Article

LIBS-MLIF Method: Stromatolite Phosphorite Determination

1
College of Surveying and Geo-informatics, Tongji University, Shanghai 200092, China
2
Key Laboratory of Space Active Opto-Electronics Technology of the Chinese Academy of Sciences, Shanghai 200083, China
3
Key Laboratory of Systems Biology, Hangzhou Institute for Advanced Study, University of Chinese Academy of Sciences, Chinese Academy of Sciences, Hangzhou 310024, China
4
Key Laboratory of Systems Health Science of Zhejiang Province, Hangzhou Institute for Advanced Study, University of Chinese Academy of Sciences, Hangzhou 310024, China
*
Authors to whom correspondence should be addressed.
Chemosensors 2023, 11(5), 301; https://doi.org/10.3390/chemosensors11050301
Submission received: 23 March 2023 / Revised: 20 April 2023 / Accepted: 14 May 2023 / Published: 19 May 2023

Abstract

:
The search for biominerals is one of the core targets in the deep space exploration mission. Stromatolite phosphorite is a typical biomineral that preserves early life on Earth. The enrichment of phosphate is closely related to microorganisms and their secretions. Laser-induced breakdown spectroscopy (LIBS) has become an essential payload in deep space exploration with the ability to analyze chemical elements remotely, rapidly, and in situ. This paper aims to evaluate the rapid identification of biological and non-biological minerals through a remote LIBS payload. LIBS is used for element analysis and mineral classification determination, and molecular laser-induced fluorescence (MLIF) is used to detect halogenated element F to support the existence of fluorapatite. This paper analyzes the LIBS-MLIF spectral characteristics of stromatolites and preliminarily evaluates the feasibility of P element quantification. The results show that LIBS technology can recognize biological and non-biological signals. This discovery is significant because it is not limited to detecting and analyzing element composition. It can also realize the detection of molecular spectrum based on selective extraction of CaF molecule. Therefore, the LIBS payload still has the potential to search for biomineral under the condition of adjusting the detection strategy.

1. Introduction

Finding extraterrestrial life has become one of the core tasks of human deep space exploration. Phosphorus plays an irreplaceable role in the evolution of life on Earth and is an essential element of life. Therefore, phosphate has also become a potential biomarker of life. The phosphorus-bearing rock series on the Earth is a special sedimentary facies, and different types of phosphorus-bearing rock series reflect phosphorus-bearing sediments generated under different paleoenvironments and paleogeographic conditions. Stromatolite phosphorite (SP) is a layered sedimentary structure formed by microbial activity. Its mineralization process demonstrates the accumulation of phosphorus by microorganisms and the enrichment of phosphate during burial, which means that microorganisms play an essential role in the mineralization process of SP. Therefore, in deep space exploration, it is significant to identify mineral categories remotely and evaluate the probability of SP. This can provide a scientific basis for rock sampling back on Earth or onsite in situ analysis.
Conventional analytical methods for mineral elements mainly include laser-induced breakdown spectroscopy (LIBS) [1], X-ray fluorescence spectroscopy (XRF) [2], atomic absorption spectroscopy (AAS) [3], atomic fluorescence spectroscopy (AFS) [4], inductively coupled plasma optical emission spectroscopy (ICP-OES) [5], inductively coupled plasma mass spectrometry (ICP-MS) [6], and other means. LIBS has advantages such as being remote and in situ, and it has strong signals. Compared with traditional analysis methods, LIBS’s real-time response and analysis speed make it the preferred technical means for deep space exploration. LIBS is an atomic emission spectroscopy technology that uses pulsed lasers to ablate the target undergoing testing and generate plasma luminescence. Almost all elements will emit characteristic spectral lines after forming a plasma so that LIBS can analyze most elements. The NASA Curiosity [7] and Perseverance [8] Mars Rovers and China Zhurong [9] Mars Rover are all equipped with LIBS payload equipment. Because of complex chemical matrix effects, the accuracy and sensitivity of the current quantitative analysis of LIBS are still challenges that need to be overcome at this stage, which also poses difficulties for scientists in interpreting measured data on Mars. McMillan [10] et al. analyzed the broadband emission spectra of 16 limestone samples using LIBS technology and compared three multivariate statistical analysis methods, namely, the soft independent modeling of class analysis (SIMCA), partial least squares regression (PLSR), and a matching algorithm method, to achieve rapid and accurate stratigraphic correlation. Maurice [11] et al. quantitatively analyzed the main element oxides in the Gail Crater and observed the P element. Harmonet et al. [12] combined LIBS with partial least squares discriminant analysis (PLSDA), distinguishing seven limestone and dolostone formations of the Early Paleozoic shelf and ramp stratigraphic sequence. Tong Chen [13] proposed using LIBS mapping combined with CNN to conduct classification research on eight different types of rock samples and verified the method’s advantages through classification experiments on shale, gneiss, and granite. Molecular laser-induced fluorescence (MLIF) is an important method for analyzing the selective excitation of halogen- and rare-earth-containing molecules. The typical representative is the emission of the alkaline-earth diatomic halides MX, M = Ca, Mg, Ba, Sr and X = F, Cl, Br, and I and the rare-earth element (REE) oxides LaO, YO, and ScO. For example, the molecular emission from CaF and CaCl may provide substantially more sensitive detection than atomic emission from elemental F and Cl and their ions [14,15,16,17]. Although many achievements have been made in the qualitative and quantitative analysis of material components using LIBS and MLIF techniques, there has yet to be a study using LIBS-MLIF to analyze mineral types online and predict SP quickly. This article aims to find potential rocks that preserve extraterrestrial life traces as an application prospect using LIBS-MLIF combined with artificial neural network methods to remotely evaluate the scientific value of rocks online, providing a reference for the next step of “sampling return” or “in situ fine analysis”.

2. Materials and Methods

2.1. Sample Description and Preparation

This work uses 18 certified reference materials (CRMs), eight mineral mixed powders (MMP), and the SP (the Dengying Formation in Weng’an, Central Guizhou Province) as the research objects. The particle size of the national standard materials and mineral mixed powders is less than 80 um (Table 1 and Table 2), and all the powders are pressed into a cake-shaped target with a diameter of 1 inch using a tablet press. The pressure applied to the powder is approximately 250 MPa and continues for 5 min. The SP rock used in the experiment is an untreated original rock block taken from the phosphorus-bearing horizon in the Weng’an Fuquan phosphate ore area.

2.2. Experimental Device

The LIBS-MLIF system comprises a pulsed laser, a Cassegrain optical system, and an 8-channel spectrometer. The pulsed laser uses an Nd: YAG Q-switched laser as the excitation source (Vlite 200, Beamtech Optronics Co., Ltd., Beijing, China), with a laser wavelength of 1064 nm, a pulse width of 6–8 ns, a maximum single pulse energy of 200 mJ, and a repetition frequency of 0–15 Hz. The Cassegrain optical system is used for pulse laser focusing and signal collection, and Schmidt correction plates are used to correct the spherical aberration of the system. The signal acquisition system uses an 8-channel spectrometer (AvaSpec Multi-Channel Spectrometer, Avantes Co., Ltd., Apeldoorn, Netherlands) with a slit of 10 μm for each channel. The spectral acquisition ranges of the eight channels are 200~320, 318~420, 417~505, 500~565, 565~670, 668~750, 745~930, and 920~1070 nm. The resolution of the spectrometer is better than 0.1 nm. Because of the exposure time of 1 ms, the microsecond-scale LIBS and MLIF signals are within the entire spectrum acquisition cycle. Therefore, the light signal collected by the spectrometer is a LIBS-MLIF mixed superposition spectrum. Each sample randomly selects 5 detection points, and each point obtains 30 spectra. The optical path structure of the whole system is shown in Figure 1. The diameter of the laser spot acting on the surface of the sample is 150 μm.

2.3. Spectral Data Preprocessing

The core part of spectral data preprocessing is the total decomposition of the LIBS spectral lines, baseline, and noise. The baseline estimation and denoising using sparsity (BEADS) algorithm removes each channel’s baseline and noise [18,19]. The baseline is modeled as a low-frequency signal, the noise is modeled as a high-frequency signal, and the LIBS spectral peaks are modeled as sparse signals, whose first and second derivatives also have sparse characteristics. It should be emphasized that the parameters in the BEADS algorithm require human intervention, mainly the cutoff frequency, which is the most critical operating parameter of the algorithm. In this article, the three core parameters, cutoff frequency (fc), filter order parameter (d), and geometry parameter (r), are set to 0.01, 1.0, and 6. However, because of the poor response of the optical system in the eighth channel, only the data of the first seven channels (200 to 930 nm) are analyzed, and the spectrum of each channel is subjected to mean normalization processing. The data preprocessing process is shown in Figure 2. Figure 2e shows the LIBS-MLIF spectra of 18 CRMs after preprocessing.

2.4. Algorithm

In terms of data processing, Matlab R2020a (Mathematics Factory Company, Natick, Massachusetts Institute of Technology) is used for data analysis and scientific drawing. Multidimensional scaling (MDS) is a technique for visualizing distances between objects. The basic goal of MDS is to “fit” the original data into a low-dimensional coordinate system to minimize deformation caused by dimensionality reduction [20]. When the similarity (or distance) between each pair of n samples is fixed, MDS is used to determine the representation of these samples in a low-dimensional space and make them “roughly match” with the original similarity (or distance) as much as possible. The purpose of MDS and principal component analysis (PCA) is consistent. Both transform high-dimensional data into low-dimensional data by mapping spatial variables, ensuring that the data of each research object maintain their original relationship and minimizing the deformation caused by dimensionality reduction. The difference is that MDS uses samples as the analysis object, while PCA uses variables as the analysis object.
As a parallel computing model, unlike traditional modeling methods, artificial neural networks have good nonlinear mapping capabilities and lower requirements for prior knowledge. That is, when the structure and parameters of the modeling object are unknown, only the input and output data of the object need to be given, and the prediction of the input and output can be obtained through the learning function of the network itself. Generalized regression neural network (GRNN) is one of the representative network structures. GRNN was proposed by American scholar Specht in 1991 and is a type of radial basis function neural network [21]. GRNN is an improvement of the radial basis function neural network, so their network structures are similar. The main difference is that GRNN has an additional summation layer. The weight connection between the hidden and output layers (the least squares superposition of Gaussian weights) is removed. GRNN has strong nonlinear mapping ability, flexible network structure, and high fault tolerance and robustness. Therefore, it is suitable for solving nonlinear problems, and the diffusion factor (σ) in the network structure is the only parameter that needs to be adjusted. GRNN consists of an input layer, a hidden layer, a summary layer, and an output layer. Firstly, the spectra of all samples are dimensionally reduced using the MDS algorithm as the model input layer vector; in the hidden layer, the training sample size determines the number of neurons, and the sample data are transferred to the next layer—the summation layer—after being calculated by the hidden layer kernel function; the neurons in the summation layer calculate the weighted sum of the output values of each neuron in the hidden layer and ultimately obtain the prediction result. In this study, the feasibility of identifying SP based on MDS-GRNN combined with LIBS-MLIF technology is proposed to address the issue of mineral classification. Partial least squares regression (PLSR) is a comprehensive class of methods for modeling relationships between sets of observed variables utilizing late variables [22]. To establish a quantitative analysis model of phosphorus element LIBS peak strength and P2O3 concentration through PLSR, we evaluated the feasibility of the remote in situ detection of the total phosphorus in rocks.

3. Results

3.1. Qualitative Analysis

Referring to the NIST database, peak position searching and matching were conducted for the LIBS-MLIF of SP, and 15 elements, calcium, phosphorus, silicon, iron, aluminum, beryllium, manganese, barium, strontium, hydrogen, lithium, nitrogen, potassium, oxygen, and sodium, were found to have identifiable discrete spectral lines, including alkali metals, alkaline earth metals, transition metals, post-transition metals, metals, nonmetals, diagnostic nonmetals, etc. Molecular spectra for CaF and CaO were found in the MLIF, which is direct evidence of the detection of the F element in SP rock; the LIBS peaks of high-concentration Ca exhibited a self-absorption effect, causing severe self-erosion at the peaks of Ca 2 at 393.3, 396.8, and 422.6 nm. Detailed LIBS-MLIF spectral information is shown in Figure 3.
Figure 3a,b shows the characteristic spectral lines of three separated P elements, indicating that the optical system has the potential to quantify total phosphorus in SP. It is worth mentioning that the high calcium content provides a possibility of detecting halogen elements, as calcium and halogen elements are easily bound and emit molecular spectra during plasma cooling. As shown in Figure 3f, the molecular spectra of CaF and CaO are presented.
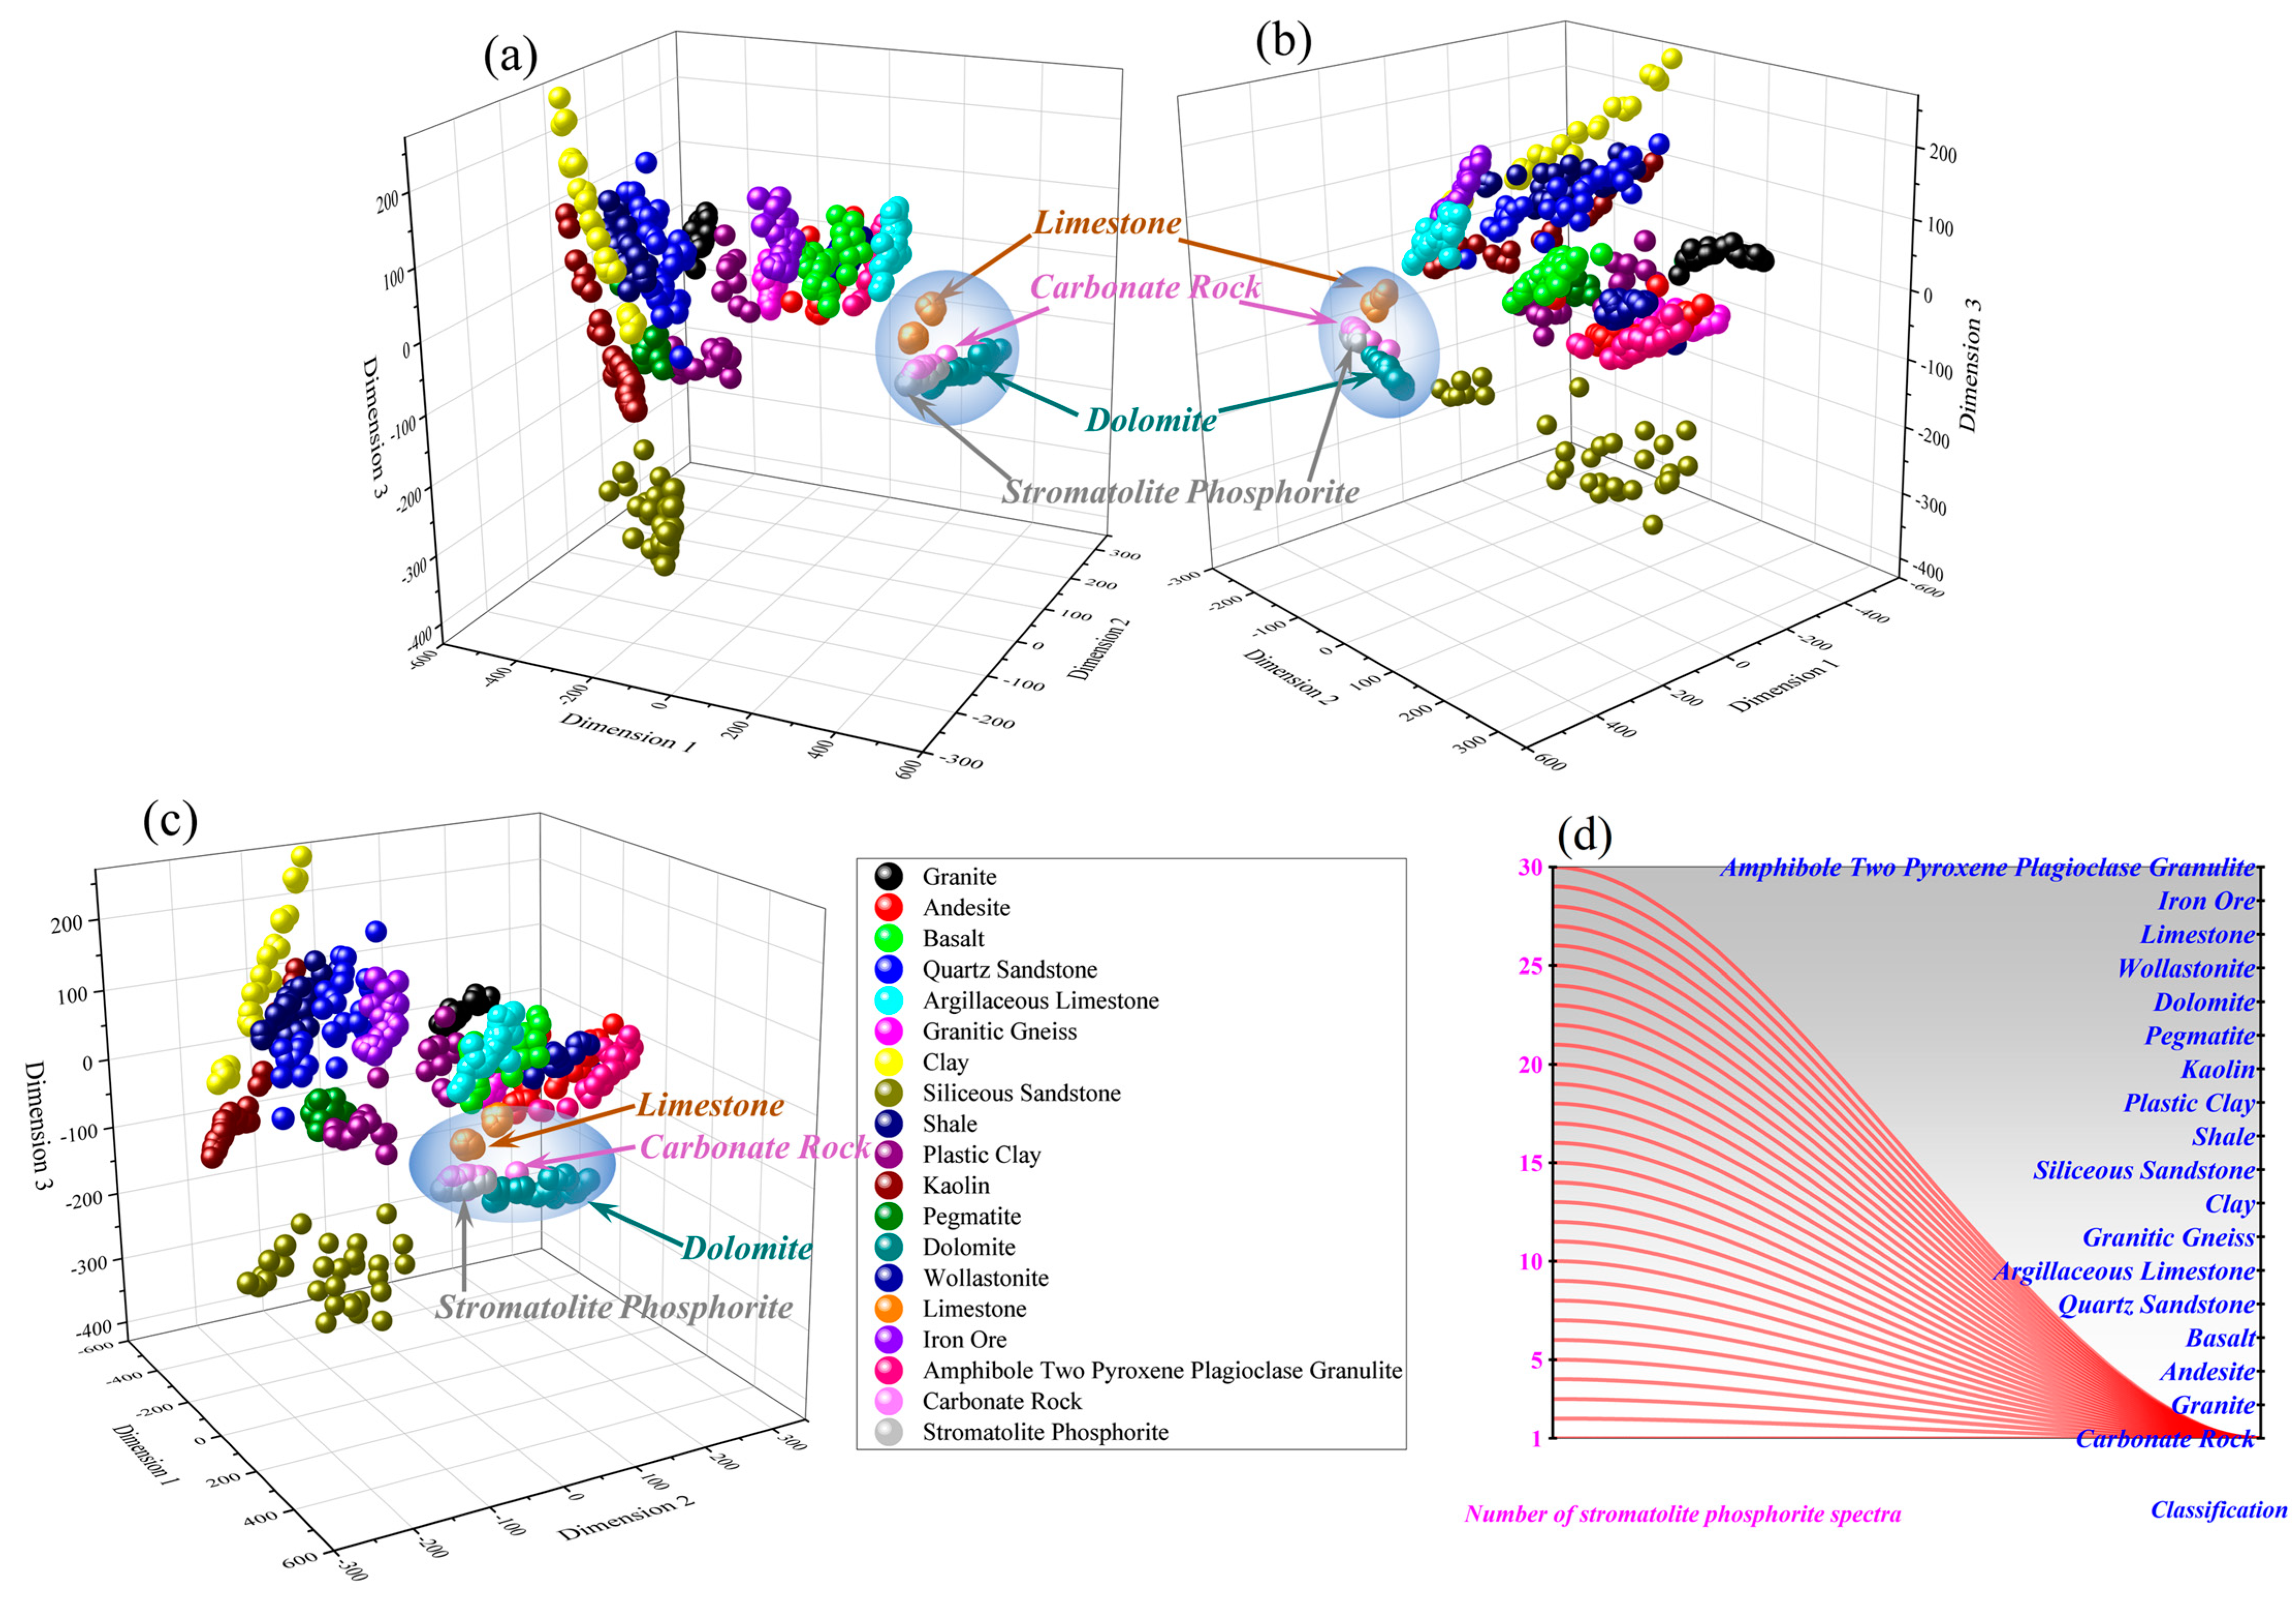
To establish a classification model for MDS-GRNN, the LIBS-MLIF of 18 CRMs and 1 SP rock were randomly divided into training, validation, and test sets in a 3:1:1 ratio. Because MDS does not require prior knowledge and is simple to calculate, this paper uses the MDS algorithm to reduce the dimension of the spectral data (seven dimensions), preserving the relative relationship of the spectral data in the original space. We selected the first three dimensions of the reduced dimension test set to present the visual effect of clustering different materials, as shown in Figure 4. Figure 4a–c shows that the spatial positions of limestone, carbonated rock, dolomite, and SP are relatively close because calcium carbonate is one of the main components of these four materials; that is, it exhibits spectral characteristics with carbonate as the chemical matrix, accompanied by rich and strong calcium spectral lines. When the spectrum of SP is regarded as an unknown object, the MDS-GRNN model will recognize it as a carbonated rock, as shown in Figure 4d, which also conforms to its clustering results in the MDS three-dimensional space; that is, the spatial location of SP is the closest to the carbonated rock. Combined with the determination of high-content phosphorus and F elements, it can assist in determining the probability of the target being SP. When using SP as one of the samples for the training model, the MDS-GRNN model can accurately classify it as SP. However, considering the diversity of SP, it is necessary to enrich the SP sample library in the future continuously.

3.2. Quantitative Analysis of Total Phosphorus

The P element is an essential element for the existence of life on Earth and is a crucial component of synthetic biological molecules. Therefore, finding the P element, especially phosphate, is essential to studying astrobiology. As we all know, LIBS has a limited ability to quantify the P element. However, this study found strong separation spectral lines for the P element in the LIBS-MLIF spectrum of SP, providing feasibility for quantifying the total phosphorus of this type of rock. To create a similar chemical matrix effect, this study prepared the mineral mixture shown in Table 2. It evaluated the relationship between the total phosphorus abundance and LIBS peak strength using the PLSR algorithm, as shown in Figure 5.

4. Discussion

4.1. Geochemical and Mineralogical Profiles of SP

SP is a typical biomineral rock composed mainly of phosphate and carbonate minerals. It is a phosphorus stromatolite reef formed by many algae through biological or biochemical processes that enrich and precipitate phosphorus in seawater. Phosphate mineralization mainly occurs in weakly alkaline secondary oxidation environments at the sediment seawater interface, and algae play an essential role in phosphorite formation. It should be emphasized that the phosphate minerals in SP rocks are mainly composed of fluorapatite and fluorocarbon apatite. The discovery of suspected stromatolite minerals outside the Earth is considered important, as these are some of the most valuable rocks sampled and returned to Earth. This study is one of the pioneering achievements in astrobiological research on SP. Combining LIBS-MLIF technology can enable us to remotely analyze SP, from elements to molecules.
LIBS-MLIF is a powerful tool for the remote and rapid analysis of elemental compositions. Although the accuracy of quantitative research is interfered with by chemical matrix effects, its detection ability exhibits high efficiency and strong signals, sufficient to demonstrate its potential as a remote and rapid assessment of biominerals. Based on LIBS-MLIF technology, 17 recognizable elements in SP were detected, including halogen group element F. Although using LIBS to see halogen element F directly is a challenging task, there is a method [23] that can detect the molecular compounds formed with fluorine in the LIBS plasma, that is, using MLIF technology to see the molecular spectrum of CaF formed with calcium in the plasma produced by fluorapatite. In this study, LIBS-MLIF technology accurately identified the characteristic spectra of elements such as Ca, F, and P in fluorapatite, providing essential typical spectral information for searching for related minerals.

4.2. On-Track Biosignature Selected Associated with Artificial Neural Network Analysis

It is well known that, in LIBS detection, the plasma generated by the interaction between the laser and matter will undergo cooling. The cooling process will lead to the recombination of elements into small molecules [24]. In addition, the first evidence of fluorine on the surface of Mars was obtained by detecting the CaF launch belt using the ChemCam instrument of the Curiosity Rover [25]. In contrast, conducting LIBS-MLIF research on stromatolites has an essential value and significance for discovering biominerals such as fluorapatite on Mars. Stromatolite phosphate rocks are mainly composed of phosphate and carbonate minerals. In the LIBS-MLIF signal, the spectral characteristics of calcium carbonate are apparent, which is highly similar to other carbonate minerals. However, the characteristic solid bands produced by the high content of F and P elements in phosphate significantly differ from other carbonate minerals.
This study preliminarily evaluated the determination of stromatolite mineral categories based on GRNN, as shown in Figure 4. Figure 4d shows that, when classifying stromatolites as unknown substances, stromatolites are classified as carbonate minerals, and the presence of fluorapatite can be determined by combining the molecular spectrum of CaF and the atomic spectrum of the P element. When adding SP to the model training set, it is possible to accurately classify the spectra of the SP to be measured into one category. Still, the SP on Earth may not necessarily be entirely consistent with extraterrestrial planets, and there are also various types of stromatolites on Earth. Therefore, it is most reliable to continuously enrich the types and quantities of SP, improve the ground database, and combine the LIBS-MLIF characteristics of CaF and P to analyze the measured data off the ground.

4.3. Scientific Research Value of Searching for Biominerals on Mars

In general, LIBS technology is used to evaluate the composition and content of elements in extraterrestrial materials. Compared with Raman spectroscopy, it has no advantage in biological signal detection. Our research results indicate that the MarSCoDe carried by the Zhurong Mars Rover can be used as a potential tool for searching for extraterrestrial life traces through a sufficient number of spectral data sets generated on the ground. Due to remote, in situ, and efficient detection advantages, LIBS can quickly screen and filter high-potential biological and abiotic minerals from different rocks. In addition, the Mars Rover Persevere is equipped with LIBS and deep ultraviolet Raman spectroscopy instruments. That is, the LIBS of Persevere can select high-value detection targets for micro-Raman and mutually verify the detection results. It should be noted that this work was not carried out in a simulated Martian environment, so the LIBS-MLIF spectrum will be affected by the composition of the Earth’s atmosphere. Still, the research results do not affect it as a potential technology for searching for extraterrestrial biological materials. We will also consider conducting research in a simulated Martian environment for subsequent extensive sample experiments.

4.4. Technical Advantages and Method Improvements of MLIF

MLIF is the molecular emission spectrum generated by small molecules and diatomic radicals generated by the chemical reaction between the target material and environmental gas in the plasma. Even if the organic matter can generate CN molecular emission spectra, carbon and nitrogen elements will likely originate from the atmosphere. Therefore, when selecting molecular emission spectra as the characteristic spectra of biomarkers, it is necessary to consider the impact of the atmospheric environment on MLIF spectra. In this paper, the CaF molecular emission spectrum produced by halogen group elements and alkali metal elements was used as a sign of the detection of fluorine in fluorapatite. In comparison, MLIF technology, X-ray technology, Raman spectroscopy technology, infrared reflection spectroscopy technology, etc., all have difficulty in achieving the remote detection of halogen elements. Of course, the method also has certain shortcomings. Firstly, as shown in Figure 1, the process of interaction between the pulsed laser and matter involves three stages of luminescence: the emission of continuous light, the emission of discrete atomic lines, and the emission of molecular lines. After the acquisition of a long exposure time, all three signals are received. That is, the original signal collected is a superimposed mixed spectrum of the three signals, where continuous light is an invalid signal that needs to be removed through baseline correction. However, removing the baseline will inevitably affect the intensity of the molecular spectrum, which is very unfavorable for the quantitative analysis of elements such as F. Even if the impact of continuous light is reduced through time delay, the process of removing the baseline will still have adverse effects on the analysis of the molecular emission spectra. Secondly, it is not possible to generate molecular emission spectra when they only contain halogen elements, which must be recombined with alkaline metal elements to form diatomic molecules. Therefore, the detection object has certain limitations; that is, this solution is targeted at specific application scenarios. Finally, the probability of CaF molecular emission spectra generated by different concentrations of F and Ca under complex chemical matrix effects needs further investigation. As shown in Figure 6, we preliminarily compared the LIBS-MLIF spectra generated by powders with different F abundances.
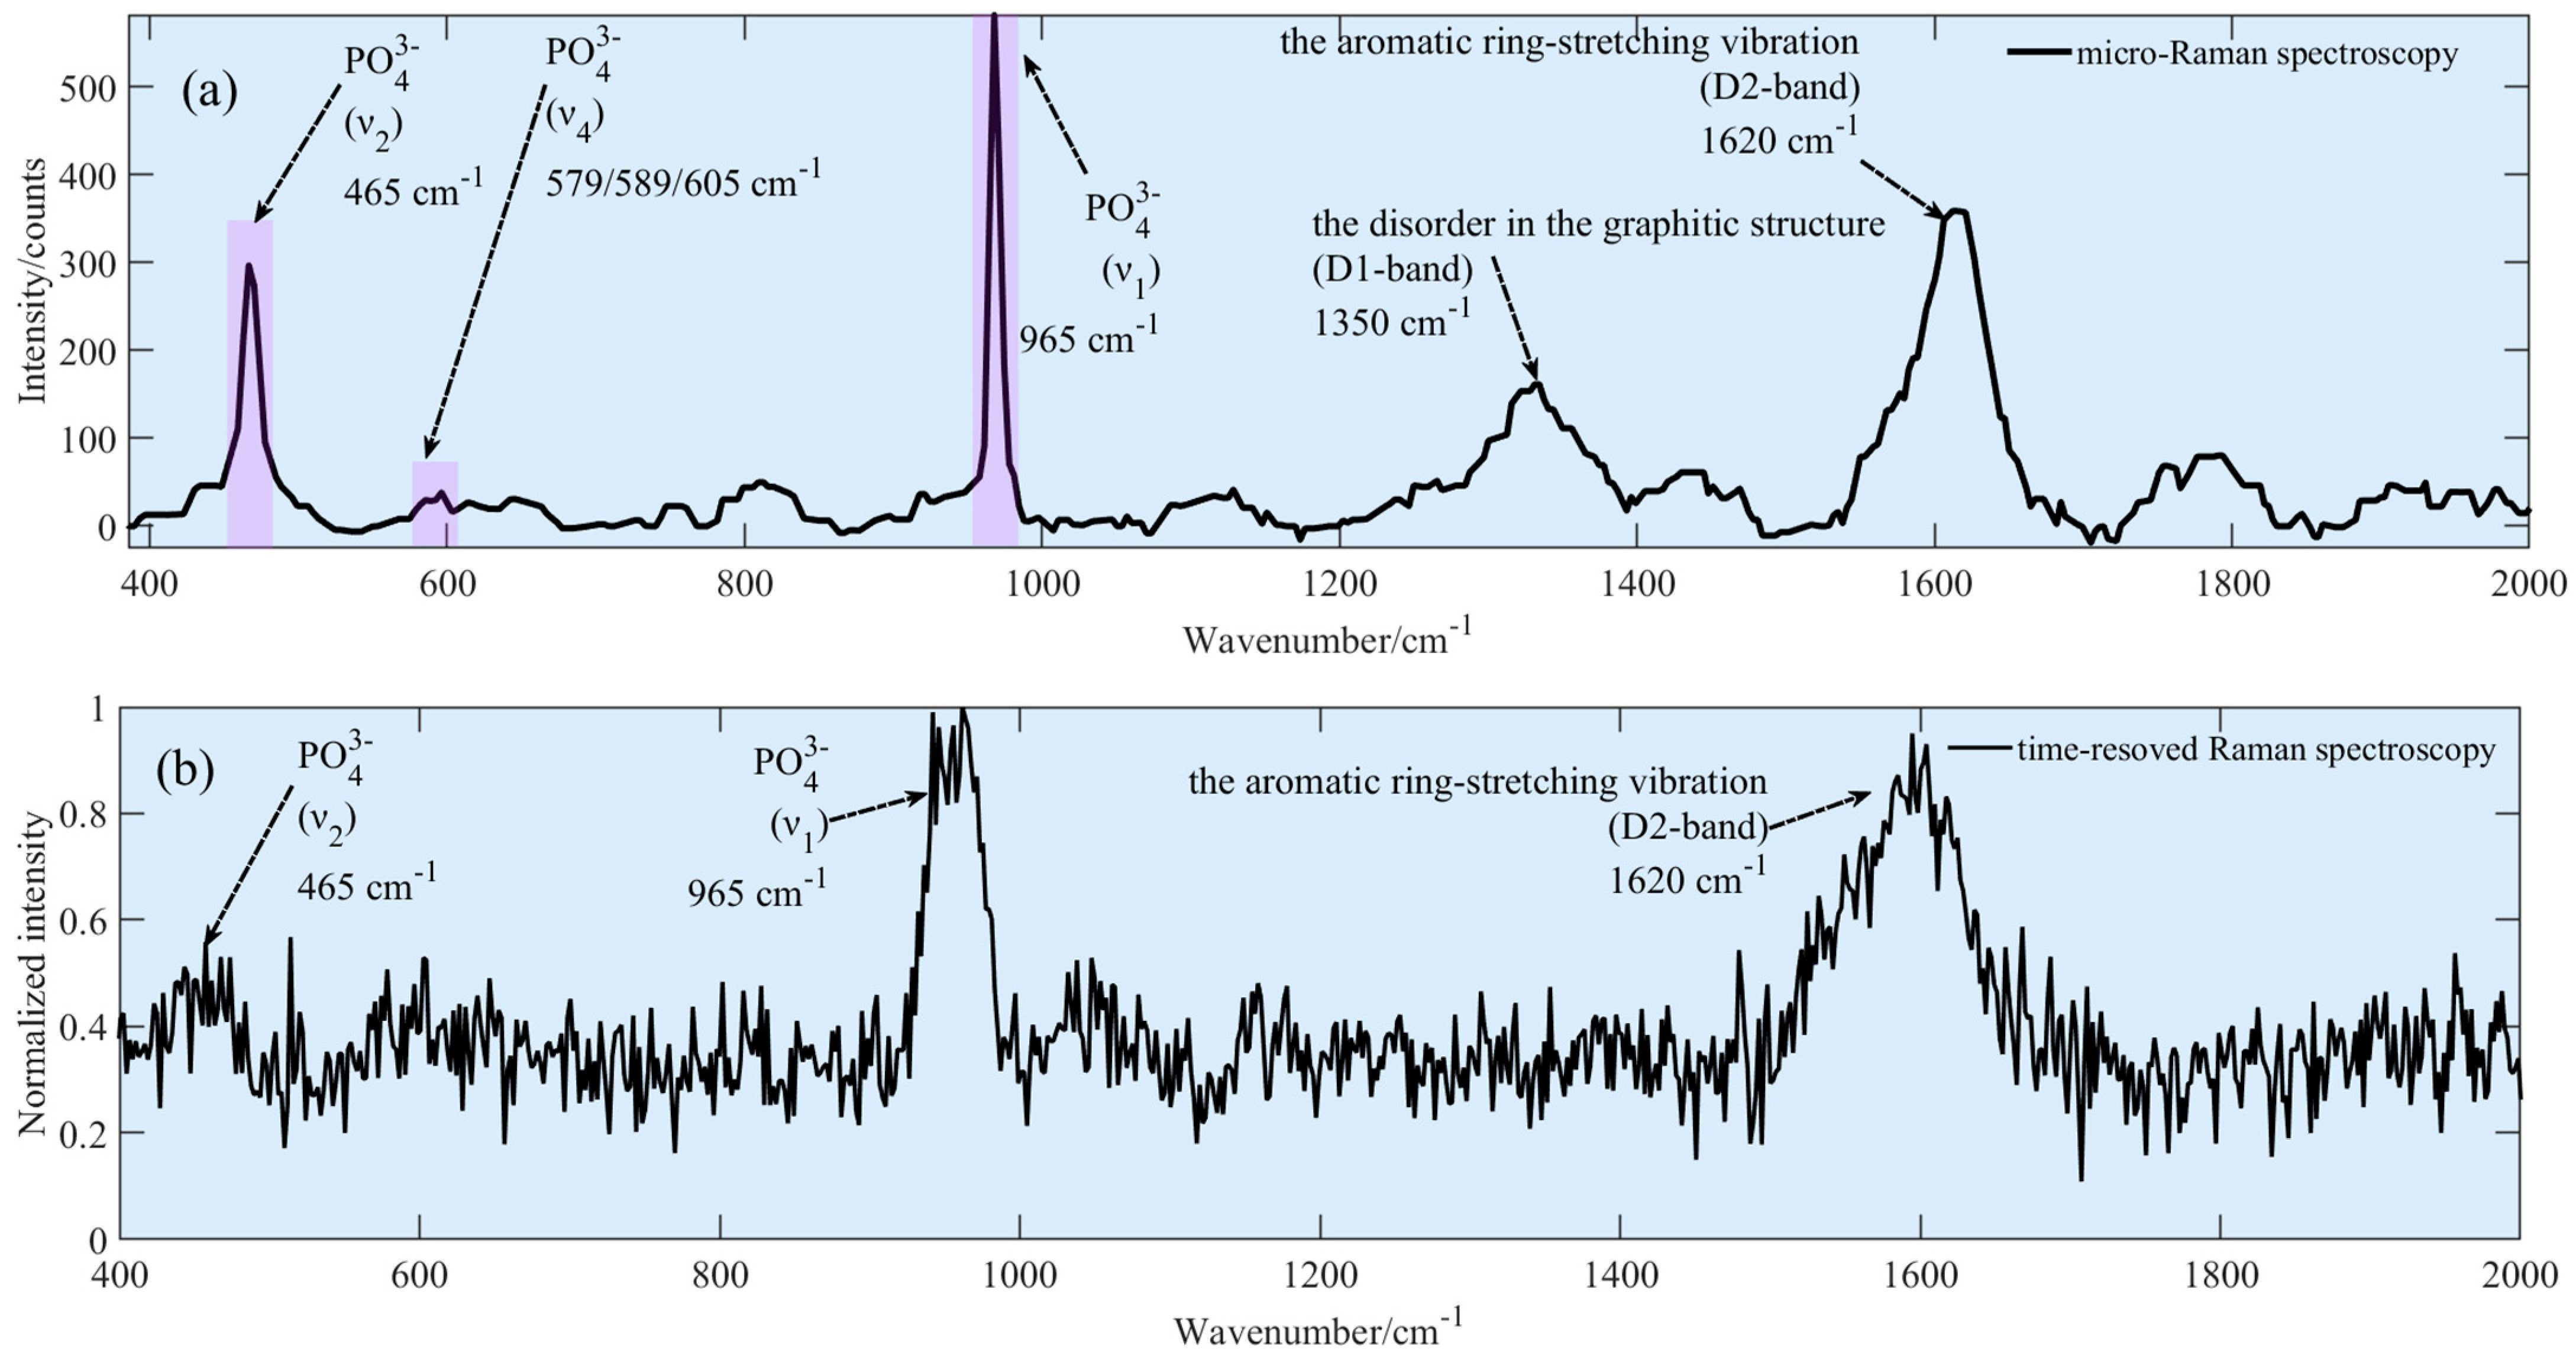
Compared with X-ray technology, X-ray technology performs poorly in detecting elements with relatively light atomic masses, and its limited working distance limits its application for remote and rapid detection in large areas; Raman spectroscopy has many technological extensions, such as micro-Raman spectroscopy (MRS), time-resolved Raman spectroscopy (TRRS), surface-enhanced Raman spectroscopy, etc. However, its complex engineering techniques, weak spectral signals, and harsh working conditions make it inferior to LIBS-MILIF technology; In deep space exploration, near-infrared reflectance spectroscopy (NIRS) is also a molecular spectroscopy technology widely used, but its most significant limitation lies in the working mode of passive detection and the limited spectral resolution, which makes it have some defects in application scenarios and material analysis. To further compare the technical advantages of LIBS-MLIF, we compared and studied the MRS and TRRS of stromatolite phosphate rocks, as shown in Figure 7. MRS and TRRS can detect spectral signals of phosphate ions and organic matter. But MRS is unsuitable for remote rapid detection and is severely affected by environmental background. Although TRRS can eliminate the influence of background noise and achieve remote detection, the signal quality is poor. In addition, Both techniques are difficult to detect the F element.

5. Conclusions

This work’s primary goal was to evaluate the LIBS-MLIF method’s ability to identify biominerals and provide reference strategies for future Mars LIBS payload searches for biominerals. First, the remote LIBS-MLIF spectra of SP and different CRMs were detected remotely. Then, the BEADS algorithm was used to preprocess the spectral data to achieve baseline correction and spectral noise reduction. Secondly, mineral classification and biomineral evaluation were realized based on the MDS-GRNN algorithm model and atomic and molecular characteristic spectra such as P and F. Finally, the partial least squares regression (PLSR) chemometrics technique was used to verify the method’s ability to quantify total phosphorus in phosphate rocks and detect molecules of the halogen F with Ca. This research shows that if the sample size is continuously expanded, LIBS-MLIF based on artificial neural networks has the potential to discover biominerals. Although this method cannot directly detect direct evidence of the molecular bonds of fluorapatite, it can solve the problem of detecting halogen group element F and combine element composition and semi-quantitative analysis to determine the classification of minerals. Therefore, LIBS-MLIF is a promising tool that can remotely identify mineral categories online and evaluate the probability of biological minerals without sample preparation, providing a basis for rock sampling back on Earth for further in situ analysis. This strategy has excellent potential in the remote and in situ search for extraterrestrial life relics.

Author Contributions

Conceptualization, H.W. and Y.X.; methodology, H.W., X.W. and Y.X.; software, H.W. and P.F.; validation, H.W., P.F. and S.L.; formal analysis, H.W. and L.Z.; investigation, H.W. and S.L.; resources, J.J.; data curation, H.W. and J.J.; writing—original draft preparation, H.W. and X.W.; writing—review and editing, H.W. and S.L.; visualization, H.W. and J.J.; supervision, X.W., J.J. and L.Z; project administration, L.Z.; funding acquisition, X.W., J.J. and L.Z. All authors have read and agreed to the published version of the manuscript.

Funding

This research was funded by the National Natural Science Foundation of China (Grant No. U1931211 and 42074210) and the National Key R&D Program of China (Grant No. 2021YFA0716100, 2021YFF0601201 and 2021YFF0601202) and sponsored by Natural Science Foundation of Shanghai (Grant No. 21ZR1473700), the Shanghai Municipal Science and Technology Major Project (Grant No. 2019SHZDZX01) and the Shanghai Pilot Program for Basic Research—Chinese Academy of Science, Shanghai Branch (JCYJ-SHFY-2021-04). This work was also supported by the Pre-Research Project on Civil Aerospace Technologies (Grant No. D020102).

Informed Consent Statement

All the authors were involved in the preparation of the manuscript.

Data Availability Statement

Data underlying the results presented in this paper are not publicly available at this time but may be obtained from the authors upon reasonable request.

Conflicts of Interest

The authors declare no conflict of interest.

References

  1. Hahn, D.W.; Nicoló, O. Laser-induced breakdown spectroscopy (LIBS), part II: Review of instrumental and methodological approaches to material analysis and applications to different fields. Appl. Spectrosc. 2012, 66, 347–419. [Google Scholar] [CrossRef]
  2. Lozano, R.; Bernal, J.P. Characterization of a new set of eight geochemical reference materials for XRF major and trace element analysis. Rev. Mex. Cienc. Geol. 2005, 22, 329–344. [Google Scholar]
  3. Filho, H.J.; Salazar, R.F.; Capri, M.D.; Neto, Â.C.; Alcântara, M.A.; Peixoto, A.L. State-of-the-Art and Trends in Atomic Absorption Spectrometry; IntechOpen: London, UK, 2012. [Google Scholar]
  4. Wagner, E.P.; Smith, B.W.; Winefordner, J.D. Ultratrace Determination of Lead in Whole Blood Using Electrothermal Atomization Laser-Excited Atomic Fluorescence Spectrometry. Anal. Chem. 1996, 68, 3199–3203. [Google Scholar] [CrossRef]
  5. Krachler, M.; Carbol, P. Validation of isotopic analysis of depleted, natural and enriched uranium using high resolution ICP-OES. J. Anal. At. Spectrom. 2011, 26, 293–299. [Google Scholar] [CrossRef]
  6. Heitland, P.; Köster, H.D. Biomonitoring of 37 trace elements in blood samples from inhabitants of northern Germany by ICP–MS. J. Trace Elem. Med. Biol. 2006, 20, 253–262. [Google Scholar] [CrossRef]
  7. Wiens, R.C.; Maurice, S.; Barraclough, B.; Saccoccio, M.; Barkley, W.C.; Bell, J.F., III; Bender, S.; Bernardin, J.; Blaney, D.; Blank, J.; et al. The ChemCam Instrument Suite on the Mars Science Laboratory (MSL) Rover: Body Unit and Combined System Tests. Space Sci. Rev. 2012, 170, 167–227. [Google Scholar] [CrossRef]
  8. Maurice, S.; Wiens, R.C.; Bernardi, P.; Caïs, P.; Robinson, S.; Nelson, T.; Gasnault, O.; Reess, J.-M.; Deleuze, M.; Rull, F.; et al. The SuperCam Instrument Suite on the Mars 2020 Rover: Science Objectives and Mast-Unit Description. Space Sci. Rev. 2021, 217, 47. [Google Scholar] [CrossRef]
  9. Xu, W.; Liu, X.; Yan, Z.; Li, L.; Zhang, Z.; Kuang, Y.; Jiang, H.; Yu, H.; Yang, F.; Liu, C.; et al. The MarSCoDe Instrument Suite on the Mars Rover of China’s Tianwen-1 Mission. Space Sci. Rev. 2021, 217, 64. [Google Scholar] [CrossRef]
  10. Nancy, J.M.; Carlos, M.; Warren, H.C. Correlation of limestone beds using laser-induced breakdown spectroscopy and chemometric analysis. Appl. Opt. 2012, 51, B213–B222. [Google Scholar]
  11. Maurice, S.; Clegg, S.M.; Wiens, R.C.; Gasnault, O.; Rapin, W.; Forni, O.; Cousin, A.; Sautter, V.; Mangold, N.; Le Deit, L.; et al. ChemCam activities and discoveries during the nominal mission of the Mars Science Laboratory in Gale crater, Mars. J. Anal. At. Spectrom. 2016, 31, 863–889. [Google Scholar] [CrossRef]
  12. Harmon, R.S.; Hark, R.R.; Throckmorton, C.S.; Rankey, E.C.; Wise, M.A.; Somers, A.M.; Collins, L.M. Geochemical Fingerprinting by Handheld Laser-Induced Breakdown Spectroscopy. Geostand. Geoanalytical Res. 2017, 41, 563–584. [Google Scholar] [CrossRef]
  13. Chen, T.; Sun, L.X.; Yu, H.B.; Wang, W.; Qi, L.; Zhang, P.; Zeng, P. Deep learning with laser-induced breakdown spectroscopy (LIBS) for the classification of rocks based on elemental imaging. Appl. Geochem. 2022, 136, 105135. [Google Scholar] [CrossRef]
  14. Gaft, M.; Nagli, L.; Gornushkin, I.; Raichlin, Y. Review on recent advances in analytical applications of molecular emission and modelling. Spectrochim. Acta Part B At. Spectrosc. 2020, 173, 105989. [Google Scholar] [CrossRef]
  15. Nagli, L.; Gaft, M.; Raichlin, Y. Halogen detection with molecular laser induced fluorescence. Spectrochim. Acta Part B At. Spectrosc. 2020, 166, 105813. [Google Scholar] [CrossRef]
  16. Nagli, L.; Gaft, M.; Raichlin, Y. LIBS-MLIBS-MLIF methods: Beryllium determination. Spectrochim. Acta Part B At. Spectrosc. 2023, 202, 106631. [Google Scholar] [CrossRef]
  17. Nagli, L.; Gaft, M. Combining Laser-Induced Breakdown Spectroscopy with Molecular Laser-Induced Fluorescence. Appl. Spectrosc. 2016, 70, 585–592. [Google Scholar] [CrossRef]
  18. Ning, X.R.; Selesnick, I.W.; Duval, L. Chromatogram baseline estimation and denoising using sparsity (BEADS). Chemom. Intell. Lab. Syst. 2014, 139, 156–167. [Google Scholar] [CrossRef]
  19. Wang, H.P.; Fang, P.P.; Yan, X.R.; Zhou, Y.; Cheng, Y.; Yao, L.; Jia, J.; He, J.; Wan, X. Study on the Raman spectral characteristics of dynamic and static blood and its application in species identification. J. Photochem. Photobiol. B Biol. 2022, 232, 112478. [Google Scholar] [CrossRef]
  20. Dzemyda, G.; Sabaliauskas, M. Geometric multidimensional scaling: A new approach for data dimensionality reduction. Appl. Math. Comput. 2021, 409, 125561. [Google Scholar] [CrossRef]
  21. Specht, D.F. A general regression neural network. IEEE Trans. Neural Netw. 1991, 2, 568–576. [Google Scholar] [CrossRef] [PubMed]
  22. Rosipal, R.; Krämer, N. Overview and Recent Advances in Partial Least Squares. In Subspace, Latent Structure and Feature Selection; Saunders, C., Grobelnik, M., Gunn, S., Shawe-Taylor, J., Eds.; SLSFS 2005. Lecture Notes in Computer Science; Springer: Berlin/Heidelberg, Germany, 2006; Volume 3940. [Google Scholar] [CrossRef]
  23. Llamas, C.A.; Pisonero, J.; Bordel, N. Quantification of fluorine traces in solid samples using CaF molecular emission bands in atmospheric air Laser-Induced Breakdown Spectroscopy. Spectrochim. Acta Part B At. Spectrosc. 2016, 123, 157–162. [Google Scholar] [CrossRef]
  24. Lei, W.Q.; Ma, Q.L.; Ros, V.M.; Bai, X.; Zheng, L.; Zeng, H.; Yu, J. Effect of ablation photon energy on the distribution of molecular species in laser-induced plasma from polymer in air. Spectrochim. Acta Part B At. Spectrosc. 2012, 73, 7–12. [Google Scholar] [CrossRef]
  25. Forni, O.; Gaft, M.; Toplis, M.J.; Clegg, S.M.; Maurice, S.; Wiens, R.C.; Mangold, N.; Gasnault, O.; Sautter, V.; Le Mouélic, S.; et al. First detection of fluorine on Mars: Implications for Gale Crater’s geochemistry. Geophys. Res. Lett. 2015, 42, 1020–1028. [Google Scholar] [CrossRef]
Figure 1. Structural diagram of stromatolite sample and experimental system.
Chemosensors 11 00301 g001
Figure 2. LIBS baseline correction and noise reduction: (a) original spectrum and baseline; (b) removing the baseline of the spectrum; (c) residual; (d) mean normalization; (e) the LIBS of 18 CRMs.
Chemosensors 11 00301 g002
Figure 3. LIBS-MLIF spectral characteristics of SP: (a) LIBS-MLIF in the 200~250 nm range; (b) LIBS-MLIF in the 250~320 nm range; (c) LIBS-MLIF in 330~365 nm range; (d) LIBS-MLIF in the 370~433 nm range; (e) LIBS-MLIF in the 440~528 nm range; (f) LIBS-MLIF in the 528~630 nm range; (g) LIBS-MLIF in the 640~750 nm range; (h) LIBS-MLIF in the 750~880 nm range.
Chemosensors 11 00301 g003
Figure 4. 3D Visualization of MDS dimensionality reduction: (a) 3D visualization from different angles; (b) 3D visualization from different angles; (c) 3D visualization from different angles; (d) classification results of the model.
Chemosensors 11 00301 g004
Figure 5. The relationship between total phosphorus abundance and LIBS peak strength.The relationship between total phosphorus abundance and LIBS peak strength: (a) PLSR model of P abundance and peak intensity at 213.6 nm; (b) PLSR model of P abundance and peak intensity at 214.9 nm; (c) PLSR model of P abundance and peak intensity at 215.4 nm.
Chemosensors 11 00301 g005
Figure 6. LIBS-MLIF spectra of powders with different F abundances: (a) LIBS-MLIF in the 530–630 nm range; (b) LIBS-MLIF in the 528~542 nm range; (c) LIBS-MLIF in the 580~588 nm range; (d) LIBS-MLIF in the 595~620 nm range.
Chemosensors 11 00301 g006
Figure 7. The relationship between total phosphorus abundance and LIBS peak strength: (a) micro-Raman spectroscopy excited by continuous laser; (b) time-resolved Raman spectroscopy excited by pulsed laser.
Chemosensors 11 00301 g007
Table 1. The abundance of oxides of the major elements (wt.%) of the 18 CRMs.
No.Sample NameReference IDSiO2Al2O3TFe2O3TiO2CaOMgOK2ONa2O
1GraniteGBW0710372.8313.42.1401.550.425.013.13
2AndesiteGBW0710460.6216.174.905.21.721.893.86
3BasaltGBW0710544.6413.8313.42.378.817.772.323.38
4Quartz SandstoneGBW0710690.363.523.220.2640.30.0820.650.061
5Argillaceous LimestoneGBW0710815.65.032.520.32735.675.190.78−0.081
6Granitic GneissGBW0712166.316.33.120.2972.661.632.65.3
7ClayGBW03101a49.9826.2710.550.70.130.460.790.06
8Siliceous SandstoneGBW03112a98.510.840.0930.020.0770.0660.0610.021
9ShaleGBW03104a69.6314.825.670.680.220.673.760.2
10Plastic ClayGBW0311555.928.570.861.210.70.31.541.74
11KaolinGBW03121a43.4134.771.50.250.0380.0690.780.045
12PegmatiteGBW0712576.413.190.240.610.00.136.221.6
13DolomiteGBW07217a0.0210.0170.2240.032.1120.370.00110.023
14WollastoniteGBW0312350.50.390.10.02240.390.950.140.052
15LimestoneGBW03107a4.050.940.580.05250.091.790.420.027
16Iron OreGSBD31004a9.792.4671.230.154.282.30.320.144
17Amphibole Two Pyroxene Plagioclase GranuliteGBW0772658.4717.146.850.6685.93.261.514.77
18Carbonate RockGBW071270.550.170.1930.01147.896.760.0430.022
Table 2. The abundance of oxides of the major elements (wt.%) of the 8 mineral mixed powders.
No.CaCO3MgCO3Fe2(CO3)3P2O5B2O3SiO2
10.450.340.150.030.020.01
20.460.300.140.040.030.03
30.470.280.110.050.040.05
40.480.260.080.060.050.07
50.490.240.050.070.060.09
60.500.220.030.080.070.10
70.510.200.010.090.070.12
80.500.180.000.100.080.14
Disclaimer/Publisher’s Note: The statements, opinions and data contained in all publications are solely those of the individual author(s) and contributor(s) and not of MDPI and/or the editor(s). MDPI and/or the editor(s) disclaim responsibility for any injury to people or property resulting from any ideas, methods, instructions or products referred to in the content.