Abstract
In this work, a novel optical fiber sensor system for ultra-low perfluorooctanoic acid (PFOA) detection in aqueous solutions is proposed. It is based on the connection, in series, of two different plastic optical fiber (POF) platforms: the first is a chemical chip realized by using a D-shaped POF with microholes filled with a specific molecularly imprinted polymer (MIP); the second is a typical surface plasmon resonance (SPR) sensor based on a D-shaped POF. In particular, the MIP-based chemical chip was used to launch the light inside the SPR–POF chip to change the SPR phenomenon by exploiting the PFOA–MIP interaction in the microholes. At first, experimental results were performed in water to demonstrate the applicability of the proposed sensing approach for measuring PFOA (or C8) in a concentration range of 1 ppt to 750 ppt, obtaining an ultra-low limit of detection (LOD) equal to about 0.81 ppt. Then, experimental results were carried out in simulated seawater to implement a complex matrix. The obtained results denoted a slight matrix effect, paving the way for the applicability of the proposed chemical sensing mechanism in several aqueous solutions.
1. Introduction
The broad class of chemicals known as perfluoroalkyl and polyfluoroalkyl substances (PFAS) is employed in a variety of consumer and industrial applications. PFASs contain carbon–fluorine bonds, which are among the strongest chemical bonds in organic chemistry, and they are classified as persistent organic pollutants (POPs), due to a lack of natural decomposition in the environment.
One of the most critical problems is that PFAS are present in everyday life; as a matter of fact, it is possible to find them in drinking water, surface water, oil, food packaging, cookware, the atmosphere, or human food sources [1]. For this reason, they can accumulate at low concentrations in humans through this continuous exposure determining severe health risks. Furthermore, the presence of these contaminants in an environmental matrix can create very dangerous and bioaccumulative substances due to their resistance to various biological and chemical treatments.
The correlation between PFAS and human health issues was recently noted. A significant number of in vitro studies show potential immunotoxic effects. However, the most alarming studies concern the potential of these substances in carcinogenicity, their interaction with the hormonal system (thyroid disruption), especially the exposure of pregnant women, and consequences for neonatal growth [2,3,4].
Based on concerns about the high persistence of PFAS and given the many negative effects on human health, these substances are strictly regulated. Since 2009, they have been listed in the international Stockholm Convention to end their usage. The EU directive 2013/39/UE includes PFAS among the priority compounds to be eradicated over the next 20 years, making this issue even more serious.
Many different methods have been used in recent years to detect PFAS [5]. In particular, high-performance liquid chromatography–mass spectrometry (HPLC–MS) and gas chromatography–mass spectrometry (GC–MS) are the most adopted techniques to detect ultra-low PFAS concentrations [6,7]. Other sensitive techniques for PFAS detection employ capillary zone electrophoresis (CZE), colorimetric sensors, fluorous membrane-based ion-selective electrodes [8,9], fluorescence-based sensors [10], electrochemical impedance spectroscopy (EIS) [11], impedance sensors [12], and ion-transfer stripping voltammetry [13].
The mentioned techniques, based on nonportable and expensive devices, are very complex, time-consuming, and require laborious preparation steps, in addition to employing a large number of solvents. It is important to employ a quick, easy, and accurate technique for the detection of PFAS to overcome these disadvantages. To this purpose, the use of sensor platforms based on optical fibers for the quick and online detection of perfluoroalkyl and polyfluoroalkyl substances is a focus of many research activities. For instance, Faiz et al. [14] recently presented a Fabry–Perot interferometry (FPI) in optical fibers to detect perfluorooctanoic acid (PFOA) and other perfluoroalkyl substances in aqueous solutions. Along the same line, Cennamo et al. [15] presented a PFAS optical fiber biosensor based on a specific bioreceptor deposited on an SPR–POF probe. On the sensitive gold surface, a self-assembled monolayer of an antibody has been realized to detect perfluorinated compounds at low concentrations (LOD equal to 0.2 ppb) [15].
Molecularly imprinted polymers (MIPs) can be used instead of bioreceptors, which boast selectivity and specificity similar to bioreceptors but are more resistant and easier to produce [16,17,18]. In a typical approach, MIP layers are obtained by spincoating a prepolymeric solution upon the sensor’s sensitive surface [19]. In this direction, a PFAS optical fiber sensor with a LOD similar to the one obtained in [15] was prepared by covering the plasmonic surface of an SPR–POF platform with a specific MIP layer capable of detecting PFAS, particularly in the range of C4 to C12 [20].
Recently, to improve the POF-based sensor performances, Cennamo et al. [21] proposed an innovative detection method based on MIPs deposited on a different POF chip with respect to the SPR–POF platform, exploiting the multimodal characteristics of POFs. More specifically, in [21], an MIP specific for 2-FAL detection was not directly deposited on the plasmonic surface but was used to fill microholes realized in a D-shaped POF platform, which is used to launch the light into the SPR–POF sensor. In such a way, the SPR sensor response is modulated by the analyte-receptor interaction that occurs in the core of the POF, leading to a remarkable improvement of the optical–chemical sensor [21].
In this work, a similar approach was adopted for the first time in PFAS detection to reduce the LOD. In this case, the same MIP of [20] was deposited in three microholes in the core of a D-shaped POF, in opposition to the [20] where the MIP was deposited on the SPR–POF probe. The analyte–MIP binding changes the effective refractive index of the first POF (chemical chip), thus producing a variation in the plasmonic resonance conditions excited in the SPR–POF probe connected in series. The proposed optical–chemical sensor system was tested for PFOA detection in water samples obtaining attractive experimental results. PFOA was chosen because it is one of the most investigated compounds among PFAS due to the danger it poses to human health [22]. Citizens at risk of everyday exposure to PFAS have considerable quantities of PFOA in their blood. Furthermore, PFOA has a half-life of about three years in people, and its function is relative to any potential disorders [22].
2. Materials and Methods
2.1. Chemicals
Reagents: Perfluorooctanoate ammonium salt (FPO-NH4), 2,2-azobisisobutyronitrile (AIBN), (Vinylbenzyl) trimethylammonium chloride VBT), and 1H,1H,2H,2H-perfluorodecyl acrylate (PFDA) were purchased from Sigma-Aldrich (Saint Louis, MO, USA) and without additional purification. To remove stabilizers, ethylene glycol dimethacrylate purchased from Sigma-Aldrich, was vacuum-distilled before use.
All other chemicals were used without preliminary distillation. The solvent was deionized water. The solids were weighed and dissolved in ultrapure water (Milli-Q®, Merck KGaA, Darmstadt, Germany) to prepare stock solutions.
2.2. MIP and NIP Preparation
For MIP synthesis, a prepolymeric mixture was prepared, according to a previously optimized procedure [20] briefly reported below. Ammonium perfluorooctanoate (FPO-NH4) was utilized as the template, with VBT and PFDA as functional monomers, and EGDMA was the cross-linking agent. The following molar ratios were used to mix the reagents: 1:4:5:50 = template:VBT:PFDA:EGDMA. The mixture dispersion was achieved by sonication until a visually homogeneous milky solution was obtained. All reagents were dissolved by adding deionized water (volume ratio H2O:EGDMA = 1:17.5). In the end, the polymerization reaction was thermally initiated by the use of AIBN added to the mix, previously prepared without any stoichiometric ratio.
Similarly, a not-imprinted polymer (NIP) was prepared in which a PFOA template was not present.
2.3. SPR–POF Probe
The production process of a D-shaped plasmonic platform has been thoroughly documented in the literature [23]. In brief, a POF with a 1 mm diameter (consisting of a 980 µm PMMA core and a 10 µm fluorinated cladding) was blocked in resin support, then polished with two types of polishing papers (5 and 1 µm grits) to take off the cladding and a section of the core, resulting in the distinct D-shaped. Then, a layer of high refractive index (around 1.6, as for its datasheet) photoresist buffer (Microposit S1813, produced by MicroChem Corp., Westborough, MA, USA) was deposited to the exposed core surface by spin coating techniques (about 1.5 µm thick) to improve the plasmonic properties [23].
Finally, a 60 nm gold nanofilm was deposited using a sputter coating machine (Safematic CCU-010, Zizers, Switzerland). Finally, the SPR chip was bonded with a 3D-printed holder fabricated by a commercial 3D printer (Photon Mono X UV Resin SLA 3D Printer, Anycubic®, Shenzhen, China). In order to excite the SPR phenomenon, it is necessary that the resonance conditions are satisfied. In particular, for this SPR probe, sufficient aqueous medium was required to be in contact with the sensitive area (gold nanofilm) [23]. Therefore, the special 3D-printed holder was fabricated to implement a cell for liquids and to connect the SPR chip with the source and detector via a custom holder. Exploiting this special holder, it was possible to guarantee the presence of the liquid solution (water in this work) for all of the timing tests. Figure 1 shows a picture of the SPR–POF chip together with the 3D-printed custom holder.
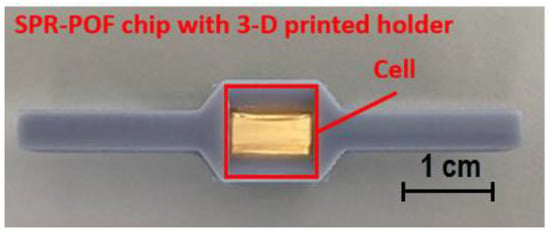
Figure 1.
Picture of the SPR–POF chip bounded with the 3D-printed holder.
2.4. POF–Chemical Platform
The same procedure adopted in [21] was used to create the POF–chemical platform. The 1 mm POF was fixed in a resin block and polished with two different types of polishing papers (5 and 1 µm grits) to achieve a D-shaped region. Then, three microholes were drilled into the exposed core of the POF with a 600 µm diameter column drill in an orientation perpendicular to the direction of the light propagation [21]. This chemical chip was also bonded to a 3D-printed support that implemented a measuring cell and a custom connector (similar to the SPR–POF chip). This support was fabricated using a commercial 3D printer (Photon Mono X UV Resin SLA 3D Printer, Anycubic®, Shenzhen, China). Figure 2a reports a picture of the modified POF chip showing the D-shaped area with the three microholes.
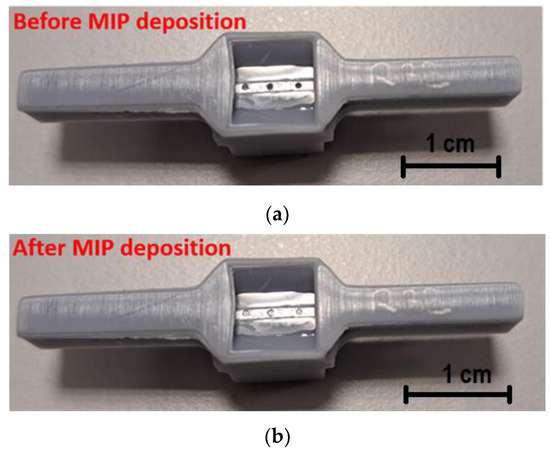
Figure 2.
Picture of the POF–chemical chip before (a) and after (b) the MIP deposition step.
These microholes were filled with the prepolymeric mixture and then thermally polymerized in an oven at 76 °C for 16 h. The prepared MIP was then washed with 96% v/v ethanol to remove any residual unpolymerized monomers. Subsequently, the template was extracted from the MIP by washing with HCl solution (2% v/v) and 96% v/v ethanol. Figure 2b shows an image of the described microstructured chemical chip after the MIP deposition process.
The same procedure was used to fill the platform with an NIP mixture in which PFOA was not present.
The used MIP and NIP polymers have already been used in several previous sensor configurations covering different sensing surfaces (PMMA and gold surfaces) [20,24]. The morphology of the surfaces of both the polymers used here was similar to those deposited on the gold and PMMA surfaces [20,24].
2.5. Experimental Setup
The experimental setup used to test the proposed optical–chemical sensor system consists of a white light source (model HL2000-LL, manufactured by Ocean Insight, Orlando, FL, USA) coupled to the previously mentioned MIP-based chemical chip, which illuminates the SPR–POF sensor located downstream. In the end, a spectrometer (model FLAME-S-VIS-NIR-ES, manufactured by Ocean Insight, Orlando, FL, USA) collected the transmitted light from the SPR platform and transmitted the information to a laptop for processing. Figure 3 shows a picture of the experimental setup, detailing the various components and their placement in the 3D-printed holder. More specifically, both the POF chips (SPR–POF chip and the POF–chemical chip) were connected to the equipment via the custom holder. The 3D-printed supports of the chips implemented removable connectors to connect the chips to the holder, whereas SMA connectors were used to connect the white light source at the input of the holder and the spectrometer at its output.
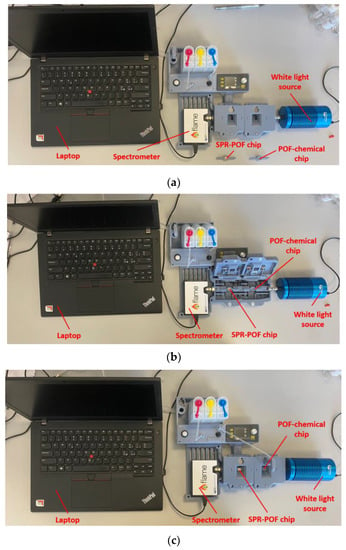
Figure 3.
Pictures of the experimental setup based on a custom holder: (a) without sensor chips in the holder, (b) with hatches open and sensor chips placed in the holder, and (c) with sensor chips in the 3D-printed holder and hatches closed.
2.6. Sensing Principle and Experimental Procedure
The sensing principle exploits the variation in the plasmonic response that occurs in a multimode POF (in terms of resonance wavelength) resulting from a change in the input light. This variation can be obtained by using a patch of a modified POF sensitive to the quantity under test [21].
In this case, and similarly to [21], the POF–chemical platform is responsible for the variation in the launching light. More specifically, once the interaction between the MIP receptor and analyte occurs, the refractive index of the MIP present in the POF core changes locally and perturbates the mode profile into the waveguide (modified POF) [21].
The experimental tests were conducted in a space with a regulated temperature. The binding of PFOA to the MIP was tested by dropping 100 μL of the solution under test upon the sensitive surface of the POF–chemical chip. The SPR spectra were acquired after ten minutes of incubation with the solution (to enable the interaction between the analyte and the receptor in the microholes) and a washing step with water. More specifically, the SPR spectra were obtained by a normalization of the transmitted spectra on a reference spectrum. The reference spectrum for the normalization is acquired when air is the surrounding medium on the plasmonic platform (in this case, the SPR condition, is not satisfied) and the water (blank solution) is present on the POF–chemical chip. However, the transmitted spectra were acquired at a fixed refractive index of the dielectric on the SPR–POF chip equal to 1.332 (water) and with the blank solution (water without analyte) present on the POF–chemical chip (added after the incubation and washing steps) [21].
3. Results and Discussion
3.1. Preliminary Results in Milli-Q Water
The proposed optical–chemical sensor system was tested by dropping solutions with different PFOA concentrations in Milli-Q water on the POF–chemical chip.
Figure 4 shows the SPR spectra obtained at different PFOA concentrations in a range of 1 ppt to 750 ppt by exploiting the MIP-based chemical sensor chip.
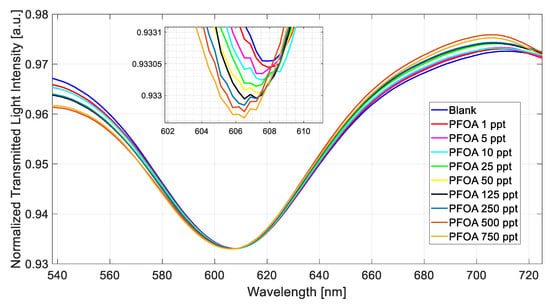
Figure 4.
Normalized transmitted spectra obtained by fixing the refractive index (1.332) on the SPR–POF chip and increasing the PFOA concentration (range 1–750 ppt) in Milli-Q water upon the POF–chemical chip.
During all of the measurements, a solution with a fixed refractive index equal to 1.332 (water) was placed on the SPR–POF platform to trigger the plasmonic phenomenon [21].
Figure 4 shows a decrease (blue shift) in the resonance wavelength value when the PFOA concentration increases.
From the results reported in Figure 4, Figure 5 shows the absolute values of the resonance wavelength variations (|∆λ|), calculated with respect to the blank solution (water without the analyte) versus the PFOA concentrations, along with the Langmuir fitting of the experimental values and the error bars. The error bars reported in Figure 5 were calculated as the maximum experimentally measured variation, resulting in error bars equal to 0.2 nm, obtained by the reproducibility tests carried out in similar conditions using analogous MIP-based POF–chemical platforms and maintaining the same SPR–POF chip. It should be stressed that the Langmuir fitting model is typically used to describe an adsorption isotherm, as reported in [25].
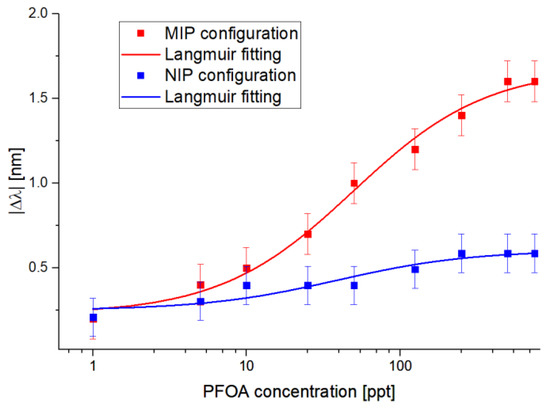
Figure 5.
The absolute value of the resonance wavelength variations (calculated with respect to the blank) versus PFOA concentration in Milli-Q water, with the error bars and Langmuir fitting in semi-log scale for MIP and NIP sensor configurations.
About Figure 5, Table 1 reports the Langmuir fitting parameters obtained by using OriginPro software (Origin Lab. Corp., Northampton, MA, USA). The software automatically calculates the parameters (reported in Table 1) of the fitted curves to better fit the experimental values; these parameters are useful for calculating the sensor’s chemical parameters, i.e., sensitivity at low concentrations, the limit of detection, and the affinity constant.

Table 1.
The Langmuir fitting parameters relative to PFOA detection by the MIP and NIP sensor configurations.
Figure 5 also reports the selectivity test of the proposed sensor system obtained using an NIP-based chemical chip (carried out by filling the microholes with NIP instead of MIP) in series with the SPR–POF chip. As shown in Figure 5, the shifts recorded on the NIP-based sensor configuration were smaller than the shifts recorded with the MIP configuration at the same concentrations. A possible explanation for this lies in a possible nonspecific interaction between the analyte and the functional monomers, meaning that substances other than the analyte can cause a shift.
The experimental values were fitted by using the Langmuir model equation, which can be defined as follows:
where is the resonance wavelength at the PFOA concentration , is the resonance wavelength at zero concentration (blank solution), is the highest value of that can be obtained at the saturation concentration, and K is the dissociation constant.
In more detail, in the condition in which c is much lower than , Equation 1 can be approximated to the linear equation . In particular, the slope is the sensitivity at low concentrations, and the parameter K is the reciprocal of the target molecule’s affinity constant (Kaff) for the imprinted site. Finally, the ratio between the standard deviation of the blank solution multiplied by three and the sensitivity at low concentration can be used to calculate the limit of detection (LOD).
Therefore, using the parameters reported in Table 1, the affinity constant, the sensitivity at low concentration, and the LOD were calculated and reported in Table 2 for the MIP-based sensor configuration.

Table 2.
Sensor chemical parameters for PFOA detection in Milli-Q water.
3.2. Selectivity Tests and Experimental Results in Seawater Matrix
Several tests were also performed in a simulated seawater matrix (NaCl 35 g/L) using three MIP-based chemical chips. For instance, the SPR spectra obtained in seawater at different PFOA concentrations (range 1–750 ppt) are reported in Figure 6.
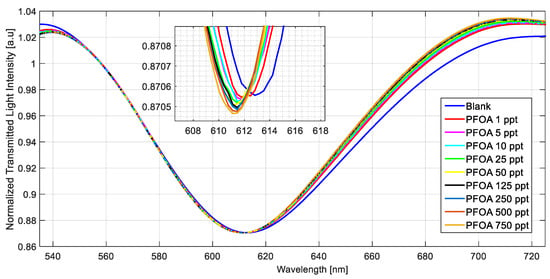
Figure 6.
Normalized transmitted spectra obtained by fixing the refractive index (1.332) on the SPR–POF chip and increasing the PFOA concentration (range 1–750 ppt) in seawater on the MIP-based chemical chip.
Figure 7 shows the absolute values of the resonance wavelength variations, calculated with respect to the blank solution versus the PFOA concentrations, along with the Langmuir fitting of the experimental values and the error bars. More specifically, the fitting parameters are reported in Table 3, whereas the error bars were calculated as the maximum variations in the resonance wavelength in the three different tests.
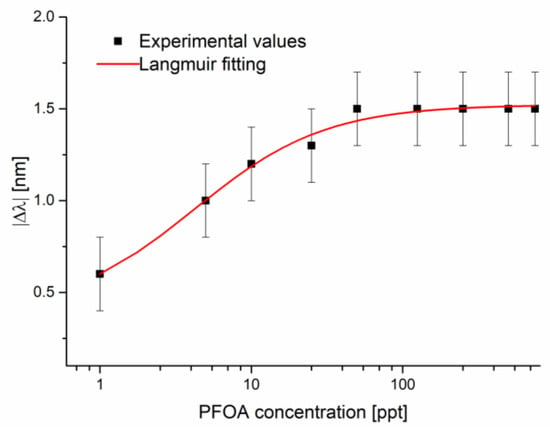
Figure 7.
The absolute value of the resonance wavelength variations (calculated with respect to the blank) versus PFOA concentration in seawater, with the error bars and Langmuir fitting on a semi-log scale.

Table 3.
The Langmuir parameters relative to the PFOA detection in simulated seawater.
As shown in Figure 7, the sensor performance is lower than that obtained in Milli-Q water because saturation is achieved sooner. Because of the high chloride concentration in seawater, the anions coordinate themselves to a VBT monomer more easily; with the addition of PFOA, a competitive equilibrium is instated that favors the analyte because of the specific molecular recognition of the cavity. This phenomenon can explain the higher shift at the lowest concentration and why saturation is achieved way before.
By using the parameters reported in Table 3, in the seawater matrix, the affinity constant, the sensitivity at low concentration, and the LOD were calculated and reported in Table 4.

Table 4.
Sensor chemical parameters for PFOA detection in seawater.
Finally, to test the selectivity of the MIP receptor, the measurements were repeated utilizing solutions containing substances other than the analyte (e.g., hydrocarbons and α-lipoic acid).
As the first test, solutions containing both substances other than the analyte were deposited on the sensor’s surface and then a solution containing PFOA was added.
As shown in Figure 8a, both substances caused a slight shift even if they were 100 times more concentrated than the analyte solution. Furthermore, these shifts may not be related to these substances but to signal noise. Moreover, a mixture of these three compounds was prepared. The results are shown in Figure 8b. In this case, the response is similar but slightly lower than the only PFOA solution (0.125 ppb). This may be related to a decrease in the pH value caused by the presence of α-lipoic acid: the polymer is designed to work at neutral pH, so a shift to an acidic pH can hinder its performance.
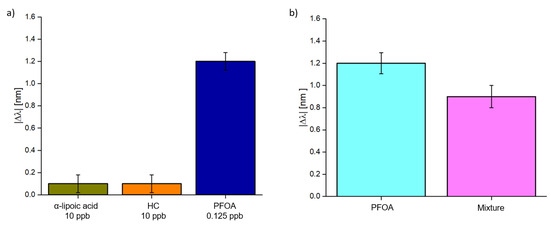
Figure 8.
Selectivity test: (a) Absolute value of the resonance variation in other substances (hydrocarbons 10 ppb and α-lipoic acid 10 ppb) and the analyte (PFOA 0.125 ppb), measured one on one. (b) Comparison between the absolute value of the resonance variation relative to a PFOA concentration of 0.125 ppb without and with other compounds (hydrocarbons 10 ppb and α-lipoic acid 10 ppb).
3.3. Discussion
In Table 5, a comparative analysis was reported to assess the obtained performance in terms of LOD with other similar experimental configurations based on the same SPR–POF probe and as already presented in the literature. Table 5 shows roughly a three orders of magnitude difference between the sensor reported in this work and those previously realized by covering the same SPR sensing region with two kinds of receptors [15,20].

Table 5.
A comparative analysis between PFOA sensors based on the same SPR–POF platform combined with different receptors and/or methods.
In order to compare the proposed sensor system with others already presented in the literature, a comparative analysis was carried out for several types of PFAS sensors based on different sensing methods such as fluorescence, electrochemical, voltammetry, Fabry–Perot interferometry (FPI), SPR, and evanescent field. Table 6 summarizes this comparative analysis in terms of LODs.

Table 6.
PFAS detection exploiting different sensing methods: a comparative analysis in terms of LOD and concentration range of PFAS sensors.
In particular, as reported in Table 6, the fluorescence sensor [10] is based on a fast-sensing method; however, this technique is affected by several factors such as ionic strength and temperature. In fact, for temperatures below 40 °C, the fluorescence intensity is not ultra-sensitive to the binding between analyte and receptor (LOD equal to 7.5 × 10⁴ ppt). However, when the temperature is higher than 40 °C, the fluorescence intensity increases in a significant way with the binding.
The PFAS sensors [11,13] can be disposable and transportable; however, these techniques present LODs that are not practical for real-scenario applications.
Table 6 reports other sensing methods based on optical fibers, used to develop PFAS sensors. In particular, the FPI-based sensor [14] needs a complex and very expensive experimental setup, which does not imply a significant improvement in terms of performance. However, the PFAS sensor [20] based on the SPR techniques presents a LOD better than the FPI-based sensor [14]. A similar LOD can also be obtained by using a POF-based intensity-based sensor [24], which requires a very experimental chip setup consisting of a light-emitting diode (LED) and photodiodes. Finally, Table 6 shows the sensor presented in this work with a LOD three orders of magnitude smaller than the classical SPR-based [20] and intensity-based [24] sensors, realized with the same MIP receptor used in this work.
4. Conclusions
The proposed PFOA sensor can gain sensitivity at low concentrations and reach a detection limit much lower than those obtained in previous works, respectively, 0.063 nm/ppt and 0.81 ppt. This achievement was possible thanks to the change in the sensing approach behind the sensor system. The MIP receptor was located in contact with the core of the POF instead of the gold surface of the SPR–POF probe. In the future, due to the interesting results obtained, it will be possible to extend the choice of analytes to other categories of substances, exploiting the proposed sensing technology and the flexibility in changing the imprinting of the MIPs.
Author Contributions
Conceptualization, N.C., F.A., C.P. and L.Z.; methodology, R.P., N.C., F.A., C.P., D.D.P., G.P. and L.Z.; validation, R.P., N.C., F.A., C.P., D.D.P., G.P. and L.Z.; formal analysis, R.P., N.C., F.A., C.P., D.D.P., G.P. and L.Z.; investigation, R.P., N.C., F.A., C.P., D.D.P., G.P. and L.Z.; resources, N.C., G.P. and L.Z.; data curation, R.P., N.C., F.A., C.P., D.D.P., G.P. and L.Z.; writing—original draft preparation, R.P., N.C., F.A., C.P., D.D.P., G.P. and L.Z.; writing—review and editing, R.P., N.C., F.A., C.P., D.D.P., G.P. and L.Z.; supervision, N.C. and L.Z. All authors have read and agreed to the published version of the manuscript.
Funding
This research received no external funding.
Institutional Review Board Statement
Not applicable.
Informed Consent Statement
Not applicable.
Data Availability Statement
The data are available upon reasonable request from the corresponding author.
Conflicts of Interest
The authors declare no conflict of interest.
References
- Al Amin, M.; Sobhani, Z.; Liu, Y.; Dharmaraja, R.; Chadalavada, S.; Naidu, R.; Chalker, J.M.; Fang, C. Recent Advances in the Analysis of Per- and Polyfluoroalkyl Substances (PFAS)—A Review. Environ. Technol. Innov. 2020, 19, 100879. [Google Scholar] [CrossRef]
- Corsini, E.; Sangiovanni, E.; Avogadro, A.; Galbiati, V.; Viviani, B.; Marinovich, M.; Galli, C.L.; Dell’Agli, M.; Germolec, D.R. In vitro characterization of the immunotoxic potential of several perfluorinated compounds (PFCs). Toxicol. Appl. Pharmacol. 2012, 15, 248–255. [Google Scholar] [CrossRef] [PubMed]
- Corsini, E.; Avogadro, A.; Galbiati, V.; Dell’Agli, M.; Marinovich, M.; Galli, C.L.; Germolec, D.R. In vitro evaluation of the immunotoxic potential of perfluorinated compounds (PFCs). Toxicol. Appl. Pharmacol. 2011, 250, 108–116. [Google Scholar] [CrossRef] [PubMed]
- Ballesteros, V.; Costa, O.; Iniguez, C.; Fletcher, T.; Ballester, F.; Lopez-Espinosa, M.J. Exposure to perfluoroalkyl substances and thyroid function in pregnant women and children: A systematic review of epidemiologic studies. Environ. Int. 2017, 99, 15–28. [Google Scholar] [CrossRef] [PubMed]
- Ryu, H.; Li, B.; De Guise, S.; McCutcheon, J.; Lei, Y. Recent Progress in the Detection of Emerging Contaminants PFASs. J. Hazard. Mater. 2021, 408, 124437. [Google Scholar] [CrossRef] [PubMed]
- Saito, K.; Uemura, E.; Ishizaki, A.; Kataoka, H. Determination of perfluorooctanoic acid and perfluorooctane sulfonate by automated in-tube solid-phase microextraction coupled with liquid chromatography–mass spectrometry. Anal. Chim. Acta 2010, 658, 141–146. [Google Scholar] [CrossRef]
- Scott, B.F.; Moody, C.A.; Spencer, C.; Small, J.M.; Muir, D.C.; Mabury, S.A. Analysis for perfluorocarboxylic acids/anions in surface waters and precipitation using GC− MS and analysis of PFOA from large-volume samples. Environ. Sci. Technol. 2006, 40, 6405–6410. [Google Scholar] [CrossRef] [PubMed]
- Zhang, T.; Zhao, H.; Lei, A.; Quan, X. Electrochemical biosensor for detection of perfluorooctane sulfonate based on inhibition biocatalysis of enzymatic fuel cell. Electrochemistry 2014, 82, 94–99. [Google Scholar] [CrossRef]
- Chen, L.D.; Lai, C.Z.; Granda, L.P.; Fierke, M.A.; Mandal, D.; Stein, A.; Gladysz, A.J.; Bühlmann, P. Fluorous membrane ion-selective electrodes for perfluorinated surfactants: Trace-level detection and in situ monitoring of adsorption. Anal. Chem. 2013, 85, 7471–7477. [Google Scholar] [CrossRef]
- Liang, J.; Deng, X.; Tan, K. An eosin Y-based “turn-on” fluorescent sensor for detection of perfluorooctane sulfonate. Spectrochim. Acta A 2015, 150, 772–777. [Google Scholar] [CrossRef]
- Clark, R.B.; Dick, J.E. Electrochemical Sensing of Perfluorooctanesulfonate (PFOS) Using Ambient Oxygen in River Water. ACS Sens. 2020, 5, 3591–3598. [Google Scholar] [CrossRef]
- Cheng, Y.H.; Barpaga, D.; Soltis, J.A.; Shutthanandan, V.; Kargupta, R.; Han, K.S.; McGrail, B.P.; Motkuri, R.K.; Basuray, S.; Chatterjee, S. Metal–organic framework-based microfluidic impedance sensor platform for ultrasensitive detection of perfluorooctanesulfonate. ACS Appl. Mater. Inter. 2020, 12, 10503–10514. [Google Scholar] [CrossRef]
- Garada, M.B.; Kabagambe, B.; Kim, Y.; Amemiya, S. Ion-transfer voltammetry of perfluoroalkanesulfonates and perfluoroalkanecarboxylates: Picomolar detection limit and high lipophilicity. Anal. Chem. 2014, 86, 11230–11237. [Google Scholar] [CrossRef] [PubMed]
- Faiz, F.; Baxter, G.; Collins, S.; Sidiroglou, F.; Cran, M. Polyvinylidene fluoride coated optical fibre for detecting perfluorinated chemicals. Sens. Actuat. B-Chem. 2020, 312, 128006. [Google Scholar] [CrossRef]
- Cennamo, N.; Zeni, L.; Tortora, P.; Regonesi, M.E.; Giusti, A.; Staiano, M.; D’Auria, S.; Varriale, A. A high sensitivity biosensor to detect the presence of perfluorinated compounds in environment. Talanta 2018, 178, 955–961. [Google Scholar] [CrossRef]
- Haupt, K.; Mosbach, K. Molecularly Imprinted Polymers and Their Use in Biomimetic Sensors. Chem. Rev. 2000, 100, 2495–2504. [Google Scholar] [CrossRef] [PubMed]
- Kupai, J.; Razali, M.; Buyuktiryaki, S.; Kecilic, R.; Szekely, G. Long-term stability and reusability of molecularly imprinted polymers. Polym. Chem. 2017, 8, 666–673. [Google Scholar] [CrossRef]
- Haupt, K. Plastic Antibodies. Nat. Mater. 2010, 9, 612–614. [Google Scholar] [CrossRef]
- Schmidt, R.H.; Mosbach, K.; Haupt, K. A Simple Method for Spin-Coating Molecularly Imprinted Polymer Films of Controlled Thickness and Porosity. Adv. Mater. 2004, 16, 719–722. [Google Scholar] [CrossRef]
- Cennamo, N.; D’Agostino, G.; Porto, G.; Biasiolo, A.; Perri, C.; Arcadio, F.; Zeni, L. A molecularly imprinted polymer on a plasmonic plastic optical fiber to detect perfluorinated compounds in water. Sensors 2018, 18, 1836. [Google Scholar] [CrossRef]
- Cennamo, N.; Arcadio, F.; Zeni, L.; Alberti, G.; Pesavento, M. Optical-Chemical Sensors Based on Plasmonic Phenomena Modulated via Micro-Holes in Plastic Optical Fibers Filled by Molecularly Imprinted Polymers. Sens. Actuat. B-Chem. 2022, 372, 132672. [Google Scholar] [CrossRef]
- Steenland, K.; Fletcher, T.; Savitz, D.A. Epidemiologic Evidence on the Health Effects of Perfluorooctanoic Acid (PFOA). Environ. Health Perspect. 2010, 118, 1100–1108. [Google Scholar] [CrossRef]
- Cennamo, N.; Massarotti, D.; Conte, L.; Zeni, L. Low cost sensors based on SPR in a plastic optical fiber for biosensor implementation. Sensors 2011, 11, 11752–11760. [Google Scholar] [CrossRef] [PubMed]
- Cennamo, N.; D’Agostino, G.; Sequeira, F.; Mattiello, F.; Porto, G.; Biasiolo, A.; Nogueira, R.; Bilro, L.; Zeni, L. A Simple and Low-Cost Optical Fiber Intensity-Based Configuration for Perfluorinated Compounds in Water Solution. Sensors 2018, 18, 3009. [Google Scholar] [CrossRef] [PubMed]
- Ayawei, N.; Ebelegi, A.N.; Wankasi, D. Modelling and interpretation of adsorption isotherms. J. Chem. 2017, 17, 11. [Google Scholar] [CrossRef]
Disclaimer/Publisher’s Note: The statements, opinions and data contained in all publications are solely those of the individual author(s) and contributor(s) and not of MDPI and/or the editor(s). MDPI and/or the editor(s) disclaim responsibility for any injury to people or property resulting from any ideas, methods, instructions or products referred to in the content. |
© 2023 by the authors. Licensee MDPI, Basel, Switzerland. This article is an open access article distributed under the terms and conditions of the Creative Commons Attribution (CC BY) license (https://creativecommons.org/licenses/by/4.0/).