Article

Highly Specific Silver Ion Detection by Fluorescent Carbon Quantum Dots

by
Lorenzo Gontrani
1,†,
Elvira Maria Bauer
2,†,
Alessandro Nucara
3,
Pietro Tagliatesta
1 and
Marilena Carbone
1,*
1
Department of Chemical Science and Technologies, University of Rome “Tor Vergata”, Via della Ricerca Scientifica, 00133 Rome, Italy
2
Italian National Research Council-Institute of Structure of Matter (CNR-ISM), Via Salaria km 29.3, 00015 Rome, Italy
3
Physics Department, Sapienza Università di Roma, P.le Aldo Moro 5, 00185 Rome, Italy
*
Author to whom correspondence should be addressed.
These authors contributed equally to this work.
Chemosensors 2022, 10(9), 362; https://doi.org/10.3390/chemosensors10090362
Submission received: 2 August 2022 / Revised: 3 September 2022 / Accepted: 5 September 2022 / Published: 9 September 2022

Abstract

:
Nitrogen-doped carbon quantum dots are easily obtainable nanomaterials endowed with remarkable fluorescence properties for the detection of contaminations by heavy metals. In this report, we show that nanometric particles with high specificity for silver cations can be prepared by hydrothermal synthesis starting from citric and folic acid solutions. Solutions of these N-CQDs give a strong fluorescence emission in the violet region (385 nm) when excited at 330 nm, which can be quenched selectively by silver (I) cations at sub-nanomolar concentrations, while other cations do not give any effect. This remarkable feature was tentatively correlated with the stronger interactions between silver ion and small portions of the nanomaterial surface by comparing Ag+ and the isoelectronic Cd2+.

Graphical Abstract

1. Introduction

Carbon-based nanomaterials, provided with various translational symmetries, ranging from zero-dimensional fullerenes, monodimensional nanotubes, and 2D graphene sheets, have been receiving considerable attention for several years now since they have proven to be very useful materials in several technological fields, including, for instance, (opto)electronics, photovoltaics, and sensoristics [1,2,3,4,5,6,7]. Among these materials, carbon quantum dots (CQDs) have come into the limelight owing to the excellent optical properties they share with “traditional” semiconductor quantum dots, such as CdTe/CdSe [8,9] or other inorganic nanomaterials [10,11,12,13,14,15,16,17,18,19,20,21], augmented with other desirable properties, including remarkable biocompatibility and negligible cytotoxicity and biohazard [4,5]. Additional features of CQDs are their excellent solubility in water, chemical stability, resistance to photobleaching, and the possibility of functionalizing their surface and scaling up their preparation in a straightforward manner [22]. Concerning their photoluminescence emission, which is related to quantum confinement and to the presence of localized surface states [23,24], it can be largely tuned through the interaction of ions or molecules with CQD surfaces, thus causing quenching or enhancement effects. For the aforementioned reasons, these materials are suitable replacements for metal-based quantum dots, in applications such as biosensing [25,26], bioimaging [27,28,29], drug delivery [30,31], adjuvant selection in vaccines [32], and photocatalysis [33].
In the field of sensors, a quite important branch where CQDs find application focuses on the detection of heavy metals (HMs), which have become a significant factor in drinking water contamination owing to growing industrialization, agricultural land exploitation, and, occasionally, natural occurrence/concentration for geological reasons. In spite of increasingly stricter regulations and legislative actions, the exposure to high levels of HM intake via drinking is a concern for millions of people worldwide, while at least one million cases of chronic poisoning have been estimated in developing countries [34]; moreover, the risks for human health through food chain accumulation are increased by the presence of HMs in surface waters and seawater. Among heavy metals, the highest level of hazard is found in cadmium, lead, chromium, arsenic, and mercury, which are systemic toxicants causing damage to multiple organs and are classified as human carcinogens at very low concentrations as well [35]. As a matter of fact, the determination of such low levels of ions is usually performed with well-established laboratory methods, such as high-performance liquid chromatography (HPLC), absorption spectrophotometry (AAS), and inductively coupled plasma mass spectrometry (ICP-MS) [36,37]. Yet, such methodologies require expensive and heavy equipment, well-trained staff, and elaborate time-consuming procedures. All these factors, therefore, limit the capillary monitoring of water quality in developing countries. In this respect, the use of optical methods involving quantum dots may be of pivotal importance. A few studies concerning the detection of these heavy metals in water using carbon nanomaterials, both from the experimental [38] and theoretical side [39], have recently been reported by some of us and other research groups [40,41,42]. Less attention has been paid to other, apparently less toxic, cations, such as silver and gold, possibly relying on their higher chemical stability and on their use in common antiseptic and antibacterial medical preparations, such as colloidal silver, or as dietary supplements. Yet, when the former metal crosses mucosal surfaces or compromised skin, behaving as poor barriers, silver can deposit as particles in the human body causing a blue-gray discoloration known as argyria [43]. As far as toxicity is concerned, acute mortality in humans was observed at intrauterine exposure to ionic silver at 64 mg/kg bw of AgNO3, whereas localized argyria was reported upon exposure to silver ions, metallic surfaces, and nanocrystalline silver. Eye irritation and some cases of allergic contact, as well as other toxicities, including hepatic, renal, neurological, and hematological effects were reported for ionic and reduced forms of the metal [44,45,46]; genotoxicity [47] and carcinogenic potential are still debated [48]. Therefore, the detection of silver contamination is an issue that deserves attention.
Turning back to metal detection by CQD optical properties, the working mechanism is linked to the presence of functional groups on the surface of the nanomaterial that can coordinate the metal and modulate the response properties. The active role in such processes is often played by oxygen-containing functional groups, such as hydroxyl and carboxylate moieties, but additional anchoring points can be generated by N-doping in order to shift the selectivity or modify the spectral features [49]. According to the accessibility requirements discussed above, CQDs for detection purposes need facile syntheses without further treatments prior to their use. Two families of protocols have been developed, namely, bottom-up and top-down approaches, which are chosen depending on the starting materials, target size, and target ion. In bottom-up approaches, the starting point is a mixture of small organic molecules that are carbonized through microwave, ultrasonication, hydrothermal, or solvothermal treatments. The forerunner of bottom-up synthesis is citric acid condensation [12,50,51], where CQDs are obtained by heating the organic acid at 180–200 °C, followed by water dilution until the liquid phase turns to a pale yellow/orange, and finally by centrifugation and diffusion dialysis. The technique was then extended to the condensation of other species, including, e.g., saccharides [52], biopolymers [53], ascorbic [54] and humic acids [55], up to fruits and vegetables [56], and some kinds of vegetable waste [57]; overall, CQDs obtained from pyrolysis are generally sensitive to Fe3+ or Fe2+ ions only [58]. N-doping can be introduced into bottom-up synthesis by performing hydrothermal treatments on several mixtures of C-donor and N-donor reactants. For instance, N-doped CQDs (N-CQDs) can be prepared using mixtures like CCl4/1,2-ethylenediamine, CCl4/1,3-propanediamine, CCl4/1,4-butanediamine [59], folic acid/ethylene glycol [60], citric acid/glycine [61], and a mixture of seaweed-derived κ-carrageenan/lemon juice/benzalkonium chloride [62] and can be used to set-up improved sensors with selectivity to multiple [59] or different ions [61]. Yet, the use of CCl4/amine mixtures is not allowed in some countries, owing to the toxic/carcinogenic character of the former component, and other nitrogen-containing biomasses like rice-straw or finely ground Tulsi (Holy basil) leaves are now used to synthesize N-CQDs [63,64]. Differently from bottom-up strategies, the top-down synthesis of CQDs takes place from the separation/fragmentation of “large” carbonic precursors, including nanotubes, graphene, carbon black, and fullerene. These abundant materials are composed of an extended network of sp2 carbon atoms but have an infinite exciton Bohr diameter and consequently no suitable bandgap to produce luminescence on excitation [65]. Therefore, the fragmentation of these large carbon structures into nanosized particles is required for the quantum confinement effect to operate, “opening” a bandgap and thereby empowering them with photoluminescence (PL) [66]. Both physical and chemical methods can be used for this purpose, such as laser ablation and redox reactions, mostly related to the Hummer method which employs sulfonitric attacks [67]. The oxi-reductive top-down synthesis, especially when applied to Buckminster fullerene, permits good size control because the original buckyballs have well defined sizes in advance; furthermore, the treatment with highly oxidizing chemicals leaves the oxygen-containing functional groups discussed above (-OH or -COOH) on the surface of the fullerene halves. Yet, N-doping is not commonly performed in unfolding top-down pathways.
In the present paper, we report a simple and low-cost bottom-up hydrothermal synthesis of N-doped CQDs starting from citric and folic acid. The synthesized N-CQDs were characterized with infrared spectroscopy and scanned electron microscopy, and they proved to be composed of nanometric spherical particles of 2.56 nm average diameter. The nanoparticles were used as fluorescent probes for metal ion detection in water solutions. We found that the present NPs show very high sensitivity towards Ag+ cation that leads to a strong fluorescence quenching (up to 80% of the blank reference fluorescence signal) while small quenching or enhancement (max 10%) is observed for all the other ions investigated.
Such high sensitivity and selectivity are of utmost interest in the field of metal chemosensors, considering that they are rarely found for this metal and at this extent. A tentative modeling of such sensitivity is performed by building small ab initio molecular models of the interaction between the cation and the nucleophilic nitrogen of pyrimidinic, graphitic, and N-oxide pyrimidinic portions of the N-doped surface. A comparison between Ag+ (strong quenching) and the isoelectronic Cd2+ (~no effect on luminescence) is carried out.

2. Materials and Methods

2.1. Sample Preparation

The carbon quantum dots were prepared according to the following synthesis strategy. A citric acid solution (0.014 gr in 7.5 mL H2O) and a folic acid solution (0.033 gr in 7.5 mL H2O) were each mildly sonicated for 10 min and then mixed together (total volume 15 mL). The mixture was stirred for another 15 min, and finally the pH was checked and corrected by the addition of 1 M NaOH until pH = 10 was reached. Finally, the reaction mixture was transferred into a Teflon-lined stainless steel autoclave (total volume 50 mL), sealed, and then transferred into a hot oven pre-heated at 250 °C, where it was kept for 5 h. After cooling to room temperature, the reaction product was separated by subjecting it to alternate one-hour centrifuge cycles at 2500 and 3500 rpm speed, respectively. After each cycle, the supernatant was discarded and replaced with an equivalent volume of ultra-pure water. The total process consisted in a total of 10 centrifuge cycles over 2 days. Additionally, the pH value of the last supernatant solution was checked for neutrality.

2.2. Spectroscopy and Microscopy

The samples were analyzed in a Field Emission Microscope Zeiss Auriga 405, of 1 nm nominal resolution (Oberkochen, Germany), mounting a Gemini column and operating at 7 kV. The instrument is equipped with a Bruker Quantax energy dispersive X-ray analyzer (Energy Resolution: 123 eV Kα of Mn). The samples were observed under high vacuum (10−5 ÷ 10−6 mbar). The microanalysis, which allows the assessment of which atoms are present in the sample, was carried out at increasing accelerating voltage E0 (i.e., 3, 5, 10, 15 keV). Considering the relationship between the accelerating voltage and the penetration of the beam, (x = 0.1 E0 1.5/r, with r = 4.75 g/cm3), the use of variable voltage allowed us to obtain a qualitative determination of the composition profile. Images were recorded on fine powders deposited from a drop of water dispersions from the sample (drop-cast method). The samples for the EDX analysis were prepared separately on two different types of sample holders, i.e., standard stubs covered either with carbon tape or with a silicon wafer of suited dimensions. Moreover, subsequent depositions of QDs were laid on the surface of the sample holders to reach approximately 0.5 mm thickness. Such a procedure ensures that no contribution to the overall signal derives from the sample holder. In addition, the employment of sample holders of different materials allows a cross checking of the actual QD composition, by comparison of the two data sets and verification of anomalous values. Finally, the EDX measurements were performed on three areas per sample holder and the results were averaged.
Infrared spectra were recorded with a Shimadzu Prestige-21 FT-IR instrument, equipped with an attenuated total reflectance (ATR) diamond crystal (Specac Golden Gate, Gillingham, UK), in the range 400–4000 cm−1, with a resolution of 4 cm−1. UV absorption measurements were conducted with a V-750 UV-Visible/NIR Spectrophotometer (Jasco, Tokyo, Japan) equipped with double-beam optics and variable spectral bandwidth, a high sensitivity PMT detector, whose spectral bandwidth can be set as narrow as 0.1 nm, and special low stray light slit settings that provide increased linearity to up to 5 absorbance units. Fluorescence measurements were performed with a Perkin Elmer fluorimeter in the 300–650 nm wavelength range using λ = 330 nm as excitation wavelength. For each measurement, 1.50 mL of the stock solution (N-CQDs in water) or of the freshly prepared water solution of metal nitrate (concentration of 18 nM for all the ions but silver, which was investigated at 20 μM and several other smaller nanomolar concentrations) were employed. Control measurements were also carried out using a different silver salt available in the lab (silver sulphate, Ag2SO4) and no appreciable differences with nitrate results were found within the experimental uncertainty.

2.3. Theoretical Calculations

We performed calculations on three small fragments of the N-CQD surface (one pyrimidine, one “graphitic” quaternary ammonium, and one pyrimidine-N-oxide, each fused with another phenyl ring) coupled with either one Ag+ or Cd2+ cation. Density Functional Theory (DFT) with the long-range corrected hybrid density functional ωB97X-D [68] was employed, using the split-valence basis set 6–31 + G(d) for light atoms [69] and the Los Alamos National Laboratory basis sets (including effective-core potentials), known as LANL2DZ [70], for Ag and Cd. The chosen functions include corrections for dispersion interactions and have proven to be effective in the calculation of geometries and excitation energies. All the geometry optimizations were performed with the Gaussian 16 program [71] and visualized with Gaussview (Version 6, Dennington, Roy; Keith, Todd A.; Millam, John M. Semichem Inc., Shawnee Mission, KS, USA, 2016.) [72] and Molden(Molden 2.0: quantum chemistry meets proteins”, J Comput Aided Mol Des (2017) 31: 789) [73] softwares.
As experimental data were gathered on nanoparticle water solutions, the solvent effect was taken into account with the Polarizable Continuum Model (PCM) [74], choosing water as solvent (static dielectric permittivity ϵ = 78.3553, permittivity at infinite frequency ϵ(∞) = 1.7778).

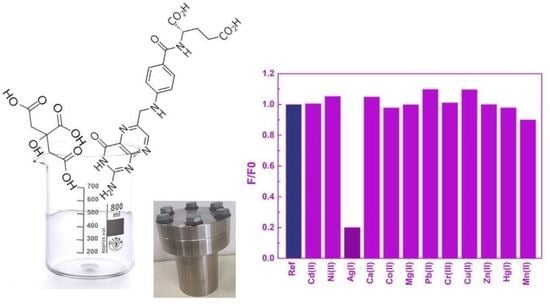
3. Results and Discussion

3.1. Characherization of Bare CQDs

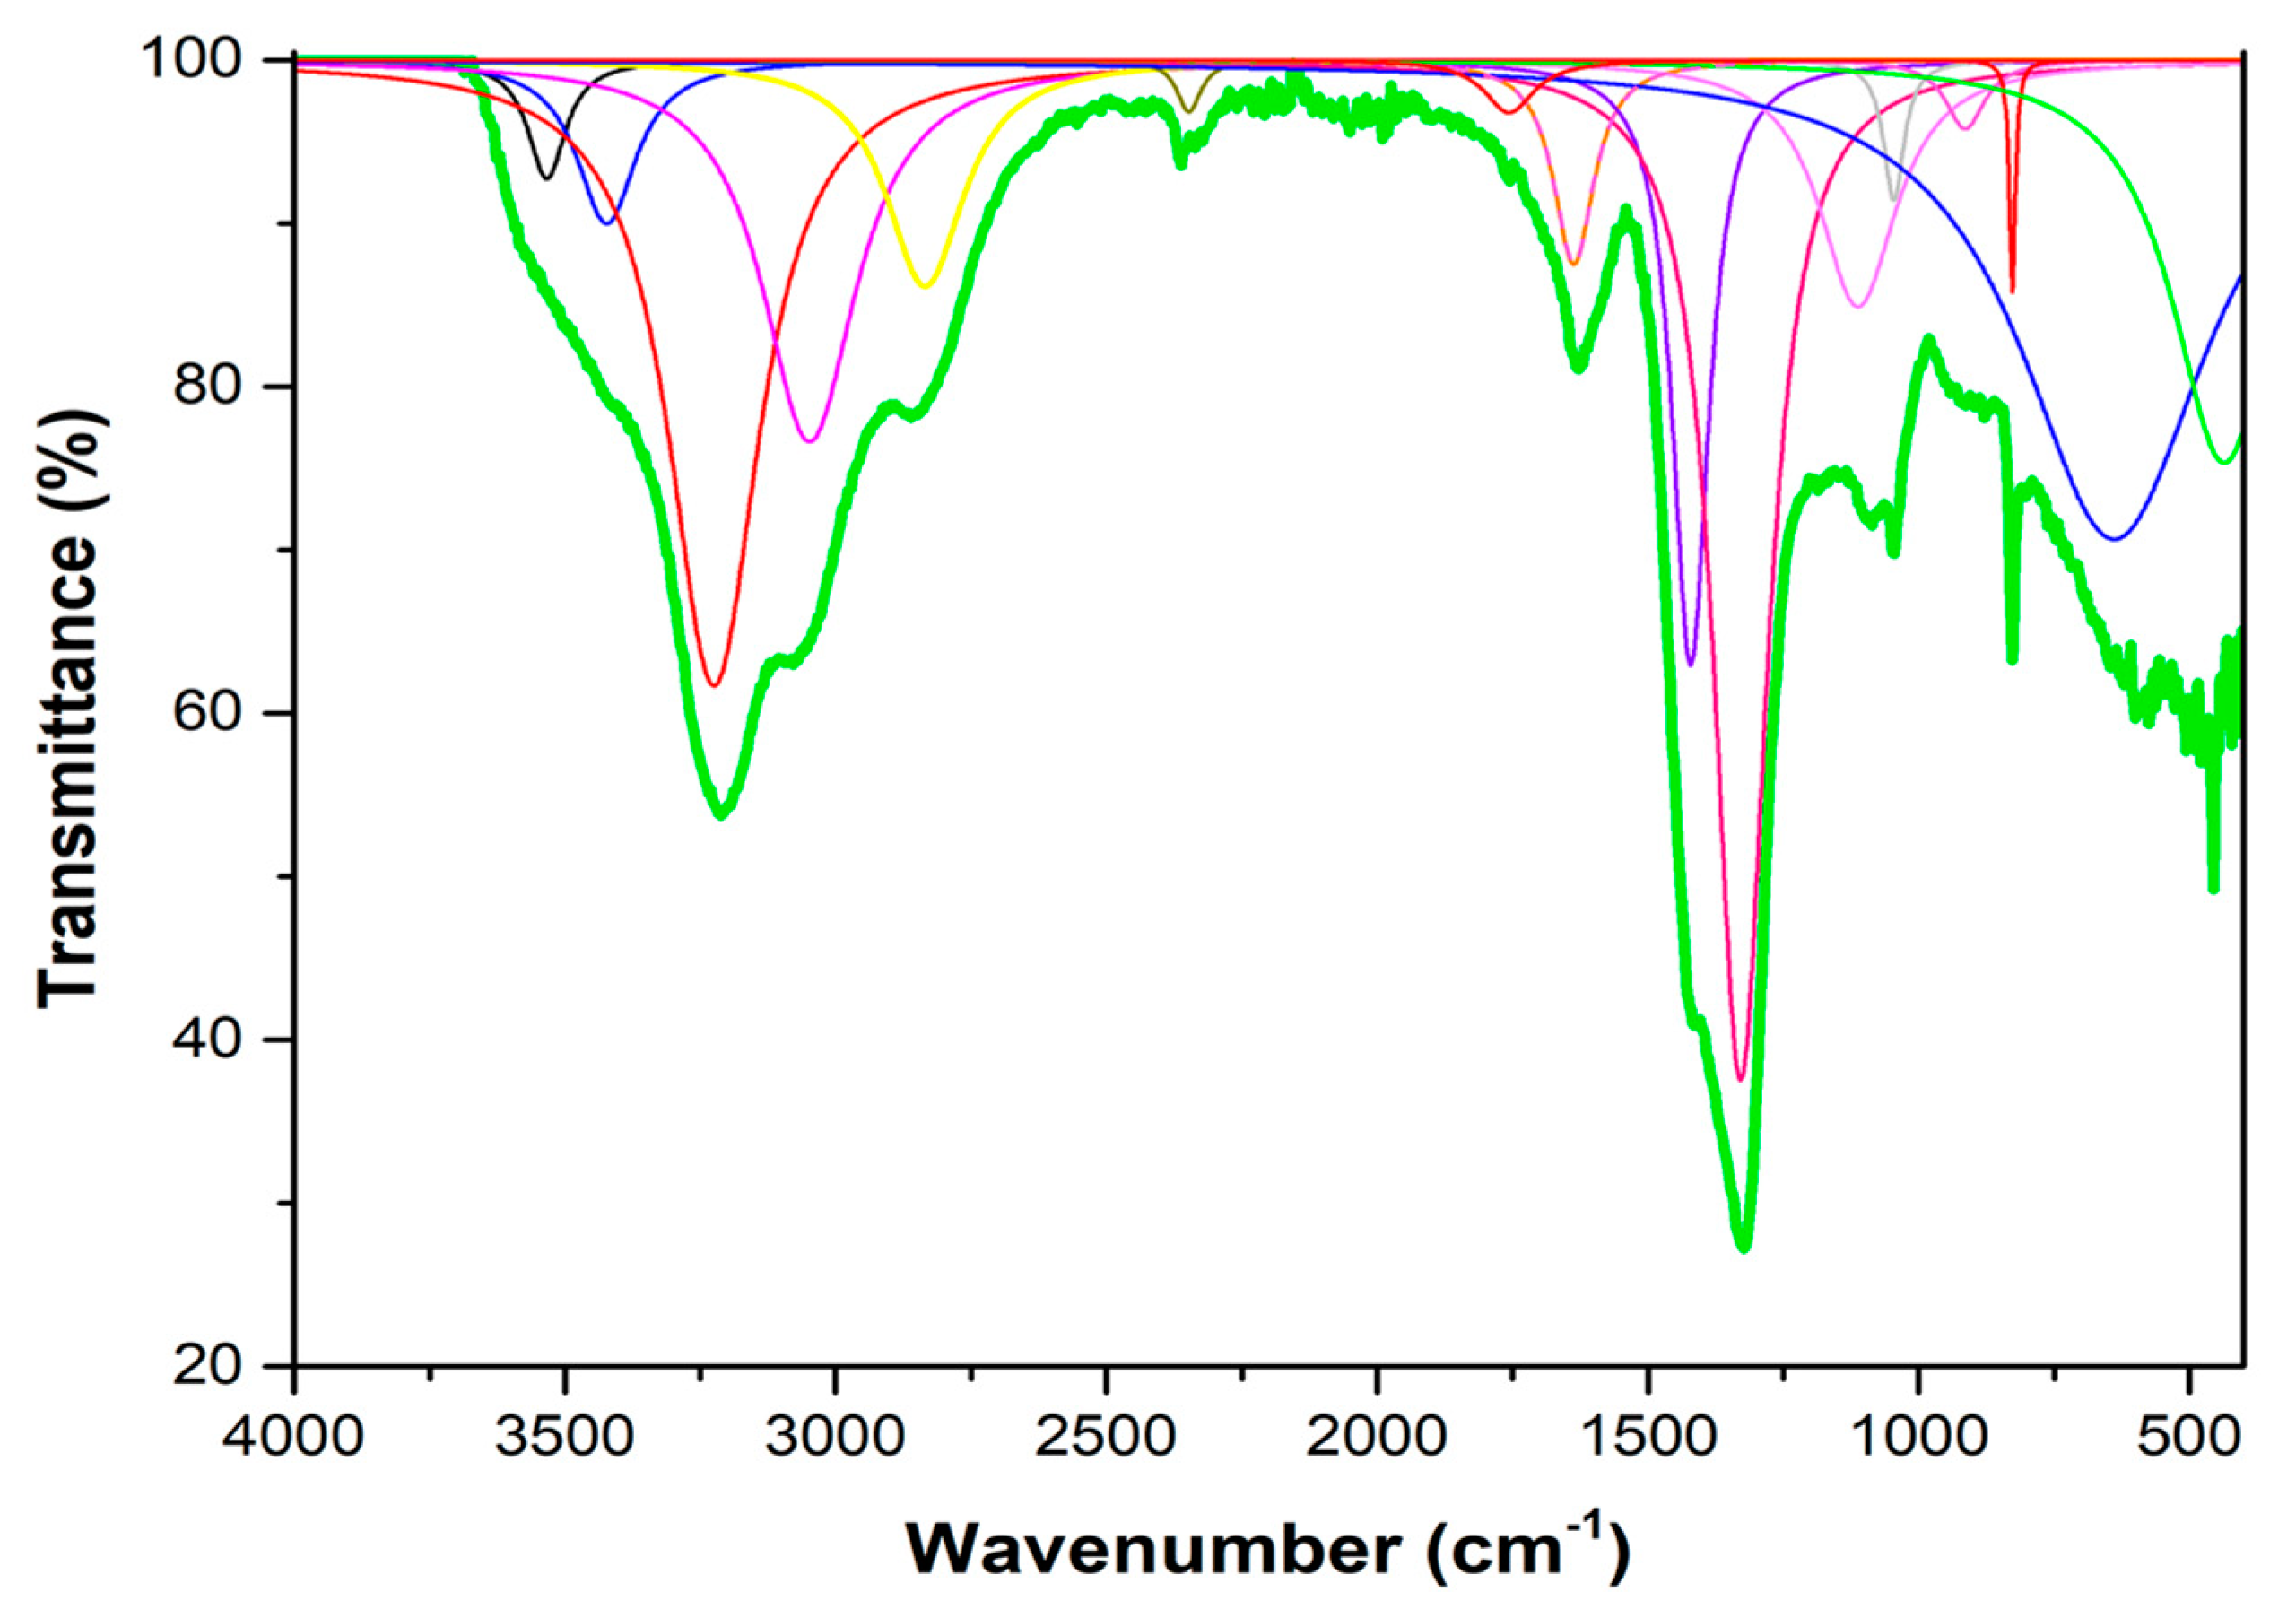
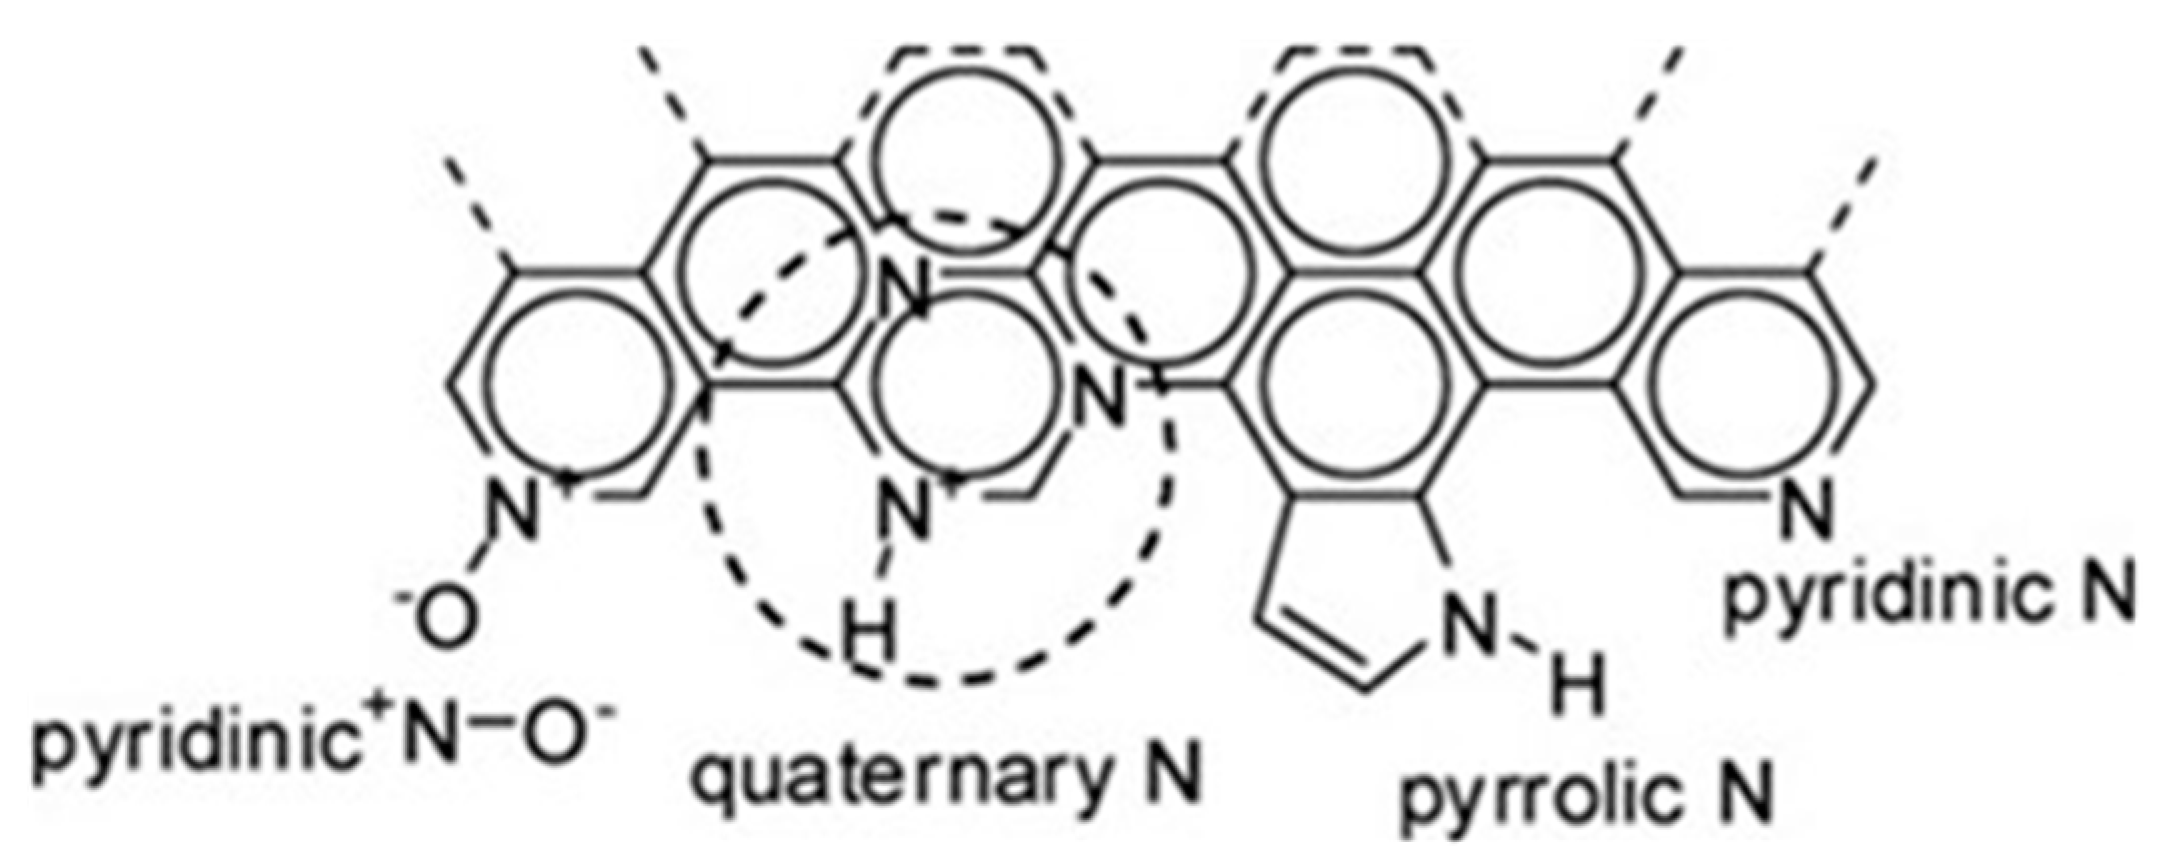
3.1.1. FTIR Spectrum
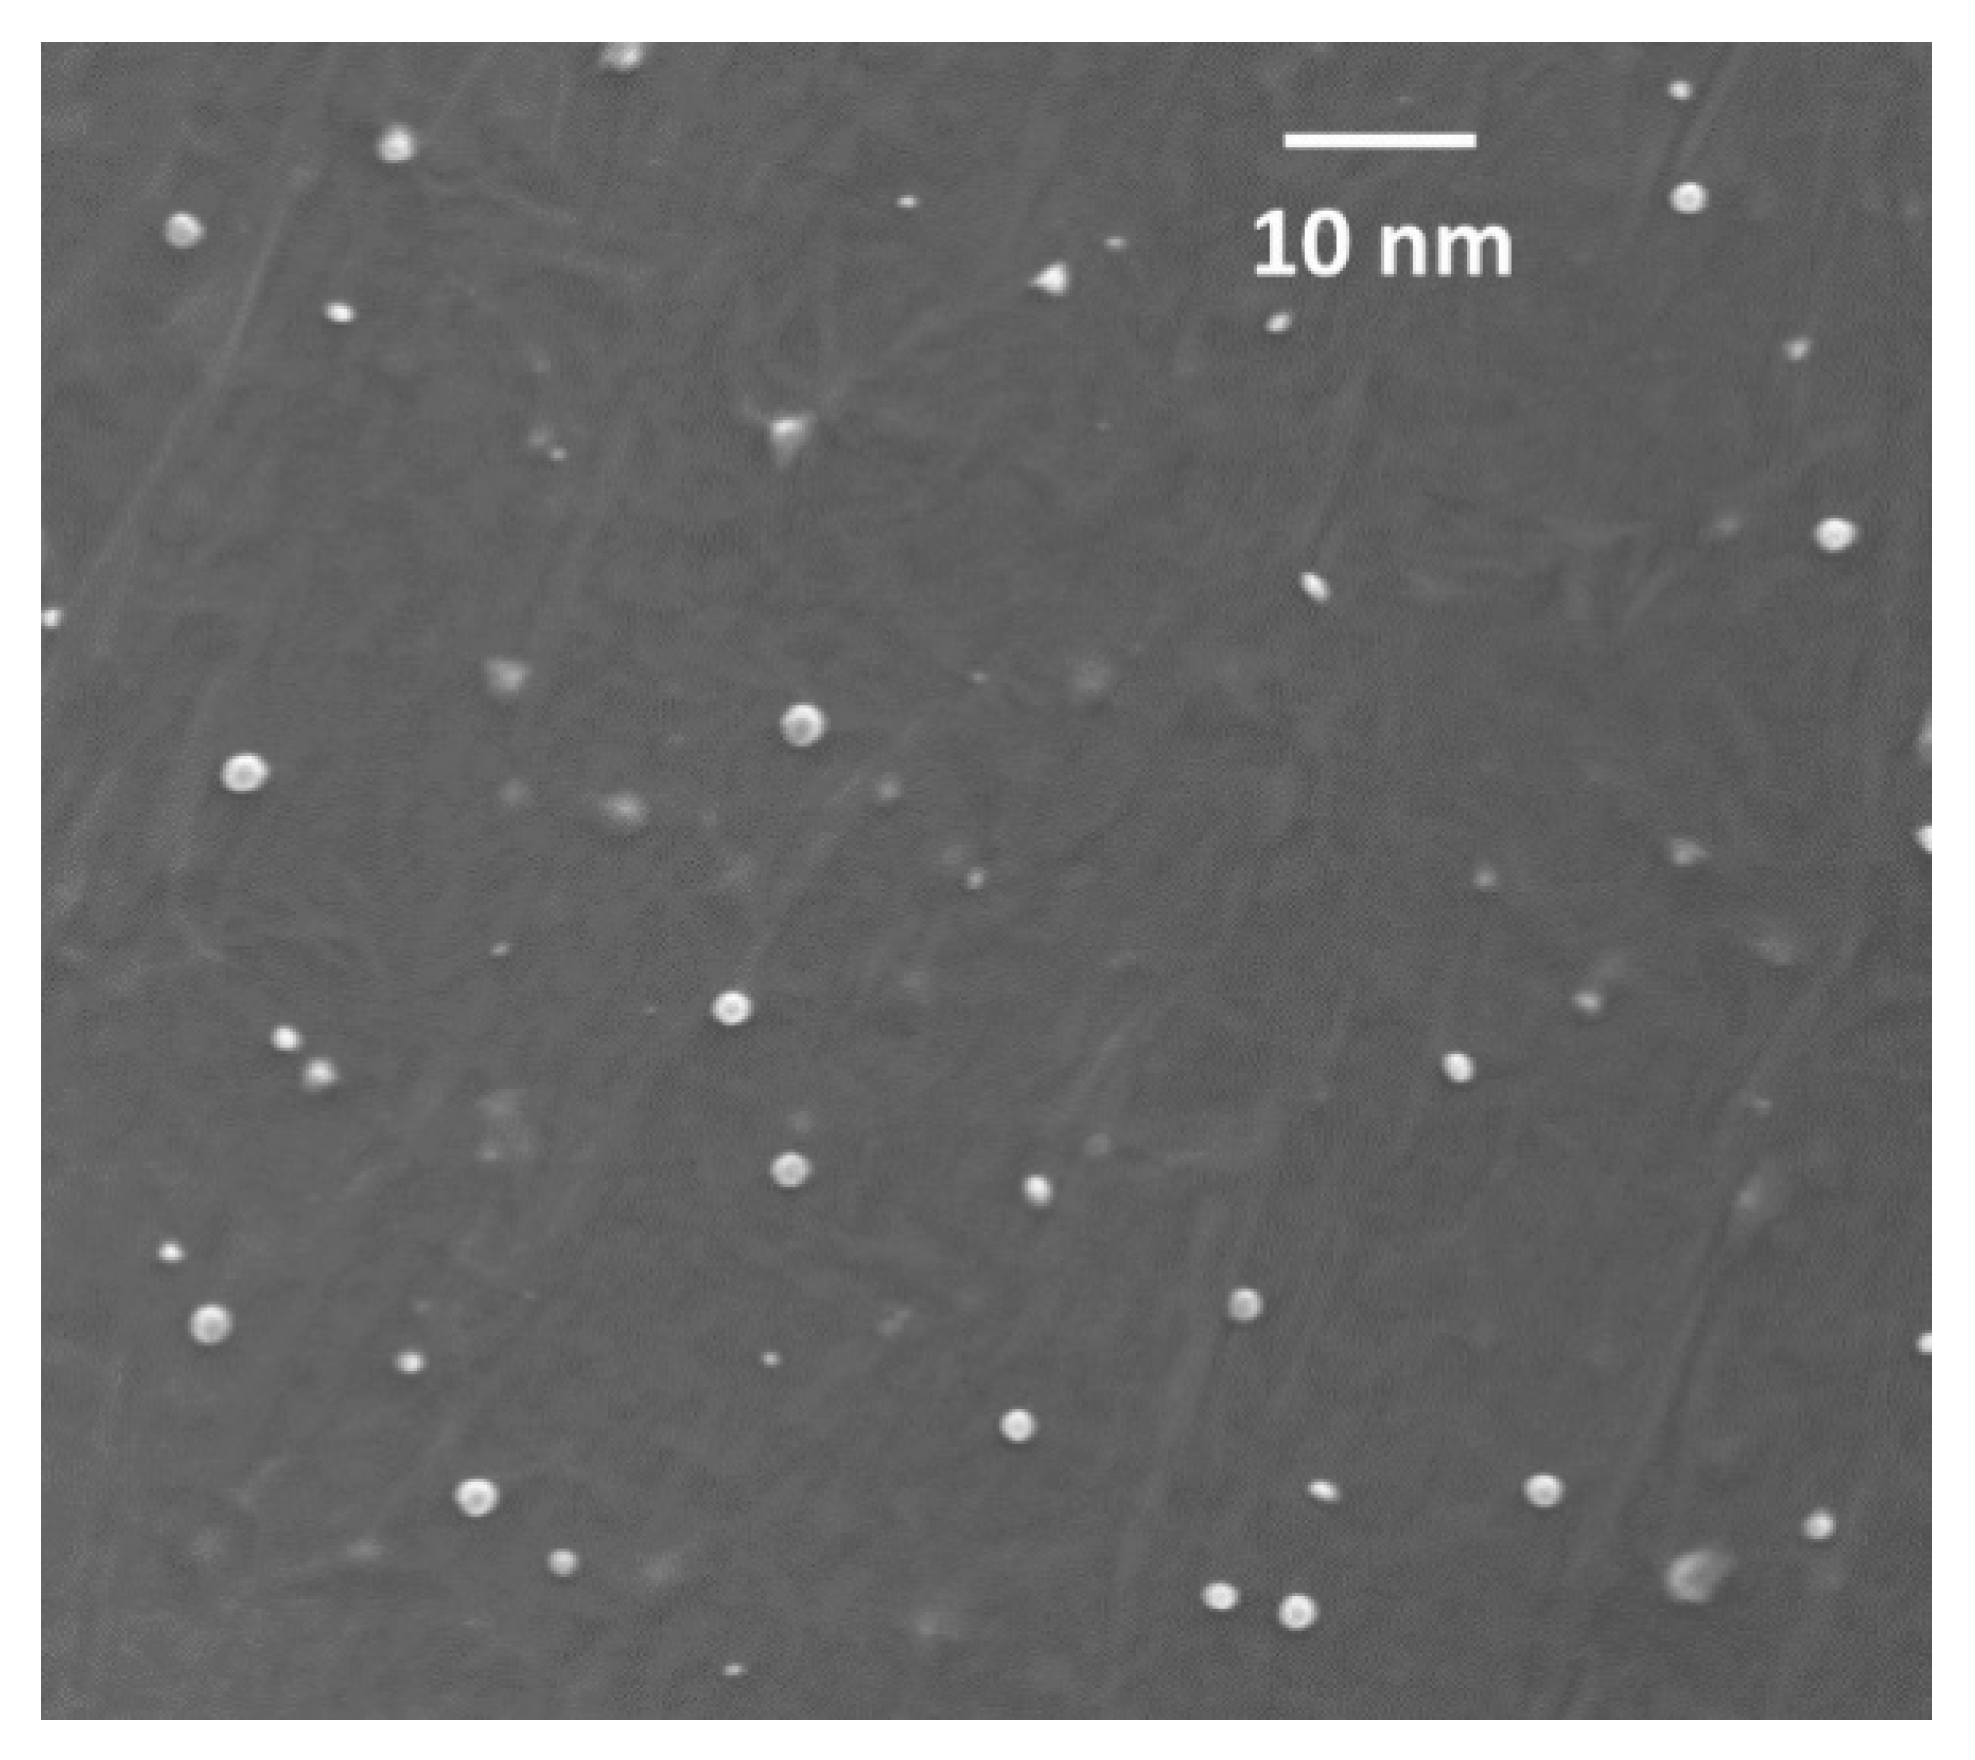
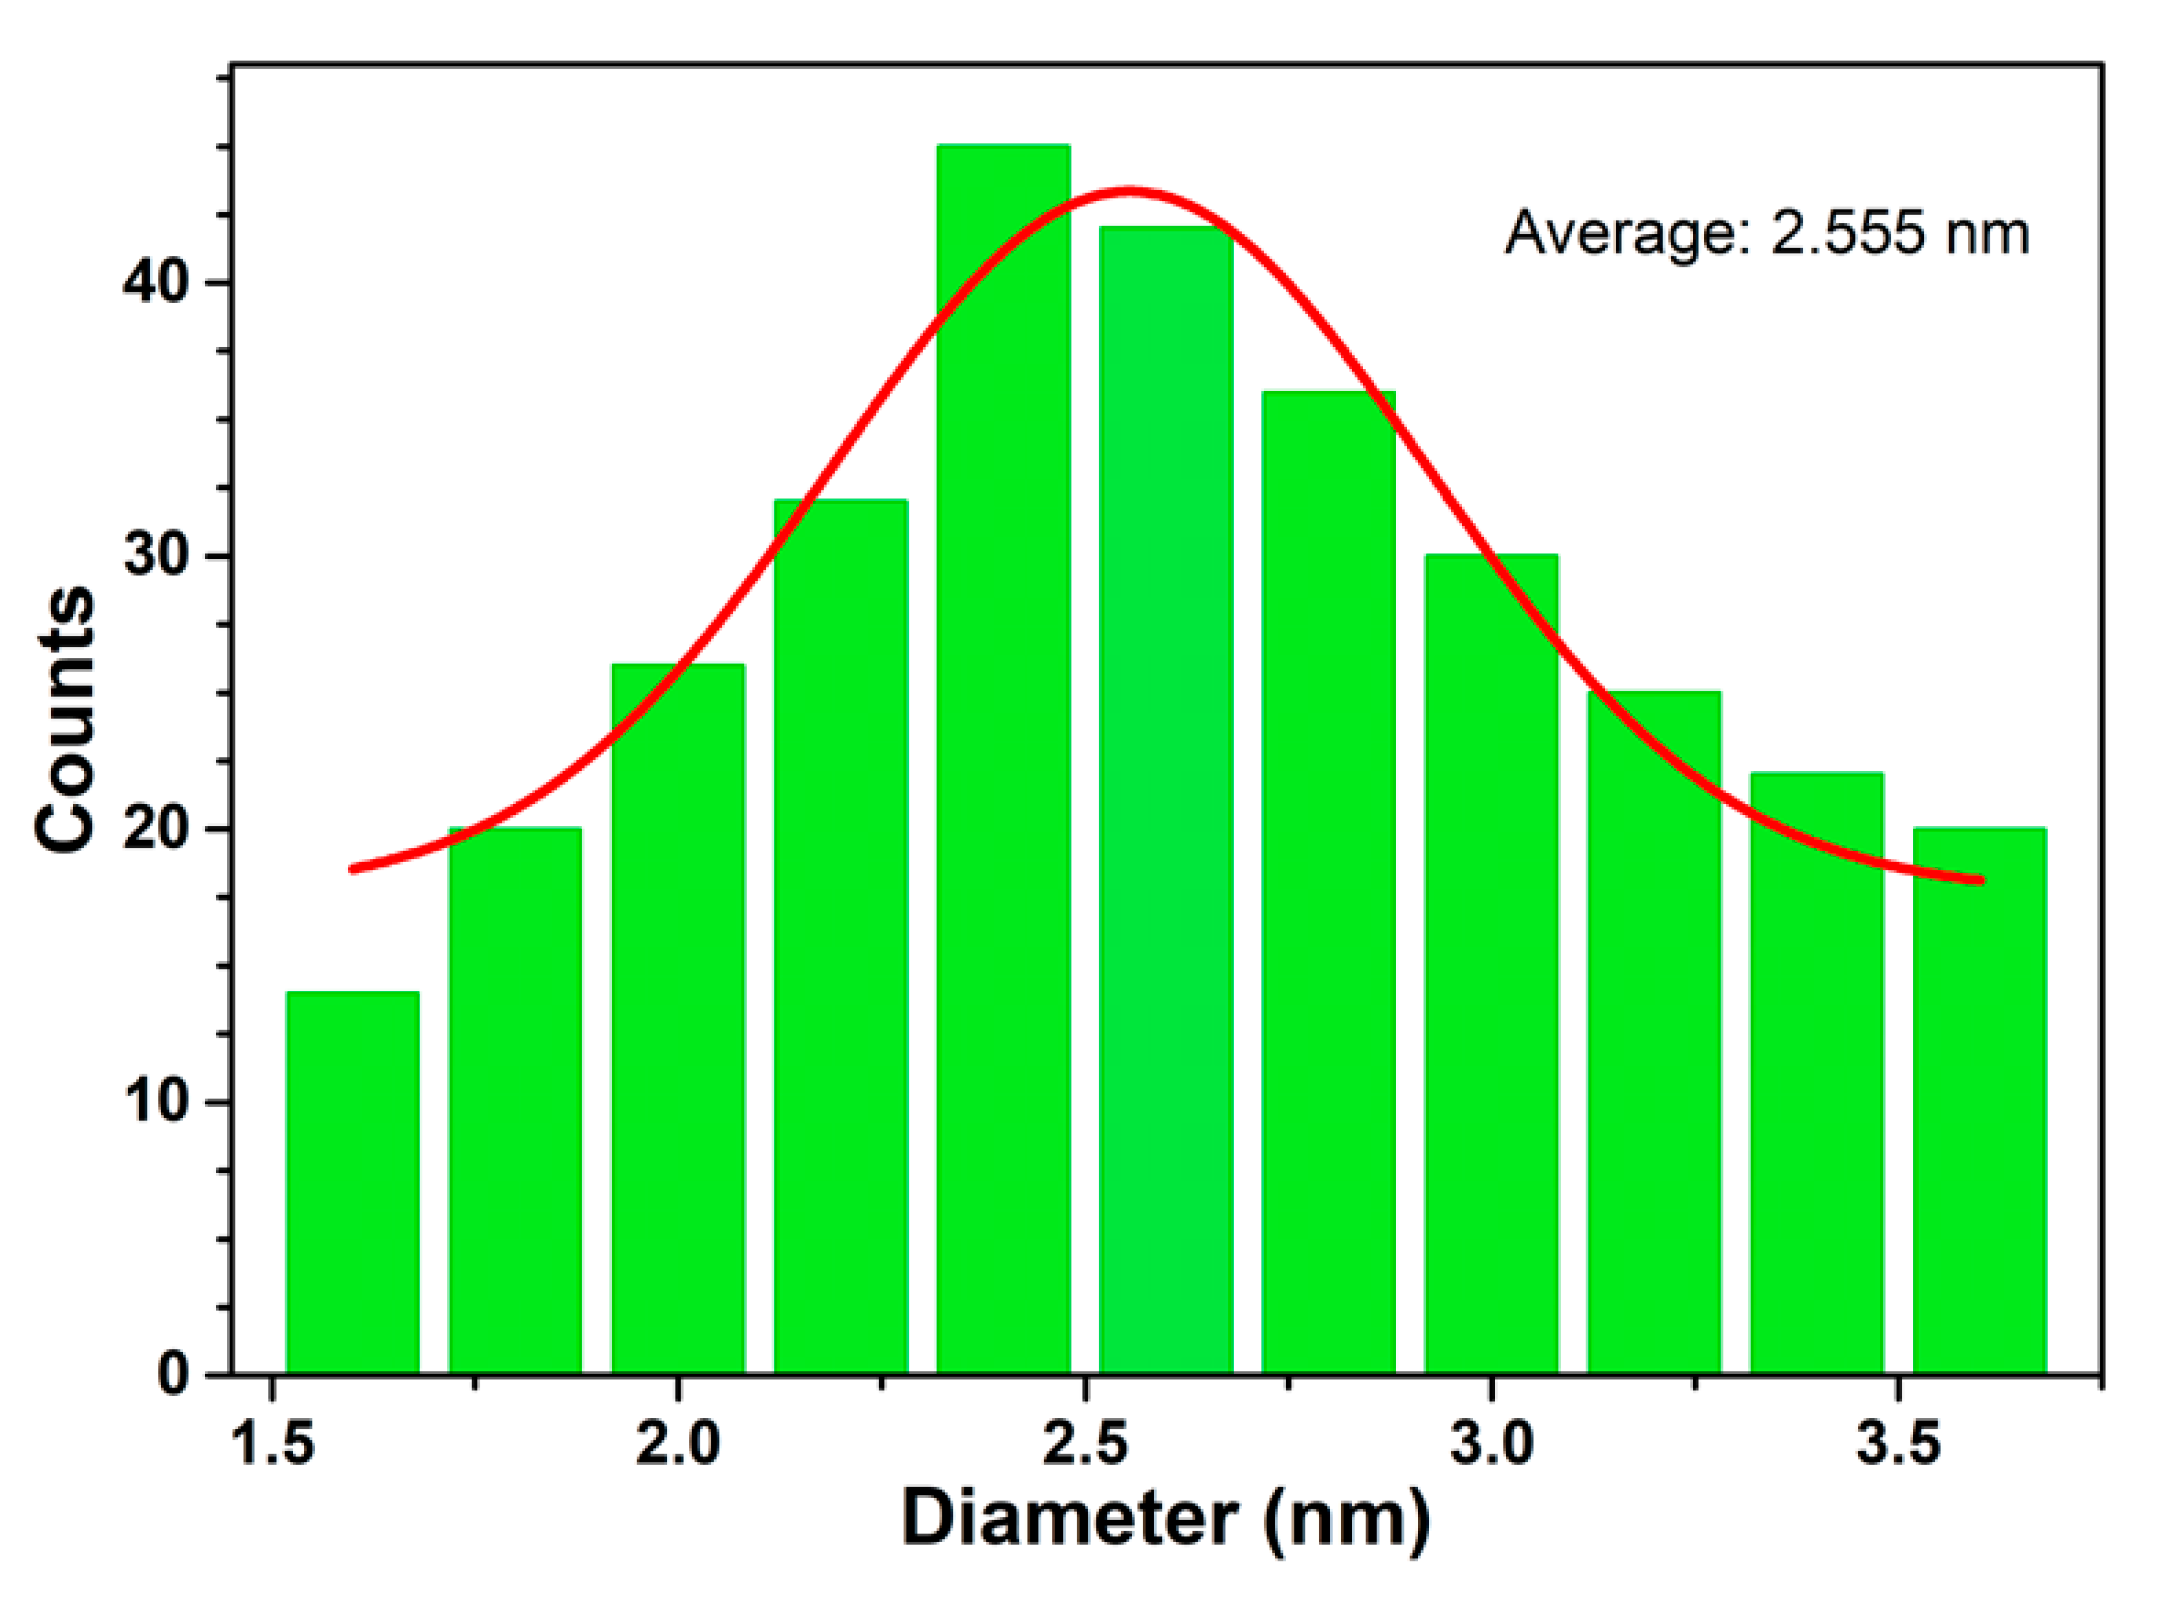
The experimental FTIR recorded for the bare N-CQDs is reported in Figure 1. Differing from the average non-N-doped carbon quantum dots spectra, the transmittance pattern shows some peculiar features in the fingerprint region and in the lower-wavenumber range, namely, the presence of two sharp peaks around 915, 825, and 440 cm−1. To facilitate the assignment, the whole spectrum was deconvoluted using Fityk software [75] by assigning a total of 16 Lorentzian functions, centered in the maxima of the observed peaks (the procedure was carried out on the derived absorbance spectrum), and the total pattern was fit using the Levenberg–Marquardt algorithm. The fitted peaks, together with area, intensity, Full Width at Half Maximum (FWHM), and a tentative interpretation of the normal mode relative to the absorption are reported in Table 1.
Above 2500 cm−1, the FTIR spectra of bare N-CQDs is dominated by a broad and quite intense band spreading from 3600 cm−1 to 2600 cm−1. The broad shoulder around 3300 cm−1 is typical for OH stretching of bound and free hydroxyl groups (water, carboxylic acids, and alcohols) while the intense maxima centered at 3224 cm−1 indicates the presence of amino or amide NH stretching vibrations. A broad and intense shoulder centered at 3048 cm−1, characteristic of aromatic CH stretching, confirms the aromatic nature of the N-CQDs obtained by hydrothermal treatment of a citric and folic acid mixture. Aliphatic hydrocarbons are also present as indicated by the quite intense shoulder located around 2834 cm−1. Interestingly, the sharp and intense bands assigned to the CH alkene formation by Abramova et al. after hydrothermal treatment of folic acid [76] have not been observed in this case although the location of the broad shoulder falls in the same spectral region. Indeed, the former study was performed on reaction products after thermal treatment at lower temperatures (200 °C) and in the absence of other reactants such as citric acid, resulting in a completely different surface modification of the obtained N-CQDs. Consequently, the FTIR pattern registered in the fingerprint region (below 1800 cm−1) of our product differs from the previously cited one. Indeed, formation of a pteroic acid derivative has been suggested to be the origin of the high quantum yield photoluminescence properties of the hydrothermal reaction product. In the present case, similarities with the folic acid derivative are less evident, especially regarding bands associated to the aromatic systems at around 1400 cm−1, 1500 cm−1, and 1600 cm−1. It should be considered that in the case of QD production from citric acid, a citrazinic acid derivative, i.e., 5-oxo-1,2,3,5-tetrahydroimidazo [1,2-α]pyridine-7-carboxylic acid] (IPCA) has been indicated to be responsible for the exciting fluorescence properties of the hydrothermal reaction products as well. Song et al. isolated IPCA as a fluorescent reaction product from citric acid using ethylenediamine as nitrogen source for hydrothermal synthesis of N-CQDs and proposed the formation of IPCA functionalized N-CQDs at temperatures around 250 °C [77] Additionally, in the latter case several strong bands associated with carboxylic acid stretching above and below 1700 cm−1 have been observed in the corresponding FTIR spectra (see also [78]) while in the present preparation method a different nitrogen source, i.e., folic acid, was chosen, thus accounting for the different chemical features of the N-CQDs examined here.
Moving towards lower wavenumbers, the feature seen at 2349 cm−1 is ascribable to CO2 antisymmetric stretching vibration, due to incomplete background subtraction; further on, the small band visible around 1757 cm−1, corresponding to the typical C=O stretching of carboxylic acids, is the leftmost boundary of a large region where several functional groups show characteristic bands. The experimental signal in this region is very broad and bears several shoulders on the higher and lower wavenumber side. Taking into account that the band spreads from 1730–1540 cm−1 contributions from C=O carboxylic (acids, amides, or ketones), OH bending of water and also C=C stretching of aromatic rings or N-bearing aromatic heterocycles (residual pteroic acid moiety of folic acid), antisymmetric stretching of guanidyl groups coupled to NH bending and NH2 scissoring may account for the region above 1590 cm−1 [79]. The indicated maximum may be assigned to the superimposition of water OH bending, amide I, and typical C-C stretching vibrations of heteroaromatic moieties (pteroic acid, pyridines, or pyrimidines). The large extension at lower wavenumbers (ca. 1550 cm−1) may indicate antisymmetric stretching vibrations of carboxylic acid groups (COO) or even formation of enolates due to deprotonation of residual pteroic acid groups. [78]. The next broad vibrational band extends from 1540 to 1310 cm−1 with evident maxima located at 1421 cm−1 and 1329 cm−1. Furthermore, in this wide spectral region several functional groups show characteristic bands. At the higher wavenumber side, antisymmetric COO stretching vibrations are generally found (1550–1500 cm−1), while the intense shoulder observed around 1421 cm−1 may be related to a superimposition of the former with typical CH2 bending modes. The CH2 groups can also contribute to the maximum found around 1329 cm−1 together with hydroxyl group OH bending, aromatic CH bending, and aromatic C-N/C-C stretching vibrations. Below 1200 cm−1, only a few bands associated with in-plane bending of aromatic -CH groups (around 1100 cm−1) or typical stretching of C-O-C fragments (1046 cm−1) can be observed. Out-of-plane bendings of carboxylic acid OH and amide NH bonds (NH wagging) may be tentatively assigned to the bands found at 914 cm−1, whereas the sharp absorption at 827 cm−1 is probably assigned to the C-O-C bending of isolated epoxy moieties on the quantum dot surface [38,80,81]; in the features at lower wavenumbers (639 and 436 cm−1), hydroxyl and CH bonds bending modes are probably involved.

3.1.2. SEM Analysis

The synthesized N-CQD nanoparticles were analyzed with SEM microscopy to evaluate their morphology. The study, whose typical image is reported in Figure 2, revealed that the drop-cast sample is composed of very small spherical particles, having diameters falling in the range of 1.6–3.6 nanometers. The size distribution of the particles, in terms of individual diameters, is reported in Figure 3. The distribution has a pseudo-Gaussian shape, with a mean value = 2.555 nm, standard deviation = 0.366 nm, and FWHM = 0.862 nm, and confirms that low-nanometric particles can be obtained with the reported methodology.
Besides the morphology investigation, SEM images were also employed to estimate the elemental composition of the system through Energy Dispersive X-Ray spectroscopy analysis (EDX). EDX revealed that the nanoparticles contained only C, N, and O atoms, whose relative ratios were compliant with an approximate citric acid to folic acid ratio of around 50:50 (Table 2). This issue demonstrated that the nitrogen doping of the nanoparticles had been correctly realized, corroborating the assignment of FTIR peaks to nitrogen-containing groups’ normal modes.

3.2. Spectroscopic Characherization of CQDs Solution

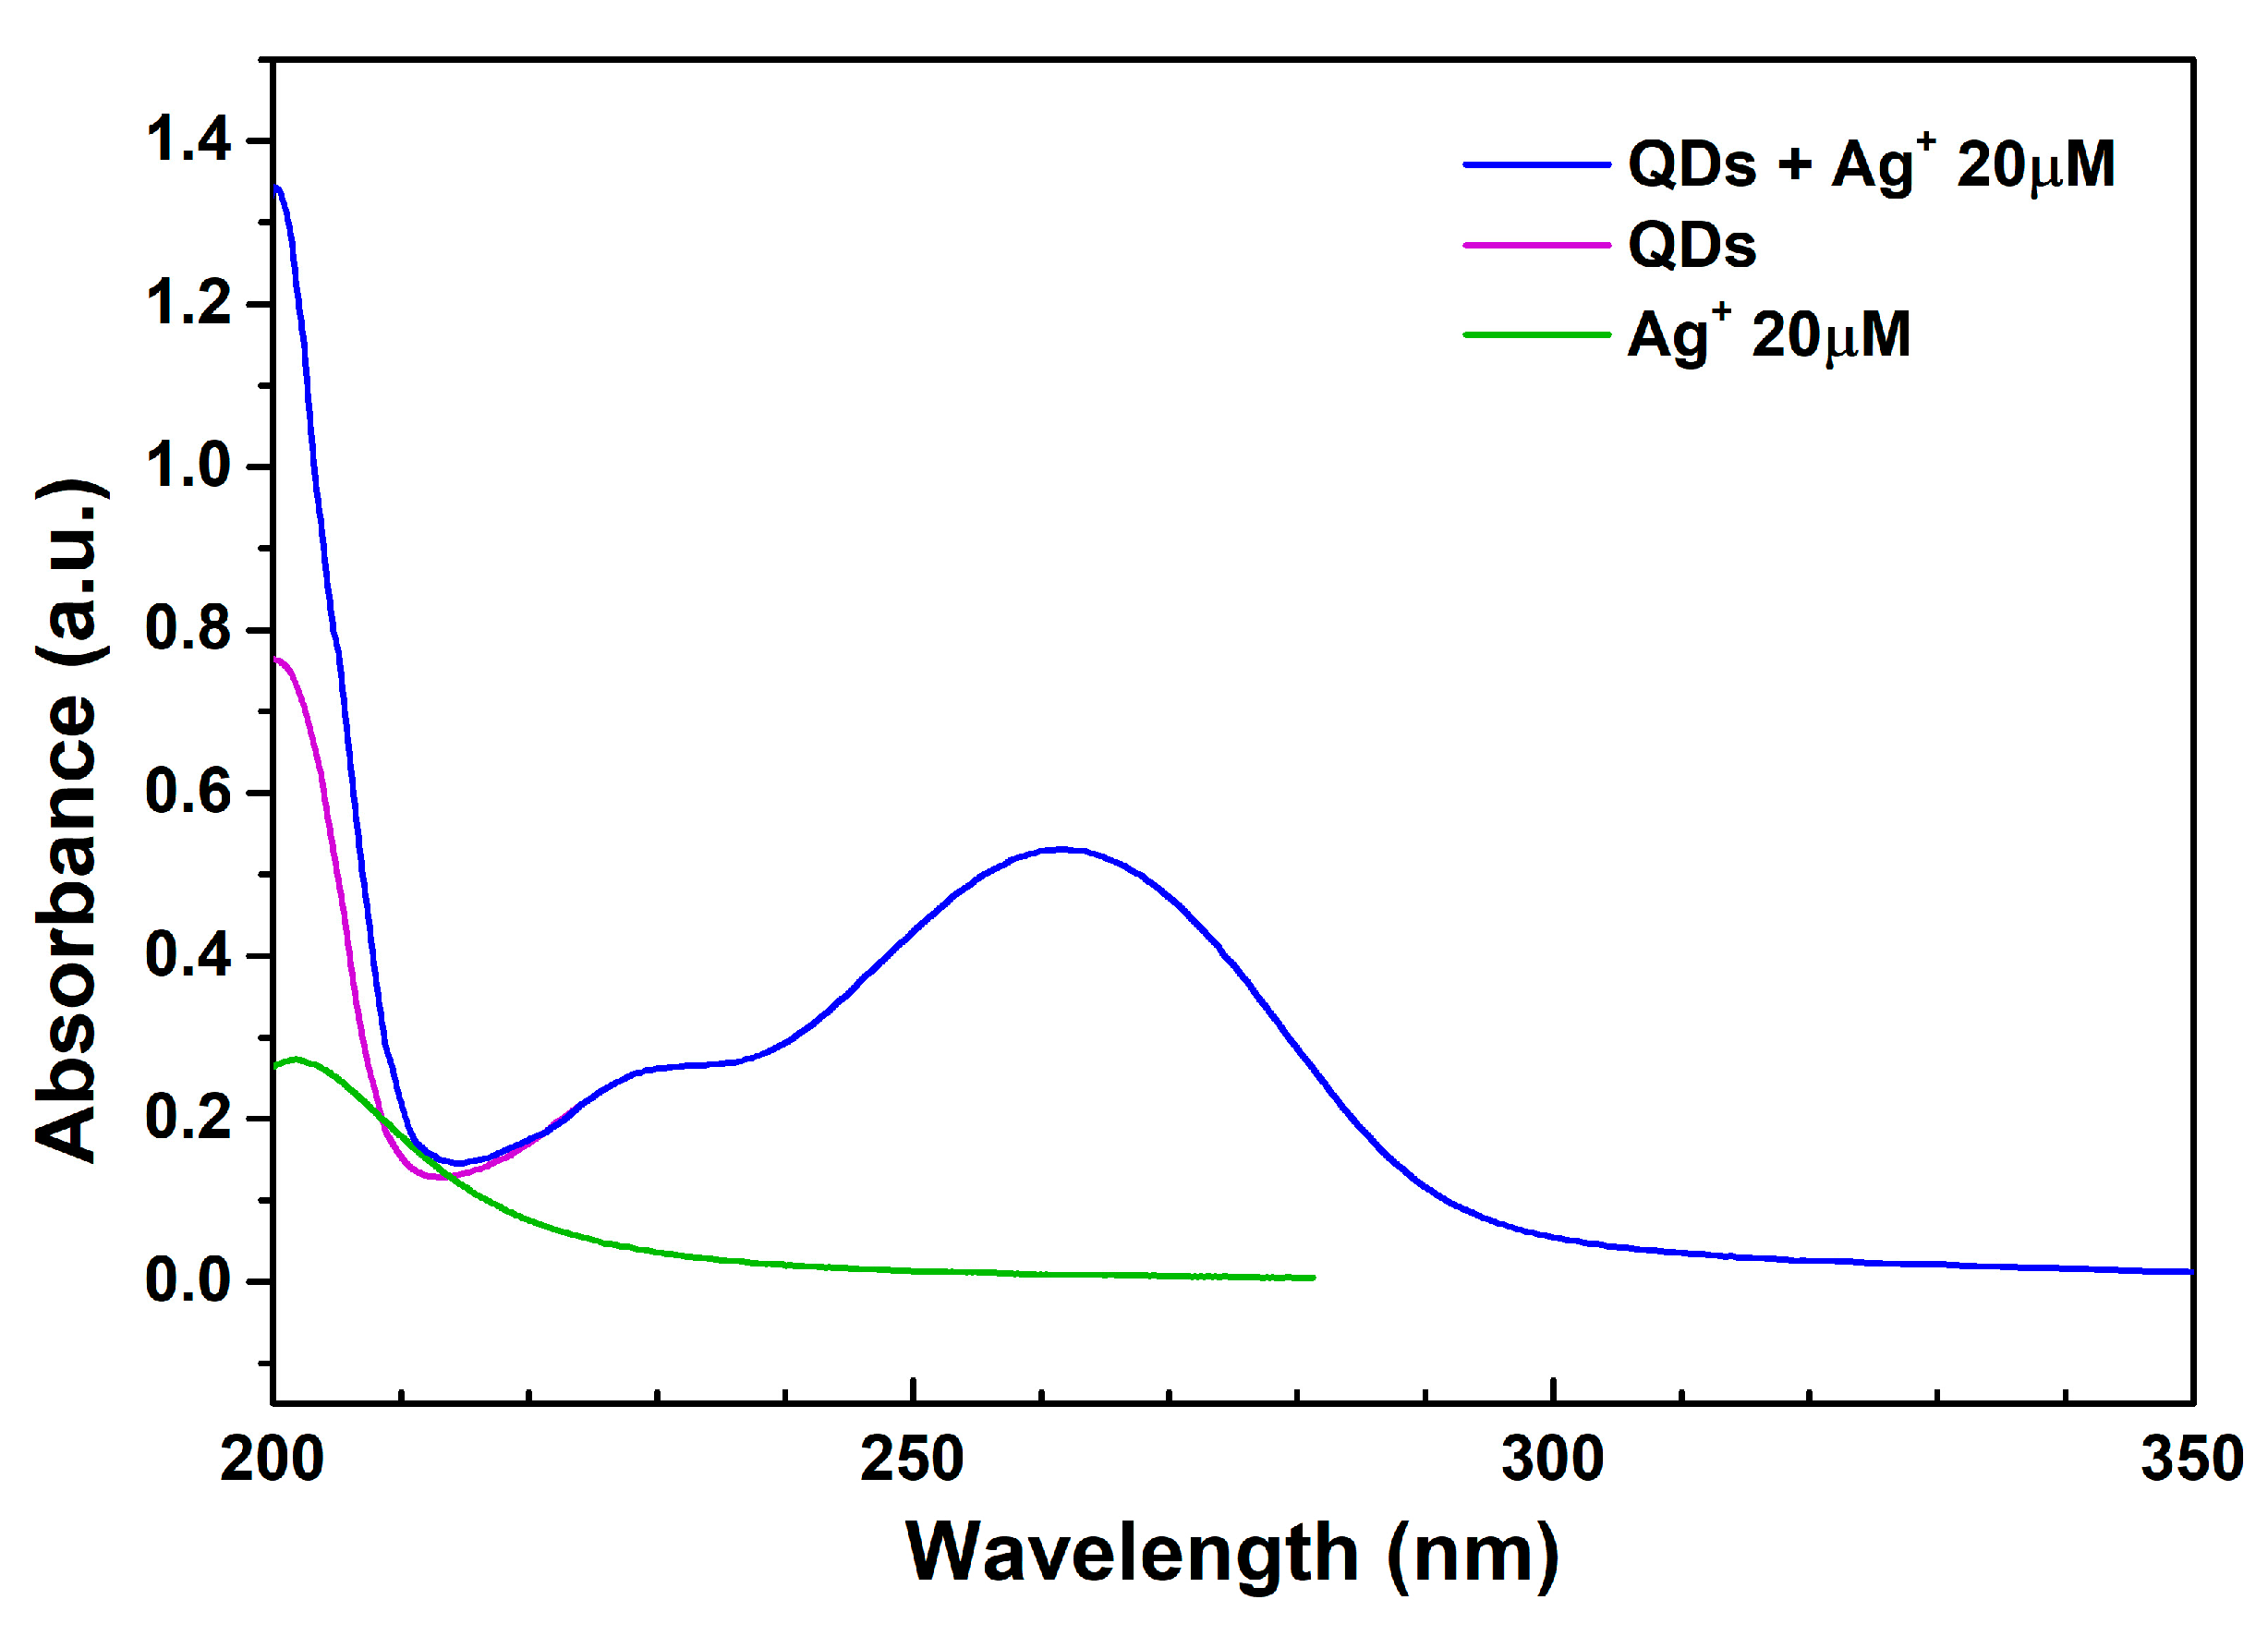
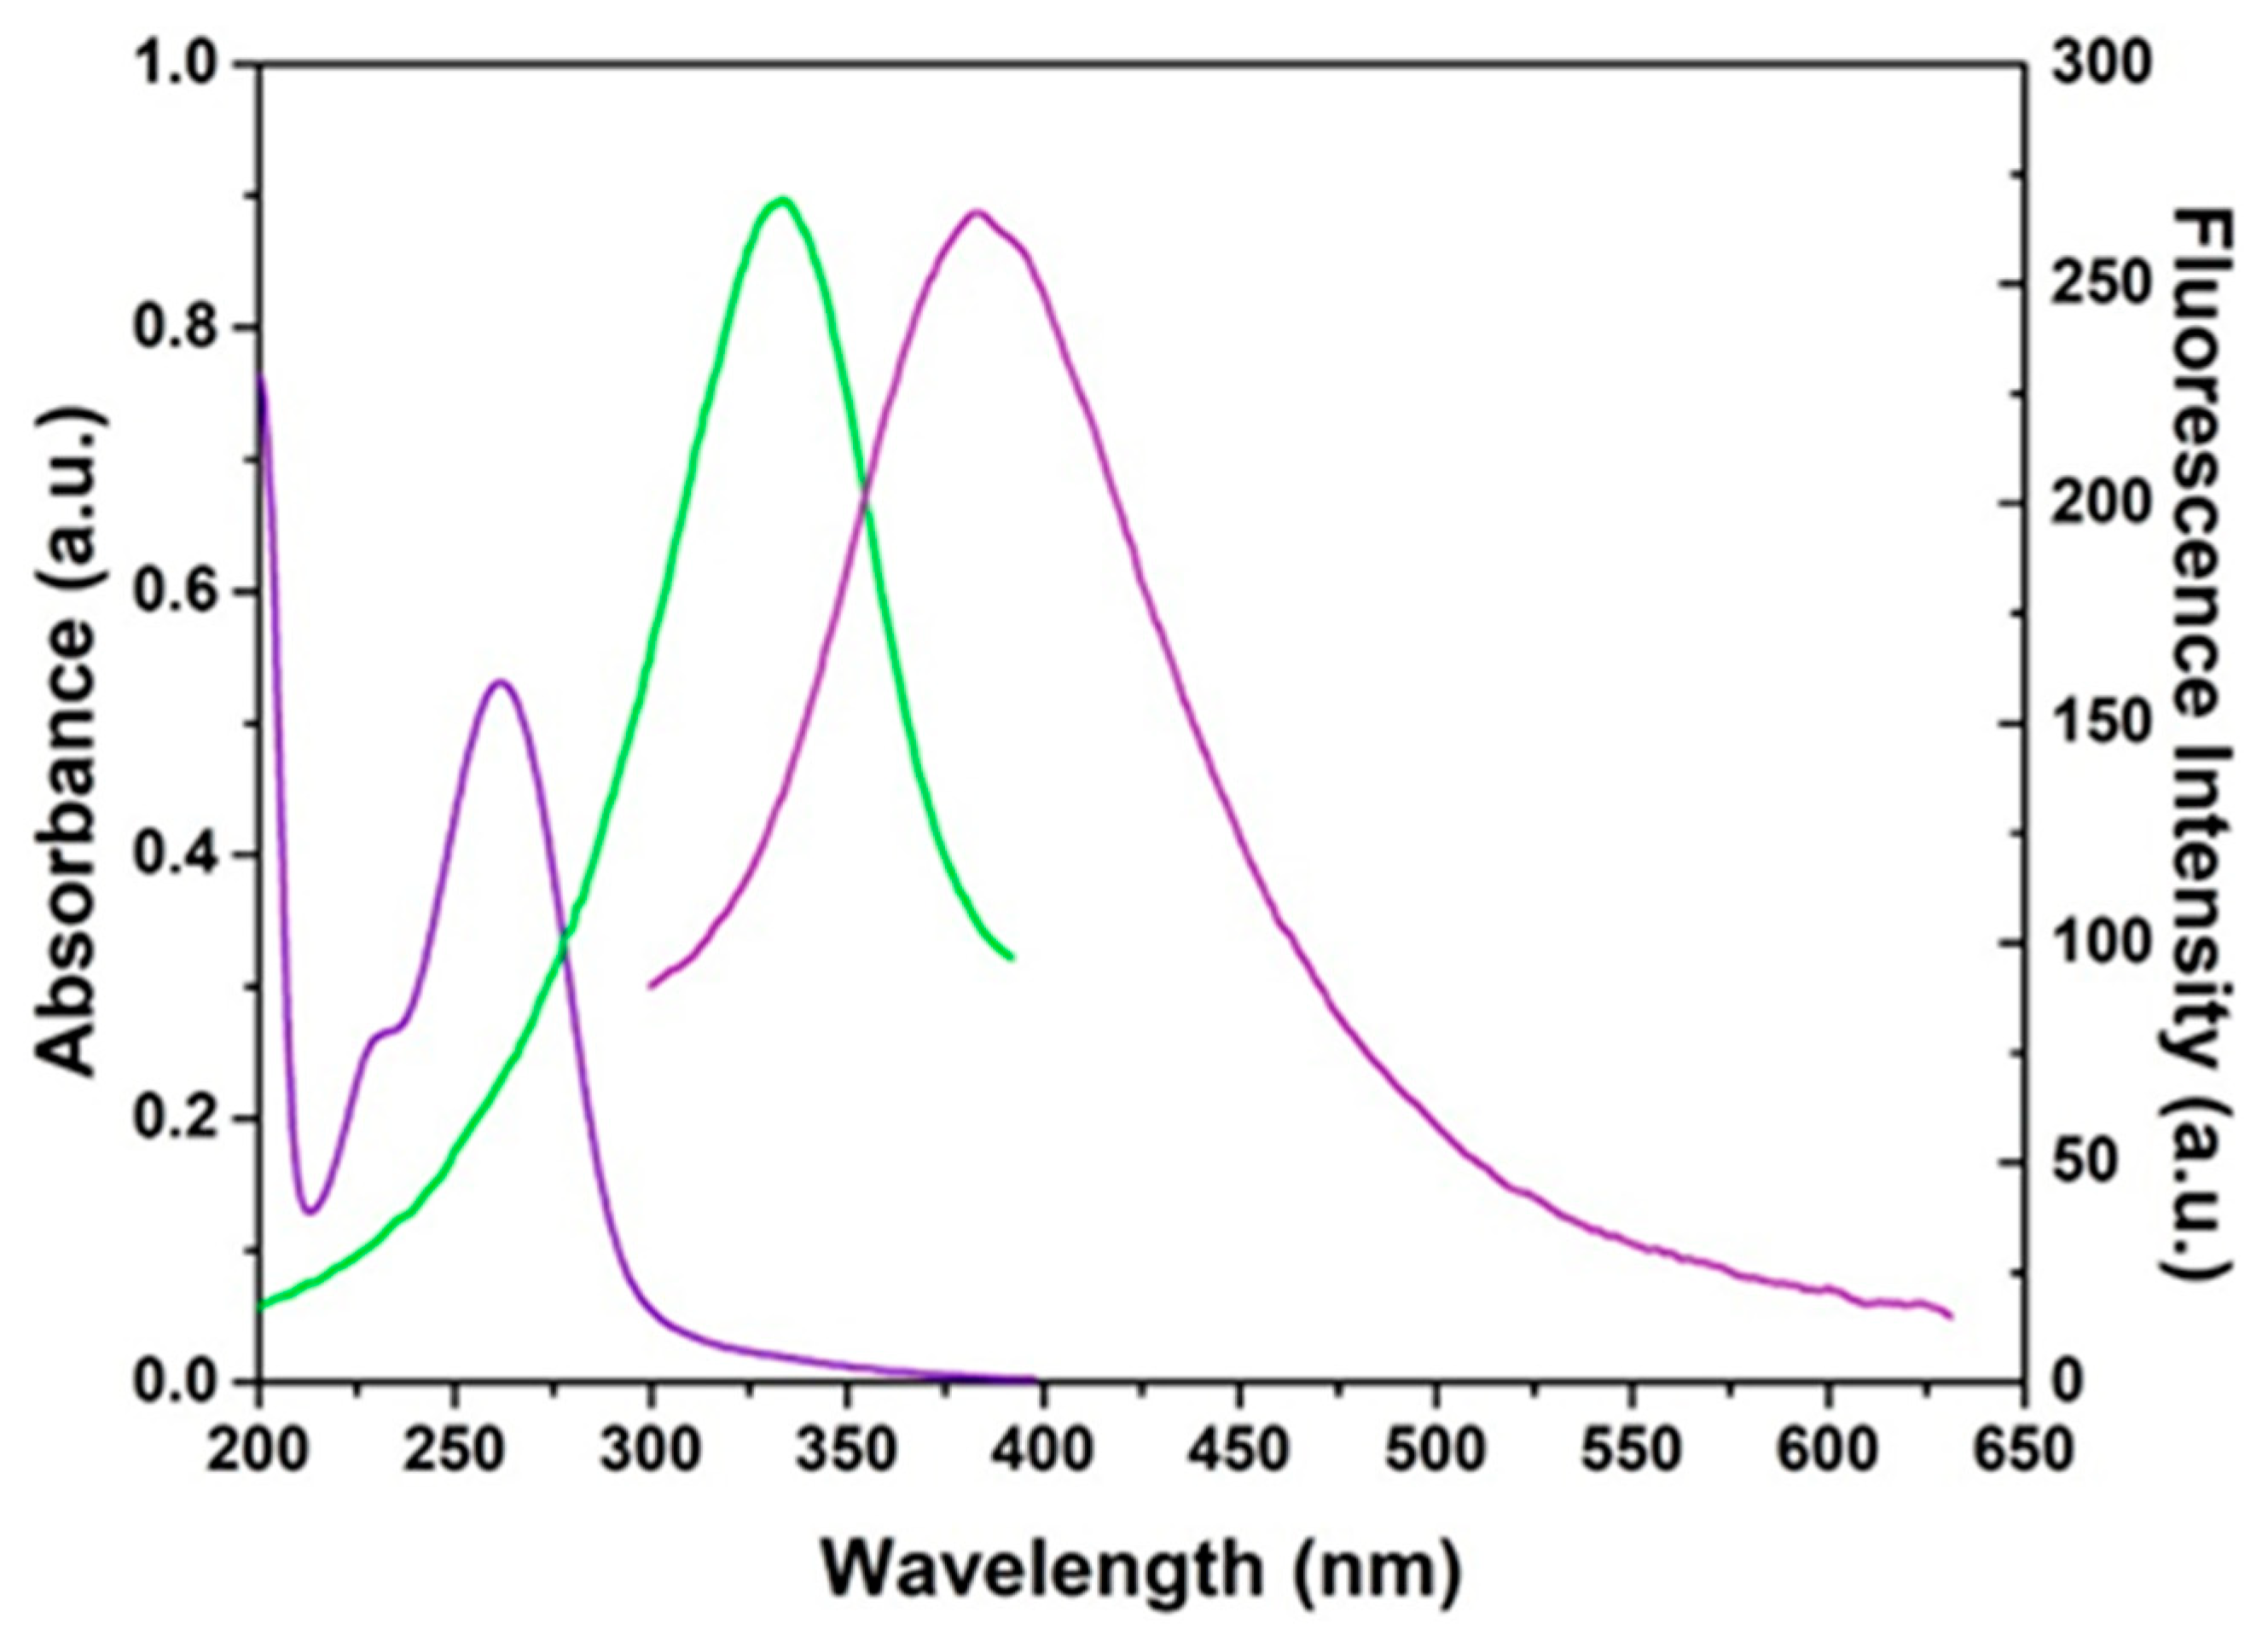
3.2.1. UV–Vis Absorption Spectrum

The UV–Vis absorption spectrum of the N-CQD water solution containing metal ions at 20 μm concentration is reported in Figure 4 in the range 200–350 nm (upper blue line). The pattern is compared to that recorded for the water solution without ions (middle violet line) and to that of a water solution of the metal salt (bottom green line) at the same concentration that the latter has in the ternary system. Above 210 nm, both the patterns measured for QD-containing systems have a bimodal shape resulting from the convolution of two peaks falling around 225 and 260 nm, whereas the silver ion solution gives rise to a featureless background absorption in that region. It can be appreciated that the pattern relative to the ternary system N-CQDs + water + cation results from the simple summation of bare N-CQD solution (stock solution) absorption and the signal coming from the cation solution, with no other absorbance variations. The patterns are reported in Figure 4 for the Ag+ solution but equivalent trends were not found for any other cation, thus making us confident that the presence of the ions did not significantly disrupt the absorption properties of the system.

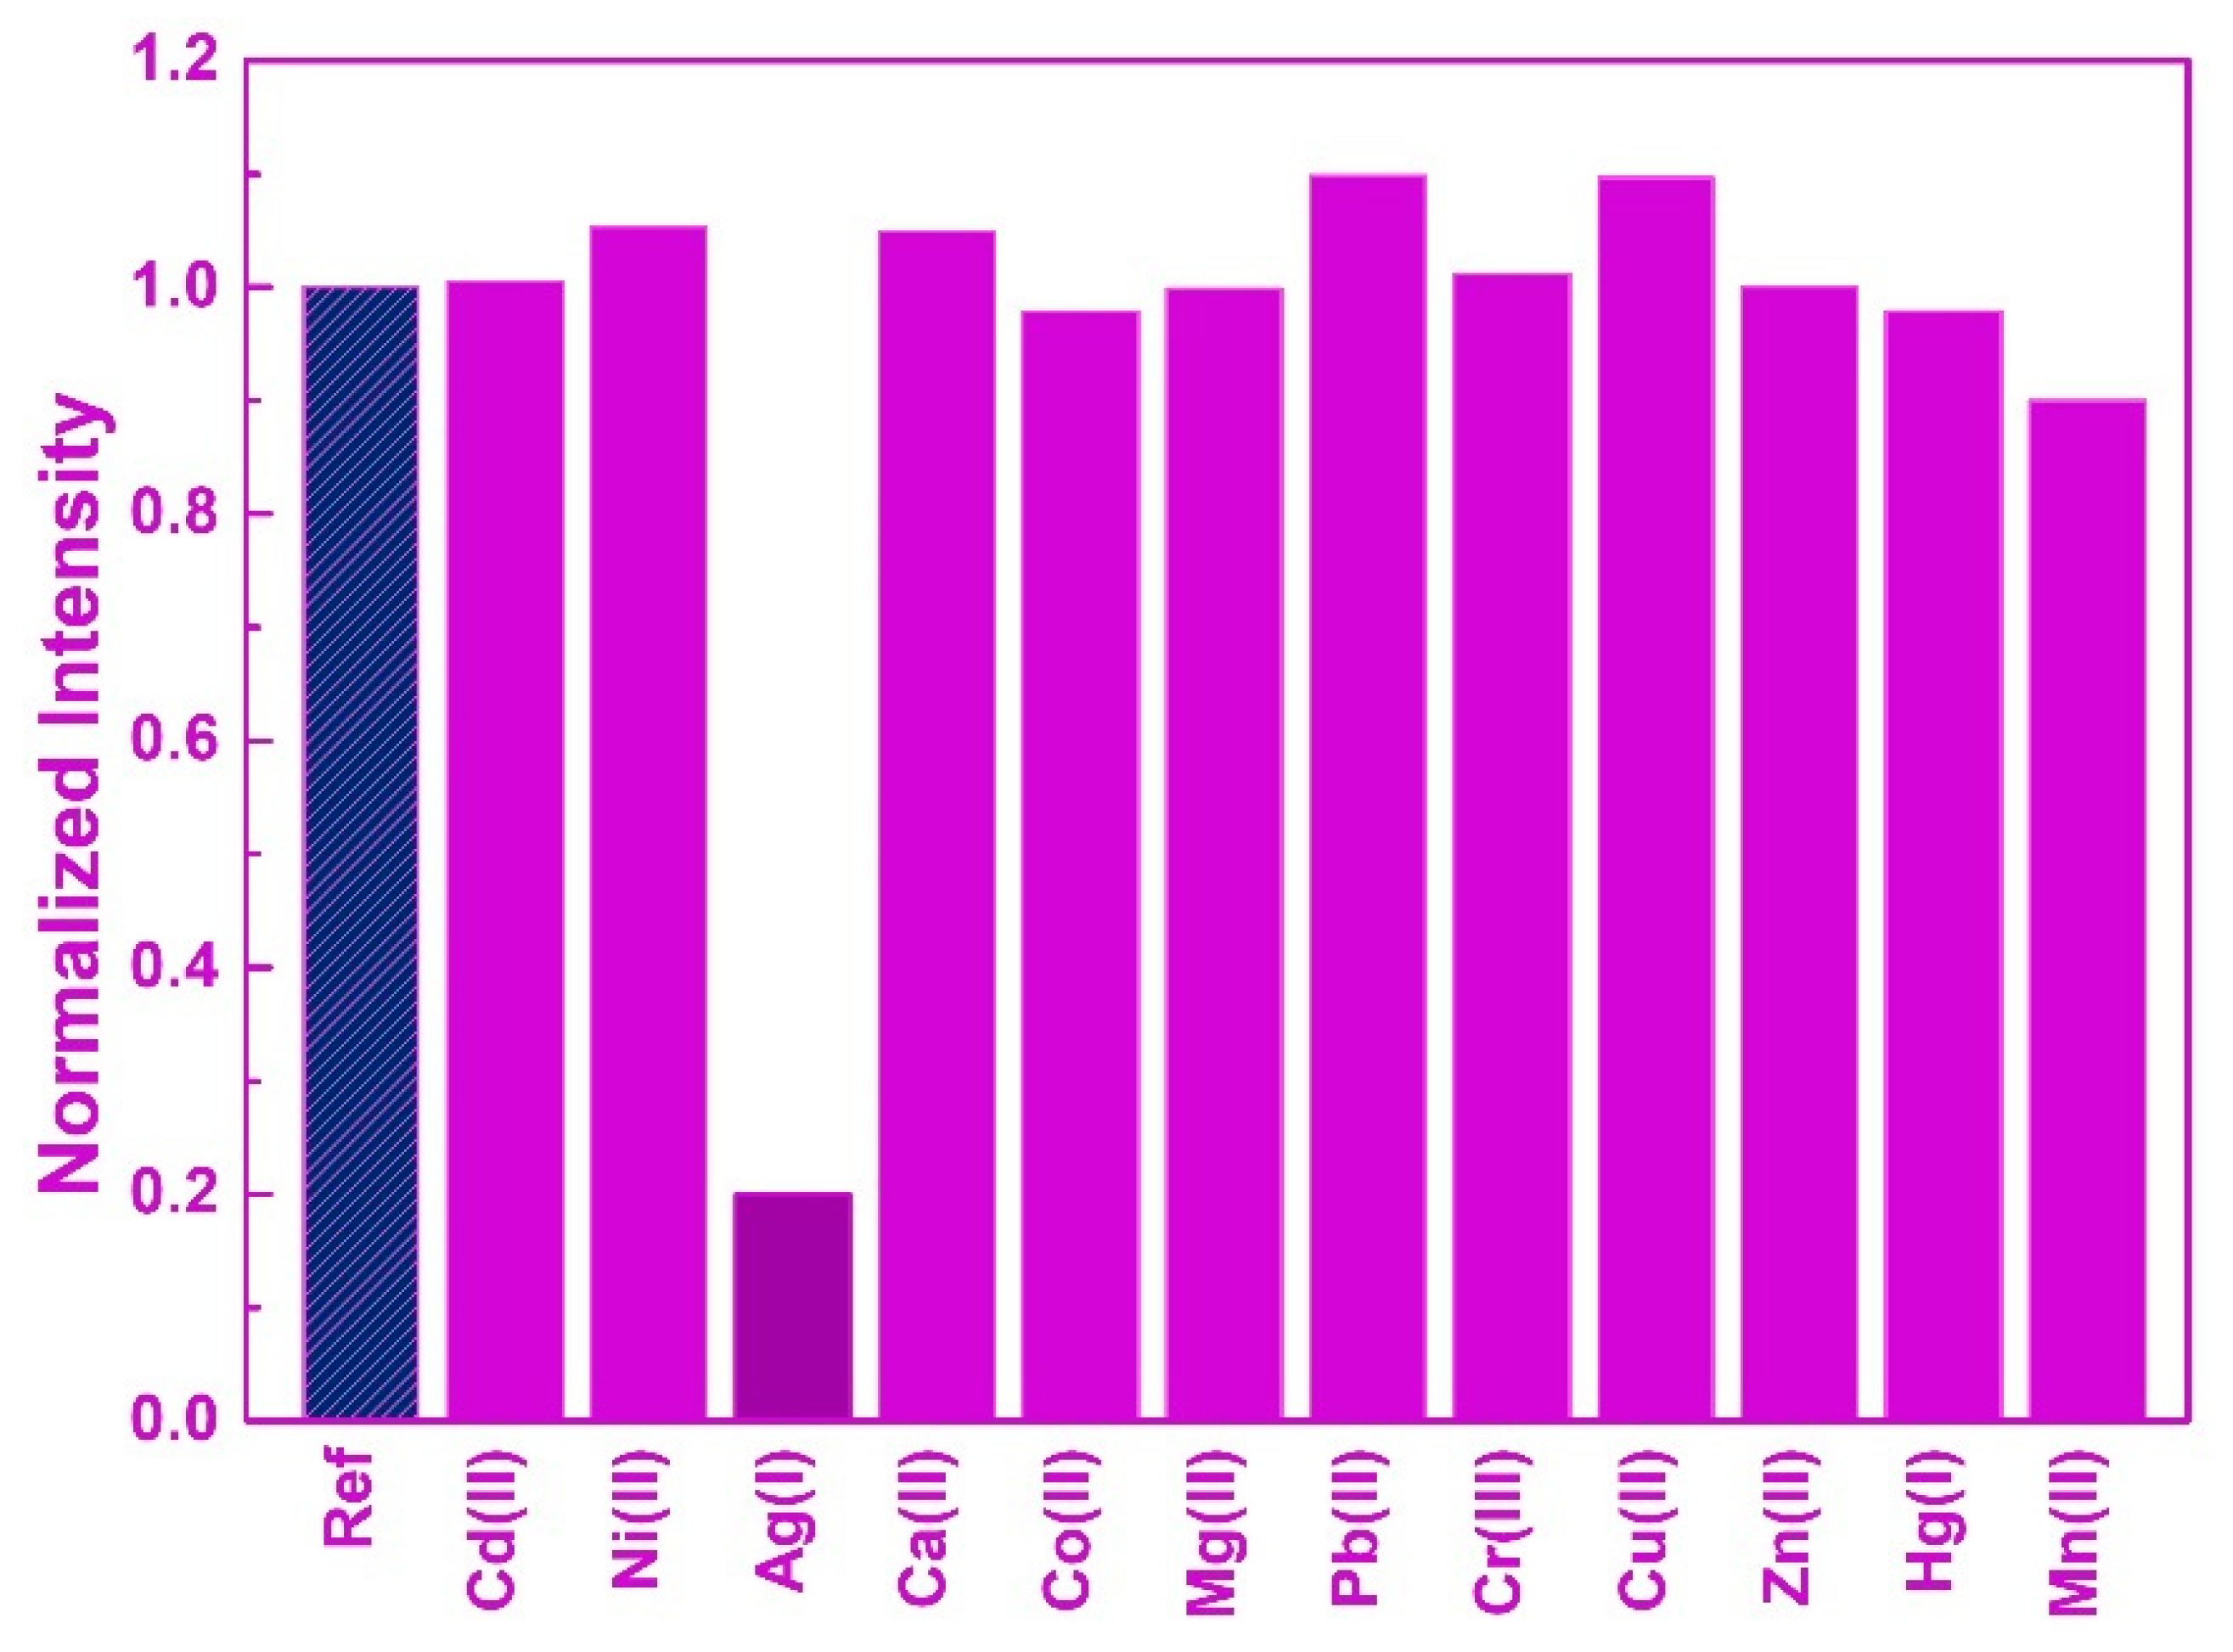
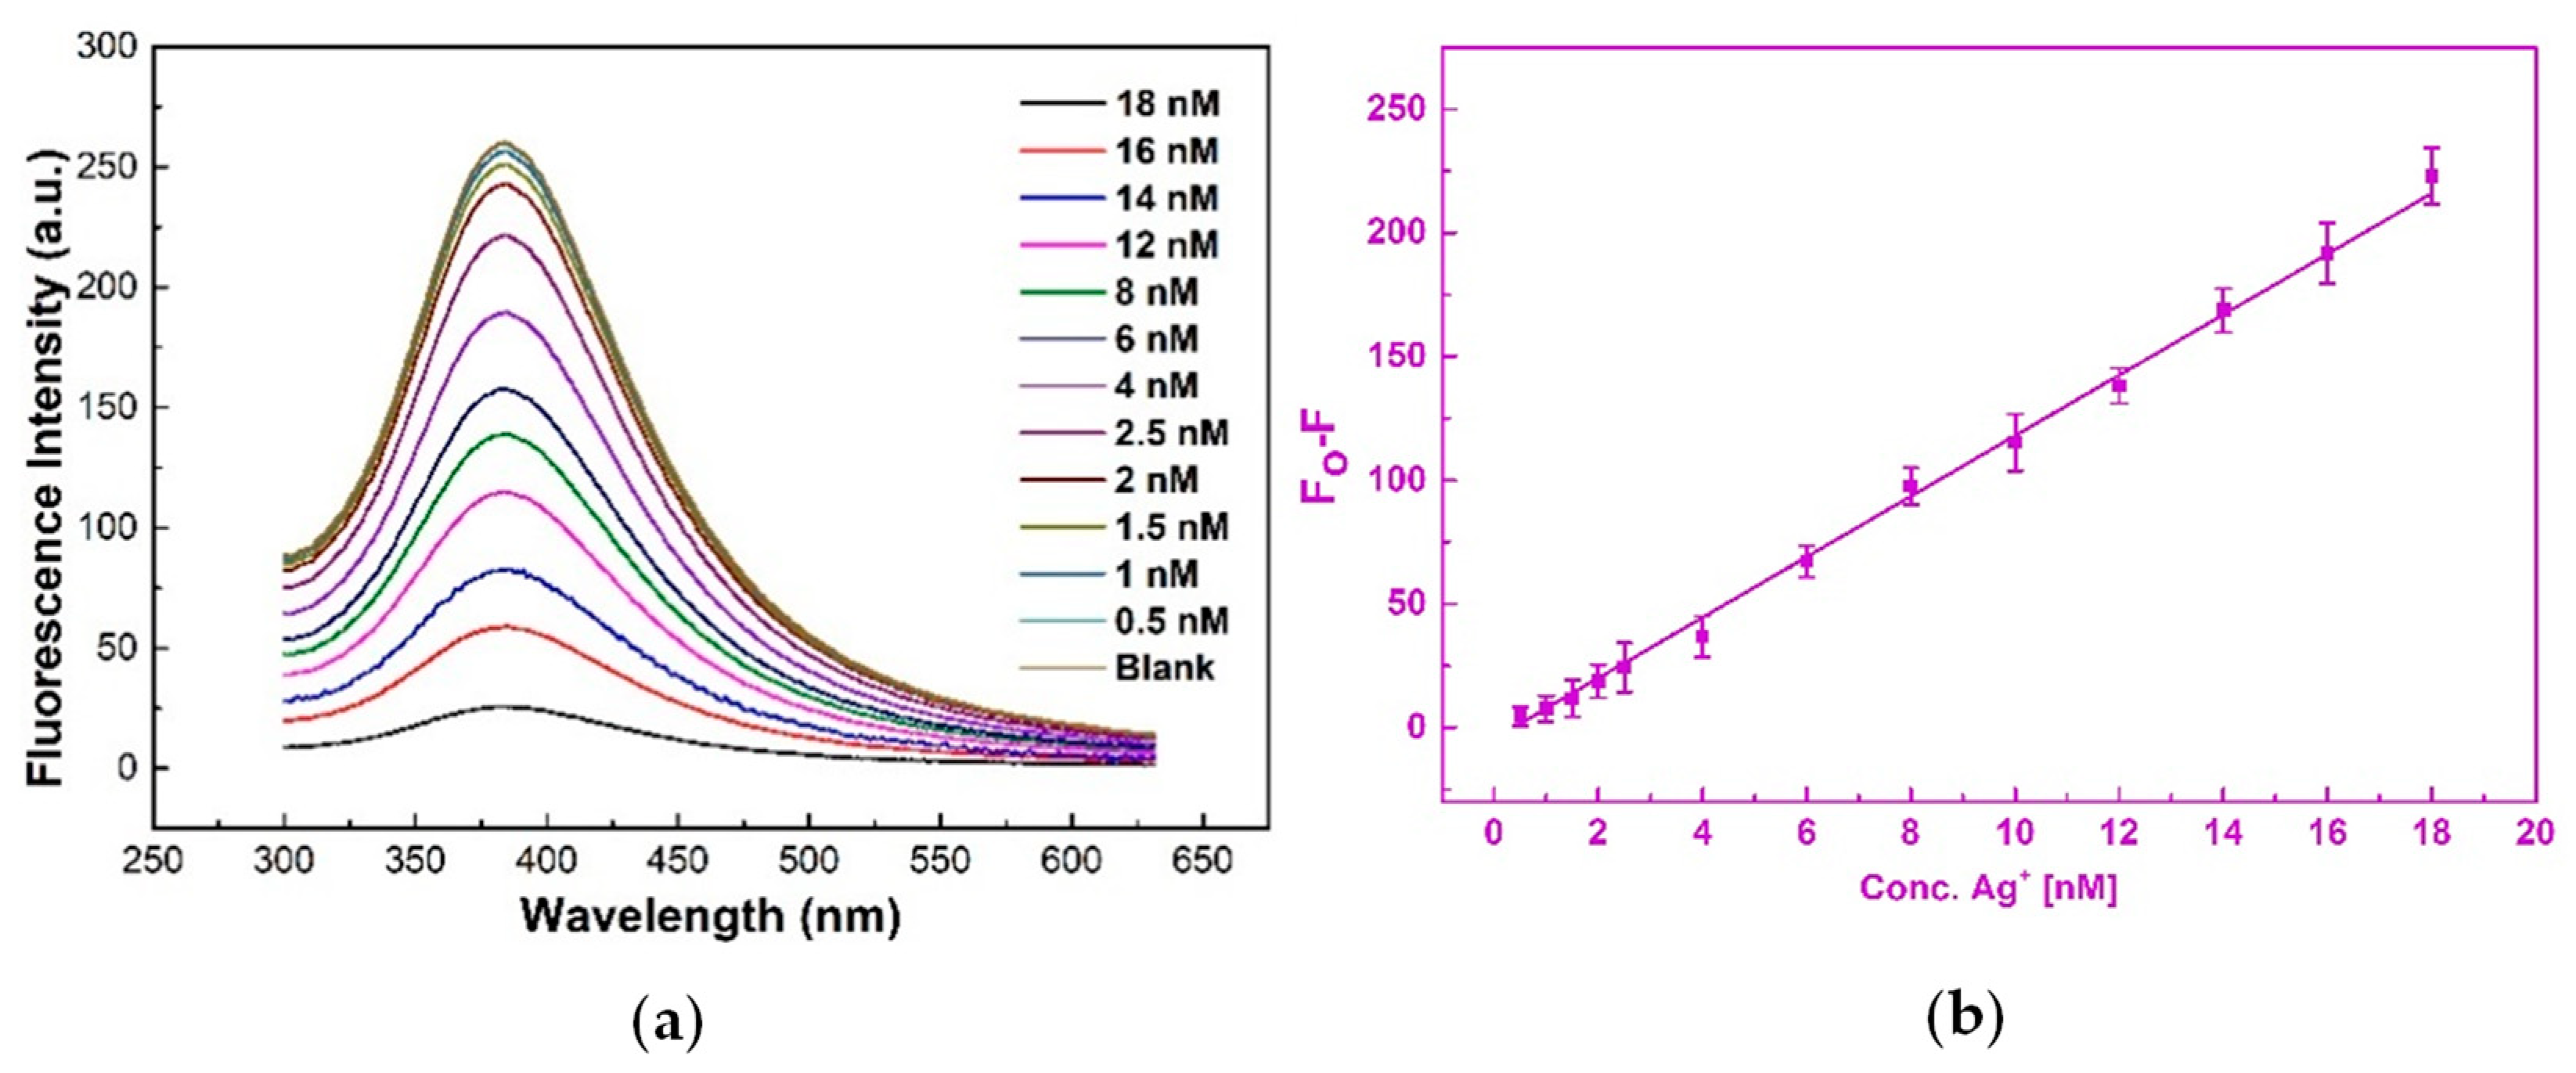
3.2.2. UV-Vis Fluorescence Spectrum

The core of the study consisted of the fluorescence spectrum of the synthesized N−CQD water solutions, with and without the addition of metal salt. The spectra were obtained through the collection of the photoluminescence radiation emitted by the solution after excitation with a monochromatized UV beam (330 nm). The observed Stokes shift was around 55 nm (see Figure 5) and the wavelength observed at the intensity maximum was 385 nm (violet). The measurements in the presence of metal ions were performed after mixing equivalent volumes (1.5 mL) of the stock solution (blank) with the metal salt (metal nitrate) water solution containing the quantity of salt needed to obtain the desired concentration in the total volume. The response to the ions was checked by comparing the fluorescence intensity ratio between metal and reference N-CQD water solutions. The results of the latter analysis for ionic concentrations of 18 nM are reported as histograms in Figure 6. The histograms clearly point out that the synthesized NPs possess high sensitivity for Ag+ cations, since they are the only ones capable of giving a strong fluorescence quenching effect (around 80% of the intensity is suppressed), whereas other cations give very modest quenching or enhancement responses, most of which are within the experimental uncertainty. The lowest limit of Ag+ quenching power was assessed by performing a series of dilutions, starting from the initial metal ion concentration (18 nM) up to 0.5 nM. The results of these fluorescence measurements are reported in Figure 7 and clearly indicate the very high sensitivity of the synthesized nanoparticles towards Ag, whose concentration may be probed up to less than 1 nM. The same phenomenon is pointed out considering the absolute difference values between the stock solution (F0) and metal solution (F), which are reported in the right panel of Figure 7. The observed decrement trend upon dilution in the range 18−0.5 nM is quite linear and confirms the validity and applicability of the proposed spectroscopic detection method of silver cations in the (sub)-nanomolar range.

3.3. Computational Analysis

In order to try to rationalize the peculiar behavior observed for silver cation detection, a series of molecular modeling studies were performed. The tendency of silver and other noble metals to interact with nitrogen ligands of various hardness (ammonia–hard, pyridine, pyrrole-soft) has been widely described in the literature, which showed that the metal tends to form linear complexes (coordination number = 2), supposedly owing to the establishment of an sd hybridization [82]. As stated in the introduction and verified by FTIR measurements reported in Section 3.1.1, the doping procedure—performed in the present study through the concomitant presence of the citric and folic acid in the reaction mixture—leaves several anchoring groups on the CQD surface. As reported in the review on nitrogen-doped graphene by Wang et al. [83], four common bonding configurations can be pointed out within the carbon lattice, including quaternary N (or graphitic N), pyridinic N, and pyrrolic N, plus a pyrimidinic N-oxide fragment (Figure 8). We therefore resolved to model the cation –N-CQD interaction with DFT methods building a two-component model containing one silver cation (Ag+) or cadmium cation (Cd2+) interacting with the nucleophilic nitrogen (N:) of the two heteroaromatic fragments (M1 = pyridine, M2 = quaternary) or with the negative oxygen of a pyridinic N-oxide moiety (model M3). Ag+ and Cd2+ share the same electron configuration (46 electrons, [Kr]4d10), and their ionic radii are 1.29 and 1.09 Å, respectively, shrinking with the charge increase [84]. These two ions were chosen owing to their having the same electron configuration and because their response to fluorescence is different, i.e., Cd2+ fluorescence intensity does not differ from the reference (blank). The geometry of the three model structures was optimized in the solution, taking into account the solvent effect through the PCM formalism (see Section 2), and the results are gathered in Table 3. The calculations show that in two models over three (M1 and M2), the cation–nitrogen distance is shorter for silver, whereas it is only slightly longer for M3. The phenomenon of larger distance for cadmium is even clearer considering the ionic radius of the cation, so that if the radii are subtracted from the calculated distance, effective “contact distance” values of 0.98 and 1.28 Å for silver and cadmium ions, respectively, in M1, 0.96/1.27 in M2 and 0.93/1.10 in M3 are obtained. From this finding, it can be hypothesized that, given the shorter distances, the silver cation is held more tightly by the N-CQD and for this reason, the perturbation it can exert on the electronic structure of ground and excited states is enhanced. The geometry of the M1 model with the two cations is shown in Figure 9, where the two structures (Ag and Cd) are compared, with the two outer phenyl rings superimposed. It can be seen that the silver model (cyan) is more elongated towards the cation (shorter nitrogen-ion distance) whereas in the cadmium model (red) the first ring is less stretched towards the ion (longer N∙∙∙Cd distance).

4. Conclusions

In the present contribution, we characterized the structure and the spectroscopical properties of nitrogen doped carbon quantum dots synthesized by the hydrothermal reaction of citric and folic acid. The nanoparticles obtained, whose EDX elemental analysis confirmed a full N-doping, show a low distance polydispersity, with average dimensions around 2.5 nm, and remarkable properties as fluorescent probes for the detection of silver (I) cations. The violet photoluminescence produced at 385 nm is largely quenched by low nanomolar concentration of the cation in a very selective way, since other cations do not have any effect on the fluorescence. The peculiar behavior of silver is explained in terms of stronger interactions with the anchoring groups of the nanomaterial surface, which was evaluated by comparing the structures of small aggregates of N-CQDS and silver (I) and of the inactive isoelectronic cadmium (II) through molecular modeling.

Author Contributions

Conceptualization, M.C. and E.M.B.; methodology, M.C., E.M.B., A.N. and L.G.; software, L.G.; validation, M.C. and E.M.B.; formal analysis, E.M.B.; investigation, L.G.; resources, M.C. and P.T.; data curation, E.M.B.; writing—original draft preparation, L.G.; writing—review and editing, L.G., E.M.B. and M.C.; visualization, M.C.; supervision, E.M.B.; project administration, M.C.; funding acquisition, M.C. and E.M.B. All authors have read and agreed to the published version of the manuscript.

Funding

This research was funded by Regione Lazio within the call n. G04014-13/04/2021 “Progetti di Gruppi di Ricerca 2020”, grant number A0375-2020-36643-Sviluppo di un Dispositivo Portatile Integrato per la Valutazione Spettroscopica Multimodale non Invasiva della Qualità di Materie Prime Alimentari (B85F21001350002).

Institutional Review Board Statement

Not applicable.

Informed Consent Statement

Not applicable.

Data Availability Statement

Not applicable.

Conflicts of Interest

The authors declare no conflict of interest.

References

  1. Bernardi, M.; Lohrman, J.; Kumar, P.V.; Kirkeminde, A.; Ferralis, N.; Grossman, J.C.; Ren, S. Nanocarbon-Based Photovoltaics. ACS Nano 2012, 6, 8896–8903. [Google Scholar] [CrossRef] [PubMed]
  2. Zhang, T.; Mubeen, S.; Myung, N.V.; Deshusses, M.A. Recent Progress in Carbon Nanotube-Based Gas Sensors. Nanotechnology 2008, 19, 332001. [Google Scholar] [CrossRef] [PubMed]
  3. Avouris, P.; Freitag, M.; Perebeinos, V. Carbon-Nanotube Photonics and Optoelectronics. Nat. Photonics 2008, 2, 341–350. [Google Scholar] [CrossRef]
  4. Georgakilas, V.; Perman, J.A.; Tucek, J.; Zboril, R. Broad Family of Carbon Nanoallotropes: Classification, Chemistry, and Applications of Fullerenes, Carbon Dots, Nanotubes, Graphene, Nanodiamonds, and Combined Superstructures. Chem. Rev. 2015, 115, 4744–4822. [Google Scholar] [CrossRef]
  5. Zhu, S.; Meng, Q.; Wang, L.; Zhang, J.; Song, Y.; Jin, H.; Zhang, K.; Sun, H.; Wang, H.; Yang, B. Highly Photoluminescent Carbon Dots for Multicolor Patterning, Sensors, and Bioimaging. Angew. Chem. Int. Ed. 2013, 52, 3953–3957. [Google Scholar] [CrossRef]
  6. Valentini, F.; Roscioli, D.; Carbone, M.; Conte, V.; Floris, B.; Palleschi, G.; Flammini, R.; Bauer, E.M.; Nasillo, G.; Caponetti, E. Oxidized Graphene in Ionic Liquids for Assembling Chemically Modified Electrodes: A Structural and Electrochemical Characterization Study. Anal. Chem. 2012, 84, 5823–5831. [Google Scholar] [CrossRef]
  7. Valentini, F.; Roscioli, D.; Carbone, M.; Conte, V.; Floris, B.; Bauer, E.M.; Ditaranto, N.; Chillura-Martino, D. Graphene and ionic liquids new gel paste electrodes for caffeic acid quantification. Sens. Actuators B Chem. 2015, 212, 248–255. [Google Scholar] [CrossRef]
  8. Limosani, F.; Bauer, E.M.; Cecchetti, D.; Biagioni, S.; Orlando, V.; Pizzoferrato, R.; Prosposito, P.; Carbone, M. Top-Down N-Doped Carbon Quantum Dots for Multiple Purposes: Heavy Metal Detection and Intracellular Fluorescence. Nanomaterials 2021, 11, 2249. [Google Scholar] [CrossRef]
  9. Carcione, R.; Limosani, F.; Antolini, F. Cadmium Telluride Nanocomposite Films Formation from Thermal Decomposition of Cadmium Carboxylate Precursor and Their Photoluminescence Shift from Green to Red. Crystals 2021, 11, 253. [Google Scholar] [CrossRef]
  10. Carbone, M. NiO-Based Electronic Flexible Devices. Appl. Sci. 2022, 12, 2839. [Google Scholar] [CrossRef]
  11. Carbone, M.; Tagliatesta, P. NiO Grained-Flowers and Nanoparticles for Ethanol Sensing. Materials 2020, 13, 1880. [Google Scholar] [CrossRef] [PubMed]
  12. Carbone, M. CQDs@NiO: An Efficient Tool for CH4 Sensing. Appl. Sci. 2020, 10, 6251. [Google Scholar] [CrossRef]
  13. Carbone, M.; Nesticò, A.; Bellucci, N.; Micheli, L.; Palleschi, G. Enhanced Performances of Sensors Based on Screen Printed Electrodes Modified with Nanosized NiO Particles. Electrochim. Acta 2017, 246, 580–587. [Google Scholar] [CrossRef]
  14. Carbone, M.; Aneggi, E.; Figueredo, F.; Susmel, S. NiO-Nanoflowers Decorating a Plastic Electrode for the Non-Enzymatic Amperometric Detection of H2O2 in Milk: Old Issue, New Challenge. Food Control 2022, 132, 108549. [Google Scholar] [CrossRef]
  15. Carbone, M.; Briancesco, R.; Bonadonna, L. Antimicrobial Power of Cu/Zn Mixed Oxide Nanoparticles to Escherichia coli. Environ. Nanotechnol. Monit. Manag. 2017, 7, 97–102. [Google Scholar] [CrossRef]
  16. Donia, D.T.; Carbone, M. Fate of the Nanoparticles in Environmental Cycles. Int. J. Environ. Sci. Technol. 2019, 16, 583–600. [Google Scholar] [CrossRef]
  17. Donia, D.T.; Bauer, E.M.; Missori, M.; Roselli, L.; Cecchetti, D.; Tagliatesta, P.; Gontrani, L.; Carbone, M. Room Temperature Syntheses of ZnO and Their Structures. Symmetry 2021, 13, 733. [Google Scholar] [CrossRef]
  18. Carbone, M. Cu Zn Co Nanosized Mixed Oxides Prepared from Hydroxycarbonate Precursors. J. Alloys Compd. 2016, 688, 202–209. [Google Scholar] [CrossRef]
  19. Carbone, M.; Bauer, E.M.; Micheli, L.; Missori, M. NiO Morphology Dependent Optical and Electrochemical Properties. Colloids Surf. A Physicochem. Eng. Asp. 2017, 532, 178–182. [Google Scholar] [CrossRef]
  20. Carbone, M. Zn Defective ZnCo2O4 Nanorods as High Capacity Anode for Lithium Ion Batteries. J. Electroanal. Chem. 2018, 815, 151–157. [Google Scholar] [CrossRef]
  21. Carbone, M.; Missori, M.; Micheli, L.; Tagliatesta, P.; Bauer, E.M. NiO Pseudocapacitance and Optical Properties: Does the Shape Win? Materials 2020, 13, 1417. [Google Scholar] [CrossRef] [PubMed]
  22. Yang, S.; Sun, J.; Li, X.; Zhou, W.; Wang, Z.; He, P.; Ding, G.; Xie, X.; Kang, Z.; Jiang, M. Large-Scale Fabrication of Heavy Doped Carbon Quantum Dots with Tunable-Photoluminescence and Sensitive Fluorescence Detection. J. Mater. Chem. A 2014, 2, 8660. [Google Scholar] [CrossRef]
  23. Sk, M.A.; Ananthanarayanan, A.; Huang, L.; Lim, K.H.; Chen, P. Revealing the Tunable Photoluminescence Properties of Graphene Quantum Dots. J. Mater. Chem. C 2014, 2, 6954–6960. [Google Scholar] [CrossRef]
  24. Ding, H.; Li, X.-H.; Chen, X.-B.; Wei, J.-S.; Li, X.-B.; Xiong, H.-M. Surface States of Carbon Dots and Their Influences on Luminescence. J. Appl. Phys. 2020, 127, 231101. [Google Scholar] [CrossRef]
  25. Devi, R.K.; Ganesan, M.; Chen, T.-W.; Chen, S.-M.; Al-onazi, W.A.; Al-Mohaimeed, A.M.; Elshikh, M.S.; Yu, Y.-Y. 3D-Nanocubes of N-Doped Carbon Quantum Dots Adorned Manganese Oxide: A Functional Electrocatalyst for the Sensitive Detection of Sulfadiazine. Colloids Surf. A Physicochem. Eng. Asp. 2022, 648, 129141. [Google Scholar] [CrossRef]
  26. Gao, X.; Lu, Y.; Zhang, R.; He, S.; Ju, J.; Liu, M.; Li, L.; Chen, W. One-Pot Synthesis of Carbon Nanodots for Fluorescence Turn-on Detection of Ag+ Based on the Ag+-Induced Enhancement of Fluorescence. J. Mater. Chem. C 2015, 3, 2302–2309. [Google Scholar] [CrossRef]
  27. Loukanov, A.; Sekiya, R.; Yoshikawa, M.; Kobayashi, N.; Moriyasu, Y.; Nakabayashi, S. Photosensitizer-Conjugated Ultrasmall Carbon Nanodots as Multifunctional Fluorescent Probes for Bioimaging. J. Phys. Chem. C 2016, 120, 15867–15874. [Google Scholar] [CrossRef]
  28. Kim, S.; Choi, Y.; Park, G.; Won, C.; Park, Y.-J.; Lee, Y.; Kim, B.-S.; Min, D.-H. Highly Efficient Gene Silencing and Bioimaging Based on Fluorescent Carbon Dots in Vitro and in Vivo. Nano Res. 2017, 10, 503–519. [Google Scholar] [CrossRef]
  29. Wang, Z.; Fu, B.; Zou, S.; Duan, B.; Chang, C.; Yang, B.; Zhou, X.; Zhang, L. Facile Construction of Carbon Dots via Acid Catalytic Hydrothermal Method and Their Application for Target Imaging of Cancer Cells. Nano Res. 2016, 9, 214–223. [Google Scholar] [CrossRef]
  30. Ganguly, S.; Das, P.; Itzhaki, E.; Hadad, E.; Gedanken, A.; Margel, S. Microwave-Synthesized Polysaccharide-Derived Carbon Dots as Therapeutic Cargoes and Toughening Agents for Elastomeric Gels. ACS Appl. Mater. Interfaces 2020, 12, 51940–51951. [Google Scholar] [CrossRef]
  31. Wu, Y.-F.; Wu, H.-C.; Kuan, C.-H.; Lin, C.-J.; Wang, L.-W.; Chang, C.-W.; Wang, T.-W. Multi-Functionalized Carbon Dots as Theranostic Nanoagent for Gene Delivery in Lung Cancer Therapy. Sci. Rep. 2016, 6, 21170. [Google Scholar] [CrossRef] [PubMed]
  32. Huang, S.; Li, B.; Ashraf, U.; Li, Q.; Lu, X.; Gao, X.; Cui, M.; Imran, M.; Ye, J.; Cao, F.; et al. Quaternized Cationic Carbon Dots as Antigen Delivery Systems for Improving Humoral and Cellular Immune Responses. ACS Appl. Nano Mater. 2020, 3, 9449–9461. [Google Scholar] [CrossRef]
  33. Liu, J.; Liu, Y.; Liu, N.; Han, Y.; Zhang, X.; Huang, H.; Lifshitz, Y.; Lee, S.-T.; Zhong, J.; Kang, Z. Metal-Free Efficient Photocatalyst for Stable Visible Water Splitting via a Two-Electron Pathway. Science 2015, 347, 970–974. [Google Scholar] [CrossRef] [PubMed]
  34. Martinez, A.; Pérez, Rubi. Heavy Metal Pollution in Drinking Water-a Global Risk for Human Health: A Review. Afr. J. Environ. Sci. Technol. 2013, 7, 567–584. [Google Scholar]
  35. Tchounwou, P.B.; Yedjou, C.G.; Patlolla, A.K.; Sutton, D.J. Heavy Metal Toxicity and the Environment. In Molecular, Clinical and Environmental Toxicology; Springer: Berlin/Heidelberg, Germany, 2012; pp. 133–164. [Google Scholar]
  36. Ressalan, S.; Chauhan, R.S.; Goswami, A.K.; Purohit, D.N. Review of Spectrophotometric Methods for Determination of Chromium. Rev. Anal. Chem. 1997, 16, 69–171. [Google Scholar] [CrossRef]
  37. Ackerman, A.H.; Creed, P.A.; Parks, A.N.; Fricke, M.W.; Schwegel, C.A.; Creed, J.T.; Heitkemper, D.T.; Vela, N.P. Comparison of a Chemical and Enzymatic Extraction of Arsenic from Rice and an Assessment of the Arsenic Absorption from Contaminated Water by Cooked Rice. Environ. Sci. Technol. 2005, 39, 5241–5246. [Google Scholar] [CrossRef]
  38. Babazadeh, S.; Bisauriya, R.; Carbone, M.; Roselli, L.; Cecchetti, D.; Bauer, E.M.; Sennato, S.; Prosposito, P.; Pizzoferrato, R. Colorimetric Detection of Chromium(VI) Ions in Water Using Unfolded-Fullerene Carbon Nanoparticles. Sensors 2021, 21, 6353. [Google Scholar] [CrossRef]
  39. Gontrani, L.; Pulci, O.; Carbone, M.; Pizzoferrato, R.; Prosposito, P. Detection of Heavy Metals in Water Using Graphene Oxide Quantum Dots: An Experimental and Theoretical Study. Molecules 2021, 26, 5519. [Google Scholar] [CrossRef]
  40. Hu, C.; Lin, T.-J.; Huang, Y.-C.; Chen, Y.-Y.; Wang, K.-H.; Andrew Lin, K.-Y. Photoluminescence Quenching of Thermally Treated Waste-Derived Carbon Dots for Selective Metal Ion Sensing. Environ. Res. 2021, 197, 111008. [Google Scholar] [CrossRef]
  41. Shtepliuk, I.; Caffrey, N.M.; Iakimov, T.; Khranovskyy, V.; Abrikosov, I.A.; Yakimova, R. On the Interaction of Toxic Heavy Metals (Cd, Hg, Pb) with Graphene Quantum Dots and Infinite Graphene. Sci. Rep. 2017, 7, 3934. [Google Scholar] [CrossRef]
  42. Shtepliuk, I.; Khranovskyy, V.; Yakimova, R. Insights into the Origin of the Excited Transitions in Graphene Quantum Dots Interacting with Heavy Metals in Different Media. Phys. Chem. Chem. Phys. 2017, 19, 30445–30463. [Google Scholar] [CrossRef] [PubMed] [Green Version]
  43. Chung, I.-S.; Lee, M.-Y.; Shin, D.-H.; Jung, H.-R. Three Systemic Argyria Cases after Ingestion of Colloidal Silver Solution. Int. J. Dermatol. 2010, 49, 1175–1177. [Google Scholar] [CrossRef] [PubMed]
  44. Hadrup, N.; Lam, H.R. Oral Toxicity of Silver Ions, Silver Nanoparticles and Colloidal Silver—A Review. Regul. Toxicol. Pharmacol. 2014, 68, 1–7. [Google Scholar] [CrossRef] [PubMed]
  45. Hadrup, N.; Sharma, A.K.; Loeschner, K. Toxicity of Silver Ions, Metallic Silver, and Silver Nanoparticle Materials after in Vivo Dermal and Mucosal Surface Exposure: A Review. Regul. Toxicol. Pharmacol. 2018, 98, 257–267. [Google Scholar] [CrossRef]
  46. Drake, P.; Hazelwood, K.J. Exposure-Related Health Effects of Silver and Silver Compounds: A Review. Ann. Occup. Hyg. 2005, 49, 575–585. [Google Scholar] [CrossRef] [PubMed]
  47. Rodriguez-Garraus, A.; Azqueta, A.; Vettorazzi, A.; López de Cerain, A. Genotoxicity of Silver Nanoparticles. Nanomaterials 2020, 10, 251. [Google Scholar] [CrossRef]
  48. Choo, W.; Moon, B.; Song, S.; Oh, S.M. Morphological Transformation Induced by Silver Nanoparticles in a Balb/c 3T3 A31-1-1 Mouse Cell Model to Evaluate in Vitro Carcinogenic Potential. Environ. Health Toxicol. 2017, 32, e2017016. [Google Scholar] [CrossRef]
  49. Sun, J.; Yang, S.; Wang, Z.; Shen, H.; Xu, T.; Sun, L.; Li, H.; Chen, W.; Jiang, X.; Ding, G.; et al. Ultra-High Quantum Yield of Graphene Quantum Dots: Aromatic-Nitrogen Doping and Photoluminescence Mechanism. Part. Part. Syst. Charact. 2015, 32, 434–440. [Google Scholar] [CrossRef]
  50. Guerrero, E.D.; Lopez-Velazquez, A.M.; Ahlawat, J.; Narayan, M. Carbon Quantum Dots for Treatment of Amyloid Disorders. ACS Appl. Nano Mater. 2021, 4, 2423–2433. [Google Scholar] [CrossRef]
  51. Dong, Y.; Shao, J.; Chen, C.; Li, H.; Wang, R.; Chi, Y.; Lin, X.; Chen, G. Blue Luminescent Graphene Quantum Dots and Graphene Oxide Prepared by Tuning the Carbonization Degree of Citric Acid. Carbon 2012, 50, 4738–4743. [Google Scholar] [CrossRef]
  52. Chandra, S.; Das, P.; Bag, S.; Laha, D.; Pramanik, P. Synthesis, Functionalization and Bioimaging Applications of Highly Fluorescent Carbon Nanoparticles. Nanoscale 2011, 3, 1533. [Google Scholar] [CrossRef] [PubMed]
  53. Yang, Y.; Cui, J.; Zheng, M.; Hu, C.; Tan, S.; Xiao, Y.; Yang, Q.; Liu, Y. One-Step Synthesis of Amino-Functionalized Fluorescent Carbon Nanoparticles by Hydrothermal Carbonization of Chitosan. Chem. Commun. 2012, 48, 380–382. [Google Scholar] [CrossRef]
  54. Cailotto, S.; Amadio, E.; Facchin, M.; Selva, M.; Pontoglio, E.; Rizzolio, F.; Riello, P.; Toffoli, G.; Benedetti, A.; Perosa, A. Carbon Dots from Sugars and Ascorbic Acid: Role of the Precursors on Morphology, Properties, Toxicity, and Drug Uptake. ACS Med. Chem. Lett. 2018, 9, 832–837. [Google Scholar] [CrossRef] [PubMed]
  55. Shi, W.; Fan, H.; Ai, S.; Zhu, L. Preparation of Fluorescent Graphene Quantum Dots from Humic Acid for Bioimaging Application. New J. Chem. 2015, 39, 7054–7059. [Google Scholar] [CrossRef]
  56. Mehta, V.N.; Jha, S.K.; Basu, H.; Singhal, R.K.; Kailasa, S.K. One-Step Hydrothermal Approach to Fabricate Carbon Dots from Apple Juice for Imaging of Mycobacterium and Fungal Cells. Sens. Actuators B Chem. 2015, 213, 434–443. [Google Scholar] [CrossRef]
  57. Wei, J.; Zhang, X.; Sheng, Y.; Shen, J.; Huang, P.; Guo, S.; Pan, J.; Liu, B.; Feng, B. Simple One-Step Synthesis of Water-Soluble Fluorescent Carbon Dots from Waste Paper. New J. Chem. 2014, 38, 906. [Google Scholar] [CrossRef]
  58. Wu, X.; Tian, F.; Wang, W.; Chen, J.; Wu, M.; Zhao, J.X. Fabrication of Highly Fluorescent Graphene Quantum Dots Using L-Glutamic Acid for in Vitro/in Vivo Imaging and Sensing. J. Mater. Chem. C 2013, 1, 4676. [Google Scholar] [CrossRef]
  59. Qian, Z.; Ma, J.; Shan, X.; Feng, H.; Shao, L.; Chen, J. Highly Luminescent N-Doped Carbon Quantum Dots as an Effective Multifunctional Fluorescence Sensing Platform. Chem. A Eur. J. 2014, 20, 2254–2263. [Google Scholar] [CrossRef]
  60. Zhang, R.; Chen, W. Nitrogen-Doped Carbon Quantum Dots: Facile Synthesis and Application as a “Turn-off” Fluorescent Probe for Detection of Hg2+ Ions. Biosens. Bioelectron. 2014, 55, 83–90. [Google Scholar] [CrossRef]
  61. Guo, X.; Xu, L.; Zhang, L.; Wang, H.; Wang, X.; Liu, X.; Yao, J.; Hao, A. One-Pot Solid Phase Pyrolysis Synthesis of Highly Fluorescent Nitrogen-Doped Carbon Dots and the Interaction with Human Serum Albumin. J. Lumin. 2018, 196, 100–110. [Google Scholar] [CrossRef]
  62. Das, P.; Ganguly, S.; Bose, M.; Ray, D.; Ghosh, S.; Mondal, S.; Aswal, V.K.; Das, A.K.; Banerjee, S.; Das, N.C. Surface Quaternized Nanosensor as a One-Arrow-Two-Hawks Approach for Fluorescence Turn “on–off–on” Bifunctional Sensing and Antibacterial Activity. New J. Chem. 2019, 43, 6205–6219. [Google Scholar] [CrossRef]
  63. Bhatt, S.; Bhatt, M.; Kumar, A.; Vyas, G.; Gajaria, T.; Paul, P. Green Route for Synthesis of Multifunctional Fluorescent Carbon Dots from Tulsi Leaves and Its Application as Cr(VI) Sensors, Bio-Imaging and Patterning Agents. Colloids Surf. B Biointerfaces 2018, 167, 126–133. [Google Scholar] [CrossRef]
  64. Qi, H.; Teng, M.; Liu, M.; Liu, S.; Li, J.; Yu, H.; Teng, C.; Huang, Z.; Liu, H.; Shao, Q.; et al. Biomass-Derived Nitrogen-Doped Carbon Quantum Dots: Highly Selective Fluorescent Probe for Detecting Fe3+ Ions and Tetracyclines. J. Colloid Interface Sci. 2019, 539, 332–341. [Google Scholar] [CrossRef]
  65. Bacon, M.; Bradley, S.J.; Nann, T. Graphene Quantum Dots. Part. Part. Syst. Charact. 2014, 31, 415–428. [Google Scholar] [CrossRef]
  66. Ponomarenko, L.A.; Schedin, F.; Katsnelson, M.I.; Yang, R.; Hill, E.W.; Novoselov, K.S.; Geim, A.K. Chaotic Dirac Billiard in Graphene Quantum Dots. Science 2008, 320, 356–358. [Google Scholar] [CrossRef] [PubMed]
  67. Sun, Y.; Wang, S.; Li, C.; Luo, P.; Tao, L.; Wei, Y.; Shi, G. Large Scale Preparation of Graphene Quantum Dots from Graphite with Tunable Fluorescence Properties. Phys. Chem. Chem. Phys. 2013, 15, 9907. [Google Scholar] [CrossRef]
  68. Chai, J.-D.; Head-Gordon, M. Long-Range Corrected Hybrid Density Functionals with Damped Atom–Atom Dispersion Corrections. Phys. Chem. Chem. Phys. 2008, 10, 6615. [Google Scholar] [CrossRef]
  69. Rassolov, V.A.; Pople, J.A.; Ratner, M.A.; Windus, T.L. 6-31G * Basis Set for Atoms K through Zn. J. Chem. Phys. 1998, 109, 1223–1229. [Google Scholar] [CrossRef]
  70. Wadt, W.R.; Hay, P.J. Ab Initio Effective Core Potentials for Molecular Calculations. Potentials for Main Group Elements Na to Bi. J. Chem. Phys. 1985, 82, 284–298. [Google Scholar] [CrossRef]
  71. Frisch, M.J.; Trucks, G.W.; Schlegel, H.B.; Scuseria, G.E.; Robb, M.A.; Cheeseman, J.R.; Scalmani, G.; Barone, V.; Petersson, G.A.; Nakatsuji, H.; et al. Gaussian 16 Revision A.03. 2016. [Google Scholar]
  72. Dennington, R.; Keith Todd, A.; Millam John, M. GaussView, Version 6, Dennington, Roy, Semichem Inc.: Shawnee Mission, KS, USA, 2016.
  73. Schaftenaar, G.; Noordik, J.H. Molden: A pre- and post-processing program for molecular and electronic structures. J. Comput.-Aided Mol. Design 2000, 14, 123–134. [Google Scholar] [CrossRef]
  74. Mennucci, B.; Cancès, E.; Tomasi, J. Evaluation of Solvent Effects in Isotropic and Anisotropic Dielectrics and in Ionic Solutions with a Unified Integral Equation Method: Theoretical Bases, Computational Implementation, and Numerical Applications. J. Phys. Chem. B 1997, 101, 10506–10517. [Google Scholar] [CrossRef]
  75. Wojdyr, M. Fityk: A General-Purpose Peak Fitting Program. J. Appl. Crystallogr. 2010, 43, 1126–1128. [Google Scholar] [CrossRef]
  76. Abramova, A.M.; Kokorina, A.A.; Sindeeva, O.A.; Jolibois, F.; Puech, P.; Sukhorukov, G.B.; Goryacheva, I.Y.; Sapelkin, A.V. Molecular Nature of Breakdown of the Folic Acid under Hydrothermal Treatment: A Combined Experimental and DFT Study. Sci. Rep. 2020, 10, 19668. [Google Scholar] [CrossRef] [PubMed]
  77. Song, Y.; Zhu, S.; Zhang, S.; Fu, Y.; Wang, L.; Zhao, X.; Yang, B. Investigation from Chemical Structure to Photoluminescent Mechanism: A Type of Carbon Dots from the Pyrolysis of Citric Acid and an Amine. J. Mater. Chem. C 2015, 3, 5976–5984. [Google Scholar] [CrossRef]
  78. Schneider, J.; Reckmeier, C.J.; Xiong, Y.; von Seckendorff, M.; Susha, A.S.; Kasák, P.; Rogach, A.L. Molecular Fluorescence in Citric Acid-Based Carbon Dots. J. Phys. Chem. C 2017, 121, 2014–2022. [Google Scholar] [CrossRef]
  79. Magri, V.R.; Rocha, M.A.; de Matos, C.S.; Petersen, P.A.D.; Leroux, F.; Petrilli, H.M.; Constantino, V.R.L. Folic Acid and Sodium Folate Salts: Thermal Behavior and Spectroscopic (IR, Raman, and Solid-State 13C NMR) Characterization. Spectrochim. Acta Part A Mol. Biomol. Spectrosc. 2022, 273, 120981. [Google Scholar] [CrossRef]
  80. Acik, M.; Lee, G.; Mattevi, C.; Chhowalla, M.; Cho, K.; Chabal, Y.J. Unusual Infrared-Absorption Mechanism in Thermally Reduced Graphene Oxide. Nat. Mater. 2010, 9, 840–845. [Google Scholar] [CrossRef]
  81. Zygouri, P.; Spyrou, K.; Mitsari, E.; Barrio, M.; Macovez, R.; Patila, M.; Stamatis, H.; Verginadis, I.I.; Velalopoulou, A.P.; Evangelou, A.M.; et al. A Facile Approach to Hydrophilic Oxidized Fullerenes and Their Derivatives as Cytotoxic Agents and Supports for Nanobiocatalytic Systems. Sci. Rep. 2020, 10, 8244. [Google Scholar] [CrossRef]
  82. Fox, B.S.; Beyer, M.K.; Bondybey, V.E. Coordination Chemistry of Silver Cations. J. Am. Chem. Soc. 2002, 124, 13613–13623. [Google Scholar] [CrossRef]
  83. Wang, H.; Maiyalagan, T.; Wang, X. Review on Recent Progress in Nitrogen-Doped Graphene: Synthesis, Characterization, and Its Potential Applications. ACS Catal. 2012, 2, 781–794. [Google Scholar] [CrossRef]
  84. Shannon, R.D. Revised Effective Ionic Radii and Systematic Studies of Interatomic Distances in Halides and Chalcogenides. Acta Crystallogr. Sect. A 1976, 32, 751–767. [Google Scholar] [CrossRef]
Figure 1. Bare N-CQDs experimental infrared spectrum (green bold line) and its deconvolution (thin lines, various colors). A total of 16 Lorentzian functions was used to fit the total pattern.
Chemosensors 10 00362 g001
Figure 2. Typical SEM image of N-CQDs nanoparticles.
Chemosensors 10 00362 g002
Figure 3. Size distribution of N-CQDs nanoparticles.
Chemosensors 10 00362 g003
Figure 4. UV–Vis absorption spectra of bare N-CQDs solution (middle, violet), N-CQDs solution containing [Ag+] = 20 m (top, blue) and of a [Ag+] = 20 m water solution.
Chemosensors 10 00362 g004
Figure 5. UV–Vis absorption spectra of N-CQDs stock solution (left, violet), excitation spectrum (green), and fluorescence (right, violet).
Chemosensors 10 00362 g005
Figure 6. Normalized fluorescence intensity ratio of the various metal N-CQDs water solutions (metal concentration = 18 nM).
Chemosensors 10 00362 g006
Figure 7. (a) Ag+ + N-CQDs solution fluorescence intensity at different metal concentrations. (b) Plot of fluorescence intensity difference between the reference solution (blank) and the N-CQDs Ag+ solutions at different concentrations.
Chemosensors 10 00362 g007
Figure 8. Common bonding configurations in nitrogen-doped carbon quantum dot surface. Reproduced upon permission from reference dx.doi.org/10.1021/cs200652y.
Chemosensors 10 00362 g008
Figure 9. “Pyridinic” interaction model M1. Ag+: cyan; Cd2+: red.
Chemosensors 10 00362 g009
Table 1. Putative deconvolution of experimental FTIR pattern of bare N-CQDs.
FrequencyIntensityAreaFWHMNormal Mode
3533.470.0739.60984.145Free OH stretching
3423.020.10021.143134.101Bound OH stretching
3224.660.383124.117206.203NH stretching (amino/amide)
3048.20.23477.832211.942Aromatic CH stretching
2834.750.13938.371175.985Aliphatic CH stretching
2348.040.0322.69653.814CO2 antisymmetric stretching (from background)
1756.640.0325.716112.579Carboxylic acid C=O stretching
1637.170.12517.89691.006OH/NH bending, aromatic C=C stretching
1421.420.37147.54081.657CH2 bending
1329.040.625118.310120.599Aromatic C-N stretching
1112.120.15141.524174.888Aromatic CH bending
1045.900.0866.16545.614C-O-C stretching (epoxy)
914.0830.0425.84288.009OH/NH out of plane bending
826.8680.1432.93513.057-C-O-C- bending (epoxy)
638.7030.294196.209425.533NH wagging
435.6840.24791.045234.917CH bending
Table 2. EDX analyses of quantum dots. Atomic percentages of C, N and are averaged over three different areas for each of the two sample holders employed.
CarbonNitrogenOxygenTotal
Atomic %55.915.129.0100
Table 3. Ion-nitrogen distance in the DFT interaction models.
ModelIonDistance (Å)Contact (Å)
M1Ag2.270.98
Cd2.371.28
M2Ag2.250.96
Cd2.361.27
M3Ag2.220.93
Cd2.191.10
Publisher’s Note: MDPI stays neutral with regard to jurisdictional claims in published maps and institutional affiliations.

