1. Introduction
Chiral recognition is one of the most challenging issues dealing with chemists for both theoretical and practical reasons [
1,
2,
3,
4]. The potential activity of drugs or agrochemicals is strictly related to the chiral character of the molecules, which specifically interact with the asymmetric biological systems like human bodies and plants. Synthetic methodologies often lead to both enantiomeric or diastereomeric forms of the desired compounds that are only occasionally purified because of the cost-prohibitive separation processes. Accordingly, these molecules are often administrated as racemates, meaning that the effective form is employed simultaneously with its mirrored counterpart; however, the latter is often invalid or–even worse–unexpectedly toxic. For chiral pesticides, the planned effect of an active enantiomer on a target organism could be accompanied by the harmfulness of its specular form. Even in the fortuitous event that this form is innocuous, its spreading is still an undue act at a high price for the environment [
5]. On one hand, this serious issue requires a detailed understanding of the toxic effects of chiral pesticides for the environmental risk assessment as a long-term action, and the monitoring of chiral species released and accumulated in different scenarios for readily giving alarms in emergencies on the other. Chemical sensor technology offers effective and viable opportunities to achieve this latter objective, providing a series of advantages such as notable sensitivity, rapid response, portability, and combining cost-efficiency with simplicity in fabrication and handling. Moreover, the possibility of being arranged in wireless mode makes sensor devices easily exploitable for in-field analysis. Over the years, many chiral sensors based on different transduction mechanisms have been developed for detecting chiral analytes [
6]. The most widespread approach in chiral sensing is based on the design of a properly tailored chiral selector to be used as selective recognition unit toward the target analyte. This selector offers a chiral environment that binds the molecular species and differentiates their enantiomeric forms. Enantioselectivity usually results in: (i) the establishment of multiple, noncovalent interactions between the selector and the enantiomers; (ii) the formation of transient diastereomeric complexes with different equilibrium constants allowing their analytical differentiation, i.e., producing different output signals for the two species. In this strategy, the realization of chiral architectures represents a crucial and demanding step for sensor development.
Even if single sensors have been successfully applied to recognize the enantiomers of a target analyte, such as limonene vapors [
7,
8], selectivity is difficult to achieve mainly when a single sensor is applied to analyze real matrices, where a considerable number of species often structurally similar are present. In this context, using sensor arrays may represent a powerful tool to discriminate different classes of target compounds, even with similar structures, by combining multiple sensing elements of broad selectivity [
9].
Taking inspiration from natural sensory systems in mammals and based on the same principles of recognition and classification, electronic noses or tongues have been developed to analyze gaseous and liquid matrices, respectively [
10,
11,
12,
13,
14,
15]. Although little explored in chiral sensing applications, this approach has begun to be applied, constituting a feasible way for detecting chiral analytes to minimize the synthetic efforts, and having great potential for on-site monitoring in different scenarios.
However, to date, a comprehensive review on the use of sensor arrays for chiral sensing is not reported, mostly due to the limited number of publications on this topic. Nevertheless, the present paper aims to highlight examples using sensor arrays for the detection of chiral targets and, in some cases, the determination of the enantiomeric excess, with a particular emphasis on the fundamentals and potentialities offered by the combined use of chiral and achiral sensing elements for chiral discrimination. Further, we thought to describe how the odors (often containing chiral molecules) are perceived and classified as smells in animals. Indeed, understanding the natural mechanisms of discrimination might help in the design of chiral sensory systems.
Finally, some future challenges for the exploration of sensor arrays for chiral analysis in real fields are discussed.
2. The Sensor Array Principle of Chemicals Identification
The sense of olfaction relies on a typical architecture maintained in all
philia [
16]. The detection of airborne (or waterborne for aquatic animals) molecules occurs in an organ called the olfactory epithelium, populated by a large number of specialized neuronal cells called olfactory receptor neurons (ORNs). ORNs are the elementary units that generate the primary odor-related signals. The chemical sensitivity of ORNs stems from a class of proteins called olfactory receptors (ORs)–transmembrane proteins where the interaction with a ligand in the outside protein portion elicits a reaction mechanism–mediated by a G protein, which leads to the opening of ion channels and the consequent electric signal. Ancillary elements of olfaction are the odorant-binding proteins (OBPs). These small proteins are released in the olfactory mucus, where they are supposed to shuttle hydrophobic molecules that could not autonomously travel through the mucus to reach the ORNs.
A striking property of this system is that despite the significant number of detectable odors, the number of different ORs is surprisingly limited. In humans, little less than 400 ORs are enough to detect up to a trillion different odors [
17]. The signals from ORNs are collected by a successive structure called the olfactory bulb (OB). The OB, located at the border of the brain, converts the sparse signals of ORNs into signal patterns that successive brain structures can identify. The signal pathways in the OB are not clearly elucidated, but it is clear that signals from different ORNs mutually activate and inhibit. Thus, the emerging pattern, contributed by all ORNs, provides a sort of combinatorial encoding of odors [
18].
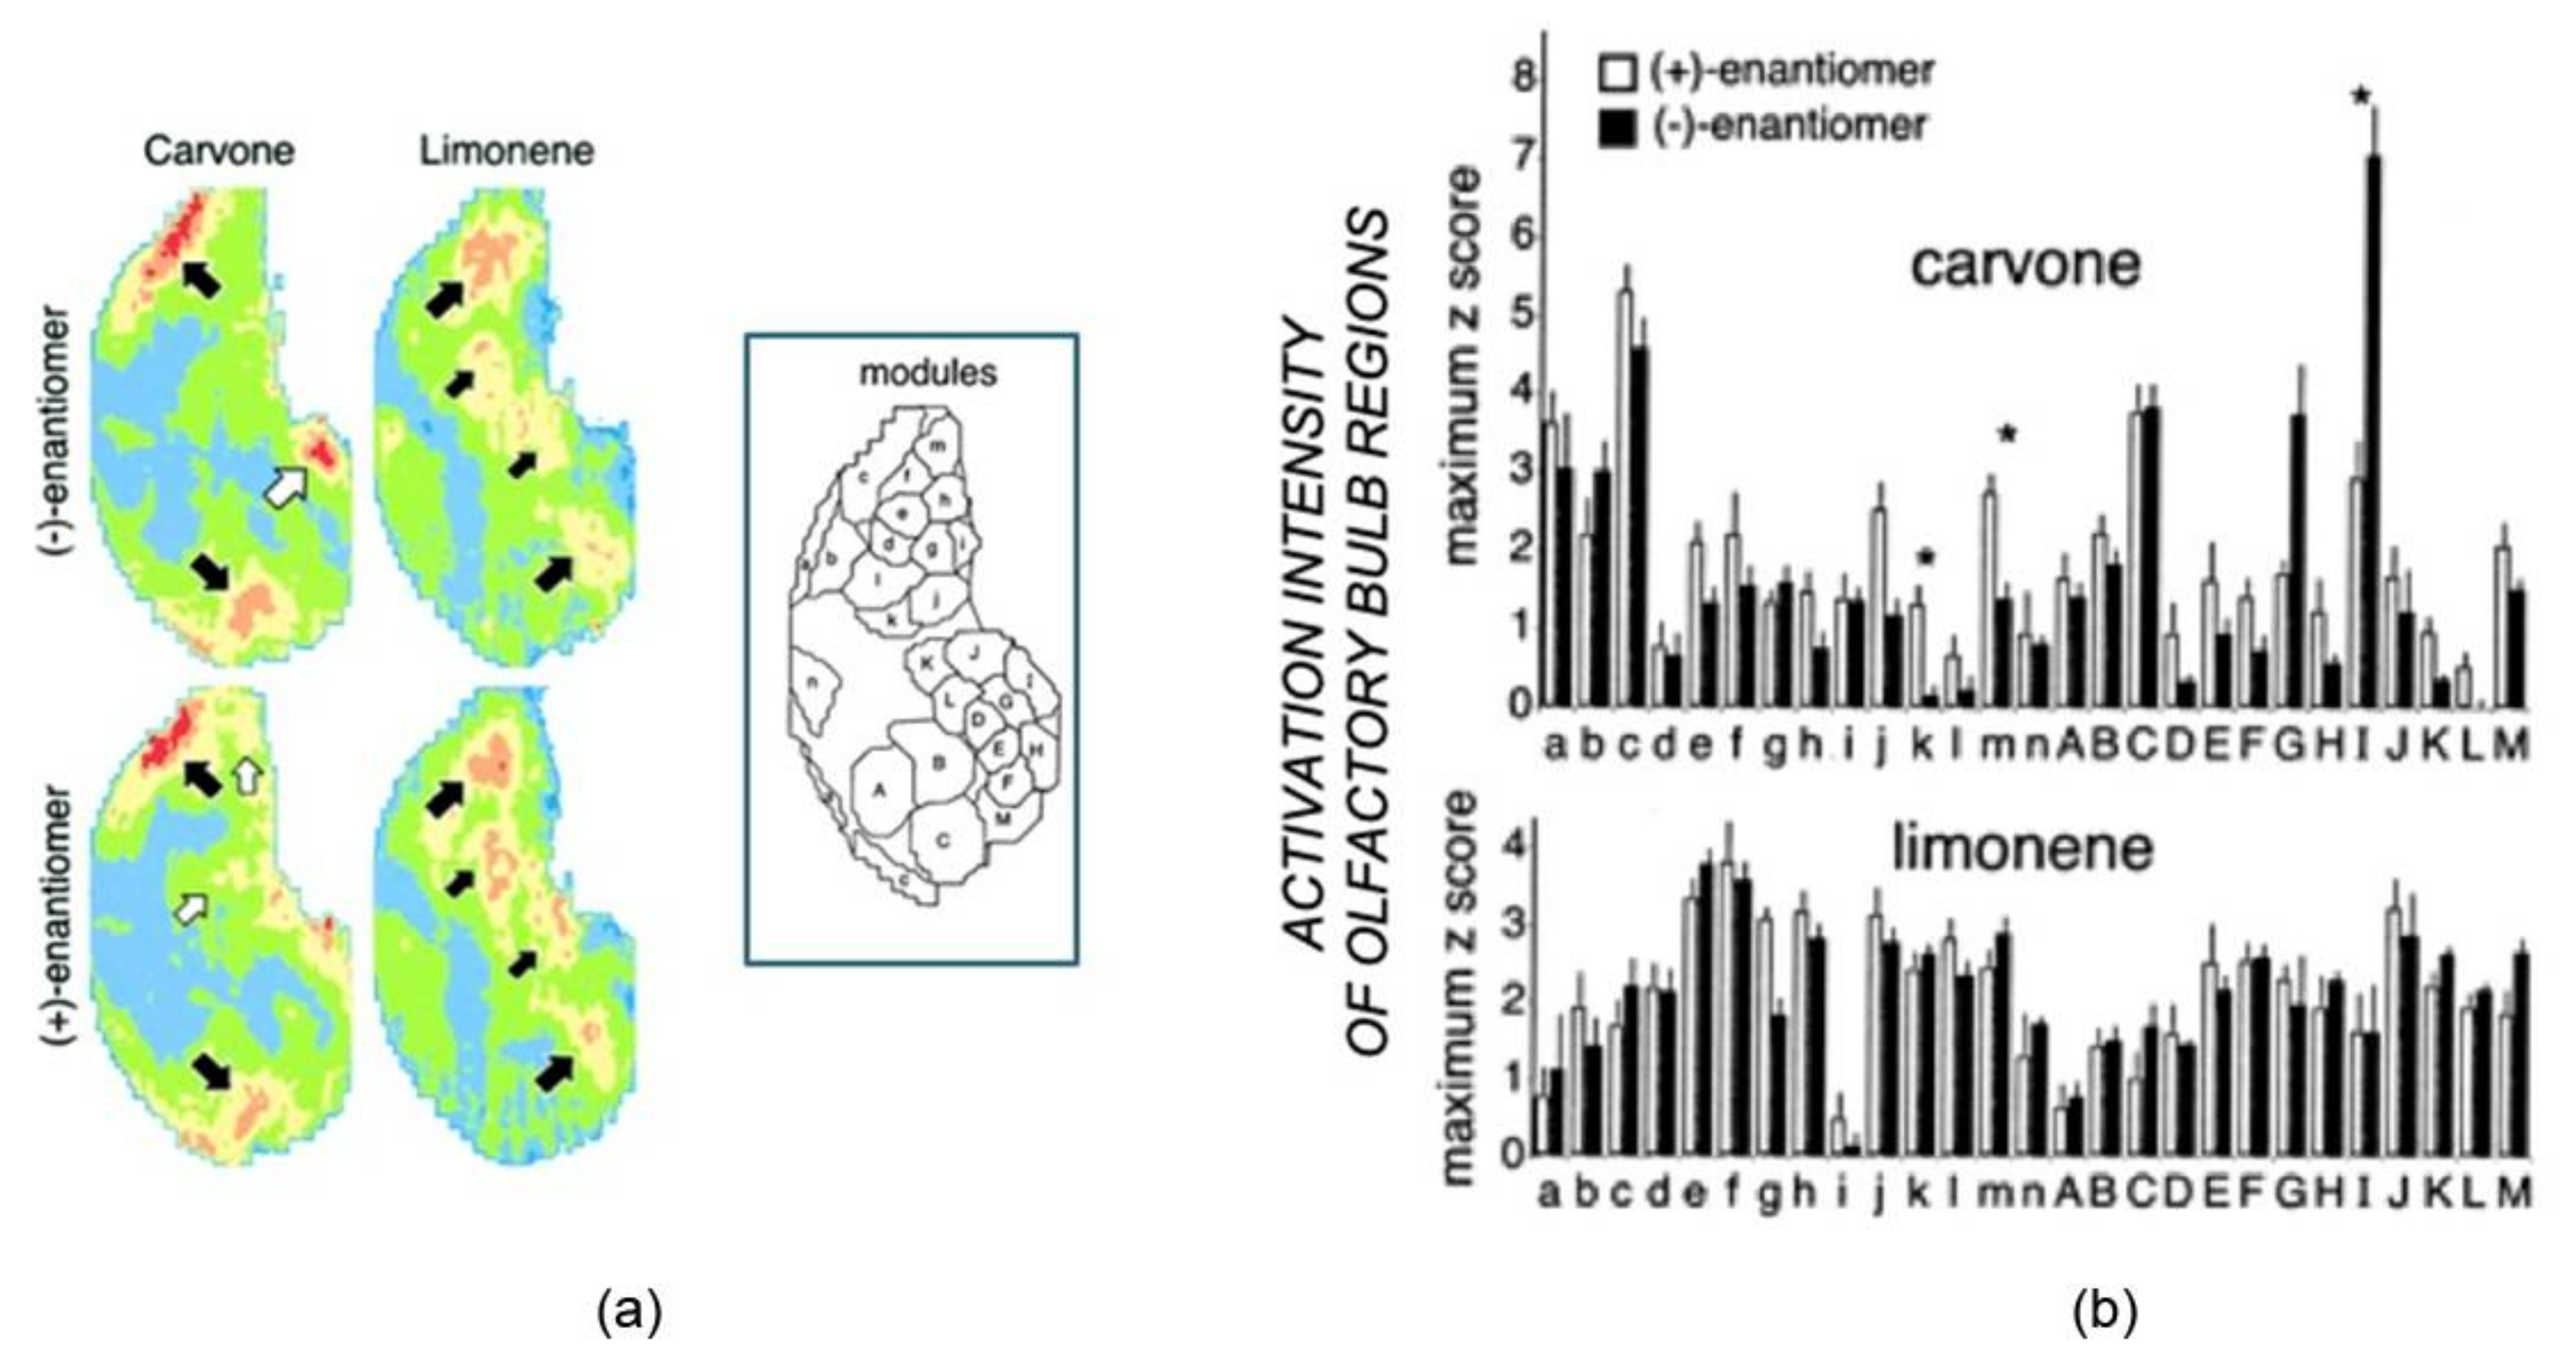
In a suggestive study, Leon and coworkers highlighted how the different perception of a couple of odorant enantiomers is due to different neural activation patterns of olfactory receptors [
19]. Using the olfactory bulb area in which the glomeruli were activated, the study highlighted how rats could discriminate between the enantiomers of limonene and carvone, as revealed by the [14C]2-deoxyglucose (2-DG) uptake that differentiates the glomerular activity under odor exposure. The patterns of 2-DG uptake caused by the enantiomers tested were reported as contour charts in
Figure 1a. As expected, limonene and carvone enantiomers stimulated different uptake patterns, but clear differences can also be observed within the specific enantiomeric pairs. Indeed (+)-carvone activated reliably distinct glomerular areas not activated by (−)-carvone (
Figure 1, two small white arrows).
These differences were quantitatively shown by reporting the pattern of activity across 27 modules, each consisting of glomeruli groups having overlapping responses to a specific odor characteristic (
Figure 1b). Notably, only three out of the 27 modules show statistically different responses for the two carvone enantiomers, evidencing higher activity of module I for the (−) enantiomer with respect to the (+), with an opposite trend observed in modules k and m. These findings reflect the different glomerular regions activated, indicated with large and small white arrows in
Figure 1. The scarce differences observed in the 2-DG uptake under exposure of limonene pairs were also supported by the absence of statistically significant differences in any of the 27 modules for this pair of odorants. Despite these minimal differences, the olfaction perceptions can discriminate the two enantiomers with high accuracy, meaning that the data processing in the brain strongly emphasizes these slight differences.
The aforementioned olfactory principles are artificially implemented in electronic noses made by ensembles of cross-selective sensors. In electronic noses, the complex OB processing is replaced by much simpler machine learning algorithms that provide the sensor pattern classification and allows for the identification of different compounds or mixtures of compounds [
20].
Clearly, a molecule must interact with one or more OR to be detected. Concerning enantioselectivity, it has been found that several ORs and OBPs can discriminate between the chiral forms of the same molecules.
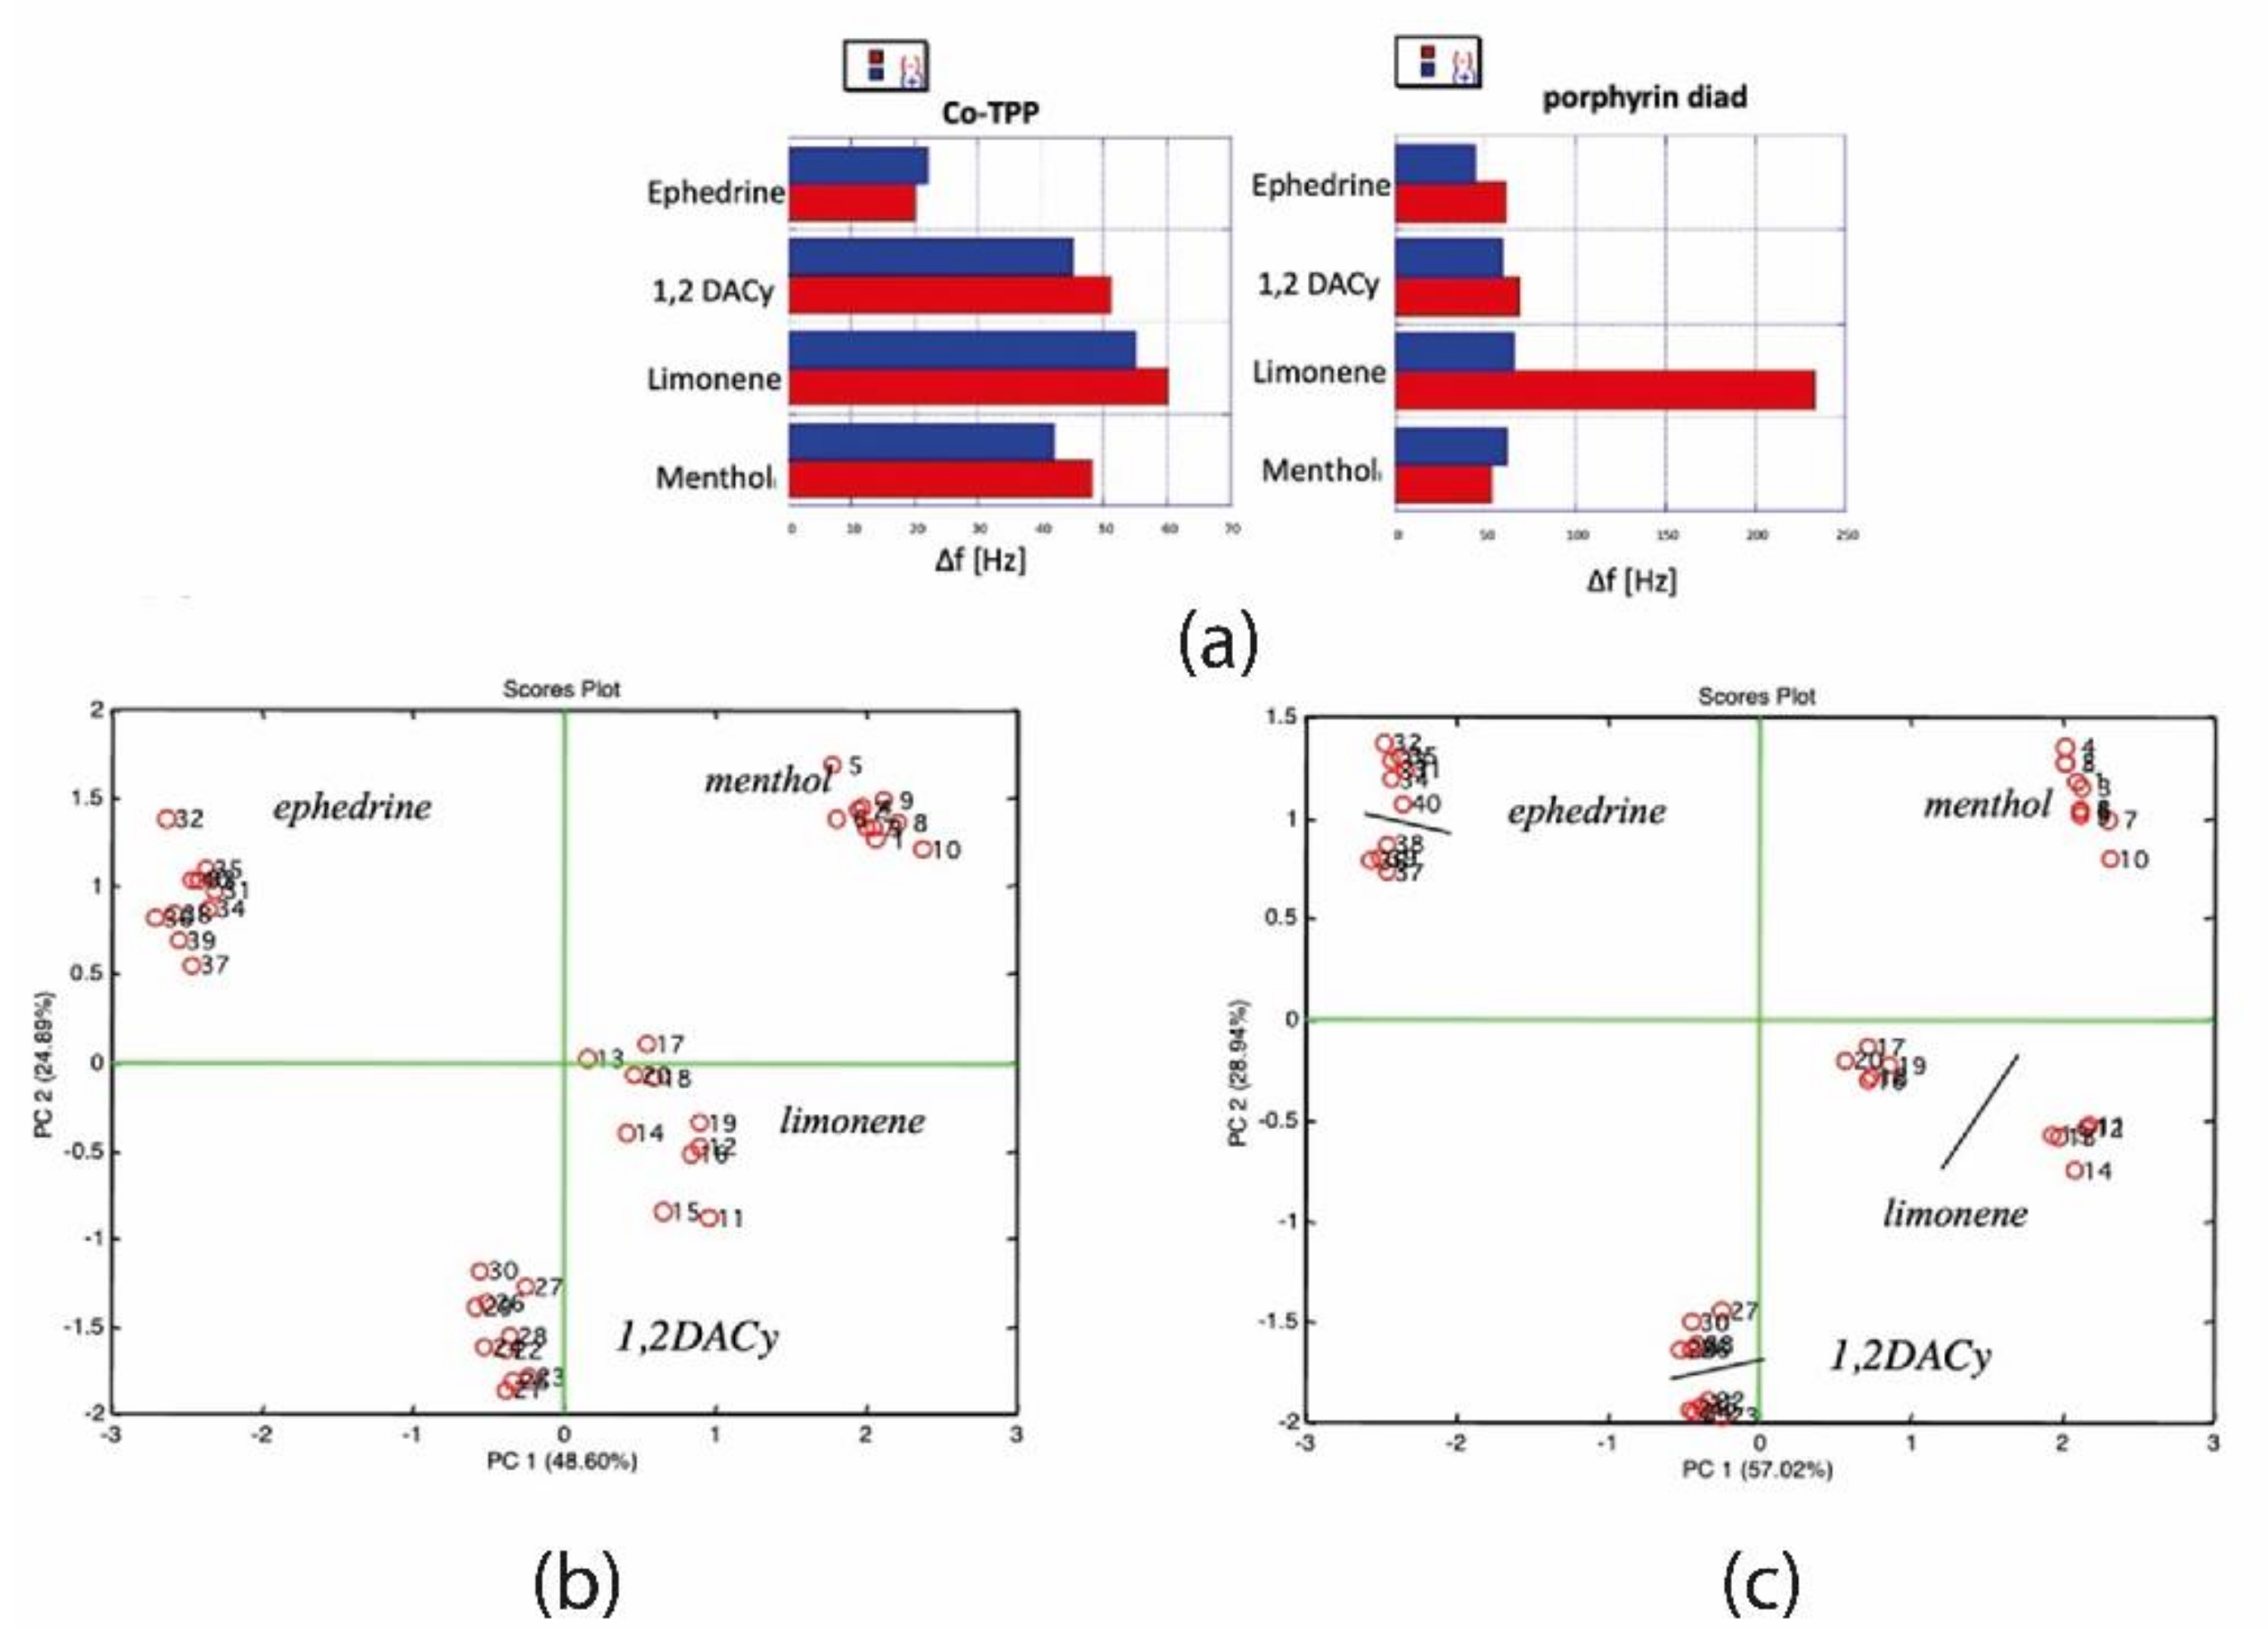
In sensors, the enantioselectivity does not imply sensor selectivity, meaning that even if a sensor has a large response to only a chiral form, it may simultaneously be sensitive to other compounds. However, the combinatorial selectivity of the array can ensure the recognition of enantiomers and the identification of compounds at the same time. As an example, let us consider the case of an array of quartz microbalance sensors functionalized by tetraphenyl porphyrins with an additional sensor functionalized by a self-assembled monolayer of 4,5-bis [5-(4-carboxyphenyl)-10-15-20-triphenylporphyrin]-
trans-1,2-dithiane. The enantioselectivity properties of this chiral dyad were shown several years ago [
21].
Figure 2a compares the signal to the 3% of the vapor pressure of a simple cobalt tetraphenyl porphyrin (CoTPP) and the chiral selective derivative. Differences for two enantiomers are evident only in the case of limonene, while signals to ephedrine, 1,2-diaminocyclohexane (1,2, DACy), and menthol are almost negligibly dependent on the chiral form.
Figure 2b shows the plot of the first two principal components of the signals of the array of QMBs functionalized with five achiral TPP molecules, where each porphyrin carries a different metal ion. Here the identification of compounds is manifested by the fact that the four volatile compounds partition the plane of the first two principal components. As expected, no separation between enantiomers is visible in this plot (receptors are achiral). The introduction in the array of the sensor functionalized by enantioselective porphyrin dyad is enough not only to separate the chiral forms of limonene but also to confer enantioselectivity for ephedrine and 1,2,DACy, while the chiral forms of menthol remain indistinct (
Figure 2c). This simple example shows the array configuration’s power in emphasizing each sensor’s contribution and–in particular–overcoming the cross-selectivity effect that could hide the enantioselectivity of single sensors.
3. Chiral Discrimination in the Gas Phase: The Case of Odors
Enantioselective discrimination and quantification of molecules in the gaseous phase by chemical sensors is particularly appealing for applications covering, among others, food and cosmetic fields, where the assessment of quality and adulteration of food as well as imitation of commercial fragrances are pivotal. Many examples of sensors using different active materials and transducers are reported in the literature [
21,
22,
23,
24,
25], but the sensor array approach is only sporadically explored. In this regard, widely differing receptors–both organic and inorganic–such as peptides [
4], metal oxide semiconductors [
26], or metal organic frameworks [
27] have been employed. On the other hand, for what concerns transducers, QCMs (Quartz Crystal Microbalances) have been primarily exploited. These systems are powerful and easy to handle for gas phase analysis, allowing to evaluate the adsorption and desorption processes by recording the frequency shift following the mass variation [
28].
In this context, pioneering works were reported in 1997 by Göpel and coworkers [
24,
29], describing the use of both piezoelectric and optical sensors for the chiral discrimination of vapors of amino acid derivatives and ethyl and methyl lactates. The two systems performed the enantiomeric differentiation, measuring the variations in mass of the sensitive layers on the thickness shear-mode resonators used (TSMRs) and in optical layer thickness, by reflectometric interference spectroscopy (RIFS). In both cases, a couple of amide polymers–namely R- and S-octyl-Chirasil-Val–have been used as chiral selectors and deposited as films on sensor surfaces. The exposure to the different enantiomer vapors gave signals that were consistent with data by other chromatographic methods previously reported: in particular, stronger interactions have been observed between analytes and polymer pairs of the same chiral configuration. The robustness of the sensor systems developed has been supported by the fact that the enantiomeric chiral sensors gave identical signals when exposed to the racemate, with values in the middle between those of the (
S)-analyte ((
R)-analyte)/(
S)-sensor pairs and the (
S)-analyte ((
R)-analyte)/(
R)-sensor couples. Both sensor systems have been successfully used for the enantiomeric discrimination of the selected gaseous species, providing 10% resolution for a fast determination of enantiomeric excess.
In the early 2000s, Shurig and coworkers reported the possibility of discriminating between limonene enantiomeric pairs by β-cyclodextrin-coated QMB sensor arrays [
30]. The molecular cavities offered by β-cyclodextrins differed in the alkyl groups (i.e., methyl (Me), ethyl (Et), and acetyl (Ac)) decorating the secondary face on the 2,3 positions of all the glucose units and, being hydrophobic, resulted in optimal candidates for the recognition by partial inclusion of the apolar limonene guest. Chiral selectors were applied as 50% (
w/
w) mixtures in different polysiloxane matrices, significantly improving the performance of the system. An achiral coating–polyether urethane (PEUT)–has also been used as a reference. Due to the limited number of available recognition sites on the QMB surface, the best results for enantioselective absorption have been obtained in the early domains of the Langmuir isotherms at very low analyte concentrations. As an example, by measuring limonene concentrations of 550 μg L
–1 with different enantiomeric compositions, the chiral Et-β-cyclodextrin QMB sensor response differed more than 100 Hz to the
R- and
S-limonene, showing a preferential absorption for the
R-enantiomer respective to the
S-. Linear isotherms for limonene with the achiral sensor showed, as expected, the same values for both the enantiomers. Data analysis was performed using an artificial neuronal network (ANN), allowing the prediction of the enantiomeric composition of the gas mixtures tested. The range of concentrations of the reference data set was from 0 to 1650 μg L
–1 and contained signals of both pure enantiomers and the racemic mixture. The same concentration range was used for the test data set, incrementing enantiomeric compositions by steps of 10%.
The concentrations of R- and S-limonene, respectively, were predicted from the ANN with a mean error of 6.97%, a non-negligible value probably due to the limited number of sensors used for predicting the enantiomers amount. Nevertheless, the enantiomeric composition of the samples was determined using the predicted concentrations of R- and S-limonene and compared with the actual values. Prediction of different enantiomeric compositions was found in steps of 15%.
It is important to note that no prediction can be made by using an ANN in the absence of the chiral sensors and, among them, a different contribution can be observed, with the Me-β-CD- and the Et-β-CD-based QMBs the most useful sensors to determine the enantiomeric composition of limonene mixtures.
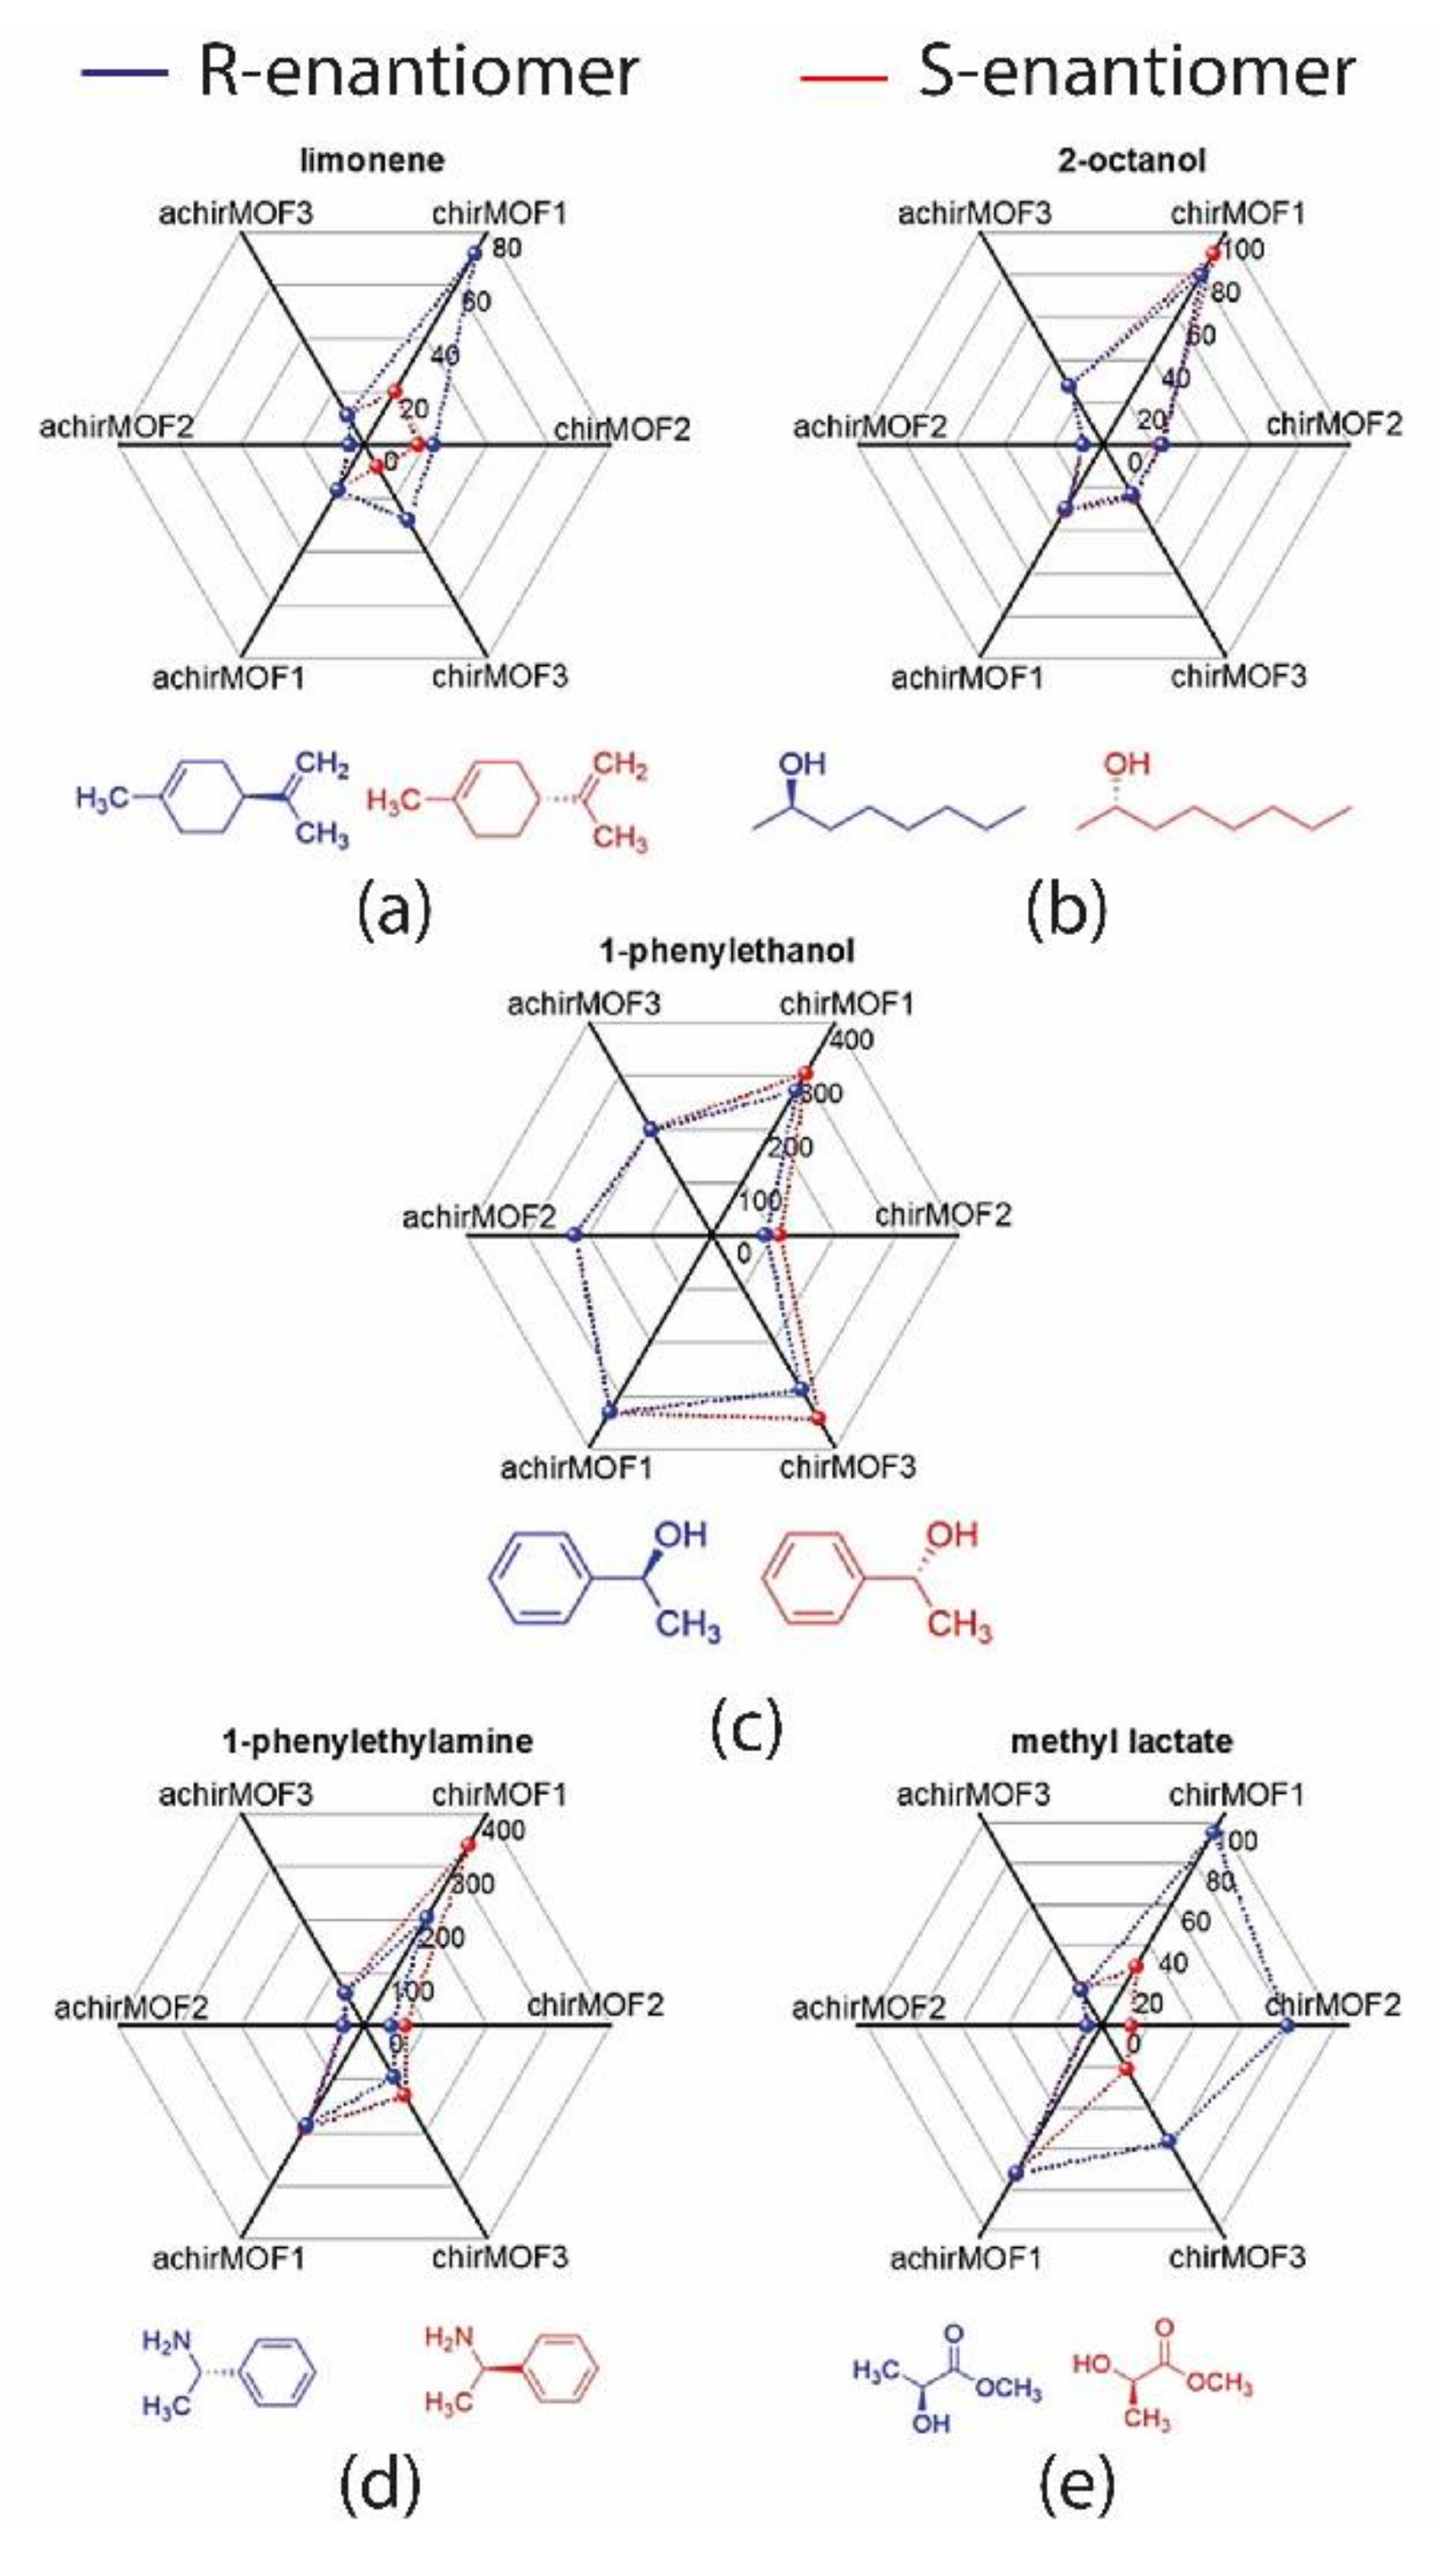
Heinke et al. recently reported an e-nose based on QMB sensors using metal organic framework (MOF) films of different nanoporous structures, both chiral and achiral, as sensitive materials [
27]. Indeed, this class of materials is emerging as a powerful and versatile way to sense gases thanks to their large surface area and fine-tunable porosity by combining impressive numbers and types of nodes and ligands. The enantioselective system is based on six QMBs for MOFs half-coated with chiral, all based on Cu
2+ dimers linked to, among others, (1
R,3
S)-(+)-camphoric acid (Dcam) that confers the homochirality to the layers. It is important to note that even if the chiral moiety is the same for the three films, their enantioselectivity is different thanks to the individual MOF structure varying in the other pillar linkers. The array was tested towards five chiral odorants, namely limonene, 2-octanol, 1-phenylethanol, 1-phenylethylamine, methyl lactate, and the corresponding enantiomers, totaling 10 odor molecules. The difference in response for all the sensors used is well-shown by radar plots reported in
Figure 3, relative to 50 ppm vapor concentration that affords characteristic patterns for all the molecules tested. It can be seen that the achiral QMBs sense the five molecules differently, but they are not able to discriminate the enantiomers for all investigated vapors. Conversely, the chiral sensors can clearly distinguish the enantiomers of the same molecule, as in the case of 1-phenylethylamine for which the response to
R-enantiomer is 60% larger with respect to
S by sensor chirMOF1. The machine learning algorithm k-nearest neighbor (kNN) was used to evaluate the performance of this platform. The confusion matrix shows that all odors can be distinguished by their QMBs responses, with high accuracy (mean value of 96.1%) for the most enantiomers tested. It is important to note that using data only from chiral sensors decreases the accuracy to 91.2%. This finding supports the integration of achiral sensors into an enantioselective system since the responses from these films improve the array performance for chiral detection, even if they do not have individually discriminating abilities. On the other hand, the authors stressed the chiral sensors’ distinctive enantioselectivity despite their structural similarities. This aspect and the virtually unlimited options to obtain MOFs with chiral features make these MOF-based films optimal candidates for the construction of chiral e-nose to be applied in advanced odor sensing.
Below are two examples of chiral discrimination via sensor array approach using other transduction mechanisms. The first deals with the discrimination of limonene and other terpenoids, such as α-pinene and carvone, using a sensor array composed of seven commercial sensors based on SnO
2 (TGS). These elements modify their electrical resistance when reacting with reducing vapors [
26]. The unclear aspect of this work lies in the fact that the sensitive materials are less-than specific, and their putative chirality is not reproducible. Anyway, the authors defended their findings on the fact that, in some cases, chiral organic molecules can selectively adsorb onto crystalline mineral surfaces. For the TGS systems, the first selective adsorption of the chiral analyte is followed by a reduction reaction with the adsorbed oxygen atoms on the surface, causing the sensor resistance to decrease. Seven sensors were carefully chosen to have the highest selectivity of the system, minimizing the possible noise as much as possible, and used to test 10 samples of each enantiomer, each measured 36 times. Even if each sensor was slightly selective to enantiomers, these latter ones were accurately recognized through multivariate techniques. Among those tested, the classification model based on Supporting Vector Machine, SVM, was found to be very accurate and, at the same time, very robust to the noise affecting the measurements. The model was able to discriminate among two different enantiomers of a single odor and recognize other analytes that did not belong to any trained molecules.
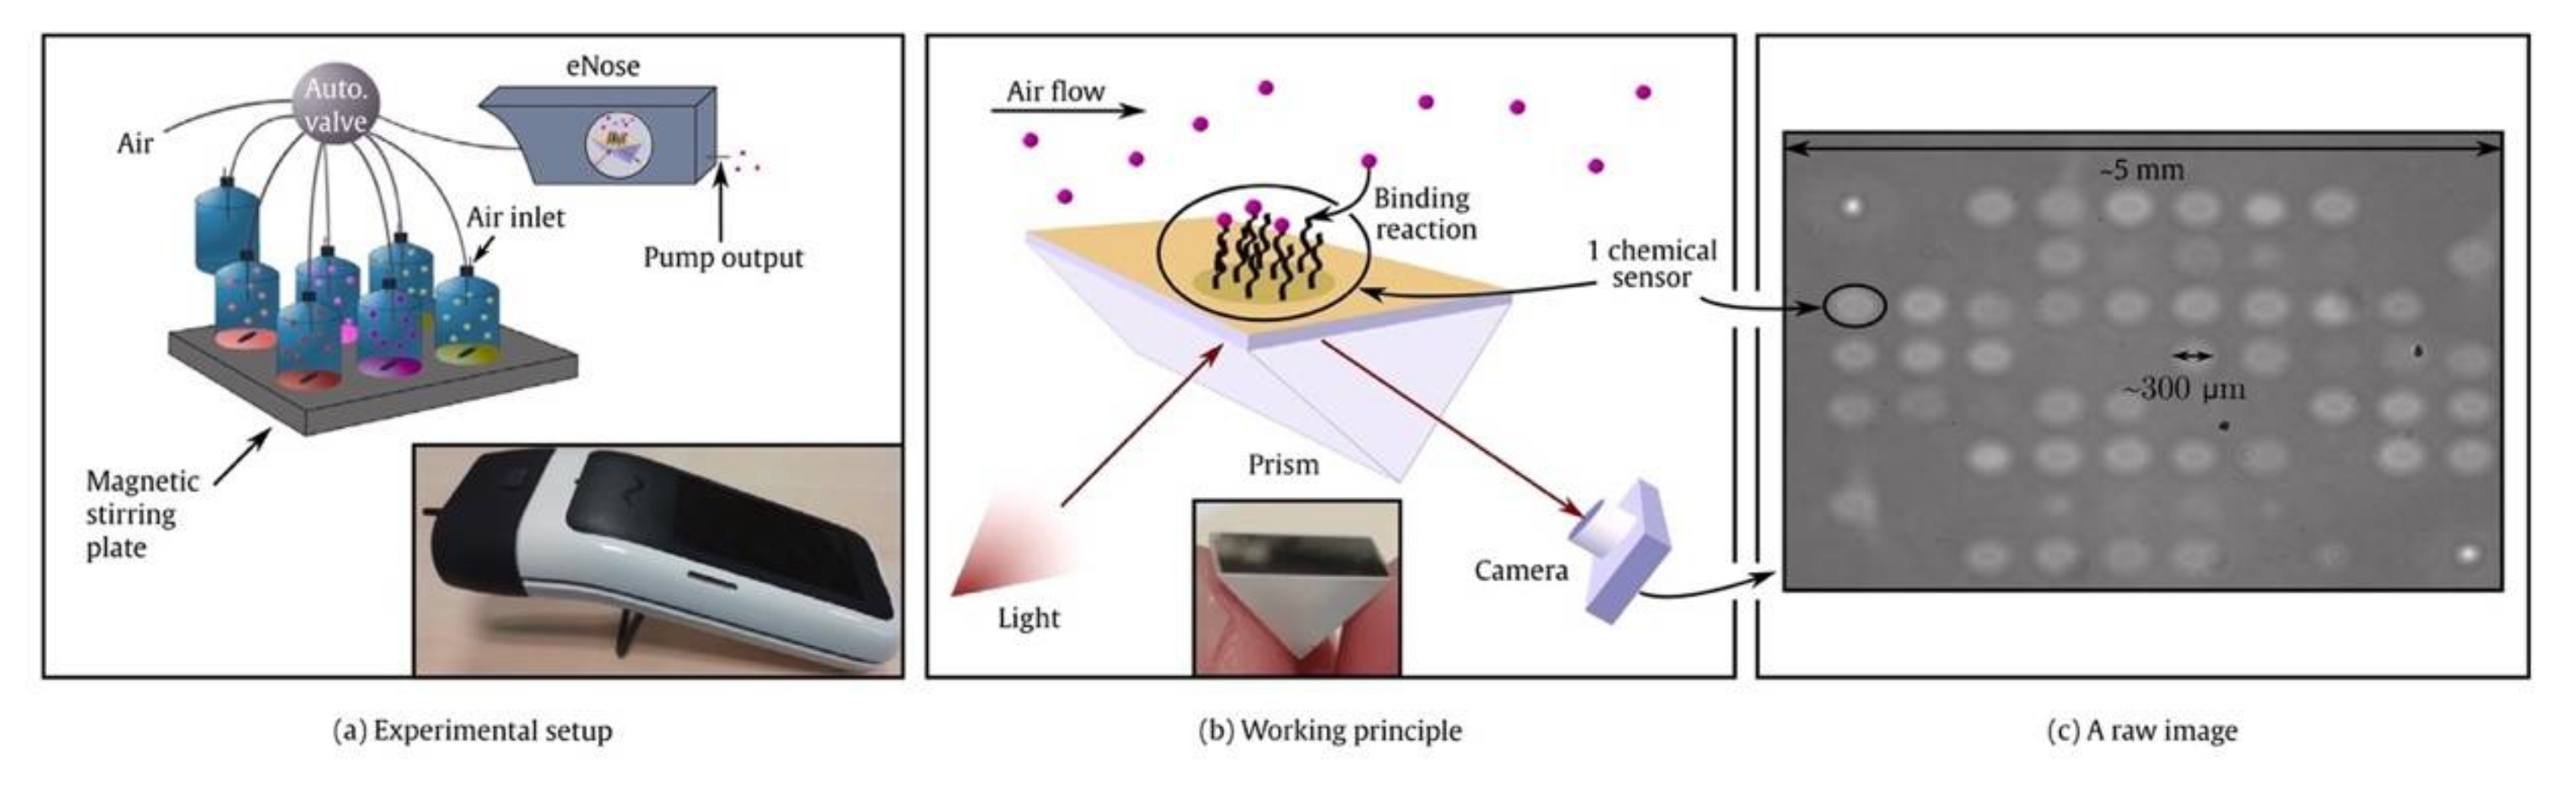
The second work reports an optoelectronic nose using peptides deposited on the Au surface of a prism as sensing materials [
4]. The research group previously published a paper describing the capability of this platform to comprise hundreds of different sensing materials with low system complexity [
31].
Here authors utilized the same board for chiral recognition since peptides may show enantioselective features towards VOCs. The enantiomer discrimination is undoubtedly a more challenging task since it requires additional care in terms of statistical reliability and measurement protocols. Two couples of chiral molecules, namely R- and S-Limonene and R- and S-Carvone have been analyzed. Butanol was tested as a non-chiral compound to estimate the uncertainty related to the measurement protocols. Indeed, the set-up for measuring enantiomer should be highly accurate to avoid bias from external sources wrongly indicating enantioselective features of systems.
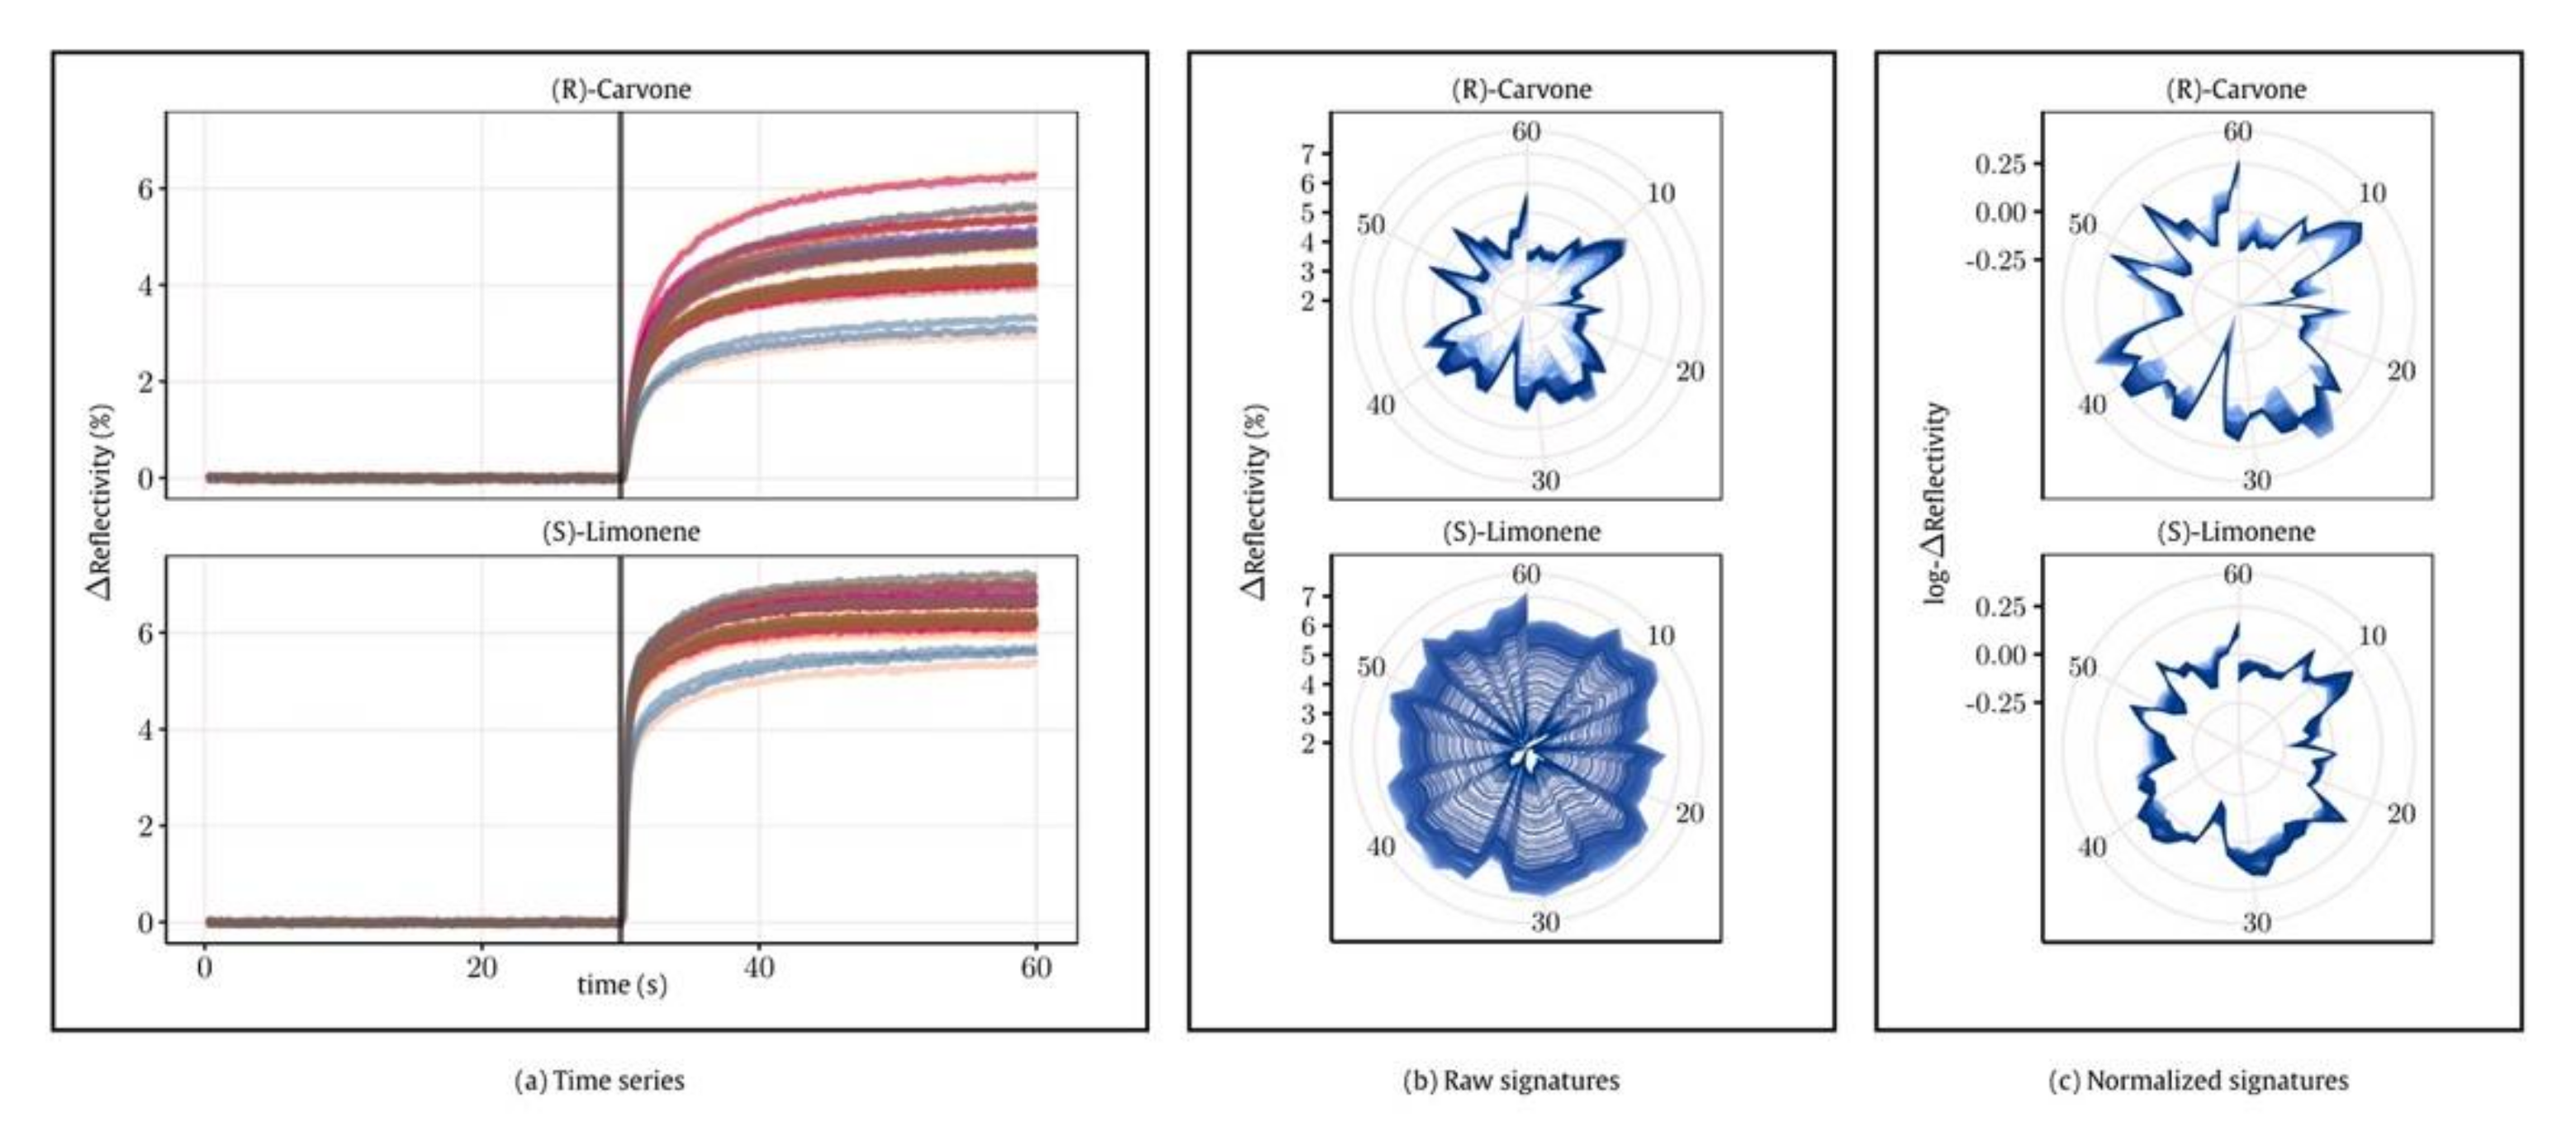
The interaction of odors with peptide films in real-time is measured by Surface Plasmon Resonance imaging (SPRi), as reported in
Figure 4. The occurrence of analyte binding onto the surface changes the refraction index, leading to variations in the reflectivity recorded by an optical camera. The authors encountered two main problems: the presence of drift over time and the repeatability of measurements for samples in different vials. Concerning the first point, drift is defined as an unpredictable variation of sensor responses to the same chemical stimulus due to aging or poisoning effects.
Figure 5a reports the time series of responses to samples having the same concentration. As it is possible to note, the sensor outputs significantly change over the measurement cycles.
To compensate for this variation, the authors proposed a normalization approach to reduce the effect of concentration. In this way, the reproducibility of measurements was greatly improved (
Figure 5b,c). Concerning the second point, the authors found that repeating the measurements of butanol utilizing two different vials produced slightly different responses. In other words, the system recognized the vial rather than the sample. The authors also conducted a statistical analysis proving the presence of a vial differentiation in the enantiomer sample measurements. However, the magnitude of this bias is not sufficient to explain the differences observed in the responses toward the two enantiomers proving the enantioselective capability of the system. Finally, applying the normalization mentioned above, the authors found that the enantiomers of carvone and limonene may be separated by utilizing PCA, even considering samples acquired in different measurement sessions. It is worth mentioning that part of the selectivity observed stems adopted from the normalization protocol.
4. Chiral Discrimination of Biologically Relevant Species by Fluorescent Sensor Arrays in Liquid
The application of sensor array for chiral discrimination in liquid media is surely more common than in gas phase. This is mainly due both to a higher amount of liquid chiral substances and to the commercial availability of enantiomeric couples of a large series of target analytes of practical importance, such as biomarkers, active substances, or agrochemicals. Further, many synthetic chiral receptors have been extensively characterized in solution, and thus their host–guest behaviors are well-known. In addition, liquid samples can be straightforwardly analysed by optical methods, allowing the analyte detection by fluorescence or absorbance variations following the interactions with target compounds [
32]. Finally, the alterations of structure/concentration of biomolecules provide valuable information on people’s health conditions, thus highlighting systemic damages or bacterial infections. New approaches for their determination aim at analyzing complex mixtures with low-cost and easy-to-handle devices by reducing sample pretreatment as much as possible and avoiding interference with non-target substances.
Among these biomolecules, thiols represent a class of substances typically present in the human body in the forms of cysteine, homocysteine, and reduced glutathione. Their abnormal values have been related to cardiovascular, neurodegenerative, and cancer diseases [
33,
34]. Generally, the determination of thiols-based compounds occurs without recognizing the single sulfur-containing molecules, but rather by evaluating the total antioxidant ability of biomolecules containing the -SH groups. Due to their importance in assessing patients’ health conditions, continuous monitoring of biological samples is performed–even with invasive techniques–and analyzed with traditional methods such as HPLC or mass spectrometry, which require expensive equipment and time-consuming sample manipulation [
35,
36].
Analysis of accessible biological fluids such as saliva or urine based on luminescence has been developed to overcome these limitations. Techniques exploiting emission phenomena have strengths, such as high sensitivity and easy implementation, and can be performed by accessible measurement devices.
Considering the chemical complexity of biological samples, in 2018, Zhang’s group reported identifying and quantifying biological thiols by a sensor array [
37].
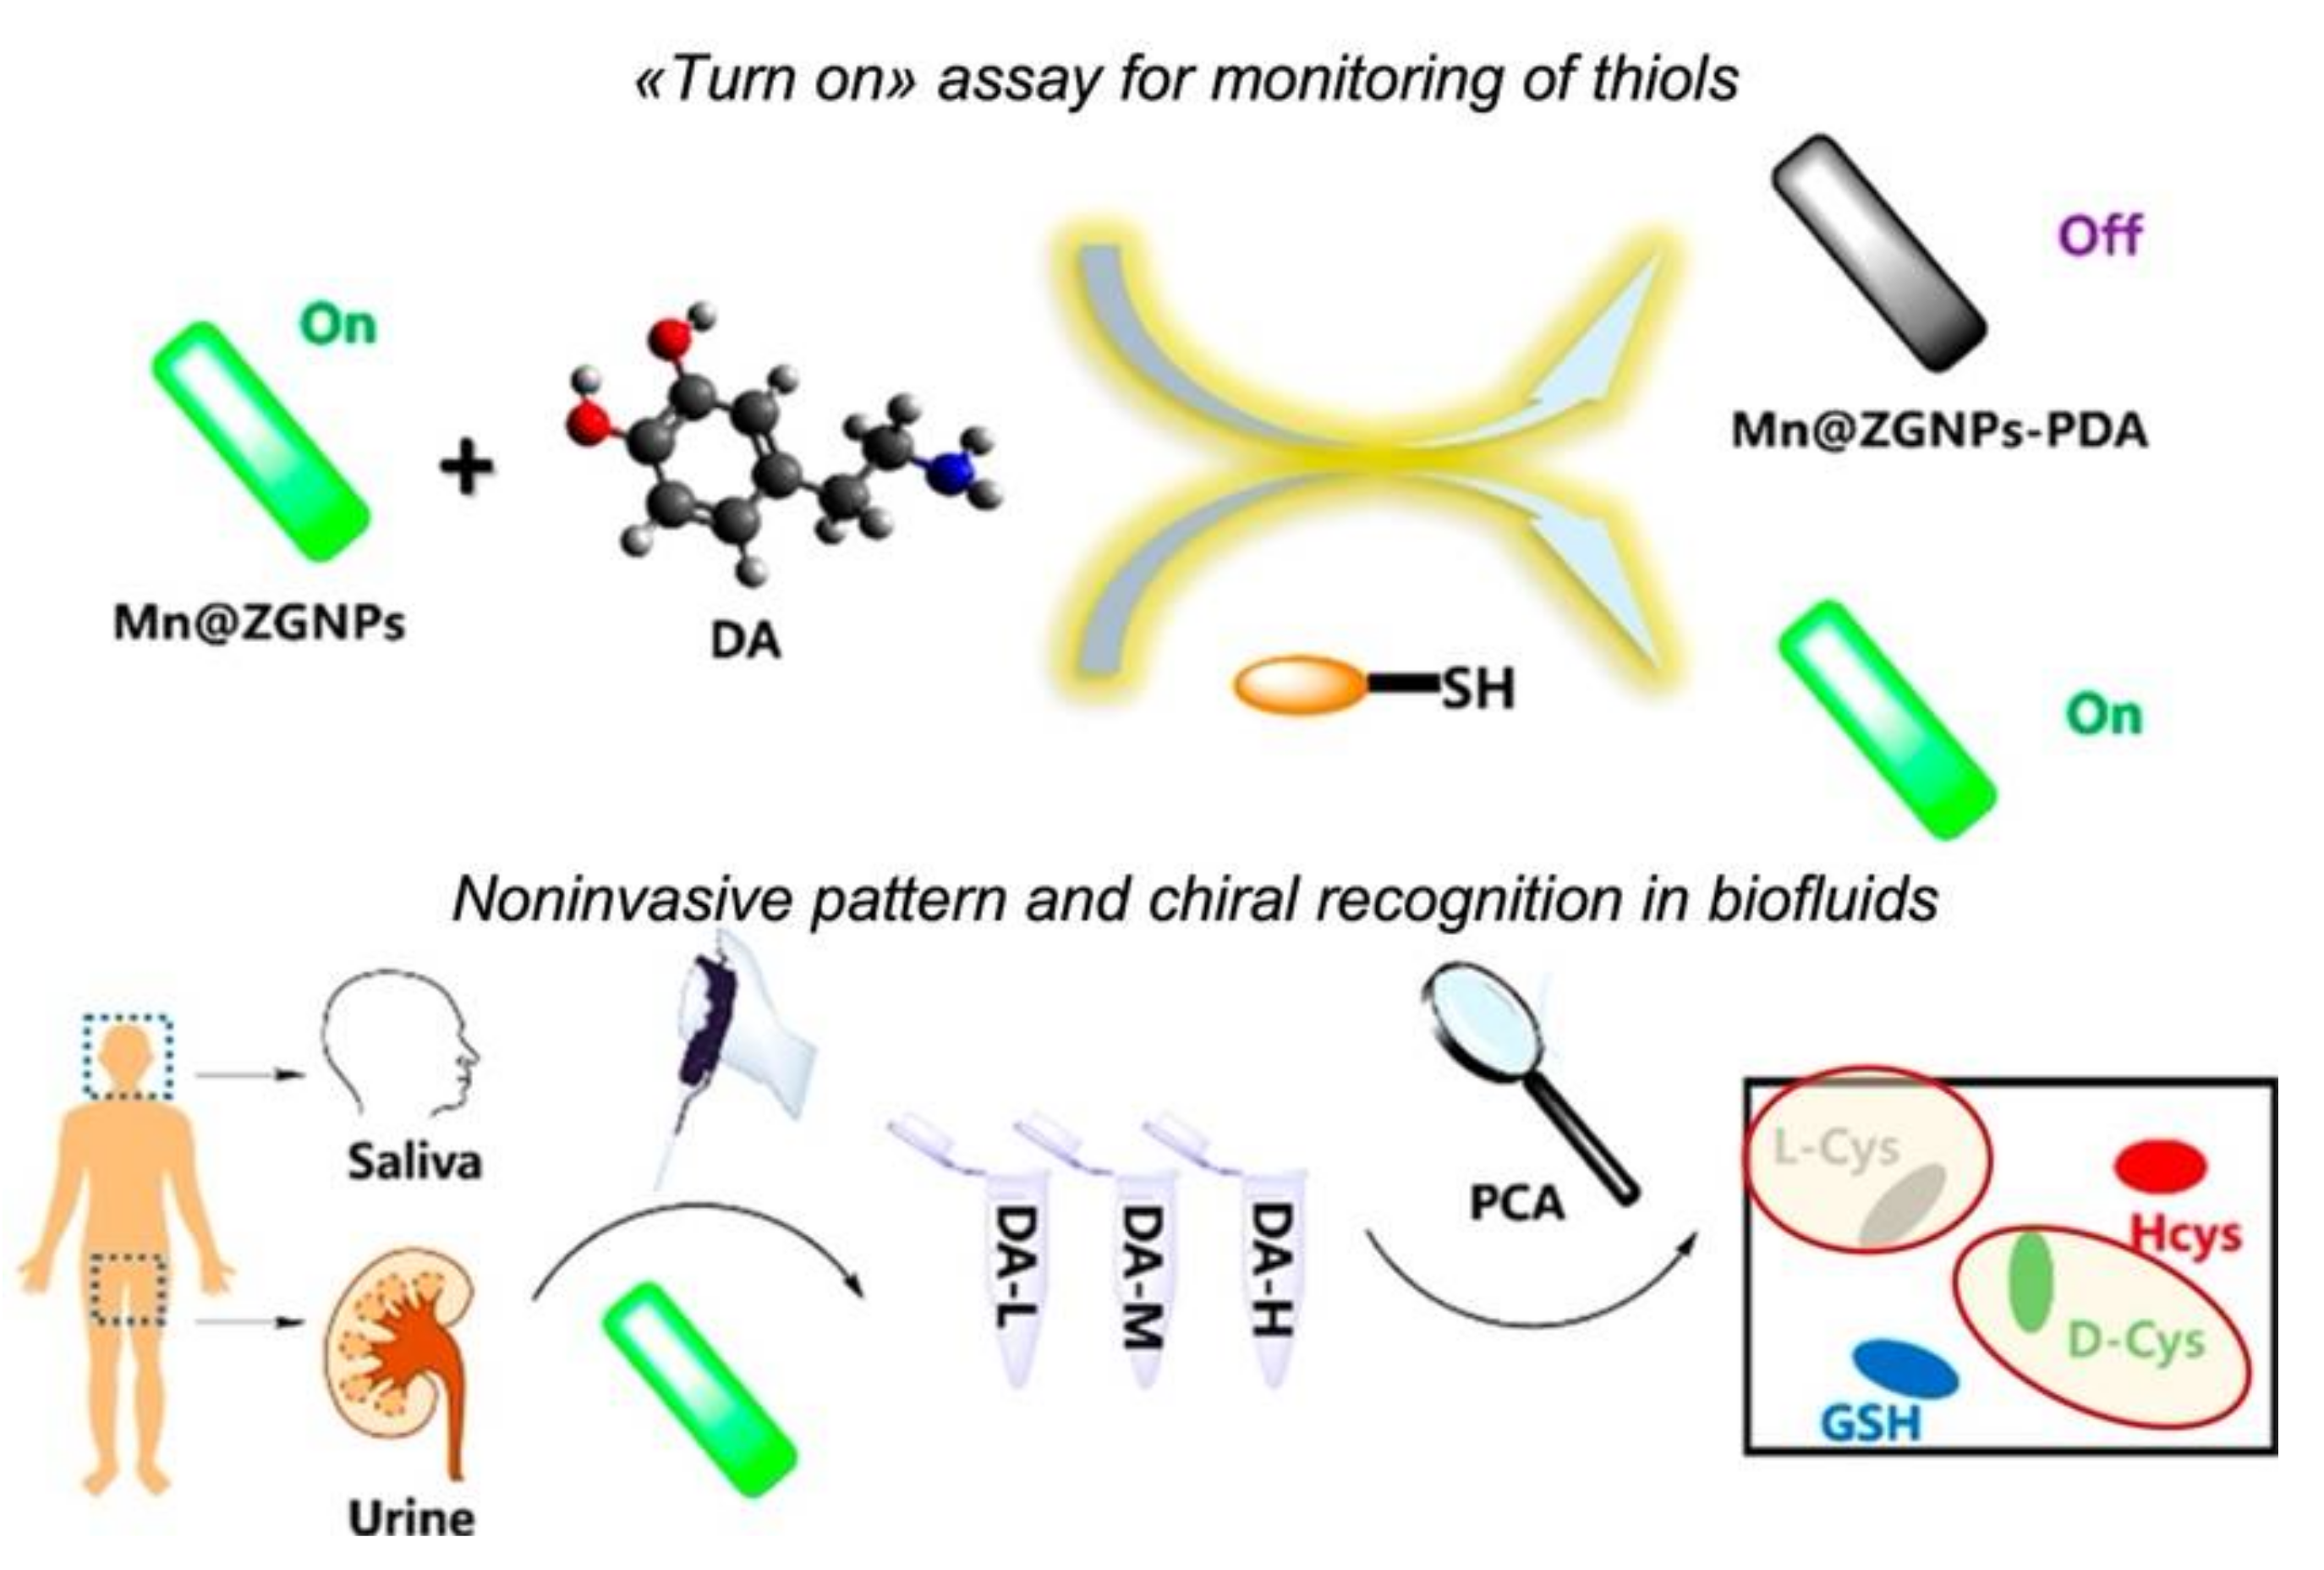
The authors described multi-components systems for bio-thiols detection where the target analyte modulates sensor emissions (
Figure 6). The responsive material is based on Mn(II)-doped zinc/germanium oxide nanoparticles (NP) endowed with long lifetime luminescence. After the addition of dopamine (DA), under alkaline conditions, it undergoes oxidation and self-polymerization, producing polydopamine (PDA) that is strongly adsorbed on NPs surface, quenching the green emission of nanoparticles through energy transfer (ET). The sensing mechanism is based on thiols’ antioxidant properties, which prevent the formation of polydopamine, thus avoiding fluorescence extinction.
Firstly, the system demonstrated a satisfactory detection of glutathione. Then, more complex analyses were carried out. Measurements differing for dopamine concentration were prepared and treated with three thiols (glutathione, cysteine, and homocysteine) in the 5–15 μM range; PCA analysis highlighted that a specific pattern is produced depending on the type and concentration of the tested analytes, as evidenced by the well-defined clusters obtained for each substance (
Figure 6). The discrimination ability is retained even in the presence of a constant concentration of the overall thiols and when changing the relative amount of two different substances. Interestingly, the mixture of cysteine enantiomers was analyzed to test whether free D-amino acids could be detected. Single amino acids were completely distinguished, probably due to a different inhibition of dopamine polymerization related to the spatial structural diversity of D and L cysteine.
The same group proposed another system based on luminescence variation, made by different substances to be both an emissive material and quencher [
38].
The emitting material is composed of PDA/PEI (i.e., polyethyleneimine) copolymers, whose luminescence is a function of pH: the acidic environment favors aggregation and hampers the light emission. This property allows to finely tune emissions by adjusting the acidity. Cu2+ ions were chosen as quenchers due to the high tendency of these ions to interact with catechol groups of the PEI unit. At the same time, the strong affinity of SH groups for Cu2+ is brought to the formation of metal ion–thiolate complexes, preventing the interaction of Cu2+ with the polymeric material, thus restoring the luminescence. The intrinsic characteristic response pattern obtained for each thiol results in the possibility of clustering eight different thiols simply by utilizing PCA. The detection of thiols can be performed at [Cu2+] = 50 μM and modulating pH value (i.e., the emission of copolymer). This system is sensitive to three bio-thiols (glutathione, D cysteine, and L cysteine) up to 100 μM, but it can also discriminate an overall 100 μM concentration of thiols obtained by mixing two compounds at various concentrations. Once again, discrimination of cysteine enantiomers was possible. Various metal ions and amino acids were then added as interferers to the sample to verify the system specificity. Principal component analysis showed no overlapping of the measured thiol samples, confirming the method’s robustness. Finally, exploitation of samples in complex matrices was investigated: one (glutathione) or two thiols (glutathione + L-cysteine) were spiked at different concentrations in urine and saliva. The PCA plot distribution of sample clusters at unknown analyte concentrations are consistent with that obtained for control groups (known concentration), and they were in line with results from standard methods (5,5-dithiobis-(2-nitrobenzoic acid), DTNB).
Amino acids, as is well known, are commonly present in humans in their L-form, although D-isomers can be introduced with diet or produced by the action of specific enzymes. Since the presence of the D-conformation of amino acids has been correlated with some diseases, their detection may be crucial for prevention. On the other hand, detecting amino acids in biological samples is challenging due to their structural similarity. Although some differences arise from the side chains, in some cases difference is barely noticeable (e.g., for leucine/isoleucine). Moreover, 19 amino acids exist as enantiomers. In light of this, discrimination of single enantiomer in such a complex mixture may be performed only by sensor array using the supramolecular analytical chemistry for the recognition and chemometric techniques to process the overall characteristic sensors’ response.
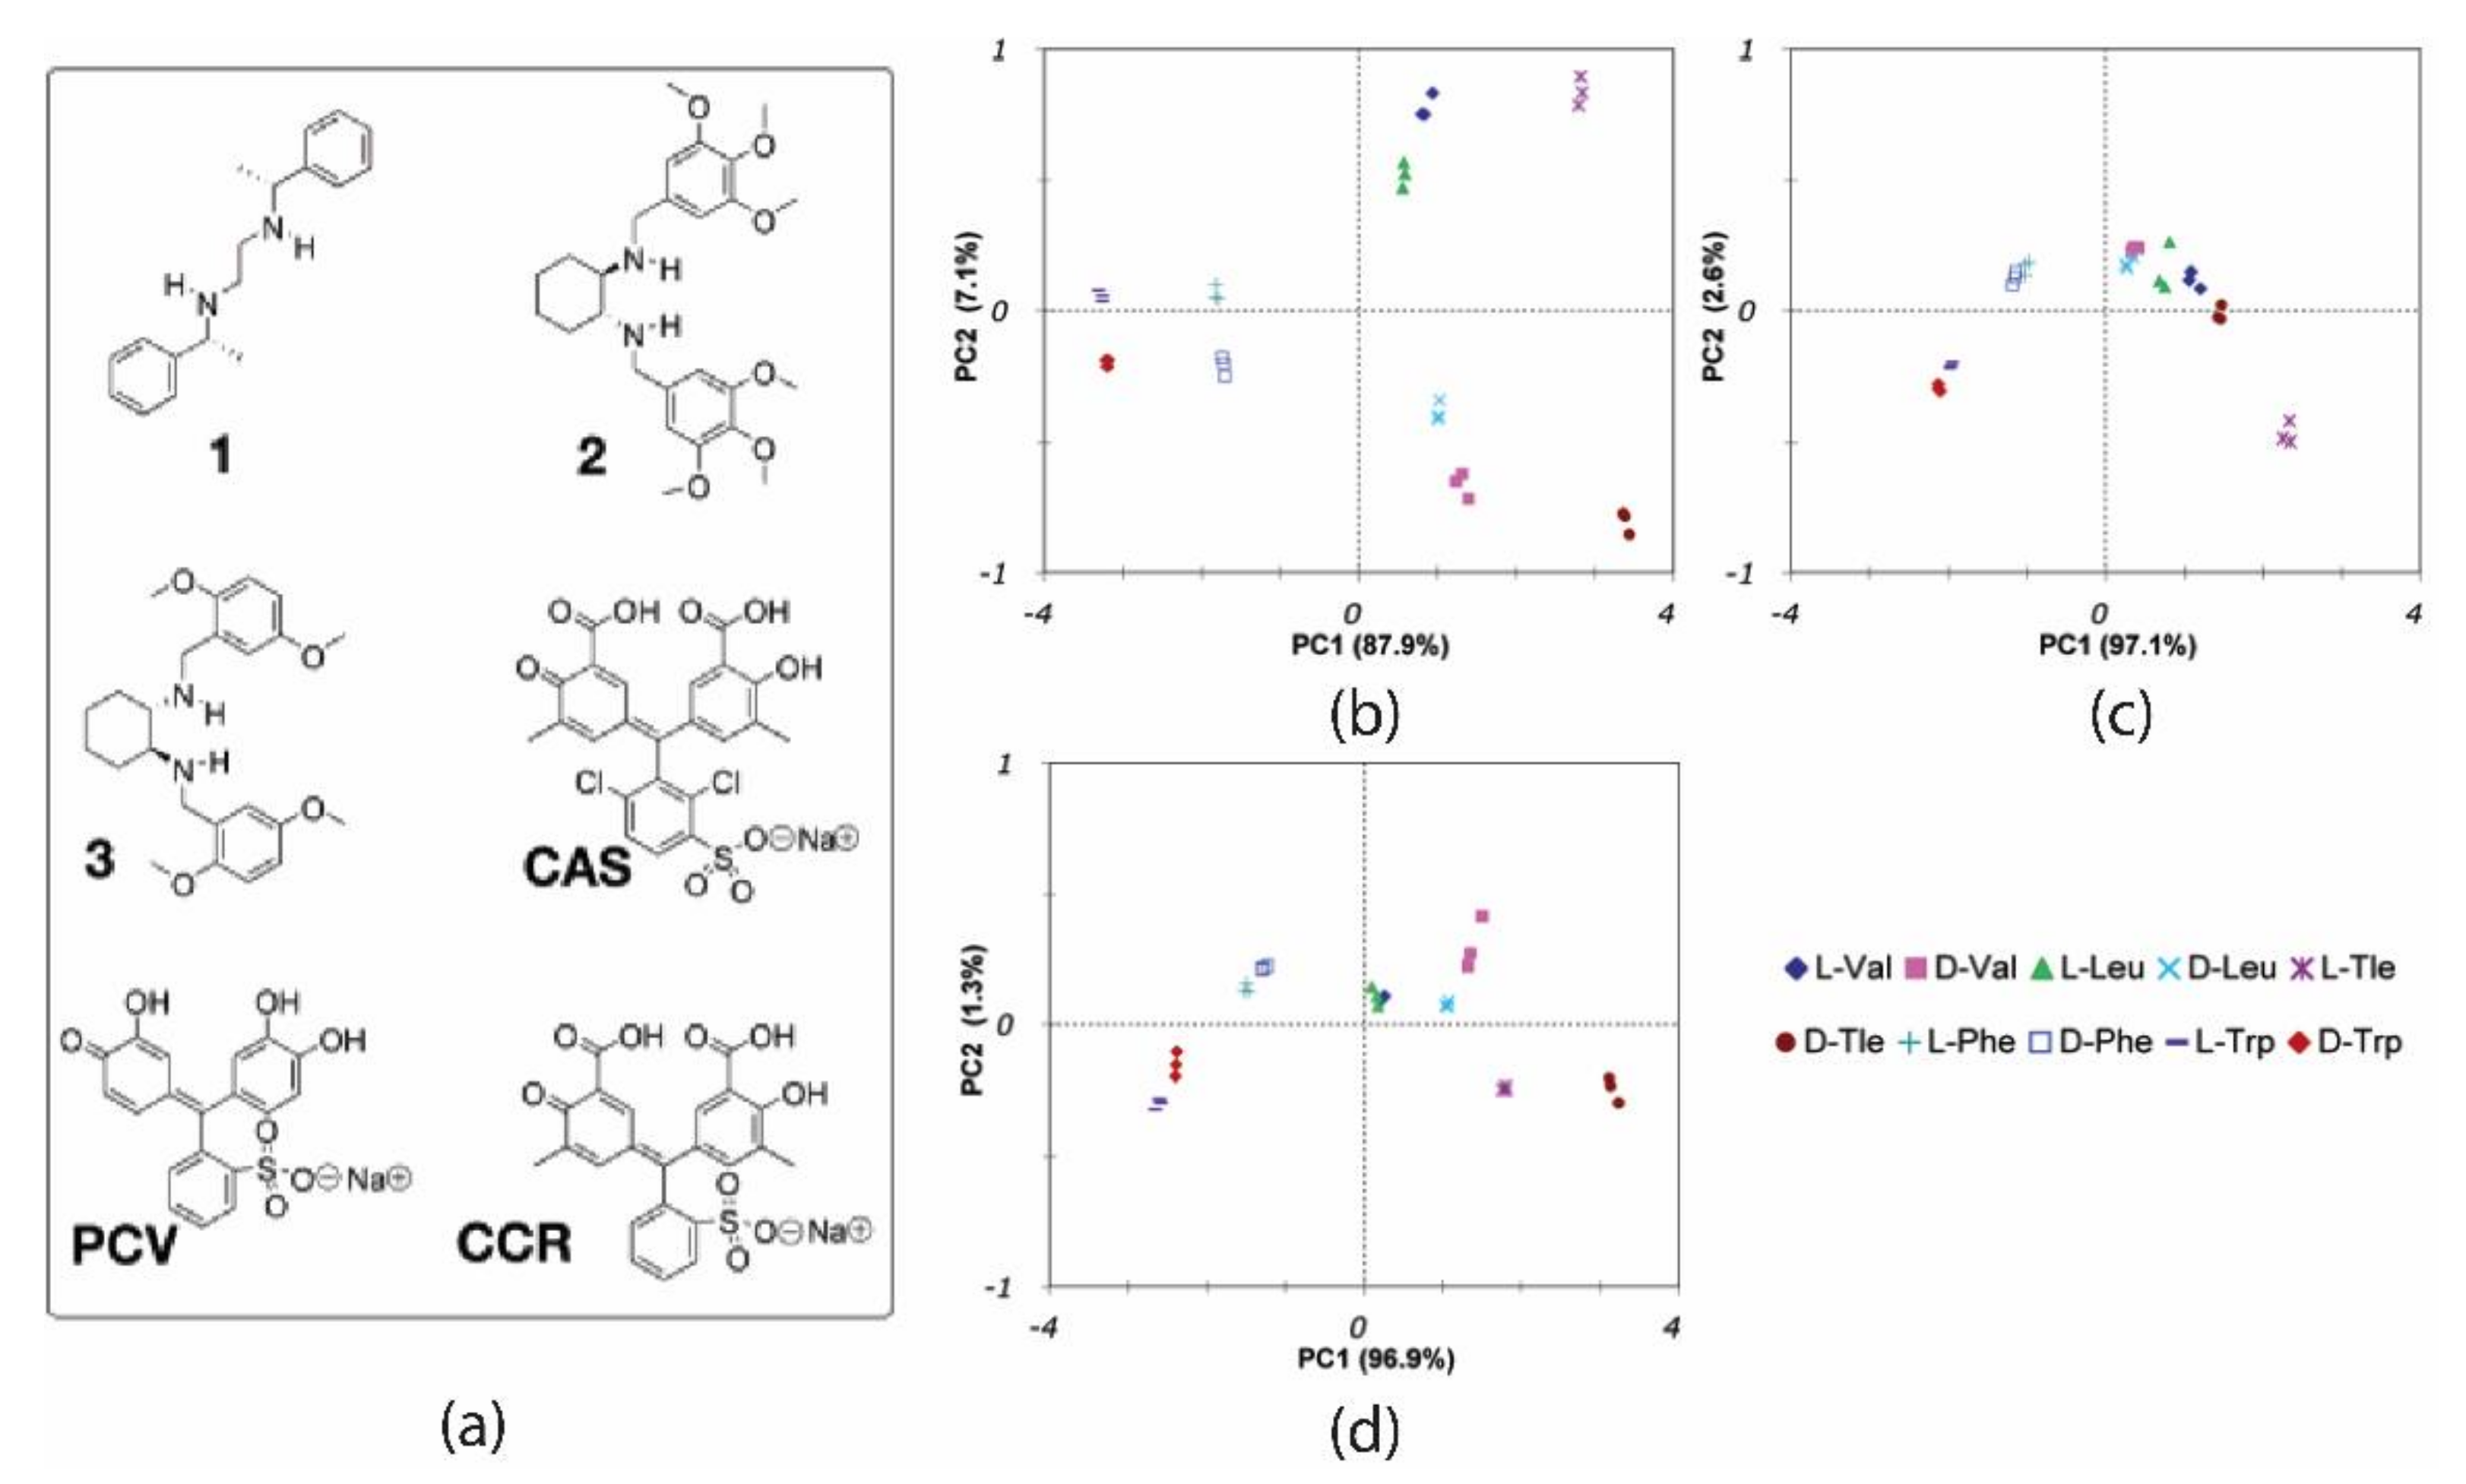
In 2006, Anslyn and coworkers reported an enantioselective array made of colorimetric sensors using indicator displacement assays (IDAs) to differentiate hydrophobic
R-amino acids [
39]. The array was organized by combining various indicators (CAS, PCV, CCR) and the Cu complexes of chiral receptors (
1,
2, and
3) (
Figure 7a) and using multi-well plate spectroscopy to measure the absorbance spectral shifts upon aminoacid-Cu binding. D/L forms of five amino acids (Leu, Val, Trp, Phe, and Tle) were examined, giving a total of 10 analytes tested.
Spectra wavelengths were selected by ANOVA to individuate the most valuable regions to be used for multivariate analysis. The resulting features were analyzed by PCA, giving the score plot shown in
Figure 7b. Considering the first two components, a good spatial resolution between all the clusters is evident, with the aliphatic amino acids (Leu, Val, Tle) clearly separated. It is important to note that all amino acids are chemically differentiated along PC1 (except for valine and leucine). At the same time, the chiral information is expressed along PC2, where negative and positive scores are shown for D- and L-amino acids, respectively. It is worth noting that using one of two concentrations for analytes surely helps the separation with this technique.
Considering the enantiomer directions (the line connecting clusters and the origin of axes), the orthogonality of amino acid isomers in the PCA plot results from having indicators with opposite enantiomeric preferences. Afterward, the authors investigated the contribution of different sensors, splitting the dataset into two subsets comprising only of indicators of a single enantiomeric preference. In this case, the relevant information can be synthesized by a single principal component (PC1) bearing both the chemical and enantiomeric information about samples. In this case, PC1 tends to separate enantiomers of amino acids in the positive and negative regions without establishing a chemoselective or enantioselective sequence determined by receptor preference (i.e., preferred enantiomer assigned lower PC1 score). In this case, the removal of oppositely biased enantiosensors, strongly affects the recognition capability of the array.
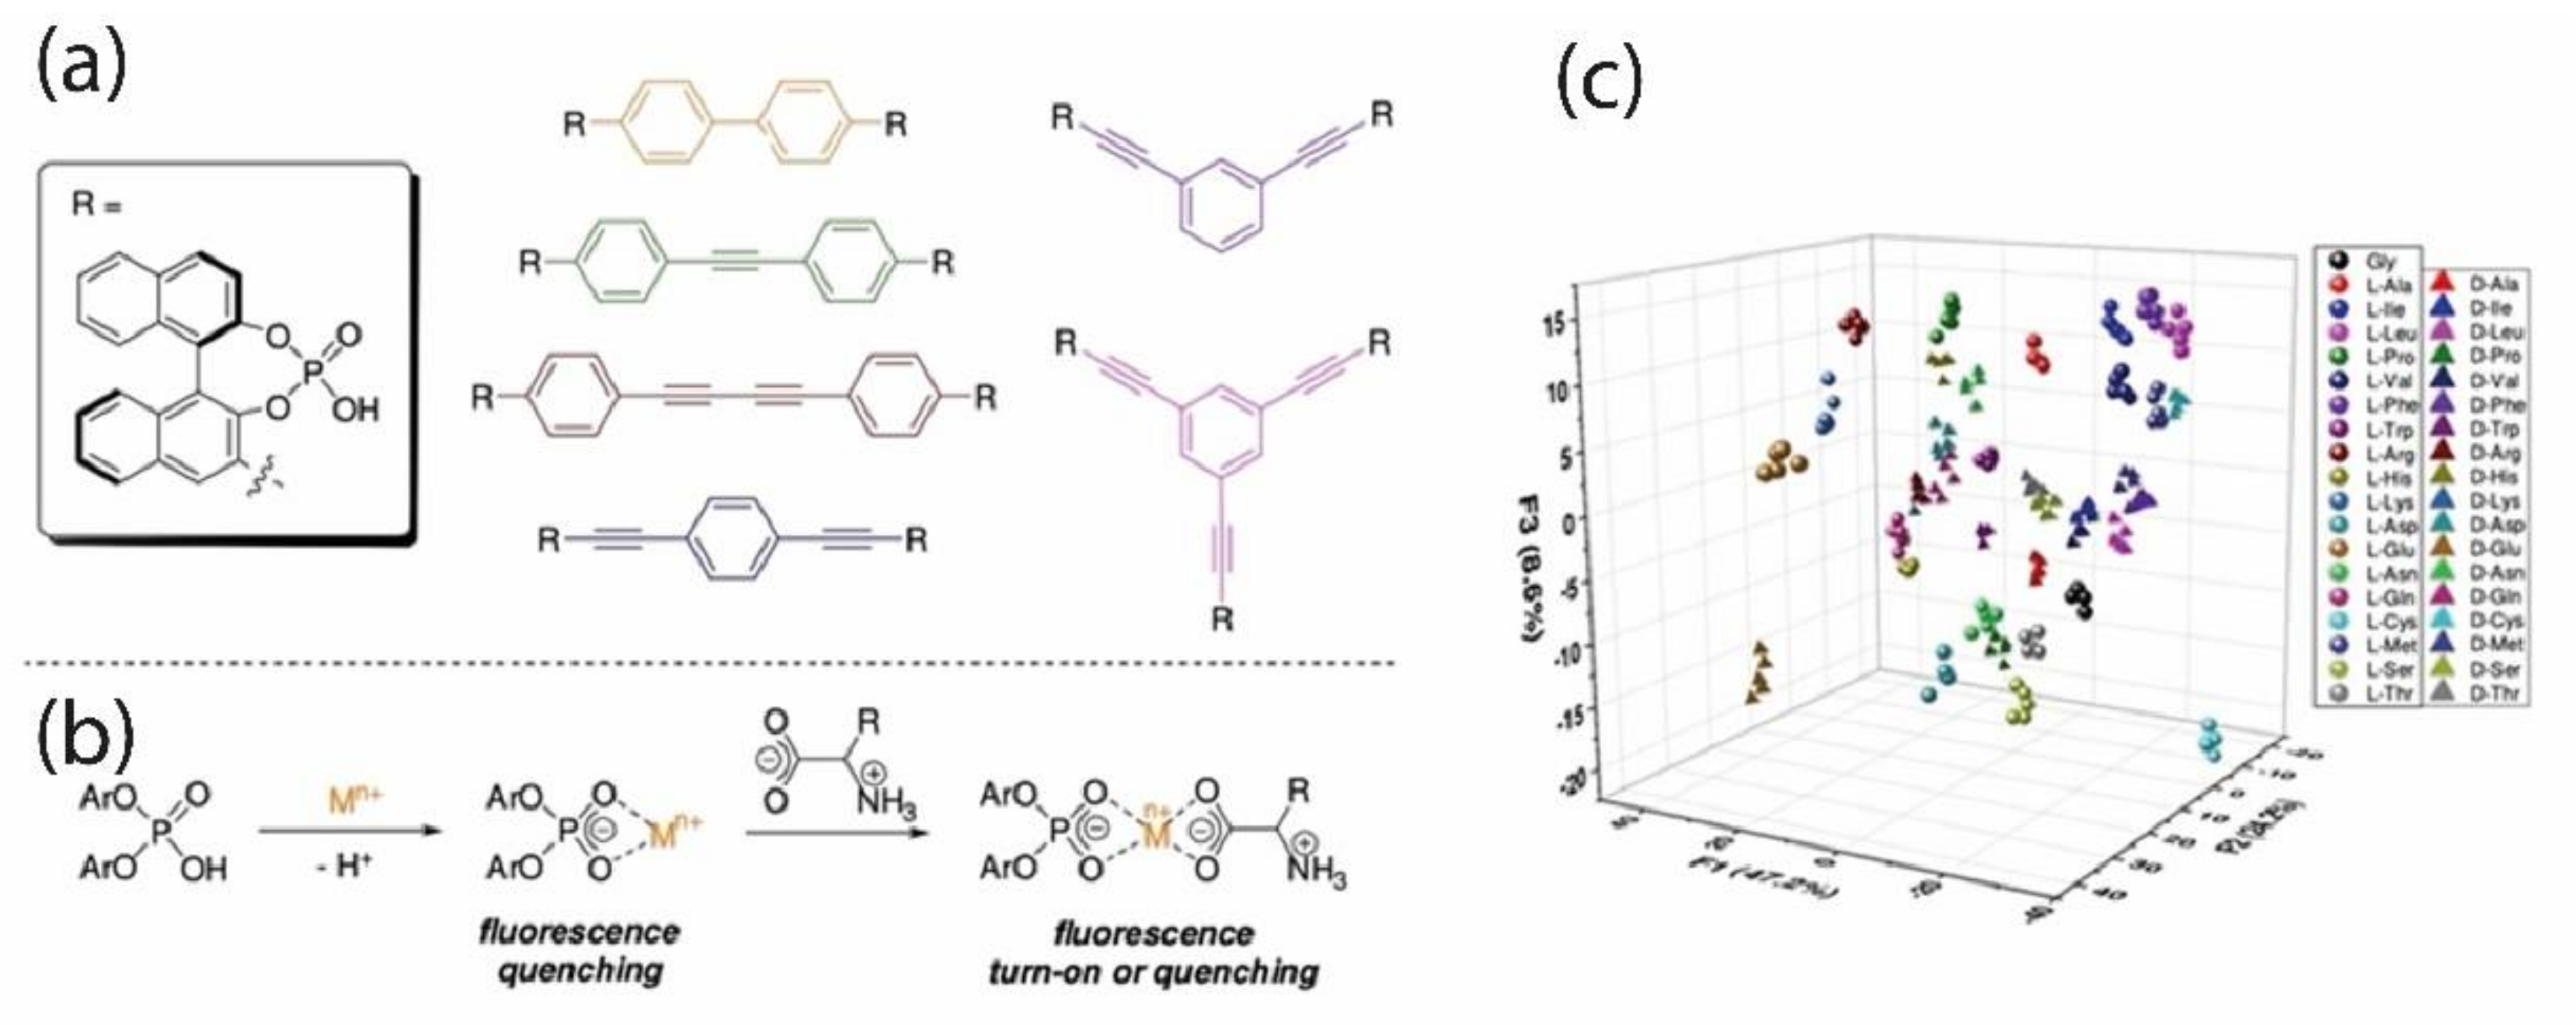
Niemeyer et al. [
40] reported a system based on the turn-on/turn-off phenomenon of luminescent chiral phosphoric acids (
Figure 8a), where emission is quenched by the interaction with Eu
3+ and Ni
2+ metal ions. Since water induces sensitive material aggregation, lowering the luminescence, experiments were conducted in acetonitrile. In CH
3CN, the emission is turned off when metal ions coordinate the phosphoric acid units. Under this condition, the subsequent addition of amino acids further affects emissions depending on the specific amino acid used.
Several hypotheses on the supramolecular interaction mechanism have been postulated to explain the observed emission variations, the most plausible one suggesting the formation of a ternary complex where metal ion is bound to both chiral phosphoric acid and amino acids (
Figure 8b). Unfortunately, no crystallographic evidence of this complex was obtained to corroborate this hypothesis.
Chemometric analysis of fluorescence changes by PCA and LDA (Linear Discriminant Analysis) techniques afforded a well-defined spatial resolution for L-amino acids and glycine, with 100% of correct analytes identification. Good results for the discrimination of L-amino acids and the enantiomeric recognition were still obtained by decreasing the number of parameters (i.e., number of chiral phosphoric acids, wavelength emission, and the number of measurements) (
Figure 8c). The scores plot for the overall mixture shows well-separated clusters, and in case of classification, the mismatched assignments were due to enantiomers exchange rather than amino acid improper identification. In particular, the most common mistake concerns histidine. Presumably, the interaction between analyte and chiral unit is sorely weakened by the strong binding of the amino acid to the ion, resulting in a loss of the stereochemical selection.
In addition to amino acids, chiral recognition may also be important for the discrimination of bigger macromolecules composed of peptides and carbohydrates, such as peptidoglycans (PGs) or linear polymers of glycans cross-linked by short peptides. Since this class of molecules is involved in constructing the bacteria cell wall, identifying amino acids in the peptide fragment allows the determination of both the bacterial species and the growth phase.
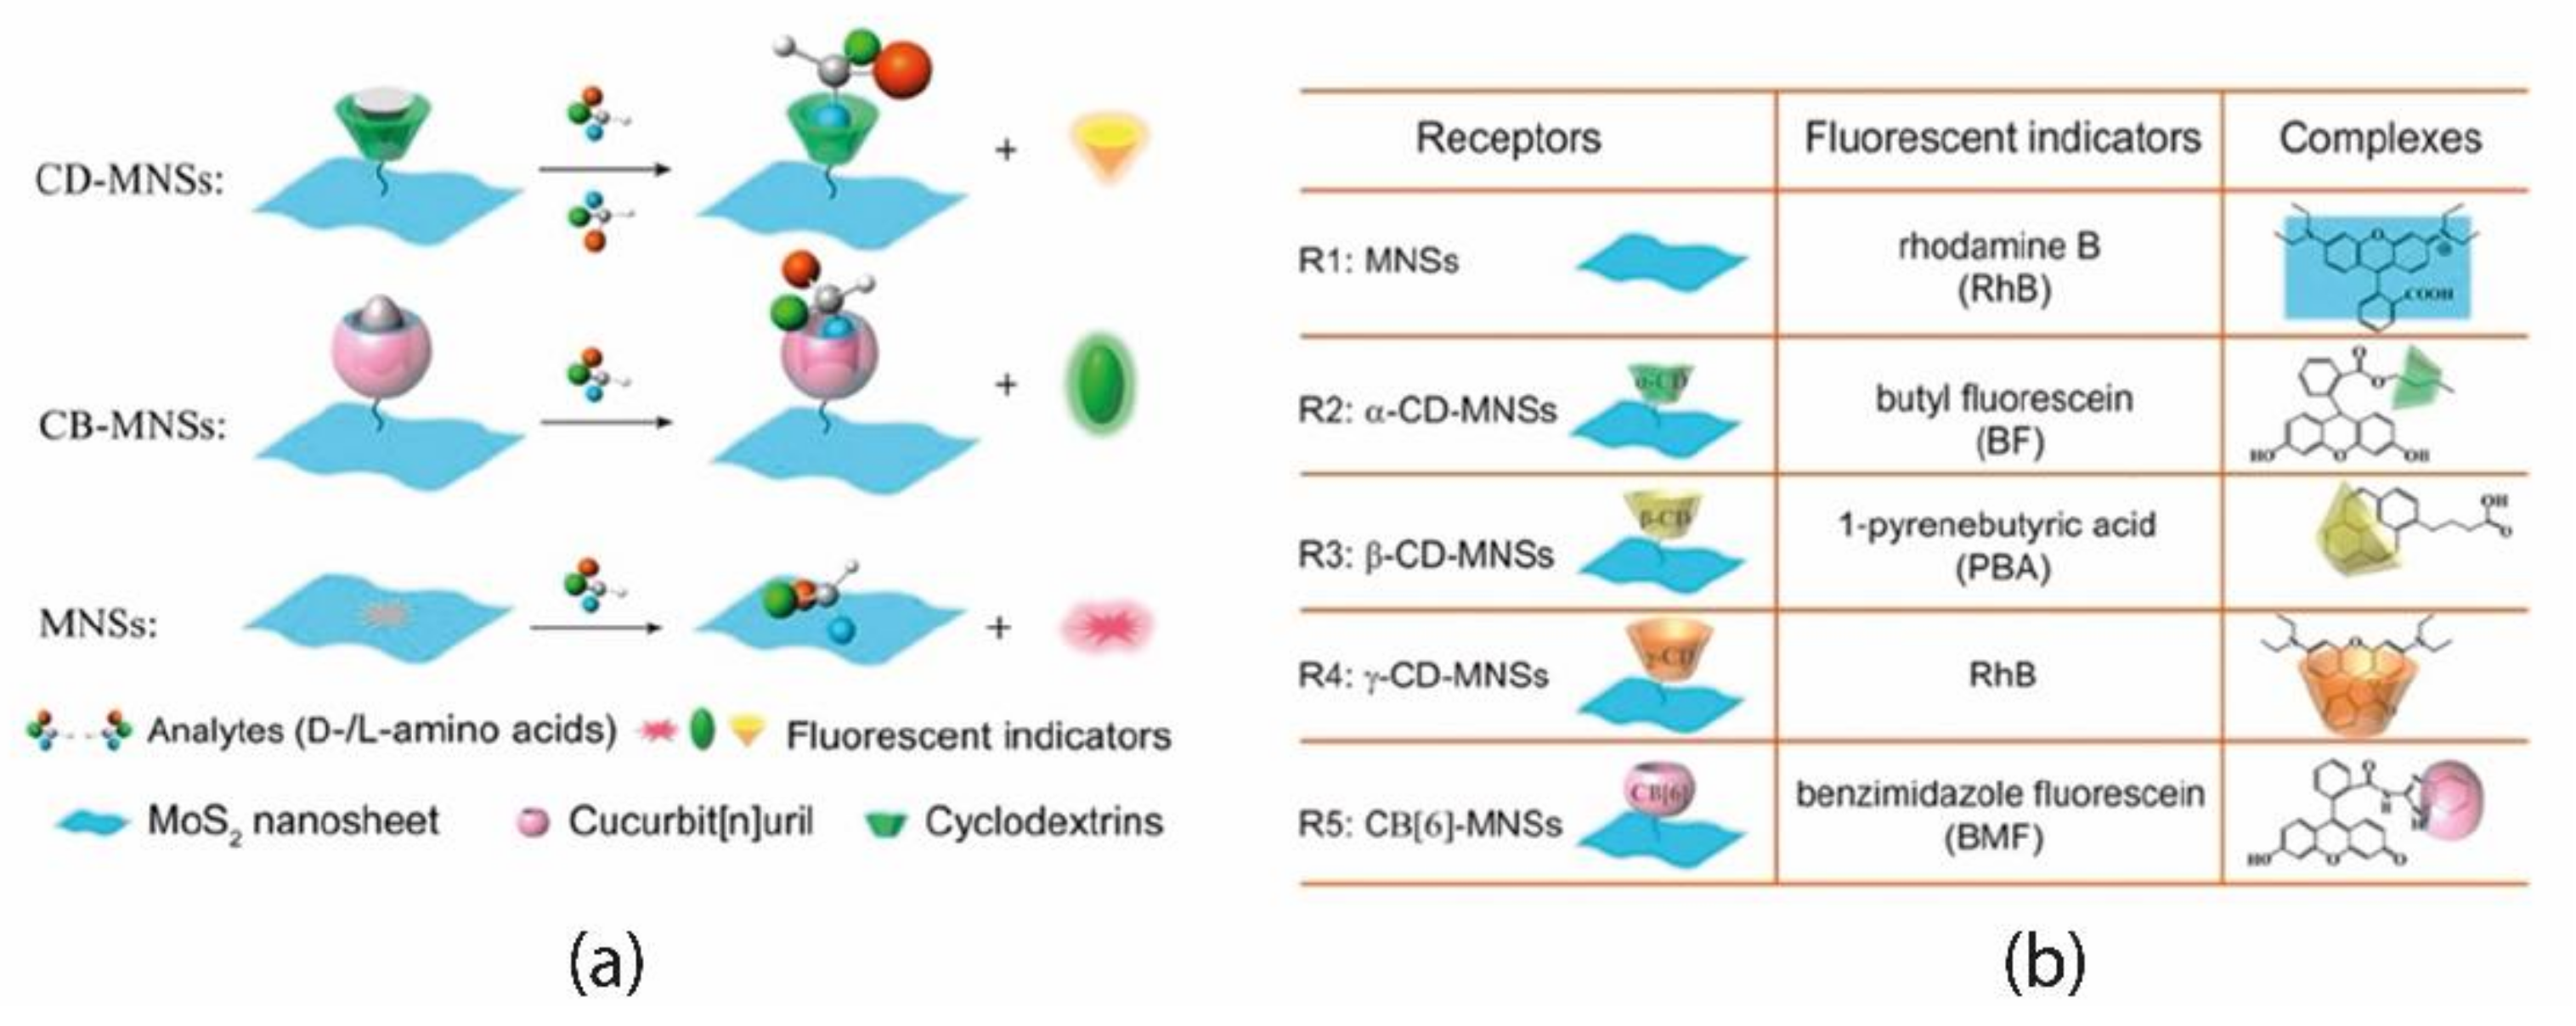
Wei et al. [
41] reported the preparation of a sensor array where analyte recognition occurs by multitype of host-guest interactions. Here, a 2D nanosheet of MoS
2 (MNS) was chosen as a scaffold to quench luminescence, allowing for transducing the recognition events into a fluorescence on/off phenomenon. Other factors triggered the interest for Mo-based nanosheets, such as the high specific surface area and the ready formation of Mo-S bond to anchor organic receptors. In addition, pristine MoS
2 could also work as a receptor. MoS
2 surface was functionalized with three cyclodextrins and one cucurbit[
n]uril moiety, chosen for their potential to discriminate analytes based on their polarity, size, and hydrophobic or H-bond forming subunits (
Figure 9b).
All the receptors were “pre-loaded” with small chromophores, corresponding to the “off state” (MoS
2 acts as a quencher). Fluorescent indicators are displaced after interaction and recognition of the analyte, turning the sensor into the “on state” (
Figure 9a); each analyte produces a distinct fluorescence variation pattern, which is the basis of the target molecule identification. A distinctive aspect of this system is that the initial concentration of receptors was chosen to decrease only partially the fluorescence (by 50–70%), preventing the complete turn-off status. In such a way, it is possible to reveal when emission rises or, eventually, when it lowers due to some chemical environment variation.
Preliminary analyses to assess amino acid enantiodiscrimination gave good results: LDA data processing highlighted the possibility of distinguishing the amino acids in a mixture of 39 compounds (enantiomers for 19 amino acids and glycine) since no overlapping among their signals occurs. The authors suggest that the cavity of receptors recognize the stereochemical information of the analyte by H-bond or as subtle variations of hydrophobic effects meaning that receptors bind each analyte with different affinity.
Afterward, the effectiveness of the sensor array to quantify D-Phe in a mixture of five amino acids (chosen among the most common components of bacterial peptidoglycans) was tested. Different concentrations of D-Phe were totally discriminated up to 8 μM.
In a more complex mixture simulating PGs composition, recognition ability was maintained; results obtained by emission variation were in agreement–in terms of peptidoglycans discriminations–with HPLC analysis, suggesting that this system could be used to monitor the growth of different bacterial populations.
Glycosaminoglycans (GAGs) are polymeric carbohydrates involved in many biological functions such as cell–cell signaling or microbial infections. Their biological activity is affected by small changes in glycosaminoglycan structure. Except for commonly used analytical techniques such as HPLC and mass spectrometry, there are no other methodologies to analyze this wide family of biomolecules.
A rare literature example reported by Rotello et al. described an analytic approach mimicking the human sense of smell, based on selective rather than specific array of sensors for the recognition of a series of glycosaminoglycans differing in size, charge, chirality, and number/position of -SO
3− and acetyl groups [
42]. Positively charged gold nanoparticles have been chosen as receptors and negatively charged fluorescent polymers as transducers. Luminescence of the organic polymer, quenched by electrostatic interactions with Au nanoparticles (AuNPs), can be turned on by the competitive binding of analytes towards AuNPs that displace the polymer, thus restoring the emission. The affinity between AuNPs and GAGs, based on the nanoparticle surface chemistry and the chemical properties of the analytes, strongly affects polymer release and thus fluorescence magnitude. To maximize the response even with small changes on AuNPs surface, large polymers were chosen to have a small AuNPs–polymer ratio and large fluorescence variation. Chemometric analysis (HCA, i.e., Hierarchical Clustering, LDA and PCA techniques) yielded a clear differentiation of negative molecules, while positive and neutral GAGs clustered together. The best results were obtained by AuNPs functionalized with aromatic units, ascribable to a higher tendency to establish π–dipole interactions, corroborating the hypothesis that charge is the main factor implicated in identification. Regarding the chiral discrimination offered by this system, authors reported that the two forms of chondroitin sulfate tested (epimers) have been satisfactorily identified and separated, as evidenced in the LDA score plot reported. The developed array was able to detect GAGs with both significant and slight structural changes, and of both charged and epimeric nature, respectively.
To conclude this section, we report an example of chiral discrimination based on bioassay.
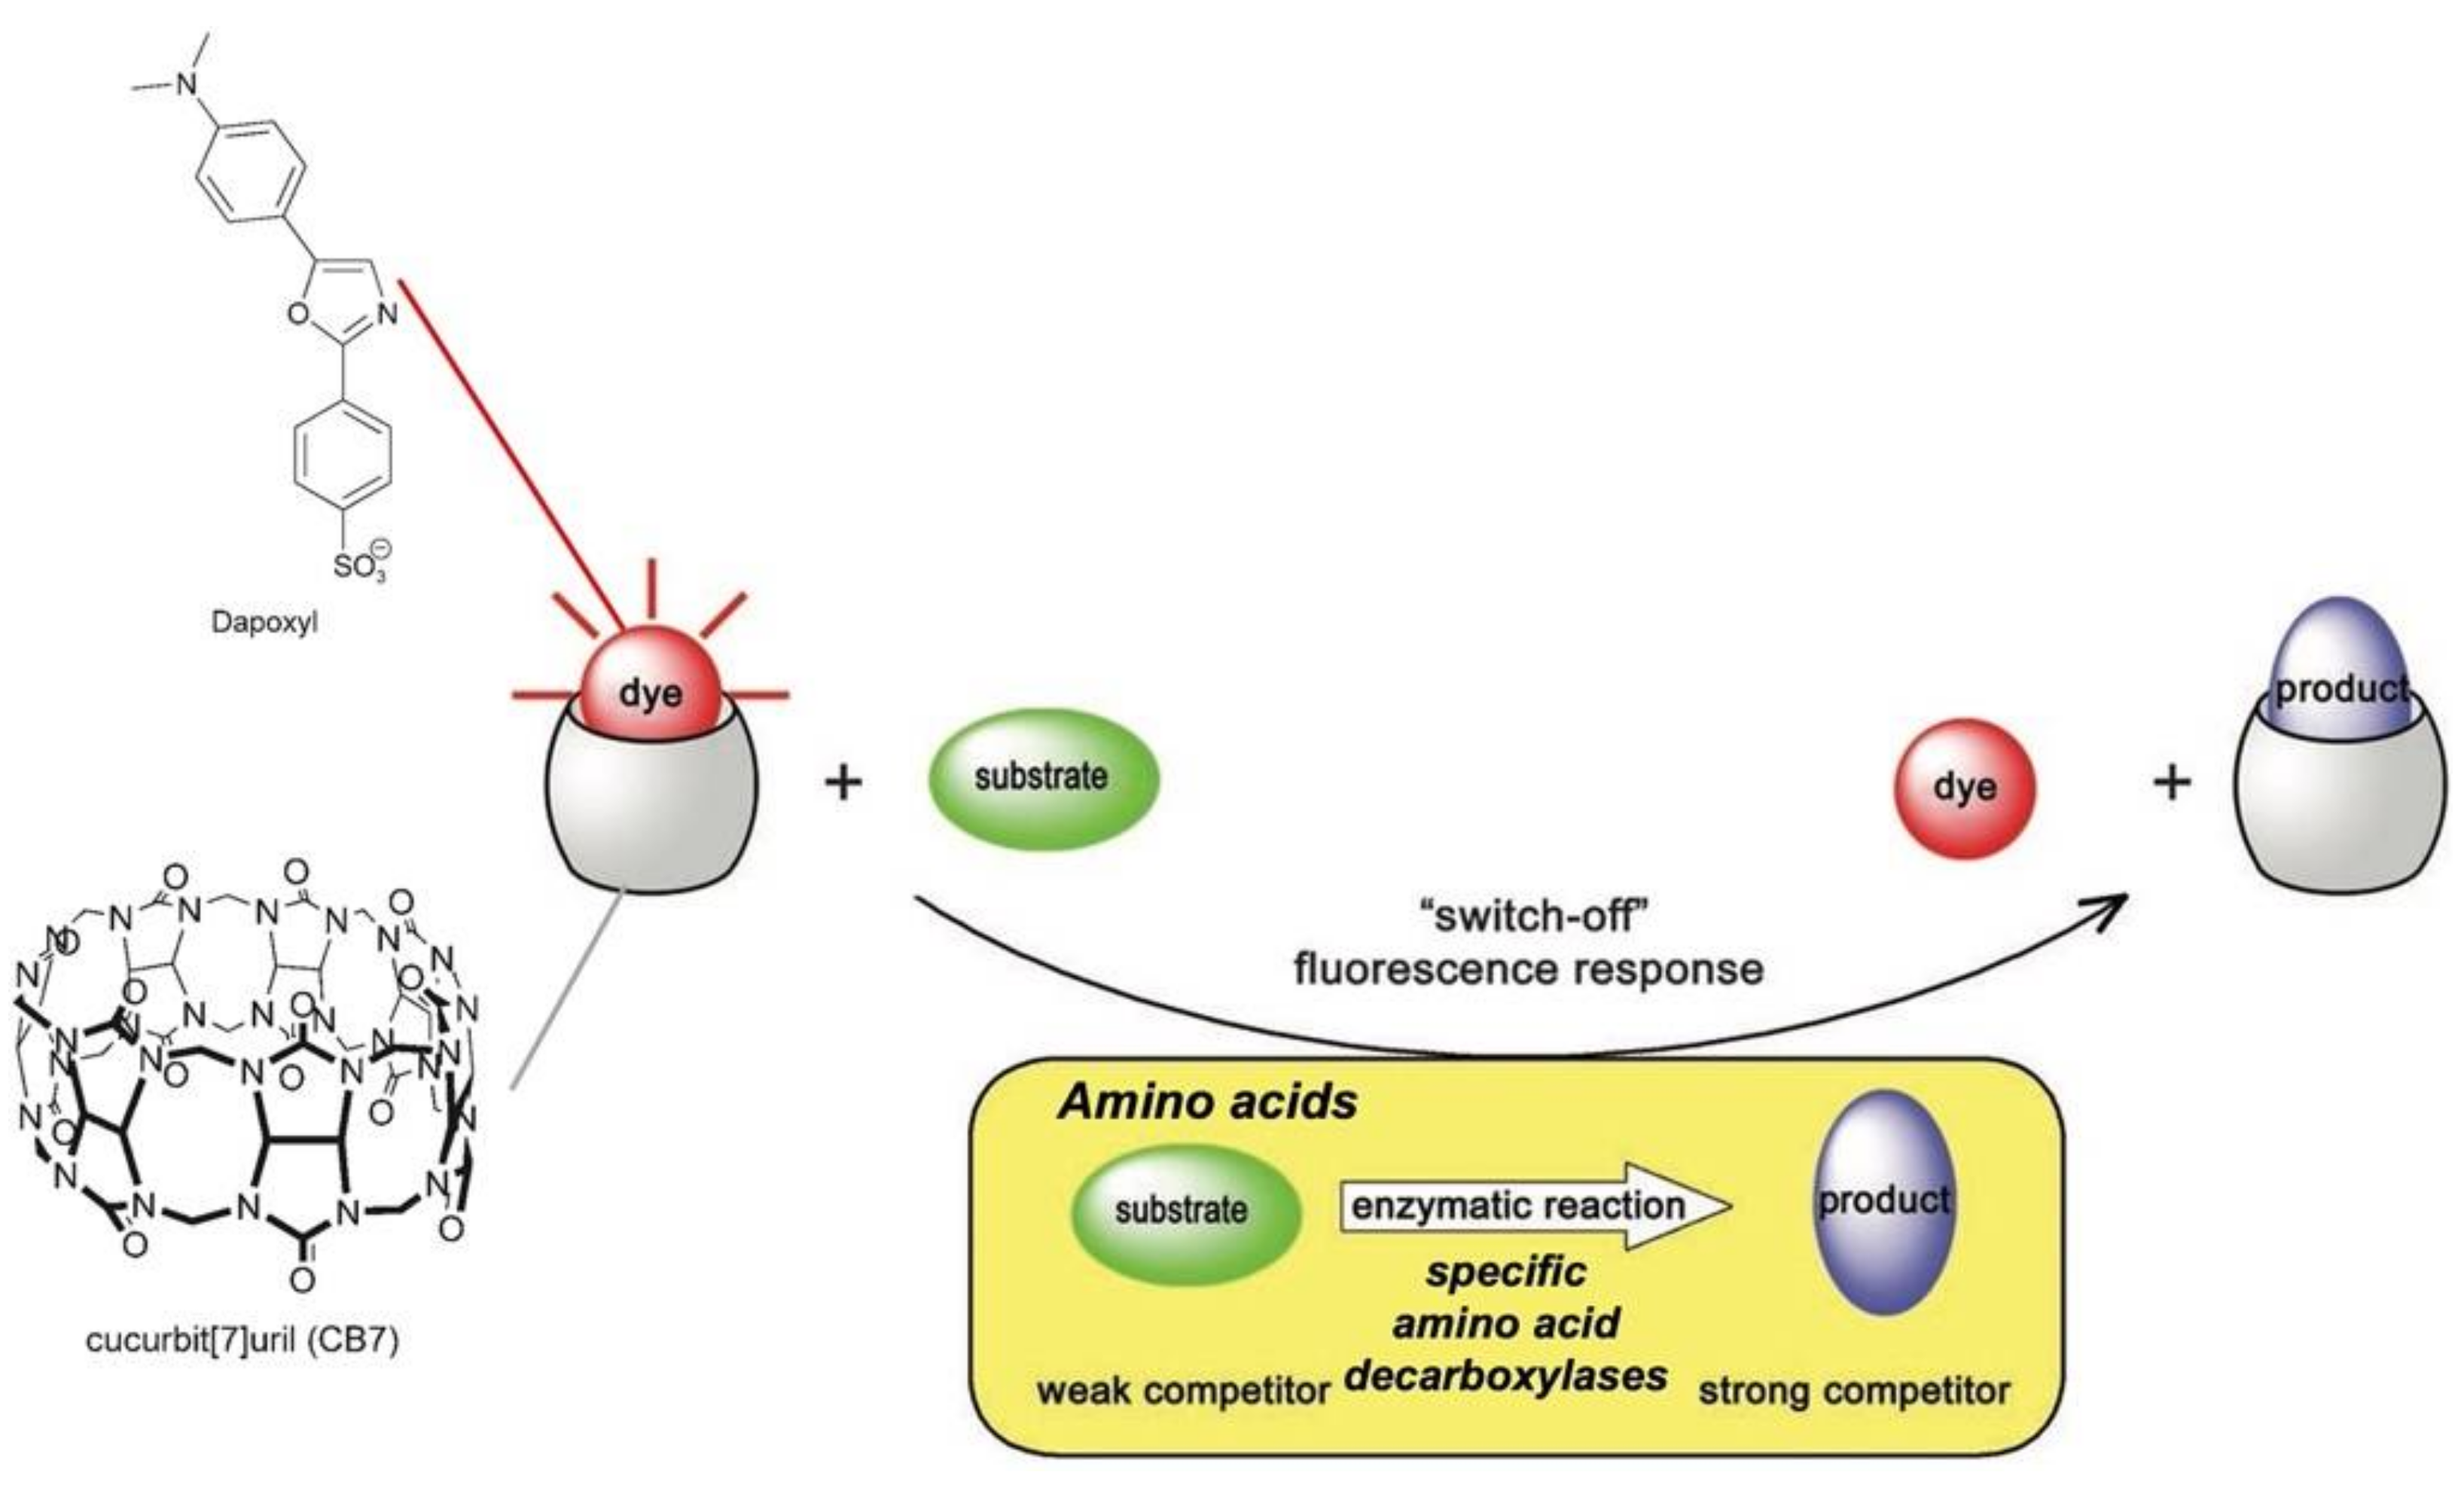
Nau and coworkers reported years ago a nice example of supramolecular tandem enzyme assays based on IDA strategy for multiparameter sensor arrays and enantiomeric excess determination of amino acids [
43]. The working principle of the “switch-off” product-coupled tandem assay is depicted in
Figure 10.
The assay utilizes the competition between the fluorescent dye Dapoxyl and the decarboxylated product of the enzymatic reaction for CB7 binding. Amino acids are weaker competitors for the CB cavity in comparison with the dye, while the corresponding decarboxylated products formed by the specific enzyme used are stronger: consequently, the following dye displacement from CB7@Dapoxyl adduct occurs during the enzymatic reaction, causing a decreasing of the Dapoxyl fluorescence (it shows a fluorescence intensity in its CB7 complex that is up to 200 times stronger). This CB7@Dapoxyl reporter pair was exploited by the authors to arrange a multiparameter sensor array able to detect either the presence and absolute concentration of a particular amino acid or its respective decarboxylase with μM sensitiviy. It is important to underline that the macrocyclic host possesses a low selectivity towards both the four selected amino acids or their enzymatic products. Nevertheless, the selective sensing is assured by the presence of decarboxylase that specifically produces compounds that cause the displacement of the dye and the following fluorescence variation. Of course, the developed method is specific for L-amino acids, and thus the authors applied the same assay to determine the enantiomeric excess of mixtures of D/L-amino acid within an extremely high range (up to 99.98%)–particularly for lysine. This latter parameter is extremely important in many applications, so several sensing systems have been finalized to measure it, with some of them reported in the following section.
5. Determination of Enantiomeric Excess (ee) by Sensor Arrays
Enantiomeric excess (optical purity) of a chiral substance indicates how much one enantiomer is in excess with respect to the other in a racemic mixture. This value is generally expressed as the following percentage:
It reflects the purity of a chiral compound obtained by asymmetric synthetic procedures that are optimized for obtaining the highest
ee value. This calculation needs the separation/differentiation of the enantiomers by means of a chiral environment traditionally offered by chiral chromatographic techniques. Faster and more convenient methods are constantly developed for supporting synthesis, the most being optical high-throughput screening (HTS) techniques [
44]. In contrast to chromatography, optical measurements can indeed be performed in microwell plates and are simple, fast, and easy to be implemented in synthesis protocols. Hence, the development of sensors based on fluorescence, UV-Vis, or circular dichroism is particularly appealing. Currently, their use is mostly focused on the chemicals and pharmaceutical industries, even if the application of the developed sensor platforms in environmental monitoring is likewise envisaged.
Anslyn’s group was one of the pioneers of the development of enantioselective IDAs (eIDA) using chiral receptors signaling the concentration and
ee of a chiral guest by color changes measured by spectroscopic methods [
39,
45,
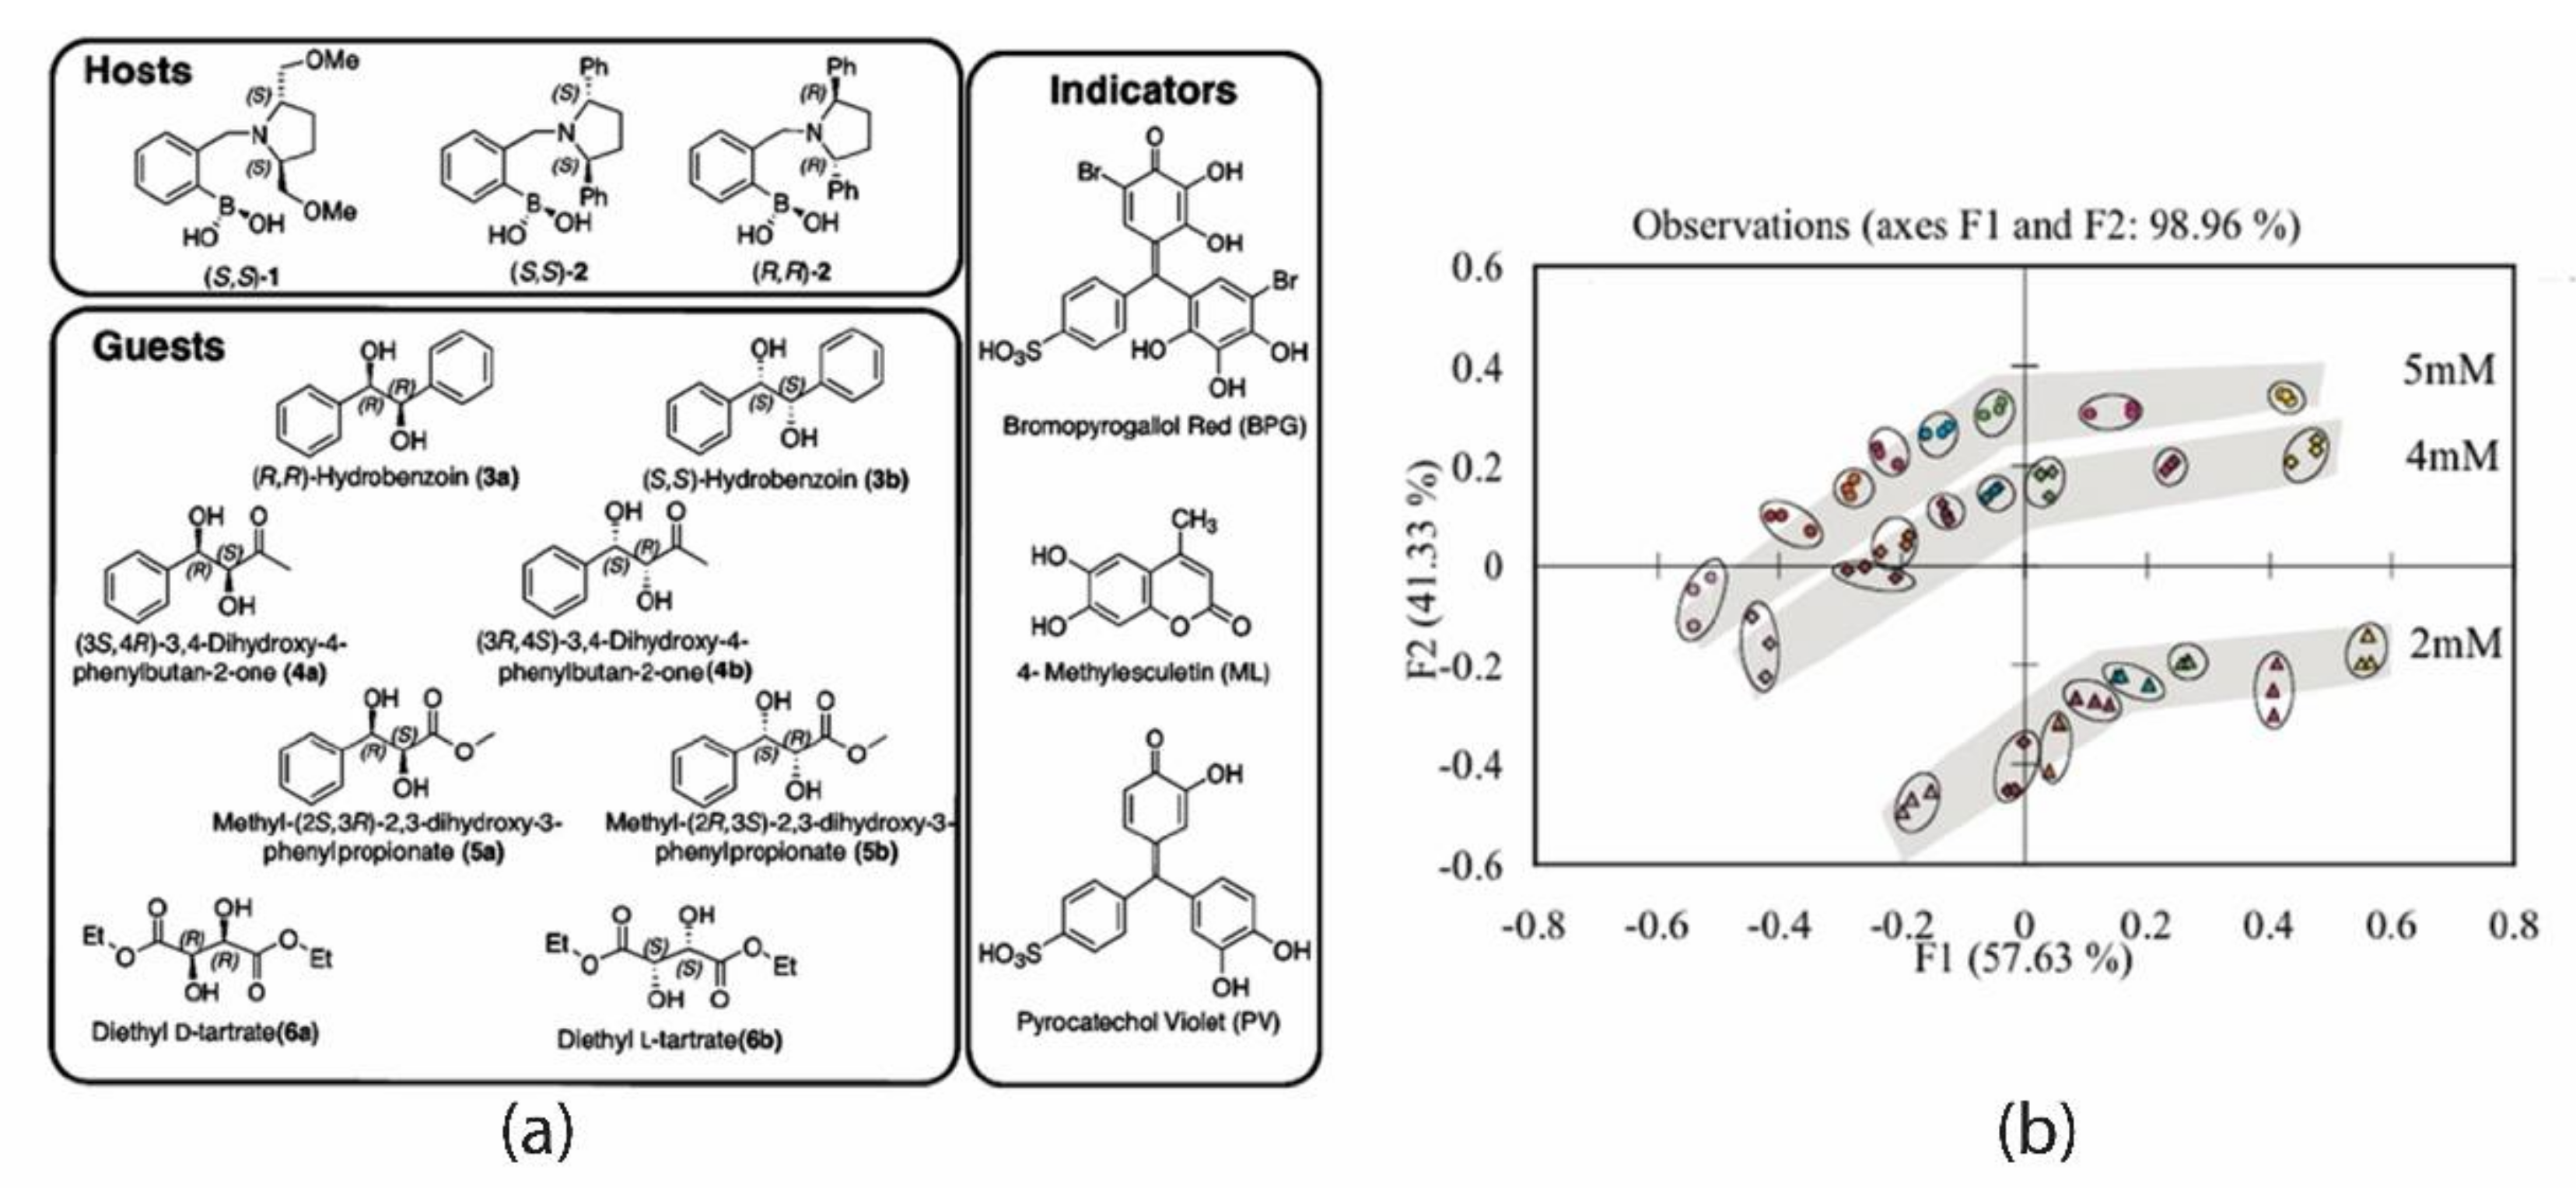
46]. For example, this research group reported the use of chiral boronic acids in a proper combination with pH indicators to arrange a colorimetric sensor array able to rapidly detect vicinal chiral diols having different electron-withdrawing groups (
Figure 11a) [
46]. An initial screening on the proper matching of receptors and indicators was performed to select those best able to enantio-differentiate the chiral diols. Then, three combinations were chosen–namely (
S,
S)-1-PV, (
R,
R)-2-ML, and (
S,
S)-2-PV, considered optimal for outlining the fingerprinting of each diol tested.
Spectra of each diol at 5 mM concentration were recorded and analyzed at nine different wavelengths: 496, 500, and 516 nm for (
S,S)-1-PV, 362, 366, and 374 nm for (
R,R)-2-ML, and 496, 500, and 516 nm for (
S,S)-2-PV. Data were processed by the XLSTAT computer program, affording a PCA plot showing that the array could excellently discriminate all the diols tested, graphically differentiating their enantiomeric forms.
Figure 11b reports the determination of analyte concentrations and
ee in the case of diol 5, by an array composed of three specific host-indicator combinations–namely 1-BPG, 2-ML, and 2-PV.
Titrations of 5 at three different concentrations (2, 4, and 5 mM) and eight different ee values (−1.0, −0.6, −0.2, 0, 0.2, 0.4, 0.6, and 1.0, with 1.0 and −1.0 correspond to 100% 5a and 5b, respectively) were performed, and the corresponding PCA plot gave good spatial resolution, clustering identical samples. Furthermore, samples with different ee values at a given concentration were highlighted by gray curves in the plot. ee values are from +1 to −1, from left to right, respectively.
Further, the authors generated an artificial neural network (ANN) to analyze samples of unknown concentrations and ee values. Network predictions allowed for the accurate determination of these parameters for five samples with an average absolute error of ±0.08 mM and 3.6% in concentration and ee, respectively.
Anzenbacher’s group was also actively focused on the development of fluorescence-based assay for determining enantiomeric excess of different classes of chiral analytes, such as diols, aminoalchools [
47], amines [
47,
48], amino acids [
48], and carboxylic acids [
49].
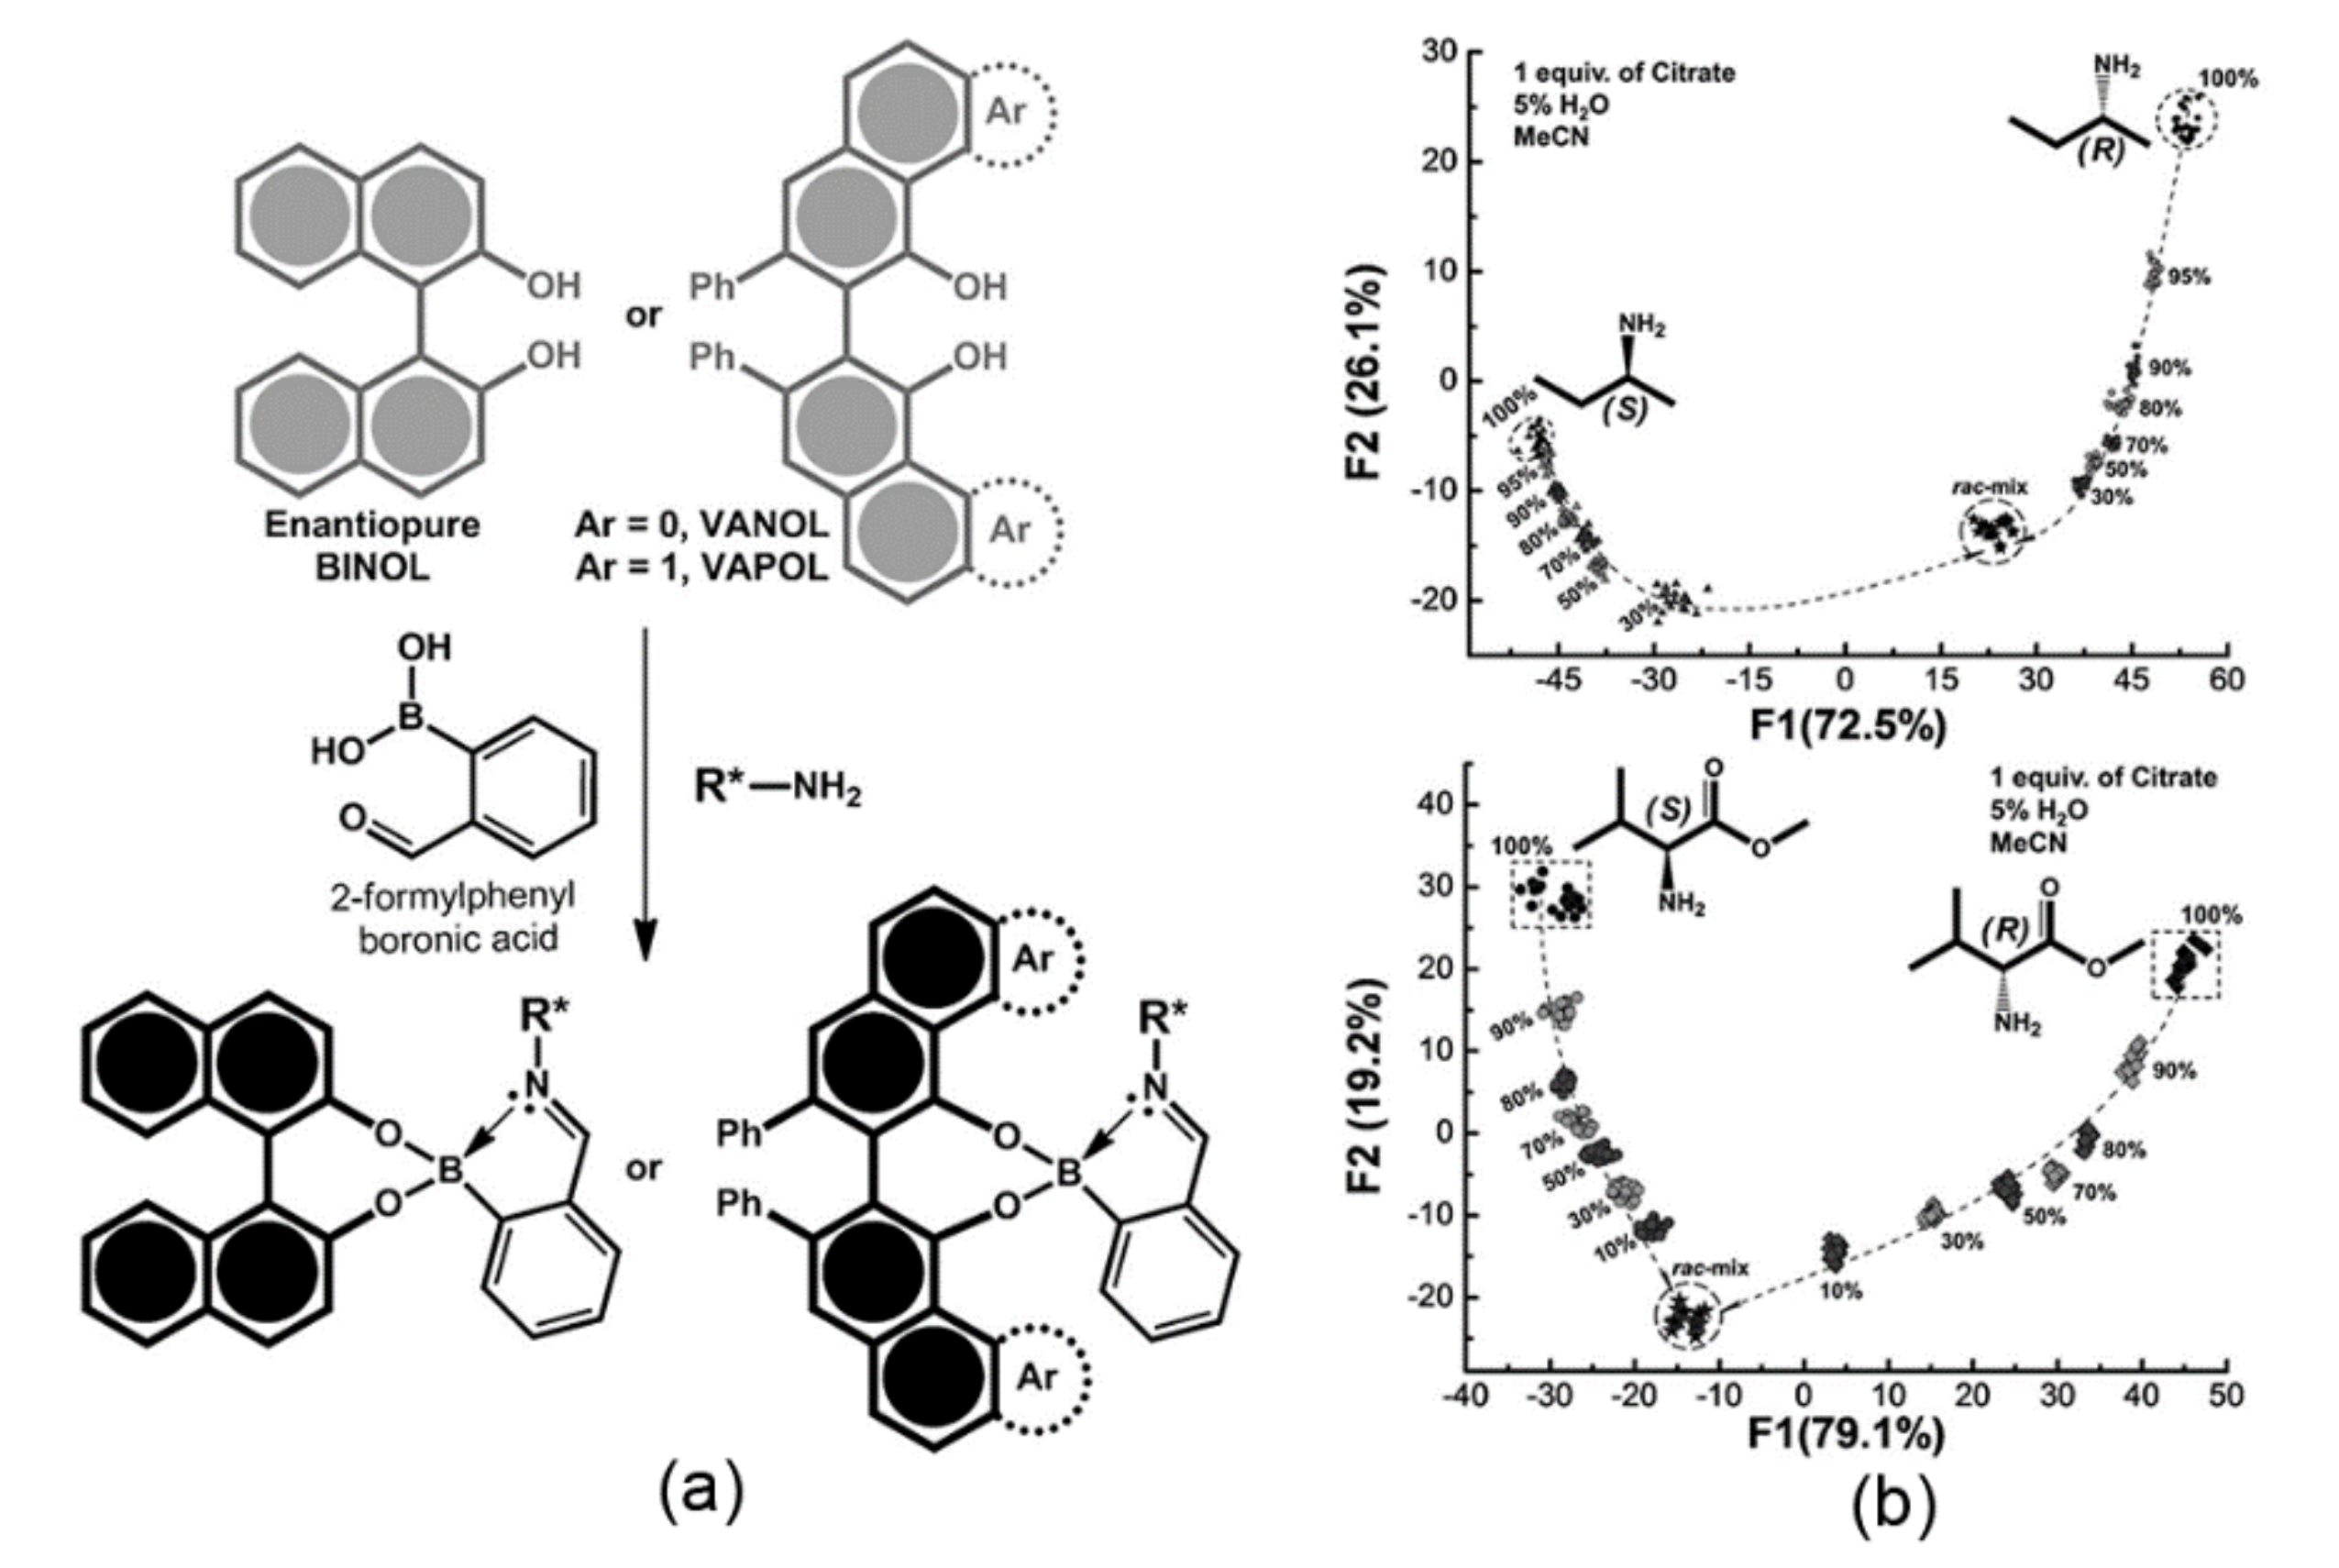
In particular, in Ref. [
48], the authors proposed a screening approach for enantiomeric excess of amine derivatives in the presence of water. A fluorescent system was realized by self-assembly of BINOL, VANOL, and VAPOL with 2-formylphenylboronic acid and chiral amines forming iminoboronate esters (
Figure 12a). Notably, both the chemical and enantiomer nature of amines influence the stability of aggregates that, in turn, display differential fluorescence. Thus, the emission signal correlates with the enantiomeric excess of the chiral amines. The first characterization concerned a qualitative analysis utilizing the differences in emission by means of LDA. This method is a supervised classification algorithm pattern recognition method that compresses data dimensions and finds the plane or reduced space that maximizes data separability. Furthermore, the cross-validation demonstrates the possibility of correctly classifying all 23 samples belonging to the 11 enantiomeric pairs of analytes and the control. In the next step, the authors utilized data from semi-quantitative experiments to check the possibility of determining the enantiomeric purity of analytes with varying ratios of
R/S enantiomers of 2-aminobutane and valine methyl ester samples (
Figure 12b). Finally, the authors proved that the Support Vector Machine (SVM) model could correctly classify the enantiomeric compositions of all samples in a study case that utilized 13 samples for calibration and two samples to predict unknown enantiomeric compositions with an RMSE lower than 1.9%.
Finally, the same group has reported the use of several cinchona alkaloid salts as fluorescent sensors for the
ee determination of a series of chiral carboxylic acids of pharmaceutical interest as the non-steroidal anti-inflammatory drugs (NSAIDs) ibuprofen, ketoprofen, and naproxen [
49]. Four properly selected receptors were dissolved in a polyurethane hydrogel matrix and the resulting hydrogel-sensor blends have been printed onto multi-well glass chips and used for quantitative analysis of
ee by acquiring the fluorescence images using a UV scanner. Data were analyzed by LDA, showing a clear cluster separation and 100% correct classification of the single values of
ee for the three NSAIDs tested. Furthermore, the use of SVM algorithm allowed the quantitative determination of
ee of unknown samples.


 ,
, 

