Article

Multi-Drone 3D Building Reconstruction Method

Faculty of Computer Science and Technology, Saint Petersburg Electrotechnical University “LETI”, 197022 Saint Petersburg, Russia
*
Author to whom correspondence should be addressed.
Mathematics 2021, 9(23), 3033; https://doi.org/10.3390/math9233033
Submission received: 12 October 2021 / Revised: 19 November 2021 / Accepted: 23 November 2021 / Published: 26 November 2021
(This article belongs to the Special Issue Application of Mathematical Methods in Artificial Intelligence)

Abstract

:
In the recent decade, the rapid development of drone technologies has made many spatial problems easier to solve, including the problem of 3D reconstruction of large objects. A review of existing solutions has shown that most of the works lack the autonomy of drones because of nonscalable mapping techniques. This paper presents a method for centralized multi-drone 3D reconstruction, which allows performing a data capturing process autonomously and requires drones equipped only with an RGB camera. The essence of the method is a multiagent approach—the control center performs the workload distribution evenly and independently for all drones, allowing simultaneous flights without a high risk of collision. The center continuously receives RGB data from drones and performs each drone localization (using visual odometry estimations) and rough online mapping of the environment (using image descriptors for estimating the distance to the building). The method relies on a set of several user-defined parameters, which allows the tuning of the method for different task-specific requirements such as the number of drones, 3D model detalization, data capturing time, and energy consumption. By numerical experiments, it is shown that method parameters can be estimated by performing a set of computations requiring characteristics of drones and the building that are simple to obtain. Method performance was evaluated by an experiment with virtual building and emulated drone sensors. Experimental evaluation showed that the precision of the chosen algorithms for online localization and mapping is enough to perform simultaneous flights and the amount of captured RGB data is enough for further reconstruction.

1. Introduction

Visual 3D reconstruction aims to restore the 3D structure of the environment or scene from the input of multi-view images based on the theory of stereo vision. Manual capturing of these images are outside the scope of this research, however, drones can be used for automatization of the sensors movement and image capturing. Today, drones can be equipped with an onboard computer, a cellular (LTE) radio, and sophisticated sensors (e.g., cameras, stereo cameras, and LiDAR). Recent estimates put the total market for these drone-based services at USD 63 billion by 2025 [1], with 3D reconstruction, the task of generating a digital 3D model of the environment, accounting for nearly a third of the drone services market [2].
Capturing images of a building automatically with a drone might bring an inconvenience for the people who work in this building i.e., because of the noise of a drone that moves slowly to capture high-resolution images. To speed up the process of 3D reconstruction it is possible to use several drones that are connected to a general network and have a very few crossings of the trajectories.
This research presents a method for centralized automatic multi drone 3D reconstruction of a particular building using low-cost drones (not equipped with more sophisticated CV sensors than RGB cameras). It is assumed that the building has a reasonable size and a drone has a stable connection to a server at every moment. Moreover, it is assumed that the building has a convex form. Convex form means that the building should not be L-shape or U-shape, however, it might contain protruding parts. The novelty of this paper is provided for the formulas that allow to set up parameters of the drones trajectories according to the characteristics of an environment. It allows one to tune the algorithm of 3D reconstruction flexibly for the concrete limitations.
The paper is structured as follows: In Section 2 the state of the art is presented. Section 3 describes in detail the suggested method. Section 4 details the experiments that prove the accuracy of the approach.

2. State of the Art

The goal stated in the Introduction requires building a complex solution, which needs to be able to handle several challenges simultaneously:
  • Workload distribution among drones;
  • Localization and control of each drone;
  • 3D scanning by using only simple drone sensors;
  • Usage of any additional hardware apart from drones and a control server;
  • Automation of the whole process.
In order to use the best practices of existing solutions, a literature review was performed. A preliminary list of papers was formed with a search of Google Scholar by using the queries “multiagent 3d reconstruction” and “drone 3d reconstruction” to find papers. The query “slam 3d reconstruction” was also added to the search because SLAM algorithms are capable of solving both tasks of reconstruction and localization. The papers that were published prior to 2015 were dropped. The resulting list contained 17 papers [3,4,5,6,7,8,9,10,11,12,13,14,15,16,17,18,19], which were filtered by excluding papers that did not comply to at least one of the following requirements:
  • Mention scanning large objects;
  • Mention the usage of several drones;
  • Describe industrial or research reconstruction solutions.
Due to the formulation of the problem task, reviewed papers should be characterized by a set of unified criteria that describe how the main challenges are handled. These criteria can be structured in a form of five questions for each paper:
  • What multiagent approach is used? This question includes subquestions about a workload distribution, a trajectory planning, a collision avoidance, an accuracy, and the speed of the whole process;
  • What localization approach is used?;
  • What 3d reconstruction approach is used?;
  • What is the level of solution automation? This question includes subquestions about prerequisites (including preconfiguration, calibration, building, and teaching models), the need of human attention during the process and abilities for customizing the solution for different objects and environments;
  • What limitations does a solution have? This question addresses the usage of any additional hardware or external spatial markup.

2.1. What Multiagent Approach Is Used?

Systems of a homogeneous architecture (i.e., all drones have the same role) with a centralized control are the most common among all reviewed articles [3,9,10,13,14,15]. A big subset of these solutions [9,10,13,14] organize control by a similar scheme—all drones capture images and/or videos using a predefined set or independent trajectories [9,14], set of predefined waypoints [10] or moving in a stable formation by a single predefined trajectory [13]. However, a more interactive approach is also used. In [15] drones perform the capture of RGB-depth (RGBD) images along with IMU sensor data using non-cooperative active SLAM methods. Ref. [3] builds a statistical model for multi-camera visual 3D reconstruction problem and then proposes a Next Best View (NBV) selection scheme to determine the best camera configuration in active visual 3D reconstruction.
Ref. [4] uses heterogeneous architecture (i.e., drones can have different roles) with a mixture of centralized and distributed control. The master is dynamically chosen among drones. The drones are communicating directly to each other. The workload is distributed evenly between slave drones by dividing the area of interest to sectors.
The authors of [5] suggest considering agents as a graph, with agents placed in nodes and edges, which implies the ability of agents to communicate. The authors suggest the consensus protocol, which allows to calculate the error of each performing agent. It is proved that this error approximately converges to zero.
Ref. [8] does not cover multi-agent interaction explicitly, but provides that the architecture of using neural networks for annotated 3D reconstruction can be scaled for a multi-agent environment by simply using data from several drones if there were to be a collision avoidance approach.
Solutions [6,7,11,12,16,17,18,19] are aimed at a single drone and do not describe an application of their approach for several drones.

2.2. What Localization Approach Is Used?

All reviewed solutions can be divided to three groups by the localization approach—SLAM-based [6,7,11,15,18,19], machine learning-based [5,8,12] and solutions that rely on any drone built-in technologies, which rely on a visual markup or do not specify any particular approach [3,4,9,10,13,14,16,17].
SLAM-based solutions mostly use visual SLAM (VSLAM) algorithms—papers [18,19] suggest using VSLAM on RGBD and RGB data, respectfully. The authors of [6] provide a VSLAM-alike algorithm which performs localization and mapping on RGB data by using wide baseline features instead of tracking interest points. Solution [7] uses a LiDAR SLAM approach using a LiDAR attached to the drone. Solution [11] uses RTAB-map SLAM for localization using RGBD data source.
Machine Learning-based solutions aimed to use pretrained models for localization. At [5] the localization is based on a consensus matrix (generated by a two-layer neural network) that calculates, among other things, the average error of the position. Solution [8] performs drone navigation by using a voxel grid reconstructed using the region-based convolutional neural network (FRCNN) and representing a rough model of a reconstructed environment. For solution [12] a drone is localized relative to the previous captured image by using a pretrained model by Scan-RL algorithm, which uses images as an input. As a result, a drone receives a six variable vector (three coordinates and three angles of orientation) of directions to a new point of the image capture.
Authors of [3,4,9,10,13,14] do not explicitly describe the localization approach, but there are several requirements to the approach. In [4,13] drones are required to localize other drones with high accuracy. In [9,10,14] localization should provide the ability to follow a predefined trajectories or waypoints. [16] also uses predefined trajectories, but the localization is done by a GPS sensor. Solution [17] describes a usage of visual markers (spheres of the same color) in order to improve the localization. The authors of [3] do not suggest a localization approach, however, they say that their NVB approach allows one to choose the best trajectory for each agent.

2.3. What 3D Reconstruction Approach Is Used?

The reviewed solutions perform three main strategies for 3D reconstruction—usage of photogrammetry (i.e., one of the most common photogrammetric algorithms—structure from motion(SfM)) [3,4,6,9,10,13,14,16,17,18], 3D reconstruction as a result of visual SLAM application [15,19] and machine learning approaches [8,12]. The authors of [5,7,11] do not explicitly describe 3D reconstruction methods.
Photogrammetry-based solutions differ by a data source and by adding extra steps to classic algorithms. Refs. [10,17,18] use photogrammetry without any additions applied to RGB images captured by drones. Ref. [3] uses SfM algorithm and also suggests a quantitative evaluation criterion for the reconstruction quality under different camera configurations. Ref. [4] uses 3D reconstruction by applying SfM to videos of an area taken by all involved drones. Ref. [6] provides a novel SfM algorithm that uses the energy function in addition to the Delaunay triangulation of 3D points. The energy function allows the extraction of a surface in an incremental manner, i.e., whenever the point cloud is updated, the energy function is adapted. Ref. [9] uses photogrammetry for RGB images captured by drones combined with external systems data (stationary RGB cameras, 3D scanning devices). 3D reconstruction is performed on the central server after all drones have performed data capture. Ref. [8] uses K-means clustering of voxel grids obtained as a result of FRCNN processing of RGB images captured by drone. Ref. [13] uses a SfM modified with additional information of relative drone positions using data from captured images. Ref. [14] uses photogrammetry for 3D reconstruction but also suggest enriching data with different sensor measurements (GPS, LiDAR). Ref. [16] uses photogrammetry for 3D reconstruction, enriching the 3D model with a texture acquired by thermal camera.
For a visual SLAM-based solution there is an outstanding paper which uses several 3D reconstruction approaches for different tasks. Ref. [15] combines both visual SLAM and photogrammetric approaches: the solution uses a RGBD camera and IMU for performing online by applying visual-SLAM and offline reconstruction by applying a SfM algorithm.
Machine learning approaches use pretrained models, which allow reconstructing objects of interest by a set of RGB images. Ref. [8] uses K-means clustering of voxel grids obtained as a result of FRCNN processing of RGB images captured by drone. Ref. [12] uses a combination of a depth fusion algorithm based on Truncated Signed Distance Function (TSDF), Deep QNetwork (DQN), and Deep Deterministic Policy Gradient.

2.4. What Is the Level of Solution Automation

The level of automation is the least described in the papers. The authors of [3,4,5,6,12,13,14,16,18,19] do not mention any automation approaches for the whole process. Automation of [7] is implemented as a two-step algorithm. In the first flight it roughly estimates the boundaries of a building and then it makes a second flight to avoid a SLAM error. From the [8] it is clear that the solution can perform autonomous movement by using Robot Operation System (ROS) trajectory planning interfaces applied to a voxel grid, but the paper does not describe any rules and algorithms of high level planning, especially for covering the whole area. In [8] the solution can perform autonomous movement by using ROS trajectory planning interfaces applied to a voxel grid, but the paper does not describe any rules and algorithms of high level planning, especially for covering the whole area. The authors of [9] claim that their solution is aimed to be fully automated in terms of data processing pipeline, however, the goal of the work (construction site monitoring) might require periodical human interaction in order to adjust predefined trajectories to the current status of the site. In [11] a set of ROS nodes is used to perform automatic path planning and movement. The list of nodes includes RTAB-Map for SLAM technique, mavros as an implementation of MAVLink protocol for PX4 autopilot, and vrpn_client_ros as VRPN protocol for sending pose data. In [10] only the image capturing part is automated, as 3D reconstruction is performed manually by the operator using photogrammetry software. Refs. [15,17] requires monitoring by the operator in order to correct the 3D map [15] and to provide correcting commands to the drones [17].

2.5. What Are the Limitations of a Solution?

Many preconfigurations were described in previous sections (e.g., training ML models, definition of trajectories and/or waypoints, visual markup) but there are more task specific limitations. The most obvious limitation for all reviewed work (it is explicitly covered at [6]) is the RGB camera calibration process, which is necessary to be done before capturing any images. Several works [7,8] implicitly require a high performance drone hardware due to demanding approaches of localization and 3D reconstruction. The solutions [9,10] require a definition and constant update of drones predefined trajectories. The description of trajectory examples shows that trajectories make it difficult to capture small details of a reconstructed area including vertical surfaces because all trajectories do not follow the Z-axis, which is also a problem for [4] because this paper mostly describes aerial photography.
Questions of energy consumption were not covered in the reviewed articles, assuming that the proposed solutions are aimed at performing a full scan without recharging [7].

2.6. Conclusions

The review showed that the two main parts of the multiagent drone 3D reconstruction problem have common solutions. The most common, robust, and cheap approach for drone interaction and simultaneous work is a centralized control with homogeneous architecture. For the 3D reconstruction, a big share of papers suggest applying a photogrammetric or SfM-based approach because it requires only RGB data and also can achieve high quality of the reconstructed model.
According to the review, the biggest challenge is online 3D map building and automatic trajectory planning for drones. The most common solution, visual SLAM methods, require significant computing resources for online work and also face the problem of simultaneous work in a multiagent environment. Photogrammetry can be used in multiagent conditions because it is invariant to the order of images. However, photogrammetry cannot be used during drone flights because of high computational complexity.
Without 3D maps of the environment, a multiagent 3D reconstruction solution cannot operate with the needed degree of automation, which leads to the usage of predefined trajectories or to the usage of visual markup. A promising approach was introduced in work [15] by performing a two-step 3D reconstruction—online reconstruction for mapping a 3D model detailed enough to plan trajectories (by applying active SLAM to RGBD and IMU data during drone flight) and an offline reconstruction (by applying SfM-based algorithm to all captured images) aimed to get a detailed 3D model.
Based on the conclusions above, we present the following requirements that should be taken into account in the developed solution in order to improve the flaws of the reviewed papers:
  • The solution should use homogeneous architecture with centralized control in order to support low-cost drones;
  • The solution should provide a two-step 3D reconstruction process (online and offline);
  • Online 3D reconstruction process should be a reasonable trade-off between 3D map accuracy and computing complexity;
  • Offline 3D reconstruction process should use photogrammetry because it allows scaling the number of drones and input data volume;
  • Due to the usage of low-cost drones it is important to use RGB images as a main data source because it is available on most platforms instead of complex sensors (LiDAR, RGBD, GPS).

3. The Essence of the Proposed Method

The main contributions of the proposed method are described below. Firstly the XYZ boundaries of the considered building should be determined. This step is required to plan a trajectory for each drone that would allow both to keep a distance from the walls of the building and not to observe other buildings. These boundaries should represent the area of interest, and they should be a little greater than the real dimensions of the considered building. It is also assumed that there are no other objects in the area except for the considered building. This means that other buildings might appear in the area of view, but objects that interfere with the observation of the buildings (lamps, cars, fences) should be avoided.
Secondly, the considered area should be divided evenly on uncrossing subareas, which will be simultaneously observed by several drones, each drone ‘taking’ one subarea. In the beginning of the observation process, drones are placed in a corner of their subarea and their trajectories are constructed in such a way that they do not intersect. Based on the boundaries of each subarea, the control center automatically calculates the initial estimation of a trajectory for each drone, using the assumption that the building has a shape close to a parallelepiped.
The next step for every drone is to follow the trajectory estimation by receiving waypoints from the center and to capture images during the flight. It is assumed that every drone is equipped with a RGB camera that is faced in the same direction as a drone and observes the environment in front of the drone. The drones use a visual odometry method to estimate their position at every moment and to follow the trajectory.
During the flight, drones send images to a central server that stores images and coordinates where these images were captured. During the visual odometry process the features from accelerated segment test (FAST) [20] are extracted in every image. Knowing the visual odometry estimation of coordinates of every drone and every feature of images, captured by several drones, allows one to create the approximate 3D point cloud of the building (online map) during the flight. The online map allows drones to adjust trajectories in order to capture maximum details of the building.
In addition, the server performs online analysis of each image from every drone on observing the edge of the building. If a drone reaches a vertical border of the building, then it means that the corner has been achieved. In this case the coordinates of this corner should be compared to the determined XY boundaries, and if they correspond, the trajectory of the drone should be updated to prevent flying far away from the building. If the drone reaches a horizontal border of a building, it means that it has flown up enough to reach the Z border. The calculated border should also be compared to the pre-set border to check if it is calculated correctly.
After the drones finished the flights, all captured images are passed through photogrammetric software for creating a detailed and textured 3D model of the building (offline map).

3.1. Trajectory Building

As mentioned above, the first step is to plan a trajectory for every drone. Since the rough XYZ boundaries are known, the area of interest is vertically divided in the subareas, which are given to every drone as it is presented in Figure 1.
It is important to mention that the subareas should not touch each other—there should be a gap between their borders. The gap is required to reduce collision risk. The size of the gap is a configurable parameter G, whose value depends both on the size of the drones and the characteristics of their cameras. In every subarea drones behave in the same way. The trajectory of each drone is constructed in that way to avoid collision of drones. In the beginning, drones should be placed in the lower left corner of their subareas. The camera of every drone is faced towards the building with a constant angle (parameter A) between the building ZX plane and drone X axis. Every drone takes off and flies up to the lowest possible height. After that, a drone flies to the right until it reaches the edge of its subarea. Then, it flies up a constant number of meters (parameter H) and starts to move left by a set of discrete steps. On each step the drone tries to keep the desired distance to the building (parameter D) using a distance approximation from the online map. This process repeats until the drone reaches the roof of the building—its upper border.
After that. a drone stops moving in a vertical plane and starts to move in a horizontal plane above the roof. The camera is faced down to observe the roof, and the drone is aligned with a constant angle R to the roof. The snake pattern of the trajectory is kept. After the roof is investigated, a drone observes the opposite side of the building. The trajectory of the opposite side repeats the trajectory of the first side, but the drone moves from the top to the bottom. The complete trajectory for a single drone is presented in a Figure 2.

3.2. The Localization Approach

The trajectory is a set of points that the drone should visit. However, it is impossible to check if the drone has achieved these points without localization. The proposed idea is to use visual odometry combined with a Kalman filter. The idea to use the visual odometry method instead of 3D SLAM is based on considerations to reduce computing resources—the SLAM algorithm requires one to store the whole map during the algorithm. On the other hand, the 3D SLAM allows one to solve a task of 3D reconstruction simultaneously. However, for a multi-agent case, the SLAM algorithm brings the task of merging the submaps that are constructed by all drones. Since the drones’ trajectories do not cross, this merging might bring errors that cannot be resolved. That is why the problem of localization and the problem of 3D reconstruction were separated.
The algorithm of visual odometry [21], which is used in the proposed method, is a part of the structure of motion algorithm. This means that the detected feature points in a camera frame are used both for localization and for future 3D reconstruction. However, a pure algorithm of visual odometry brings the accumulated error. To decrease this error, the Kalman filter is implemented. The Kalman filter consists of the model, which brings the prior estimation, and the observation, which allows one to calculate posterior estimation. The observed variable is the linear speed divided in three spaces. The model is built on the assumption that the drone moves with a constant speed in all three dimensions. The filtered speed is then used to calculate the accurate position of a drone. The result of applying the Kalman filter to trajectory estimation is presented in a Figure 3.

3.3. 3D Reconstruction Approach for Offline Map

In the proposed method, the 3D reconstruction for an offline map is based on a structure from motion algorithm. It happens at the end of the flights when the drones have completed their movement and have captured all images. The 3D model of the building consists of the feature points that were captured during the flight. After that, the photogrammetry method is applied to these points according to all captured images.
For a correct reconstruction it is required that the captured images have intersections. This means that for every image there should exist at least one other image with which it has a common part. This restriction can be satisfied by increasing the image capturing rate. On the other hand, the parts that are observed by different drones should also join one another. This can be achieved by tuning the closeness of the trajectory of a drone to the border between drone’s subareas.

3.4. Method Scalability and Adaptation

The method provides a general framework for solving the 3D reconstruction problem in a number of different conditions due to even workload distribution and is simple approach for avoiding collisions. By adjusting the trajectory parameters A, H, D, R and, therefore, the degree of images overlapping, drones can receive the needed amount of information for small details and thus provide enough data for an offline mapping process. By adjusting parameters G, H, D, the reconstruction speed can be regulated by increasing or decreasing the number of positions for image capturing.
This method can be also modified for conditions where one drone cannot scan the whole subarea during one flight, e.g., due to very large buildings and/or drones with low battery resources by changing the rule for workload distribution in order to match the capabilities of each drone. For example, scaling can be done by dividing each subarea in subsubareas using the following algorithm:
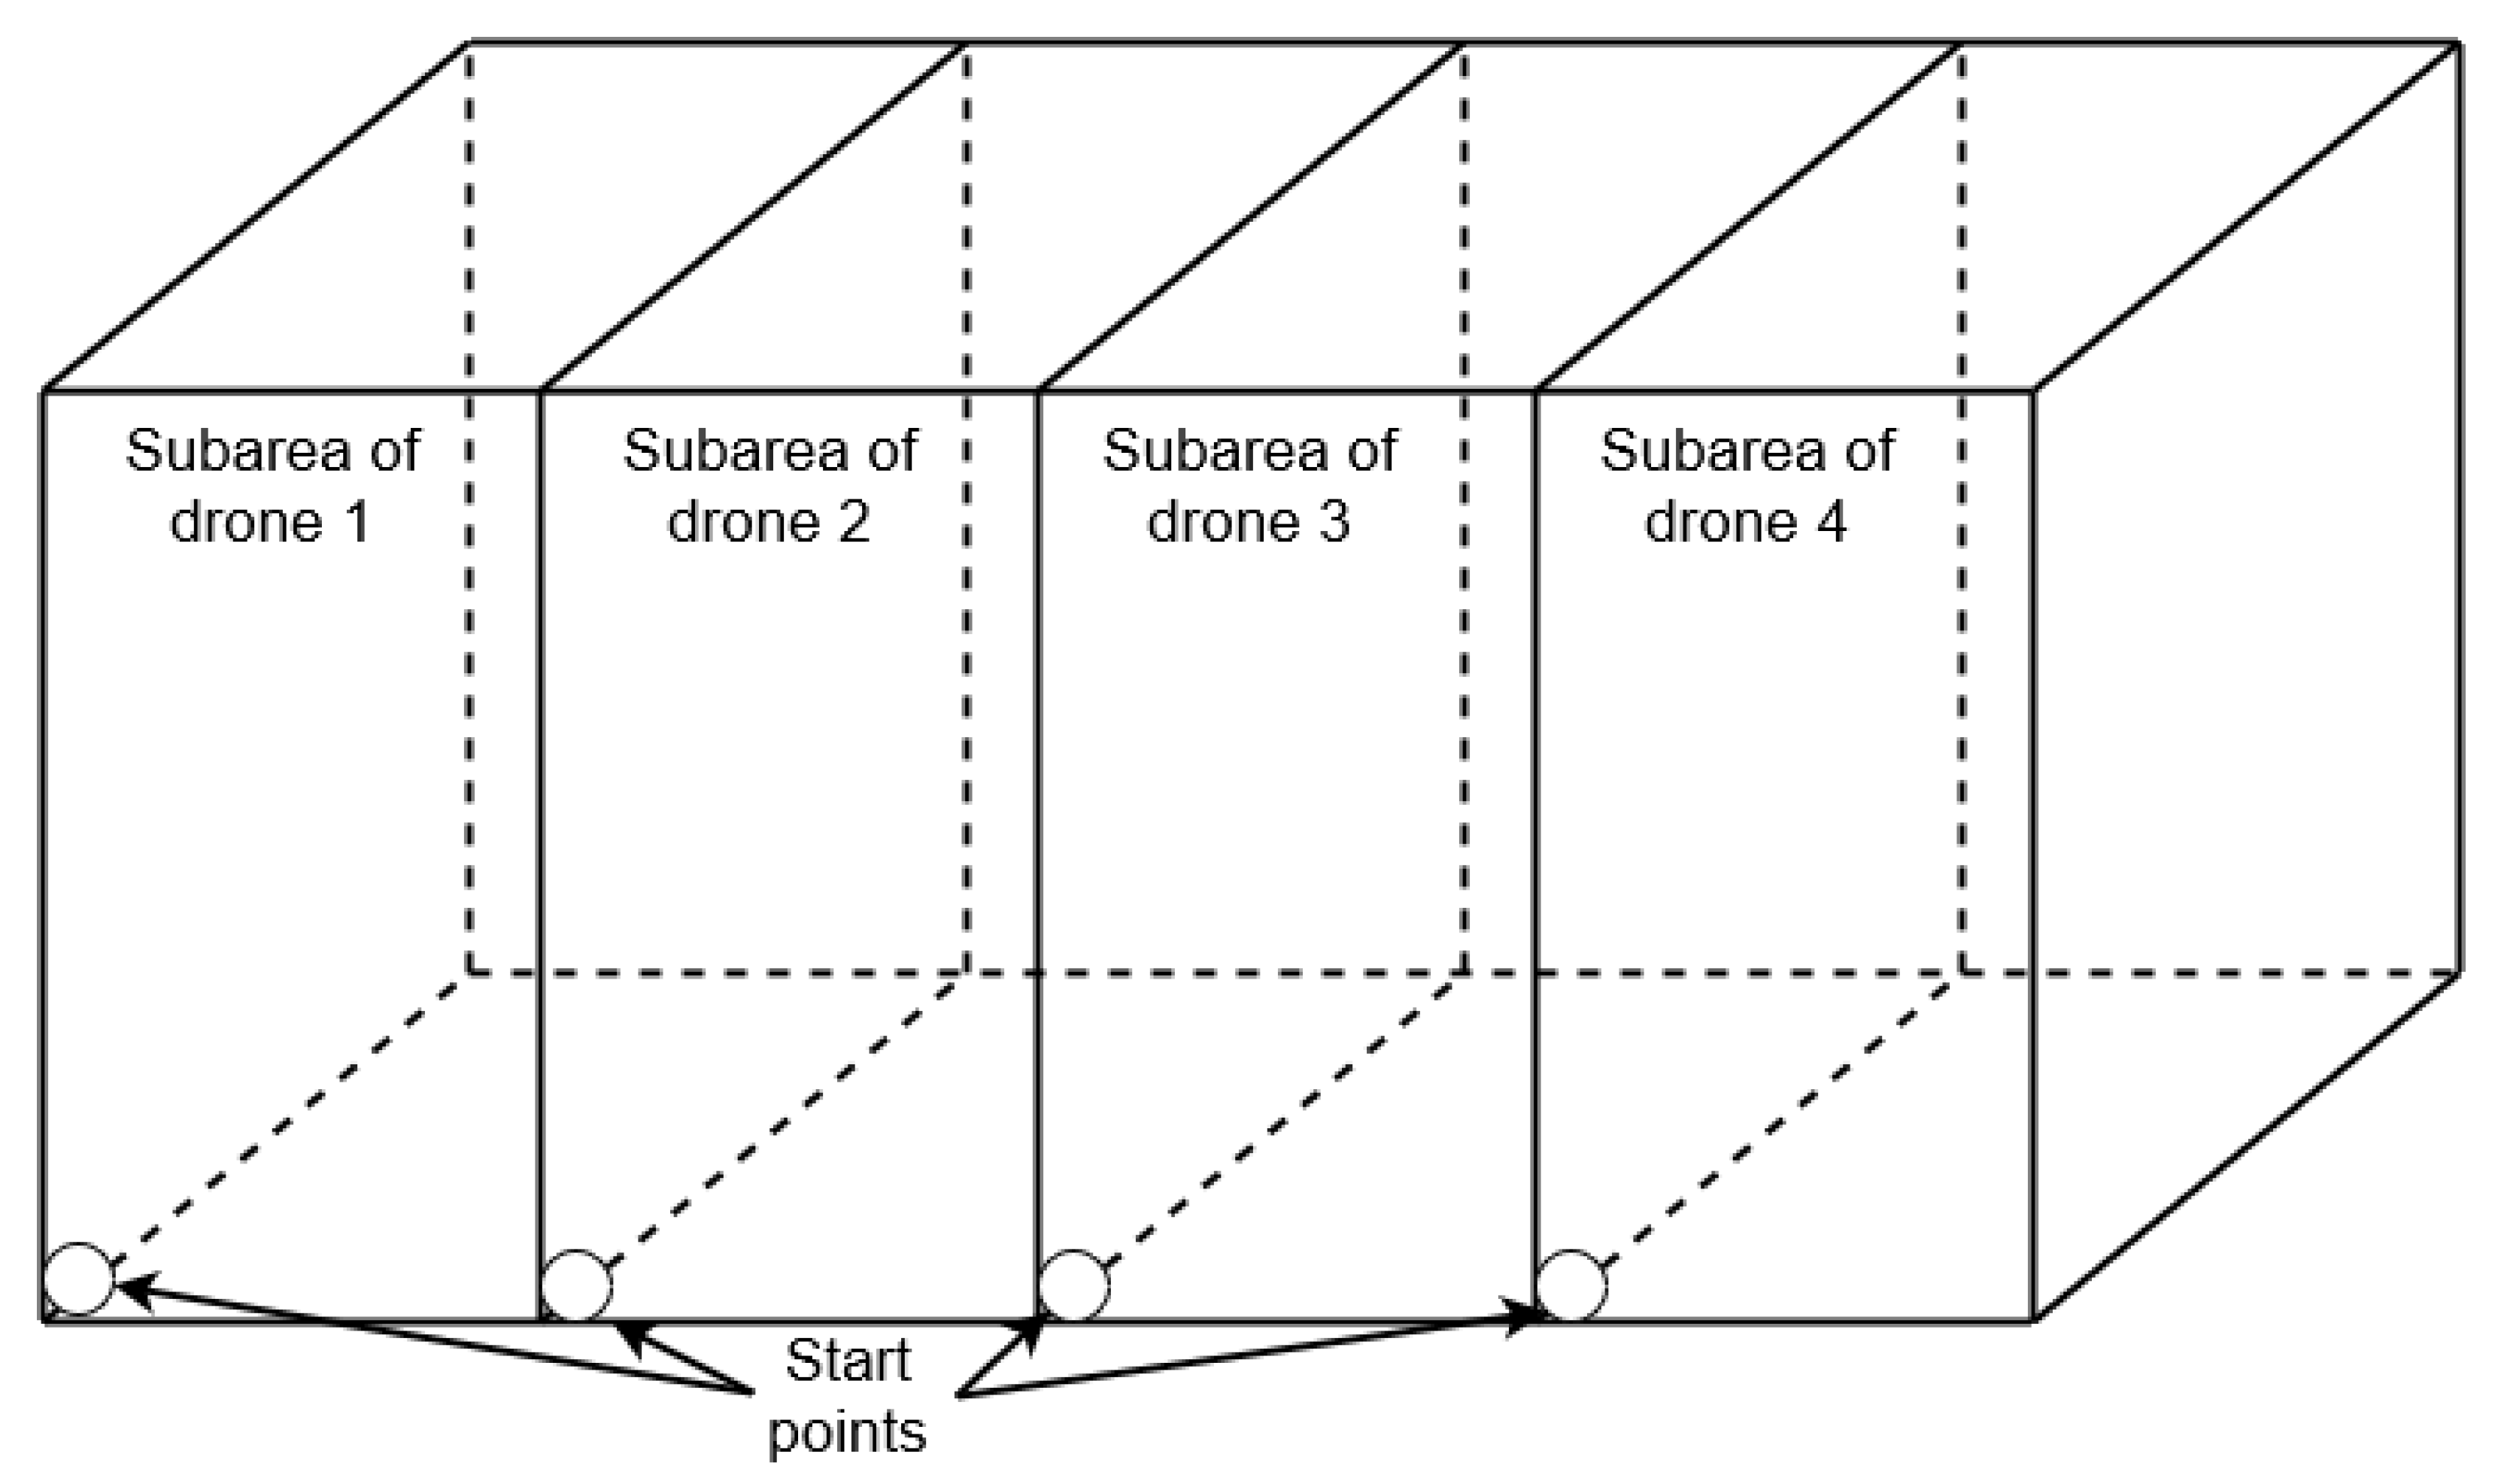
  • Divide the subarea approximately into three parts—front side, roof, and back side of the building.;
  • Divide the front side and back side parts of the subareas evenly and horizontally (division lines are parallel X axis) in the ZX plane;
  • Divide the roof part in the XY plane evenly and vertically (division lines are parallel Y axis) for subsubareas.
The width of each subsubarea is constant and is defined as Wf, Wb, Wr parameters relative to the frontside, the backside, and the roof of the building. These parameters are presented in Figure 4. The parameters values can be estimated using the information about drone average battery capacity and approximate length of the return trajectory to each part of the area. Additionally, an additional parameter Hr (approximate roof height) is added in order to avoid wasting drone batteries to estimate roof height value.
After the defining the subsubareas the method can be applied for guiding drones in a slightly changed manner:
  • Each drone is assigned to a particular subsubarea;
  • The system calculates deploying trajectories for each drone from the base to the approximate starting point of a subsubarea (bottom-left corner for frontside and backside subsubareas, front-left corner for roof subsubareas);
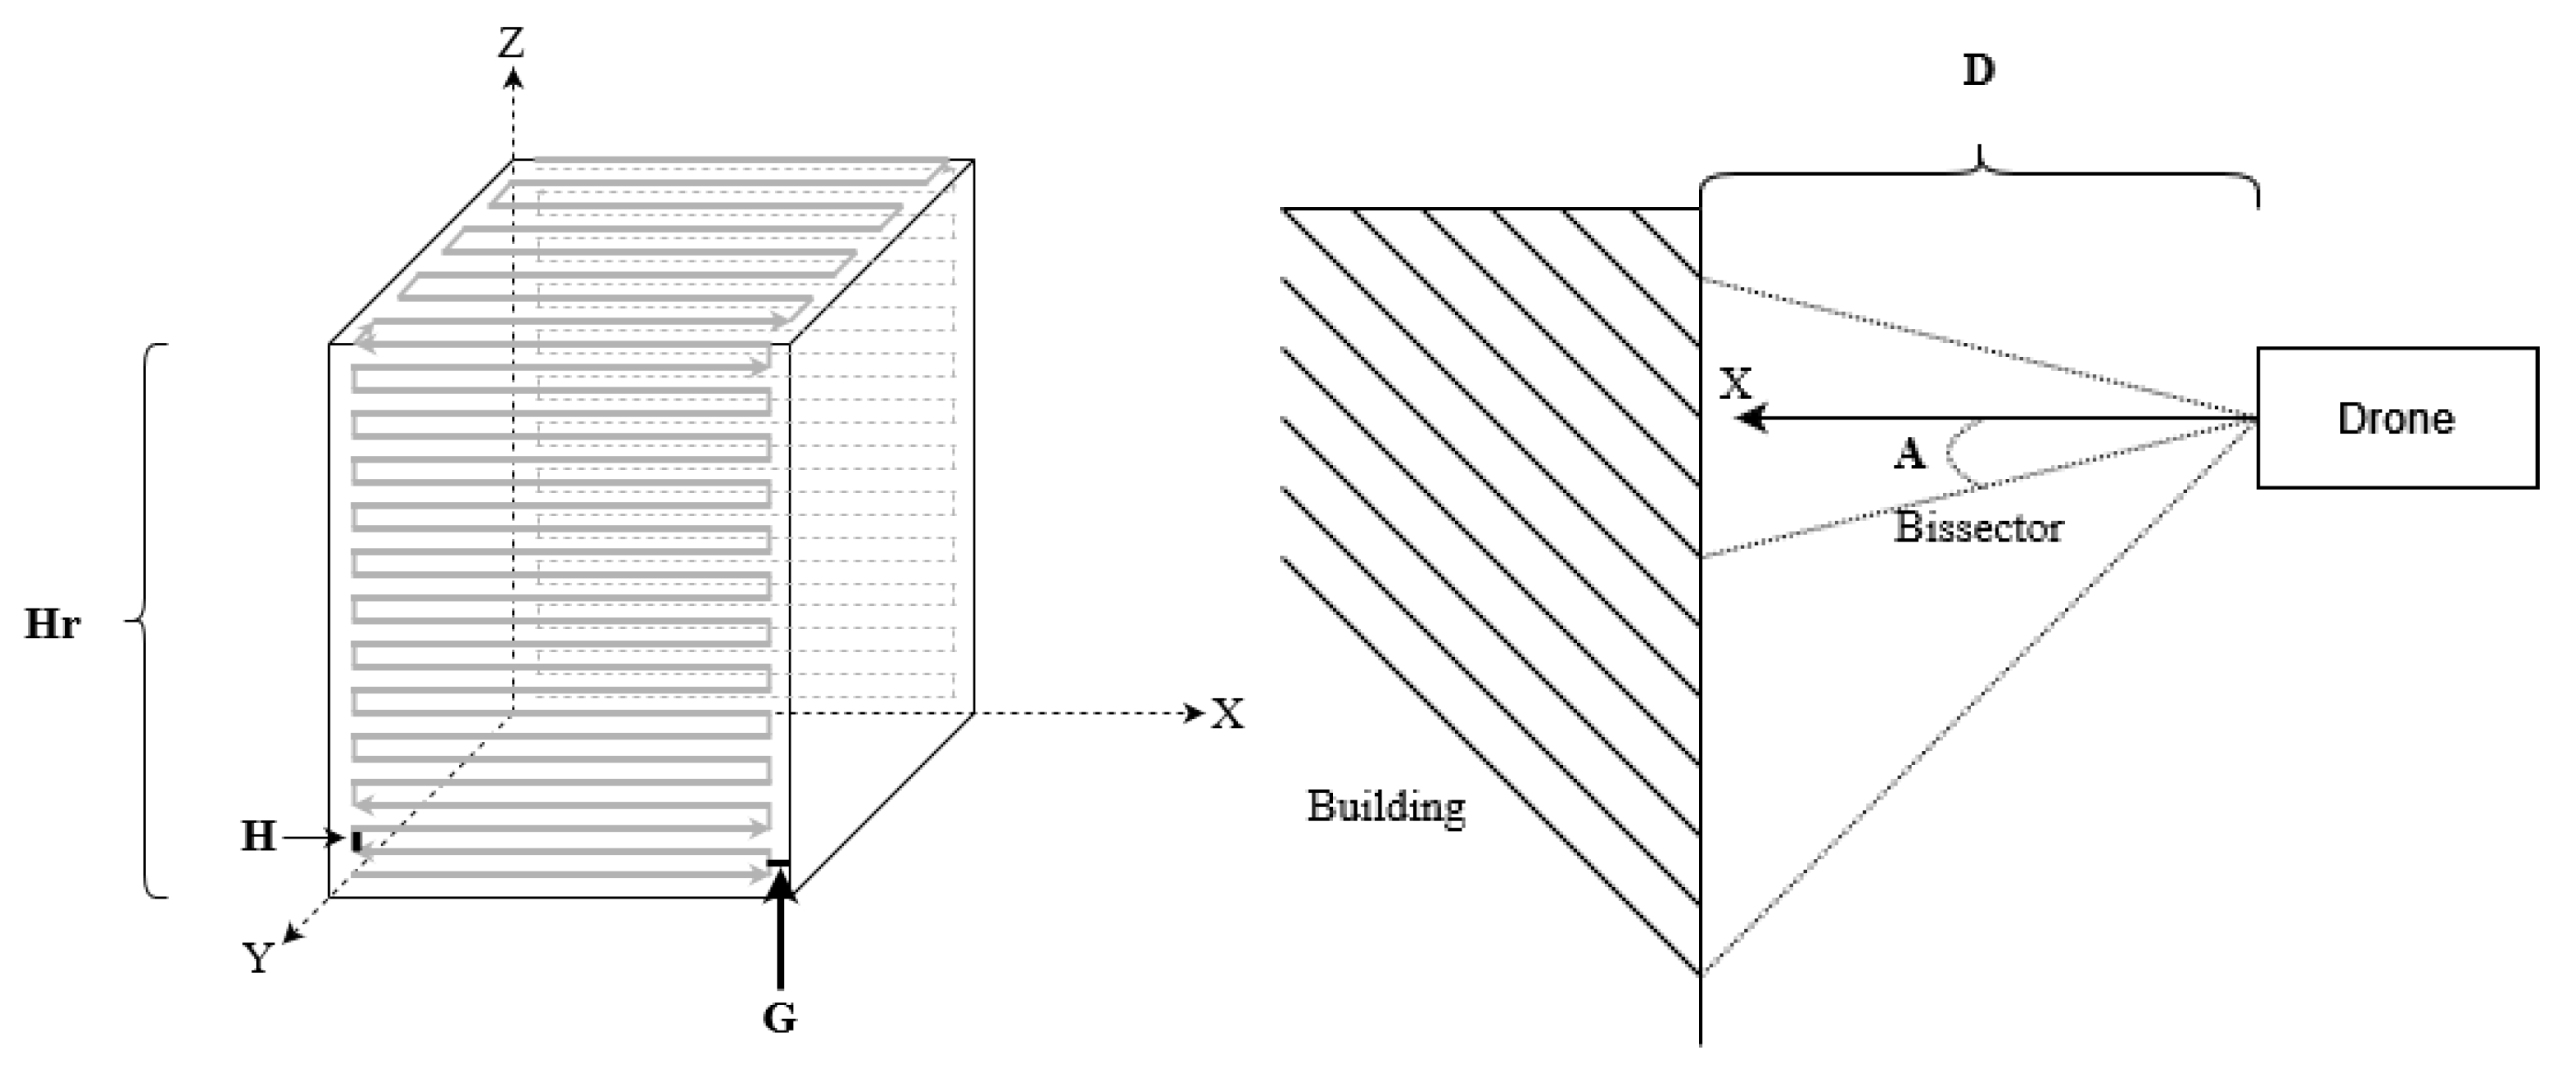
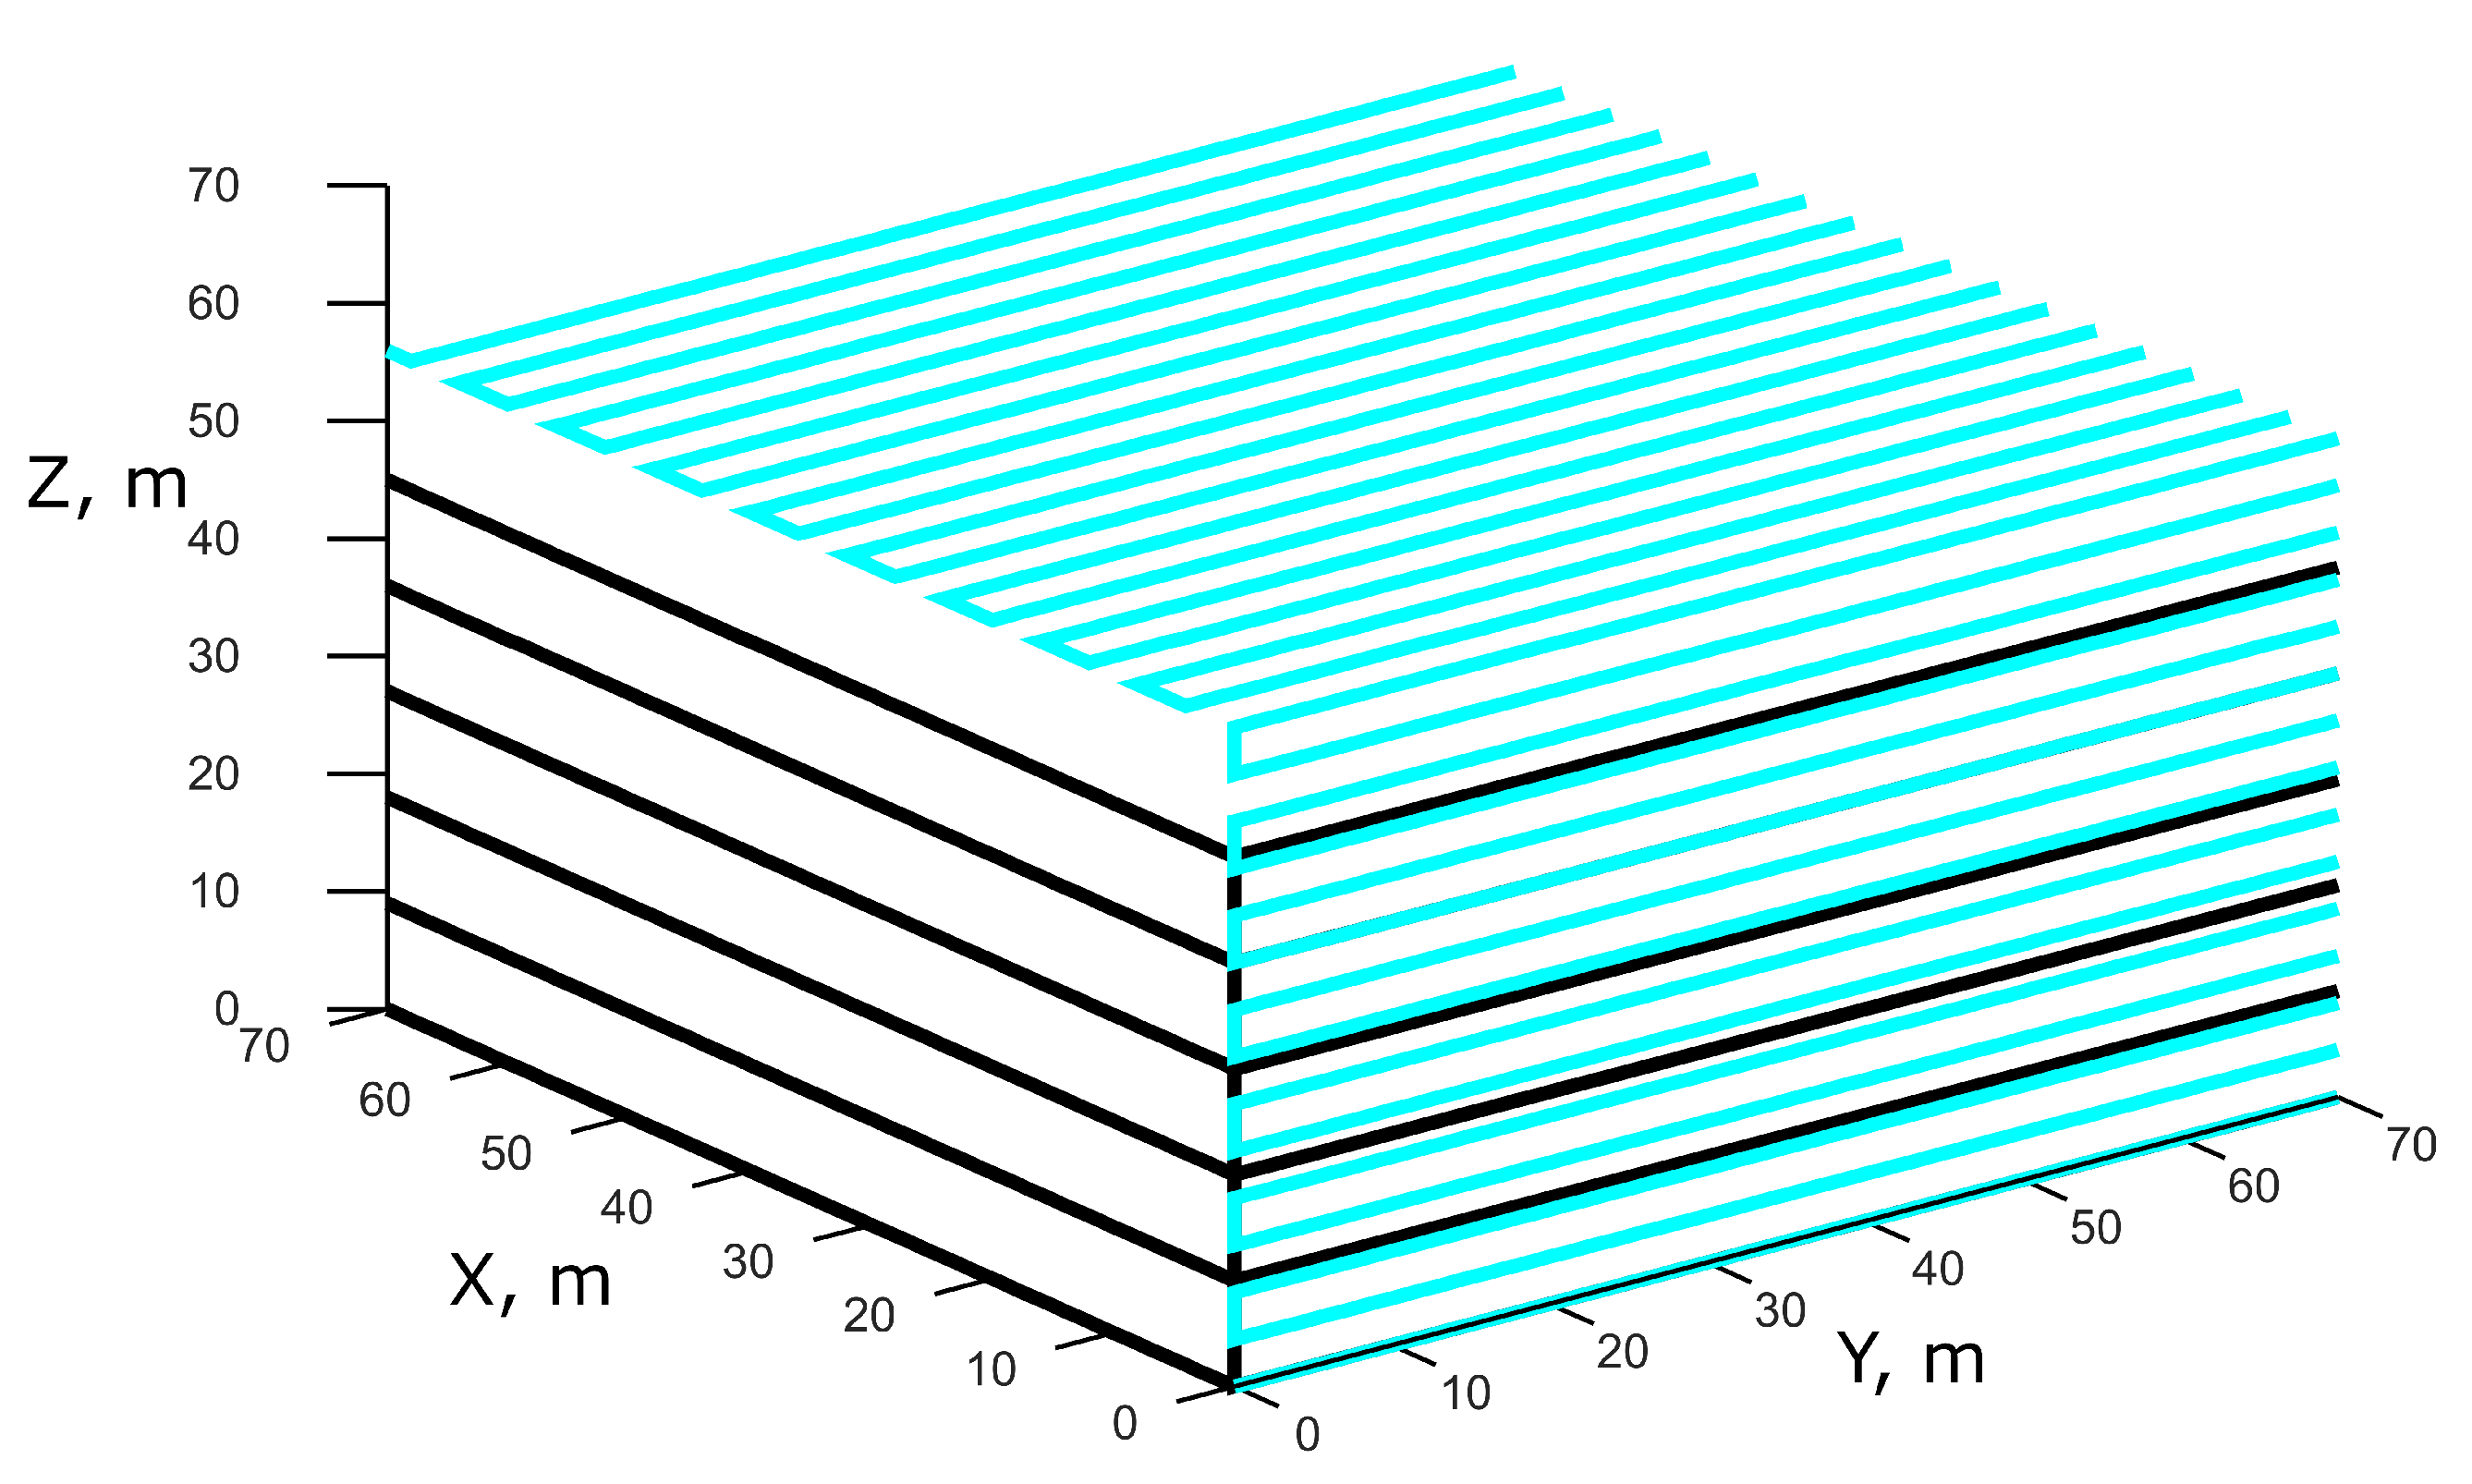
  • Each drone on frontside and backside subsubareas starts scanning using a snake pattern moving from left to right and from down to up;
  • Each drone on roof subsubareas starts scanning using a snake pattern moving from left to right and from front to back;
  • After completing the subsubarea drone returns to the base.

4. Evaluation

In order to evaluate the method performance, two different experiments were conducted. The first is a theoretical evaluation of the built trajectory. Its comparison to a single-agent approach and statement of formulas allow to configure a method for particular drone hardware limitations. The second part contains the evaluation of a global system in a simulation.

4.1. Trajectory Benefits

The first thing that should be described is a probable benefit of using several agents instead of one. For these purposes it is necessary to consider a drone with known characteristics and calculate its performance applied to a building with known boundaries. A list of the drone’s characteristics is presented below: speed of movement, rate of image capturing, areas of camera view, and battery resource. The simplest formula that allows one to estimate a drone’s application to a particular task is:
S < v · t b a t t e r y ,
where
  • S—the distance that the drone might process;
  • v—the average speed of the drone;
  • t b a t t e r y —the estimated time resource of the battery.
In other words, the length of a trajectory should be short enough to allow a drone to complete the trajectory before its battery runs out. If a drone can observe the full height of a building in one frame, then the length of the trajectory is equal to the sum of x , y (boundaries of the building) S = 2 · x + 2 · y . If the drone cannot observe the full height, then it should make several spiral turns where the length of each turn is equal to S. The height delta between spiral turns depends on camera characteristics, because it is required to keep enough of the crossing area in the images that are captured on different spiral turns. To simplify the math, it is possible to assume that in general a drone should fly up the height of the building (Hr). However, it is possible to calculate the largest amount of spiral turns (N) according to a battery resource:
N · S + H r < v · t b a t t e r y
or
N < v · t b a t t e r y H r 2 · x + 2 · y
Consider a cheap and easily obtainable DJI Tello drone [22], which has, according to its description, 13 min of battery and a max speed of 8 m/s. Therefore, it can fly 6240 m. Consider a building that is 300 m × 200 m × 50 m. According to Formula (2), for this building the maximum amount of spiral turns is six in ideal conditions. Additionally, it is often required to add a roof to a 3D model and one or two spiral turns should be used for this purpose. In addition, the drone might face weather conditions that might slow it down or decrease the battery lifetime.
On the other hand, it is possible to calculate the amount of spiral turns that should be flown by a drone in a multi-agent case. The path for a drone in this case is presented in Figure 5 and Figure 6. The length of a single drone’s trajectory consists of three parts: front, roof, and back, which is equal to:
S t r = ( N · X s u b a r e a + H r ) + ( M · X s u b a r e a + y ) + ( N · X s u b a r e a + H r ) ,
where
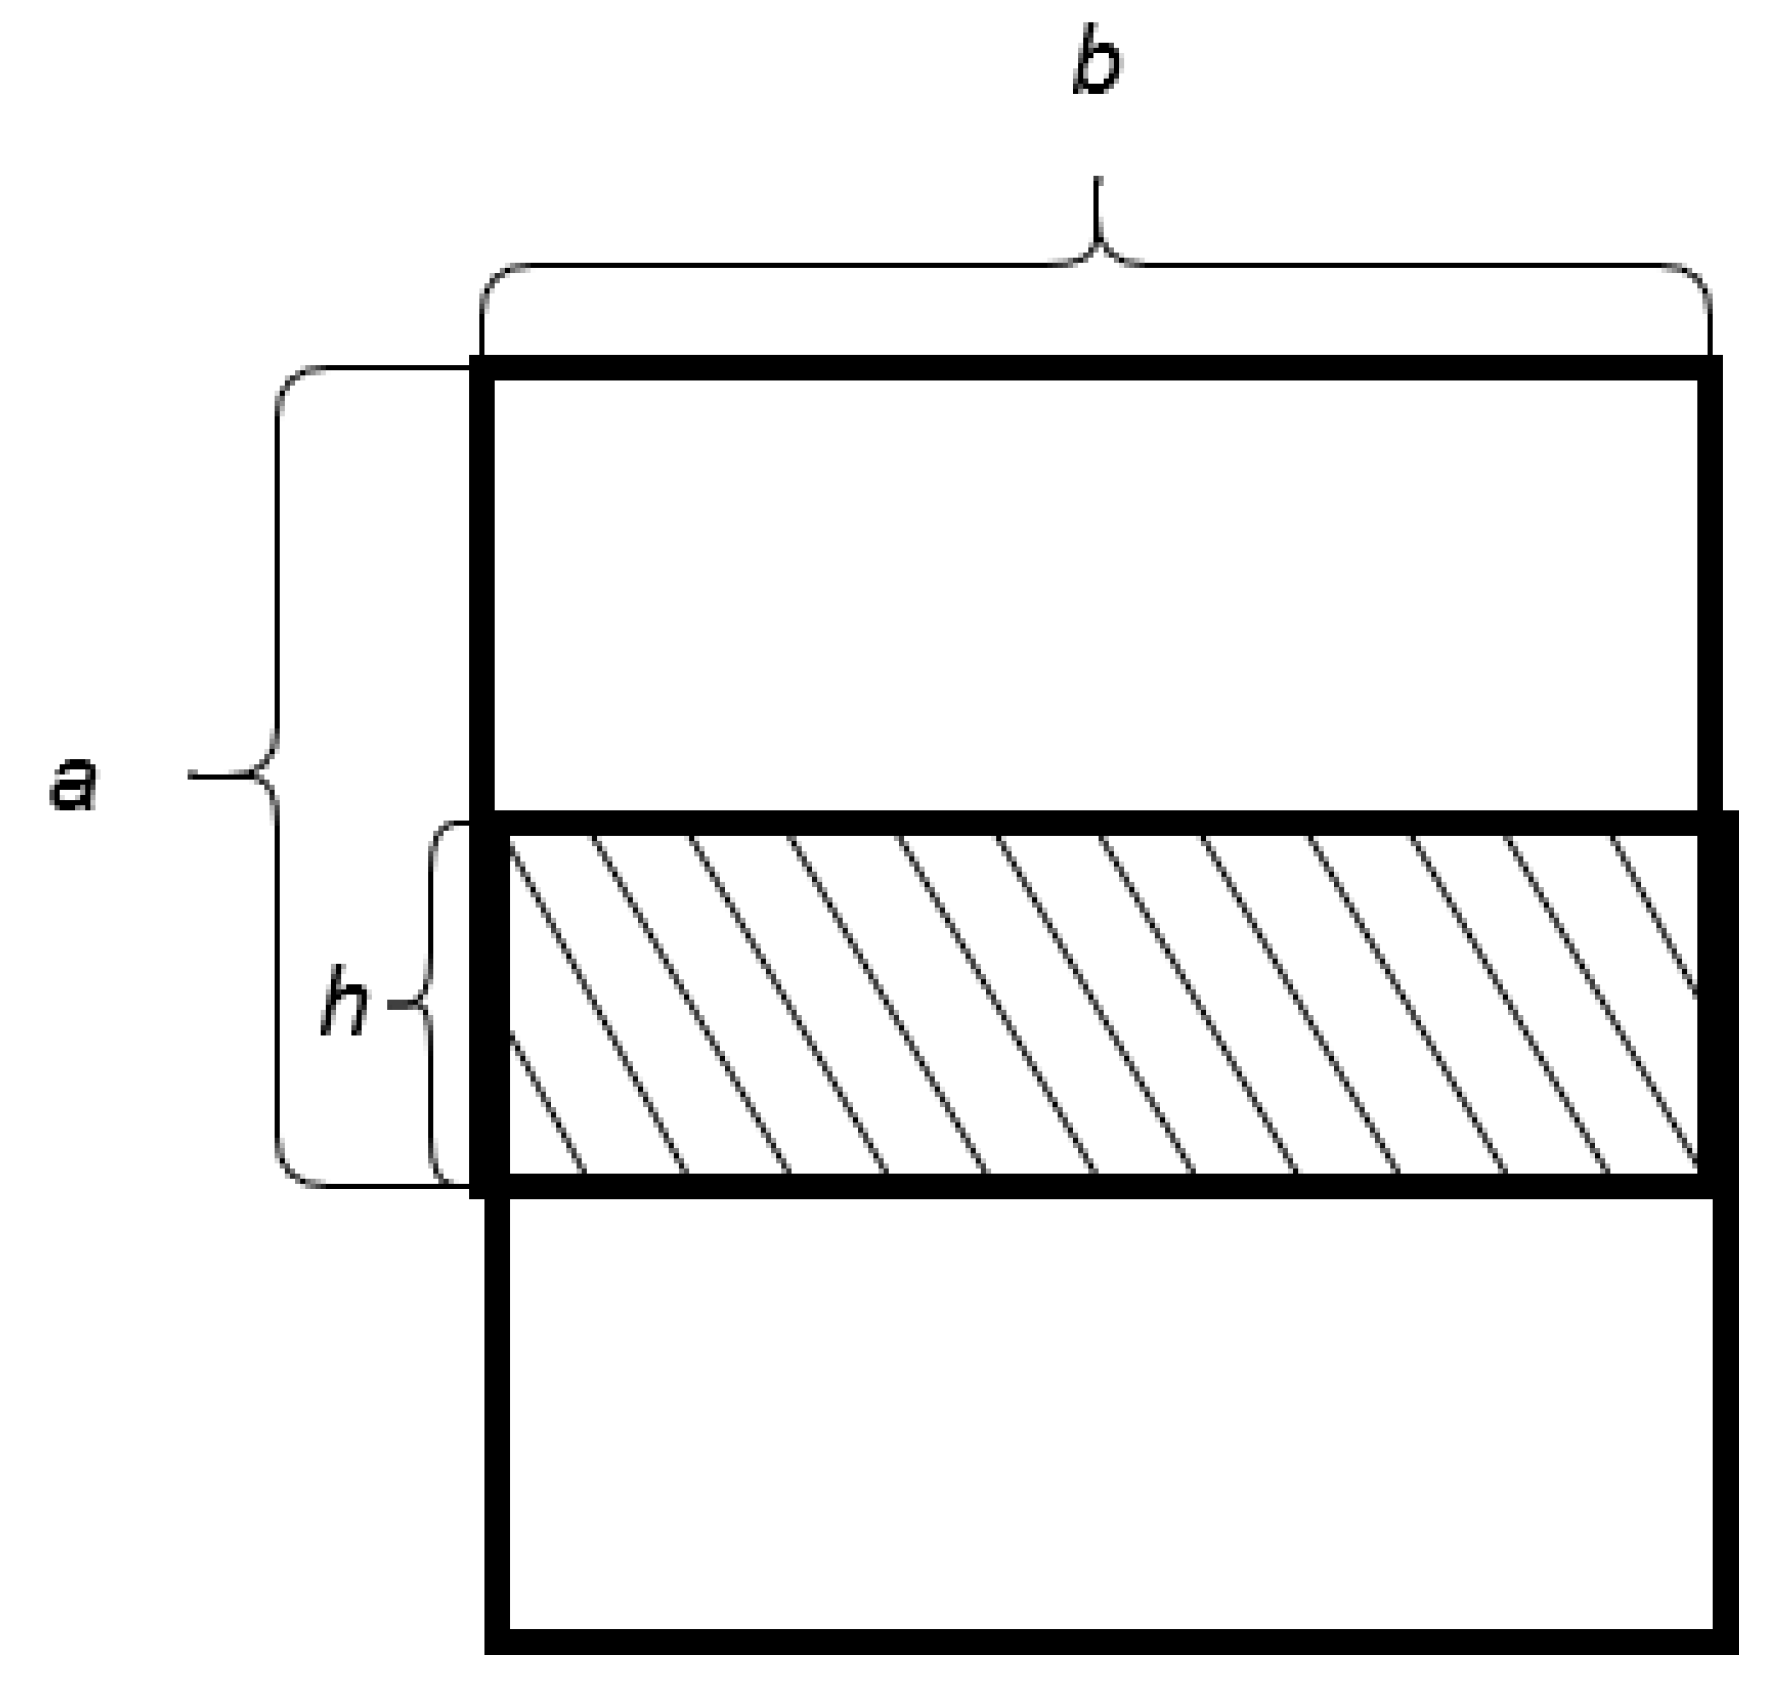
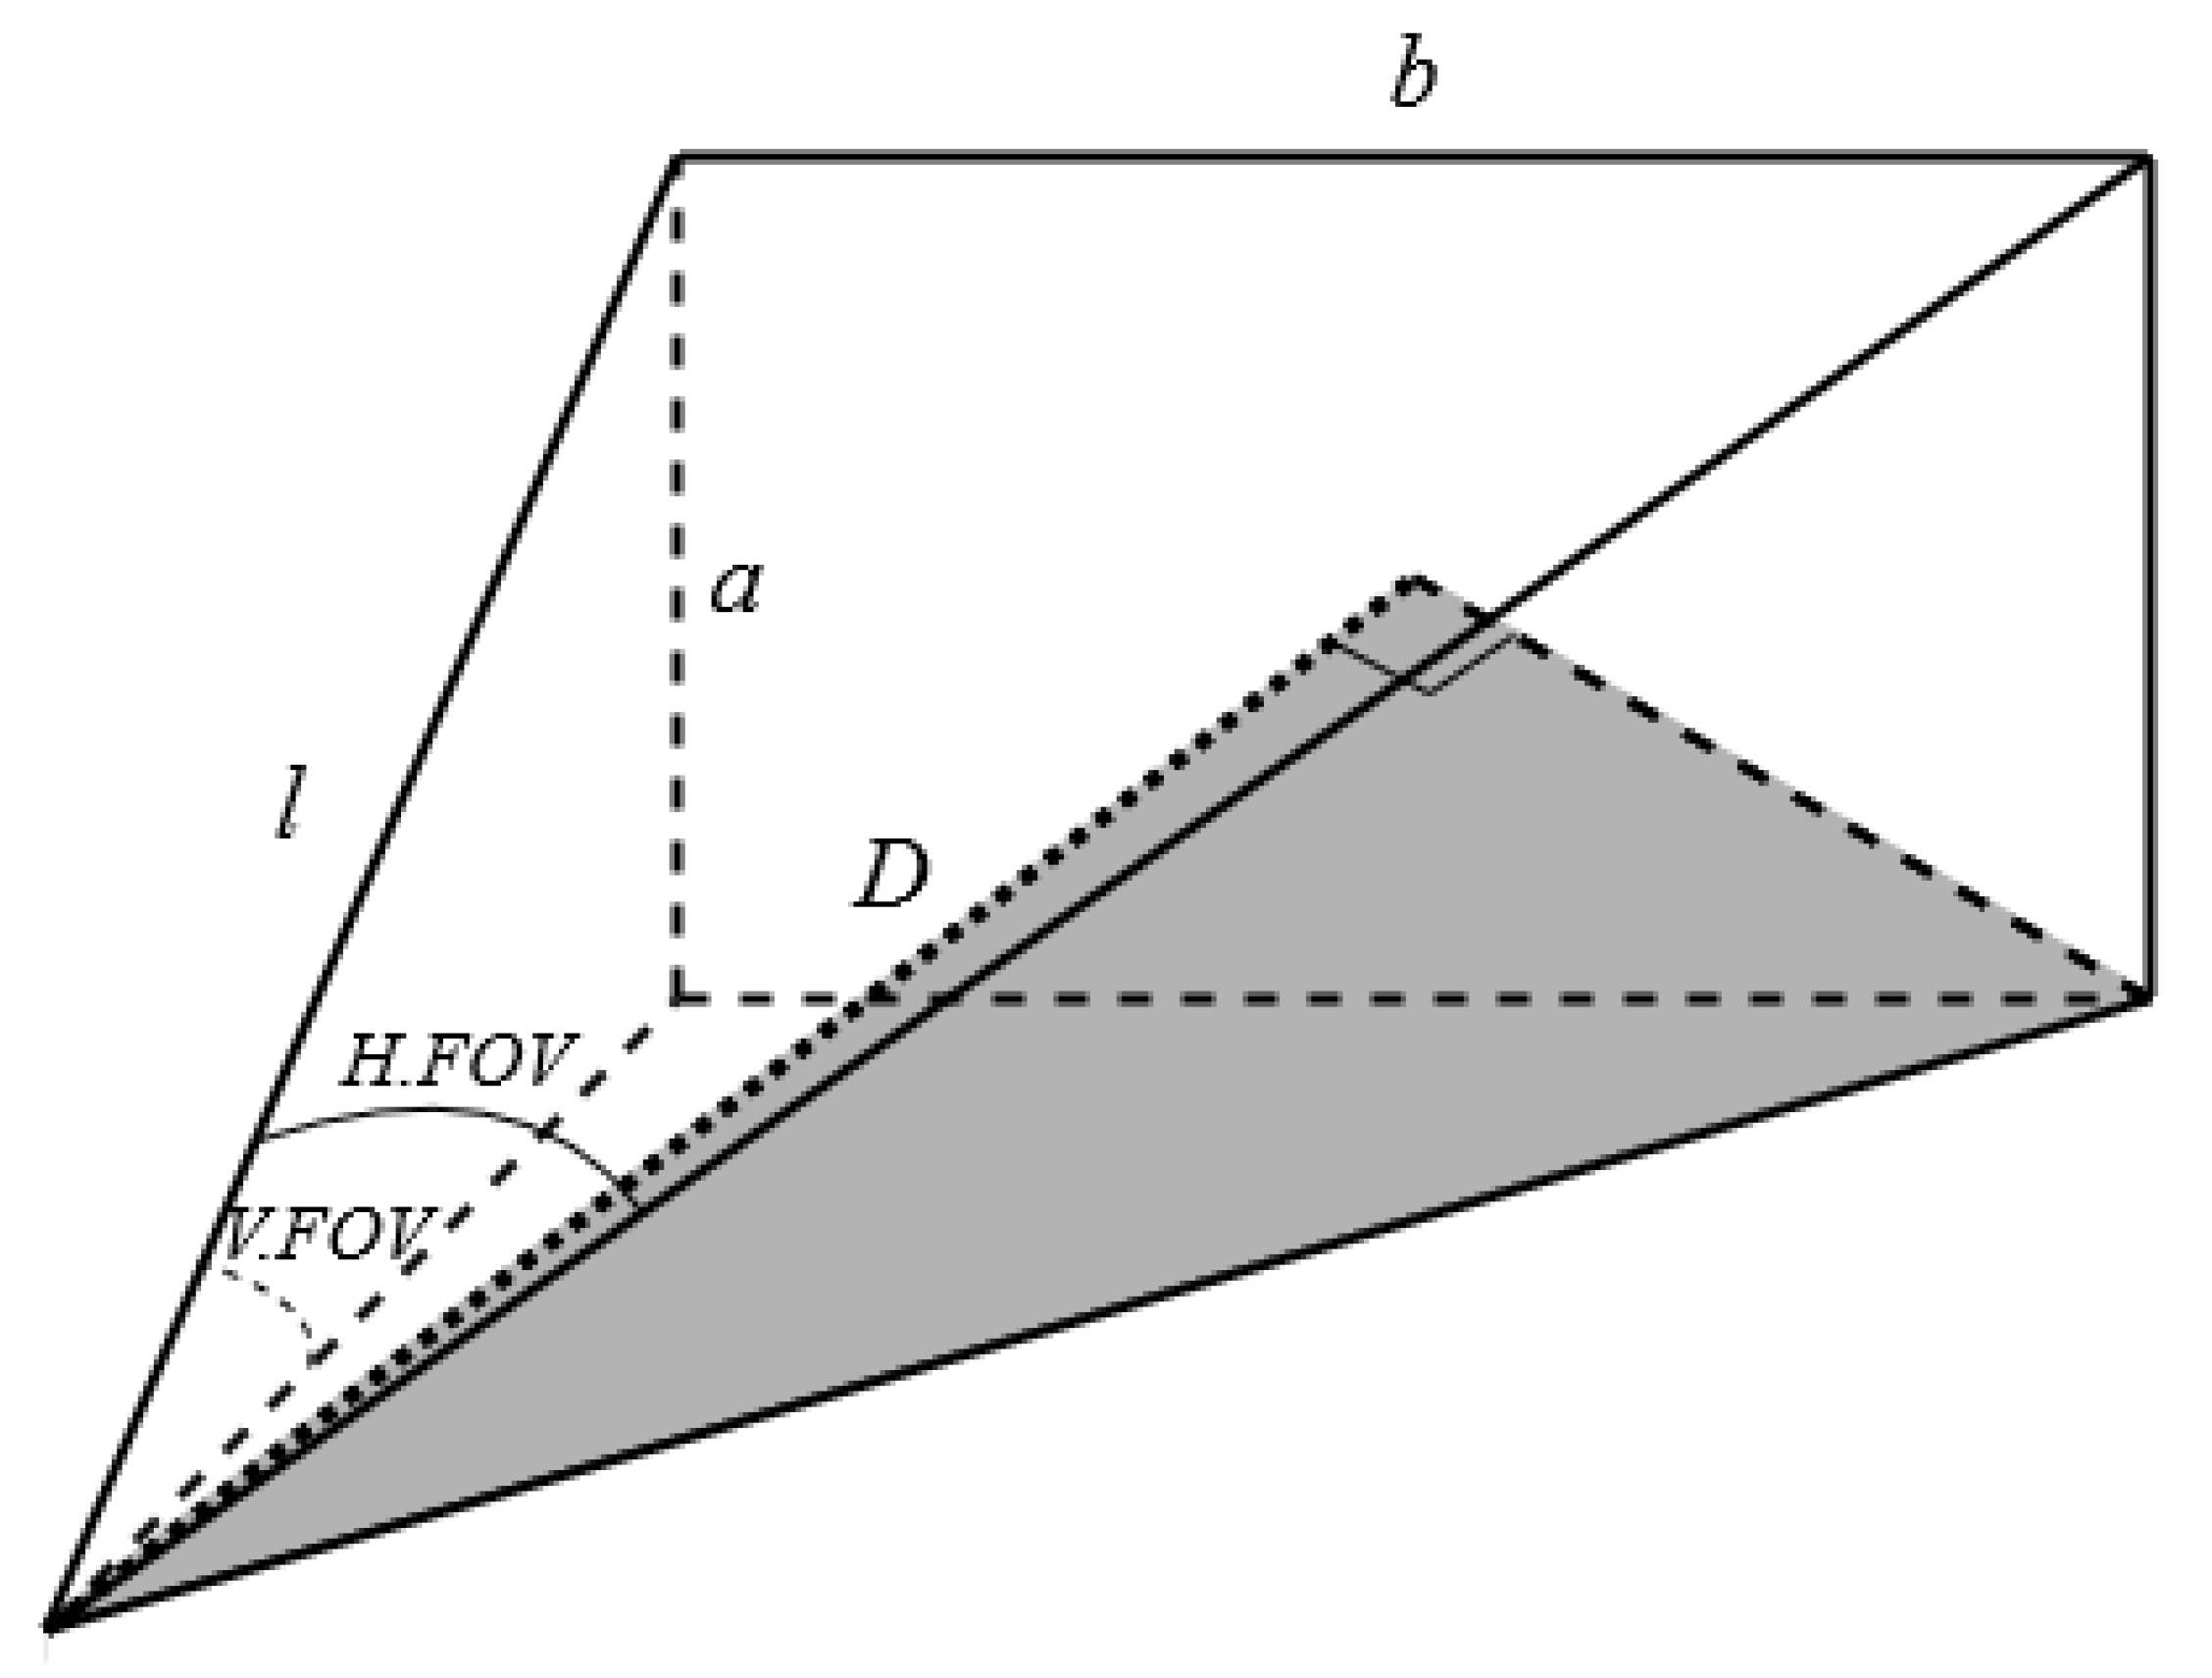
  • N—amount of spiral turns in a vertical plane;
  • M—amount of spiral turns in a horizontal plane;
  • X s u b a r e a —widths of the drone’s subarea;
  • H r —height of a building;
  • y—width of a building.
X s u b a r e a depends on the length of a building (x) and amount of drones in system ( N d r o n e s ):
X s u b a r e a = x N d r o n e s
Hence, using Formulas (2)–(4), it is possible to get a formula for the amount of spiral turns:
( N · x N d r o n e s + H r ) + ( M · x N d r o n e s + y ) + ( N · x N d r o n e s + H r ) < v · t b a t t e r y
or
2 N + M < ( v · t b a t t e r y y 2 H r ) · N d r o n e s x
2 N + M —theglobal amount of spiral turns, including front, back, and roof side.
Consider the same building, as above, which is 300 m × 200 m × 50 m, and the same drone, which is able to fly up to 6240 m on one battery charge. Assume that four such drones are used. Then, one drone can perform almost 80 spiral turns. Of course, the length of these turns is much lower than the length of turns in the example above. However, this amount of spiral turns allows to fly them closer to one another and make the 3D reconstruction more accurate.
Figure 5 shows the comparison of trajectories on a real scale, and Figure 6 represents the zoomed-in view. The black line is the trajectory of a single drone that observes the whole building. As it was calculated above, it can make six spiral turns before its battery runs out. At the same time, if the area is divided into four parts, then a single drone is able to far more spiral turns. It is also able to observe a roof. In Figure 6 it is shown that the distance between spiral turns in a multi-drone case (azure) is lower than in a single-drone case. Thus, the suggested method of division of work and trajectory building allows one to observe a building more precisely since the distance between vertically adjacent images is lower.
On the other hand, the amount of spiral turns should not be redundant. The delta of distance (H) should be such that the images overlap not lower and not greater than on a specific percentage. To be more specific, it is possible to assume that images should overlap by 40%—this allows the photogrammetry algorithms to match enough descriptors of detected features and to calculate the relative orientation of images. Figure 7 demonstrates this situation.
In Figure 7 the area ratio of the shaded rectangle to the one with bold borders is equal to 0.4 . Since they have the same side b, then h / a = 0.4 . This means that the distance between the centers of rectangles with bold borders is equal to 0.6 a . The centers of these rectangles represent the positions of the camera. So, the distance between spiral turns H should be 60% of the vertical length of view to keep 40% of the images overlapped.
The only thing left is to determine the vertical length of the viewed image. Below we present the derivation of formulas that allow one to calculate this value.
Consider that the following parameters are known: two angles of camera view and the distance from the camera to a building. The area of view is drawn in Figure 8. There is an assumption that angle A is equal to 0 and, therefore the X axis of a drone is strictly perpendicular to a building.
The angle of the camera view in the horizontal plane is called H . F O V , the angle in the vertical plane— V . F O V , the distance from the camera to the building, i.e., the height of the pyramid is D and the side of the pyramid is called l. a and b—are the length and width of the area of view that should be calculated.
Considering the side face of the pyramid, it is obvious that
0.5 a = l · s i n ( H . F O V / 2 )
Similarly, from another side
0.5 b = l · s i n ( V . F O V / 2 )
Then, consider the rectangle in the base of the pyramid. Its diagonal is equal to s q r t ( x 2 + y 2 ) .
Finally consider the gray triangle from Figure 8. It is a rectangular triangle with sides that are equal to D, s q r t ( x 2 + y 2 ) / 2 and l. Hence, there is the last equation that connects a, b and l:
l 2 = D 2 + ( a 2 + b 2 ) / 4
Using Formulas (6)–(8) the value of a and b is obtained:
a 2 = 4 D 2 · t g 2 ( H . F O V / 2 ) ( 1 + t g 2 ( V . F O V / 2 ) ) 1 t g 2 ( H . F O V / 2 ) · t g 2 ( V . F O V / 2 )
b 2 = 4 D 2 · t g 2 ( V . F O V / 2 ) ( 1 + t g 2 ( H . F O V / 2 ) ) 1 t g 2 ( H . F O V / 2 ) · t g 2 ( V . F O V / 2 )
When b is known, then according to Figure 7 it is possible to get an estimation of H:
H = 4 D 2 · t g 2 ( V . F O V / 2 ) ( 1 + t g 2 ( H . F O V / 2 ) ) 1 t g 2 ( H . F O V / 2 ) · t g 2 ( V . F O V / 2 )
Consider a particular drone with H . F O V = π / 2 , V . F O V = π / 3 and assume D = 10 m. Then, according to Formula (9), H = 12 m. Considering a building with dimensions of 300 m × 200 m × 50 m and dividing it into 4 drones, it means that each drone should do 37 spiral turns. The limit of 80 turns that was obtained from the Formula (5) is satisfied completely. Moreover, 80 turns can be achieved only in perfect conditions, and in reality the limit of battery power would allow just a little more than 37 spiral turns.
The next subsection presents the experiments in a simulation. These experiments have the following parameters. The average speed of the drone is 1 m/s, the battery resource is set up to 5 min of flight. According to Formula (5) each drone should perform 14 spiral turns. This means that the delta between turns (H) is equal to 5.5 m. For H = 5.5 m, XYZ boundaries of the building are 60 × 40 × 30 m, 40% of image overlap, according to Formula (9), and the distance to the building (D) is 5 m.

4.2. Experiments in a Simulation

The experiments were carried out in the simulation. “Unreal engine” [23] was used to simulate the environment, because it allows to assemble a scene easily, add noise in observations and it simulates a model of drone that is close to a real physical model. The observed building has a parallelepiped shape and a drone cannot observe a detailed image of a full building.
The experiment contains the following steps:
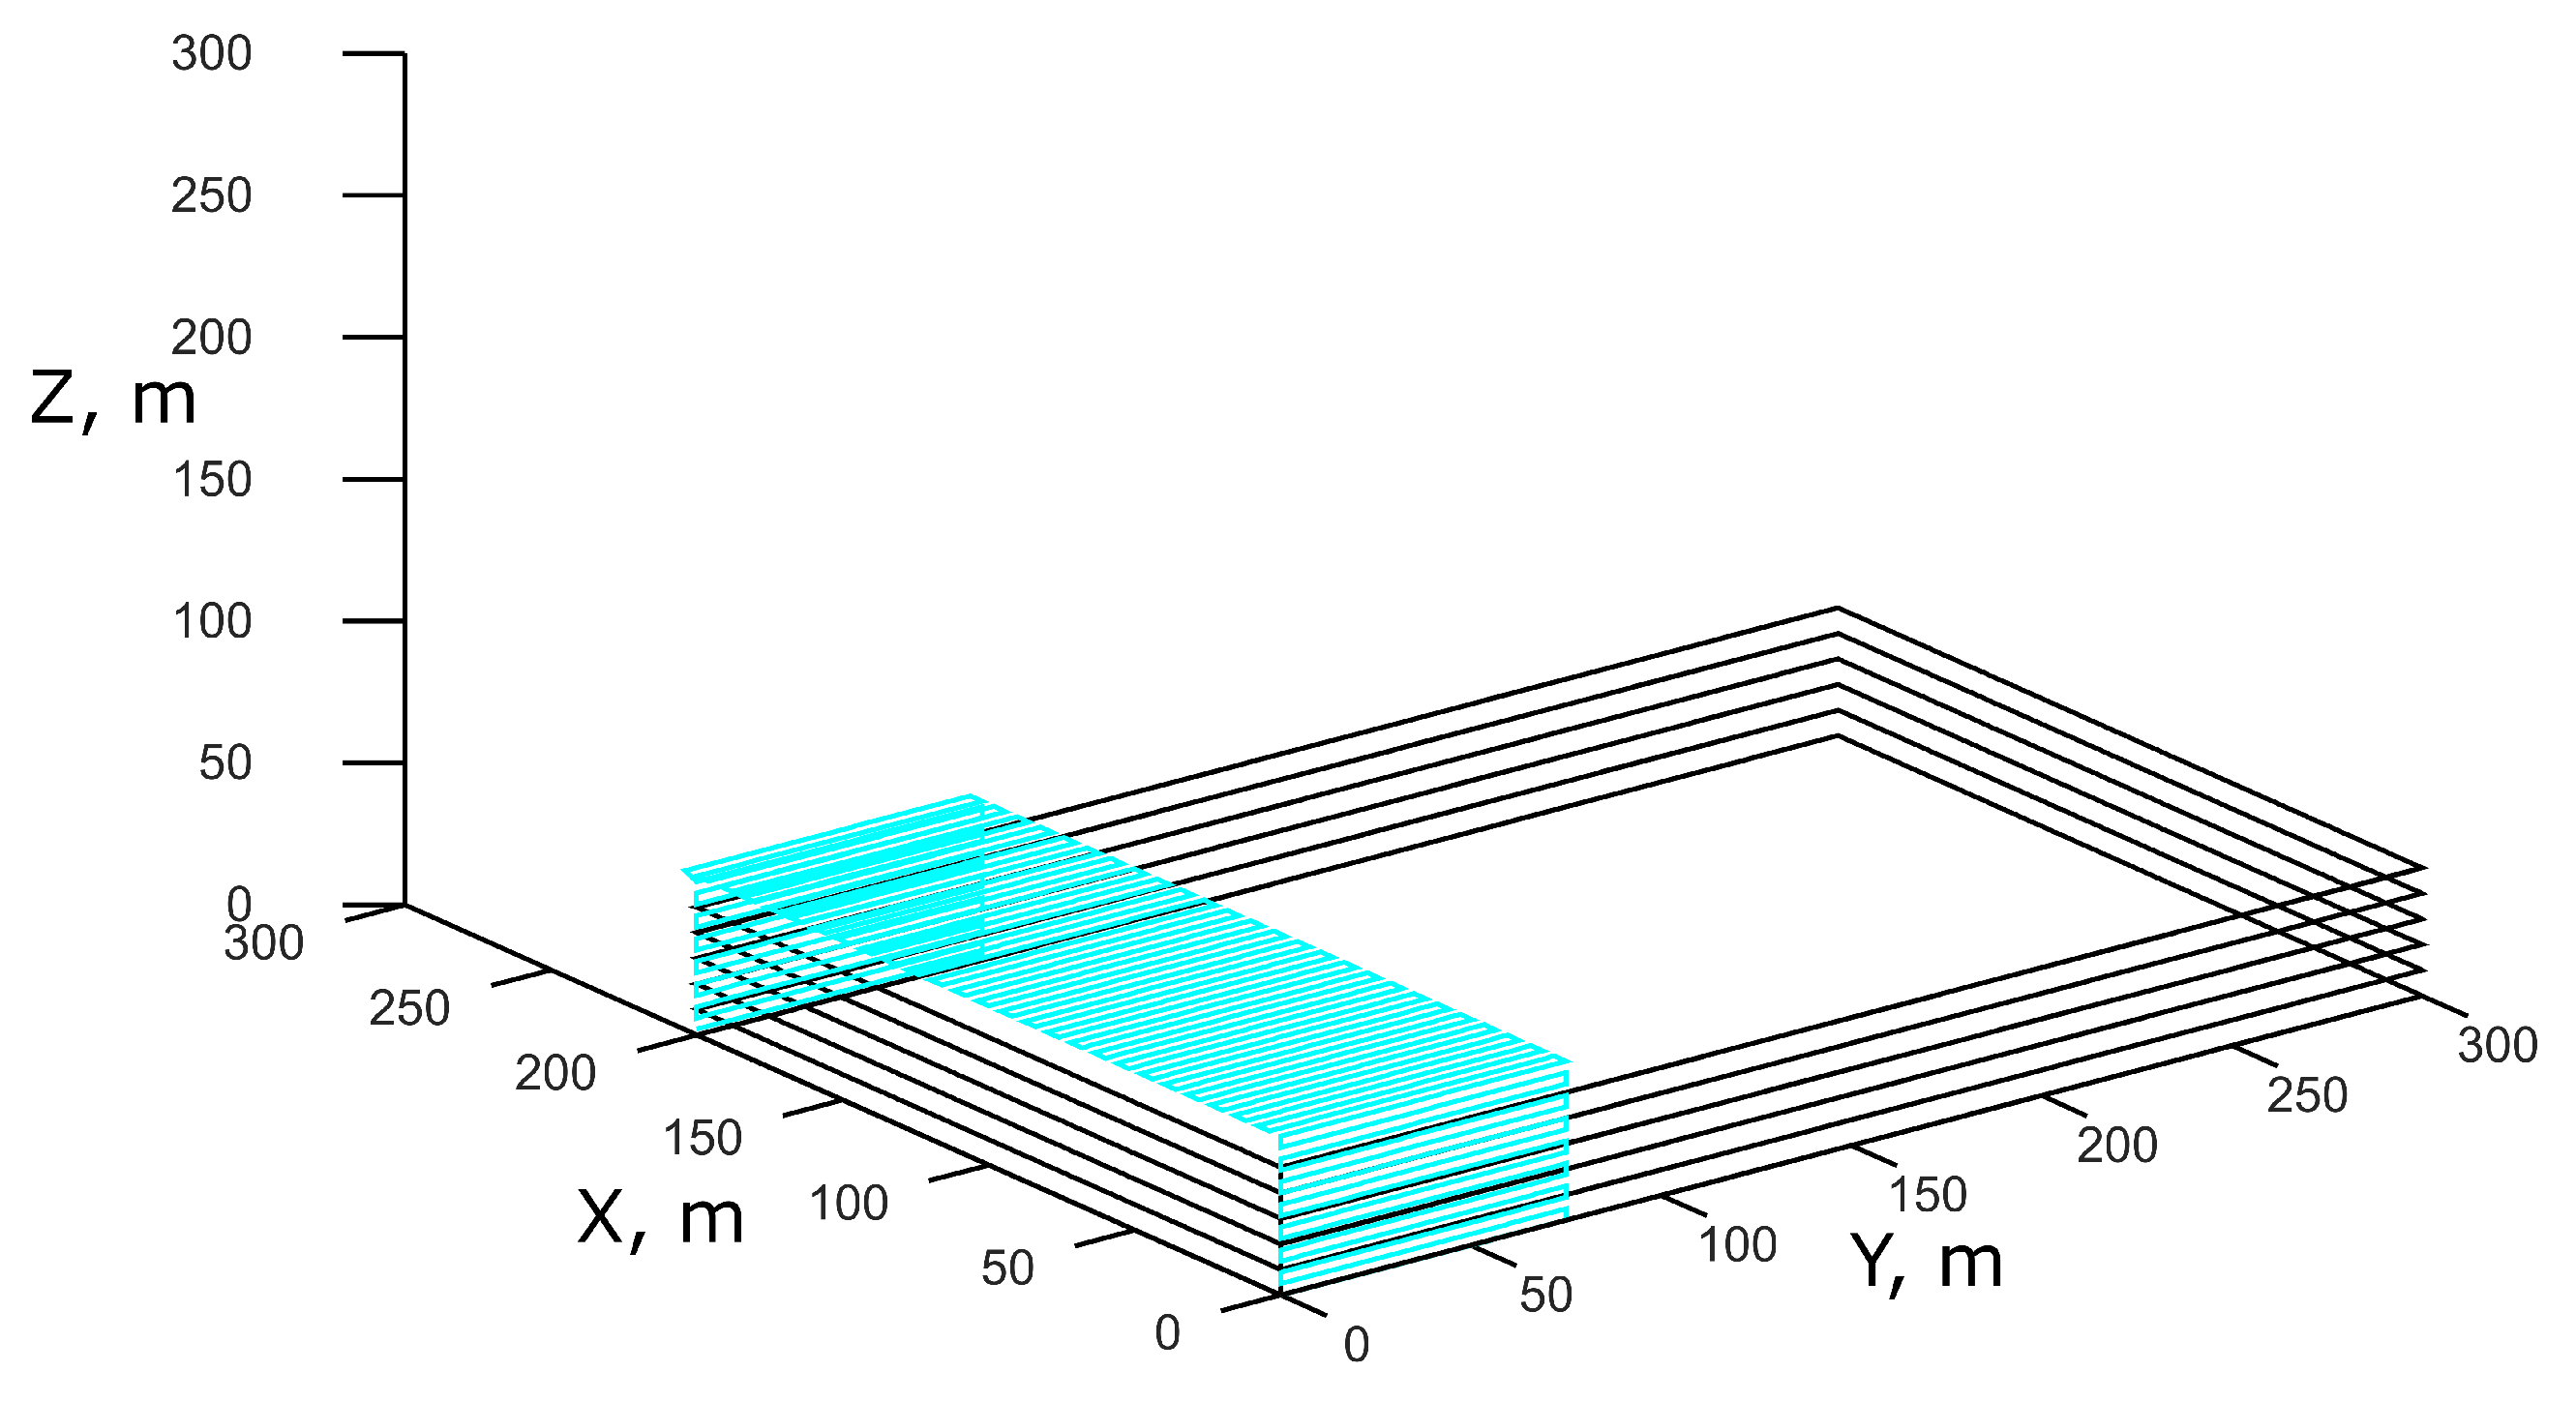
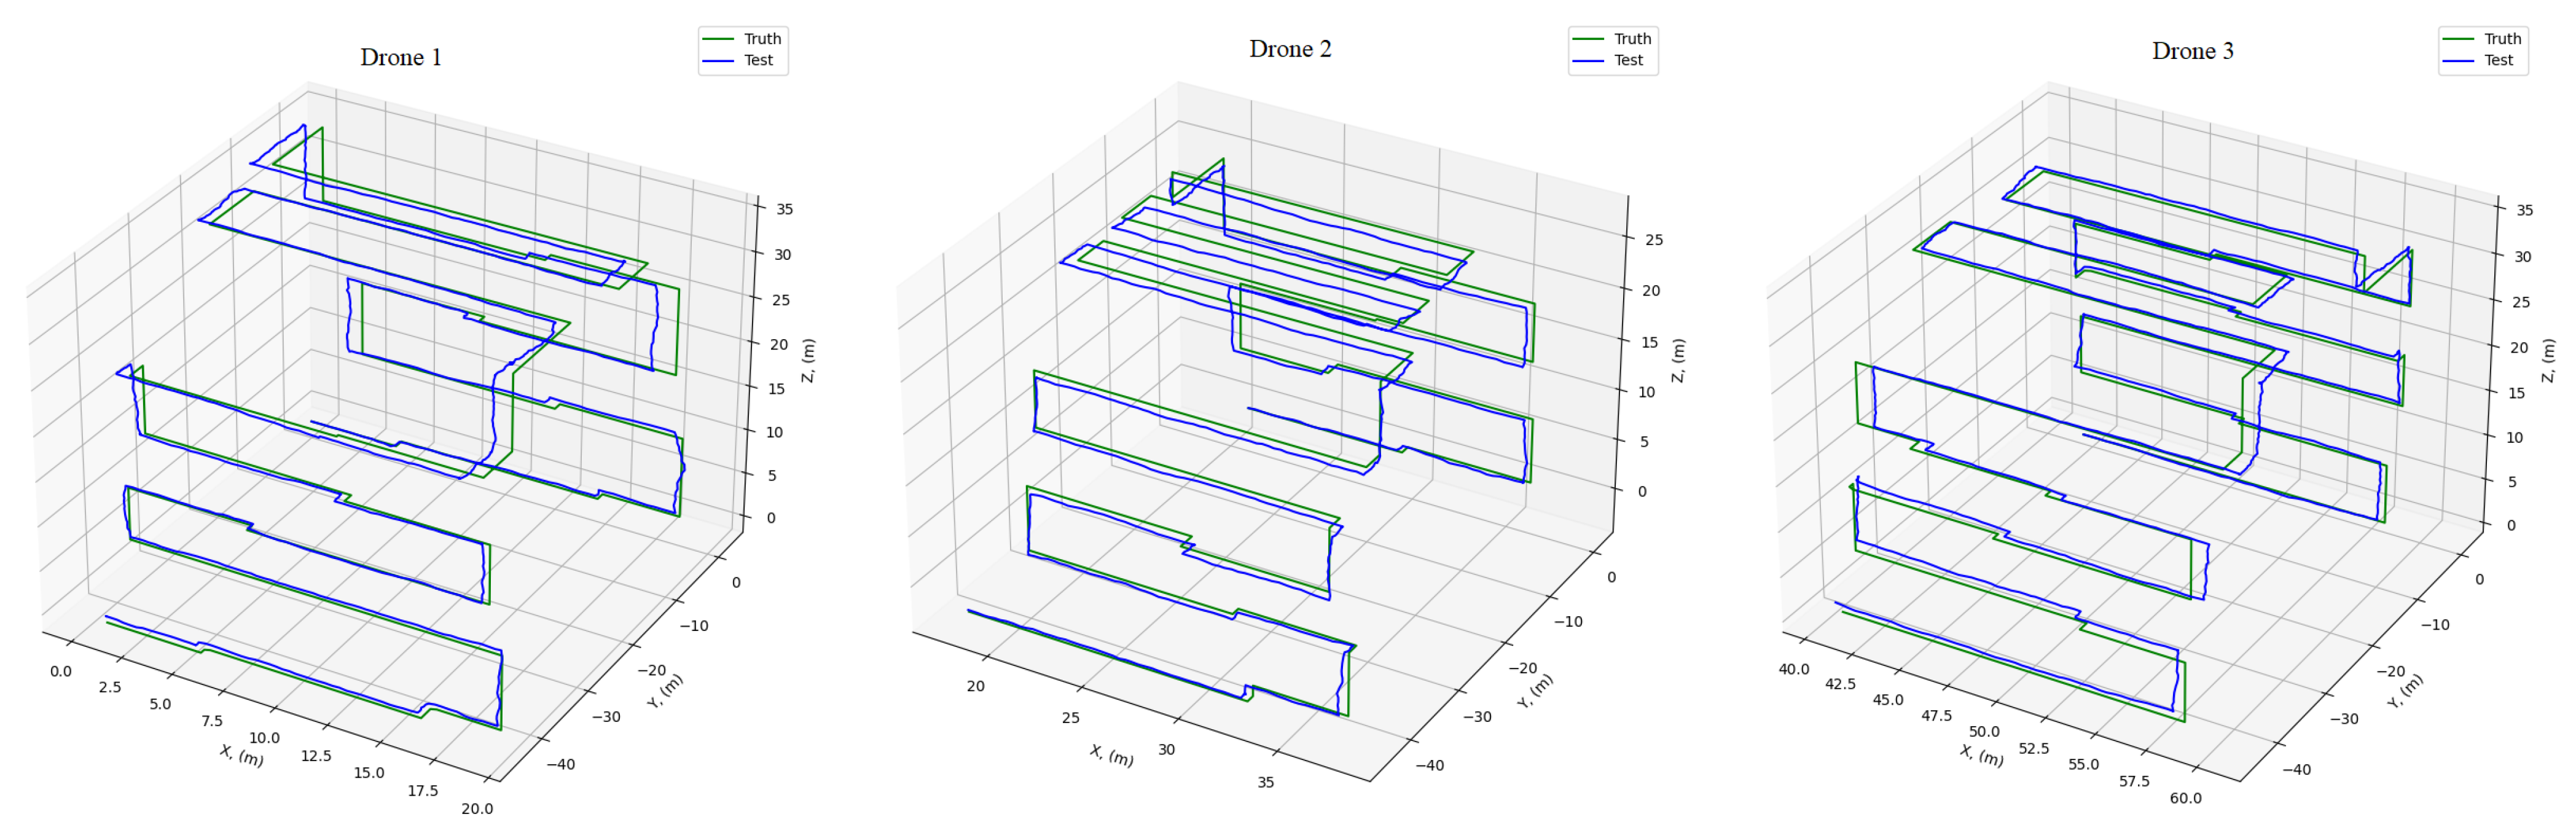
  • Knowing the rough boundaries of a building 60 × 40 × 30, the area was divided into 3 parts—each for one drone;
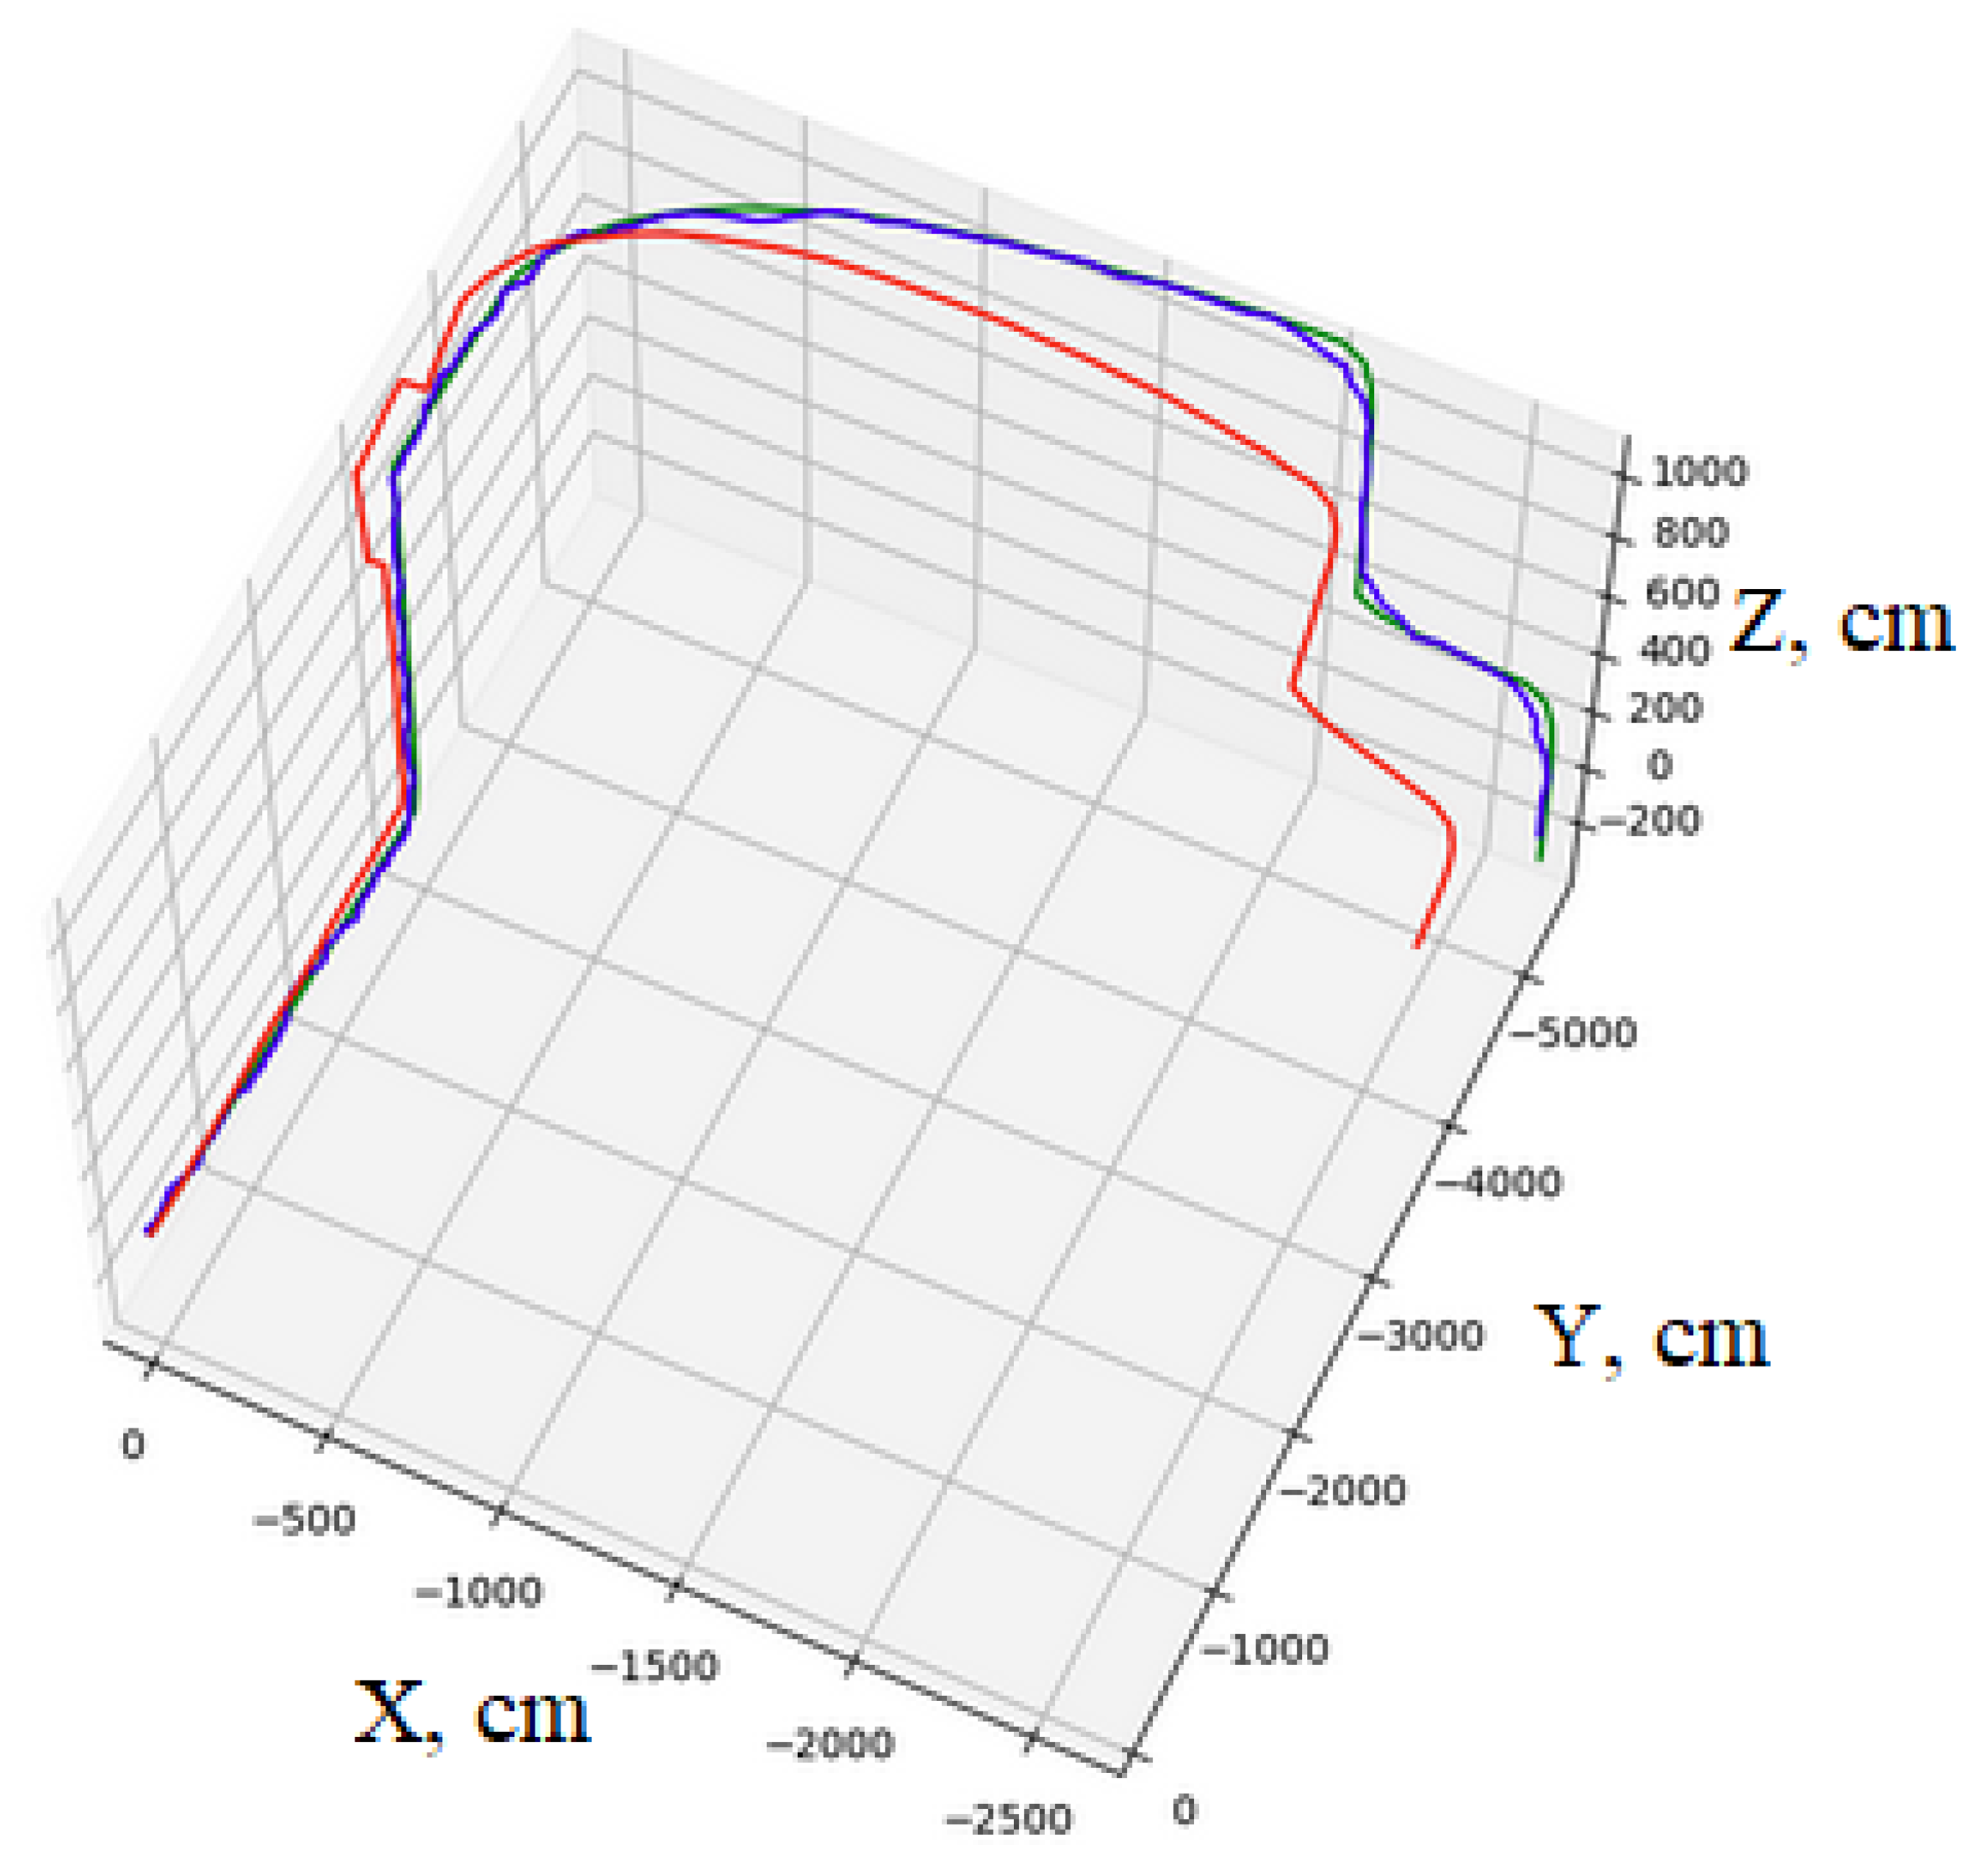
  • The trajectory for each drone was constructed independently. The beginning point for each drone is set manually according to the division on sub-areas;
  • Each drone follows the trajectory, keeping a constant distance to the building. If the distance is changed (i.e., because of unevenness of a building wall), the trajectory of the drone is updated to keep the constant distance;
  • After the drone reaches the end of its trajectory, it returns back to the point of the beginning;
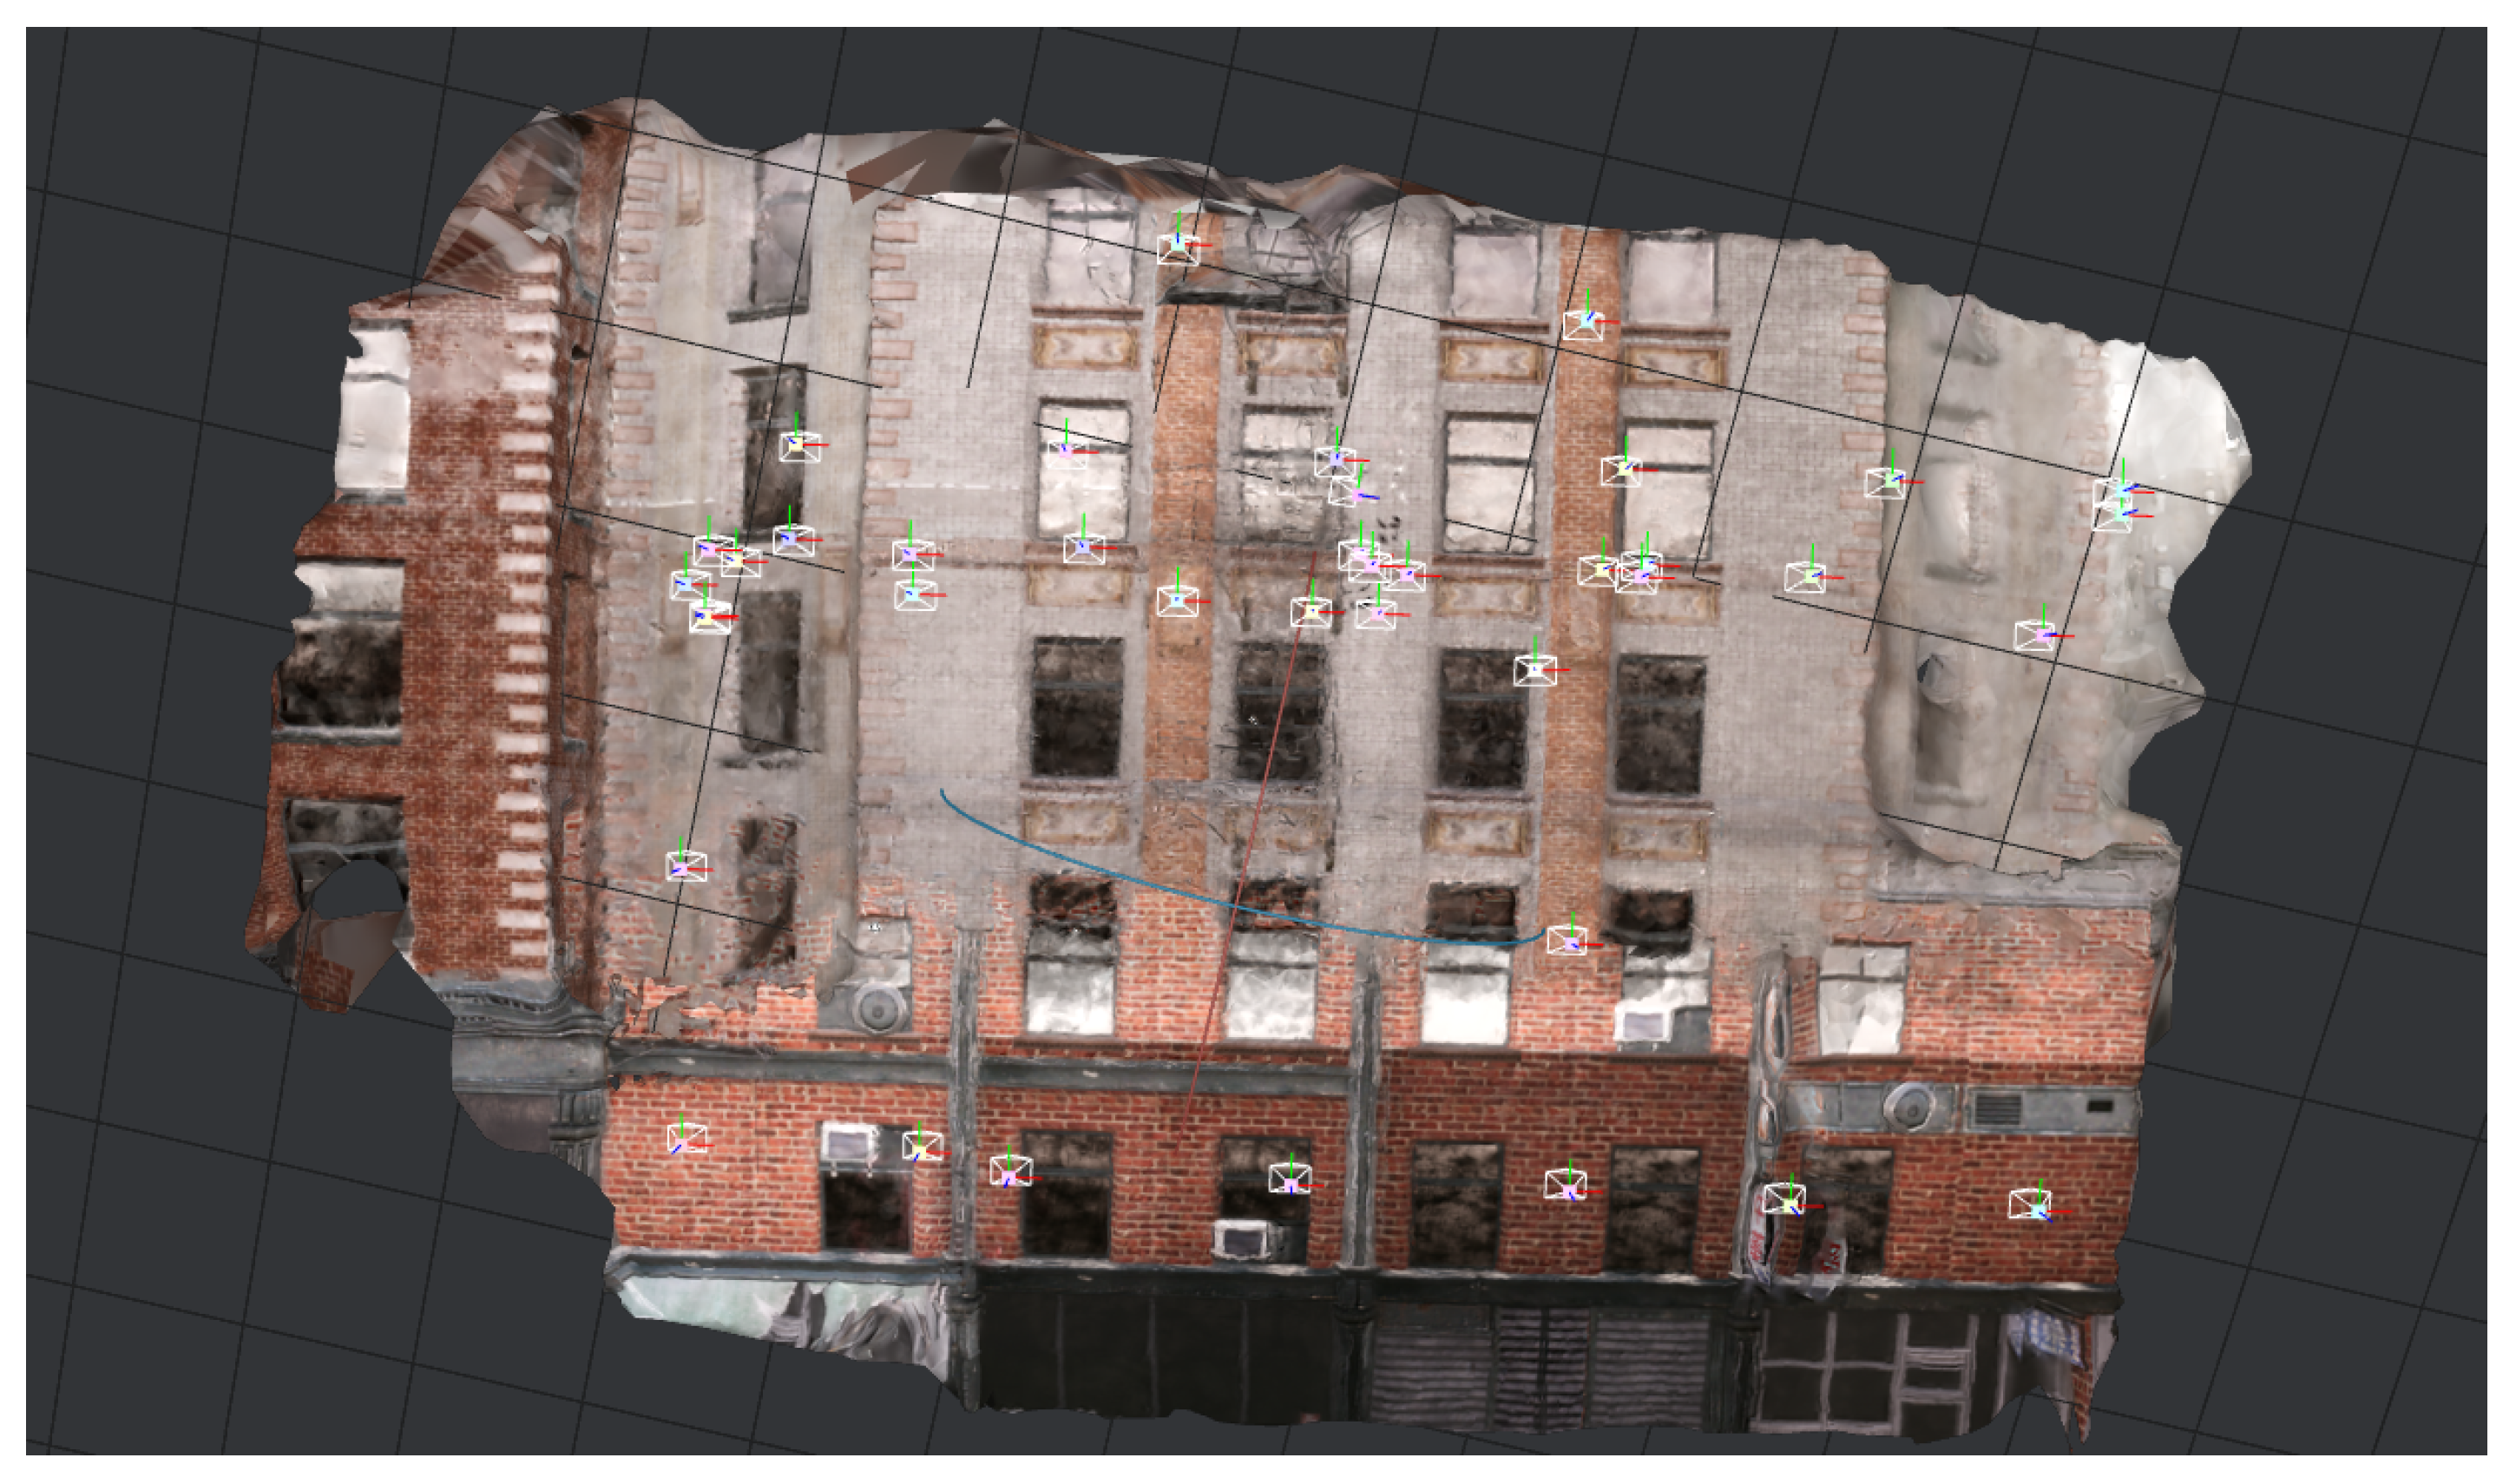
  • Captured images are provided to Meshroom [24] to construct a 3D model of a building.
The results of the fourth step can be estimated quantitatively and the output of the fifth step can be estimated qualitatively.
The mean absolute error and maximum error of trajectory in comparison to ground truth can be found in Table 1.
Figure 9 shows the trajectory result for every drone. It also shows the groundtruth trajectory; positions which the drone took, and the trajectory that was estimated during the flight.
According to the experiment, the length of the trajectory is 345 m for a single drone. The maximum error of the trajectory in this length is 0.74 m. Moreover, the trajectories of the drones do not cross, the drones do not bump into each other, and they safely complete their tasks. This means that the process of trajectory estimation is accurate.
The output of modeling in Meshroom is presented in Figure 10. It is important to mention that the 3D visualization in Meshroom is performed once after the drones have completed their flight. The visualization is based only on the captured images and does not take into account the estimated positions of the drones. The construction of the 3D map online is one of the future tasks.
To sum up, there were 3 drones in the experiment, and their average speed was 1.15 m/s. They completed the observation of the building (60 × 40 × 30 m) in 5 min and flew approximately 345 m. During the flight, the average error of estimated trajectory was 0.4 m. A total of 1076 images were captured, and the resulting 3D recognition was acceptable. This means that Formulas (5) and (9) successfully provide the estimation of such parameters as distance to the building, amount of spiral turns, and delta between spiral turns.
The Table 2 synthetically connects parameters, such as building boundaries, amount of drones, drone maximum trajectory, distance to a building, and percentage of overlap. In addition, the expectation of photogrammetry quality is presented. This expectation is based on the fact that the overlap should be greater than 50% to make sure that there exist feature points that are observed in at least three different positions. It is assumed that the camera angles of view fit the following equation:
t g 2 ( V . F O V / 2 ) ( 1 + t g 2 ( H . F O V / 2 ) ) 1 t g 2 ( H . F O V / 2 ) t g 2 ( V . F O V / 2 ) 1

5. Conclusions

In the paper, a parameterized method for multidrone 3D reconstruction of buildings is presented. The proposed approach allows all drones to work simultaneously, autonomously, and independently because of an algorithm of workload distribution and because of a combination of online (descriptor-based) and offline (photogrammetry) mapping. Usage of visual odometry as a main localization approach allows the application of relatively low-cost drones, which are not equipped with LiDARs, RGBD cameras, or GPS sensors. The general nature of the method allows it to apply the solution for multiple different tasks with varying 3D reconstruction quality, image capture speed, and number of drones using the method parameters. The results of the numerical experiments have shown that parameter values can be estimated by performing simple computations requiring only general information about reconstructed buildings and drone capabilities. Additional experiments in a complex virtual environment with RGB camera model and a set of virtual drones have shown that localization precision and online map quality are enough for performing autonomous multidrone 3D reconstruction of a whole building.
In addition, we presented formulas that connect the characteristics of cameras and drones, and the rough estimations of a building with the number of drones that are required for 3D reconstruction.
The possible directions for further improvements are as follows: (a) optimization of an image capturing algorithm for reducing the number of images for the given quality requirements of a reconstructed model, (b) support of trajectory patterns for non-convex buildings, (c) improving quality of an offline map by using online map data and trajectory estimations, (d)processing the experiments on real drones. For these purposes it is planned to use DJITello drones [22].
In addition, it is important to mention that the future work includes the continuation of research in the AI area. According to the current method, the feature points are being detected in the images with regular computer vision methods. However, it is possible to apply machine learning to increase the robustness of the feature extraction. ML techniques could be applied to the localization process. In the described work it is performed with visual odometry, which is also based on feature extraction. However, in the future we plan to update this process by applying neural networks for feature detection.
Last but not least, in tye future will be possible to update an offline map (that is now constructed in Meshroom) using estimations of an online map. This allows one to apply the position estimations in the photogrammetry process and also provides a flexible tuning of foreshortening on online map data.

Author Contributions

Conceptualization, K.K., M.Z. and A.F.; methodology, M.Z. and A.F.; software, M.Z.; validation, A.F.; formal analysis, A.F.; investigation, M.Z. and A.F.; resources, M.Z.; data curation, K.K.; writing—original draft preparation, M.Z. and A.F.; writing—review and editing, K.K.; visualization, A.F.; supervision, K.K.; project administration, A.F.; funding acquisition, K.K. All authors have read and agreed to the published version of the manuscript.

Funding

This work was supported by the Ministry of Science and Higher Education of the Russian Federation by the Agreement number 075-15-2020-933 dated 13.11.2020 on the provision of a grant in the form of subsidies from the federal budget for the implementation of state support for the establishment and development of the world-class scientific center “Pavlov center” Integrative physiology for medicine, high-tech healthcare, and stress-resilience technologies.

Institutional Review Board Statement

Not applicable.

Informed Consent Statement

Not applicable.

Acknowledgments

The authors would like to thank Saint Petersburg Electrotechnical University “LETI” for providing support and materials for working on this paper. Authors would also like to thank Gleb Bessudnov and Arina Kormschikova for considerable input in this research. Some materials and equipment were provided by JetBrains Research.

Conflicts of Interest

The authors declare no conflict of interest.

References

  1. Drone Services Market by Type, Application, Industry, Solution, and Region—Global Forecast to 2026. Available online: https://www.marketsandmarkets.com/Market-Reports/drone-services-market-80726041.html (accessed on 9 October 2021).
  2. Drone Data Services Market Size, Share & Trends Analysis Report by Service Type, by Platform, by End-Use, by Region, and Segment Forecasts, 2018–2025. Available online: https://www.grandviewresearch.com/industry-analysis/drone-data-services-market (accessed on 9 October 2021).
  3. An, Q.; Shen, Y. On the performance analysis of active visual 3d reconstruction in multi-agent networks. In Proceedings of the 2019 11th International Conference on Wireless Communications and Signal Processing (WCSP), Xi’an, China, 23–25 October 2019; pp. 1–5. [Google Scholar]
  4. Aydın, M.; Bostancı, E.; Güzel, M.S.; Kanwal, N. Multiagent Systems for 3D Reconstruction Applications. Multi Agent Syst. Strateg. Appl. 2020, 25. [Google Scholar] [CrossRef] [Green Version]
  5. Meng, W.; Yang, Q.; Sarangapani, J.; Sun, Y. Distributed control of nonlinear multiagent systems with asymptotic consensus. IEEE Trans. Syst. Man Cybern. Syst. 2017, 47, 749–757. [Google Scholar] [CrossRef]
  6. Daftry, S.; Hoppe, C.; Bischof, H. Building with drones: Accurate 3D facade reconstruction using MAVs. In Proceedings of the 2015 IEEE International Conference on Robotics and Automation (ICRA), Seattle, WA, USA, 26–30 May 2015; pp. 3487–3494. [Google Scholar]
  7. Ahmad, F.; Shin, C.; Chai, E.; Sundaresan, K.; Govindan, R. ARES: Accurate, Autonomous, Near Real-time 3D Reconstruction using Drones. arXiv 2021, arXiv:2104.08634. [Google Scholar]
  8. Nair, S.; Ramachandran, A.; Kundzicz, P. Annotated reconstruction of 3D spaces using drones. In Proceedings of the 2017 IEEE MIT Undergraduate Research Technology Conference (URTC), Cambridge, MA, USA, 3–5 November 2017; pp. 1–5. [Google Scholar]
  9. Anwar, N.; Izhar, M.A.; Najam, F.A. Construction monitoring and reporting using drones and unmanned aerial vehicles (UAVs). In Proceedings of the Tenth International Conference on Construction in the 21st Century (CITC-10), Colombo, Sri Lanka, 2–4 July 2018; pp. 2–4. [Google Scholar]
  10. McAlinden, R.; Suma, E.; Grechkin, T.; Enloe, M. Procedural reconstruction of simulation terrain using drones. In Proceedings of the Interservice/Industry Training, Simulation, and Education Conference (I/ITSEC), Orlando, FL, USA, 30 November–4 December 2015; pp. 1–12. [Google Scholar]
  11. Minos-Stensrud, M.; Haakstad, O.H.; Sakseid, O.; Westby, B.; Alcocer, A. Towards Automated 3D reconstruction in SME factories and Digital Twin Model generation. In Proceedings of the 2018 18th International Conference on Control, Automation and Systems (ICCAS), PyeongChang, Korea, 17–20 October 2018; pp. 1777–1781. [Google Scholar]
  12. Peralta, D.; Casimiro, J.; Nilles, A.M.; Aguilar, J.A.; Atienza, R.; Cajote, R. Next-best view policy for 3D reconstruction. In Proceedings of the European Conference on Computer Vision, Glasgow, UK, 23–28 August 2020; pp. 558–573. [Google Scholar]
  13. Milani, S.; Memo, A. Impact of drone swarm formations in 3D scene reconstruction. In Proceedings of the 2016 IEEE International Conference on Image Processing (ICIP), Phoenix, AZ, USA, 25–28 September 2016; pp. 2598–2602. [Google Scholar]
  14. Renwick, J.D.; Klein, L.J.; Hamann, H.F. Drone-based reconstruction for 3D geospatial data processing. In Proceedings of the 2016 IEEE 3rd World Forum on Internet of Things (WF-IoT), Reston, VA, USA, 12–14 December 2016; pp. 729–734. [Google Scholar]
  15. Zhang, G.; Shang, B.; Chen, Y.; Moyes, H. SmartCaveDrone: 3D cave mapping using UAVs as robotic co-archaeologists. In Proceedings of the 2017 International Conference on Unmanned Aircraft Systems (ICUAS), Miami, FL, USA, 13–16 June 2017; pp. 1052–1057. [Google Scholar]
  16. Rakha, T.; Gorodetsky, A. Review of Unmanned Aerial System (UAS) applications in the built environment: Towards automated building inspection procedures using drones. Autom. Construct. 2018, 93, 252–264. [Google Scholar] [CrossRef]
  17. Mentasti, S.; Pedersini, F. Controlling the flight of a drone and its camera for 3D reconstruction of large objects. Sensors 2019, 19, 2333. [Google Scholar] [CrossRef] [PubMed] [Green Version]
  18. Shang, Z.; Shen, Z. Real-time 3D reconstruction on construction site using visual SLAM and UAV. arXiv 2017, arXiv:1712.07122. [Google Scholar]
  19. Huang, F.; Yang, H.; Tan, X.; Peng, S.; Tao, J.; Peng, S. Fast Reconstruction of 3D Point Cloud Model Using Visual SLAM on Embedded UAV Development Platform. Remote Sens. 2020, 12, 3308. [Google Scholar] [CrossRef]
  20. Viswanathan, D.G. Features from accelerated segment test (fast). In Proceedings of the 10th Workshop on Image Analysis for Multimedia Interactive Services, London, UK, 6–8 May 2009; pp. 6–8. [Google Scholar]
  21. OpenCV 3.0 Based Algorithm of Visual Odometry. Available online: https://github.com/avisingh599/mono-vo (accessed on 9 October 2021).
  22. DJI Tello Drone. Available online: https://www.ryzerobotics.com/tello (accessed on 9 October 2021).
  23. Unreal Engine 3D Creation Tool. Available online: https://www.unrealengine.com/en-US/ (accessed on 9 October 2021).
  24. AliceVision. Meshroom: A 3D Reconstruction Software. Available online: https://github.com/alicevision/meshroom (accessed on 9 October 2021).
Figure 1. The division into subareas.
Mathematics 09 03033 g001
Figure 2. The trajectory of a drone and the parameters.
Mathematics 09 03033 g002
Figure 3. Kalman filtration applien to the trajectory estimation by visual odometry. Green—groundtruth, red—pure VO, blue—VO + filtration.
Mathematics 09 03033 g003
Figure 4. Divided trajectory in several parts when the drone resources are not enough to cover the whole building in one flight.
Mathematics 09 03033 g004
Figure 5. Trajectory around a building 300 × 200 × 50. All axes in the same scale.
Mathematics 09 03033 g005
Figure 6. Zoomed in trajectory around a building 300 × 200 × 50.
Mathematics 09 03033 g006
Figure 7. Two overlapped images from the camera, captured in the different height. a and b are the height and width of the camera view.
Mathematics 09 03033 g007
Figure 8. The camera’s area of view.
Mathematics 09 03033 g008
Figure 9. Estimated trajectory of all drones and the groundtruth trajectory.
Mathematics 09 03033 g009
Figure 10. Result of 3D visualization in Meshroom.
Mathematics 09 03033 g010
Table 1. Mean absolute error and maximum error of trajectory in comparison to ground truth.
Drone 1Drone 2Drone 3
MAE of trajectory, m 0.41 ± 0.14 0.40 ± 0.14 0.35 ± 0.13
Max error of trajectory, m 0.72 0.700.74
Table 2. Parameter configurations that fit the obtained formulas, where X, Y, Z—building length, width, and height, trajectory resource—the average speed of a drone multiplied to the average battery time resource.
X, mY, mZ, mNumberTrajectoryDistance toOverlapExpected Quality
of DronesResource, mthe Building, mof Imagesof Photogrammetry
100503011200150.45average
10050302120050.17low
100503021200100.59high
10050302240050.61high
100503022400100.80high
10050303120050.45average
100503031200100.72high
10050303240050.74high
100503032400100.87high
2001005022400100.20low
200100503120050fail
2001005031200100fail
200100503240050fail
2001005032400100.47average
200100504120050fail
2001005041200100.13low
200100504240050.20low
2001005042400100.60high
Publisher’s Note: MDPI stays neutral with regard to jurisdictional claims in published maps and institutional affiliations.

