You are currently viewing a new version of our website. To view the old version click .
Mathematics
  • Article
  • Open Access

17 October 2021

INF-GAN: Generative Adversarial Network for Illumination Normalization of Finger-Vein Images

,
,
,
and
Division of Electronics and Electrical Engineering, Dongguk University, 30 Pildong-ro, 1-gil, Jung-gu, Seoul 04620, Korea
*
Author to whom correspondence should be addressed.
This article belongs to the Special Issue Machine Learning in Image Processing and Pattern Recognition: Modern Methods and Applications

Abstract

When images are acquired for finger-vein recognition, images with nonuniformity of illumination are often acquired due to varying thickness of fingers or nonuniformity of illumination intensity elements. Accordingly, the recognition performance is significantly reduced as the features being recognized are deformed. To address this issue, previous studies have used image preprocessing methods, such as grayscale normalization or score-level fusion methods for multiple recognition models, which may improve performance in images with a low degree of nonuniformity of illumination. However, the performance cannot be improved drastically when certain parts of images are saturated due to a severe degree of nonuniformity of illumination. To overcome these drawbacks, this study newly proposes a generative adversarial network for the illumination normalization of finger-vein images (INF-GAN). In the INF-GAN, a one-channel image containing texture information is generated through a residual image generation block, and finger-vein texture information deformed by the severe nonuniformity of illumination is restored, thus improving the recognition performance. The proposed method using the INF-GAN exhibited a better performance compared with state-of-the-art methods when the experiment was conducted using two open databases, the Hong Kong Polytechnic University finger-image database version 1, and the Shandong University homologous multimodal traits finger-vein database.

1. Introduction

Biometrics are replacing traditional authentication methods in several fields requiring security. Biometric identifiers include fingerprint, iris, face, and finger-vein. Biometrics using finger-vein have the following advantages [1]. (1) As veins are hidden inside the body, there is little risk of forgery or theft, and the surface conditions of the hands have no effect on authentication. (2) The use of infrared light allows for noninvasive, contactless imaging that ensures both convenience and cleanliness for the user experience. (3) Vein patterns are stable and clearly defined, allowing the use of low-resolution cameras to capture vein images for small-size, simple data image processing. As finger-vein images are captured using near-infrared (NIR) light when deoxygenated hemoglobin inside the vein absorbs NIR illumination [2], a blur may occur or low-quality images with poor illumination may be acquired due to the difference in thicknesses of fingers, the nonuniformity of illumination intensity, and light scattering as light passes through the skin layer [3,4]. Low-quality images due to blur or poor illumination, significantly affect the recognition performance; thus, with the advancements in deep-learning technology, extensive research is being conducted on finger-vein recognition using a convolutional neural network (CNN) [5,6]. For solving the problem of low-quality image recognition due to blur or nonuniform illumination in finger-vein images, various methods in which a blur is removed by restoring images or a vein pattern is restored using a generative adversarial network (GAN) have been studied [7,8]. Further, methods to ensure robust training through CNN recognition using a GAN in data augmentation have been studied [9]. However, the restoration of only optical blur was considered in the previous study [7]; the restoration method of focusing on a vein shape was difficult to apply to a severe case of nonuniformity of illumination where images were entirely or partially bright or dark due to nonuniform illumination in the previous study [8]. As in the previous study [9], performing data augmentation by adding random noise to input data is inappropriate for solving the problem of nonuniform illumination. Therefore, a method for restoring the severe nonuniformity of illumination based on a GAN for the illumination normalization of finger-vein images (INF-GAN) and for improving the performance of finger-vein recognition is proposed in this paper. The main contributions of our paper are as follows:
-
This study is the first to restore finger-vein images with nonuniform illumination using a GAN.
-
The INF-GAN is newly proposed for the restoration of a finger-vein image with nonuniform illumination.
-
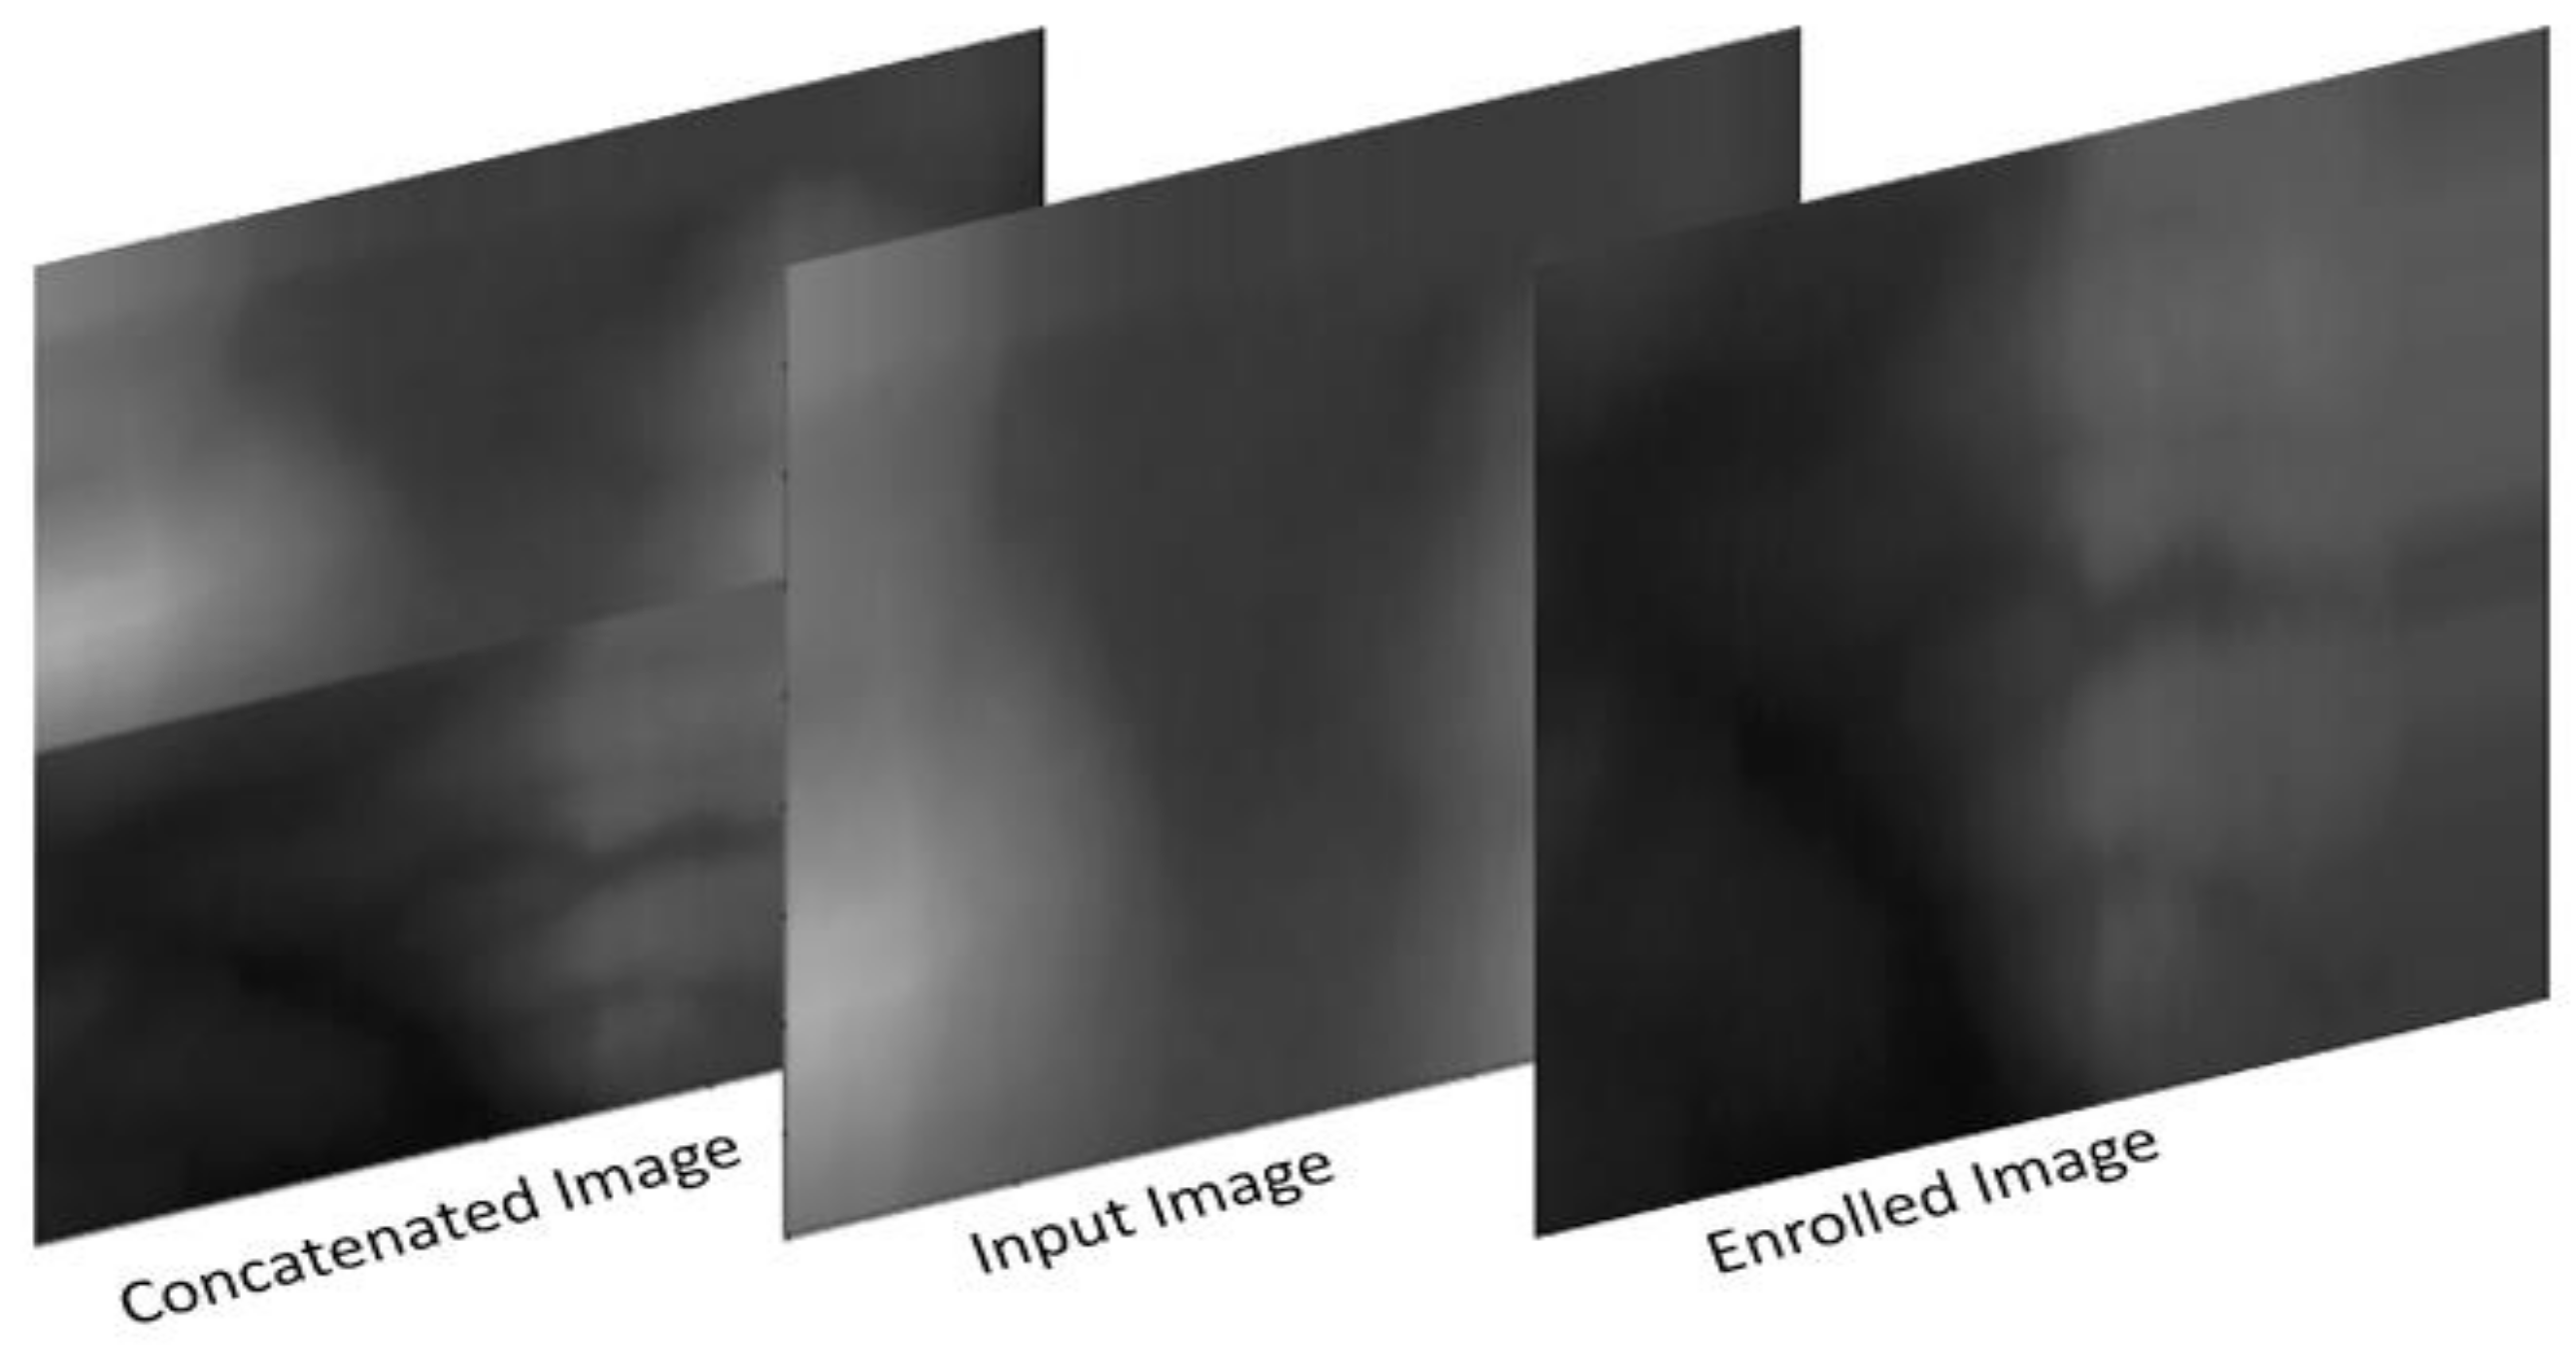
The INF-GAN is based on the conventional Pix2Pix-HD, but uses a ResNet generator and only one PatchGAN discriminator, unlike the Pix2Pix-HD. A residual image-generation block (RIGB) is newly proposed for highlighting the vein texture of images distorted by the severe nonuniformity of illumination. In the INF-GAN, a one-channel residual image containing the finger-vein texture information is generated to be concatenated onto the input, thus improving the restoration performance. Furthermore, a feature encoder network was not used, unlike in Pix2Pix-HD.
-
For a fair performance assessment by other researchers, the nonuniform finger-vein images, INF-GAN, and algorithm proposed in this study are disclosed through [10].
The remainder of this paper is organized as follows. In Section 2, the previous studies are described, and the proposed method is described in Section 3. In Section 4, comparative experiments and experimental results with analysis are described. Finally, in Section 5, the conclusions of this study are provided.

3. Proposed Methods

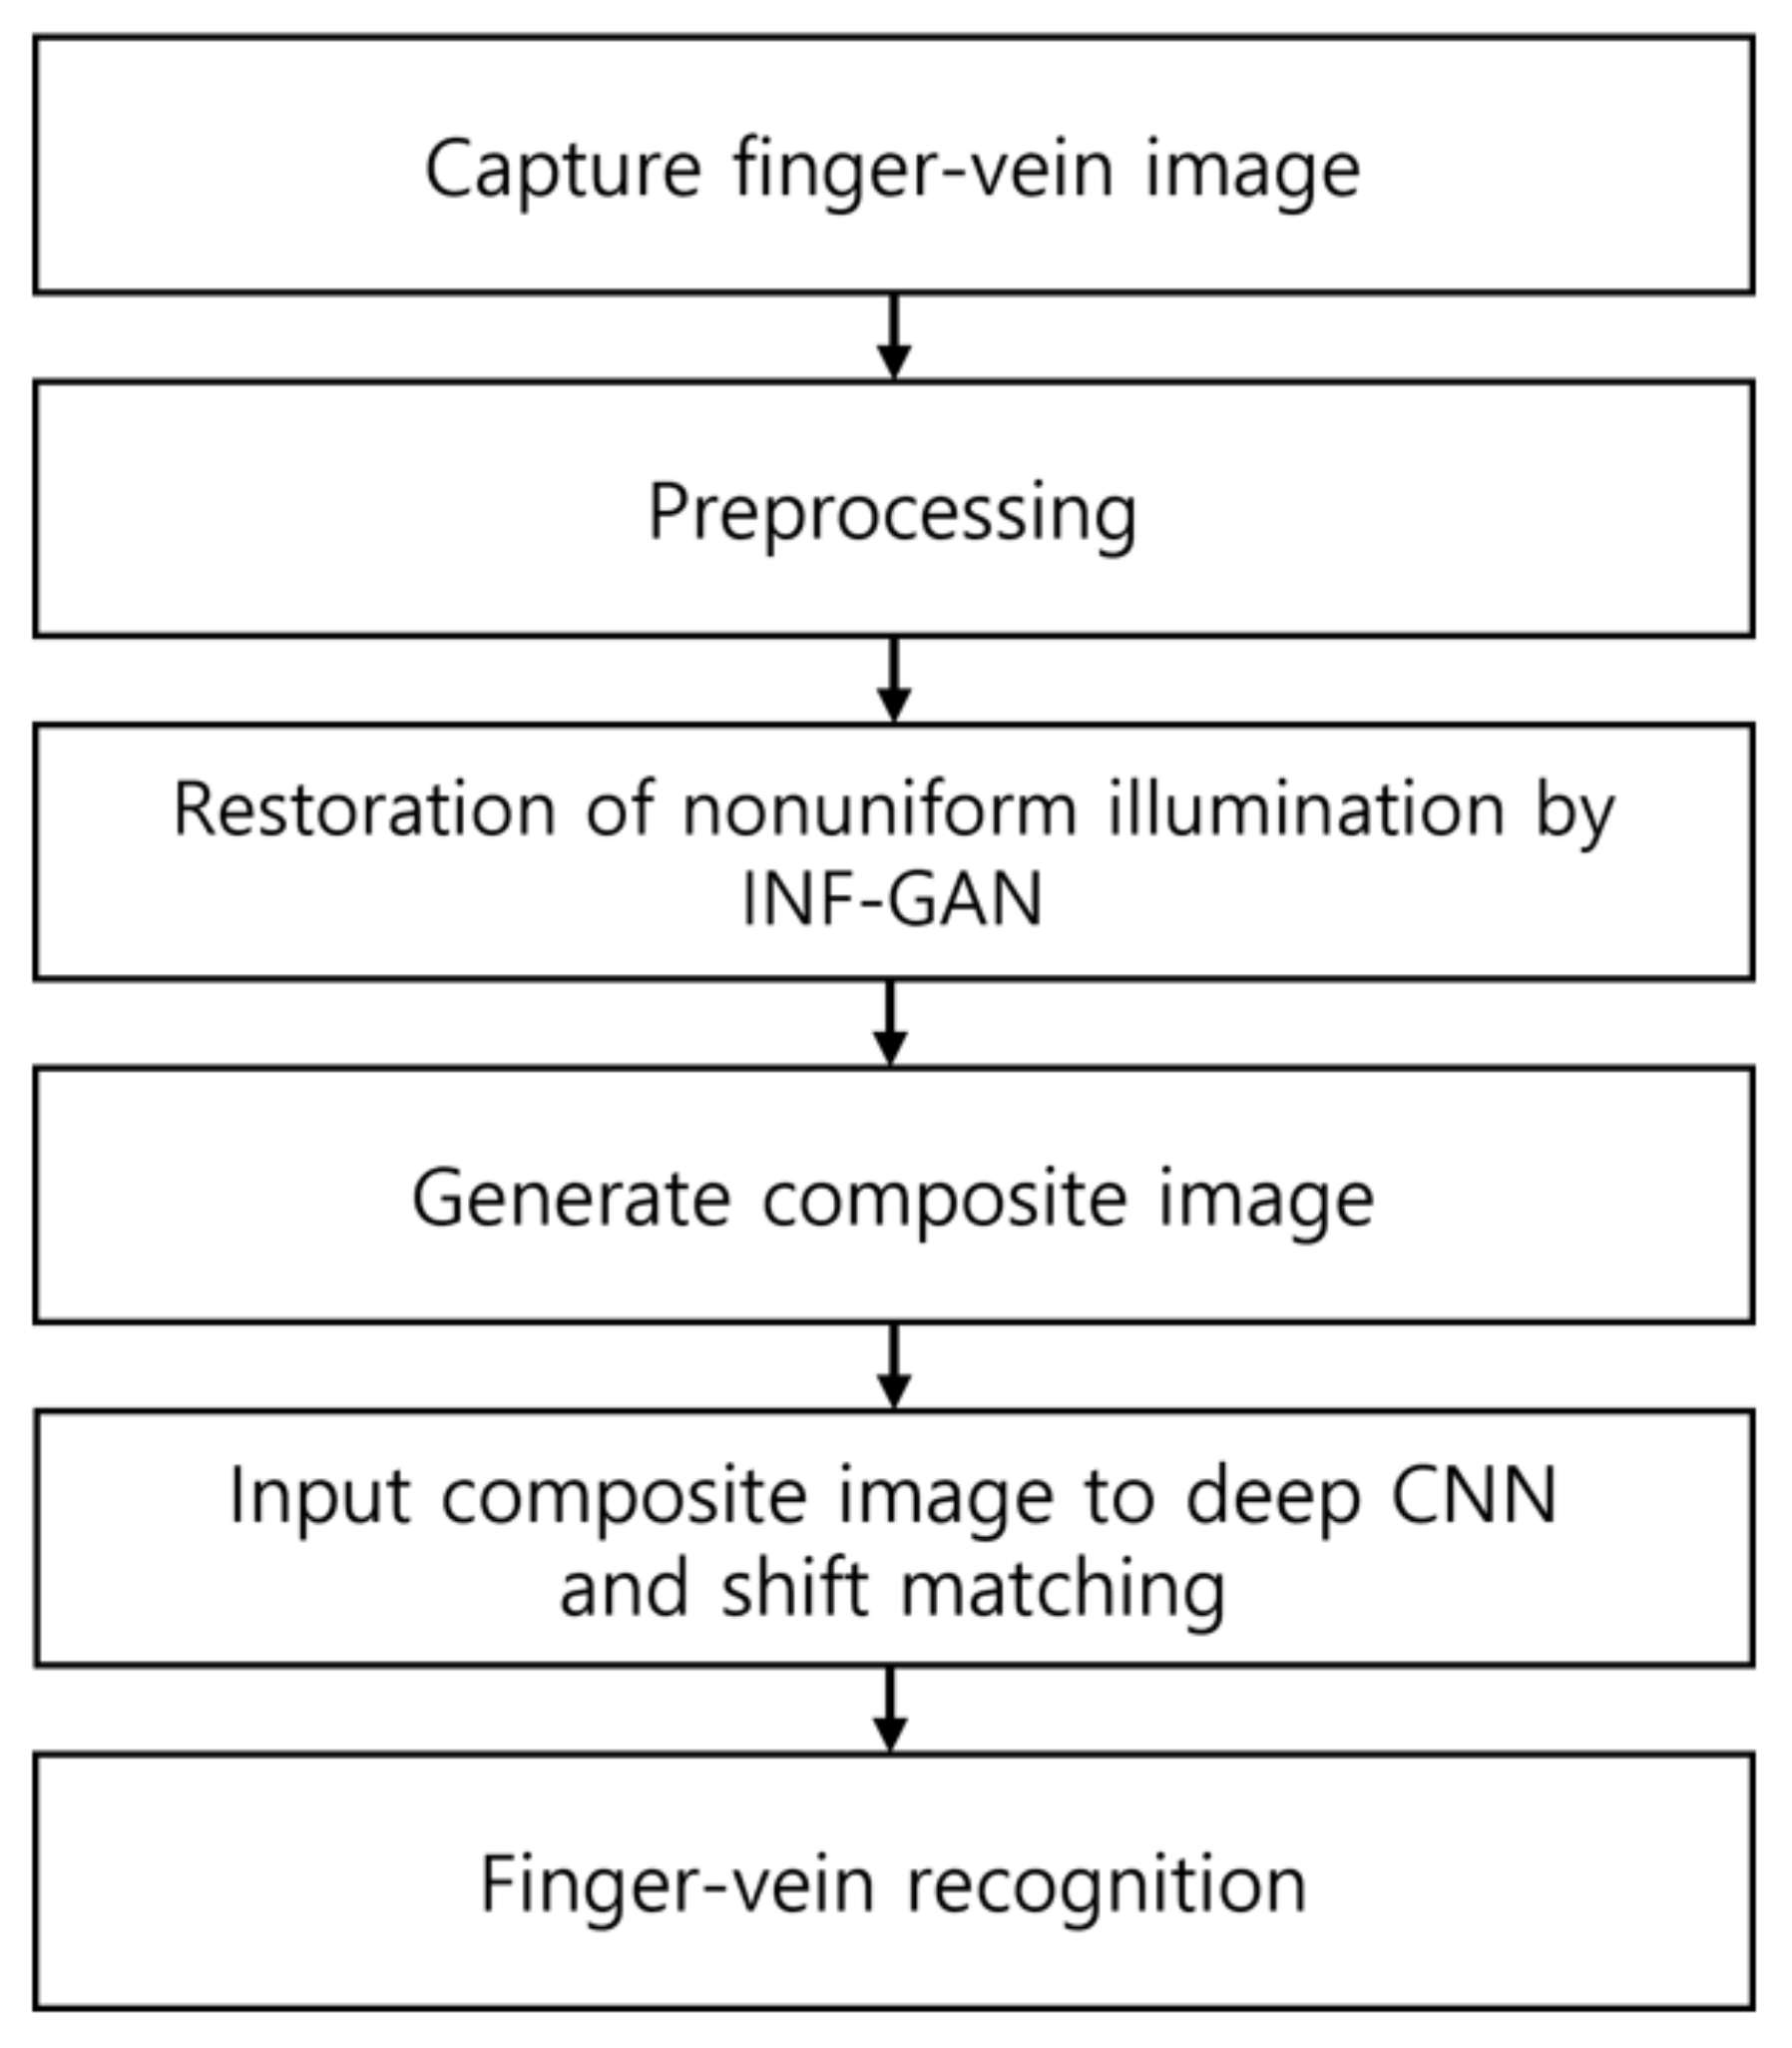
3.1. Overview of the Proposed Method

Figure 1 shows the overall procedure of the proposed method. After obtaining finger-vein images, the finger ROI is detected through preprocessing. Using the INF-GAN proposed in this study, nonuniform illumination is restored. Then, a composite image is generated to be used as input for the CNN, and the final matching score is obtained through shift matching to perform finger-vein recognition.
Figure 1. Overall procedure of the proposed method.

3.2. Preprocessing

The preprocessing shown in Figure 2 was performed to extract the finger ROI in a finger-vein image. For the input image shown in Figure 2a, image binarization using fixed threshold of 127 was performed to obtain the image shown in Figure 2b. That is, for the input image, a pixel value higher than (or the same as) 127 becomes 255 (white) and those lower than 127 becomes 0 (black). As shown in Figure 2c, an edge-map image is obtained by applying the Sobel edge detector to the original input image of Figure 2a. Then, a difference image is obtained as shown in Figure 2d, by subtracting the resulting edge-map image of Figure 2c from the binarized image of Figure 2b. In this case, 0 (black) is assigned to the pixel value of difference image if the subtracted value is less than 0. Then, with the difference image of Figure 2d, local binarization based on 25 × 25 window (binarization threshold is set as the Gaussian average value of pixels of difference image within 25 × 25 window) is performed as area thresholding, which produces the resulting image of Figure 2e. With Figure 2e, contour extraction is performed as shown in Figure 2f. As shown in Figure 2f, finger area is separated from background, and only the finger region is extracted as shown in Figure 2g by component labeling, size filtering based on the selection of largest isolated area, hole filling, and morphological erosion.
Figure 2. Examples of preprocessing: (a) Input image, (b) binarized image, (c) edge-map image, (d) difference image between the binarized and edge-map images, (e) resulting image by area thresholding with (d), (f) resulting image by contour extraction with (e), (g) mask image after component labeling, size filtering, hole filling, and morphological erosion with (f), (h) mask image after rotational alignment with (g), (i) mask image of the ROI with (h), and (j) finger-vein ROI image.
After obtaining the mask image, an in-plane rotation compensation method [20] was used for the rotational alignment of the finger image. Equation (1) was then used to determine the normalized second-order moments using the mask image.
β 11 = x , y R y g y 2 I x , y x , y R I x , y ,         β 12 = x , y R y g y x g x I x , y x , y R I x , y ,       β 22 = x , y R x g x 2 I x , y x , y R I x , y
Here, I ( x , y ) and ( g x , g y ) refer to the pixel value and the position of the center of the mask image, respectively. Using the value obtained from Equation (1), the angle value was calculated in Equation (2). Subsequently, the image in Figure 2h, to which rotational alignment was applied, was obtained.
θ = tan 1 β 11 β 22 + β 11 β 22 2 + 4 β 12 2 2 β 12   i f   β 11 > β 22 tan 1 2 β 12 β 22 β 11 + ( β 22 β 11 ) 2 + 4 β 12 2   i f   β 11 β 22
The ROI was extracted after performing rotational alignment using the mask image. As shown in Figure 2a, the vein pattern cannot be easily observed in the left and right sides of the image due to the fingernail or the thickness of the finger. Therefore, both sides of the image were cut. After cutting the image, a 4 × 20 filter was used to correct the excessively cut part of the image to create the final ROI. Figure 2i shows the mask image of the ROI, and Figure 2j shows the finger-vein image of the ROI.

3.3. Restoration of Nonuniform Illumination by INF-GAN

The performance of a recognition model is significantly reduced if the finger-vein image is transformed to be bright or dark due to severe nonuniform illumination. Features are difficult to find after image transformation due to illumination; thus, the performance cannot be improved through simple preprocessing, such as grayscale normalization or the robust training of a recognition model. Therefore, this study aims to improve the performance against severe nonuniform illumination through image restoration using the newly proposed INF-GAN. The Pix2Pix-HD model [21] was used as a baseline model of the INF-GAN. Pix2Pix-HD is used for obtaining high-resolution images, but it uses a ResNet generator, unlike the conventional image-to-image translation model. Features are extracted from multiple layers of a discriminator, thus generating more photorealistic images using a feature matching loss. In Pix2Pix-HD, two generators and multiple discriminators are used to obtain high-resolution images. However, this study aims to obtain nonuniform illumination restoration instead of obtaining high-resolution images. Thus, one ResNet generator and one discriminator are used in the proposed method. The Pix2Pix-HD model concatenates the instance map containing the image boundary information onto the input image, and generates an output image where the object boundary does not collapse by distinguishing the boundary between objects during training. This study newly proposes an RIGB and applies the concatenation of a residual image containing image texture information onto the input image, thus correcting the texture information that has weakened owing to the transformation of the image to be bright or dark.

3.3.1. Generator of INF-GAN

A ResNet generator is the generator using a residual block in the study by He et al. [22], which can easily train a very deep network where an image can be concentrated on major features to be transformed, thus exhibiting an excellent performance in an image-to-image translation network. However, for severe nonuniform illumination, illumination restoration is difficult, as the skin region and vein region of the finger-vein image become difficult to discern as the image becomes distorted. Using the RIGB proposed in this study, a residual image that evidently shows the vein texture of the input image was used. In this study, a ResNet generator consisting of one RIGB, two 2D convolutional layer blocks, four downsampling blocks, nine residual blocks, and four upsampling blocks was used. In the ResNet generator, a 2D convolutional layer, instance normalization [23], and rectified linear unit (ReLU) activation [24] were used. Table 2 presents the detailed architecture of the ResNet generator used in this study. The detailed architecture of the RIGB in Table 2 is presented in Table 3.
Table 2. Structure of the generator.
Table 3. Structure of the RIGB.
To restore distorted vein texture in this study, a one-channel residual image containing vein texture characteristics was generated from the input image, with a reduced quality due to severe nonuniform illumination, using the RIGB consisting of a 2D Conv block and residual block, as shown in Table 3. This residual image was then concatenated onto the input of the ResNet generator, as shown in Figure 3a. Two residual blocks were used in the RIGB to create a residual image. The vein texture of an image becomes more evident as a greater number of residual blocks are connected. However, only two residual blocks were used in this study, as the edge sharpness of the vein was weakened.
Figure 3. Network architecture of the INF-GAN. (a) ResNet generator and (b) RIGB.

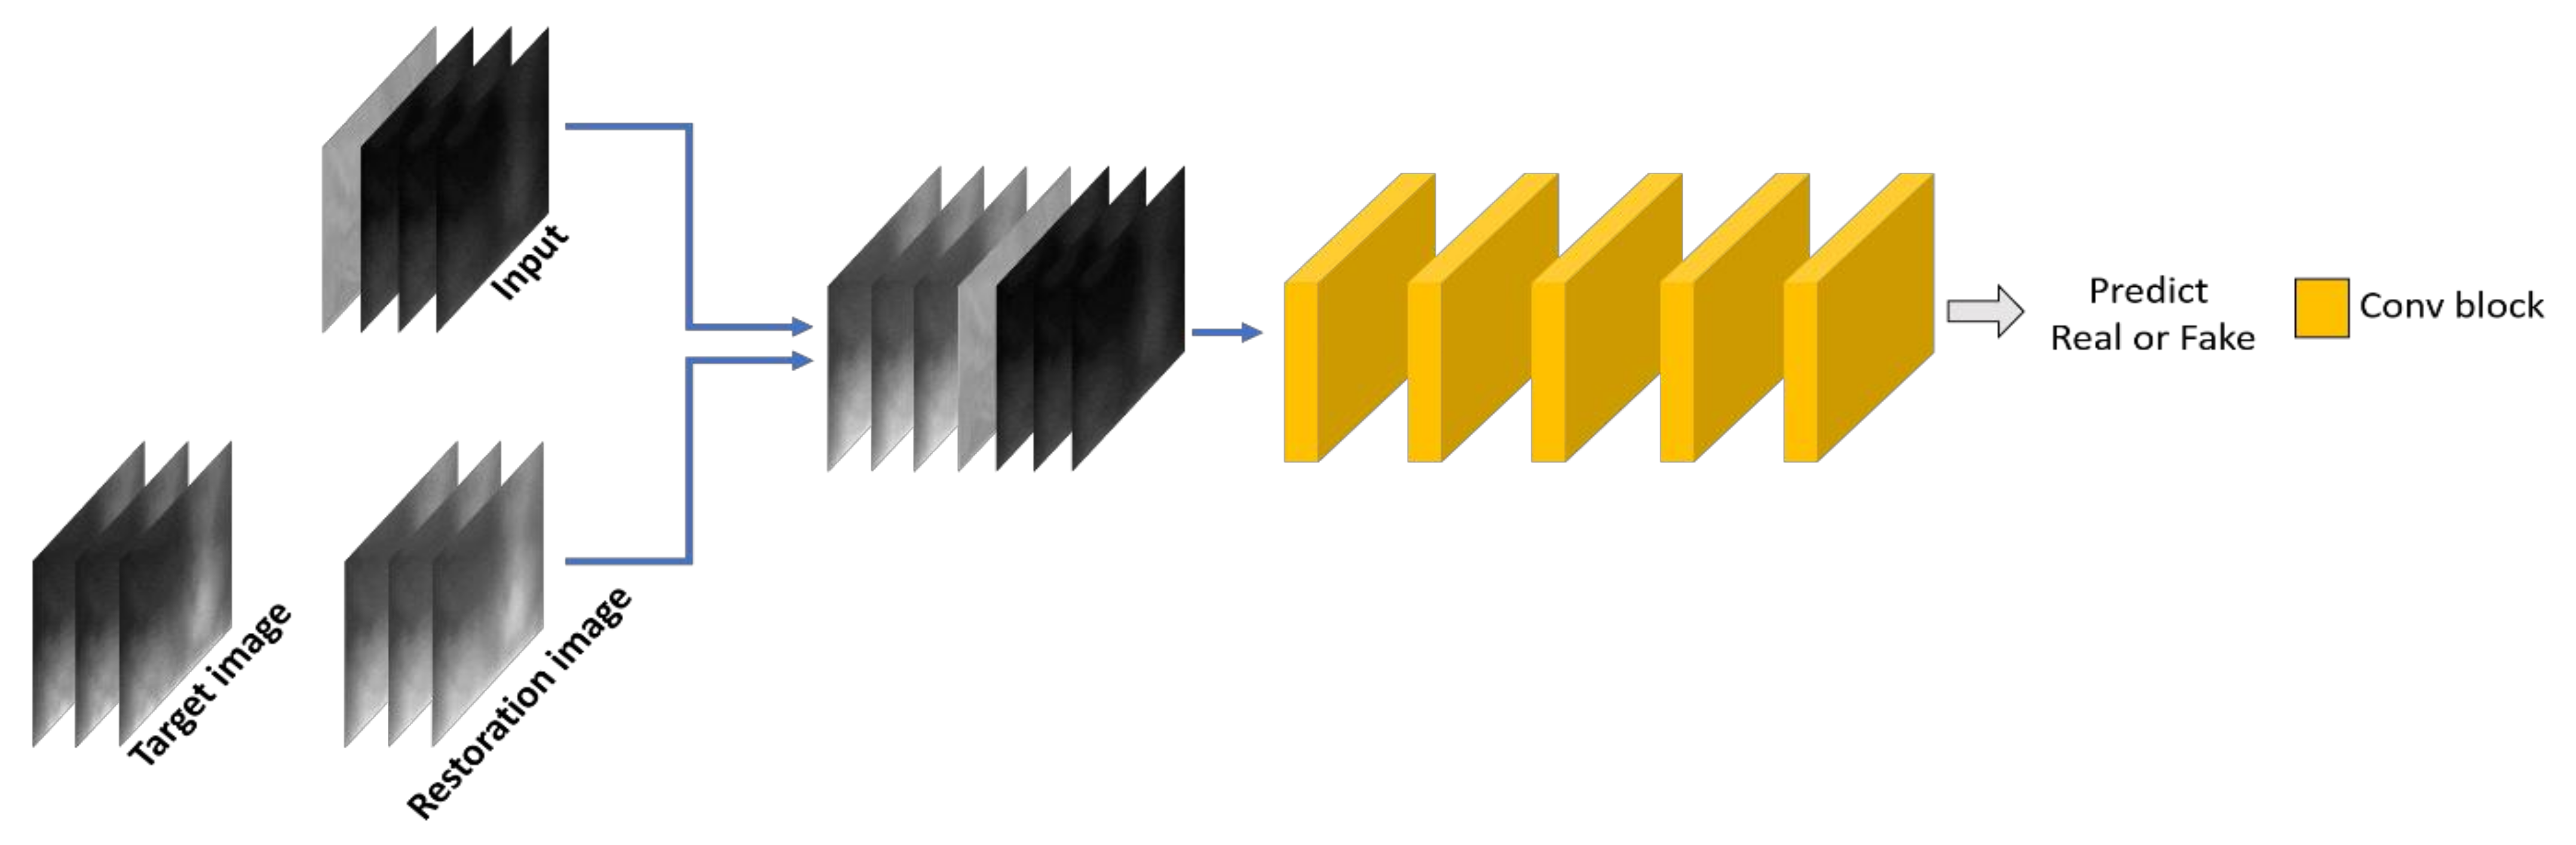
3.3.2. Discriminator of INF-GAN

The PatchGAN discriminator [25] classifies whether an N × N patch is real or fake. PatchGAN computes at the unit of an image patch. Thus, it is fast and exhibits an excellent performance in the image-to-image translation network by training features in a local region by discriminating parts of an image, instead of an entire image. In this study, a 70 × 70 PatchGAN consisting of five convolutional layers, as shown in Figure 4, was used. A seven-channel input was used for the discriminator, as the number of input image channels of the generator is four, whereas the number of target (or restoration image) channels is three. Table 4 presents the detailed architecture of the PatchGAN discriminator used in this study.
Figure 4. Network architecture of the discriminator.
Table 4. Structure of the discriminator.

3.3.3. Loss Function of INF-GAN

In this study, adversarial loss was used for training the INF-GAN in addition to feature matching loss [26] and perceptual loss [27]. The goal of the generator when using a GAN is to generate an image that is difficult to discriminate using the discriminator. Conversely, the goal of the discriminator is to distinguish the output of the generator from the actual target image. The goal of training a GAN is to induce the generator and discriminator to achieve Nash equilibrium by having them compete against each other using the adversarial loss [28]. However, both the generator and discriminator attempt to reduce their own loss, which thus cannot lead to an ideal convergence, and overtraining may occur as the discriminator tends to be trained relatively faster. In detail, as shown in Figure 3a, a generator usually tries to produce the whole image which is similar to the ground-truth (target) image, whereas a discriminator usually tries to only classify real (target) and fake (produced) images during the training procedure, as shown in Figure 4. Therefore, the task of the discriminator is relatively simpler compared with that of the generator, which causes the discriminator to be trained faster than the generator. Therefore, although the training of the discriminator is accomplished (low-value of training loss), further training proceeds because the training of generator is not accomplished (high-value of training loss). This procedure of further training causes the overtraining of discriminator.
To prevent the overtraining by the discriminator, the feature matching loss is used in our discriminator, which is calculated from the extracted feature sets through the discriminator from the produced output (fake) and target (real) image, and the difference between the extracted feature sets is reflected as the loss. In this study, the feature matching loss was calculated using the feature sets extracted from four layers: Conv blocks one–four, in Table 4. By using this feature matching loss, we can make the training convergence of the discriminator more difficult, which causes the reduction of training speed of the discriminator compared to that of the generator, and consequently prevents the overtraining of the discriminator. Equations (3) and (4) express the adversarial loss and feature matching loss used in this study, respectively.
min G   max D L G A N G , D = E x , y log D x , y + E x [ log 1 D x , G x
L F M G , D = E x , y l = 1 T E x , y l = 1 T 1 N l D F l x , y D F l x , G x 1
Here, G and D in Equations (3) and (4) represent the generator and discriminator, respectively; x is the four-channel input image where the residual image has been concatenated in a channel-wise manner, and y is the target image. In Equation (4), T is the total number of layers from which feature sets are extracted, N l is the feature-set size obtained from the lth layer of the discriminator, and D F l is the feature set obtained from the lth layer of the discriminator.
Perceptual loss is similar to feature matching loss, but it extracts feature sets from a specific layer using the pretrained CNN model, unlike feature matching loss. As a method for calculating the feature loss extracted from the generator’s output and target image, the perceptual loss was used for style transfer or for image-to-image translation [21,27]. The VGG Net-19 model pretrained with the ImageNet database was used as the pretrained model for perceptual loss. Equation (5) expresses the perceptual loss used in this study.
L P V , G = E x , y l = 1 T 1 M l [ | V l y V l G x | 1 ]
Here, V l is the feature set obtained from the lth layer of the VGG Net-19 pretrained with the ImageNet database, whereas G denotes the generator. Moreover, x and y in this equation are identical to the x and y used in Equations (3) and (4); in VGG Net-19, feature sets are extracted from T number of layers, as in Equation (4). Furthermore, M l is the feature-set size obtained from the lth layer. The final loss equation can be expressed as follows by combining Equations (3)–(5).
min G ( max D L G A N G , D + λ 1 L F M G , D + λ 2 L p V , G )

3.4. Differences between the Proposed INF-GAN and Pix2Pix-HD

The difference between the Pix2Pix-HD model and the proposed INF-GAN can be summarized as follows:
-
The generator of the Pix2Pix-HD was configured with a global generator, which is a ResNet generator, and a multiresolution pipeline as an additional local generator to transform low-resolution images into high-resolution images. The INF-GAN proposed in this study only used the ResNet generator, as it is a translation of nonuniform illumination to the uniform illumination of the images with an identical resolution.
-
Pix2Pix-HD used three multiscale discriminators to use three PatchGAN discriminators with different receptive field sizes, whereas the INF-GAN used one PatchGAN discriminator.
-
Pix2Pix-HD used a one-channel instance map containing the boundary region information of an object to ensure objects are distinguished for translation. In contrast, the newly proposed RIGB was used in the INF-GAN to highlight the vein texture of images distorted by severe nonuniformity of illumination. In the INF-GAN, a one-channel residual image containing the vein texture information was generated to be concatenated onto the input, thus improving the restoration performance.
-
Pix2Pix-HD used a feature encoder network to generate images of various styles to obtain output diversity. In contrast, the INF-GAN did not use a feature encoder network, as it focused on an accurate restoration of nonuniform illumination rather than output diversity.

3.5. Generation of Composite Image and Recognition by DenseNet-161 with Shift Matching

A composite image is created through the composition of enrolled and input images. When authentic and imposter matching is performed using a composite image, training is more robust against noise [6] compared with a difference image matching method [7]. A composite image consists of a 224 × 224 enrolled image in the first channel, a 224 × 224 input image in the second channel, and a 224 × 224 image created by vertically concatenating the enrolled and input images that have been vertically squeezed into a size of 224 × 112, where three images are applied with channel-wise concatenation. Figure 5 shows the example of a three-channel composite image.
Figure 5. Example of a three-channel composite image.
DenseNet-161 [6,7,18] was used in this study to recognize finger-vein images. The growth rate of the DenseNet-161 model was set to 32, and the weights pretrained with the ImageNet database were used. While 1000 vectors are output in the last output layer of the original DenseNet-161, DenseNet-161 in this study was trained by revising the output nodes of the fully connected layer to output two vectors, as it had been determined whether the enrolled and input images were same-class images (genuine matching) or different-class images (imposter matching). The Conv block, dense block, and transition block of DenseNet-161 are all orderly configured with batch normalization [29], ReLU, and a convolutional layer. The detailed structure of DenseNet-161 is shown in Table 5.
Table 5. Structure of DenseNet-161.
DenseNet exhibits an excellent performance in finger-vein recognition tasks, as low-level features are efficiently delivered using the dense block even when the network is deep [6,7]. During final recognition, shift matching was used based on eight-way translation (up, down, left, right, diagonal to left-up, diagonal to left-down, diagonal to right-up, and diagonal right-down) by five pixels (left-right) and three pixels (up-down) [6]. Shift matching shifts the input image to match with the enrolled image, thus preventing a reduction in the recognition performance due to misalignment between the input and enrolled images. When recognition is performed using a composite image, the spatial difference between the enrolled and input images included in each channel is used for recognition. If there is misalignment between the input and enrolled images, the recognition performance is degraded due to increased spatial difference. Hence, shifting matching was applied in this study.
The output class of DenseNet-161 was set to two classes: genuine matching and imposter matching. Genuine matching refers to the case where enrolled and recognized finger-vein images are of the same class data, whereas imposter matching refers to the case where enrolled and recognized finger-vein images are of different class data. Genuine matching or imposter matching is determined based on the output score obtained from the last layer of DenseNet-161. It is determined as genuine matching when the CNN output score of the testing data is less than the threshold determined based on the genuine matching distribution of the output score obtained from the training data and the equal error rate (EER) of the imposter matching distribution. Otherwise, it is determined as imposter matching if the CNN output score of the testing data is greater than the threshold. EER is the error rate at the point when the false acceptance rate (FAR), which is the error rate of incorrectly accepting imposter data as genuine data, becomes identical to the false rejection rate (FRR), which is the error rate of incorrectly rejecting genuine data as imposter data.

4. Experimental Results and Analysis

4.1. Dataset and Experimental Environments

In this study, experiments were conducted using the session one images of the Hong Kong Polytechnic University finger image database version one (HKPU-DB) [20] and the Shandong University homologous multimodal traits finger-vein database (SDUMLA-HMT-DB) [30], which are open databases. For convenience, the SDUMLA-HMT-DB is referred to as SDU-DB in this paper. There are other open databases such as MMCBNU_6000 [31] and THU-FVFDT1 [32]. However, because the nonuniformity of illumination of finger-vein images in MMCBNU_6000 is not severe, it is not appropriate for our experiments of finger-vein recognition considering severe nonuniformity of illumination. Although THU-FVFDT1 includes the images of nonuniform illumination, the HKPU-DB and SDUMLA-HMT-DB used in our experiments have been most widely adopted for experiments in previous research on finger-vein recognition [5,6,7,9,16,20]. Therefore, we used these two open databases for experiments.
As shown in Table 6, six images of index and middle fingers each were obtained from 156 individuals for session one for a total of 1,872 images (156 people × two fingers × six images) for the HKPU-DB. Furthermore, for the SDU-DB, six images of index, middle, and ring fingers each were obtained from 106 individuals for a total of 3816 images (106 people × two hands × three fingers × six images).
Table 6. Summary of the experimental databases.
In this study, the classes of the HKPU-DB and SDU-DB were divided into half to perform training and testing for twofold cross-validation. It was ensured that the same class data were not used for training and testing (open-world setting). For example, 156 classes of data were used for training in the first fold validation for the HKPU-DB, whereas the remaining 156 classes of data were used for testing. In the second fold validation, the training and testing data used during the first fold validation were switched for the experiment; the average value of the two testing accuracies was determined as the final testing accuracy. A similar operation was performed with the SDU-DB.
Furthermore, to facilitate model training and prevent overfitting due to insufficient training data, data augmentation was applied for the training data of the two open databases, as shown in Table 6. Specifically, images that are five times the size of the original images were generated by applying five-pixel and three-pixel translation and cropping in the vertical and horizontal directions. The original images that were not augmented were used as the testing data.
The computing environment of this study is a desktop computer equipped with Intel(R) Core(TM) i7-7700 CPU @ 3.60 GHz with 16 GB RAM and NVIDIA GeForce GTX 1070 (1920 compute unified device architecture (CUDA) cores) graphic processing unit (GPU) card with a graphics memory of 8 GB [33]. Compute unified device architecture (CUDA) (version 10.2) and CUDA deep neural network library (cuDNN) (version 7.6.5) environments were used; the algorithms and models were implemented using OpenCV (version 4.4.0), PyCharm, and PyTorch (version 1.7.0) [34].

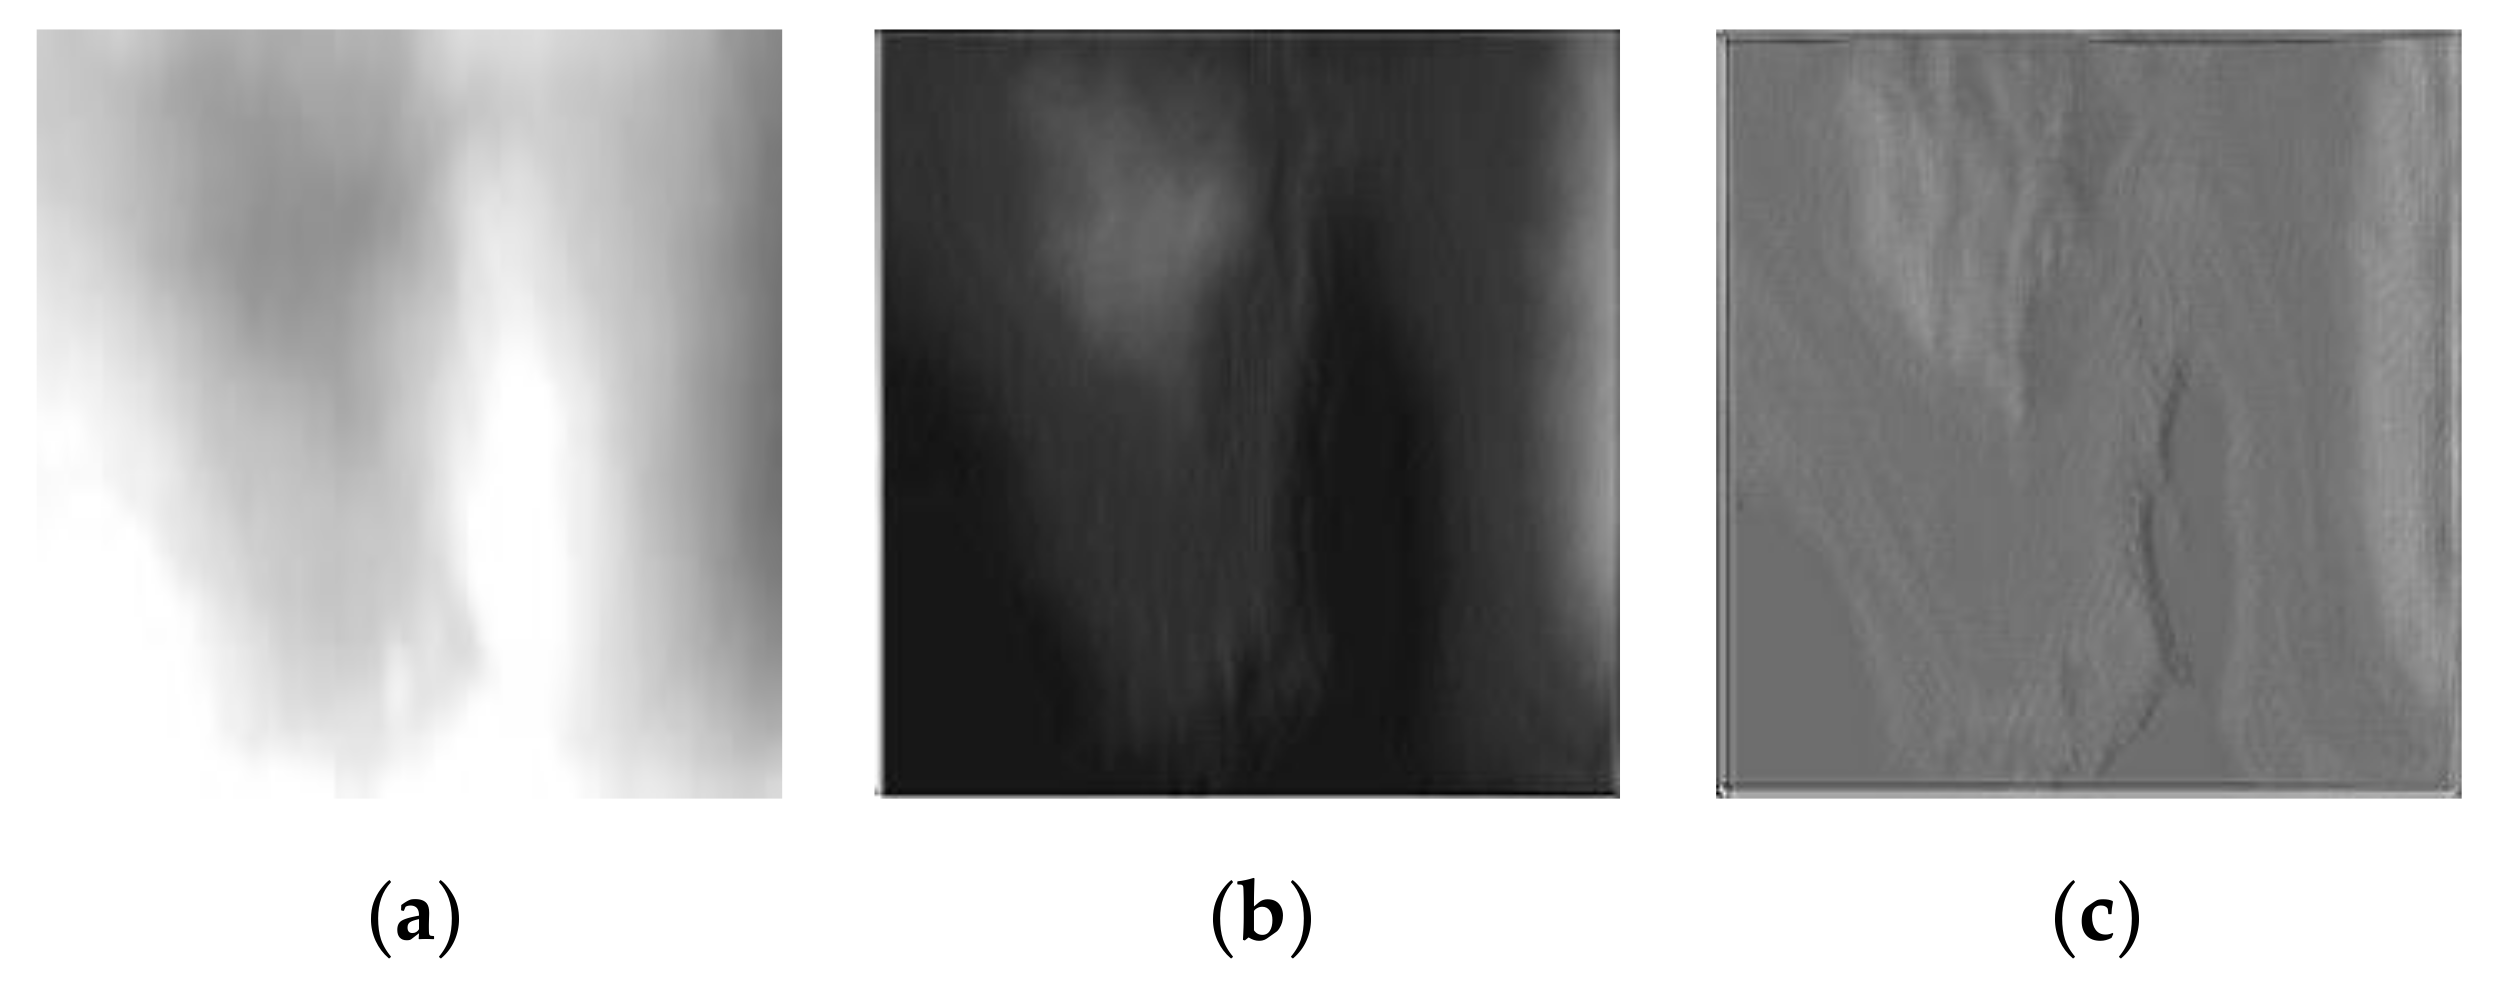
4.2. Generation of the Nonuniform Illumination Dataset

The quality of the finger-vein images may vary depending on the intensity of NIR illumination. Due to the intensity of NIR illumination and finger thickness, the finger region may be saturated quite brightly or a nonuniformly illuminated image that is too dark may be obtained, as shown in Figure 6, which reduces the recognition accuracy. The following method was used in this study to generate images containing nonuniform illumination from the images of the HKPU-DB and SDU-DB. First, based on Equation (7) [35,36,37], extremely dark and bright images were generated by nonlinearly transforming the intensity signal of light through a nonlinear transfer function using gamma correction. A Gaussian blur was also applied, as the vein pattern may become blurry when the images are transformed to be bright or dark. Unlike the case in Figure 6, the overall brightness of an image is changed when gamma correction is simply applied; thus, image contrast was adjusted using Equation (8).
Y 0 = B G C · I γ + N G + N P
Y 1 = 2 Y M Y 0
Figure 6. Examples of original images with nonuniform illumination from (a) HKPU-DB and (b) SDU-DB.
In Equations (7) and (8),   I is the two-dimensional finger-vein image pixel value in grayscale, whereas C and γ are gamma correction parameters. B G is the Gaussian blur function for which a 3 × 3 kernel was used in this study, and the standard deviation value was 0.8. Further, NG is the Gaussian noise, and NP is the Poisson noise. The contrast was adjusted from Y 0 in Equation (7), and the nonuniform illumination image Y 1 was finally generated, as shown in Figure 7. Here, Y M is the average pixel value of Y 0 , and γ and C values were applied differently to the HKPU-DB and SDU-DB for brightly adjusted and darkly adjusted cases, respectively. To generate a bright image for the HKPU-DB, γ = 2.5 and C = 1 were applied; to generate a dark image, γ = 2 and C = 0.3 were applied. Moreover, γ = 2.5 and C = 1 were applied for generating a bright image for the SDU-DB, whereas γ = 2.5 and C = 0.2 were applied to generate a dark image.
Figure 7. Examples of original images with normal illumination (left) and generated images with nonuniform illumination (middle and right) from (a) HKPU-DB and (b) SDU-DB.
Equations (7) and (8) were applied to the HKPU-DB and SDU-DB divided twofold to examine how the performance is affected by the changes in illumination. These equations were randomly applied to 936 images out of 1872 images in the HKPU-DB and 1908 images out of 3816 images in the SDU-DB for conducting an experiment to compare the performance with that of the original image during testing and to measure the restoration performance.

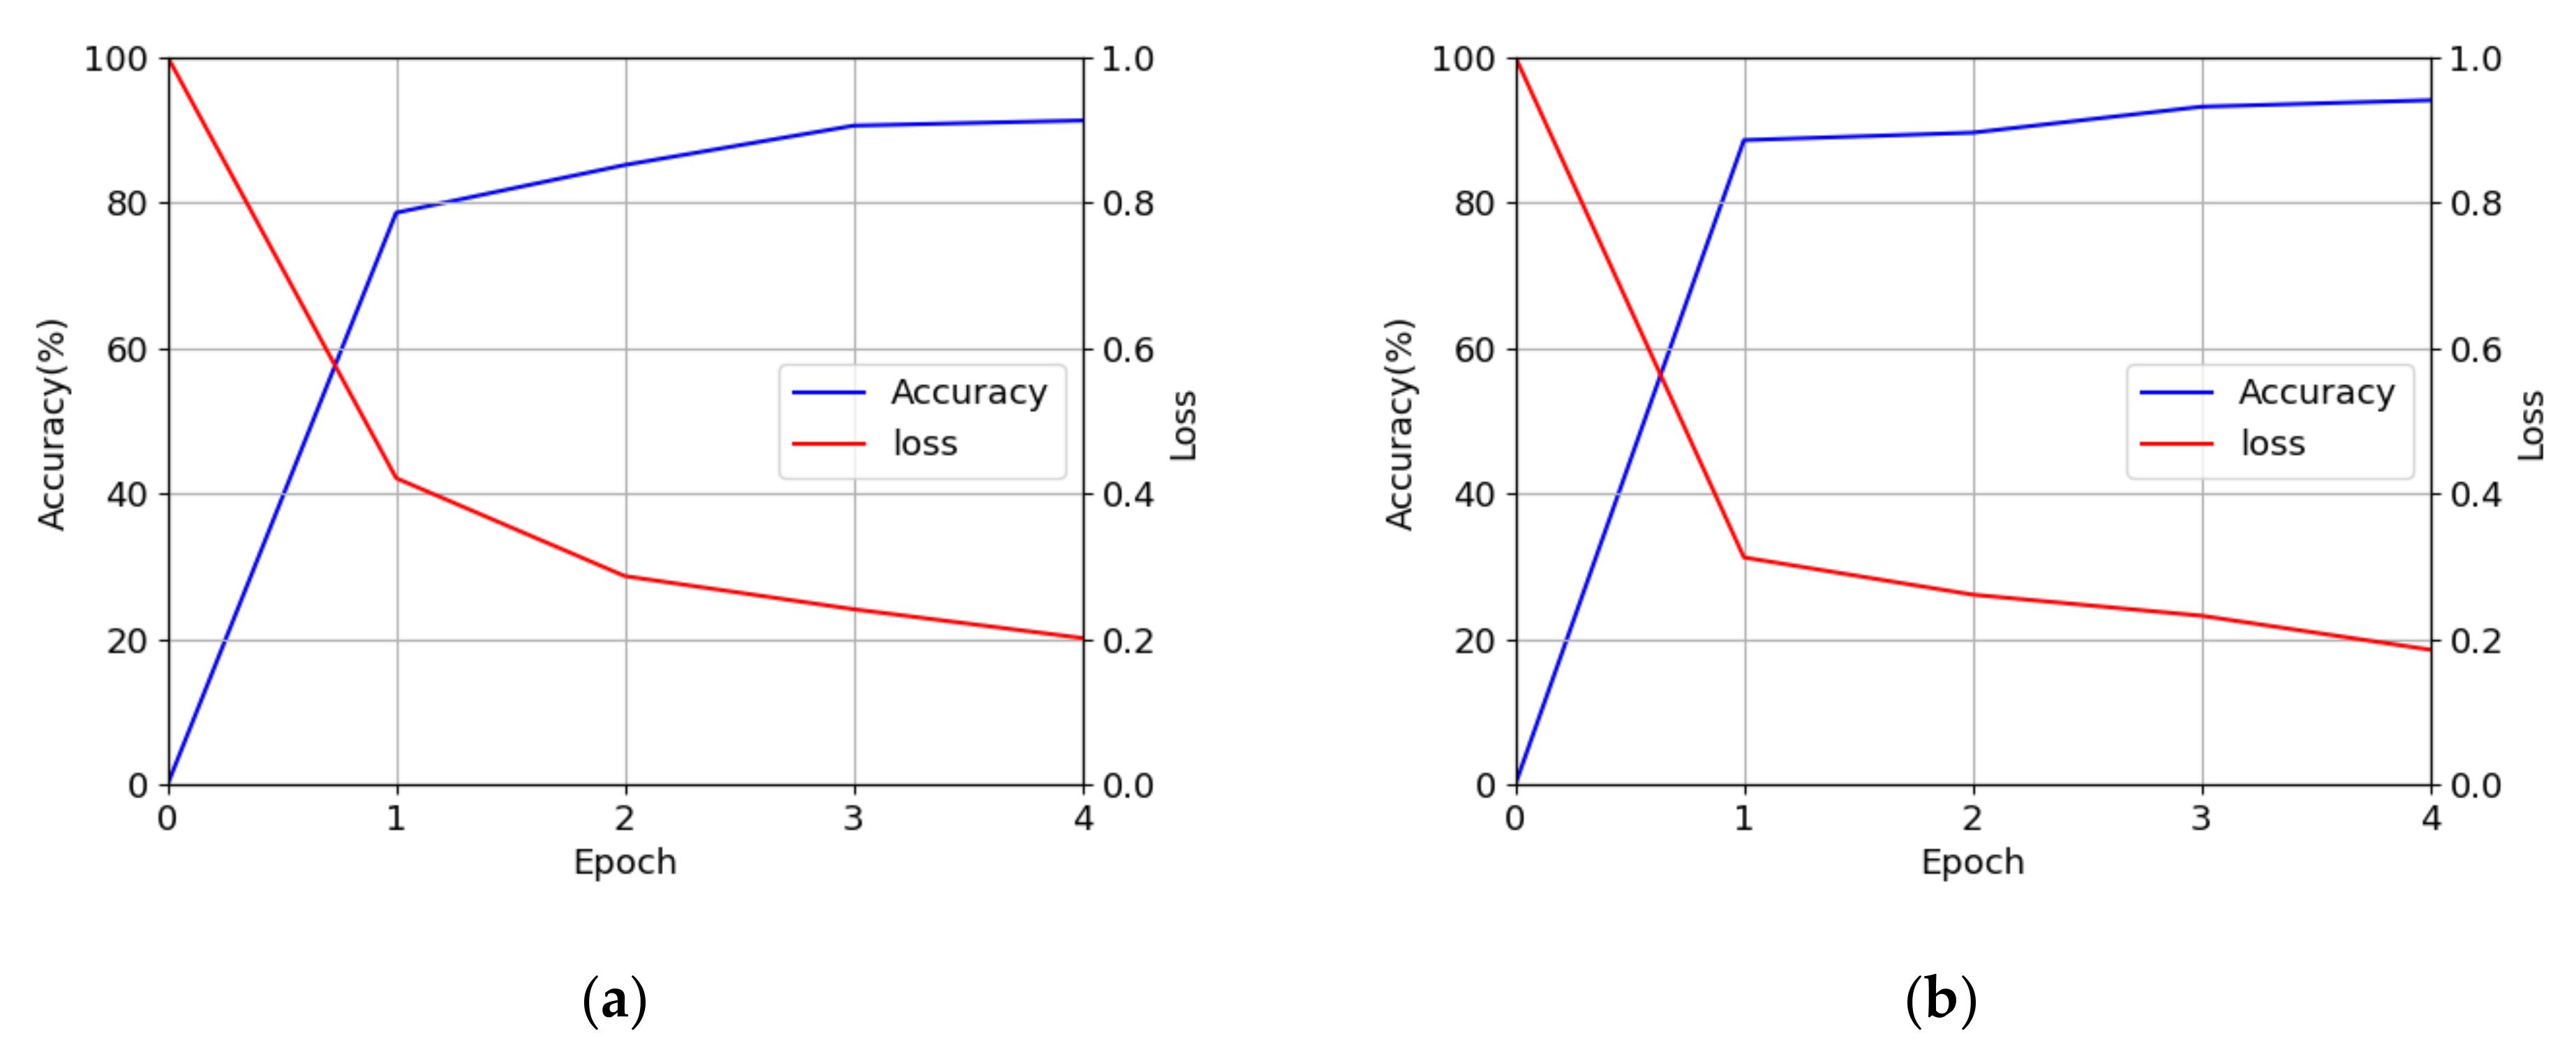
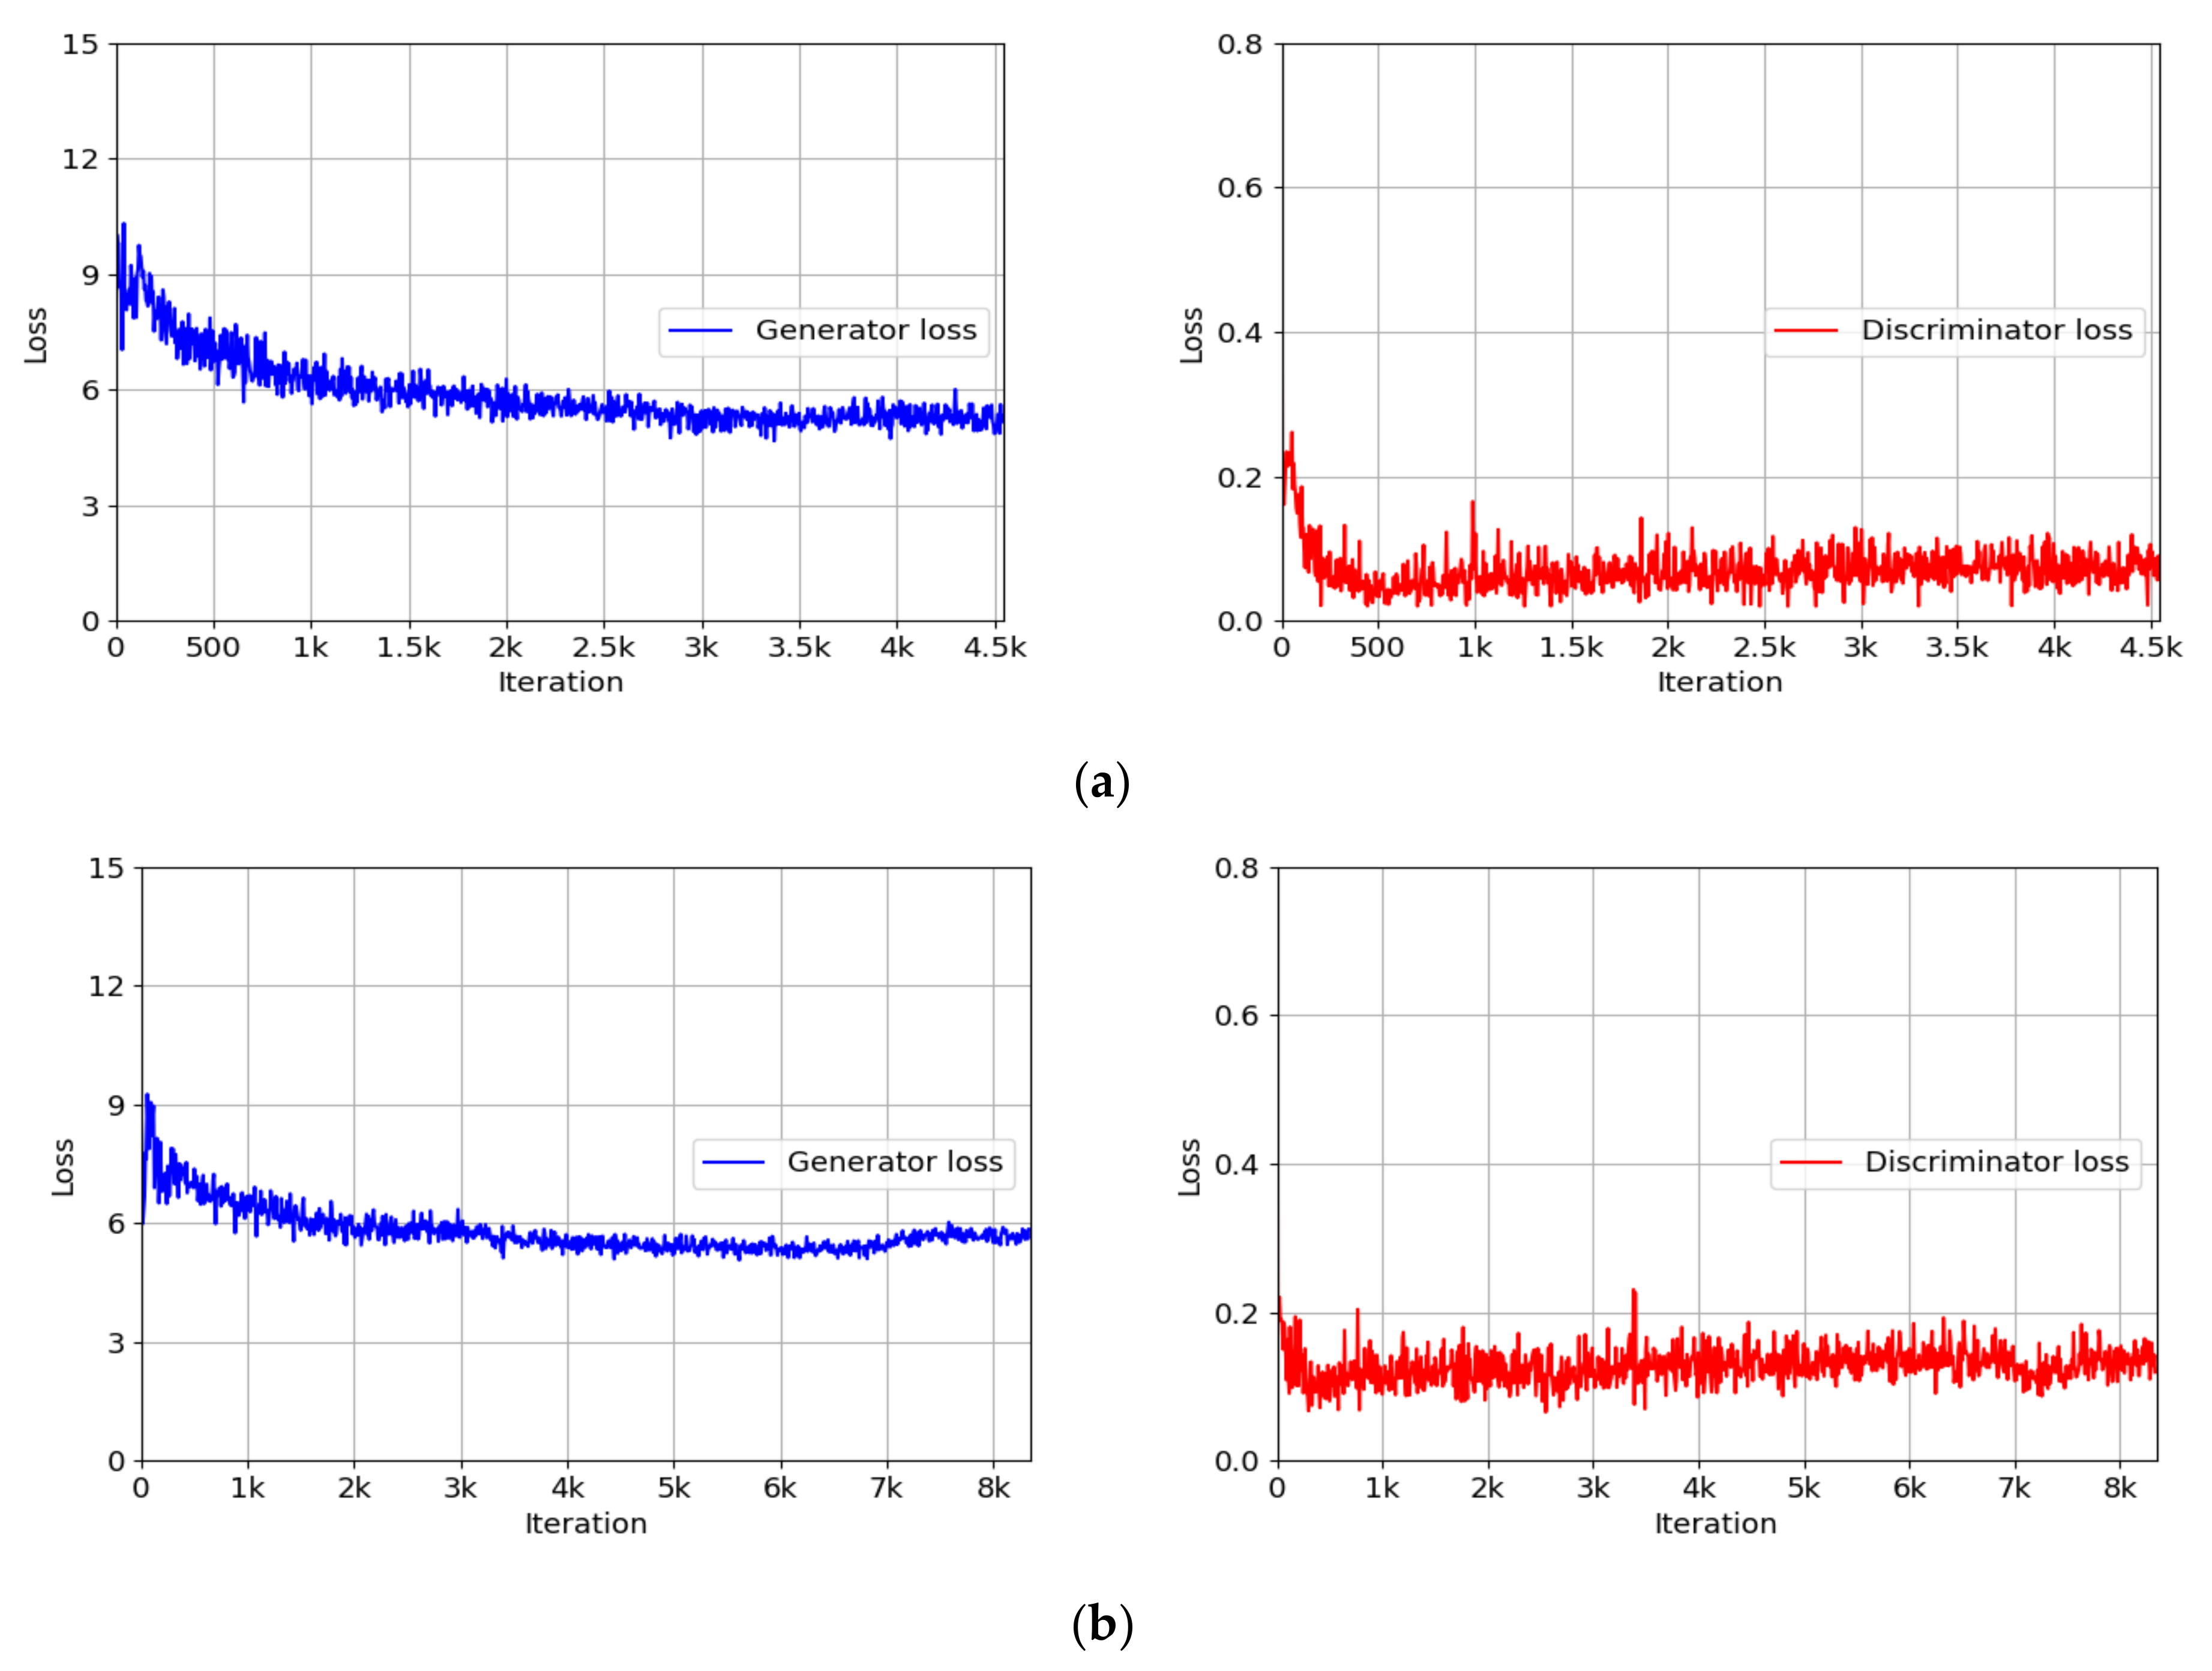
4.3. Training of INF-GAN

The training data used for training the INF-GAN were selected by comparing the average pixel distribution of the original image and the average pixel distribution of the illumination-adjusted image. As shown in Table 6, 1040 images were randomly selected in the HKPU-DB among the images with the average pixel value of less than 50 or greater than 160, and half of 5200 images generated based on the data augmentation method described in Section 4.1, or 2600 images, were used in the training set. For the SDU-DB, 1832 images were randomly selected among the images with the average pixel distribution of less than 50 or greater than 120, and half of the 9160 images generated based on the data augmentation method described in Section 4.1, or 4580 images, were used in the training set. All the experiments were conducted as twofold cross-validation.
The hyperparameters had a learning rate of 0.0002, a batch size of 1, and 90 epochs during the INF-GAN training. An adaptive moment estimation (ADAM) optimizer [38] was used, where the first and second moment estimates were set to be 0.9 and 0.99, respectively, for the training. Using the training data, the optimal hyperparameters were determined as the values when the best accuracies of finger-vein recognition were obtained. Figure 8 shows the training loss graphs of the generator and discriminator with the HKPU-DB and SDU-DB. As shown in Figure 8, the INF-GAN was sufficiently trained with the training data.
Figure 8. Training loss graphs of the INF-GAN. Training loss curves of the generator and discriminator with the (a) HKPU-DB and (b) SDU-DB.

4.4. Training of the CNN Model for Finger-Vein Recognition

The DenseNet-161 was trained for finger-vein recognition in two classes: authentic matching and imposter matching. With respect to the number of augmented images in Table 6, the number of authentic matching cases in HKPU-DB was 140,400, whereas that of imposter matching cases was 21,762,000, creating a substantial imbalance between the two classes. Therefore, imposter cases were trained through undersampling to correspond to authentic cases for both the databases. Additionally, 90% of the data was used as training data and the remaining 10% was used as validation data. The hyperparameters had a learning rate of 0.0001, a batch size of four, and four epochs during the training of the DenseNet-161. The Adam optimizer [38] was used, where the first and second moment estimates were set to be 0.9 and 0.99, respectively, for the training. Using the training data, the optimal hyperparameters were determined as the values when the best accuracies of finger-vein recognition were obtained. Figure 9 and Figure 10, respectively show the training loss and accuracy graphs and the validation loss and accuracy graphs of DenseNet-161 with the HKPU-DB and SDU-DB. As shown in Figure 9 and Figure 10, DenseNet-161 was sufficiently trained with the training data.
Figure 9. Training loss and accuracy graphs of the DenseNet-161 with (a) HKPU-DB and (b) SDU-DB.
Figure 10. Validation loss and accuracy graphs of DenseNet-161 with (a) HKPU-DB and (b) SDU-DB.

4.5. Testing of the Proposed Method

4.5.1. Ablation Study

As the first ablation study, the performance was compared with respect to the number of residual blocks in the RIGB in Table 3. Figure 11 shows the result images; when two residual blocks were used, as shown in Figure 11c, more fine textures of the vein pattern were observed than when one residual block was used, as shown in Figure 11b.
Figure 11. Examples of residual images generated by the RIGB. (a) Input finger-vein image and generated residual images by using (b) one residual block in the RIGB and (c) two residual blocks in the RIGB.
Table 7 shows the comparison of the finger-vein recognition accuracies according to the number of residual blocks in the RIGB. Here, the EER of finger-vein recognition described in Section 3.5 was used as the performance evaluation metric. As shown in Table 7, using two residual blocks resulted in more accurate finger-vein recognition than using other numbers of residual blocks for the HKPU-DB. In contrast, using one residual block resulted in more accurate finger-vein recognition than using other numbers of residual blocks for the SDU-DB. As the image quality of the SDU-DB is poorer than that of the HKPU-DB, the high-frequency information of features before passing through the convolutional layer is preserved more when two residual blocks are used, while also generating more noise, thus reducing the accuracy of finger-vein recognition.
Table 7. Comparisons of finger-vein recognition accuracies according to the number of residual blocks in the RIGB (unit: %).
Table 8 shows the comparison of the finger-vein recognition accuracies when the RIGB was used and when the RIGB was not used. As shown in Table 8, the finger-vein recognition accuracy was higher when the RIGB was used compared with when the RIGB was not used.
Table 8. Comparisons of finger-vein recognition accuracies with or without the RIGB (unit: %).

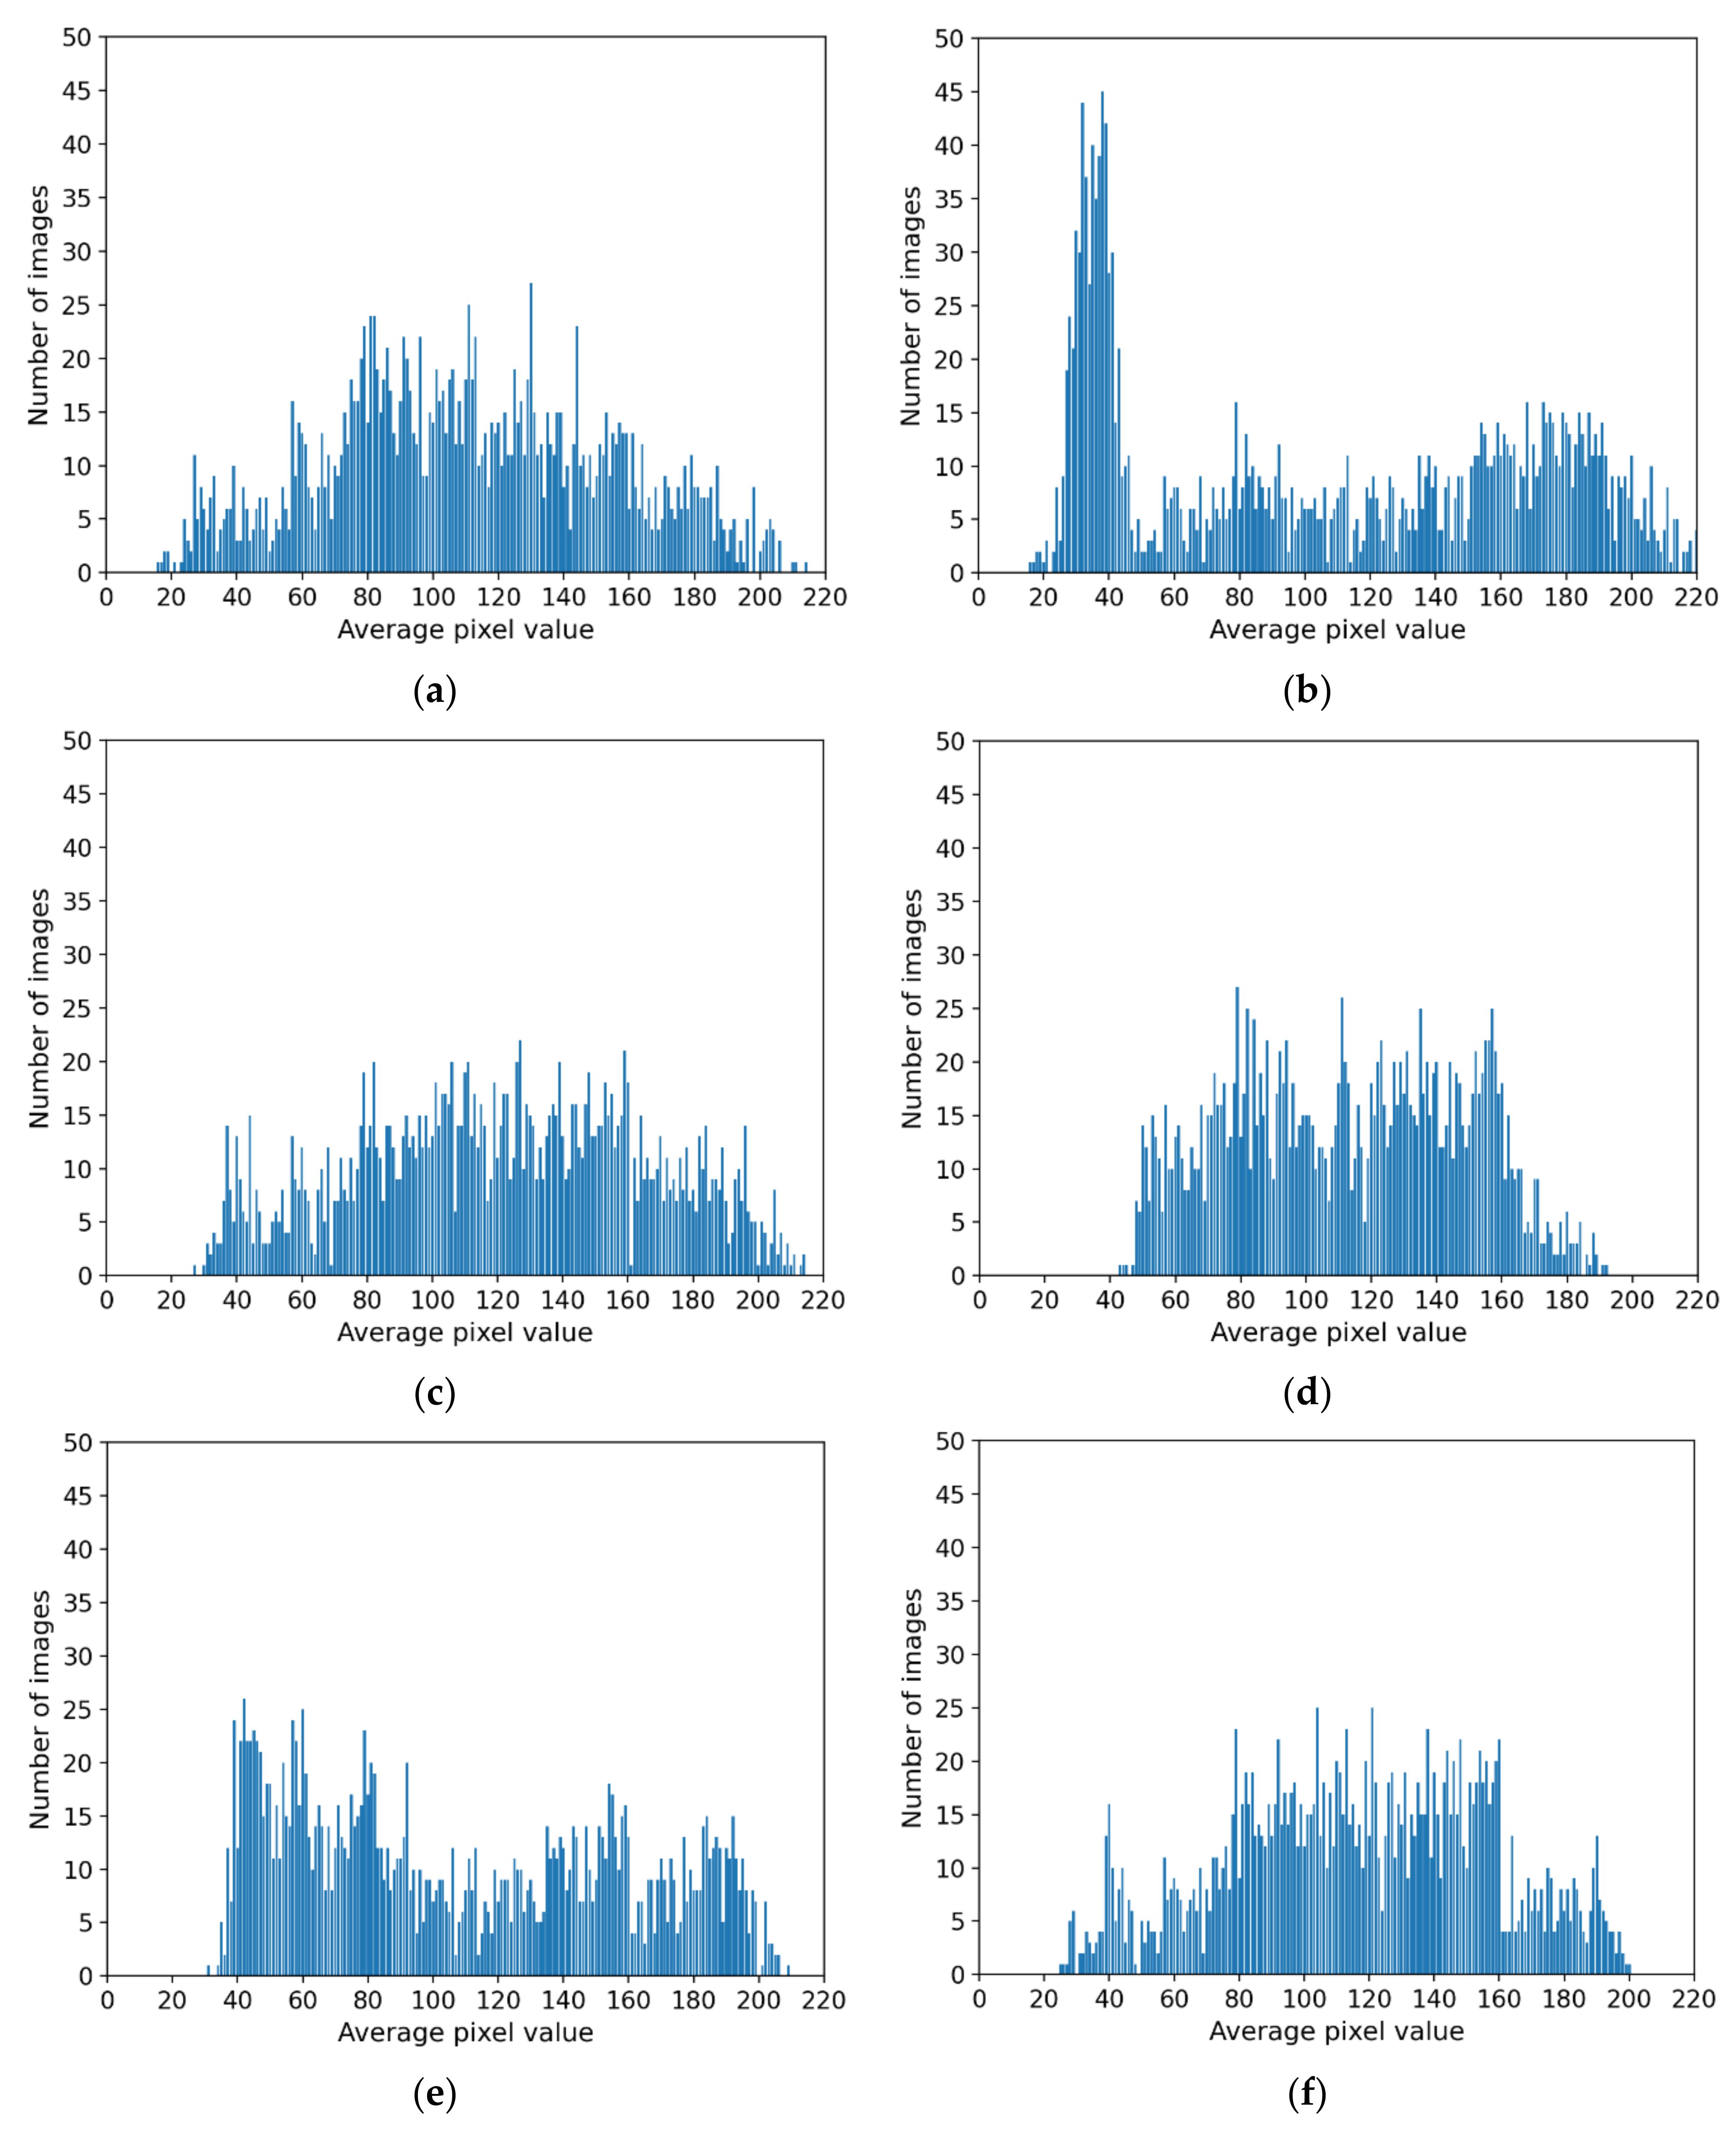
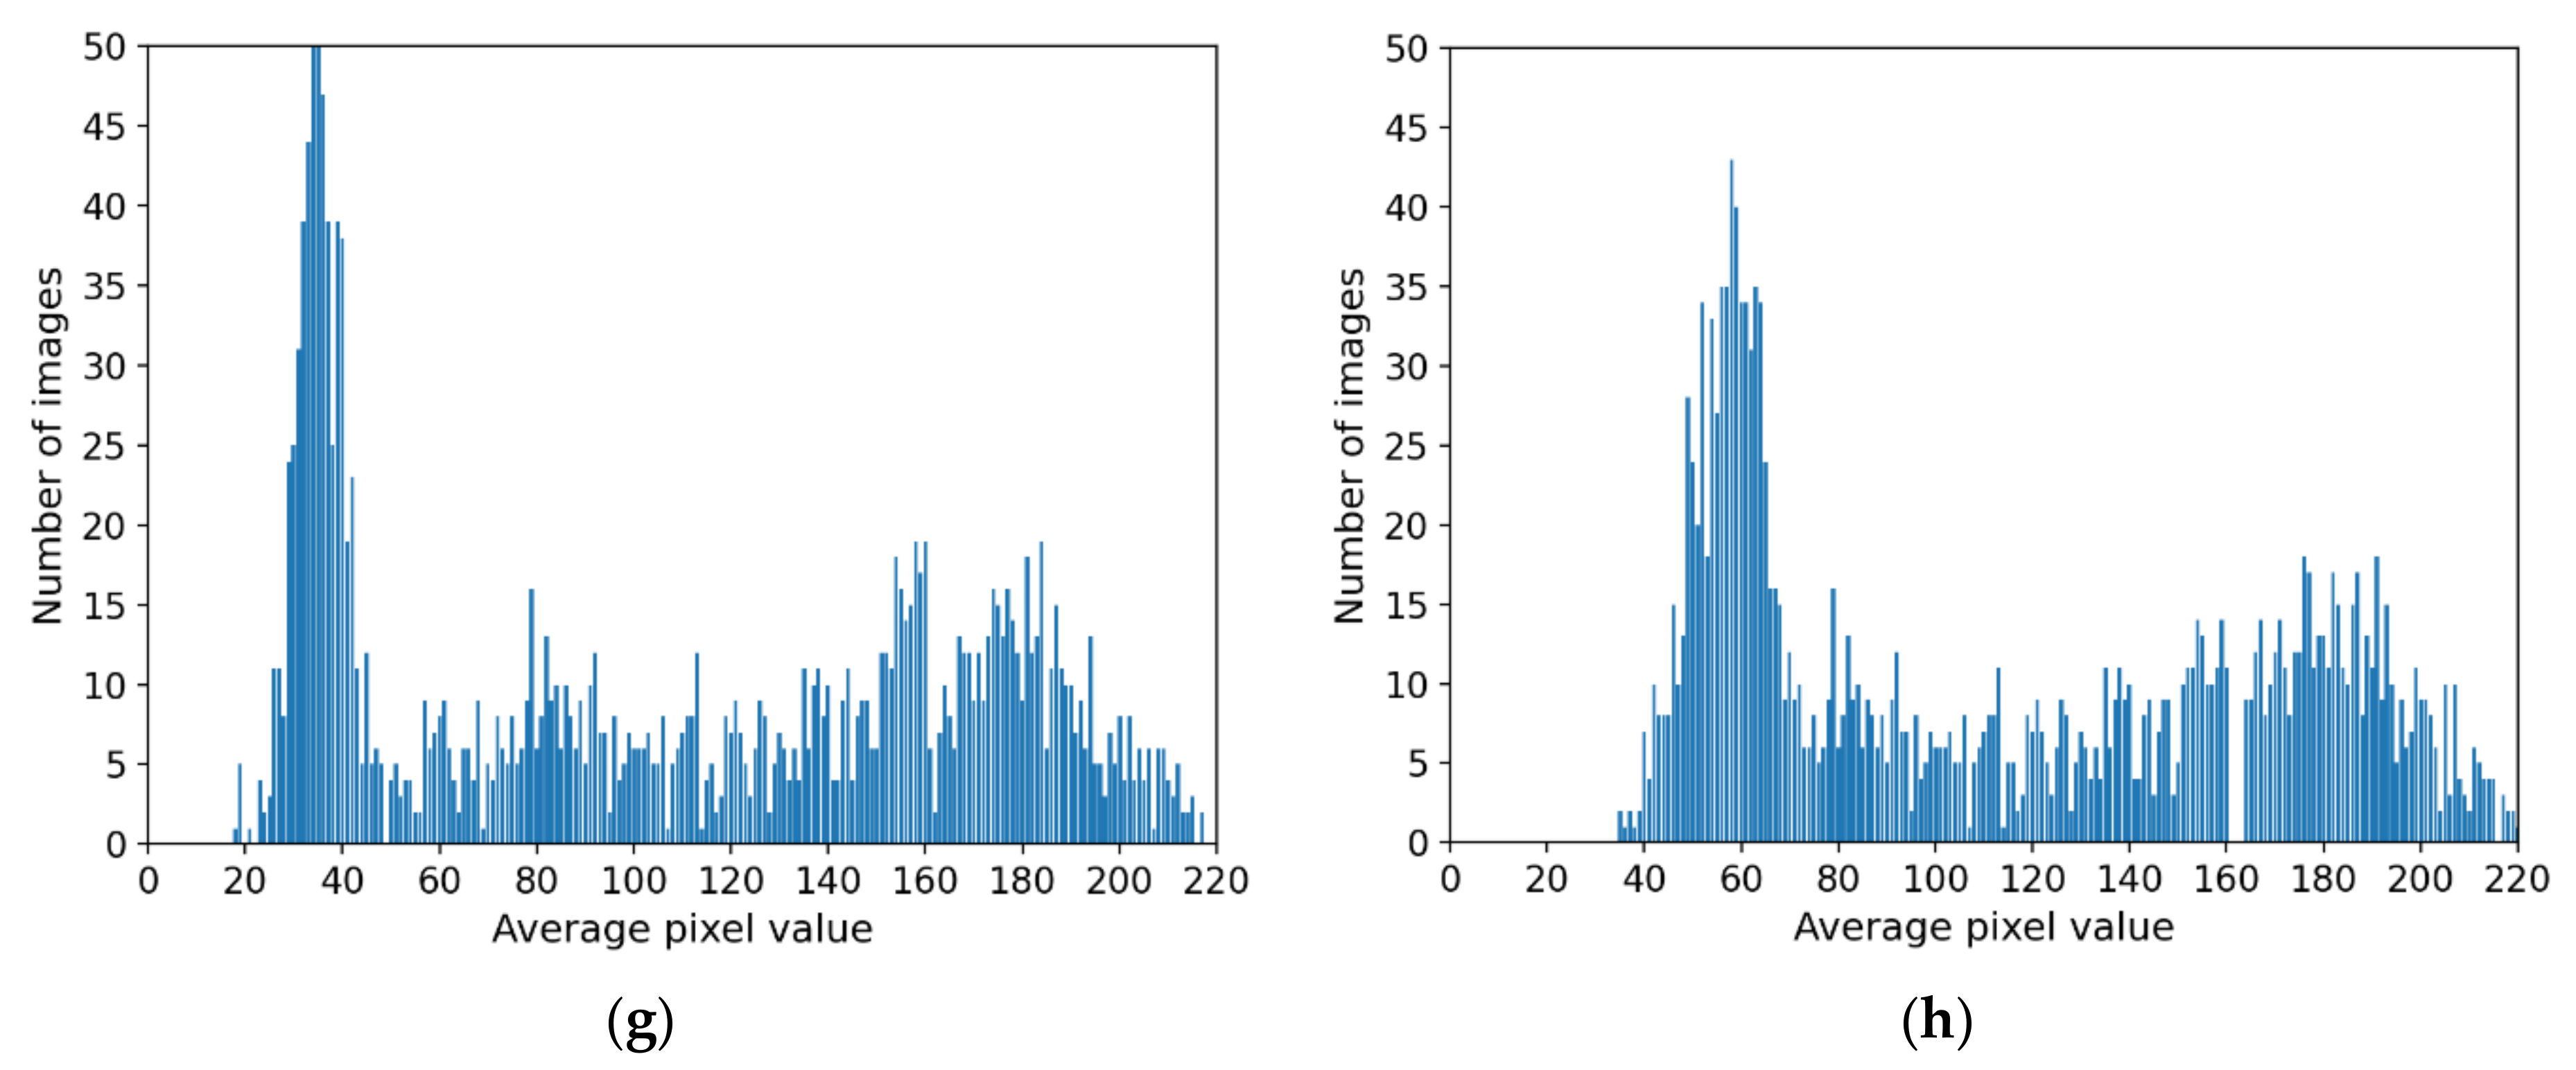
4.5.2. Comparison of Distribution of Generated Images by INF-GAN and Original Images

In this section, various methods (proposed INF-GAN, Pix2Pix [39], CycleGAN [40], Pix2Pix-HD [21], attention-guided image-to-image translation GAN [41], and EnlightenGAN [42]) were used to compare the distributions of the average pixel value of the restored images and the distributions of the average pixel value of the original images, as shown in Figure 12. The experiment results showed that the distributions of the average pixel value by the INF-GAN (Figure 12c), Pix2Pix (Figure 12d), and Pix2Pix-HD (Figure 12f) were similar to the average pixel distribution (Figure 12a) of the original image.
Figure 12. Distribution of the average pixel value of the (a) original image, (b) nonuniformly illuminated image, and images restored by the (c) INF-GAN, (d) Pix2Pix, (e) CycleGAN, (f) Pix2Pix-HD, (g) attention-guided image-to-image translation GAN, and (h) EnlightenGAN.
For the next experiment, the similarity between the distributions of the average pixel value of the original image and the distributions of the average pixel value of the images restored by various methods in Figure 12 was quantitatively compared using d-prime (d′) [43], Wasserstein distance [44], and Fréchet inception distance (FID) [45], as shown in Table 9.
d = μ s μ n 1 2 σ s 2 + σ n 2
W D p P , Q = i n f π Γ P , Q d × d X Y p d π 1 / p
FID = μ x μ y 2 + T r x + y 2   x y
d′ was calculated through mean μ s ,   μ n and standard deviation σ s ,   σ n calculated from two distributions as in Equation (9). Equation (10) is Wasserstein distance and is calculated through combined probability distribution Γ(P, Q) for the two probability distributions P and Q, marginal probability distribution d × d , Random variables X and Y in each probability distribution, and dπ which is the joint probability for random variables X and Y. The inf in Equation (10) is infimum, meaning the greatest lower bound, and through this, the value estimated with the smallest expected value for the distance between random variables X and Y among all joint probability distributions Γ(P, Q) is divided into two distributions. Equation (11) is Fréchet inception distance and is calculated through mean μ x ,   μ y and covariance matrix x ,   y and Tr which is the diagonal sum function, by using 2048 size feature x, y extracted through Inception-v3 which is pretrained using the ImageNet database. Unlike the results in Figure 12, the similarity between the original image and the images generated with the INF-GAN was relatively lower than that of the other methods. In the case of d′, simple mean and standard deviation are used for computation under the assumption that the distribution follows a Gaussian distribution [43]. The Wasserstein distance, which is the earth mover’s distance for calculating the cost required for ensuring two distributions to be identical by moving the distribution, also cannot accurately reflect the similarity between two distributions because from the point of view of cumulative distribution, the frequency of individual variables cannot be reflected [44]. The FID is a feature-based distance extracted from the image that is input into Inception-v3 [46], pretrained with the ImageNet database, thus showing a difference from the average pixel distribution of the image [45].
Table 9. Comparisons of the d′ value, Wasserstein distance, and FID between the original and nonuniformly illuminated images in addition to those between the original and restored images by various methods.
As shown in Table 9, the INF-GAN produced slightly poorer results compared with the other methods from the perspective of the similarity between the original image and the generated image, but in Figure 13, the similarity of the generated image compared to the original image was high. This is because of the characteristics described above for d′, Wasserstein distance, and FID used in Table 9. In the case of d′, the average pixel value distribution does not follows a Gaussian distribution, and in the case of Wasserstein distance, the metric does not reflect the difference in frequency of individual variables from the point of view of cumulative distribution. In addition, in the case of FID, it can differ from average pixel value distribution because it is a distribution comparison method through feature. However, this study focused on improving the finger-vein recognition accuracy, rather than the quality of the generated image. Therefore, the results were compared from the perspective of finger-vein recognition accuracy in the following subsection. Figure 13 shows the examples of the original image, nonuniformly illuminated image, and images generated using various methods.
Figure 13. Examples of the (a) original image, (b) nonuniformly illuminated image, and images restored by the (c) INF-GAN, (d) Pix2Pix, © CycleGAN, (f) Pix2Pix-HD, (g) attention-guided image-to-image translation GAN, and (h) EnlightenGAN.

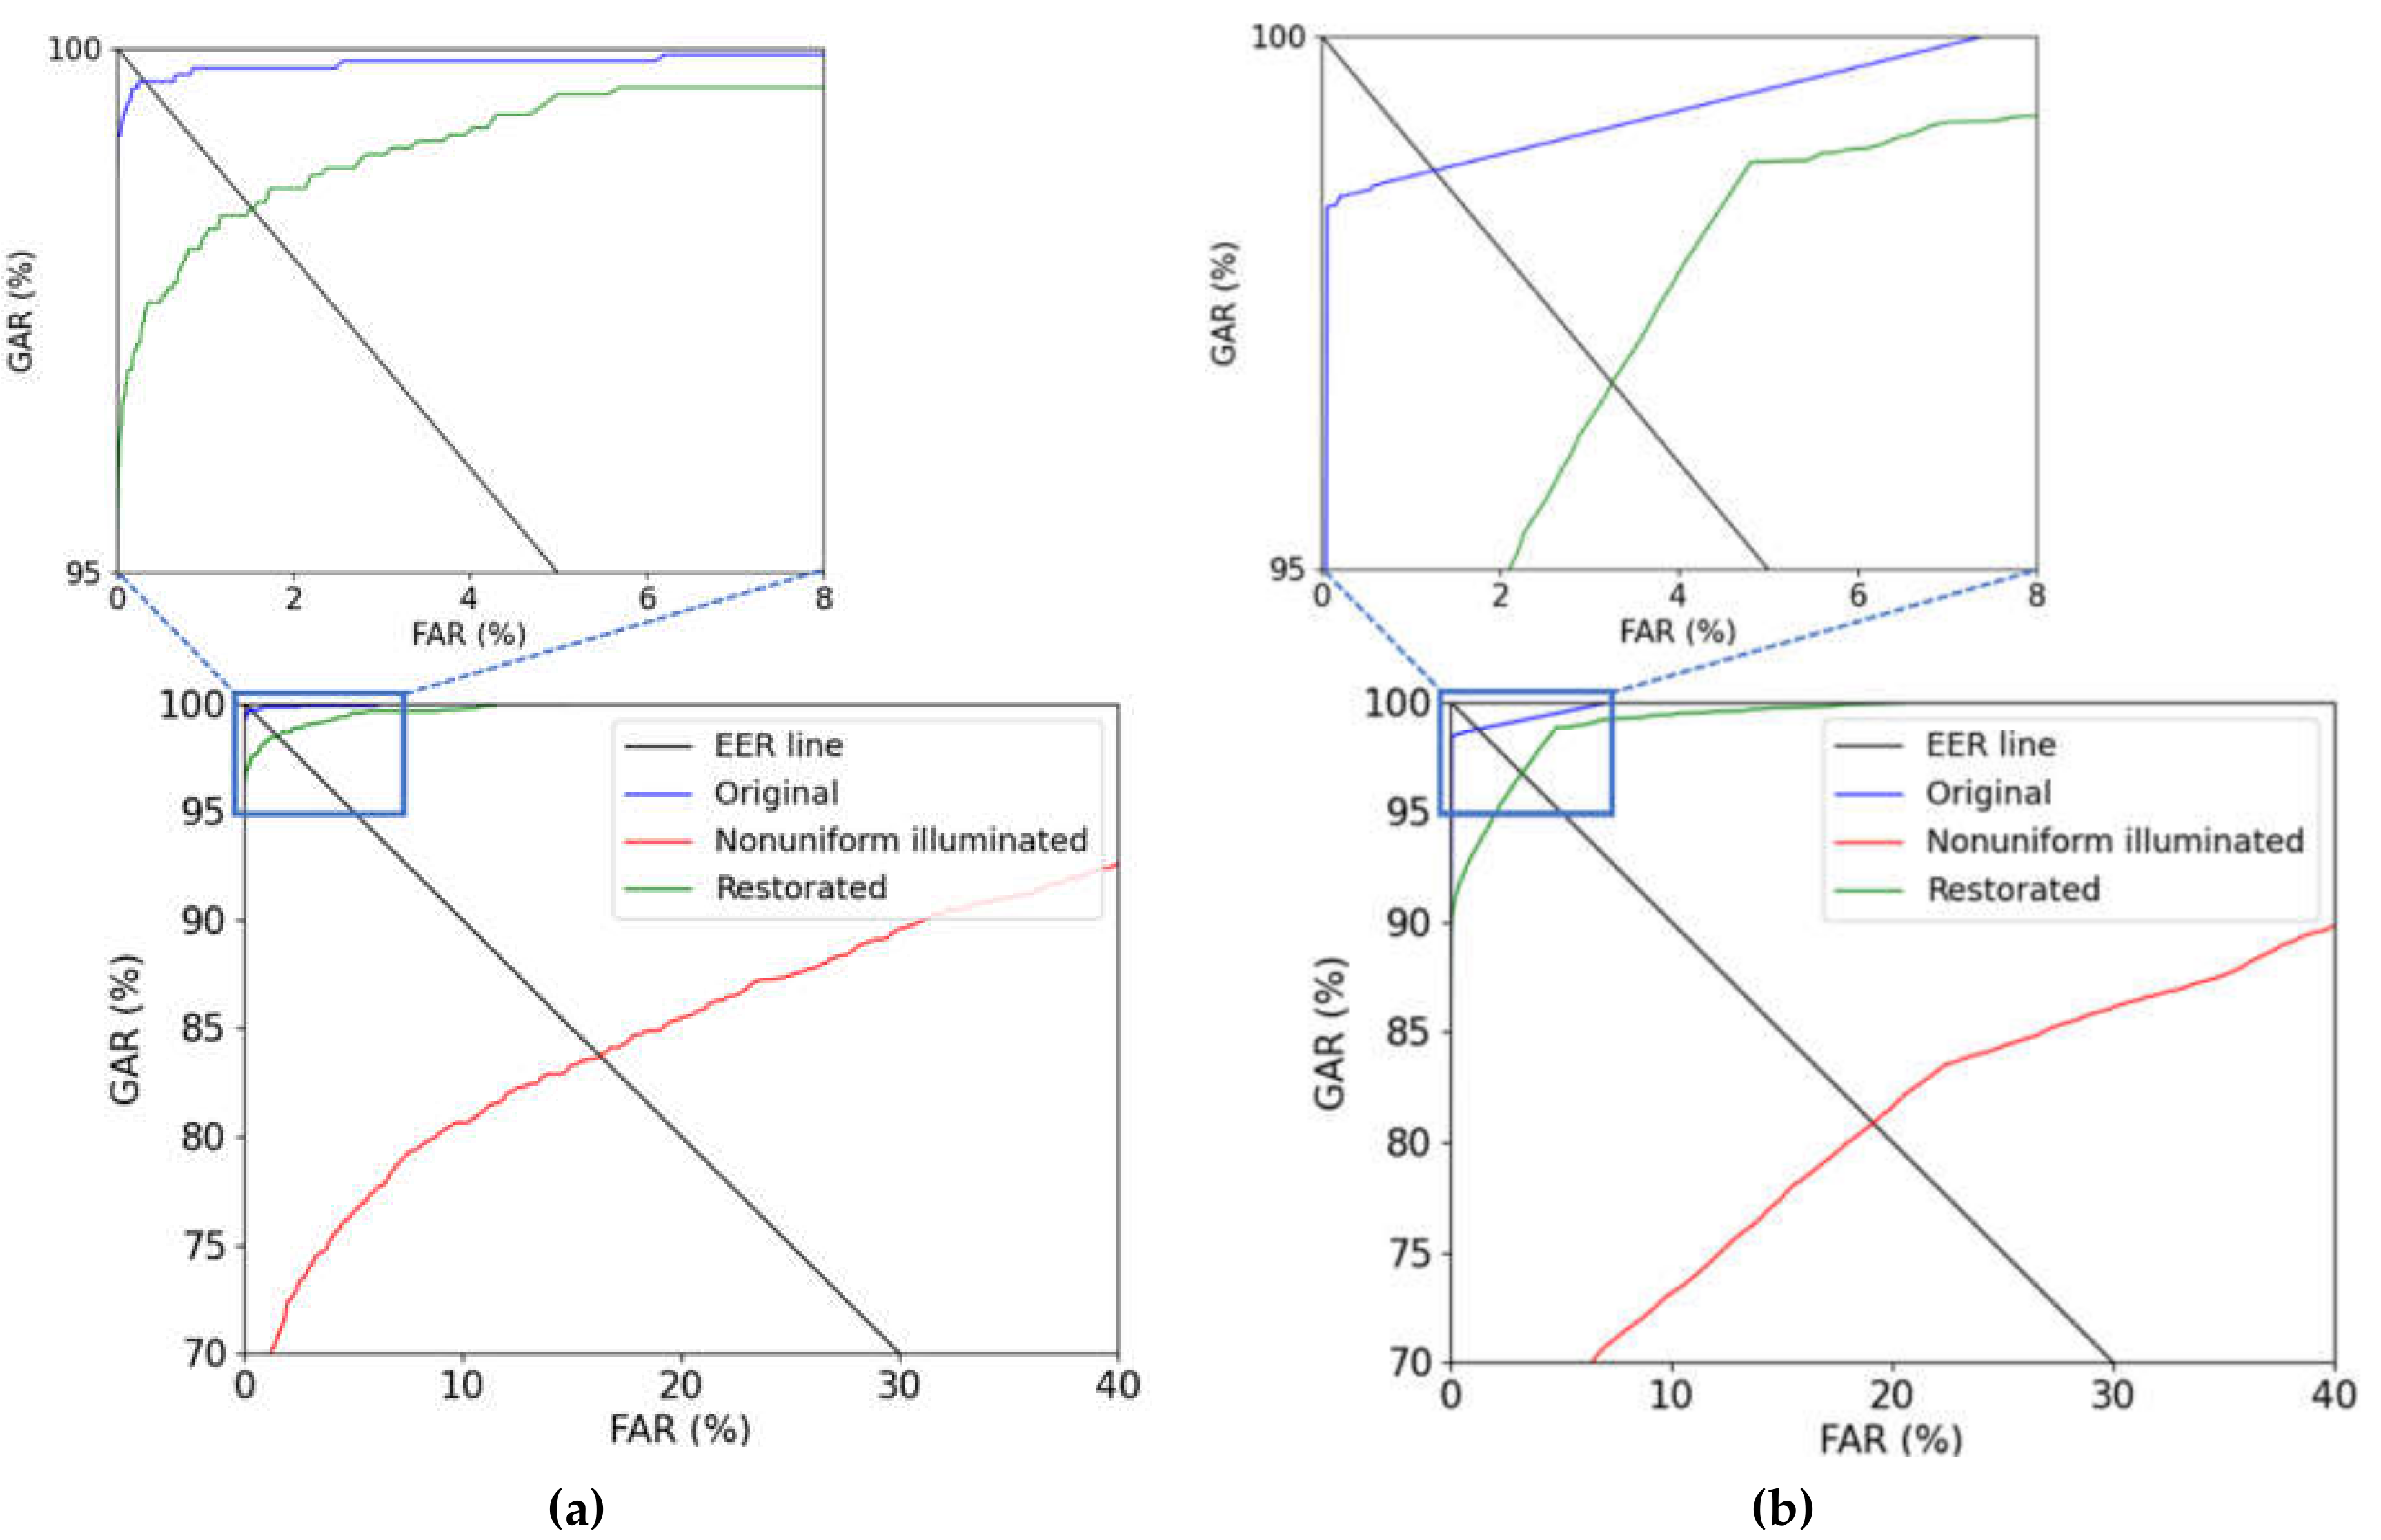
4.5.3. Comparisons of Finger-Vein Recognition Accuracies by the Proposed Method

Figure 14 shows the original images, nonuniformly illuminated images, residual images generated by the RIGB, and images restored by the INF-GAN. As shown in Figure 14, the INF-GAN restored even a low-quality image with nonuniform illumination so that it is closer to the original image.
Figure 14. Examples of (a) original images, (b) nonuniformly illuminated images, (c) residual images generated by the RIGB, and (d) images restored by the INF-GAN. The first row is an example of restoration of a relatively brightened images and the second row is an example of restoration of a relatively darkened images due to nonuniform illumination.
In Table 10, the EERs of finger-vein recognition were computed when the original images and nonuniformly illuminated images were used for the baseline performance. The EERs of finger-vein recognition were also computed for the cases where the images restored by the INF-GAN were used. Figure 15 shows the receiver-operating characteristic (ROC) curves of each case. The x-axis of the ROC curve is the FAR, whereas the y-axis is the genuine acceptance rate (GAR) (100−FRR (%)) where the graph is placed more toward the top left as the accuracy is higher. As shown in Table 10 and Figure 15, the finger-vein recognition accuracies were lower when the images restored by the INF-GAN were used compared with when the original images were used. However, the finger-vein recognition accuracies were considerably improved compared with when the nonuniformly illuminated images were used.
Table 10. Comparisons of EER of finger-vein recognition with the original images, nonuniformly illuminated images, and images restored by the INF-GAN (unit: %).
Figure 15. ROC curves of finger-vein recognition with the original images (blue lines), nonuniformly illuminated images (red lines), and images restored by the INF-GAN (green lines) on the (a) HKPU-DB and (b) SDU-DB.

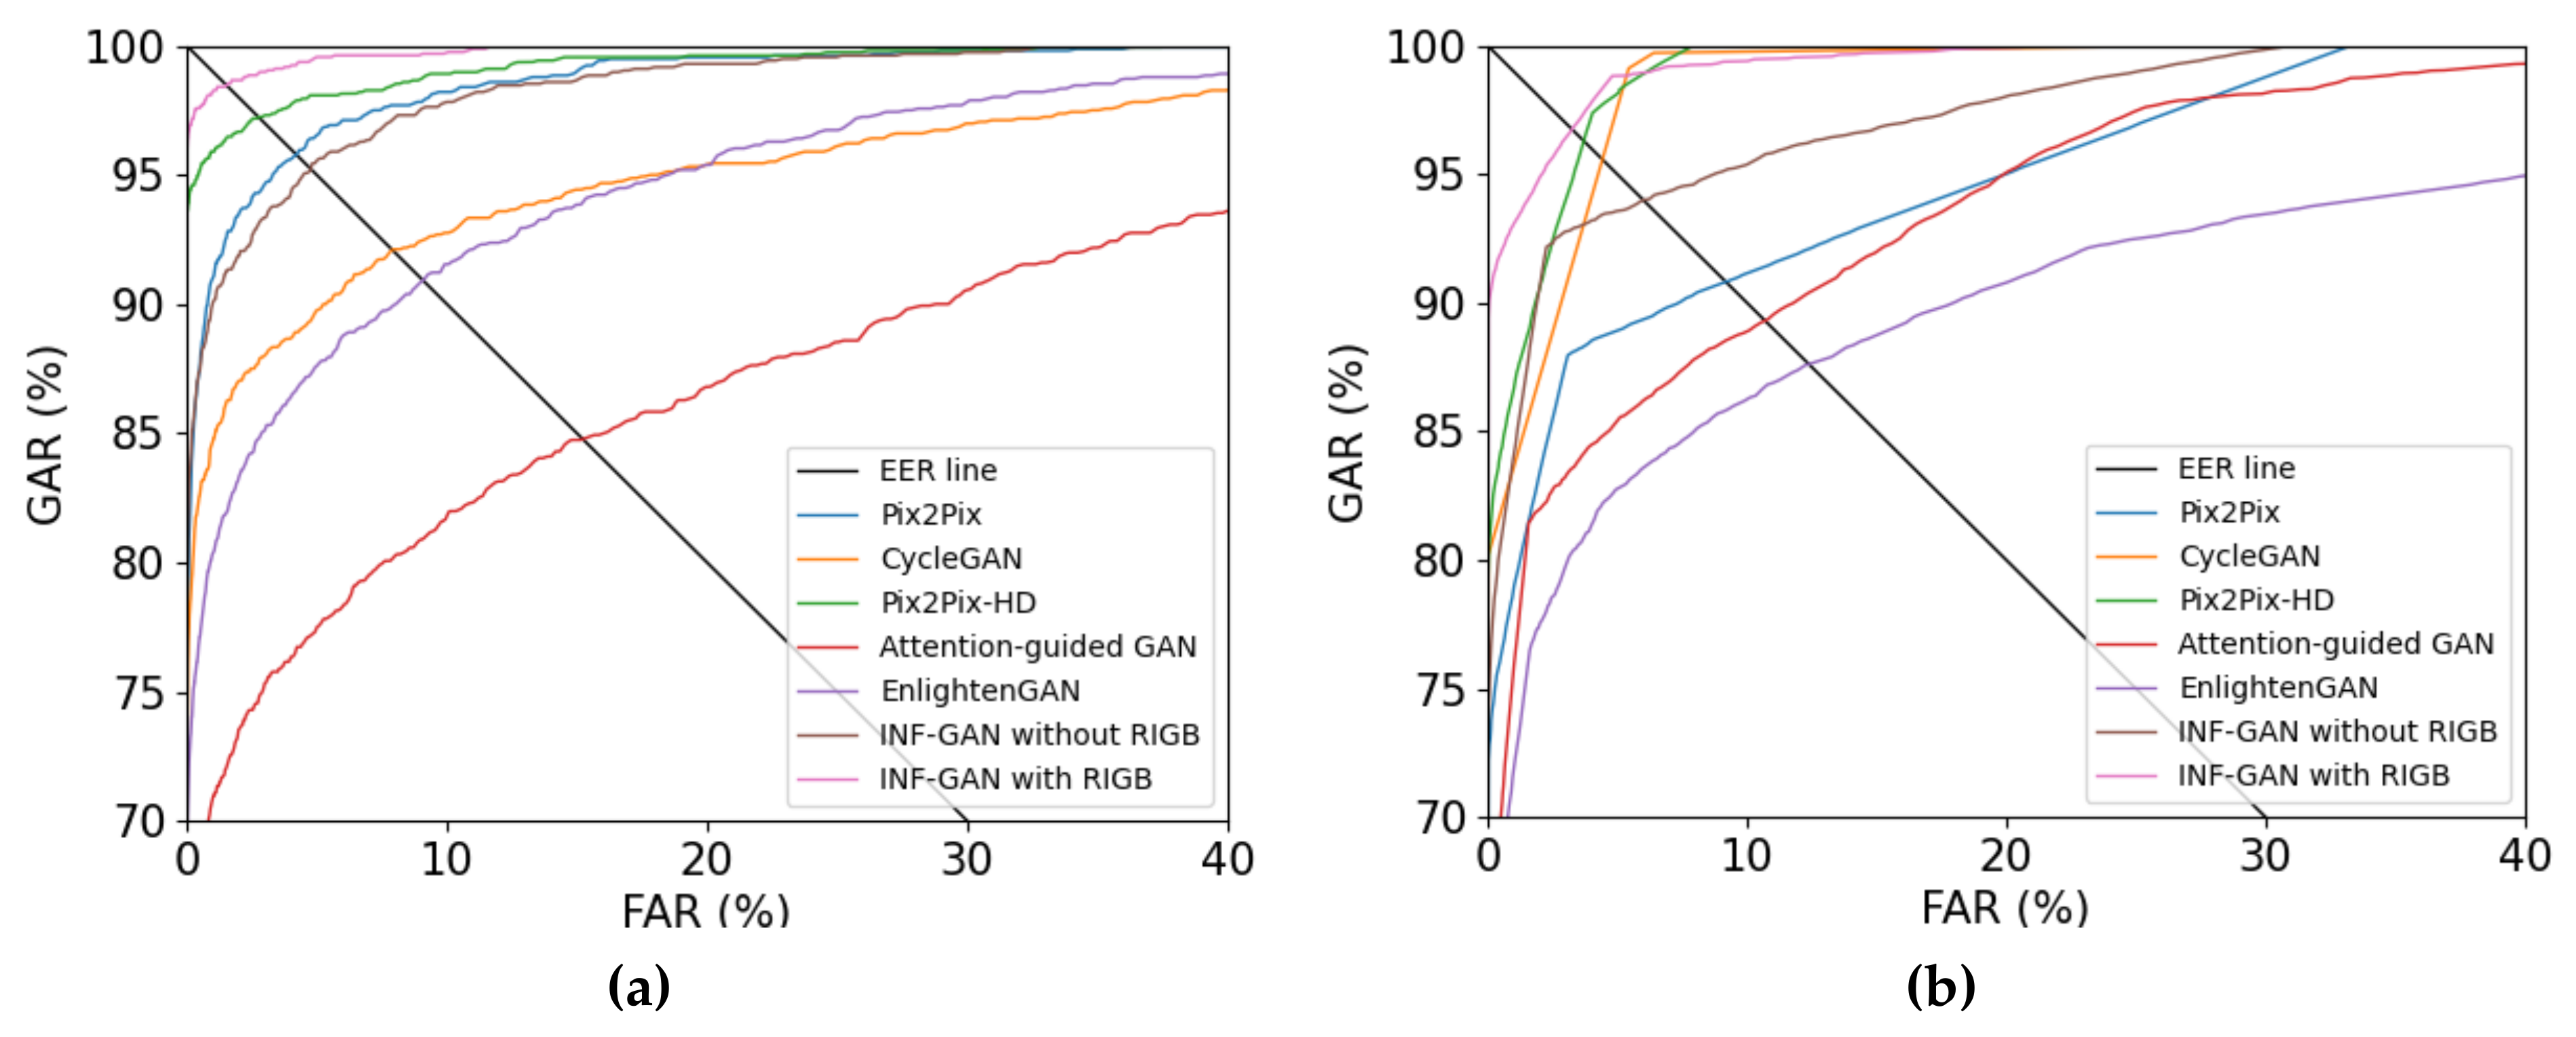
4.5.4. Comparisons of the Proposed Method and State-of-the-Art Methods

In this subsection, we compared our method with the state-of-the-art methods in terms of finger-vein recognition accuracies. For fair comparisons, the DenseNet-161-based finger-vein recognition methods described in Section 3.5 were applied to all the methods. As shown in Table 11, the proposed INF-GAN (with the RIGB) had a higher finger-vein recognition accuracy for all the cases compared with state-of-the-art methods.
Table 11. Comparisons of EER for the proposed method with those of state-of-the-art methods.
Figure 16 shows the ROC curves of each case. As shown in Figure 16, the proposed INF-GAN (with RIGB) had a higher finger-vein recognition accuracy for all the cases compared with the state-of-the-art methods.
Figure 16. ROC curves of finger-vein recognition by proposed method and the state-of-the-art methods on (a) HKPU-DB and (b) SDU-DB.
Figure 17a,c shows the cases of authentic and imposter matching, respectively, before restoration, which are examples of incorrect matching, as the vein pattern and texture information have been transformed due to nonuniform illumination. For incorrect matching, authentic matching was classified as imposter matching through false rejection, whereas imposter matching was classified as authentic matching through false acceptance, thus degrading the recognition performance. From the left, the images correspond to enrolled, recognized, and concatenated images of Figure 5, respectively. Figure 17b,d shows the cases where the incorrect matching in (a) and (c) was determined to be correct matching by restoring with the INF-GAN proposed in this study. Authentic matching was correctly classified into correct acceptance, whereas imposter matching was correctly classified into correct rejection.
Figure 17. Example of recognition result with or without image restoration by INF-GAN. (a) Incorrect authentic matching before restoration (middle image), (b) correct authentic matching after restoration (middle image), (c) incorrect imposter matching before restoration (middle image), and (d) correct imposter matching after restoration (middle image). Images in (ad) show the enrolled, recognized, and concatenated images of Figure 5, respectively, from the left.
Figure 18 shows the examples of false rejection and false acceptance even when the images were restored by the INF-GAN. The cause of these errors is that the visibility of the finger-vein pattern in the enrolled and recognized images has weakened.
Figure 18. Examples of recognition depending on the application of image restoration by the INF-GAN. (a) Incorrect authentic matching before restoration (middle image), (b) incorrect authentic matching after restoration (middle image), (c) incorrect imposter matching before restoration (middle image), and (d) incorrect imposter matching after restoration (middle image). Images in (ad) show the enrolled, recognized, and concatenated images of Figure 5, respectively, from left to right.

4.5.5. Testing on the Unseen Dataset

We performed additional experiments on the unseen dataset. For this purpose, INF-GAN is trained with HKPU-DB, and tested with SDUMLA-HMT-DB in the first trial. Then, INF-GAN is trained with SDUMLA-HMT-DB and tested with HKPU-DB in the second trial. As shown in Figure 19, our INF-GAN can produce the images where the nonuniformity of illumination can be removed and which are similar to original target images. From that, we confirm that our INF-GAN can be operated well on the unseen dataset, also.
Figure 19. Testing examples on the unseen dataset. In (a) INF-GAN is trained with HKPU-DB, and tested with SDUMLA-HMT-DB, and (b) INF-GAN is trained with SDUMLA-HMT-DB, and tested with HKPU-DB. In (a,b), original image of uniform illumination (target image), image of severely nonuniform illumination, and restored image by INF-GAN are shown from left to right, respectively. In (a,b), each row represents the different examples of testing results.

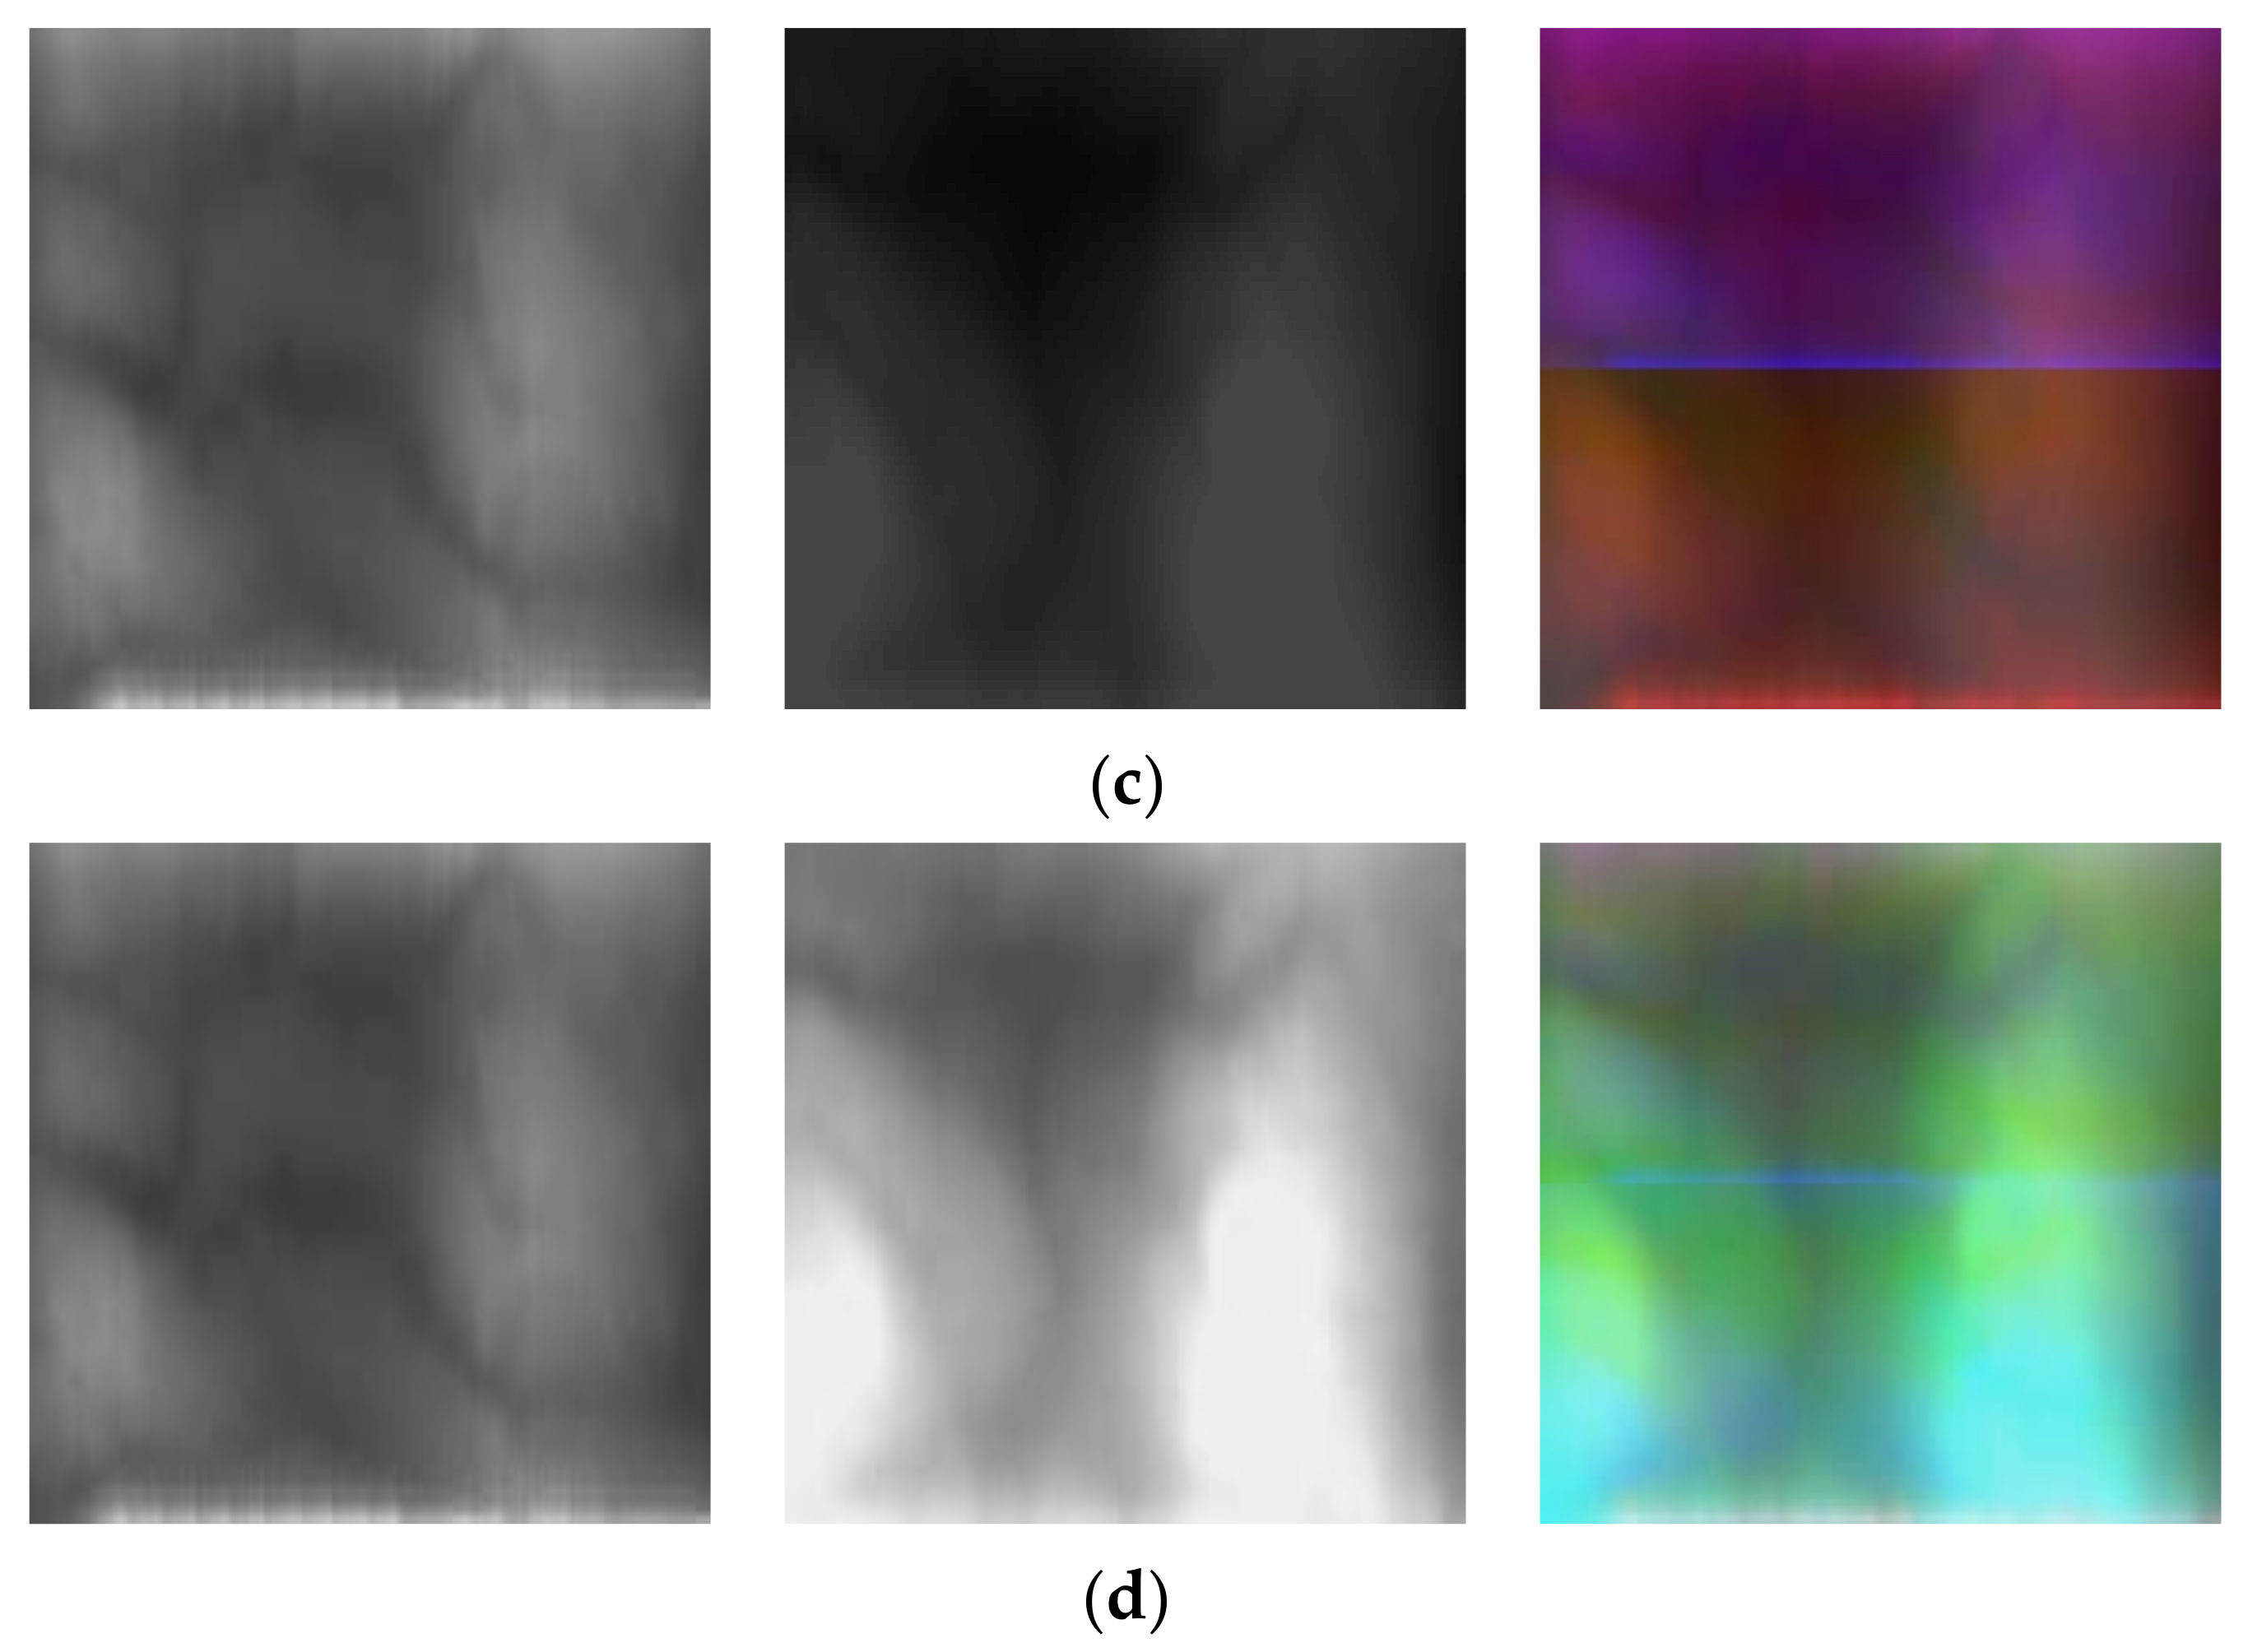
4.5.6. Analysis of Feature Maps by Grad-CAM

In this subsection, we analyzed the feature maps from DenseNet-161 using a class activation map (CAM). A CAM expresses which parts were concentrated on by a classifier, such as a CNN, for distinguishing specific classes [47]. The feature maps extracted from dense blocks one, two and three in Table 5 were compared through a Grad-CAM [48]. Accordingly, the cases of matching using the original image, nonuniformly illuminated image, and images restored by the INF-GAN were compared by separating into authentic matching and imposter matching, as shown in Figure 17. For the composite image, the restored image and the original image showed similarities; for authentic matching in Figure 20a, the similarity in activation maps between the original image and the restored image was higher than between the original image and the nonuniformly illuminated image for dense blocks one, two and three. For imposter matching in Figure 20b, despite the similarity between the nonuniformly illuminated image and the enrolled image, the similarity in activation maps was higher between the original image and the restored image than between the original image and the nonuniformly illuminated image for both dense blocks three. The features extracted from the images restored by the INF-GAN were more similar to the features extracted from the original image than the features extracted from the nonuniformly illuminated image. Thus, it was confirmed that the features extracted from the images restored by the INF-GAN are helpful in improving the accuracy of finger-vein recognition.
Figure 20. Grad-CAM by different layers from DenseNet-161 in the case of (a) authentic matching and (b) imposter matching.

4.5.7. Processing Time of the Proposed Method

In this subsection, the processing time of the proposed restoration model with the INF-GAN and DenseNet-161 was measured. The processing time was measured using the desktop computer described in Section 4.1 and the Jetson TX2 embedded system in Figure 21 [49]. Because finger-vein recognition is often used with an embedded system as it is adopted in an environment where access is restricted due to security reasons, the processing time was also measured using a Jetson TX2 board in this study. The Jetson TX2 board is an embedded system with an NVIDIA PascalTM GPU architecture with 256 NVIDIA CUDA cores, 8 GB 128-bit LPDDR4 memory, and Dual-Core NVIDIA Denver 2 64-Bit CPU. The Jetson TX2 board execution environment was implemented in Ubuntu 18.04, CUDA (version 10.2), and cuDNN (version 8.0.0). As presented in Table 12, restoration through the INF-GAN required 15.62 ms and 33.77 ms on the desktop computer and Jetson TX2 board, respectively, whereas finger-vein recognition through DenseNet-161 required 13.12 ms and 227.45 ms, respectively, on these systems. Accordingly, it was confirmed that the proposed method is applicable in an embedded environment where resources and computing power are limited.
Figure 21. Jetson TX2 embedded system.
Table 12. Comparisons of processing speed by the proposed method on the desktop computer and embedded system (unit: ms).

5. Conclusions

This paper proposed an image restoration method through the INF-GAN to prevent performance degradation in finger-vein recognition due to severe nonuniformity of illumination. An RIGB was used to supplement the distinction between vein textures in the image weakened due to nonuniform illumination. The finger-vein recognition performance through a deep CNN was improved when the restoration was performed by concatenating a one-channel residual image, which is generated by the RIGB and includes vein texture information, onto the input image. Through the experiment conducted using two open databases, HKPU-DB and SDU-DB, the quality of the image generated through the INF-GAN was compared using the state-of-the-art methods, d′, Wasserstein distance, and FID; the accuracy of finger-vein recognition was also compared using EER and ROC curves. The experiment results showed that the image quality of the INF-GAN was slightly poorer than that of the state-of-the-art-methods, but the accuracy of finger-vein recognition of the INF-GAN was better. Furthermore, the activation maps extracted from the DenseNet-161 were compared using a Grad-CAM, and the applicability of the proposed method on a desktop computer and embedded system was verified.
In future work, we would evaluate our method with more databases such as the MMCBNU_6000, THU-FVFDT1, etc. In addition, the quality of images generated by the proposed INF-GAN would be improved to examine the applicability for nonuniform illumination restoration in general scene images, instead of the finger-vein recognition examined in this study. Moreover, the possibility of using the INF-GAN-based nonuniform illumination restoration proposed in this study in various other biometric modalities of face-, iris-, and body-based recognition will be examined.

Author Contributions

Methodology, J.S.H.; Conceptualization, J.C.; Validations, S.G.K., M.O.; Supervision, K.R.P.; Writing—original draft, J.S.H.; Writing—review and editing, K.R.P. All authors have read and agreed to the published version of the manuscript.

Funding

This research was supported in part by the National Research Foundation of Korea (NRF) funded by the Ministry of Science and ICT (MSIT) through the Basic Science Research Program (NRF-2021R1F1A1045587), in part by the NRF funded by the MSIT through the Basic Science Research Program (NRF-2020R1A2C1006179), and in part by the MSIT, Korea, under the ITRC (Information Technology Research Center) support program (IITP-2021-2020-0-01789) supervised by the IITP (Institute for Information & Communications Technology Planning & Evaluation).

Institutional Review Board Statement

Not applicable.

Data Availability Statement

Not applicable.

Conflicts of Interest

The authors declare no conflict of interest.

References

  1. Mohsin, A.; Zaidan, A.; Zaidan, B.; Albahri, O.; Ariffin, S.A.B.; Alemran, A.; Enaizan, O.; Shareef, A.H.; Jasim, A.N.; Jalood, N. Finger Vein Biometrics: Taxonomy Analysis, Open Challenges, Future Directions, and Recommended Solution for Decentralised Network Architectures. IEEE Access 2020, 8, 9821–9845. [Google Scholar] [CrossRef]
  2. Akila, D.; Jeyalaksshmi, S.; Jayakarthik, R.; Mathivilasini, S.; Suseendran, G. Biometric Authentication with Finger Vein Im-ages Based on Quadrature Discriminant Analysis. In Proceedings of the 2nd International Conference on Computation, Auto-mation and Knowledge Management, Dubai, United Arab Emirates, 19–21 January 2021; pp. 118–122. [Google Scholar]
  3. Ma, H.; Hu, N.; Fang, C. The biometric recognition system based on near-infrared finger vein image. Infrared Phys. Technol. 2021, 116, 103734. [Google Scholar] [CrossRef]
  4. Lee, Y.H.; Khalil-Hani, M.; Bakhteri, R. FPGA-based finger vein biometric system with adaptive illumination for better image acquisition. In Proceedings of the IEEE International Symposium on Computer Applications and Industrial Electronics, Kota Kinabalu, Malaysia, 3–5 December 2012; pp. 107–112. [Google Scholar]
  5. Gil Hong, H.; Lee, M.B.; Park, K.R. Convolutional Neural Network-Based Finger-Vein Recognition Using NIR Image Sensors. Sensors 2017, 17, 1297. [Google Scholar] [CrossRef] [PubMed] [Green Version]
  6. Noh, K.J.; Choi, J.; Hong, J.S.; Park, K.R. Finger-Vein Recognition Based on Densely Connected Convolutional Network Using Score-Level Fusion with Shape and Texture Images. IEEE Access 2020, 8, 96748–96766. [Google Scholar] [CrossRef]
  7. Choi, J.H.; Noh, K.J.; Cho, S.W.; Nam, S.H.; Owais, M.; Park, K.R. Modified Conditional Generative Adversarial Net-work-Based Optical Blur Restoration for Finger-Vein Recognition. IEEE Access 2020, 8, 16281–16301. [Google Scholar]
  8. Yang, S.; Qin, H.; Liu, X.; Wang, J. Finger-Vein Pattern Restoration with Generative Adversarial Network. IEEE Access 2020, 8, 141080–141089. [Google Scholar] [CrossRef]
  9. Zhang, J.; Lu, Z.; Li, M.; Wu, H. GAN-Based Image Augmentation for Finger-Vein Biometric Recognition. IEEE Access 2019, 7, 183118–183132. [Google Scholar] [CrossRef]
  10. INF-GAN with Algorithm and Nonuniform Finger-Vein Images. Available online: http://dm.dgu.edu/link.html (accessed on 10 June 2021).
  11. Lee, E.C.; Lee, H.C.; Park, K.R. Finger vein recognition using minutia-based alignment and local binary pattern-based feature extraction. Int. J. Imaging Syst. Technol. 2009, 19, 179–186. [Google Scholar] [CrossRef]
  12. Song, W.; Kim, T.; Kim, H.C.; Choi, J.H.; Kong, H.-J.; Lee, S.-R. A finger-vein verification system using mean curvature. Pattern Recognit. Lett. 2011, 32, 1541–1547. [Google Scholar] [CrossRef]
  13. Wu, J.-D.; Liu, C.-T. Finger-vein pattern identification using SVM and neural network technique. Expert Syst. Appl. 2011, 38, 14284–14289. [Google Scholar] [CrossRef]
  14. Simonyan, K.; Zisserman, A. Very deep convolutional networks for large-scale image recognition. arXiv 2014, arXiv:1409.1556. [Google Scholar]
  15. Peng, J.; Wang, N.; El-Latif, A.A.A.; Li, Q.; Niu, X. Finger-vein Verification Using Gabor Filter and SIFT Feature Matching. In Proceedings of the 2012 Eighth International Conference on Intelligent Information Hiding and Multimedia Signal Processing, Piraeus-Athens, Greece, 18–20 July 2012; pp. 45–48. [Google Scholar]
  16. Van, H.T.; Thai, T.T.; Le, T.H. Robust Finger Vein Identification Base on Discriminant Orientation Feature. In Proceedings of the Seventh IEEE International Conference on Knowledge and Systems Engineering, Ho Chi Minh, Vietnam, 8–10 October 2015; pp. 348–353. [Google Scholar]
  17. Qin, H.; Qin, L.; Xue, L.; He, X.; Yu, C.; Liang, X. Finger-Vein Verification Based on Multi-Features Fusion. Sensors 2013, 13, 15048–15067. [Google Scholar] [CrossRef] [PubMed] [Green Version]
  18. Huang, G.; Liu, Z.; van der Maaten, L.; Weinberger, K.Q. Densely Connected Convolutional Networks. In Proceedings of the IEEE Conference on Computer Vision and Pattern Recognition, Honolulu, HI, USA, 21–26 July 2017; pp. 2261–2269. [Google Scholar]
  19. Deng, J.; Dong, W.; Socher, R.; Li, L.-J.; Li, K.; Li, F.-F. ImageNet: A Large-Scale Hierarchical Image Database. In Proceedings of the IEEE Conference on Computer Vision and Pattern Recognition, Miami, FL, USA, 20–25 June 2009; pp. 248–255. [Google Scholar]
  20. Kumar, A.; Zhou, Y. Human Identification Using Finger Images. IEEE Trans. Image Process. 2012, 21, 2228–2244. [Google Scholar] [CrossRef] [PubMed]
  21. Wang, T.-C.; Liu, M.-Y.; Zhu, J.-Y.; Tao, A.; Kautz, J.; Catanzaro, B. High-resolution Image Synthesis and Semantic Manipula-tion with Conditional GANs. In Proceedings of the IEEE Conference on Computer Vision and Pattern Recognition, Salt Lake City, UT, USA, 18–23 June 2018; pp. 8798–8807. [Google Scholar]
  22. He, K.M.; Zhang, X.Y.; Ren, S.Q.; Sun, J. Deep Residual Learning for Image Recognition. In Proceedings of the IEEE Conference on Computer Vision and Pattern Recognition, Las Vegas, NV, USA, 27–30 June 2016; pp. 770–778. [Google Scholar]
  23. Van der Ouderaa, T.F.; Worrall, D.E. Reversible GANs for Memory-efficient Image-to-image Translation. In Proceedings of the IEEE Conference on Computer Vision and Pattern Recognition, Long Beach, CA, USA, 15–20 June 2019; pp. 4720–4728. [Google Scholar]
  24. Awasthi, P.; Tang, A.; Vijayaraghavan, A. Efficient Algorithms for Learning Depth-2 Neural Networks with General ReLU Activations. arXiv 2021, arXiv:2107.10209. [Google Scholar]
  25. Li, M.; Lin, J.; Ding, Y.; Liu, Z.; Zhu, J.-Y.; Han, S. GAN Compression: Efficient Architectures for Interactive Conditional GANs. In Proceedings of the IEEE Conference on Computer Vision and Pattern Recognition, Seattle, WA, USA, 14–19 June 2020; pp. 5284–5294. [Google Scholar]
  26. Hui, Z.; Li, J.; Wang, X.; Gao, X. Image Fine-grained Inpainting. arXiv 2020, arXiv:2002.02609. [Google Scholar]
  27. Javed, K.; Din, N.U.; Bae, S.; Maharjan, R.S.; Seo, D.; Yi, J. UMGAN: Generative adversarial network for image unmosaicing using perceptual loss. In Proceedings of the 16th International Conference on Machine Vision Applications, Tokyo, Japan, 27–31 May 2019; pp. 1–5. [Google Scholar]
  28. Salimans, T.; Goodfellow, I.; Zaremba, W.; Cheung, V.; Radford, A.; Chen, X. Improved Techniques for Training GANs. arXiv 2016, arXiv:1606.03498. [Google Scholar]
  29. Yang, G.; Pennington, J.; Rao, V.; Sohl-Dickstein, J.; Schoenholz, S.S. A mean field theory of batch normalization. arXiv 2019, arXiv:1902.08129. [Google Scholar]
  30. Yin, Y.; Liu, L.; Sun, X. SDUMLA-HMT: A Multimodal Biometric Database. In Proceedings of the Chinese Conference on Biometric Recognition, Beijing, China, 3–4 December 2011; pp. 260–268. [Google Scholar]
  31. Lu, Y.; Xie, S.J.; Yoon, S.; Wang, Z.; Park, D.S. An available database for the research of finger vein recognition. In Proceedings of the 6th International Congress on Image and Signal Processing, Hangzhou, China, 16–18 December 2013; pp. 410–415. [Google Scholar]
  32. THU-FVFDT1. Available online: https://www.sigs.tsinghua.edu.cn/labs/vipl/thu-fvfdt.html (accessed on 10 October 2021).
  33. NVIDIA GeForce GTX 1070. Available online: https://www.geforce.com/hardware/desktop-gpus/geforce-gtx-1070/specifications (accessed on 10 June 2021).
  34. Paszke, A.; Gross, S.; Massa, F.; Lerer, A.; Bradbury, J.; Chanan, G.; Killeen, T.; Lin, Z.; Gimelshein, N.; Antiga, L.; et al. Pytorch: An Imperative Style, High-performance Deep Learning Library. arXiv 2019, arXiv:1912.01703. [Google Scholar]
  35. Loh, Y.P.; Liang, X.; Chan, C.S. Low-light image enhancement using Gaussian Process for features retrieval. Signal. Process. Image Commun. 2019, 74, 175–190. [Google Scholar] [CrossRef]
  36. Shen, L.; Yue, Z.; Feng, F.; Chen, Q.; Liu, S.; Ma, J. MSR-net: Low-light Image Enhancement Using Deep Convolutional Network. arXiv 2017, arXiv:1711.02488. [Google Scholar]
  37. Lore, K.G.; Akintayo, A.; Sarkar, S. LLNet: A deep autoencoder approach to natural low-light image enhancement. Pattern Recognit. 2017, 61, 650–662. [Google Scholar] [CrossRef] [Green Version]
  38. Kingma, D.P.; Ba, J. Adam: A method for stochastic optimization. arXiv 2017, arXiv:1412.6980. [Google Scholar]
  39. Isola, P.; Zhu, J.-Y.; Zhou, T.; Efros, A.A. Image-to-Image Translation with Conditional Adversarial Networks. In Proceedings of the 2017 IEEE Conference on Computer Vision and Pattern Recognition (CVPR), Honolulu, HI, USA, 21–26 July 2017; pp. 5967–5976. [Google Scholar] [CrossRef] [Green Version]
  40. Zhu, J.; Park, T.; Isola, P.; Efros, A.A. Unpaired Image-to-Image Translation Using Cycle-Consistent Adversarial Networks. In Proceedings of the 2017 IEEE International Conference on Computer Vision (ICCV), Venice, Italy, 22–29 October 2017; Volume 2242–2251. [Google Scholar] [CrossRef] [Green Version]
  41. Mejjati, Y.A.; Richardt, C.; Tompkin, J.; Cosker, D.; Kim, K.I. Unsupervised Attention-Guided Image to Image Translation. arXiv 2018, arXiv:1806.02311. [Google Scholar]
  42. Jiang, Y.; Gong, X.; Liu, D.; Cheng, Y.; Fang, C.; Shen, X.; Yang, J.; Zhou, P.; Wang, Z. EnlightenGAN: Deep Light Enhance-ment Without Paired Supervision. IEEE Trans. Image Process. 2021, 30, 2340–2349. [Google Scholar] [CrossRef]
  43. Herzog, M.H.; Francis, G.; Clarke, A. Experimental Design and the Basics of Statistics: Signal Detection Theory (SDT). In Basic Concepts on 3D Cell Culture; Springer: Berlin, Germany, 2019; pp. 13–22. [Google Scholar]
  44. Ramdas, A.; Trillos, N.G.; Cuturi, M. On Wasserstein Two-Sample Testing and Related Families of Nonparametric Tests. Entropy 2017, 19, 47. [Google Scholar] [CrossRef]
  45. Heusel, M.; Ramsauer, H.; Unterthiner, T.; Nessler, B.; Hochreiter, S. GANs Trained by a Two Time-Scale Update Rule Con-verge to a Local Nash Equilibrium. arXiv 2018, arXiv:1706.08500. [Google Scholar]
  46. Szegedy, C.; Vanhoucke, V.; Ioe, S.; Shlens, J.; Wojna, Z. Rethinking the inception architecture for computer vision. In Proceedings of the IEEE Conference on Computer Vision and Pattern Recognition, Las Vegas, NV, USA, 27–30 June 2016; pp. 2818–2826. [Google Scholar]
  47. Zhou, B.; Khosla, A.; Lapedriza, A.; Oliva, A.; Torralba, A. Learning deep features for discriminative localization. In Proceedings of the IEEE Conference on Computer Vision and Pattern Recognition, Las Vegas, NV, USA, 27–30 June 2016; pp. 2921–2929. [Google Scholar]
  48. Selvaraju, R.R.; Cogswell, M.; Das, A.; Vedantam, R.; Parikh, D.; Batra, D. Grad-CAM: Visual Explanations from Deep Net-works via Gradient-based Localization. In Proceedings of the IEEE International Conference on Computer Vision, Venice, Italy, 22–29 October 2017; pp. 618–626. [Google Scholar]
  49. Jetson TX2 Module. Available online: https://developer.nvidia.com/embedded/jetson-tx2 (accessed on 2 January 2021).
Publisher’s Note: MDPI stays neutral with regard to jurisdictional claims in published maps and institutional affiliations.

Article Metrics

Citations

Article Access Statistics

Multiple requests from the same IP address are counted as one view.