
Multi-Criteria Analysis for Business Location Decisions


Abstract
:1. Introduction
Literature Review
2. Materials and Methods
2.1. Database
2.1.1. Health
2.1.2. Education
2.1.3. Employment and Income
2.1.4. Environment
2.1.5. Equality
2.1.6. Leisure
2.1.7. Accommodations and Security
2.1.8. Mobility
2.1.9. Climate
2.1.10. Technology

| Dimension | No. | Indicator | Description | Unit | Sign | Year | Source |
|---|---|---|---|---|---|---|---|
| Health (A) | A1 | Healthy life expectancy at birth | Average number of years that a person can expect to live with “full health”, taking into account years lived with less than full health due to disease and/or injury | Years | Max | 2016 | Word Health Organization |
| Health (A) | A2 | Health spending | Final consumption of healthcare goods and services including personal healthcare and collective services but excluding spending on healthcare investments | Percentage of gross domestic product | Max | 2019 | OECD |
| Health (A) | A3 | Available hospital beds | All hospital beds that are regularly maintained and staffed and immediately available for admitted patients’ care | Per 100,000 inhabitants | Max | 2017 | Eurostat |
| Health (A) | A4 | HAQ Index | Deaths from treatable health conditions in 195 countries and regions | Score of 0–100 | Max | 2015 | The Lancet |
| Education (B) | B1 | Population with secondary education | Upper secondary and post-secondary non-tertiary education among individuals aged 20 to 24 | Percentage | Max | 2019 | Eurostat |
| Education (B) | B2 | Population with tertiary education | Tertiary education for those aged 25 to 64 by gender and Nomenclature of Territorial Units for Statistics (NUTS) 2 regions | Percentage | Max | 2019 | Eurostat |
| Education (B) | B3 | PISA reading score | Mean score and variation in reading performance reported by PISA | Score | Max | 2018 | OECD |
| Education (B) | B4 | PISA mathematics score | Mean score and variation in mathematics performance reported by PISA | Score | Max | 2018 | OECD |
| Education (B) | B5 | PISA science score | Mean score and variation in science performance reported by PISA | Score | Max | 2018 | OECD |
| Education (B) | B6 | PISA total score | Top performers in reading, mathematics, and science reported by PISA | Percentage | Max | 2018 | OECD |
| Education (B) | B7 | QS World University Rankings | Number of city’s universities in the top 500 of QS ranking | Number | Max | 2019 | QS top universities |
| Employment and income (C) | C1 | Unemployment rate | Unemployment by gender for individuals aged between 15 and 74—annual data | Percentage of active population | Min | 2019 | Eurostat |
| Employment and income (C) | C2 | Ease of doing business ranking | Economies ranked by ease of doing business from 1–190 | Number | Max | 2019 | World Bank |
| Employment and income (C) | C3 | Gini index | Income dispersion value from 0 = equal income distribution to 1 = total inequality | Scale of 0–1 | Min | 2010–2014 | OECD |
| Employment and income (C) | C4 | Number of work hours/week | Average number of usual weekly hours of work in main job by gender, age, and NUTS 2 region | Hours | Min | 2019 | Eurostat |
| Environment (D) | D1 | Density of airborne particles (particulate matter [PM] 2.5) | Annual mean concentration of PM of 2.5 microns or less in diameter (PM2.5) in city and localities | Grams/cubic centimeter | Min | 2016 | World Health Organization |
| Environment (D) | D2 | Density of airborne particles (PM 10) | Annual mean concentration of PM of 10 microns or less in diameter (PM10) in cities and localities | Micrograms/cubic meter | Min | 2017 | World Health Organization |
| Environment (D) | D3 | Greenhouse emissions | Total national emissions of greenhouse gases including carbon dioxide, methane, nitrous oxide, and so-called fluorinated gases (i.e., hydrofluorocarbons, perfluorocarbons, nitrogen trifluoride, and sulfur hexafluoride) | Tons per capita | Min | 2018 | Eurostat |
| Environment (D) | D4 | Waste generation | Waste generation by waste category, hazardousness, and statistical classification of economic activities or NACE Rev. 2 | Kilograms per capita | Min | 2016 | Eurostat |
| Environment (D) | D5 | Waste treatment | Waste treatment by waste category, hazardousness, and waste management operations | Kilograms per capita | Max | 2016 | Eurostat |
| Environment (D) | D6 | Energy from renewable sources | Share of renewable energy | Percentage | Max | 2019 | Eurostat |
| Environment (D) | D7 | Water for consumption | People using safely managed drinking water services | Percentage | Max | 2017 | World Bank |
| Gender equality (E) | E1 | Gender Equality Index | Composite indicator that quantifies the progress made in implementation and results of member states’ equality policies | Score | Max | 2019 | European Institute for Gender Equality |
| Gender equality (E) | E2 | Global Gender Gap Index | (1) Economic participation and opportunity: salaries, participation, and highly qualified employment; (2) education: access to basic and higher levels of education; (3) political participation: representation in decision-making structures; (4) health and survival: life expectancy and male-female ratio | Score | Max | 2020 | World Economic Forum |
| Gender equality (E) | E3 | Gender Inequality Index | Three important aspects of human development: reproductive health, empowerment, and economic situation | Score (the lower the better) | Min | 2019 | Human development reports (United Nations) |
| Leisure (F) | F1 | Theme Index and Museum Index | Number of museums in city that are in the top 20 of Europe by visitors | Number | Max | 2019 | Themed Entertainment Association/AECOM |
| Leisure (F) | F2 | Restaurant Price Index by city | Comparison of prices of meals and drinks in restaurants and bars to New York City prices | Percentage | Min | 2020 | Numbeo |
| Leisure (F) | F3 | McMeal price at McDonald’s | Price of McMeal or equivalent combo meal by city | Euros | Min | 2020 | Numbeo |
| Leisure (F) | F4 | Number of meetings per city | European city ranking by number of meetings | Number | Max | 2019 | ICCA |
| Leisure (F) | F5 | Number of parks and natural sites | Number of parks and natural sites in city | Number | Max | 2020 | TripAdvisor |
| Leisure (F) | F6 | Number of museums | Number of museums in city | Number | Max | 2020 | TripAdvisor |
| Leisure (F) | F7 | Number of monuments and interesting places to visit in city | Number of monuments and interesting places in city | Number | Max | 2020 | TripAdvisor |
| Leisure (F) | F8 | Number of shows | Number of shows in city including theaters, comedy shows, and concerts | Number | Max | 2020 | TripAdvisor |
| Accommodations and security (G) | G1 | Housing price | Ratio between average housing prices by city and average wage by country | Number | Min | 2020 | Numbeo |
| Accommodations and security (G) | G2 | Mortgage as percentage of income | Ratio of actual monthly cost of mortgage to take-home pay per family | Percentage | Min | 2020 | Numbeo |
| Accommodations and security (G) | G3 | Price to rent ratio in city center | Average cost of ownership divided by received rent income if buying to let or estimated rent paid if buying to reside | Score | Min | 2020 | Numbeo |
| Accommodations and security (G) | G4 | Crime rate index | Estimation of overall level of crime in city or country | Score | Min | 2020 | Numbeo |
| Accommodations and security (G) | G5 | Corruption Perceptions Index | Perceived level of corruption by country | Number | Max | 2019 | Transparency International |
| Mobility (H) | H1 | Motor vehicle traffic accidents | Motor vehicle traffic accidents per 100,000 inhabitants | Deaths per 100,000 | Min | 2015 | World Health Organization |
| Mobility (H) | H2 | Gasoline price | Price of one liter of gasoline by city | Euros | Min | 2020 | Numbeo |
| Mobility (H) | H3 | TomTom Traffic Index | Level of urban congestion by city | Number | Max | 2019 | TomTom |
| Weather (W) | I1 | Climate Index | Includes average temperature, days of rain, and total amount of rain in millimeters by city | Number | Max | 2020 | Soler et al. [36] |
| Technology (J) | J1 | Innovation Cities Index | Values ranging from 0 = no innovation to 60 = much innovation | Number | Max | 2019 | Innovation Cities Program |
| Technology (J) | J2 | Web Index | Economic, social, and political benefit that countries obtain from the Internet | Number | Max | 2014–15 | World Wide Web Foundation |
| Technology (J) | J3 | Internet speed | Internet speed by city | Mbps | Max | 2020 | Nomad List |
| Technology (J) | J4 | Internet access | Households with access to Internet at home | Percentage | Max | 2019 | Eurostat |
| Technology (J) | J5 | Broadband access | Households with broadband access by NUTS 2 region | Percentage | Max | 2019 | Eurostat |
| Technology (J) | J6 | Global Innovation Index | Latest trends and annual innovation ranking of 131 economies by country | Score (0–100) | Max | 2020 | WIPO |
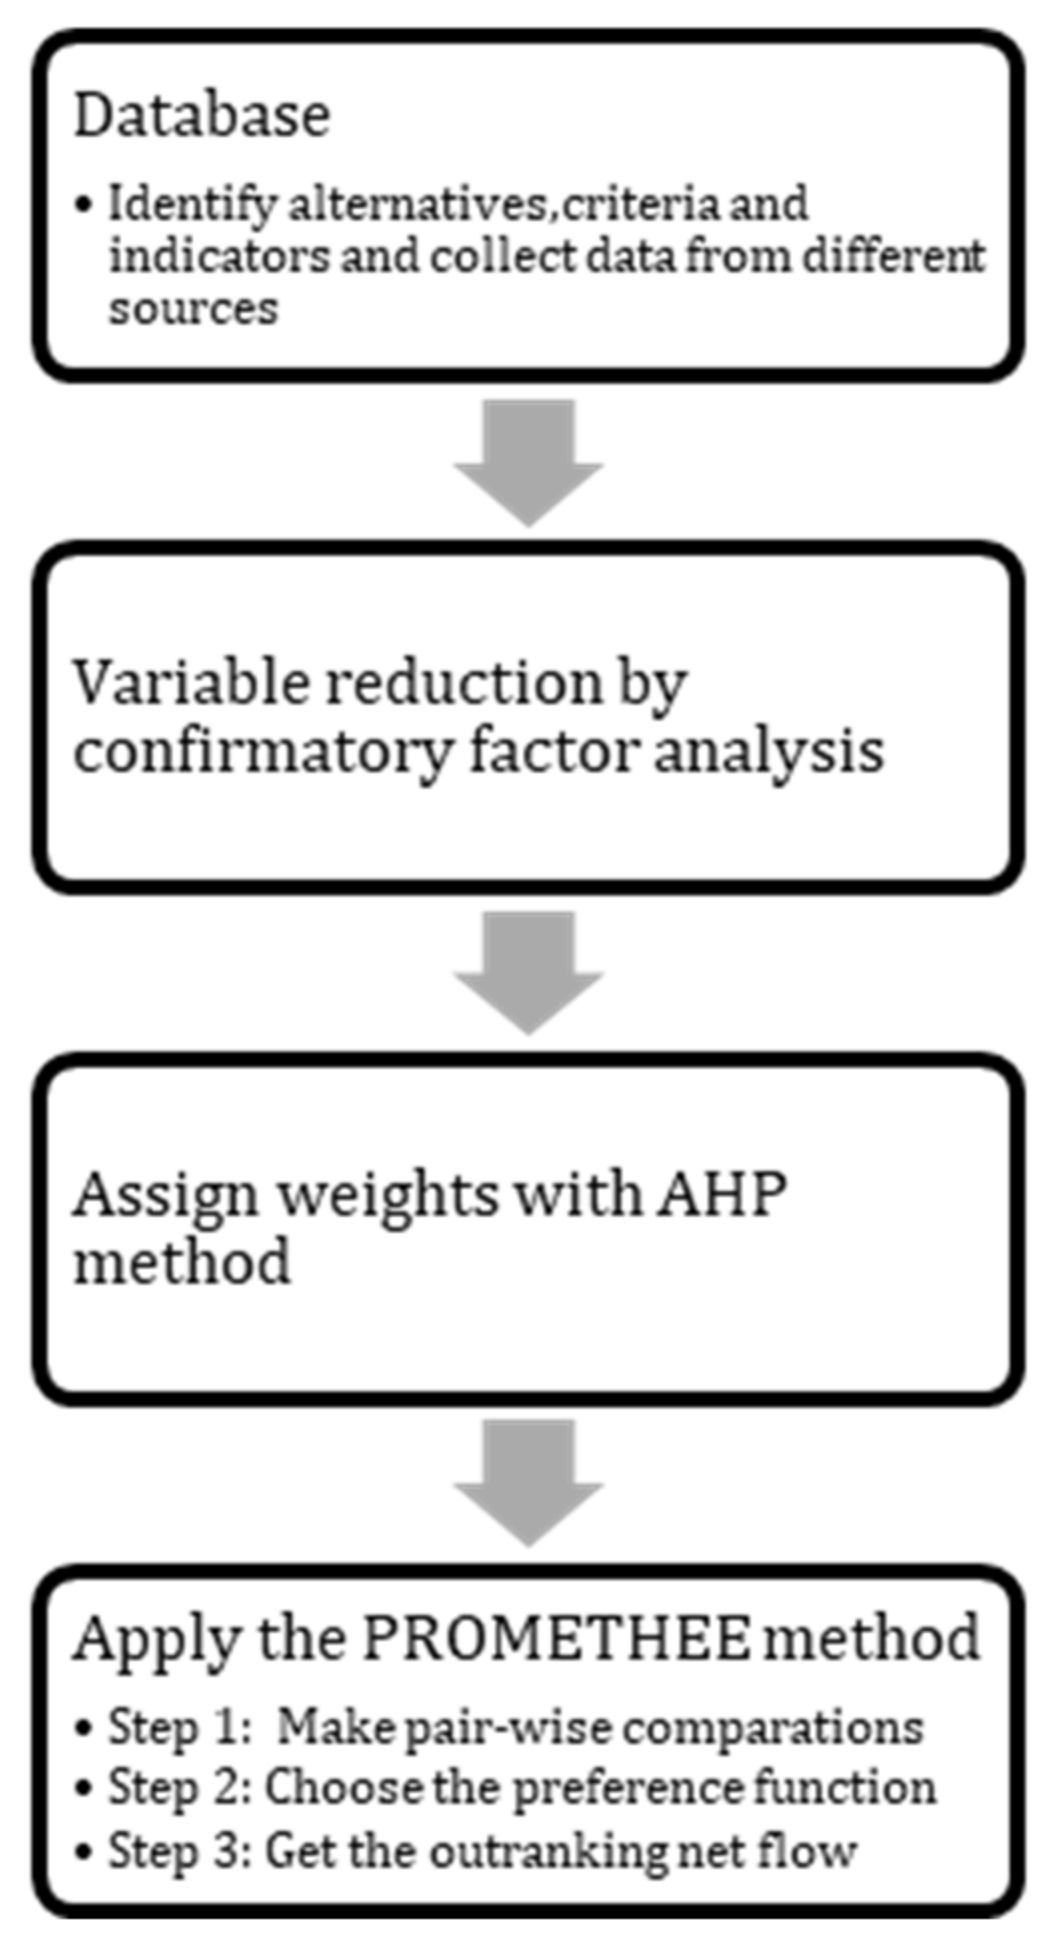
2.2. Methodology
2.2.1. Factor Analysis
2.2.2. AHP Method
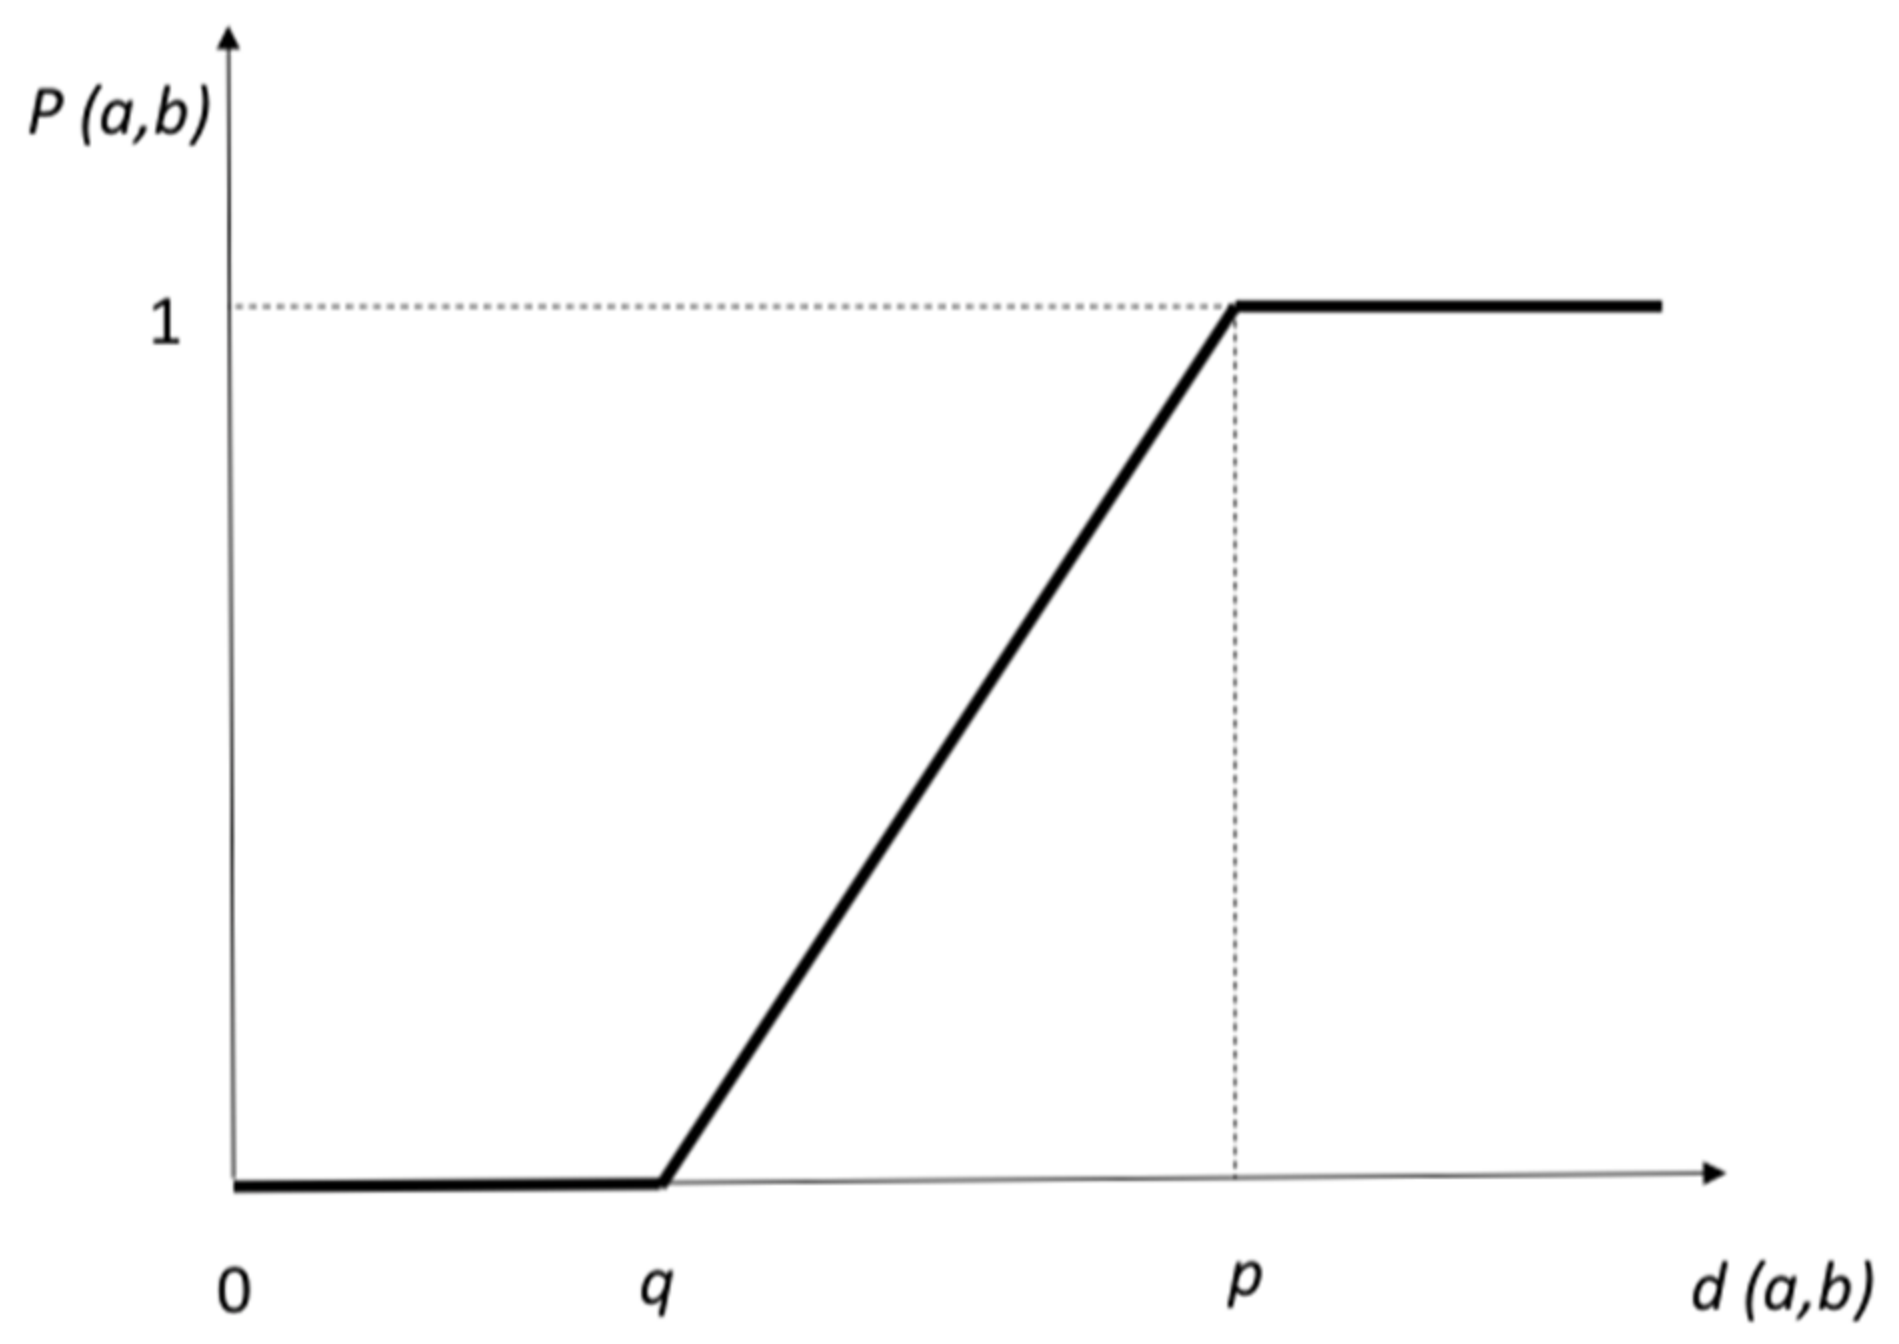
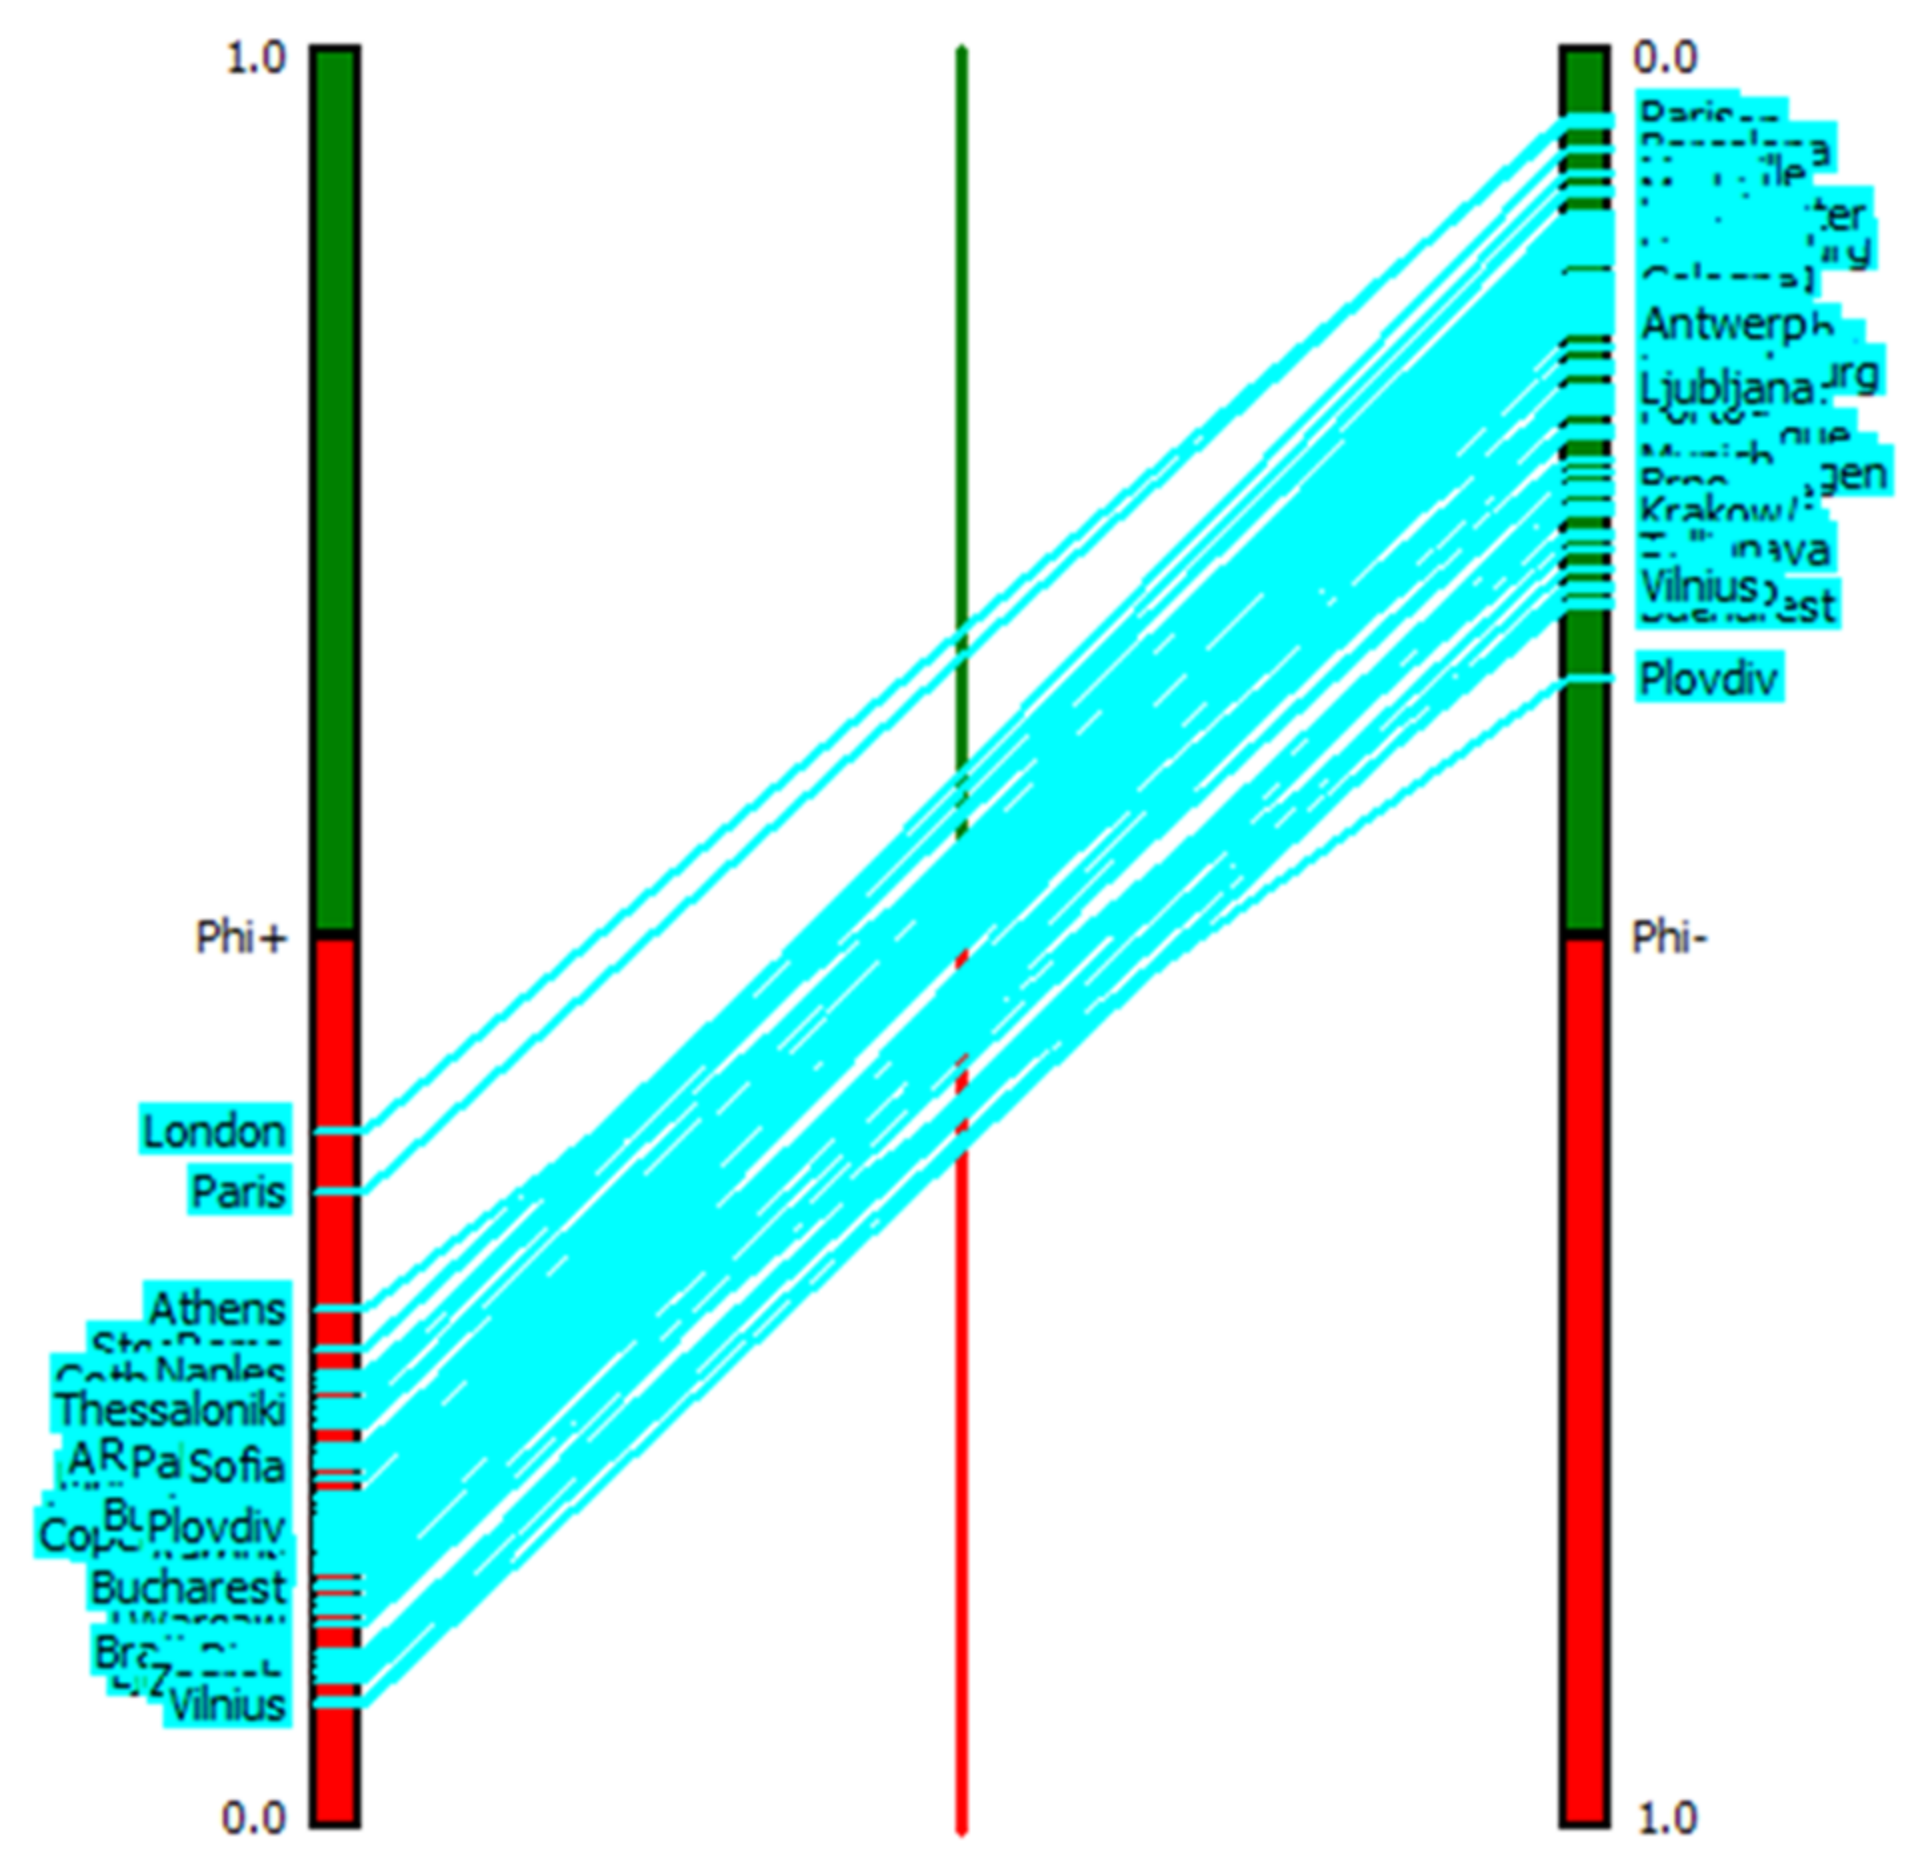
2.2.3. PROMETHEE
Step One
Step Two
Step Three
Step Four
Step Five
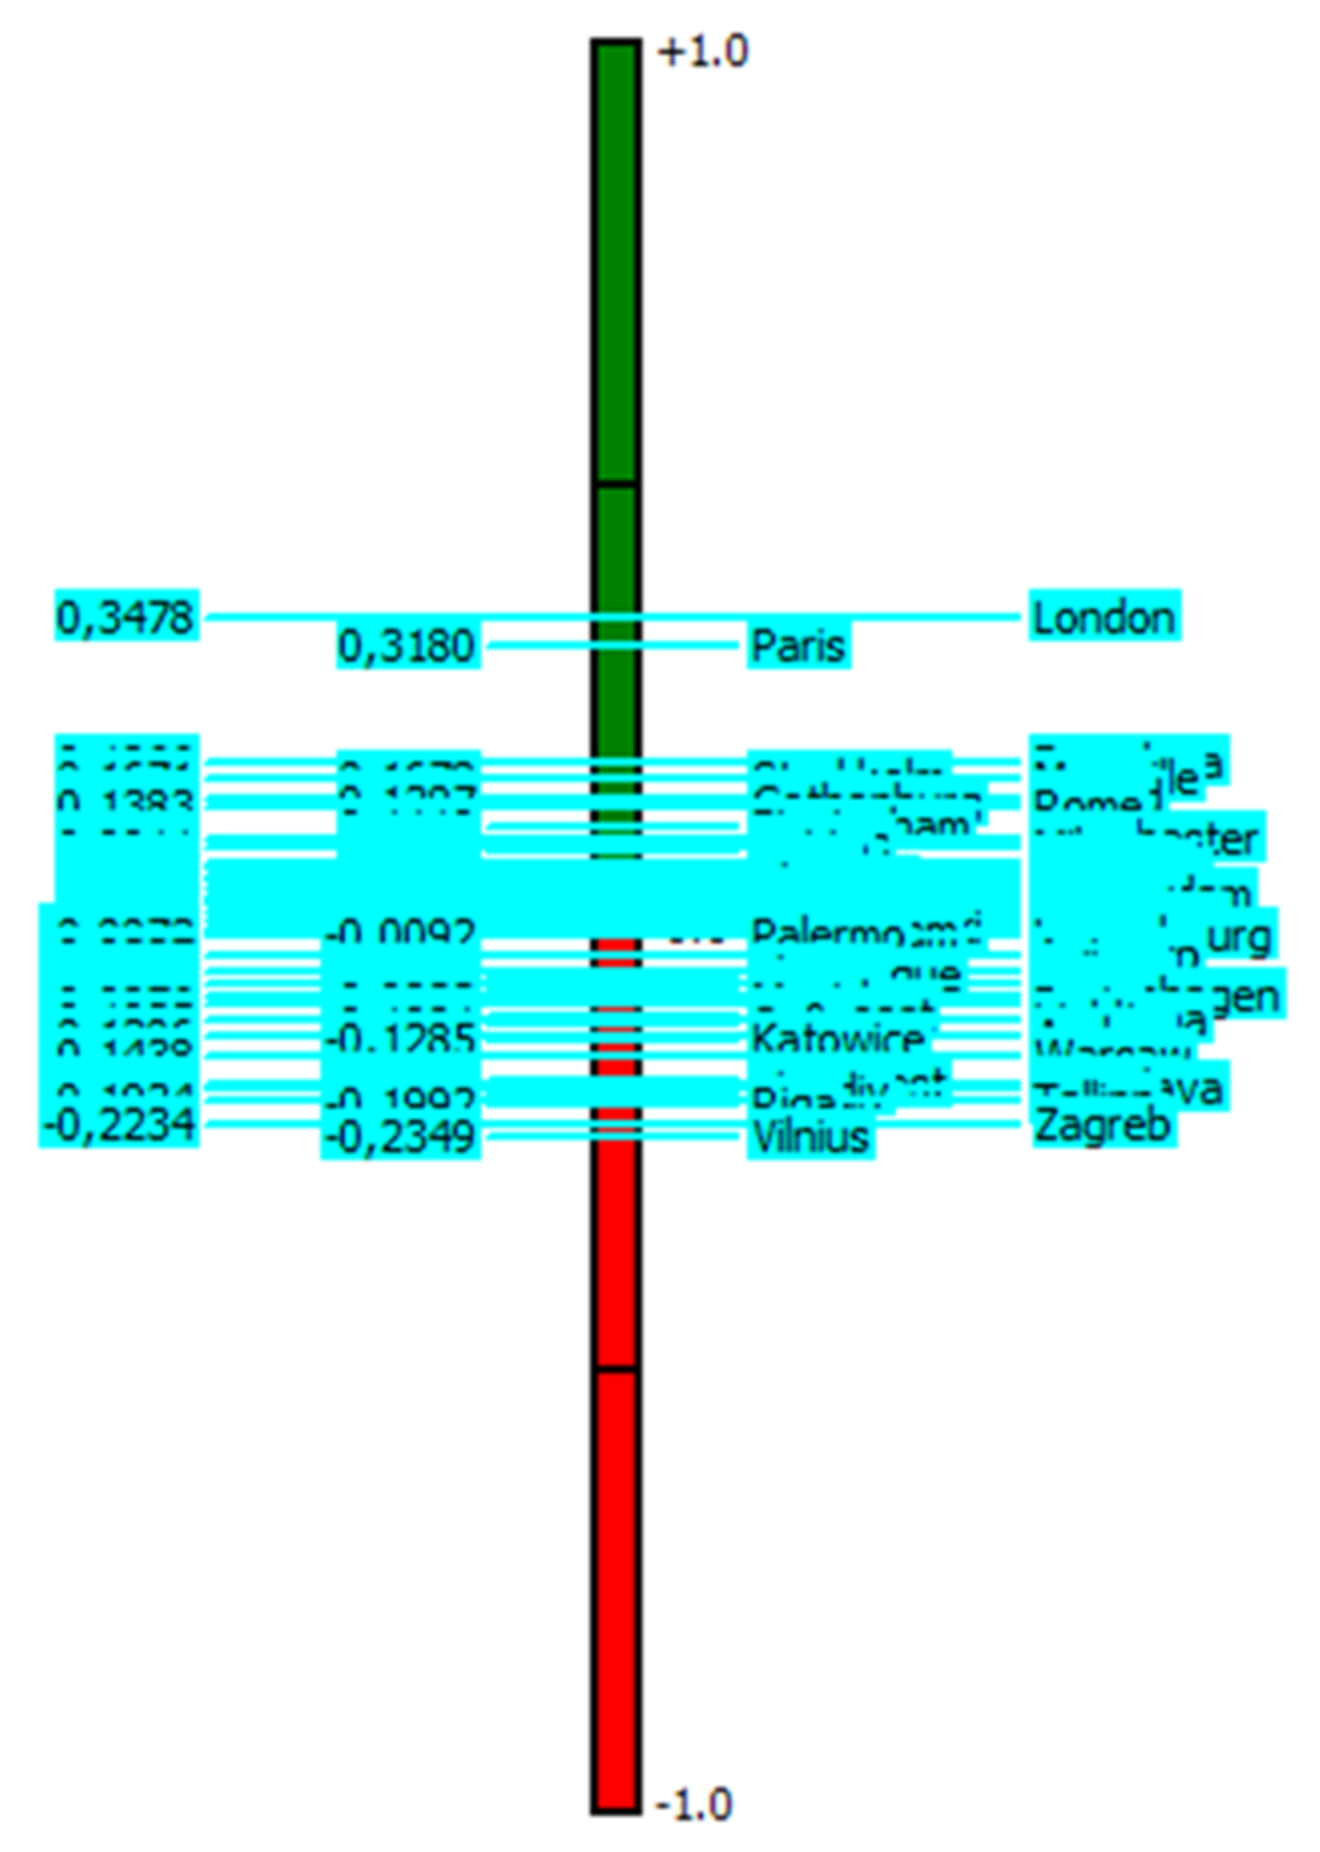
3. Results
4. Discussion
5. Conclusions
5.1. Theoretical Implications
5.2. Practical Implications
5.3. Limitations and Future Lines of Research
Author Contributions
Funding
Institutional Review Board Statement
Informed Consent Statement
Data Availability Statement
Conflicts of Interest
Appendix A
| Dimension | Tag | Cronbach’s Alpha |
|---|---|---|
| Health | A1 | 0.764 |
| A2 | ||
| A3 | ||
| A4 | ||
| Education | B3 | 0.874 |
| B4 | ||
| B5 | ||
| B6 | ||
| Employment and Income | C1 | 0.815 |
| C2 | ||
| C3 | ||
| C4 | ||
| Environment | D3 | 0.747 |
| D4 | ||
| D5 | ||
| Gender and Equality | E1 | 0.715 |
| E2 | ||
| E3 | ||
| Leisure | F1 | 0.876 |
| F4 | ||
| F5 | ||
| F6 | ||
| F7 | ||
| F8 | ||
| Accommodation | G1 | 0.700 |
| G2 | ||
| G3 | ||
| Security | G4 | 0.730 |
| G5 | ||
| Mobility | H1 | 0.920 |
| H2 | ||
| Technology | J1 | 0.863 |
| J2 | ||
| J4 | ||
| J5 | ||
| J6 |
| 1 | 2 | 3 | 4 | 5 | 6 | 7 | 8 | 9 | 10 | |
|---|---|---|---|---|---|---|---|---|---|---|
| A1 | 0.961 | |||||||||
| A2 | 0.675 | |||||||||
| A3 | −0.749 | |||||||||
| A4 | 0.918 | |||||||||
| B3 | 0.921 | |||||||||
| B4 | 0.953 | |||||||||
| B5 | 0.991 | |||||||||
| B6 | 0.915 | |||||||||
| C1 | 0.590 | |||||||||
| C2 | 0.743 | |||||||||
| C3 | 0.708 | |||||||||
| C4 | 0.663 | |||||||||
| D3 | 0.542 | |||||||||
| D4 | 0.967 | |||||||||
| D5 | 0.972 | |||||||||
| E1 | 0.936 | |||||||||
| E2 | 0.861 | |||||||||
| E3 | −0.786 | |||||||||
| F1 | 0.830 | |||||||||
| F4 | 0.814 | |||||||||
| F5 | 0.957 | |||||||||
| F6 | 0.922 | |||||||||
| F7 | 0.891 | |||||||||
| F8 | 0.964 | |||||||||
| G1 | 0.974 | |||||||||
| G2 | 0.927 | |||||||||
| G3 | 0.745 | |||||||||
| G4 | 0.713 | |||||||||
| G5 | −0.713 | |||||||||
| H1 | 0.793 | |||||||||
| H2 | −0.793 | |||||||||
| J1 | 0.601 | |||||||||
| J2 | 0.891 | |||||||||
| J4 | 0.933 | |||||||||
| J5 | 0.899 | |||||||||
| J6 | 0.905 |
References
- Chang, X.; Li, J. Business performance prediction in location-based social commerce. Expert Syst. Appl. 2019, 126, 112–123. [Google Scholar] [CrossRef]
- Arauzo-Carod, J.M.; Liviano-Solis, D.; Manjón-Antolín, M.C. Empirical studies in industrial location: An assessment of their methods and results. J. Reg. Sci. 2010, 50, 685–711. [Google Scholar] [CrossRef]
- Button, P. Do tax incentives affect business location and economic development? Evidence from state film incentives. Reg. Sci. Urban Econ. 2019, 77, 315–339. [Google Scholar] [CrossRef] [PubMed] [Green Version]
- The Mori Memorial Foundation. Global Power City Index; Mori Memorial Foundation: Tokyo, Japan, 2020. [Google Scholar]
- IESE Business School. Cities in Motion Index; IESE Business School: Pamplona, Navarra, Spain, 2019. [Google Scholar]
- Fernandez-Crehuet, J.M.; Rosales-Salas, J.; Avilés, R. Best city to invest in: European Cities Quality Index. Risk Gov. Control. Financ. Mark. Inst. 2020, 10, 8–22. [Google Scholar] [CrossRef]
- Brans, J.-P.; Vincke, P. Note—A Preference Ranking Organisation Method: (The PROMETHEE Method for Multiple Criteria Decision-Making). Manag. Sci. 1985, 31, 647–656. [Google Scholar] [CrossRef] [Green Version]
- Saaty, T.L. The Analytic Hierarchy Process; Mc. GrawYHill International: New York, NY, USA, 1980. [Google Scholar]
- Stearns, T.M.; Carter, N.M.; Reynolds, P.D.; Williams, M.L. New firm survival: Industry, strategy, and location. J. Bus. Ventur. 1995, 10, 23–42. [Google Scholar] [CrossRef]
- Gémar, G.; Moniche, L.; Morales, A.J. Survival analysis of the Spanish hotel industry. Tour. Manag. 2016, 54, 428–438. [Google Scholar] [CrossRef]
- Gémar, G.; Soler, I.P.; Guzmán-Parra, V.F. Predicting bankruptcy in resort. Int. J. Contemp. Hosp. Manag. 2019, 31, 1546–1566. [Google Scholar] [CrossRef]
- Belberdos, R.; Du, H.S.; Slangen, A. When do firms choose global cities as foreign investment locations within countries? The roles of contextual distance, knowledge intensity, and target-country experience. J. World Bus. 2020, 55, 101022. [Google Scholar]
- Flores, R.G.; Aguilera, R.V. Globalization and location choice: An analysis of US multinational firms in 1980 and 2000. J. Int. Bus. Stud. 2007, 38, 1187–1210. [Google Scholar] [CrossRef]
- Ramasamy, B.; Yeung, M.; Laforet, S. China’s outward foreign direct investment: Location choice and firm ownership. J. World Bus. 2012, 47, 17–25. [Google Scholar] [CrossRef]
- Mataloni, R.J. The structure of location choice for new US manufacturing investments in Asia-Pacific. J. World Bus. 2011, 46, 154–165. [Google Scholar] [CrossRef]
- Goerzen, A.; Asmussen, C.G.; Nielsen, B.B. Global cities and multinational enterprise location strategy. J. Int. Bus. Stud. 2013, 44, 427–450. [Google Scholar] [CrossRef]
- Friedmann, J. The World City Hypothesis. In World Cities in a World System; Cambridge University Press: Cambridge, UK, 1995; pp. 317–331. [Google Scholar]
- Sassen, S. The Global City. In A Companion to the Anthropology of Politics; Blackwell Publishing Ltd.: Oxford, UK, 2008; pp. 168–178. [Google Scholar]
- Blevins, D.P.; Moschieri, C.; Pinkham, B.C.; Ragozzino, R. Institutional changes within the European Union: How global cities and regional integration affect MNE entry decisions. J. World Bus. 2016, 51, 319–330. [Google Scholar] [CrossRef]
- Audretsch, B. Agglomeration and the location of innovative activity. Oxf. Rev. Econ. Policy 1998, 14, 18–29. [Google Scholar] [CrossRef]
- Camagni, R. Innovation Networks: Spatial Perspectives; Belhaven Press: London, UK, 1991. [Google Scholar]
- Nijkamp, P. XXQ factors for sustainable urban development: A systems economics view. Rom. J. Reg. Sci. 2008, 2, 1–34. [Google Scholar]
- Kourtit, K.; Macharis, C.; Nijkamp, P. A multi-actor multi-criteria analysis of the performance of global cities. Appl. Geogr. 2014, 49, 24–36. [Google Scholar] [CrossRef] [Green Version]
- Bartik, T.J. The Effects of Environmental Regulation on Business Location in the United States. Growth Chang. 1988, 19, 22–44. [Google Scholar] [CrossRef]
- Lopes, A.P.F.; Muñoz, M.M.; Alarcón-Urbistondo, P. Regional tourism competitiveness using the PROMETHEE approach Ana. Ann. Tour. Res. J. 2018, 73, 1–13. [Google Scholar] [CrossRef]
- Ostovare, M.; Shahraki, M.R. Evaluation of hotel websites using the multicriteria analysis of PROMETHEE and GAIA: Evidence from the five-star hotels of Mashhad. Tour. Manag. Perspect. 2019, 30, 107–116. [Google Scholar] [CrossRef]
- Makan, A.; Fadili, A. Sustainability assessment of large-scale composting technologies using PROMETHEE method. J. Clean. Prod. 2020, 261, 121244. [Google Scholar] [CrossRef]
- Brans, J.P.; De Smet, Y. PROMETHEE methods. Int. Ser. Oper. Res. Manag. Sci. 2016, 233, 187–219. [Google Scholar] [CrossRef]
- Macharis, C.; Springael, J.; de Brucker, K.; Verbeke, A. PROMETHEE and AHP: The design of operational synergies in multicriteria analysis—Strengthening PROMETHEE with ideas of AHP. Eur. J. Oper. Res. 2004, 153, 307–317. [Google Scholar] [CrossRef]
- World Health Organization. Healthy Cities: Good Health Is Good Politics: Toolkit for Local Governments to Support Healthy Urban Development; World Health Organization: Manila, Philippines, 2015. [Google Scholar]
- Barber, R.M.; Fullman, N.; Sorensen, R.J.D.; Bollyky, T.; McKee, M.; Nolte, E.; Abajobir, A.A.; Abate, K.H.; Abbafati, C.; Abbas, K.M. Healthcare Access and Quality Index based on mortality from causes amenable to personal health care in 195 countries and territories, 1990–2015: A novel analysis from the Global Burden of Disease Study 2015. Lancet 2017, 390, 231–266. [Google Scholar] [CrossRef] [Green Version]
- Rosenthal, S.S.; Strange, W.C. The attenuation of human capital spillovers. J. Urban Econ. 2008, 64, 373–389. [Google Scholar] [CrossRef]
- OECD. PISA 2018 Results (Volume I): What Students Know and Can Do; OECD Publishing: Paris, France, 2019. [Google Scholar]
- World Bank. Doing Business 2020; World Bank Publications: Washington, DC, USA, 2020. [Google Scholar]
- UN General Assembly Transforming Our World: The 2030 Agenda for Sustainable Development. In A New Era in Global Health; Springer Publishing Company: New York, NY, USA, 2018.
- Perales, J.A.S. De los Objetivos del Milenio al desarrollo sostenible: Naciones Unidas y las metas globales post-2015. Anu. Ceipaz 2014, 7, 49–84. [Google Scholar]
- European Institute for Gender Equality. Gender Equality Index; European Institute for Gender Equality: Vilnius, Lithuania, 2019. [Google Scholar]
- World Economic Forum Global Gender Gap Report 2020. Available online: https://reports.weforum.org/global-gender-gap-report-2020/the-global-gender-gap-index-2020/results-and-analysis/ (accessed on 15 October 2021).
- United Nations Development Programme. Human Development Report 2020. The Next Frontier. Human Development and the Anthropocene; United Nations Development Programme: New York, NY, USA, 2020; ISBN 978-92-1-126442-5. [Google Scholar]
- Thees, H.; Zacher, D.; Eckert, C. Work, life and leisure in an urban ecosystem—Co-creating Munich as an Entrepreneurial Destination. J. Hosp. Tour. Manag. 2020, 44, 171–183. [Google Scholar] [CrossRef]
- ICCA International Congress and Convention Association. Country and City Rankings. Available online: http://www.iccaworld.com/ (accessed on 15 October 2021).
- Transparency International the Global Coalition against Corruption, Corruption Perceptions Index. 2020. Available online: https://www.transparency.org/en/cpi/2019/index/nzl (accessed on 15 October 2021).
- World Health Organization. Global Status Report on Road Safety; World Health Organization: Geneva, Switzerland, 2015. [Google Scholar]
- Amelung, B.; Nicolls, S.; Viner, D. Implications of Global Climate Change for Tourism Flows and Seasonality. J. Travel Res. 2007, 45, 285–296. [Google Scholar] [CrossRef]
- Soler, I.P.; Gémar, G.; Correia, M.B. The climate index-length of stay nexus. J. Sustain. Tour. 2020, 28, 1272–1289. [Google Scholar] [CrossRef]
- Tarachucky, L.; Sabatini-Marques, J.; Yigitcanlar, T.; Baldessar, M.J.; Pancholi, S. Mapping hybrid cities through location-based technologies: A systematic review of the literature. Cities 2021, 116, 103296. [Google Scholar] [CrossRef]
- Dutta, S.; Reynoso, R.E.; Lanvin, B.; Wunsh-Vicent, S.; León, L.R.; Garansvili, A.; Bayona, P. Global Innovation Index 2020. Available online: https://www.globalinnovationindex.org/gii-2016-report# (accessed on 15 October 2021).
- Bollen, K.A. Structural Equations with Latent Variables; John Wiley and Sons: New York, NY, USA, 1989. [Google Scholar]
- Hair, J.F.; Anderson, R.E.; Tatham, R.L.; Black, W.C. Análisis Multivariante, 5th ed.; Prentice Hall: Hoboken, NJ, USA, 1999. [Google Scholar]
- Cronbach, L.J. Coefficient alpha and the internal structure of tests. Psychometrika 1951, 163, 297–334. [Google Scholar] [CrossRef] [Green Version]
- Pérez, C. Técnicas Estadísticas con SPSS, 1st ed.; Prentice Hall: Madrid, Spain, 2001. [Google Scholar]
- Soler, I.P.; Gemar, G. A measure of tourist experience quality: The case of inland tourism in Malaga. Total Qual. Manag. Bus. Excell. 2019, 30, 1466–1479. [Google Scholar] [CrossRef]
- Gemar, G.; Soler, I.P.; Melendez, L. Analysis of the intent to purchase travel on the web. Tour. Manag. Stud. 2019, 15, 23–33. [Google Scholar] [CrossRef]
- Brans, J.P. L’ingénierie de la Décision: L’élaboration D’instruments D’aide a la Décision; Presses de l’Université Laval: Laval, QC, Canada, 1982. [Google Scholar]
- Gervásio, H.; Simões da Silva, L. A probabilistic decision-making approach for the sustainable assessment of infrastructures. Expert Syst. Appl. 2012, 39, 7121–7131. [Google Scholar] [CrossRef]
- Brans, J.P.; Mareschal, B. The PROMCALC & GAIA decision. Decis. Support Syst. 1994, 12, 297–310. [Google Scholar]


| Country | City | Country | City | Country | City | |||
|---|---|---|---|---|---|---|---|---|
| 1 | Germany | Berlin | 23 | Estonia | Tallinn | 45 | The Netherlands | The Hague |
| 2 | Germany | Cologne | 24 | Finland | Helsinki | 46 | Poland | Katowice |
| 3 | Germany | Hamburg | 25 | France | Paris | 47 | Poland | Krakow |
| 4 | Germany | Munich | 26 | France | Lyon | 48 | Poland | Warsaw |
| 5 | Austria | Vienna | 27 | France | Marseille | 49 | Portugal | Oporto |
| 6 | Belgium | Brussels | 28 | France | Lille | 50 | Portugal | Lisbon |
| 7 | Belgium | Antwerp | 29 | France | Toulouse | 51 | United Kingdom | Edinburgh |
| 8 | Bulgaria | Sofia | 30 | Greece | Athens | 52 | United Kingdom | Glasgow |
| 9 | Bulgaria | Plovdiv | 31 | Greece | Thessaloniki | 53 | United Kingdom | Cardiff |
| 10 | Cyprus | Nicosia | 32 | Hungary | Budapest | 54 | United Kingdom | London |
| 11 | Denmark | Copenhagen | 33 | Ireland | Dublin | 55 | United Kingdom | Birmingham |
| 12 | Denmark | Aarhus | 34 | Iceland | Reykjavik | 56 | United Kingdom | Manchester |
| 13 | Slovakia | Bratislava | 35 | Italy | Milan | 57 | United Kingdom | Leeds |
| 14 | Slovenia | Ljubljana | 36 | Italy | Rome | 58 | United Kingdom | Liverpool |
| 15 | Spain | Madrid | 37 | Italy | Turin | 59 | United Kingdom | Belfast |
| 16 | Spain | Barcelona | 38 | Italy | Naples | 60 | Croatia | Zagreb |
| 17 | Spain | Valencia | 39 | Italy | Palermo | 61 | Czechia | Brno |
| 18 | Spain | Sevilla | 40 | Latvia | Riga | 62 | Czechia | Prague |
| 19 | Spain | Bilbao | 41 | Lithuania | Vilnius | 63 | Romania | Bucharest |
| 20 | Spain | Zaragoza | 42 | Malta | Valleta | 64 | Sweden | Stockholm |
| 21 | Spain | Malaga | 43 | The Netherlands | Rotterdam | 65 | Sweden | Gothenburg |
| 22 | Spain | Murcia | 44 | The Netherlands | Amsterdam | 66 | Luxembourg | Luxembourg |
| Dimensions | Priority | Rank |
|---|---|---|
| Security | 21.61% | 1 |
| Technology | 15.18% | 2 |
| Education | 13.21% | 3 |
| Equality | 11.14% | 4 |
| Health | 10.61% | 5 |
| Employment | 8.63% | 6 |
| Climate | 5.82% | 7 |
| Housing | 4.45% | 8 |
| Mobility | 3.18% | 9 |
| Leisure | 3.14% | 10 |
| Environment | 3.03% | 11 |
| Total | 100.00% |
| Rank | Alternative | Phi | Phi+ | Phi− | Rank | Alternative | Phi | Phi+ | Phi− | Rank | Alternative | Phi | Phi+ | Phi− |
|---|---|---|---|---|---|---|---|---|---|---|---|---|---|---|
| 1 | London | 0.3478 | 0.3899 | 0.0421 | 23 | Liverpool | 0.0444 | 0.1592 | 0.1148 | 45 | Valleta | −0.0514 | 0.1426 | 0.194 |
| 2 | Paris | 0.318 | 0.3564 | 0.0384 | 24 | Valencia | 0.0381 | 0.1801 | 0.1419 | 46 | The Hague | −0.0568 | 0.1611 | 0.2179 |
| 3 | Barcelona | 0.1866 | 0.2445 | 0.0578 | 25 | Amsterdam | 0.038 | 0.2063 | 0.1683 | 47 | Prague | −0.0652 | 0.1367 | 0.202 |
| 4 | Stockholm | 0.1678 | 0.268 | 0.1003 | 26 | Turin | 0.0348 | 0.2126 | 0.1777 | 48 | Vienna | −0.0682 | 0.1284 | 0.1966 |
| 5 | Marseille | 0.1671 | 0.2378 | 0.0707 | 27 | Sevilla | 0.0339 | 0.1709 | 0.1371 | 49 | Copenhagen | −0.0753 | 0.1632 | 0.2385 |
| 6 | Bilbao | 0.1476 | 0.227 | 0.0794 | 28 | Malaga | 0.0295 | 0.1738 | 0.1443 | 50 | Munich | −0.0822 | 0.1498 | 0.232 |
| 7 | Madrid | 0.1447 | 0.2265 | 0.0818 | 29 | Helsinki | 0.0275 | 0.232 | 0.2046 | 51 | Oporto | −0.0876 | 0.1137 | 0.2013 |
| 8 | Gothenburg | 0.1387 | 0.2505 | 0.1117 | 30 | Hamburg | 0.0221 | 0.1487 | 0.1266 | 52 | Budapest | −0.0996 | 0.1752 | 0.2748 |
| 9 | Rome | 0.1383 | 0.269 | 0.1307 | 31 | Leeds | 0.0192 | 0.1518 | 0.1326 | 53 | Ljubljana | −0.1035 | 0.0874 | 0.1909 |
| 10 | Birmingham | 0.1119 | 0.2086 | 0.0967 | 32 | Cologne | 0.0137 | 0.1447 | 0.131 | 54 | Sofia | −0.1081 | 0.2024 | 0.3104 |
| 11 | Manchester | 0.1009 | 0.1947 | 0.0938 | 33 | Reykjavik | 0.0069 | 0.2085 | 0.2016 | 55 | Aarhus | −0.1206 | 0.152 | 0.2726 |
| 12 | Athens | 0.0938 | 0.2918 | 0.198 | 34 | Belfast | 0.0043 | 0.1492 | 0.1449 | 56 | Katowice | −0.1285 | 0.1226 | 0.2511 |
| 13 | Milan | 0.0911 | 0.2243 | 0.1332 | 35 | Zaragoza | 0.002 | 0.1605 | 0.1585 | 57 | Warsaw | −0.1438 | 0.1135 | 0.2573 |
| 14 | Dublin | 0.0869 | 0.1865 | 0.0997 | 36 | Thessaloniki | 0.0017 | 0.2339 | 0.2322 | 58 | Brno | −0.1739 | 0.0714 | 0.2453 |
| 15 | Naples | 0.0738 | 0.2553 | 0.1814 | 37 | Lisbon | −0.0026 | 0.1469 | 0.1495 | 59 | Krakow | −0.1752 | 0.0862 | 0.2614 |
| 16 | Lyon | 0.073 | 0.1658 | 0.0928 | 38 | Edinburgh | −0.0033 | 0.1564 | 0.1596 | 60 | Bucharest | −0.1786 | 0.135 | 0.3136 |
| 17 | Brussels | 0.066 | 0.1694 | 0.1034 | 39 | Cardiff | −0.0044 | 0.1471 | 0.1515 | 61 | Bratislava | −0.1828 | 0.0981 | 0.2809 |
| 18 | Berlin | 0.0647 | 0.1845 | 0.1198 | 40 | Rotterdam | −0.0046 | 0.1725 | 0.177 | 62 | Plovdiv | −0.1857 | 0.1682 | 0.3538 |
| 19 | Toulouse | 0.0575 | 0.1634 | 0.1059 | 41 | Luxembourg | −0.0073 | 0.1738 | 0.181 | 63 | Tallinn | −0.1934 | 0.0886 | 0.282 |
| 20 | Lille | 0.0558 | 0.1673 | 0.1115 | 42 | Palermo | −0.0092 | 0.2046 | 0.2138 | 64 | Riga | −0.1992 | 0.0929 | 0.2921 |
| 21 | Murcia | 0.0557 | 0.1841 | 0.1284 | 43 | Antwerp | −0.0327 | 0.1214 | 0.1542 | 65 | Zagreb | −0.2234 | 0.0816 | 0.3049 |
| 22 | Glasgow | 0.0482 | 0.1628 | 0.1146 | 44 | Nicosia | −0.0499 | 0.1489 | 0.1988 | 66 | Vilnius | −0.2349 | 0.0681 | 0.3031 |
Publisher’s Note: MDPI stays neutral with regard to jurisdictional claims in published maps and institutional affiliations. |
© 2021 by the authors. Licensee MDPI, Basel, Switzerland. This article is an open access article distributed under the terms and conditions of the Creative Commons Attribution (CC BY) license (https://creativecommons.org/licenses/by/4.0/).
Share and Cite
Perez-Benitez, V.; Gemar, G.; Hernández, M. Multi-Criteria Analysis for Business Location Decisions. Mathematics 2021, 9, 2615. https://doi.org/10.3390/math9202615
Perez-Benitez V, Gemar G, Hernández M. Multi-Criteria Analysis for Business Location Decisions. Mathematics. 2021; 9(20):2615. https://doi.org/10.3390/math9202615
Chicago/Turabian StylePerez-Benitez, Virginia, German Gemar, and Mónica Hernández. 2021. "Multi-Criteria Analysis for Business Location Decisions" Mathematics 9, no. 20: 2615. https://doi.org/10.3390/math9202615
APA StylePerez-Benitez, V., Gemar, G., & Hernández, M. (2021). Multi-Criteria Analysis for Business Location Decisions. Mathematics, 9(20), 2615. https://doi.org/10.3390/math9202615