Article

Ensemble of 2D Residual Neural Networks Integrated with Atrous Spatial Pyramid Pooling Module for Myocardium Segmentation of Left Ventricle Cardiac MRI

1
Department of Information Technology, Faculty of Computing and Information Technology, King Abdulaziz University, Jeddah 21589, Saudi Arabia
2
ImViA Lab, Department of Information System, University of Burgundy, 21000 Dijon, France
3
Department of Computer Engineering, National Institute of Technology Kurukshetra, Kurukshetra 136119, Haryana, India
4
Department of Computer Science and Information Engineering, Asia University, Taichung 413, Taiwan
5
Staffordshire University, Stoke-on-Trent ST4 2DE, UK
*
Author to whom correspondence should be addressed.
Mathematics 2022, 10(4), 627; https://doi.org/10.3390/math10040627
Submission received: 29 October 2021 / Revised: 28 January 2022 / Accepted: 28 January 2022 / Published: 17 February 2022

Abstract

:
Cardiac disease diagnosis and identification is problematic mostly by inaccurate segmentation of the cardiac left ventricle (LV). Besides, LV segmentation is challenging since it involves complex and variable cardiac structures in terms of components and the intricacy of time-based crescendos. In addition, full segmentation and quantification of the LV myocardium border is even more challenging because of different shapes and sizes of the myocardium border zone. The foremost purpose of this research is to design a precise automatic segmentation technique employing deep learning models for the myocardium border using cardiac magnetic resonance imaging (MRI). The ASPP module (Atrous Spatial Pyramid Pooling) was integrated with a proposed 2D-residual neural network for segmentation of the myocardium border using a cardiac MRI dataset. Further, the ensemble technique based on a majority voting ensemble method was used to blend the results of recent deep learning models on different set of hyperparameters. The proposed model produced an 85.43% dice score on validation samples and 98.23% on training samples and provided excellent performance compared to recent deep learning models. The myocardium border was successfully segmented across diverse subject slices with different shapes, sizes and contrast using the proposed deep learning ensemble models. The proposed model can be employed for automatic detection and segmentation of the myocardium border for precise quantification of reflow, myocardial infarction, myocarditis, and h cardiomyopathy (HCM) for clinical applications.

1. Introduction

Cardiac diseases have profound effects on health and mortality. Prediction of the cardiac index from cardiac MR (magnetic resonance) images is essential to diagnose and identify cardiac disease. In particular, an accurate quantification and identification of cardiac disease from left ventricle (LV) cardiac imaging is an imperative and demanding task [1]. During clinical practice, LV segmentation algorithms [2] generate myocardium borders either automatically or by measuring myocardium contouring borders manually. This process needs reliable and accurate quantification of the myocardium. Besides, manual contouring of the myocardium border is a time constraint, subjective to high observer inconsistency, and typically insufficient for ED (end-diastolic) and ES (end-systolic) frames. These factors make the process inadequate for dynamic functional analysis. Due to shape variability and the lack of edge information, LV segmentation requires research that involves advanced techniques.
Various segmentation methods for cardia MR images [2,3] require strong user interactions and a priori information to achieve better and reliable results for effective clinical applications. Recently, direct methods without segmentation, based on machine learning (ML) techniques, have gained popularity and have exhibited reliable performance. However, a few limitations have been reported: (1) features obtained manually could not capture sufficient information from task-relevant cardiac structures; (2) some manual feature selection techniques and ML algorithms may not be optimally integrated; (3) only measuring the volume of cardiac features is insufficient for regional, inclusive universal and vibrant function valuation.
Recently, convolutional neural networks (CNN) have been used widely for cardiac image analysis. For example, CNNs have achieved success in medical oriented imaging analysis [4]. In addition, CNNs in combination with other deep learning models have been positively employed for cardiac image analysis, with deep learning models incorporated with deformable models to develop and evaluate a fully automatic LV segmentation tool from short-axis cardiac MRI datasets [5]. Further, CNNs have been used to automatically detect the LV chamber in MRI datasets and stacked autoencoders to determine the LV shape. The inferred shape is combined into deformable models to enhance the accuracy of the segmentation. In [6], the authors proposed a unique method based on deep learning and a level set for the automated segmentation of the left ventricle of the heart from cardiac cine magnetic resonance (MR) data. This combined method used small training sets and delivered accurate segmentation results. In another study [7], Tran presented a method to solve the problem of automated left and right ventricle segmentation using deep fully convolutional neural network architecture. He trained his proposed model end-to-end in a single learning stage from whole-image inputs and ground truths to analyze every pixel. Long et al. [8] applied AlexNet, VGG net, and GoogLeNet into CNNs and transferred their learned representations using fine-tuning to the segmentation task. They presented a model that integrates semantic information from a deep, coarse layer with image information from a shallow, fine layer to generate precise and elaborate segmentations. Wolterink et al. [9] proposed a fully automatic method for segmentation and disease classification using cardiac cine MR images. They used CNN segmentations of the left ventricle (LV), right ventricle (RV), myocardium in end-diastole (ED) and end-systole (ES) images. The extracted features from segmentations were used in Random Forest algorithms to classify different heart diseases. In [10], the authors presented a method based on multi-planar deep CNN with an adaptive fusion scheme in which they automatically used complementary information from different planes of the 3-D scans for improved delineations. They used CT and MRI images to train and test their model for cardiac substructures. In [11], the authors proposed a fully automatic MRI cardiac segmentation method based on CNN. This model used features of both levels, such as high-level features and low-level features. These features were learned with a grid-like CNN architecture. Further, they tested their model on the ACDC MICCAI’17 challenge dataset. This method can segment all three regions of a 3-D MRI cardiac image. Various 2-D and 3-D Unet-based deep learning models have been proposed in automatic cardiac diagnosis challenge (ACDC) for cardiac segmentation, including dilated CNN, encoder-decoder architecture. Moreover, Tan et al. [12] introduced a multiscale deep learning model for LV oriented segmentation in the polar typed spaced domain. Brahim et al. [13] presented 3-D CNN for segmenting volumetric oriented images. These models acquired sufficient success to handle LV segmentation based on MR cardiac images.
In this research, a deep learning model with a residual block and integrated ASPP module is proposed to extract multiscale features from the decoder side and to use these features in the encoder side of the proposed model for myocardium border segmentation based on MRI cardiac images. The main objectives and salient features of this paper are listed below:
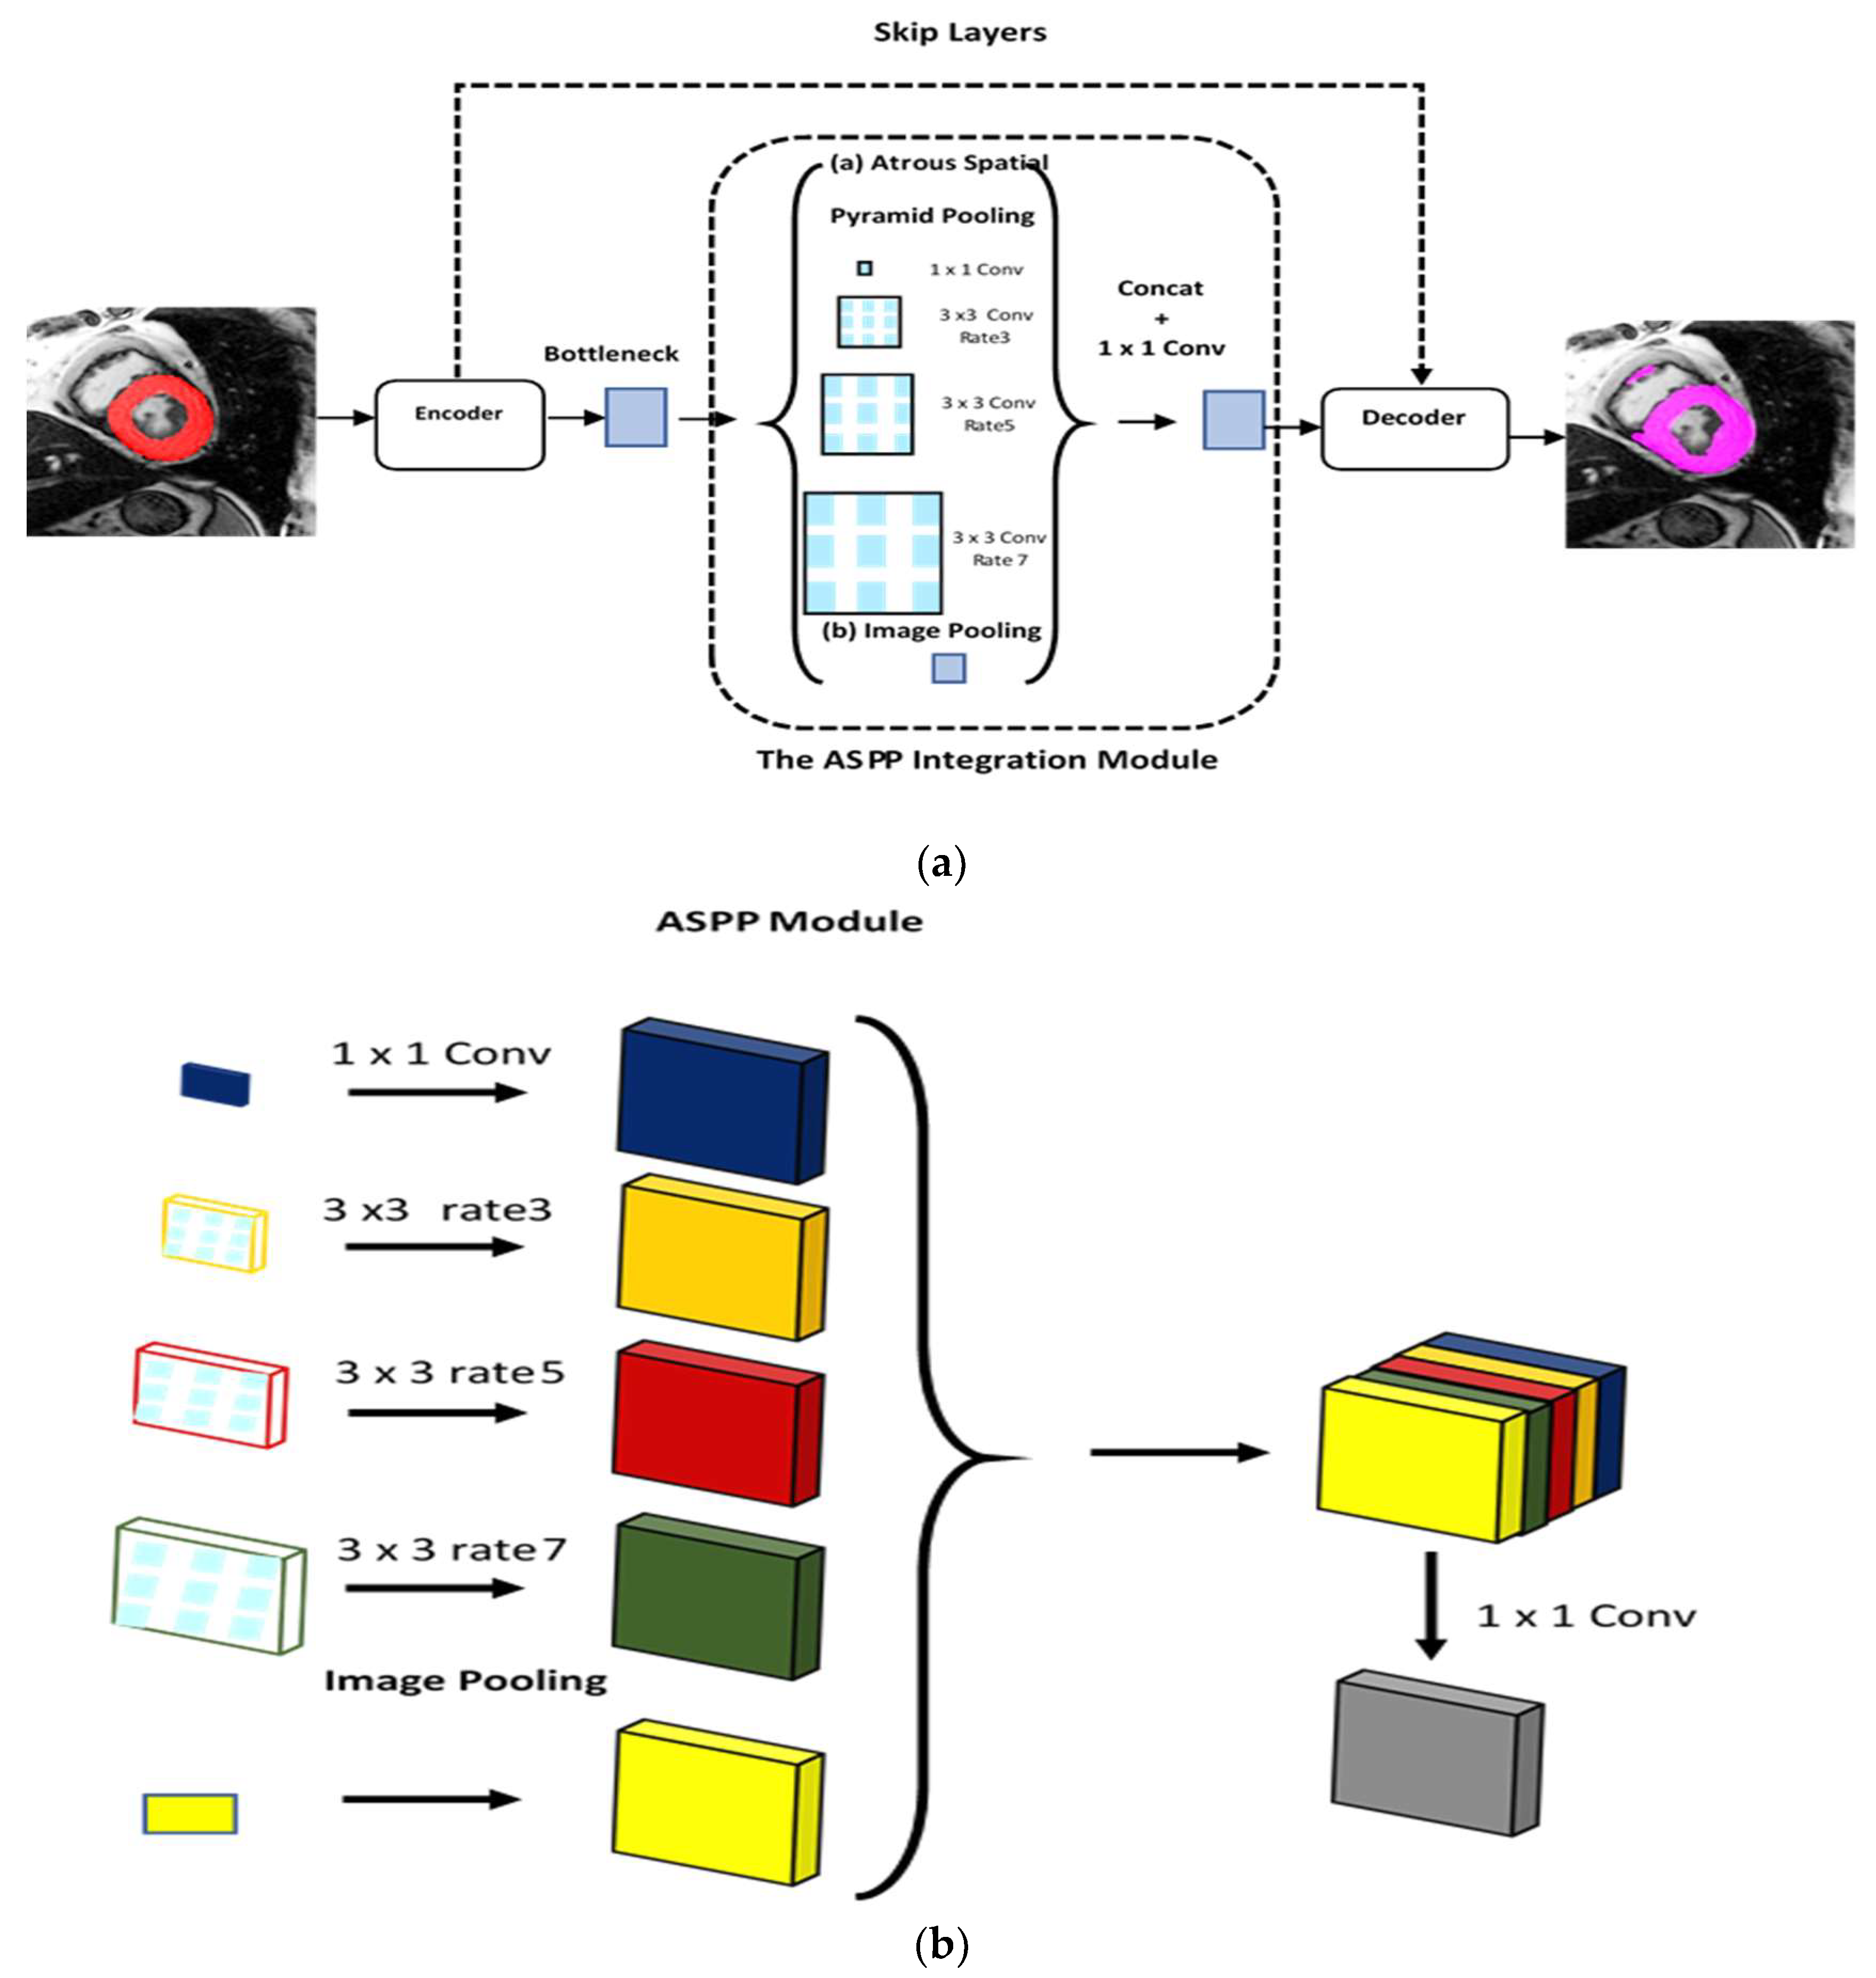
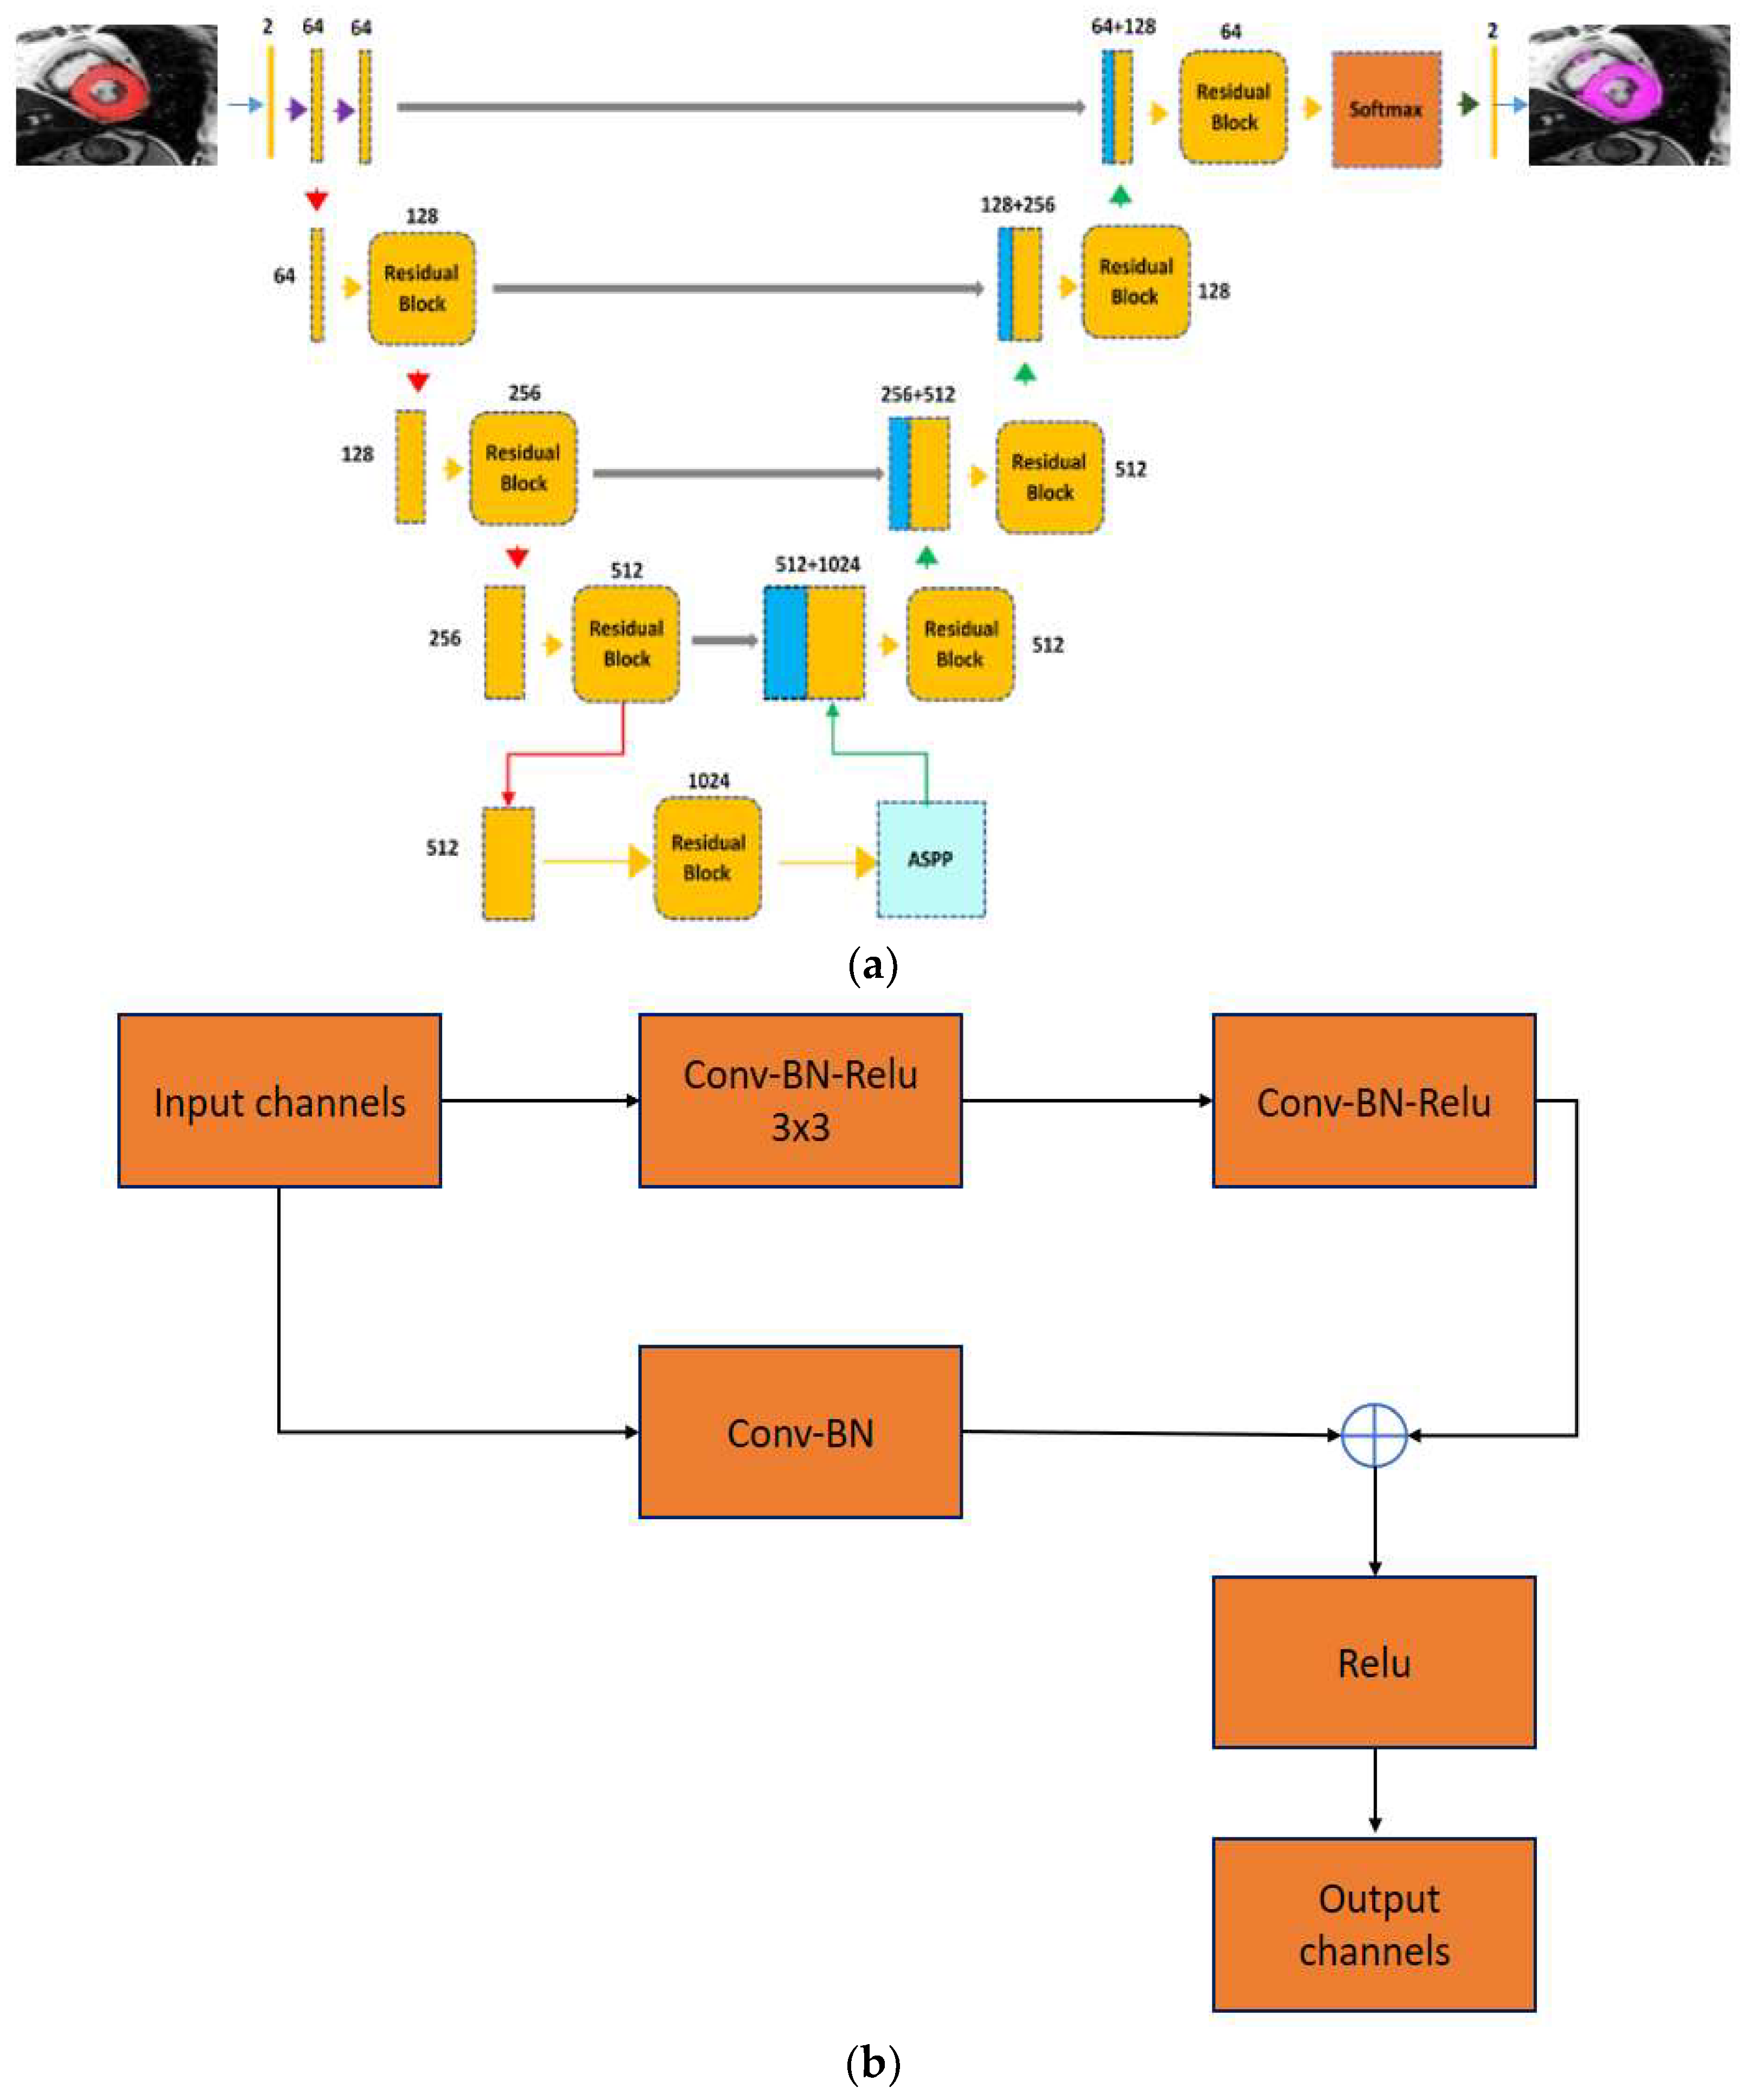
  • The research work proposes integration of the 2-D residual neural network with the ASPP module. The designed network has different numbers of layers at the encoder and the decoder components. In addition, the ASPP module is added at the lowermost of the encoder and the decoder. The integrated framework captures multiscale information, and the ASPP module can be detect small objects with different shapes, sizes and orientations from MR heart images.
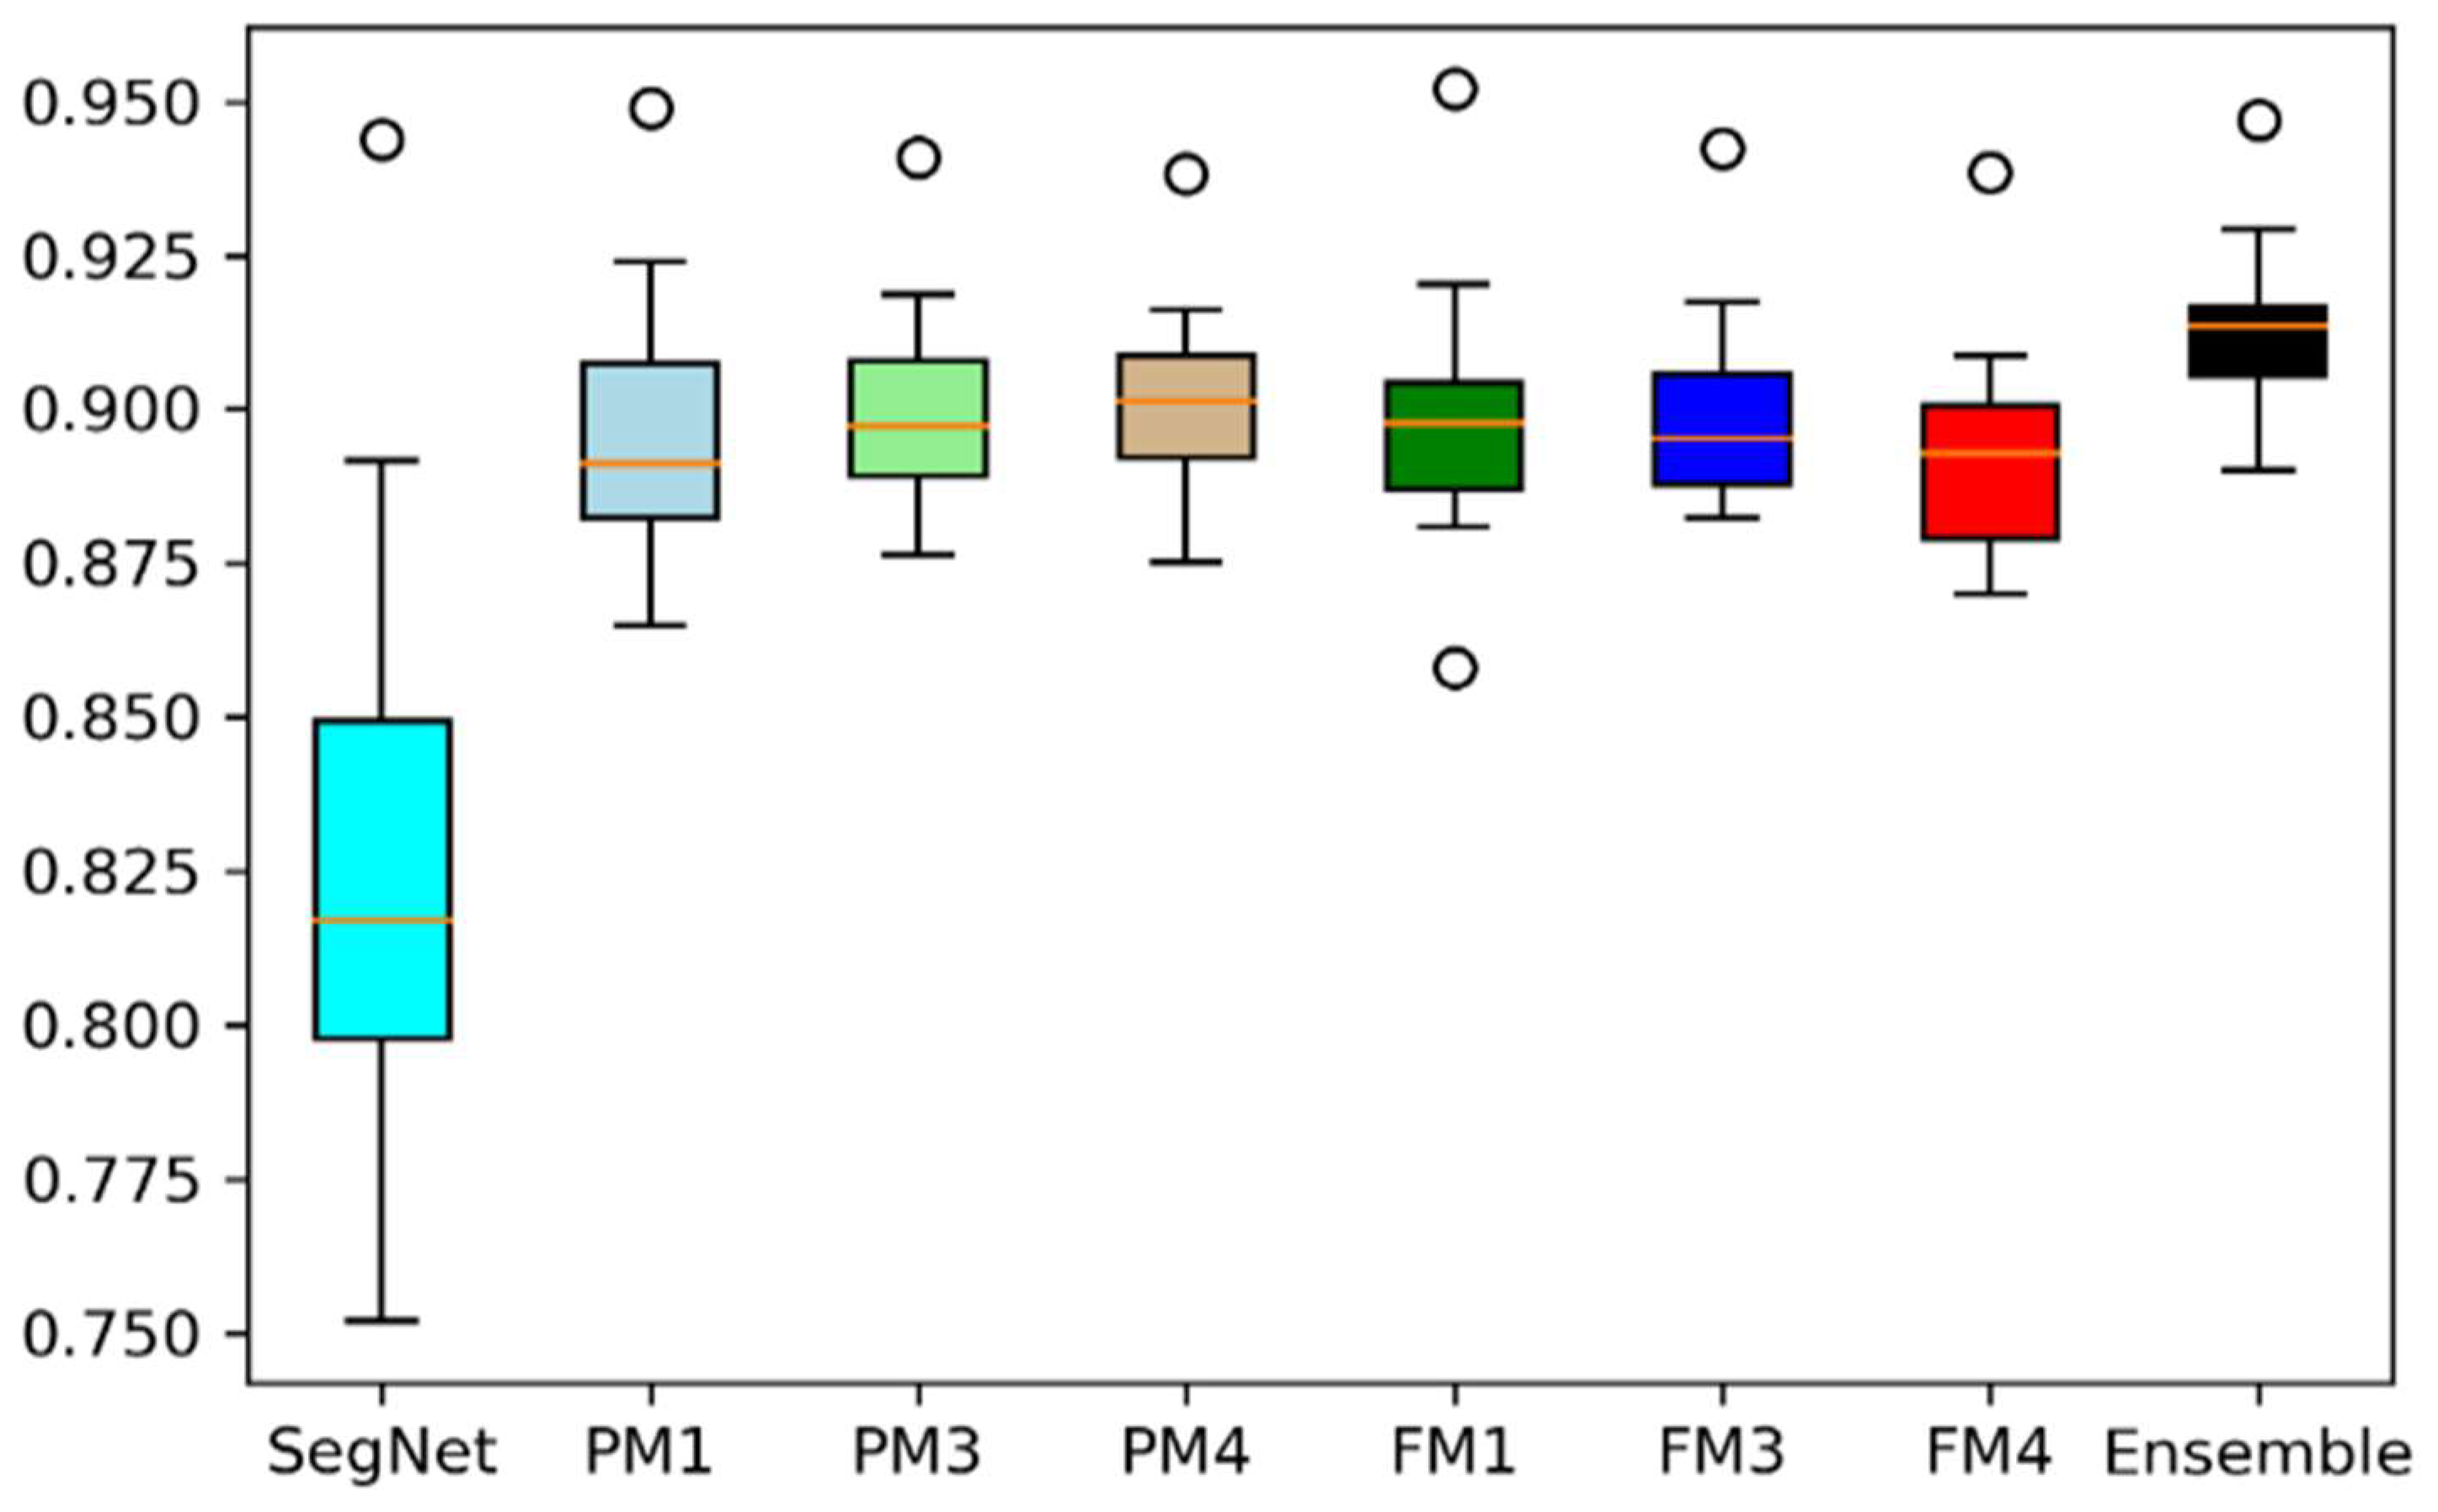
  • The proposed model is designed to be robust because its training involves various hyperparameters. In addition, different models are brought together using a majority voting scheme to further enhance segmentation accuracy.
  • A contrast enhancement method is proposed for preprocessing the input cardiac MRI dataset. Various performance metrics are used to relate the performance of recent models and the proposed model in deep learning contexts.
The rest of the paper is organized as follows. Section 2 describes related work. Section 3 describes materials and methods for the dataset, preprocessing, proposed model, and evaluation criteria. The experimental results are discussed in Section 4. Section 5 concludes the work and provides direction for future work.

2. Related Work

LV quantification methods for cardiac MR images are grouped into three classifications: (1) physical quantification; (2) segmentation oriented quantification, and (3) straight regression-oriented quantification. Conventionally, experimental practice involves physically contouring the boundaries of myocardium and is considered reliable [14]. However, the manual contouring approach consumes more time than automatic methods and the results vary because of observer bias. In addition, the method typically limits the ED (end-diastolic) and ES (end-systolic) frames, which makes it inadequate for vibrant functional investigation during the complete cardia cycle. Segmentation-based quantification has been used to segment the cardiac myocardium towards multifaceted environments, and with visibly delineated corners of the epicardium and endocardium. Moreover, various methods [2,15], such as image driven methods, and training-based and deformable models, have been designed for cardiac LV classification. To obtain precise performance, these methods need user interaction and a priori information. Some methods are based on anatomical assumptions, such as circular geometry of the LV [16], intensity histogram distribution [17], or statistical shape modeling [18]. User interactions involves pointing out the center of the LV cavity and manually identifying the ventricle corner of the first frame [19]. This can create inaccuracies and may prevent LV separation methods being used for effective scientific applications. In [20], depth-wise dense network is proposed to detect infected area in lungs X-rays that improved feature representations by performing multilevel feature embedding.
Direct regression approaches have used recent ML approaches to estimate cardiac volumes. These methods can further be categorized into two groups: two phase classes only [21,22,23], and end-to-end deep learning models [24,25,26]. The two-phase method uses unsupervised ML such as the Bhattacharyya coefficient in image disseminations [27], appearance features [28], multiple low level image features [22], features from a multiscale convolution deep belief network (MCDBN) [23], and manually obtained features. Furthermore, these features are employed in regression models for cardiac volume estimation. In another study [29], a hybrid model based on 3D residual network (RN) with a squeeze-and-excitation (SE) block is proposed for volumetric segmentation of kidney, liver, and their associated tumors that improved performance in volumetric biomedical segmentation. End-to-end deep learning models have been effectively utilized in medical image investigation [30] and have the capability of extracting effective features in a complete fashion [31]. Deep learning models such as the deep belief network (DBN), auto stacked encoder and CNN, incorporated with traditional models [5,6,32] are used in cardiac image segmentation. The fully convolutional network (FCN) and recurrent FCN have been proposed in cardiac segmentation [6,7,33]. The author of [24] proposed 3-D deep learning models to segment and estimate volume. The end-to-end deep learning models could not obtain temporal information between each slice of cardiac MR images and were incapable of handling multiscale information or features from input cardiac images. Therefore, these end-to-end (E2E) deep learning models must incorporate multiscale features from input images to produced reliable performance. The designed method is capable of segmenting myocardium borders and extracting multiscale features using an ASPP module for all segments in the complete cardiac cycle.
Zheng et al. [34] proposed a model to address the overfitting problem in deep CNN based on two-stage training methods such as: 1—pretraining and 2—implicit regularization training. In the first method, image representation is extracted through training a model for anomaly detection. In the second method, the model is retrained based on anomaly detection results to standardize the feature boundary and converge it in a suitable position.
In another study, Zheng et al. [35] proposed a full stage data augmentation framework to enhance the accuracy of deep convolutional neural networks. This model acts as an implicit ensemble model without additional training costs. Coexisting data augmentation during the training and testing process can provide network optimization and improve its generalization capability.
Liu et al. [36] proposed a method to extract hierarchical neighborhood preserving features based on a stacked neighborhood preserving autoencoder (S-NPAE). A loss function feature was applied to reconstruct and preserve the neighborhood structure of the input data at the same time. NPAE extracted the features from its input data by minimizing the loss function. The deep S-NPAE network was developed hierarchically by stacking multiple NPAEs. The extracted features were provided to S-NPAE for prediction in soft sensor modeling.
Rucco et al. [37] proposed a model for radiomics features based on topological features for a personalized diagnostic system of Glioblastoma multiforme (GBM) analysis from fluid attenuated inversion recovery (FLAIR). They developed a method based on topological and textural features, and automatic interpretable machine learning for automatic GBM classification on FLAIR.
In [38], a semantic segmentation network was introduced to develop an indoor navigation system for a mobile robot based on a convolutional neural network (CNN).
To detect and remove outliers in high dimensional data, a multistage technique was proposed in [39]. This technique reduced the high dimensional features into two dimensional features based on t-distributed stochastic neighbour embedding (t-SNE). Further, a convolutional neural network model (ConvNet) was used for the image classification problem.
In [40], Hu et al. developed a TopoResNet that integrates topological information into the residual neural network architecture. They applied TopoResNet to a skin lesion classification problem. They determined that TopoResNet improves the accuracy and the stability of the training process.
Ensemble learning unites several specific models to obtain adequate generalization performance. Nowadays, deep learning models are demonstrating better performance than traditional classification models. Deep ensemble learning models combine the advantages of deep learning and ensemble learning to improve the generalization performance of the model. In this regard, several researchers have used ensemble learning in their studies [41,42,43,44].

3. Material and Methods

3.1. Dataset

A dataset from 56 subjects with SAX MR sequences based on a clinical environment was used for model training and validation. Each subject consisted of 20 frames and the pixel layout of the MR images was assorted between 0.6836 mm/pixel and 2.0833 mm/pixel, in addition to a mode with 1.5625 mm/pixel. The study obtained the dataset from three medical resources associated with health care hubs, namely, London and St. Joseph Healthcare Centers based on scanners of two merchants (GE & Siemens) [45,46]. The dataset is publicly available [45] with subjects having ages from 16 years to 97 years and averaging 58.9 years. The ground truth for each frame for all subjects was provided for endocardium and epicardium borders. The individual subject data comprised 20 frames all over the cardiac cycle.

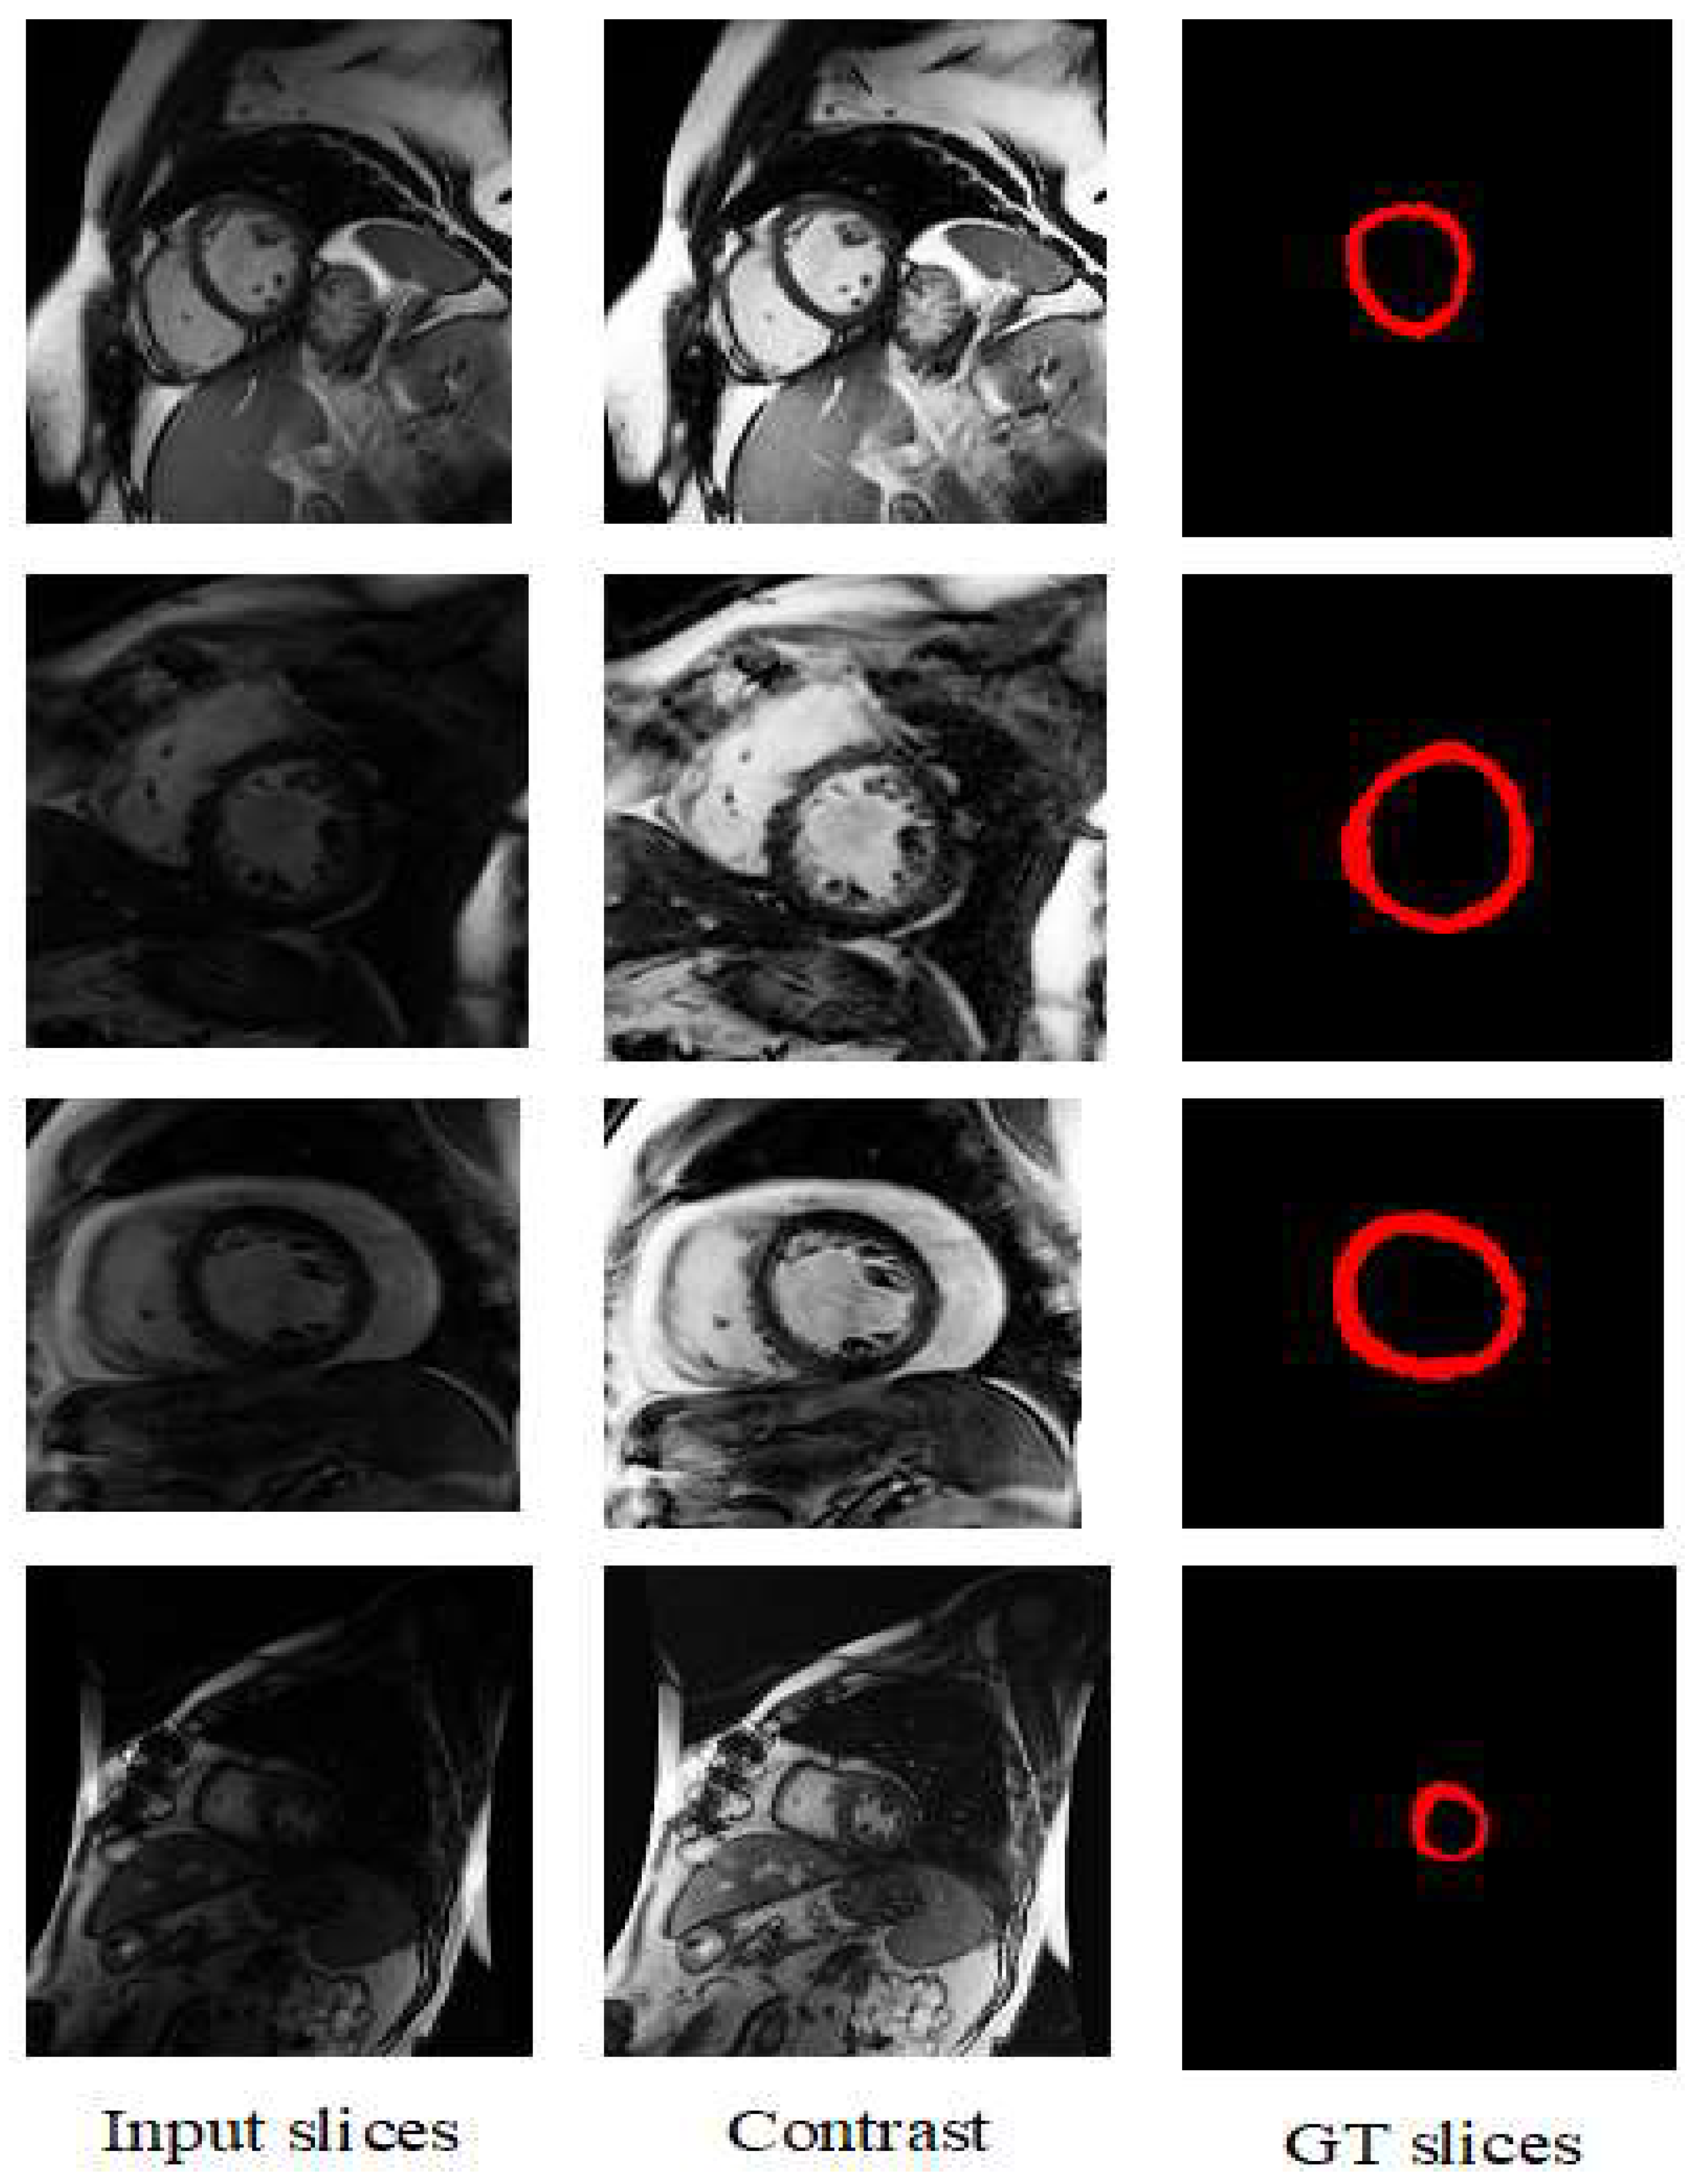
3.2. Preprocessing of the Dataset

A dynamic histogram equalization technique was used for contrast enhancement of input cardiac MRI images. The raw and contrast images are shown in Figure 1 for different numbers of patients. The input slices with enhanced slices and ground truth mask are shown in Figure 1.

3.3. Proposed Model

The proposed model is a residual network comprising an encode-decode network. The ASPP module is integrated at the bottom of the proposed model. Figure 2 depicts the block diagram of the proposed model for myocardium segmentation using MR cardiac images. The input feature maps from the encoder side are passed to the ASPP module, and output feature maps after the ASPP module are provided to the decoder part of the proposed model. Details of each module are explained in the following sections.

3.3.1. ASPP Module

The ASPP network is a combination of various parallel atrous convolutions with different rates, global average pooling and a 1 × 1 convolutional layer. The proposed network can capture contextual information at multiple scales using atrous convolution with different filter kernels. In addition, it can extract multiscale features from the input feature maps for myocardium border segmentation. Atrous convolution is a promising tool for capturing multiscale feature information by controlling different resolutions by adjusting different receptive fields [47]. Atrous convolution was applied on the input x for each pixel i on the output y and filter w as shown in Equation (1):
y [ i ] = k x [ i + r . k ] w [ k ]
Here, the atrous rate r controls the stride for sampling the input image. The subjected convolution inserts r − 1 zeros between two successive filter values and convolves the input x with those filters. The receptive field of filter can be modified by adjusting the filter rate r. We integrated an ASPP module was used in DeepLabv3 [48] in the proposed residual network to improve the segmentation results.
ASPP consisted of four atrous convolutions layers using different atrous rate r and one global average pooling layer. Three parallel atrous convolution layers were used with 3 × 3 size rates of 3, 5 and 7, and one 1 × 1 convolution layer. The resulting features from the four convolutions and one overall pooling average layer were up sampled bilinearly to the feed size and then concatenated and provided to another 1 × 1 type convolution. The ASPP was employed to the feature map produced by the bottom of the encoder segment and the outcome feature map from ASPP were provided to the decoder part of the network.

3.3.2. Proposed Hybrid Encoder-Decoder ASPP-RN Model

The pooling layers in convolutional neural network gathered contextual information and reduced the spatial information from input image. The main problem in semantic subdivision is that the feature maps have low resolution. AN encoder-decoder based networks such as U-net, V-net can be employed to solve the low-resolution problem based on the up-sampling layer, gathering the information from lower layers and reinstating the resolution of the estimate to that of the input image at the decoder side. The encoder-decoder based networks concatenate maps from the decoder side with a lower-level feature map to provide the spatial information in semantic segmentation using the up-sampling layer.
The proposed model is structured into a series of encoding and decoding operations constituting a residual network. The convolution task is performed by an encoder that carries a 2 × 2 residual block incorporating the maximum pooling operation that down-samples the data. The channels relating to feature maps are doubled once the encoder performs its residual activity in the network The ASPP network combines both the top and bottom of the encoder-decoder operations in the model. The ASPP network is provided with the features of input images that map the inputs to the up-sample component of the network. The residual part of the network typically consists of layers named the convolution layer, batch-normalization layer, and the ReLu layer containing an activation function. The process passes the inputs to the third later after convolving it by the convolutional layer. The products of the first two layers are combined and provided to the ReLu instigation function. The residual block is shown in Figure 3. A different set of channels is employed by the residual segment at various layer channels that perform encoding and decoding in the network.
The segments of the decoding part perform up-sampling employing a 2 × 2 deconvolution operation followed by a concatenation of features (inputs of encoding) fed into the residual block. The entire process divides the input data into halves with the consecutive operation of up-sampling and down-sampling. After a series of such operations, the process achieves a convolution 1 × 1 layer that is accompanied by a sigmoid activation method. The desired output in a binary format is thus predicted through the system.

3.3.3. Ensemble of Proposed Models

The ensemble technique based on majority voting was applied based on various machine and deep learning models for classification problem [49,50]. The majority voting technique was applied for creating an ensemble of the output of the proposed models based on predicted masks for myocardium segmentation. Figure 4 shows a block diagram of the ensemble method. Based on experimental results, seven best models with different hyperparameters space were chosen for this experiment. Majority voting based on maximum function scheme used for ensemble of the output of various models is shown in Figure 4. In majority voting, the predicted pixel value outputs of the best deep learning models are assigned votes and the most predicted values are assigned as the vote of the outputted model as an ensemble. The ensemble model output is expressed in Equation (2).
C ( x ) = m a x   C i ( x ) = y
where y is the output pixel values of the ensemble model and Ci(x) is the prediction of each individual model. As a result, seven base segmentation models are selected to generate the output of ensemble model. The prediction of these best models is voted to obtain the final myocardium segmentation.

3.3.4. Network Parameters or Configuration

The proposed model was implemented using PyTorch with Adam optimizer. Different hyperparameters were used for training of the model. The learning degree, weight falloff, and batch size with number of epochs were also used in training the model.

3.4. Evaluation Criteria
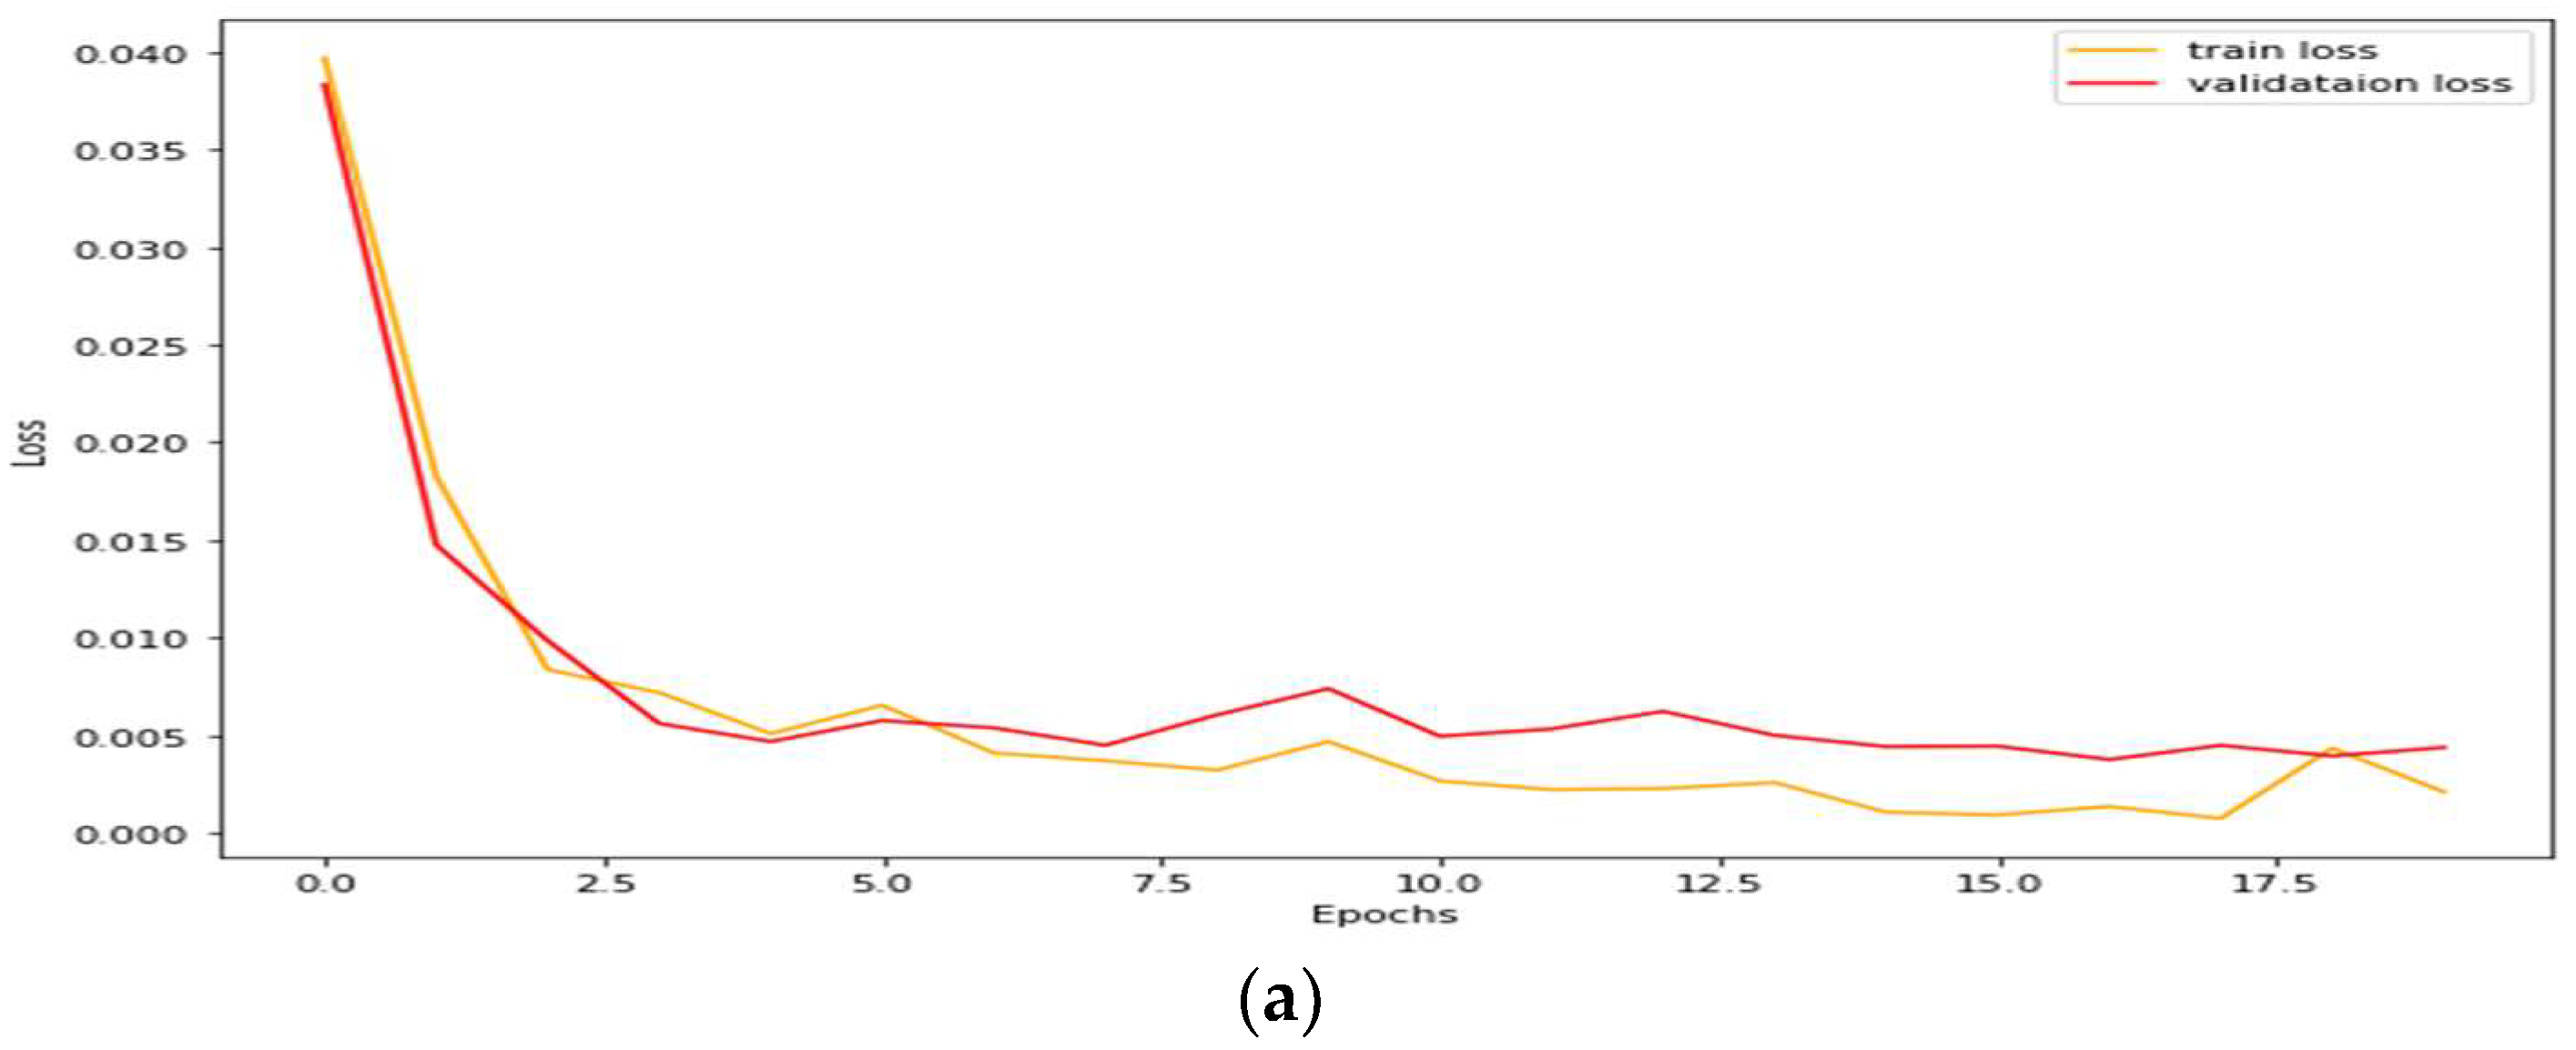
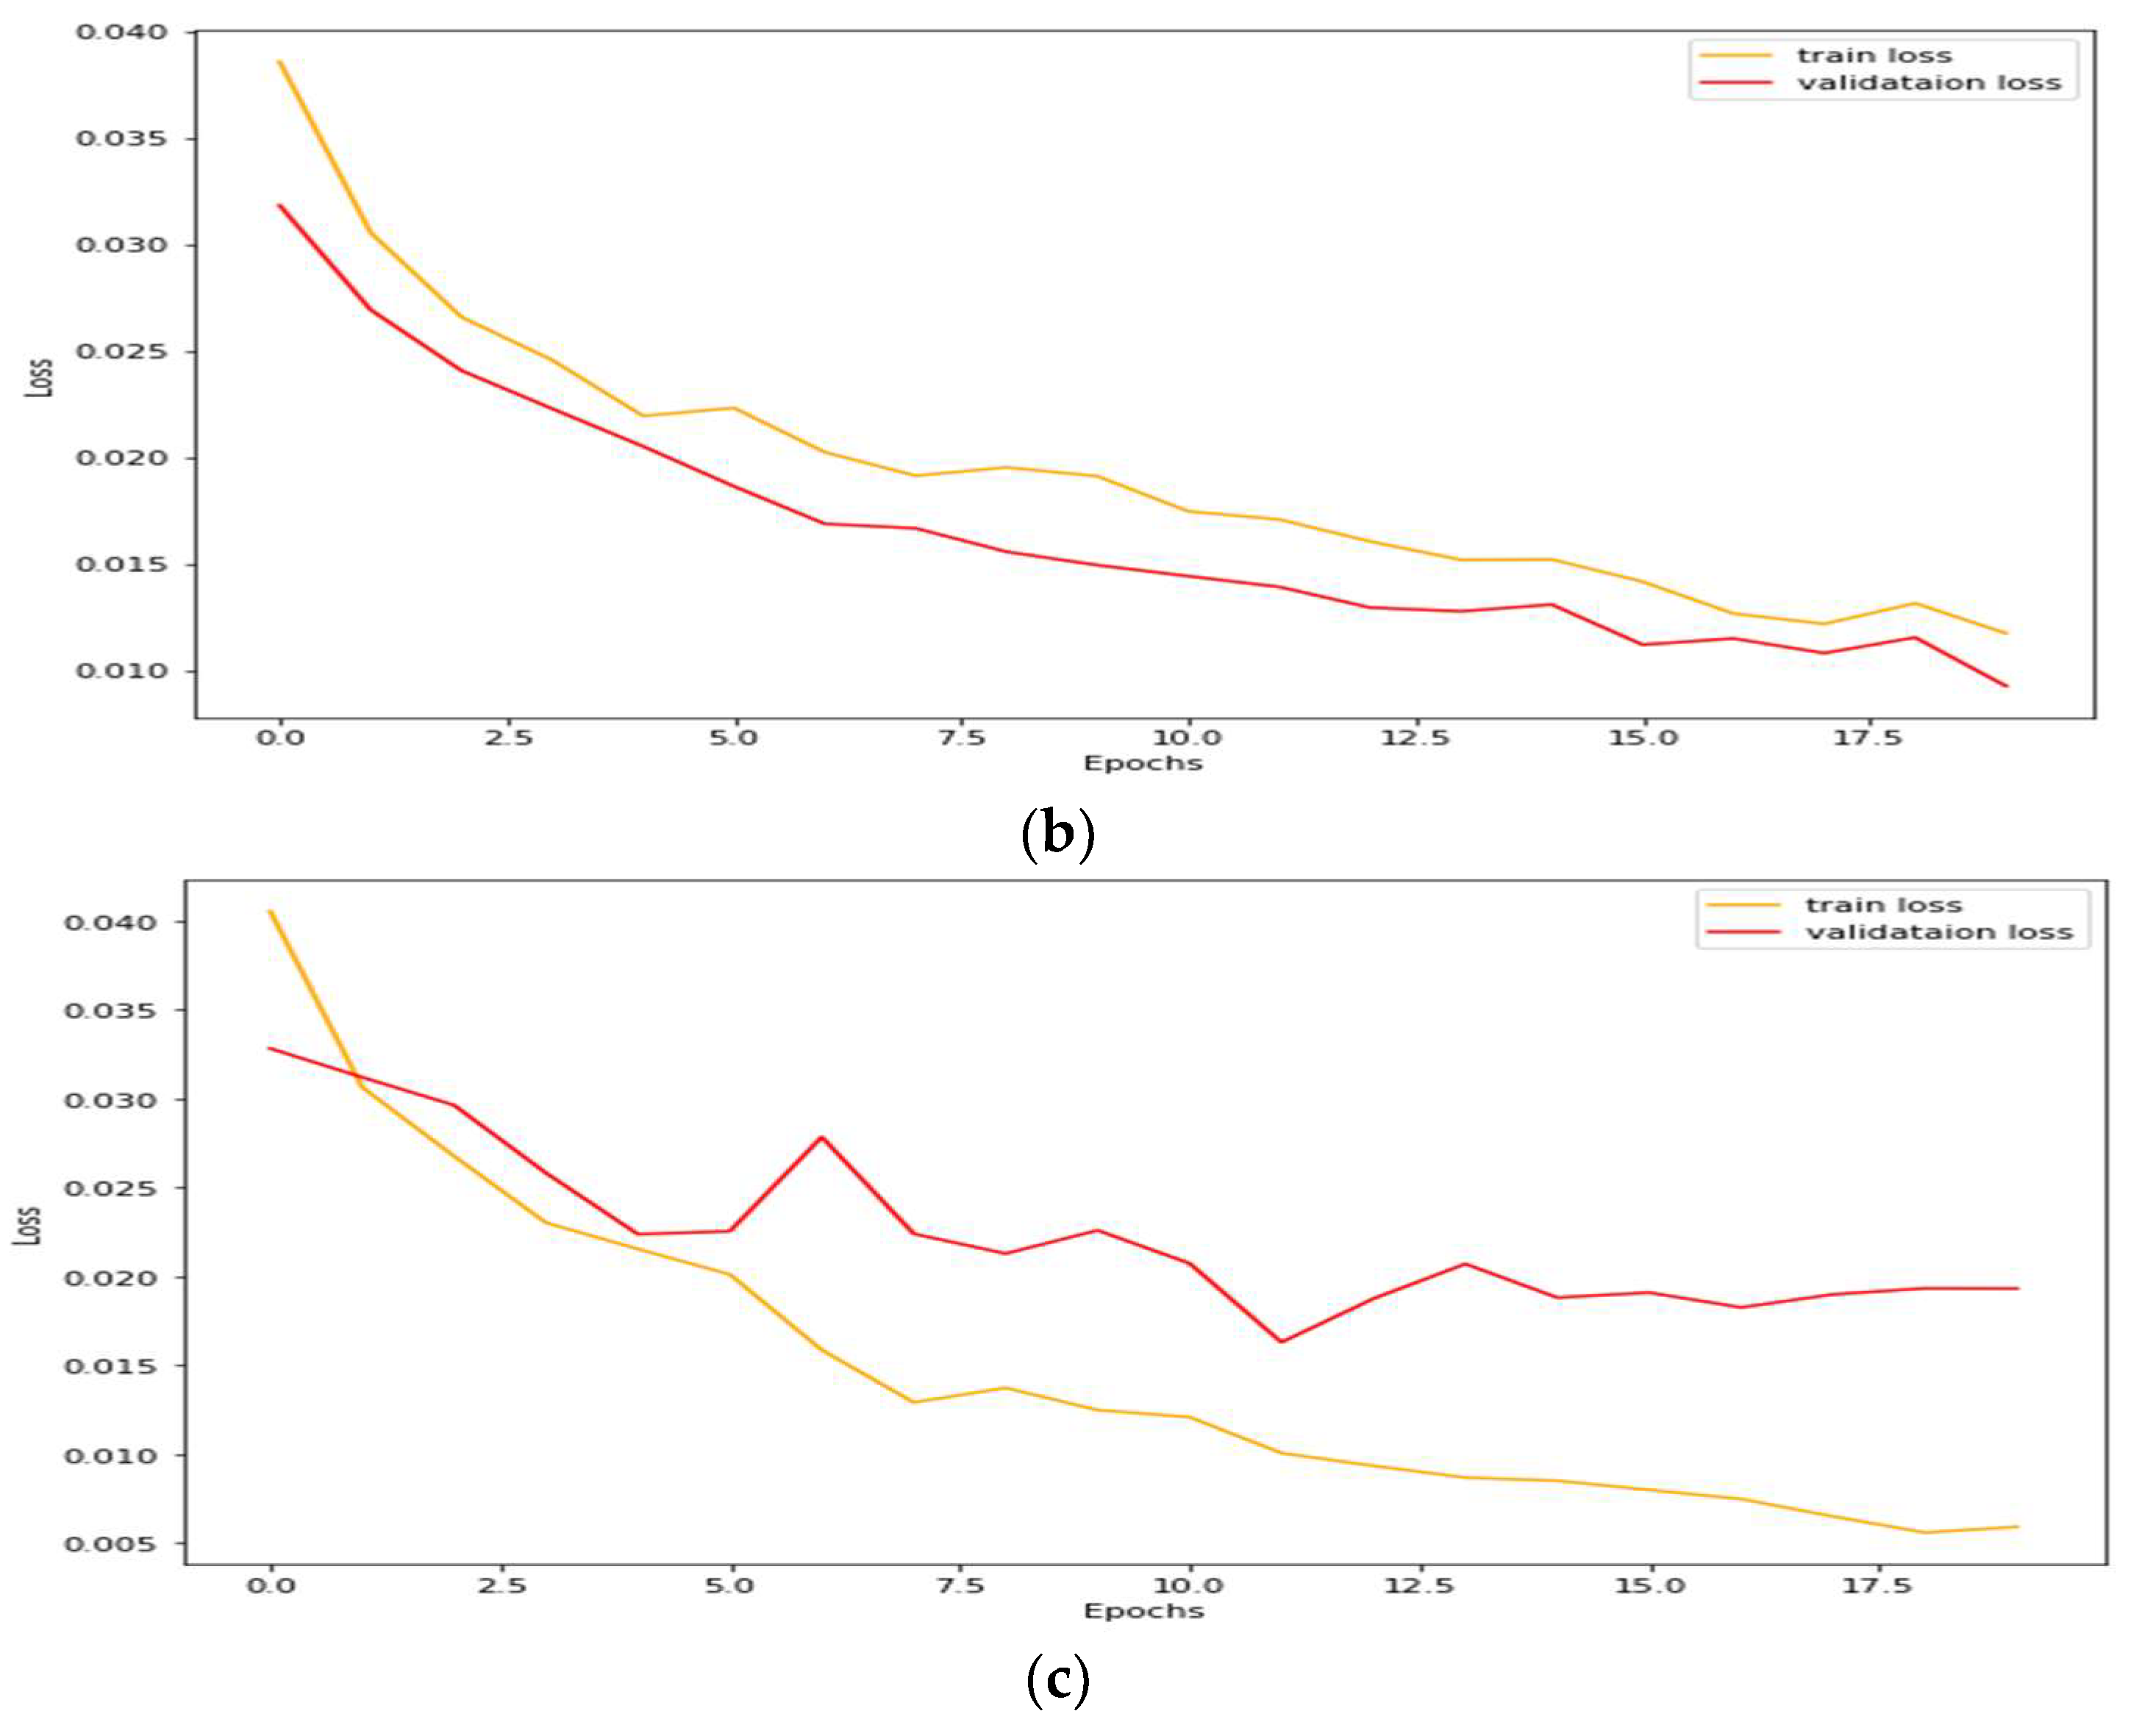
The performance of the proposed model was evaluated based on evaluation metrics such as sensitivity, specificity, Jaccard coefficients, Dice coefficient, Volume Overlap Error (VOE), Relative Volume Difference (RVD), Surface Distance Metrics, and Hausdorff distance. These evaluation metrics are described below.
Sensitivity is used to measure the positive portion of the voxels between actual and predicted segmentation masks. Sensitivity is determined by Equation (3):
Sensitivity = T P R = T P T P + F N
Specificity is employed to measure the negative voxels between actual and predicted masks. Specificity is expressed in Equation (4):
Specificity = T N R = T N T N + F P
The Jaccard Coefficients index (JAC) [14] describes the overlap of two sets separated with union of sets as shown in Equation (5):
J ( A , B ) = | A   B | | A   B |
where A is the actual volume, and B is the predicted volume.
The Dice coefficient (DC) is employed for validating the segmentation of the medical volume-oriented data. This is an overlapping index that calculates the magnitude of overlapping between actual result and achieved results in the context of task-related binary segmentation [40]. For the actual and achieved mask, the DC is expressed by following Equation (6):
Dice ( A , B ) = 2 | A   B | | A   B |
The volume overlap error [40] is almost the reciprocal of the Jaccard index. It is defined by Equation (7):
VOE ( A , B ) = 1 | A   B | | A   B |
The relative volume difference (RVD) is calculated by Equation (8) [40]:
RVD ( A , B ) = | B | | A | | A |
Surface distance metrics determine the measurements between actual and predicted segmentation [40] as defined in Equations (9) and (10):
d ( v , S ( A ) ) = m i n S A ϵ S ( A ) v S A
ASD ( A , B ) = 1 | S ( A ) | + | S ( B ) | ( S A ϵ S ( A ) d ( S A , S ( B ) ) + S B ϵ S ( B ) d ( S B , S ( A ) ) )
The Hausdorff Distance is employed for differentiating between the binary objects into two masks of segmentation. It is termed as the maximum surface distance (MSD) that exists in objects [51]. The MSD is expressed in Equation (11):
MSD ( A , B ) = m a x { m a x S A ϵ S ( A ) d ( S A , S ( B ) ) , m a x S B ϵ S ( B ) d ( S B , S ( A ) ) }

4. Simulation

The study employs eight metrics for the measurement of the accuracy of the proposed segmentation method by comparing results with those of recent models. Measurements are made of metrics such as relative volume difference (RVD), volumetric overlap error (VOE), maximum surface distance (MSD), average symmetric surface distance (ASD), Dice coefficients, Jaccard coefficients, specificity and sensitivity. It was noticed that better segmentation was achieved for smaller values of the first four measurements. Better segmentation was achieved for higher value of Dice and other three metrics (Jaccard, sensitivity, specificity).

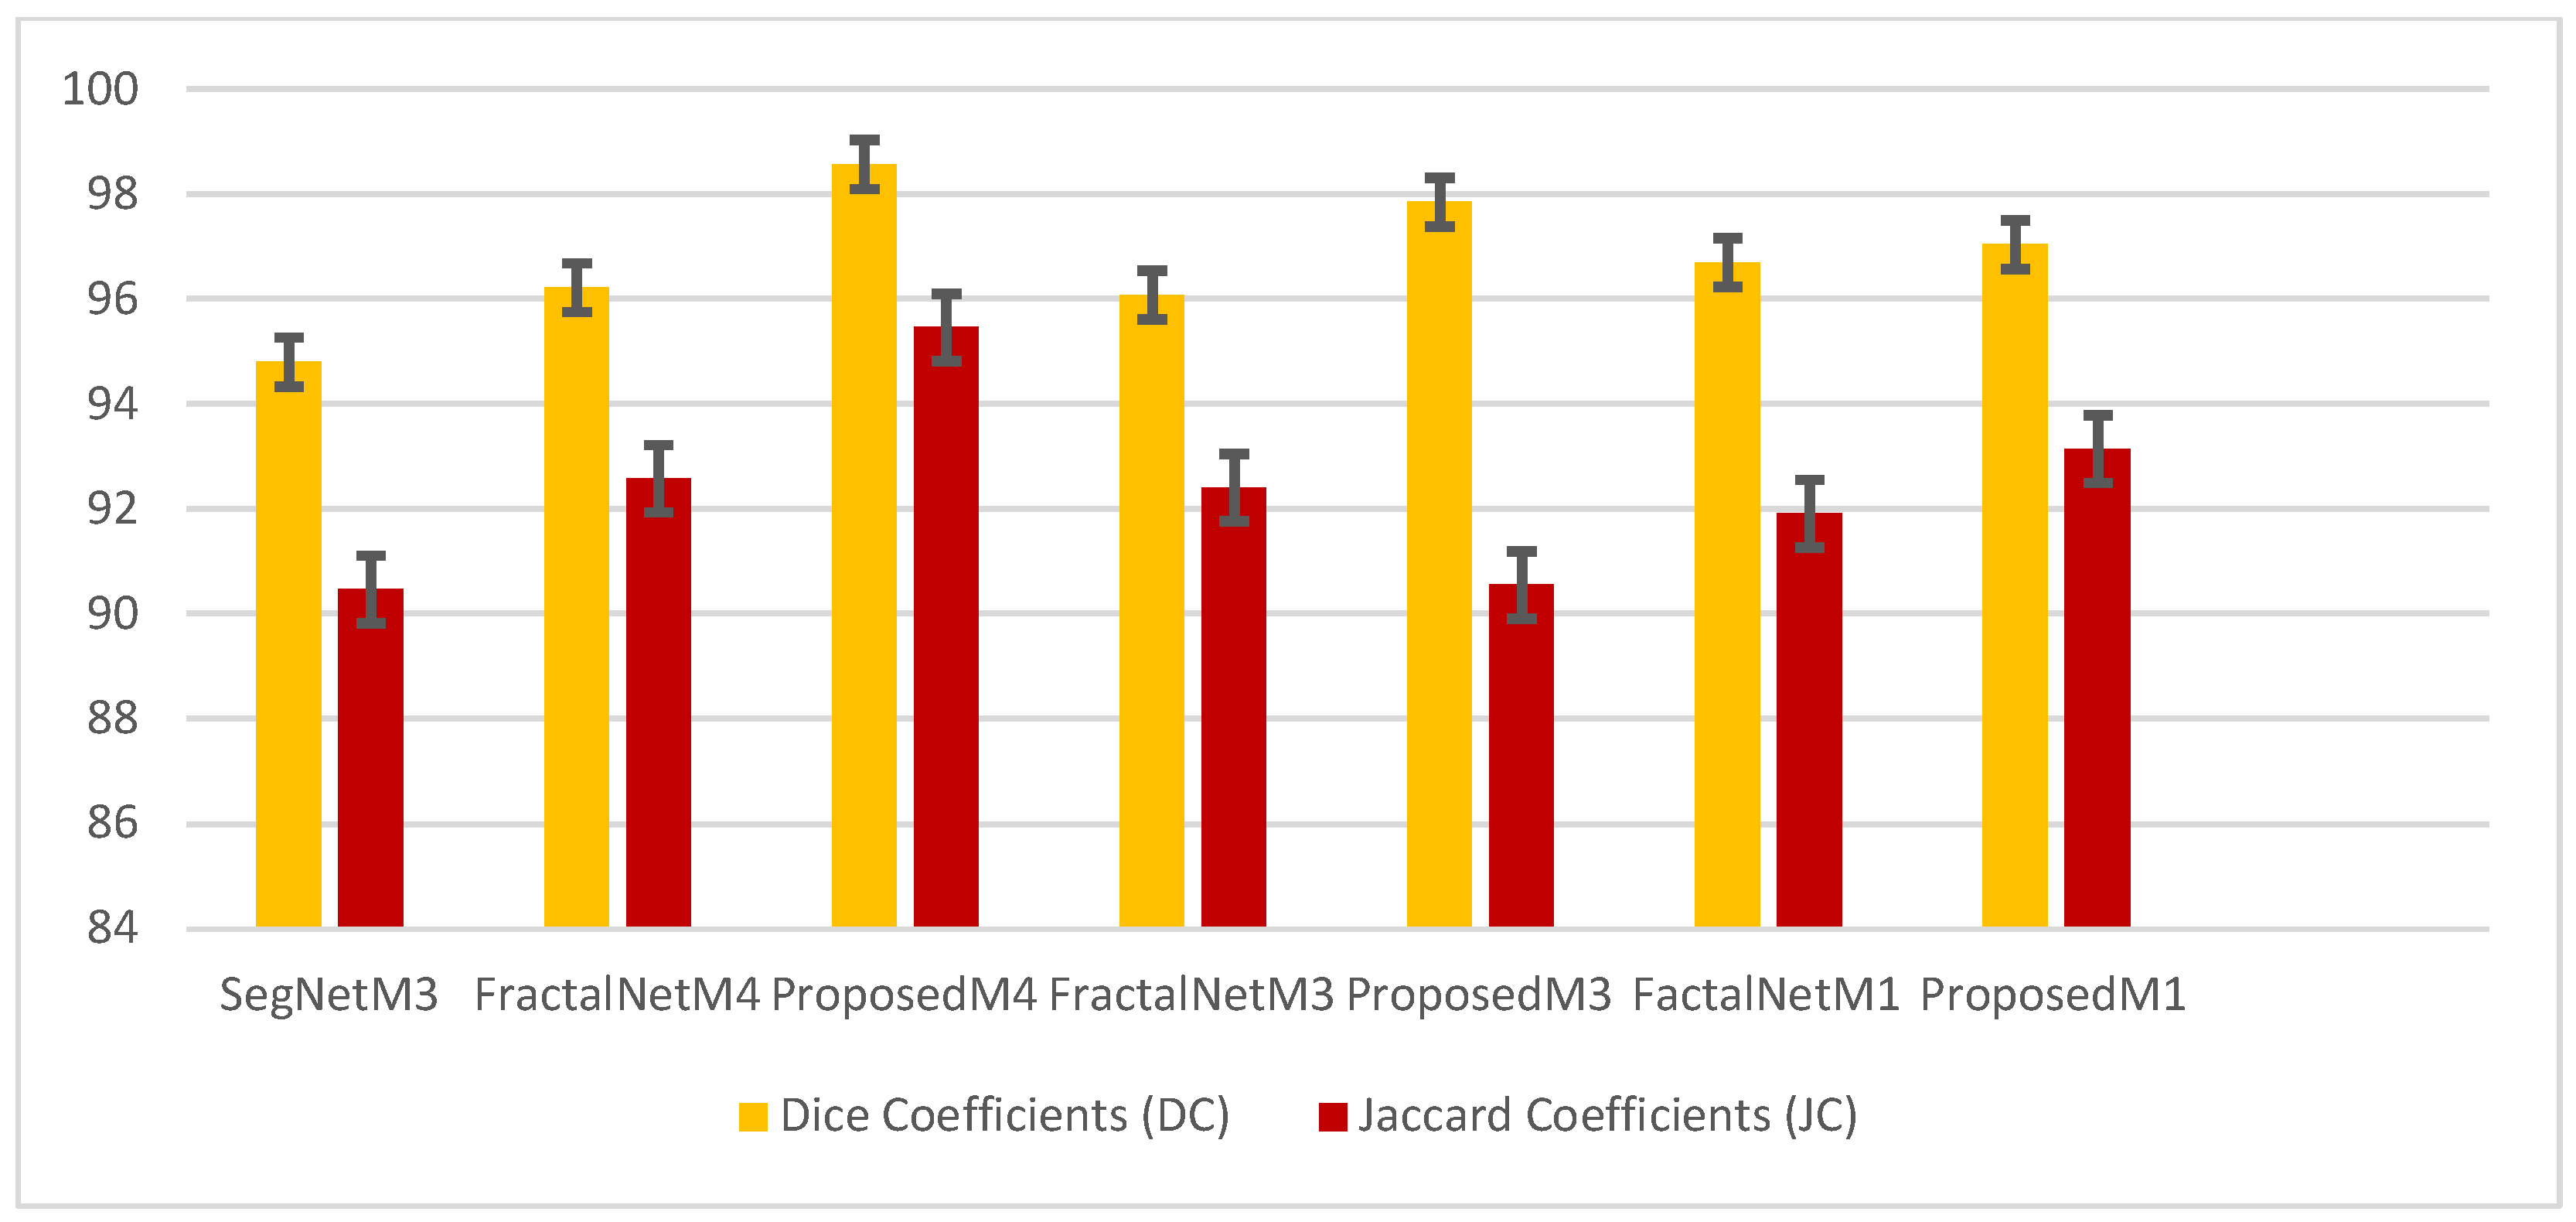
4.1. Performance Analysis Based on Performance Metrics

Various recent models used for segmentation based on biomedical images were reimplemented and trained on various set of parameters (learning rate, optimizer, size of batch with number of epochs). The performance metrics for all existing and proposed segmentation models is shown in Table 1. The models were trained using four different sets of hyperparameters (details of each hyperparameter set are depicted in Table 2) and the best models chosen based on test samples.
Best training Dice coefficients and Jaccard coefficients based on proposed and existing models are shown in Figure 5.
Figure 6 shows the Dice and Jaccard coefficients for all models. The best four sets of hyperparameters were used for training the proposed and existing models.
The sets of hyperparameters used for recent existing deep learning models and proposed model are depicted in Table 2. The symbol ‘-’ represent the same value noted in the proposed model.
Percentage of equal pixels was employed to evaluate the binary segmentation between actual and predicted samples. The high value of percentage agreement between pixels of predicted and ground truth data shows that the proposed models produced optimal performance. A histogram of pixel agreement between predicted and ground truth test samples using the proposed model is shown in Figure 7. Most of the samples shows more than 96 percent agreement between predicted and ground truth values for all proposed models. Figure 7h shows that the ensemble model produced 99 percent histogram agreement for most of the samples. This pixel agreement analysis shows that the proposed model produced reliable and accurate segmentation results using cardiac MRI-validated dataset. Pixel agreement analysis revealed that our proposed model could be used for myocardium border segmentation.
Bland Altman analysis was conducted using ground truth and predicted segmentation values for all frames of the test data. Figure 8 shows the Bland Altman analysis for the chosen best models (proposed and existing). The analysis showed a 95% agreement between predicted and ground truth samples for all test data. Only a few samples produced error values, as shown in Figure 8a. Figure 8h shows densely grouped values for most of the samples indicating agreement between samples. FractalM1 and FractalM4 showed a high error rate for a certain number of samples and some samples were diverted from densely grouped samples. The Bland Altman analysis shows that the ensemble model provides a reliable solution and strong agreement between actual and predicted samples, except for a few samples. Statistical analysis was performed based on actual and predicted mask frames for one patient. The Pearson correlation coefficient was calculated for actual and predicted masks based on best proposed and existing models. The correlation values are shown in Figure 9. The ensemble produced highest correlation values between actual and predicted masks. Pixel agreement for 20 frames based on one patient’s data is shown in Figure 10. The best proposed and existing models were used to calculate pixel agreement percentage. The ensemble model produced the highest pixel agreement percentage between the actual and predicted masks.

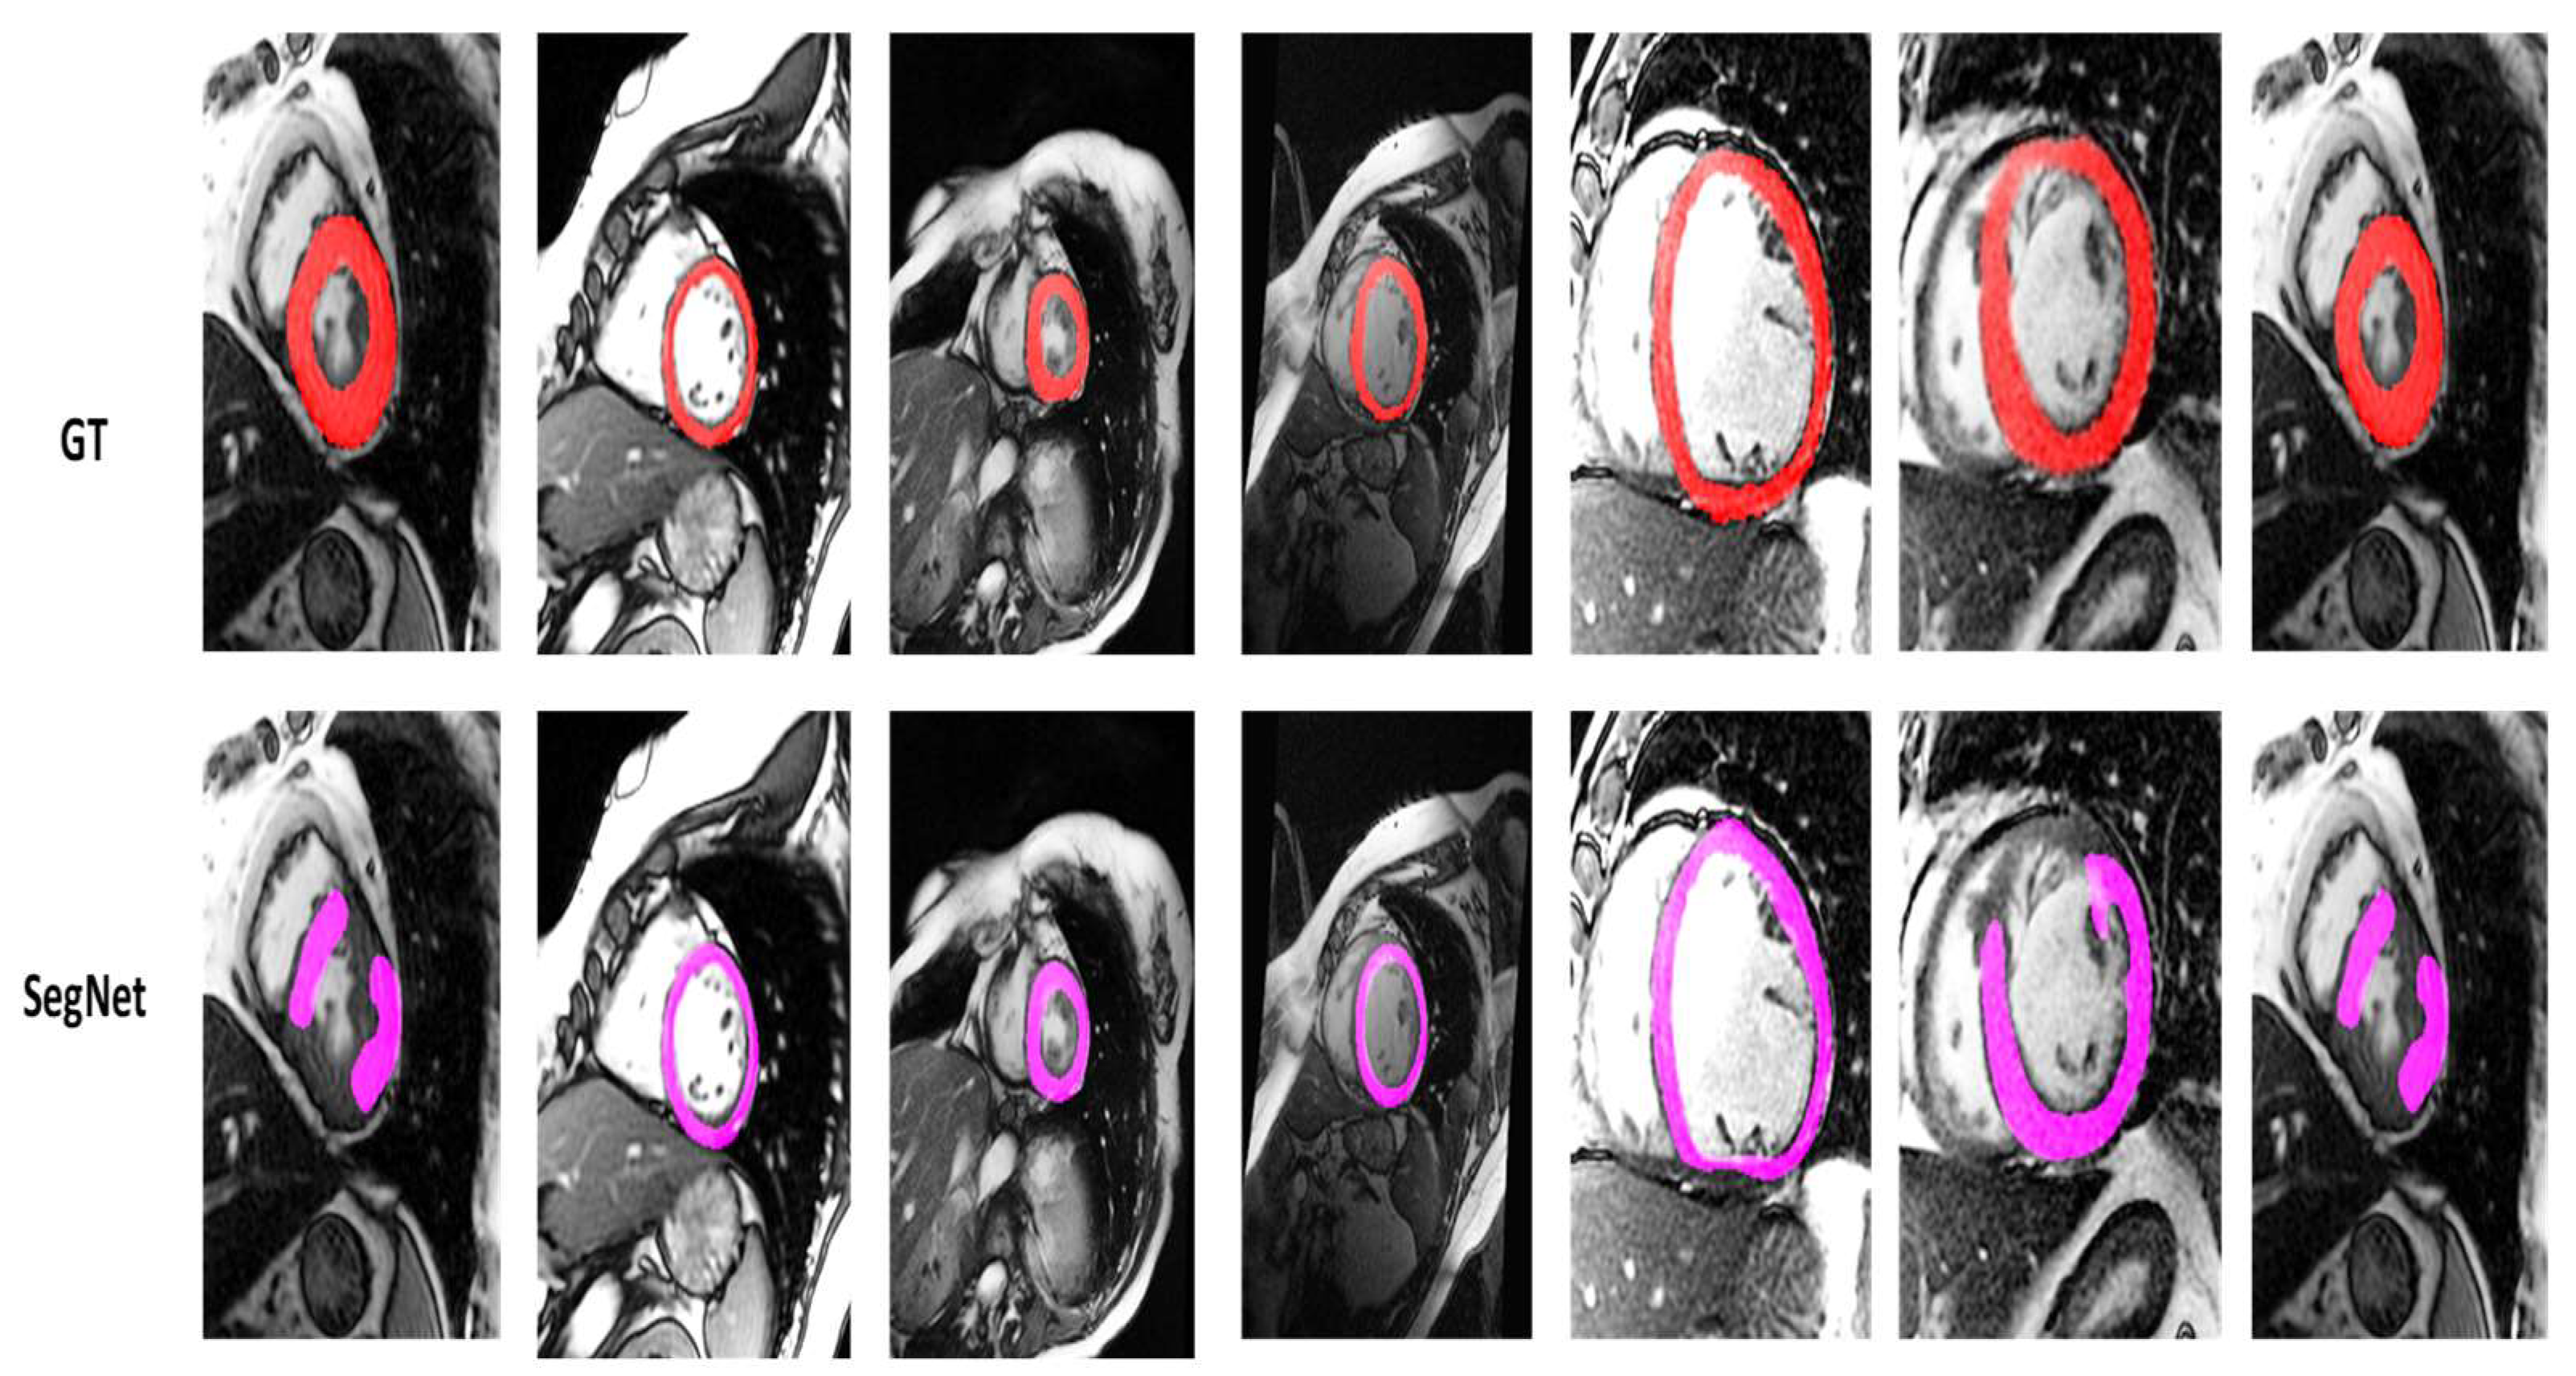
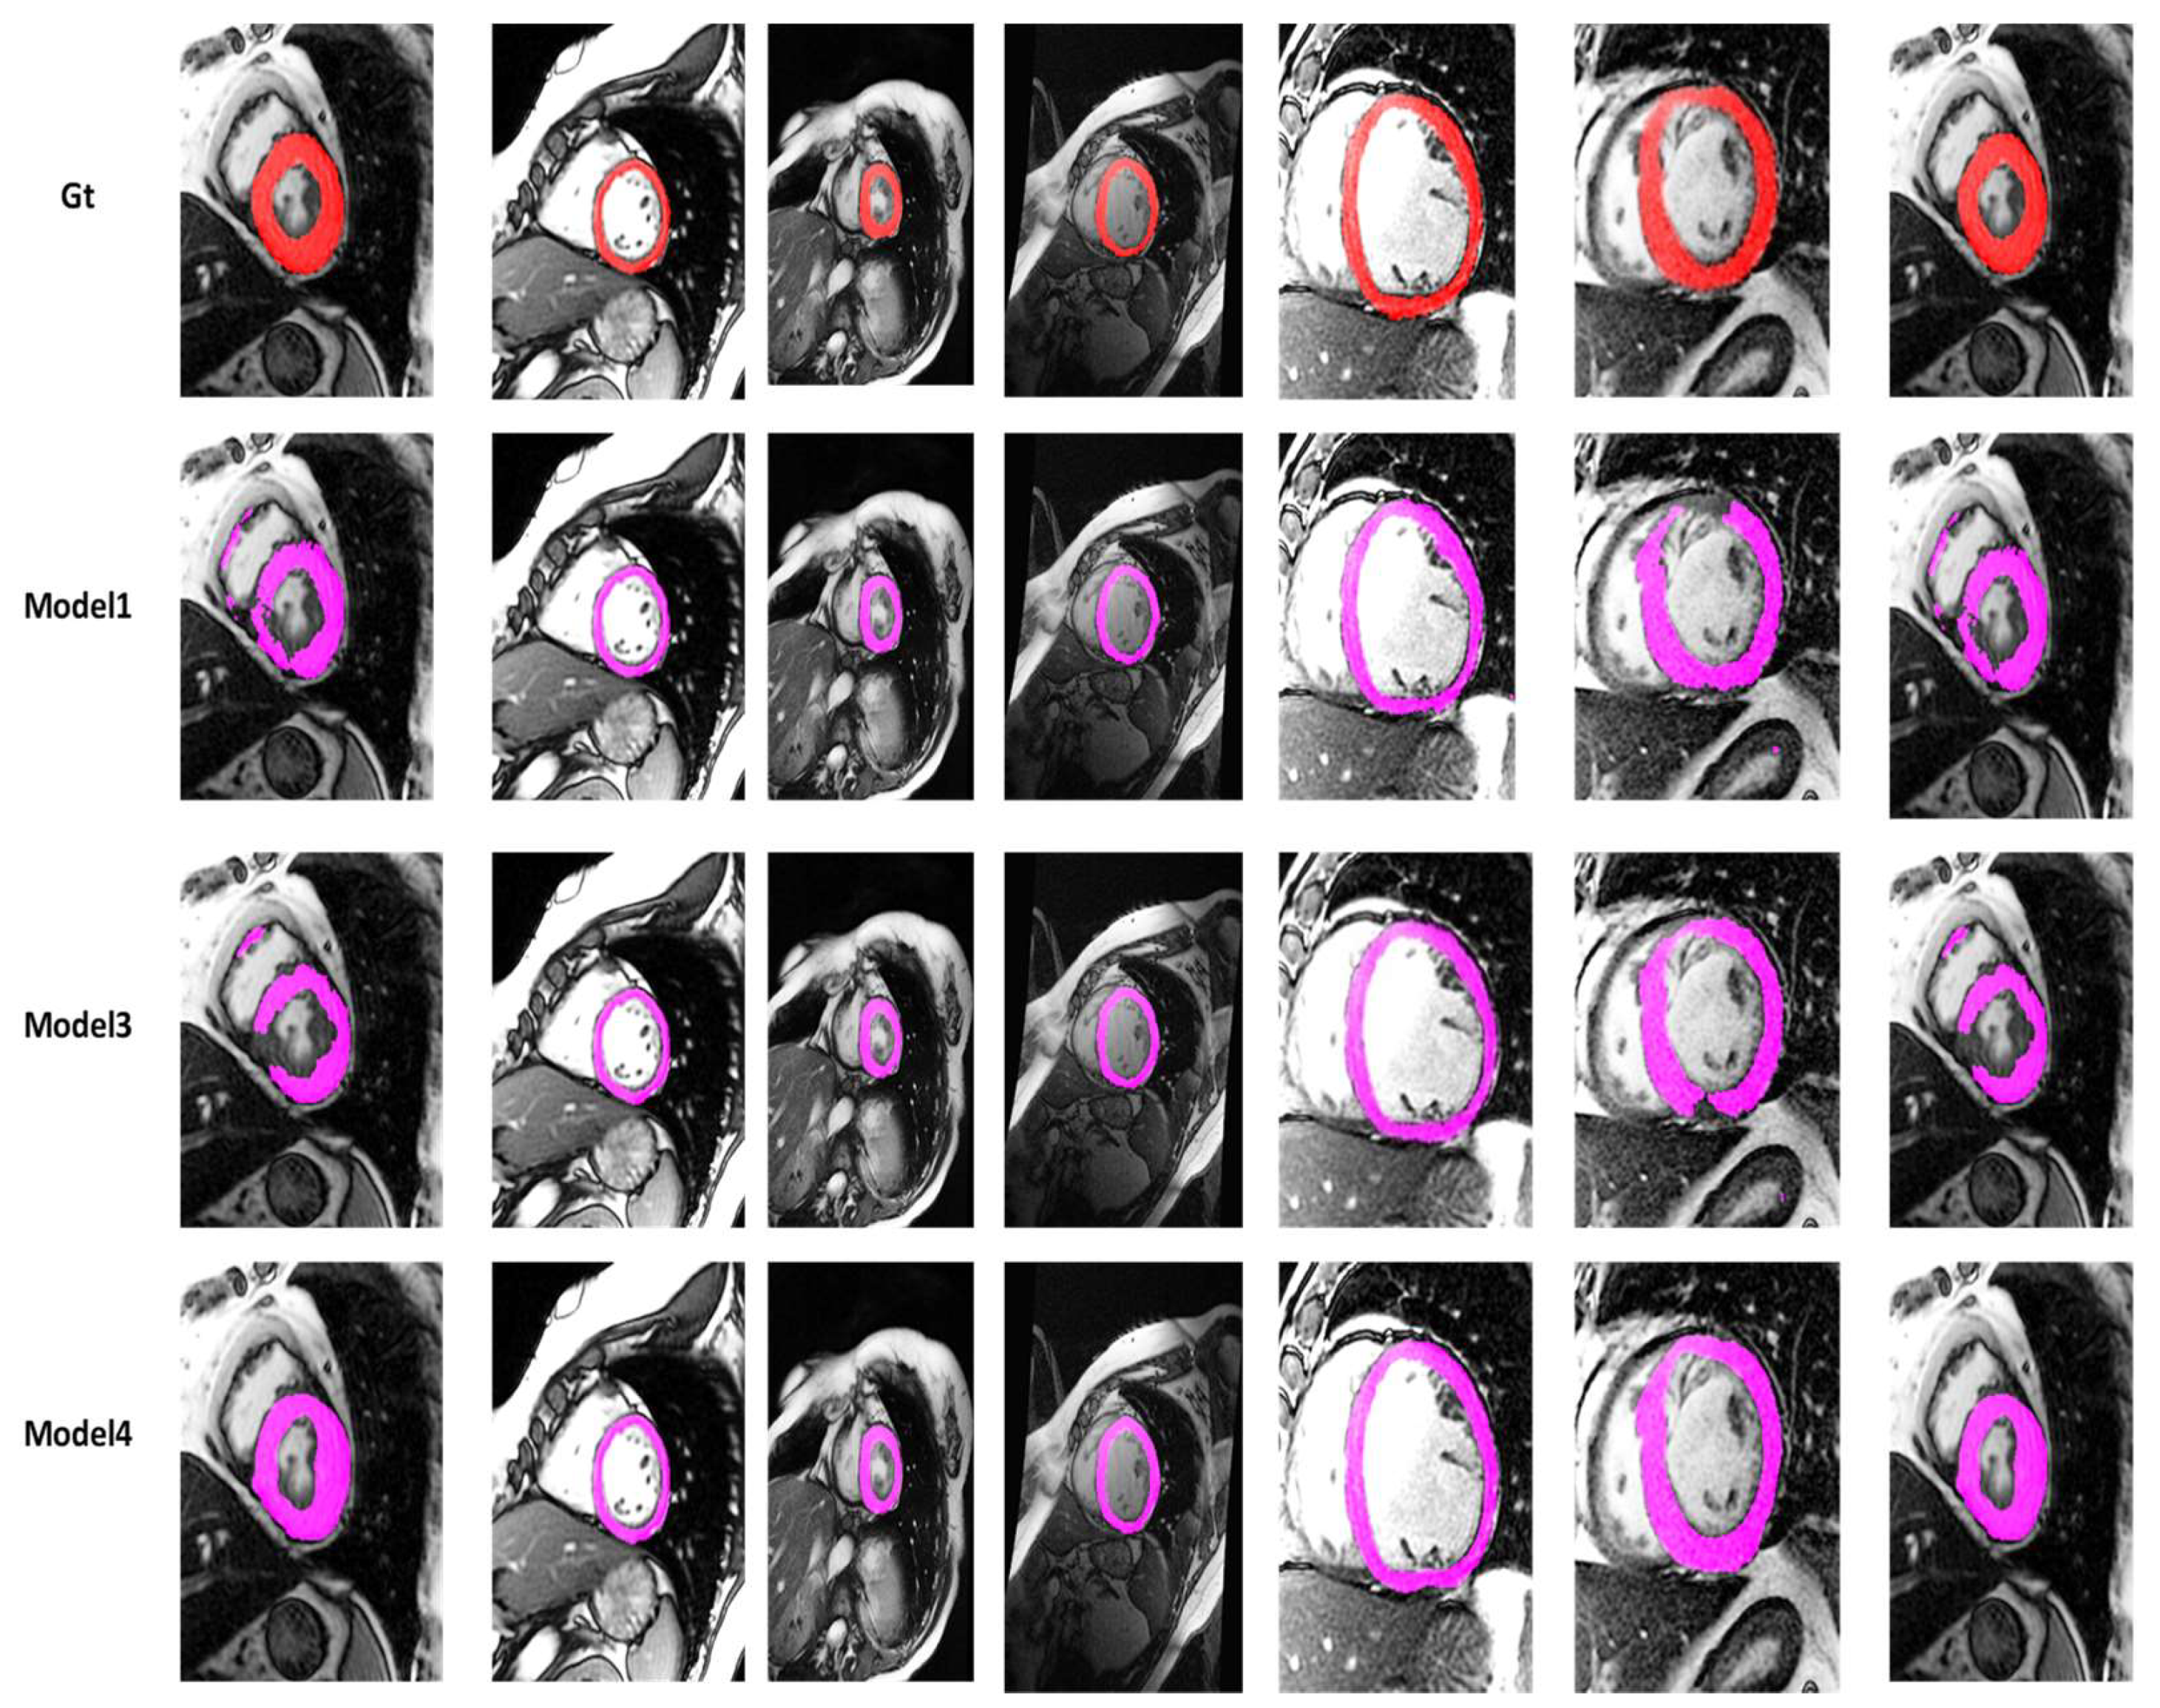
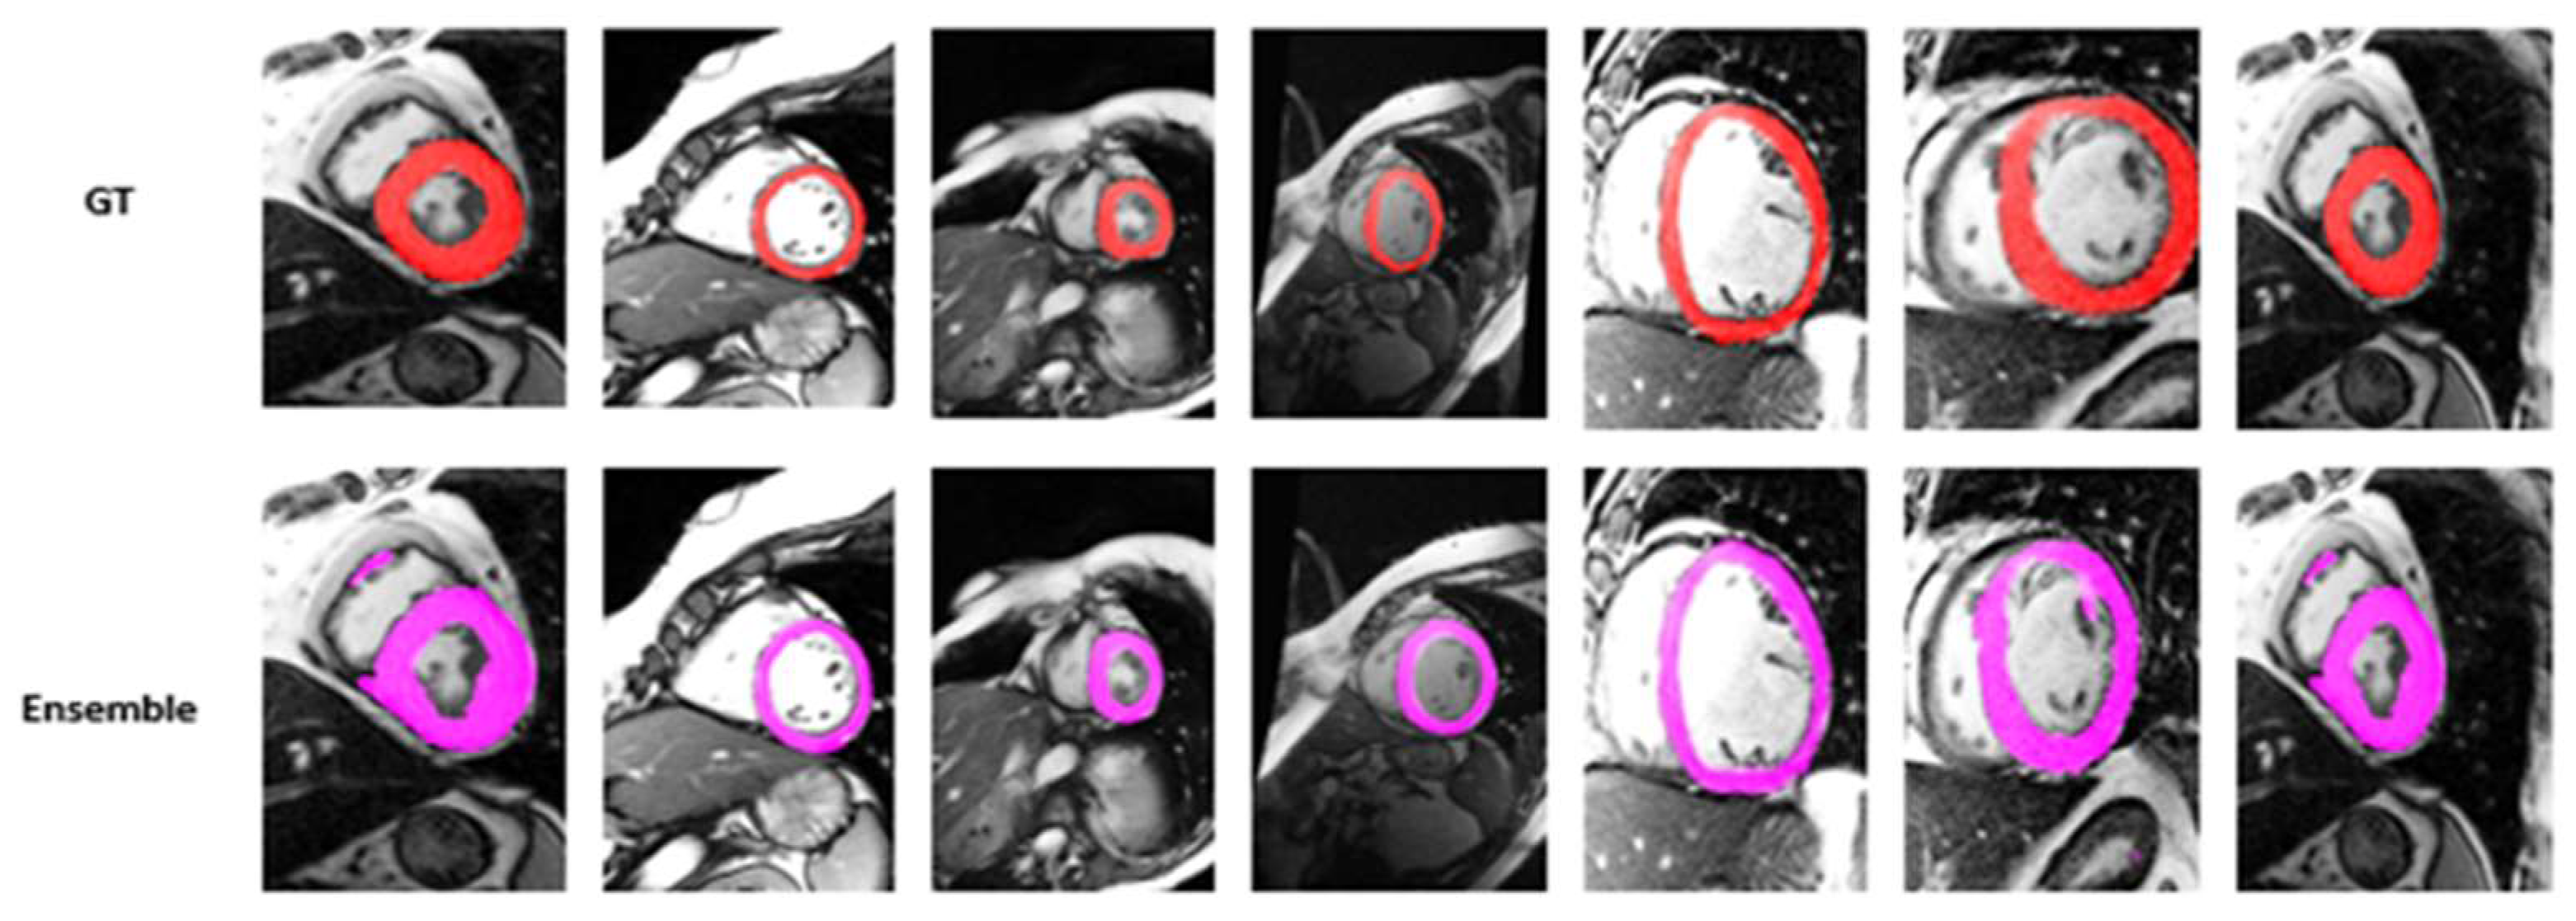
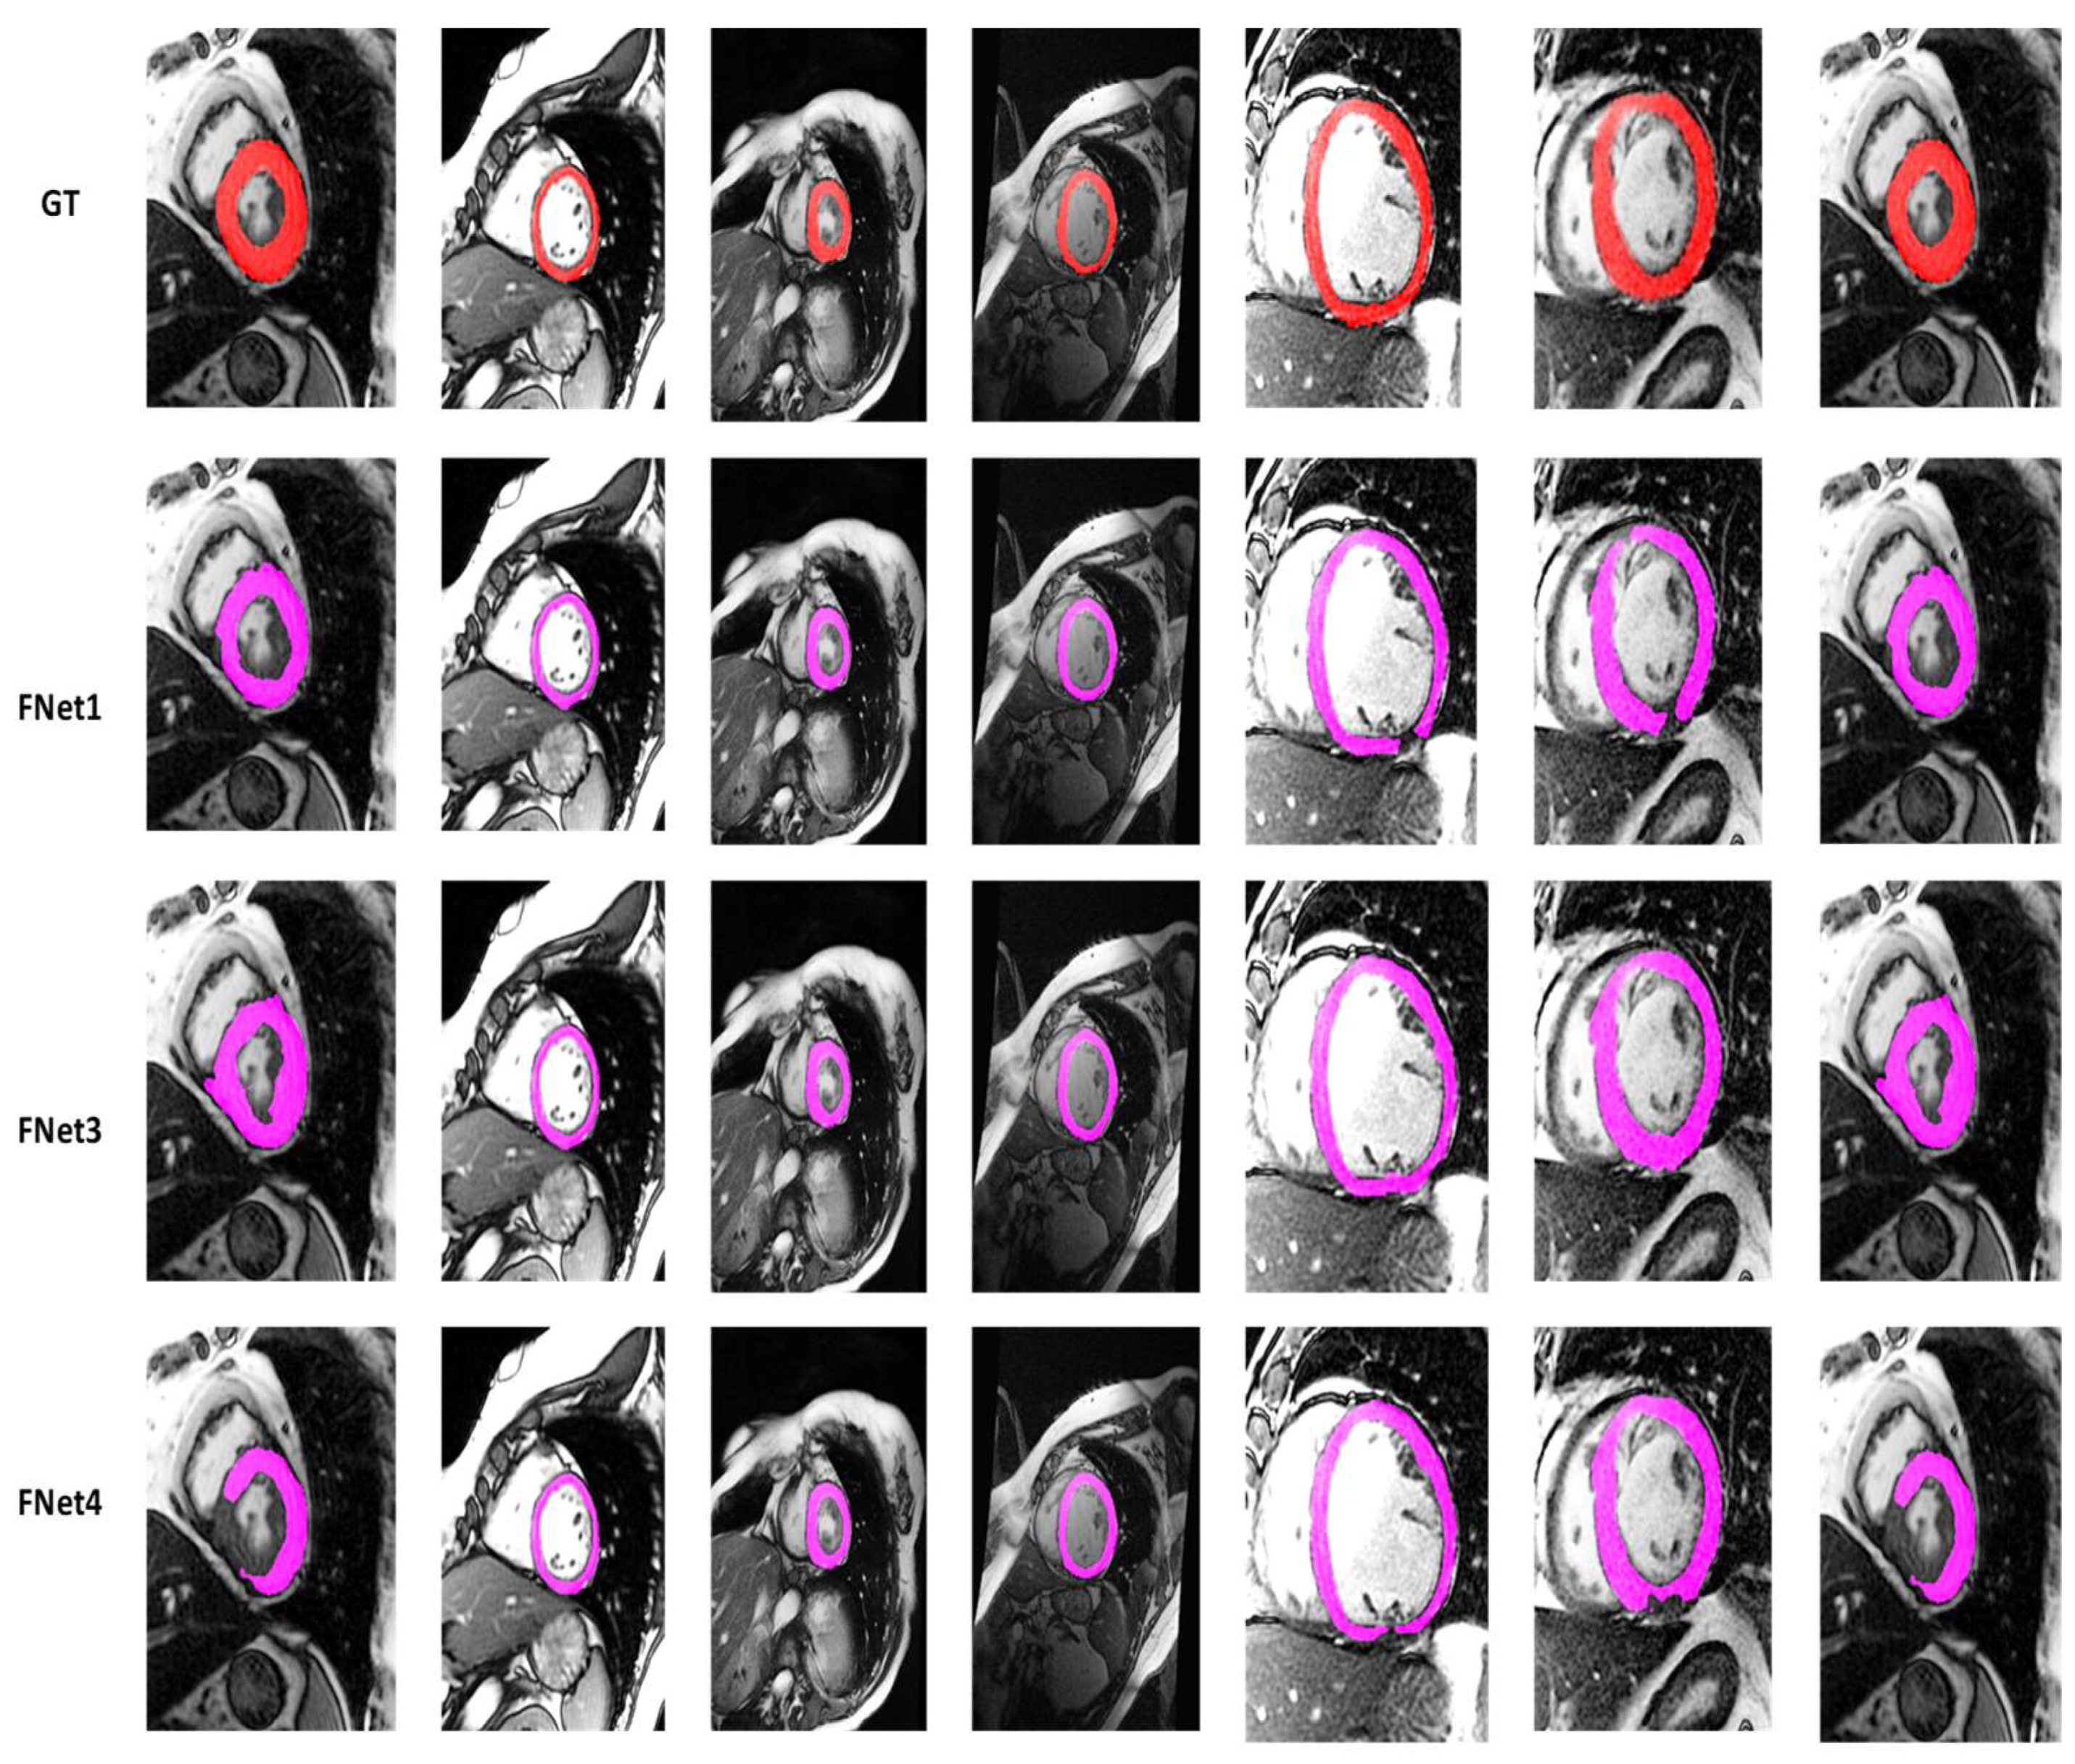
4.2. Visualization Segmentation Results

The proposed model and existing deep learning models were used to evaluate segmentation of the myocardium border using heart MRI dataset. An 80% dataset was used for training and 20% for testing. The actual and segmented contours are shown in Figure 10.
Table 3 shows comparison of the proposed ensemble model with datasets. Alain et al. [57] proposed a dataset based on left ventricle myocardium segmentation. The proposed model also evaluated a multi-sequence cardiac MRI dataset [58]. The dataset used in this paper with other publicly available datasets are shown in Table 3.
Training and validation loss curves for the proposed model are shown in Figure 11.
The training and validation loss curves are shown in Figure 11. The loss curves did not provide smooth learning when we used the Liu dataset [58] and resulted in overfitting; the reason being the small number of samples available for training. The dataset provided by Xue [45] produced better training and validation loss compared to the Liu dataset [58].
Table 4 shows the number of trainable parameters and number of flops used during optimization and training of proposed model with different number of hyperparameters. There was no big difference between trainable parameters across each model. The computational complexity was the same across each model when we used different number of parameters.

4.3. Discussion

The performance of the proposed framework was evaluated using various performance metrics for semantic segmentation. Performance metrics such as Dice coefficients, Jaccard coefficients, volume over error, Housdrouf distance, maximum average surface distance, accuracy, sensitivity, specificity were used to assess the accuracy between actual and predicted values based on each frame of the input dataset. Other performance metrics such as correlation coefficients, agreement between binary and Bland Altman plots between actual and predicted masks were assessed to determine the accuracy of the proposed model. Slice-by-slice popular segmentation deep learning models such as Unet, SegNet, FractelNet, ResNet, Attention U-net were reimplemented and results compared with our proposed Residual neural network including an atrous spatial pyramid pooling module deep learning model. Further, we trained state-of-the-art and proposed models using various hyperparameters and ensemble, or by fusing the four best chosen models using an ensemble majority voting method. The ensemble model produced the best results with the proposed models. The proposed model performed well for myocardium segmentation and handled the big challenges occurring in myocardium segmentation due to different sizes and shapes of the myocardium border. The texture between the myocardium borders and its surroundings is another challenge, and our proposed model handled this challenge well. Images of a few slices are shown in Figure 12, Figure 13, Figure 14 and Figure 15. Due to insufficient contrast between surroundings and the border of myocardium, some parts of the border could not be seen using fractalNet, as shown in Figure 15. The proposed model4 segmented the full myocardium border, as shown in Figure 13. The ensemble model produced excellent results and segmented the full border with different shapes and sizes of the myocardium border. The atrous spatial pyramid pooling module is used successfully for segmentation of computer vision and biomedical image semantic segmentation problems. The ASPP module integrated with the proposed encoder-decoder residual network has the ability to extract detailed features and achieved good performance compared with recent deep learning models.
Some boundary pixels of myocardium borders still require reconstruction using deep learning models. In the proposed ensemble solution we took maximum pixel values from the same location using different proposed models. Standard convolution usually uses a convolution kernel with a smaller receptive field, making it impossible to obtain contextual information. ASPP consisted of four atrous convolution layers using different atrous rates (r) and one global average pooling layer. The pooling layers in the convolutional neural network gather contextual information and reduce the spatial information from the input image. The main problem in semantic subdivision is that the feature maps have low resolution. Encoder-decoder-based networks such as U-net, and V-net can be employed to solve the low-resolution problem based on an up-sampling layer, gathering the information from lower layers and reinstating the resolution of the estimate to that of the input image at the decoder side.
The proposed model is structured into a series of encoding and decoding operations constituting a residual network. The majority voting technique was applied for ensemble of the output of the proposed models based on predicted masks for myocardium segmentation.
U-Net presented limited capacity in effectively learning the feature information of the images in complicated tasks such as myocardium border segmentation with the same texture surrounding the area and with different shapes. This limitation led to a need for optimizing the network architecture structure to enlarge the parameter space to allow the network to learn more representative features.
The proposed residual block with ASPP module has various advantages compared to traditional CNN-based models. The main advantages are (1) that the gradient can flow continuously, allowing the parameters to be updated in very deep networks, (2) the operations applied by a single layer are only a small modification to identity operation, and (3) ResNets modules are robust to layer permutations suggesting that neighboring layers perform similar operations. The main purpose of such residual blocks is the safeguarding of feature maps within convolutional layer blocks that are used before each encoder and decoder block required to bridge the semantic gap between the encoder and decoder by maintaining small increments in the computational overhead and providing an accurate segmentation map. The structural information for feature maps could be restored using ASPP with the addition of the residual blocks aimed to preserve the fine-grained structures that play an important role in medical image segmentation.

5. Conclusions

Quantification of the myocardium is an essential task for identification of myocardial infraction and other heart diseases. The main challenge is to segment the myocardium border that has different shapes and sizes of the myocardium border zone and the same texture as the surrounding tissues. Various deep learning models have been proposed to tackle the myocardium border segmentation task.
In this paper, a model based on a residual encoder-decoder integrated with an ASPP module was presented for myocardium segmentation using a cardiac MRI dataset. Structural information for feature maps could be restored using the proposed ASPP with the addition of residual blocks and different hyperparameters used in training of various models. We chose the best models based on the experimental results. Further the ensemble method based on a majority voting technique was applied to fuse the segmentation output of the best proposed and existing deep learning models. The ASPP module was used to extract relatively local features and multi-scale features to provide rich context information for the proposed network. Further, the ASPP and residual blocks from the encoder and decoder side of the proposed model were used to reduce the semantic gap between the high-level feature and the low-level feature maps to improve feature fusion capability and improve the performance of the myocardium border segmentation task. The results show that the proposed deep learning model could be used for cardiac myocardium segmentation. Accurate segmentation and detection of myocardium borders could be helpful in diagnosing myocardial infraction, no reflow and hypertrophic cardiomyopathy (HCM) disease.
In future work, different hyperparameters in deep learning models and postprocessing image processing steps could be used to reconstruct and segment the myocardium border accurately. The postprocessing steps will be helpful for further accurate detection of myocardium borders. The hybrid deep learning model approach could be developed for the myocardium border.

Author Contributions

Conceptualization, A.Q. and I.A.; methodology, A.Q.; software, A.Q.; validation, I.A, M.O.A. and R.A.A.; formal analysis, A.Q.; investigation, A.Q. and I.A.; resources, M.O.A. and R.A.A.; data curation, A.Q.; writing—original draft preparation, A.Q. and I.A.; writing—review and editing, B.B.G.; visualization, B.B.G., M.O.A. and R.A.A.; supervision, A.Q.; project administration, I.A.; funding acquisition, I.A. All authors have read and agreed to the published version of the manuscript.

Funding

This research work was funded by Institute Fund Projects under grant no. (IFPHI-145-611-2020). The authors acknowledge technical and financial support from the Ministry of Education and King Abdulaziz University, DSR, Jeddah, Saudi Arabia.

Institutional Review Board Statement

Not applicable.

Informed Consent Statement

Not applicable.

Data Availability Statement

Not applicable.

Acknowledgments

This research work was funded by Institute Fund Projects under grant no. (IFPHI-145-611-2020). The authors acknowledge technical and financial support from the Ministry of Education and King Abdulaziz University, DSR, Jeddah, Saudi Arabia.

Conflicts of Interest

The authors declare no conflict of interest.

References

  1. Karamitsos, T.D.; Francis, J.M.; Myerson, S.; Selvanayagam, J.B.; Neubauer, S. The role of cardiovascular magnetic resonance imaging in heart failure. J. Am. Coll. Cardiol. 2009, 54, 1407–1424. [Google Scholar] [CrossRef] [PubMed] [Green Version]
  2. Peng, P.; Lekadir, K.; Gooya, A.; Shao, L.; Petersen, S.E.; Frangi, A.F. A review of heart chamber segmentation for structural and functional analysis using cardiac magnetic resonance imaging. Magn. Reson. Mater. Phys. Biol. Med. 2016, 29, 155–195. [Google Scholar] [CrossRef] [PubMed] [Green Version]
  3. Ayed, I.B.; Chen, H.M.; Punithakumar, K.; Ross, I.; Li, S. Max-flow segmentation of the left ventricle by recovering subject-specific distributions via a bound of the Bhattacharyya measure. Med. Image Anal. 2012, 16, 87–100. [Google Scholar] [CrossRef] [PubMed]
  4. Hayit, G.; Van Ginneken, B.; Summers, R.M. Guest editorial deep learning in medical imaging: Overview and future promise of an exciting new technique. IEEE Trans. Med. Imaging 2016, 35, 1153–1159. [Google Scholar]
  5. Avendi, M.R.; Kheradvar, A.; Jafarkhani, H. A combined deep-learning and deformable-model approach to fully automatic segmentation of the left ventricle in cardiac MRI. Med. Image Anal. 2016, 30, 108–119. [Google Scholar] [CrossRef] [PubMed] [Green Version]
  6. Ngo, T.A.; Lu, Z.; Carneiro, G. Combining deep learning and level set for the automated segmentation of the left ventricle of the heart from cardiac cine magnetic resonance. Med. Image Anal. 2017, 35, 159–171. [Google Scholar] [CrossRef] [PubMed]
  7. Tran, P.V. A fully convolutional neural network for cardiac segmentation in short-axis MRI. arXiv 2016, arXiv:1604.00494. [Google Scholar]
  8. Long, J.; Shelhamer, E.; Darrell, T. Fully convolutional networks for semantic segmentation. In Proceedings of the IEEE Conference on Computer Vision and Pattern Recognition, Boston, MA, USA, 7–12 June 2015; pp. 3431–3440. [Google Scholar]
  9. Wolterink, J.M.; Leiner, T.; Viergever, M.A.; Išgum, I. Automatic segmentation and disease classification using cardiac cine MR images. In International Workshop on Statistical Atlases and Computational Models of the Heart; Springer: Cham, Switzerland, 2017; pp. 101–110. [Google Scholar]
  10. Mortazi, A.; Burt, J.; Bagci, U. Multi-planar deep segmentation networks for cardiac substructures from MRI and CT. In International Workshop on Statistical Atlases and Computational Models of the Heart; Springer: Cham, Switzerland, 2017; pp. 199–206. [Google Scholar]
  11. Zotti, C.; Luo, Z.; Lalande, A.; Humbert, O.; Jodoin, P.M. Novel deep convolution neural network applied to MRI cardiac segmentation. arXiv 2017, arXiv:1705.08943. [Google Scholar]
  12. Tan, L.K.; Liew, Y.M.; Lim, E.; McLaughlin, R.A. Convolutional neural network regression for short-axis left ventricle segmentation in cardiac cine MR sequences. Med. Image Anal. 2017, 39, 78–86. [Google Scholar] [CrossRef]
  13. Brahim, K.; Qayyum, A.; Lalande, A.; Boucher, A.; Sakly, A.; Meriaudeau, F. A 3D deep learning approach based on Shape Prior for automatic segmentation of myocardial diseases. In Proceedings of the 2020 Tenth International Conference on Image Processing Theory, Tools and Applications (IPTA), Paris, France, 9–12 November 2020; IEEE: Piscataway, NJ, USA; pp. 1–6. [Google Scholar]
  14. Suinesiaputra, A.; Bluemke, D.A.; Cowan, B.R.; Friedrich, M.G.; Kramer, C.M.; Kwong, R.; Plein, S.; Schulz-Menger, J.; Westenberg, J.J.; Young, A.A.; et al. Quantification of LV function and mass by cardiovascular magnetic resonance: Multi-center variability and consensus contours. J. Cardiovasc. Magn. Reson. 2015, 17, 63. [Google Scholar] [CrossRef] [Green Version]
  15. Petitjean, C.; Dacher, J.N. A review of segmentation methods in short axis cardiac MR images. Med. Image Anal. 2011, 15, 169–184. [Google Scholar] [CrossRef] [PubMed] [Green Version]
  16. Wu, Y.; Wang, Y.; Jia, Y. Segmentation of the left ventricle in cardiac cine MRI using a shape-constrained snake model. Comput. Vis. Image Underst. 2013, 117, 990–1003. [Google Scholar] [CrossRef]
  17. Pednekar, A.; Kurkure, U.; Muthupillai, R.; Flamm, S.; Kakadiaris, I.A. Automated left ventricular segmentation in cardiac MRI. IEEE Trans. Biomed. Eng. 2006, 53, 1425–1428. [Google Scholar] [CrossRef] [PubMed]
  18. Lötjönen, J.; Kivistö, S.; Koikkalainen, J.; Smutek, D.; Lauerma, K. Statistical shape model of atria, ventricles and epicardium from short-and long-axis MR images. Med. Image Anal. 2004, 8, 371–386. [Google Scholar] [CrossRef]
  19. Nachtomy, E.; Cooperstein, R.; Vaturi, M.; Bosak, E.; Vered, Z.; Akselrod, S. Automatic assessment of cardiac function from short-axis MRI: Procedure and clinical evaluation. Magn. Reson. Imaging 1998, 16, 365–376. [Google Scholar] [CrossRef]
  20. Qayyum, A.; Razzak, I.; Tanveer, M.; Kumar, A. Depth-wise dense neural network for automatic COVID19 infection detection and diagnosis. Ann. Oper. Res. 2021, 1–21, published online ahead of print. [Google Scholar] [CrossRef]
  21. Zhen, X.; Islam, A.; Bhaduri, M.; Chan, I.; Li, S. Direct and simultaneous four-chamber volume estimation by multi-output regression. In International Conference on Medical Image Computing and Computer-Assisted Intervention; Springer: Cham, Switzerland, 2015; pp. 669–676. [Google Scholar]
  22. Zhen, X.; Wang, Z.; Islam, A.; Bhaduri, M.; Chan, I.; Li, S. Direct estimation of cardiac bi-ventricular volumes with regression forests. In International Conference on Medical Image Computing and Computer-Assisted Intervention; Springer: Cham, Switzerland, 2015; pp. 586–593. [Google Scholar]
  23. Zhen, X.; Wang, Z.; Islam, A.; Bhaduri, M.; Chan, I.; Li, S. Multi-scale deep networks and regression forests for direct bi-ventricular volume estimation. Med. Image Anal. 2016, 30, 120–129. [Google Scholar] [CrossRef]
  24. Kabani, A.; El-Sakka, M.R. Estimating ejection fraction and left ventricle volume using deep convolutional networks. In International Conference on Image Analysis and Recognition; Springer: Cham, Switzerland, 2016; pp. 678–686. [Google Scholar]
  25. Xue, W.; Islam, A.; Bhaduri, M.; Li, S. Direct multitype cardiac indices estimation via joint representation and regression learning. IEEE Trans. Med. Imaging 2017, 36, 2057–2067. [Google Scholar] [CrossRef] [Green Version]
  26. Xue, W.; Nachum, I.B.; Pandey, S.; Warrington, J.; Leung, S.; Li, S. Direct estimation of regional wall thicknesses via residual recurrent neural network. In International Conference on Information Processing in Medical Imaging; Springer: Cham, Switzerland, 2017; pp. 505–516. [Google Scholar]
  27. Afshin, M.; Ayed, I.B.; Punithakumar, K.; Law, M.; Islam, A.; Goela, A.; Peters, T.; Li, S. Regional assessment of cardiac left ventricular myocardial function via MRI statistical features. IEEE Trans. Med. Imaging 2013, 33, 481–494. [Google Scholar] [CrossRef]
  28. Wang, Z.; Salah, M.B.; Gu, B.; Islam, A.; Goela, A.; Li, S. Direct estimation of cardiac biventricular volumes with an adapted bayesian formulation. IEEE Trans. Biomed. Eng. 2014, 61, 1251–1260. [Google Scholar] [CrossRef]
  29. Qayyum, A.; Lalande, A.; Meriaudeau, F. Automatic segmentation of tumors and affected organs in the abdomen using a 3D hybrid model for computed tomography imaging. Comput. Biol. Med. 2020, 127, 104097. [Google Scholar] [CrossRef]
  30. Fritscher, K.; Raudaschl, P.; Zaffino, P.; Spadea, M.F.; Sharp, G.C.; Schubert, R. Deep neural networks for fast segmentation of 3D medical images. In International Conference on Medical Image Computing and Computer-Assisted Intervention; Springer: Cham, Switzerland, 2016; pp. 158–165. [Google Scholar]
  31. Zeiler, M.D.; Fergus, R. Visualizing and understanding convolutional networks. In European Conference on Computer Vision; Springer: Cham, Switzerland, 2014; pp. 818–833. [Google Scholar]
  32. Ngo, T.A.; Carneiro, G. Left ventricle segmentation from cardiac MRI combining level set methods with deep belief networks. In Proceedings of the 2013 IEEE International Conference on Image Processing, Melbourne, Australia, 15–18 September 2013; IEEE: Piscataway, NJ, USA, 2013; pp. 695–699. [Google Scholar]
  33. Poudel, R.P.; Lamata, P.; Montana, G. Recurrent fully convolutional neural networks for multi-slice MRI cardiac segmentation. In Reconstruction, Segmentation, and Analysis of Medical Images; Springer: Cham, Switzerland, 2017; pp. 83–94. [Google Scholar]
  34. Zheng, Q.; Yang, M.; Yang, J.; Zhang, Q.; Zhang, X. Improvement of Generalization Ability of Deep CNN via Implicit Regularization in Two-Stage Training Process. IEEE Access 2018, 6, 15844–15869. [Google Scholar] [CrossRef]
  35. Zheng, Q.; Yang, M.; Tian, X.; Jiang, N.; Wang, D. A Full Stage Data Augmentation Method in Deep Convolutional Neural Network for Natural Image Classification. Discret. Dyn. Nat. Soc. 2020, 2020, 4706576. [Google Scholar] [CrossRef]
  36. Liu, C.; Wang, K.; Ye, L.; Wang, Y.; Yuan, X. Deep learning with neighborhood preserving embedding regularization and its application for soft sensor in an industrial hydrocracking process. Inf. Sci. 2021, 567, 42–57. [Google Scholar] [CrossRef]
  37. Rucco, M.; Viticchi, G.; Falsetti, L. Towards Personalized Diagnosis of Glioblastoma in Fluid-Attenuated Inversion Recovery (FLAIR) by Topological Interpretable Machine Learning. Mathematics 2020, 8, 770. [Google Scholar] [CrossRef]
  38. Teso-Fz-Betoño, D.; Zulueta, E.; Sánchez-Chica, A.; Fernandez-Gamiz, U.; Saenz-Aguirre, A. Semantic Segmentation to Develop an Indoor Navigation System for an Autonomous Mobile Robot. Mathematics 2020, 8, 855. [Google Scholar] [CrossRef]
  39. Perez, H.; Tah, J.H.M. Improving the Accuracy of Convolutional Neural Networks by Identifying and Removing Outlier Images in Datasets Using t-SNE. Mathematics 2020, 8, 662. [Google Scholar] [CrossRef]
  40. Hu, C.-S.; Lawson, A.; Chen, J.-S.; Chung, Y.-M.; Smyth, C.; Yang, S.-M. TopoResNet: A Hybrid Deep Learning Architecture and Its Application to Skin Lesion Classification. Mathematics 2021, 9, 2924. [Google Scholar] [CrossRef]
  41. Joshi, G.P.; Alenezi, F.; Thirumoorthy, G.; Dutta, A.K.; You, J. Ensemble of Deep Learning-Based Multimodal Remote Sensing Image Classification Model on Unmanned Aerial Vehicle Networks. Mathematics 2021, 9, 2984. [Google Scholar] [CrossRef]
  42. Kang, J.; Gwak, J. Ensemble Learning of Lightweight Deep Learning Models Using Knowledge Distillation for Image Classification. Mathematics 2020, 8, 1652. [Google Scholar] [CrossRef]
  43. Ganaie, M.A.; Hu, M.; Tanveer, M.; Suganthan, P.N. Ensemble deep learning: A review. arXiv 2021, arXiv:2104.02395. [Google Scholar]
  44. Neshir, G.; Rauber, A.; Atnafu, S. Meta-Learner for Amharic Sentiment Classification. Appl. Sci. 2021, 11, 8489. [Google Scholar] [CrossRef]
  45. Xue, W.; Brahm, G.; Pandey, S.; Leung, S.; Li, S. Full left ventricle quantification via deep multitask relationships learning. Med. Image Anal. 2018, 43, 54–65. [Google Scholar] [CrossRef] [PubMed]
  46. Xue, W.; Lum, A.; Mercado, A.; Landis, M.; Warrington, J.; Li, S. Full quantification of left ventricle via deep multitask learning network respecting intra-and inter-task relatedness. In International Conference on Medical Image Computing and Computer-Assisted Intervention; Springer: Cham, Switzerland, 2017; pp. 276–284. [Google Scholar]
  47. Chen, L.C.; Zhu, Y.; Papandreou, G.; Schroff, F.; Adam, H. Encoder-decoder with atrous separable convolution for semantic image segmentation. In Proceedings of the European Conference on Computer Vision (ECCV), Munich, Germany, 8–14 September 2018; pp. 801–818. [Google Scholar]
  48. Chen, L.C.; Papandreou, G.; Schroff, F.; Adam, H. Rethinking atrous convolution for semantic image segmentation. arXiv 2017, arXiv:1706.05587. [Google Scholar]
  49. Ni, Q.; Zhang, L.; Li, L. A Heterogeneous Ensemble Approach for Activity Recognition with Integration of Change Point-Based Data Segmentation. Appl. Sci. 2018, 8, 1695. [Google Scholar] [CrossRef] [Green Version]
  50. Ju, C.; Bibaut, A.; van der Laan, M. The relative performance of ensemble methods with deep convolutional neural networks for image classification. J. Appl. Stat. 2018, 45, 2800–2818. [Google Scholar] [CrossRef]
  51. Christ, P.F.; Ettlinger, F.; Grün, F.; Elshaera, M.E.A.; Lipkova, J.; Schlecht, S.; Ahmaddy, F.; Tatavarty, S.; Bickel, M.; Bilic, P.; et al. Automatic liver and tumor segmentation of CT and MRI volumes using cascaded fully convolutional neural networks. arXiv 2017, arXiv:1702.05970. [Google Scholar]
  52. Badrinarayanan, V.; Kendall, A.; Cipolla, R. Segnet: A deep convolutional encoder-decoder architecture for image segmentation. IEEE Trans. Pattern Anal. Mach. Intell. 2017, 39, 2481–2495. [Google Scholar] [CrossRef]
  53. He, K.; Zhang, X.; Ren, S.; Sun, J. Deep residual learning for image recognition. In Proceedings of the IEEE Conference on Computer Vision and Pattern Recognition, Honolulu, HI, USA, 21–26 July 2017; pp. 770–778. [Google Scholar]
  54. Ronneberger, O.; Fischer, P.; Brox, T. U-net: Convolutional networks for biomedical image segmentation. In International Conference on Medical Image Computing and Computer-Assisted Intervention; Springer: Cham, Switzerland, 2015; pp. 234–241. [Google Scholar]
  55. Oktay, O.; Schlemper, J.; Folgoc, L.L.; Lee, M.; Heinrich, M.; Misawa, K.; Mori, K.; McDonagh, S.; Hammerla, N.Y.; Kainz, B.; et al. Attention u-net: Learning where to look for the pancreas. arXiv 2018, arXiv:1804.03999. [Google Scholar]
  56. Larsson, G.; Maire, M.; Shakhnarovich, G. Fractalnet: Ultra-deep neural networks without residuals. arXiv 2016, arXiv:1605.07648. [Google Scholar]
  57. Lalande, A.; Chen, Z.; Decourselle, T.; Qayyum, A.; Pommier, T.; Lorgis, L.; de la Rosa, E.; Cochet, A.; Cottin, Y.; Ginhac, D.; et al. Emidec: A database usable for the automatic evaluation of myocardial infarction from delayed-enhancement cardiac MRI. Data 2020, 5, 89. [Google Scholar] [CrossRef]
  58. Liu, Y.; Wang, W.; Wang, K.; Ye, C.; Luo, G. An automatic cardiac segmentation framework based on multi-sequence MR image. In International Workshop on Statistical Atlases and Computational Models of the Heart; Springer: Cham, Switzerland, 2019; pp. 220–227. [Google Scholar]
Figure 1. The first column shows the raw input slices, the second column shows the contrast enhanced input slices and the third column represents ground truth (GT) masks.
Mathematics 10 00627 g001
Figure 2. (a) Proposed encoder-decoder model integrated with the ASPP module; (b) the ASPP module used in the proposed residual network.
Mathematics 10 00627 g002
Figure 3. (a) Proposed model based on an encoder-decoder integrated with an ASPP module for myocardium segmentation. (b) Residual block used in proposed model.
Mathematics 10 00627 g003
Figure 4. The ensemble module used for myocardium segmentation based on best proposed and existing models. The majority voting scheme is used to obtain the output of proposed and existing models.
Mathematics 10 00627 g004
Figure 5. Dice and Jaccard coefficients based on best proposed and existing algorithms using training dataset.
Mathematics 10 00627 g005
Figure 6. Dice and Jaccard coefficients based different sets of hyperparameters. (a) Proposed models, (b) ResNet model, (c) Unet model, (d) SegNet model, (e) attention U-Net model, (f) FractalNet model.
Mathematics 10 00627 g006aMathematics 10 00627 g006b
Figure 7. Histogram plots of pixel agreement between predicted and ground truth data for all frames of the test cardiac MRI dataset based on best proposed and existing models. (a) SegNet, (b) ProposedM1, (c) ProposedM3, (d) ProposedM4, (e) FractalM1, (f) FractalM3, (g) FractalM4, (h) Ensemble.
Mathematics 10 00627 g007
Figure 8. Bland Altman plot using proposed, existing and ensemble models. (a) SegNet model, (b) ProposedM1, (c) ProposedM3, (d) ProposedM4, (e) FractalM1, (f) FractalM3, (g) FractalM4, (h) Ensemble.
Mathematics 10 00627 g008aMathematics 10 00627 g008b
Figure 9. Correlation Coefficient values of 20 frames of test patient data based on best proposed and existing models.
Mathematics 10 00627 g009
Figure 10. Pixel agreement between actual and predicted masks for 20 frames of test patient data using the best proposed and existing models. PM1 denoted as proposedM1, PM3 denoted as prposedM3 and PM4 denoted as proposedM4. Similarly, FM1, FM3 and FM4 denoted as FractalNetM1, FractalNetM3 and FractalNetM4.
Mathematics 10 00627 g010
Figure 11. Training and validation loss curves for different datasets using the proposed model. (a) Proposed model curves for the Xue dataset. (b) Proposed model curves for the Alain dataset. (c) Proposed model curves for the Liu dataset.
Mathematics 10 00627 g011aMathematics 10 00627 g011b
Figure 12. The first row represents ground truth images and the second row predicted masks based on best SegNet model.
Mathematics 10 00627 g012
Figure 13. The first row represents ground truth images and the second, third, fourth rows represent predicted mask based on proposed model1, model3 and model4, respectively.
Mathematics 10 00627 g013
Figure 14. The first row represents as ground truth images and second row represents predicted masks based on the best ensemble model.
Mathematics 10 00627 g014
Figure 15. The first row represents ground truth images and second, third, fourth rows represent predicted masks based on FractalNet model1, FractalNet model3 and FractalNet model4, respectively.
Mathematics 10 00627 g015
Table 1. The Performance metrics based on prevailing and proposed models on test dataset.
ModelsDCJCHd95HDSpecificitySensitivityVOEASSDRVD
SegNetM381.0069.108.522713.686798.6384.870.30892.54840.1201
FractalNetM481.9571.719.072116.354498.7289.720.28282.49740.3443
ProposedM485.4375.936.170210.014299.1485.510.24061.78230.0141
FractalNetM383.6373.8813.193820.202499.0483.180.26112.97400.0169
ProposedM384.9674.7811.391524.469298.9787.480.25212.39370.0795
FactalNetM181.9171.389.245330.490198.6085.920.28612.804430.1231
ProposedM182.5171.8011.475226.90598.7687.220.28192.73590.1746
Ensemble Model84.9975.175.678212.678197.9990.780.27901.89320.0674
The last line in bold shows the best results.
Table 2. Hyperparameters Employed in Proposed and Recent Deep Learning Models.
HyperparametersProposed ModelSegNet [52]ResNet [53]Unet-Base [54]Attention with Unet [55]FractalNet [56]
Learning rate3 × 10−4, 1 × 10⁻⁴, 2 × 10⁻⁴, 1 × 10⁻⁴-----
OptimizersAdam-----
Batch size8, 12, 16, 20-----
Number of epochs100, 200, 300, 500-----
Table 3. Comparison of proposed model with other publicly available datasets.
DatasetsDCJCHd95HD
Xue et al. [45]84.9975.175.678212.6781
Alain et al. [57]79.6772.098.3310.33
Liu et al. [58]78.3370.018.3414.22
Table 4. Trainable parameters and number of flops for optimization of proposed model with different hyperparameters.
ModelsTrainable ParametersNumber of Flops
Model127,889,221334,516,681
Model227,414,339333,277,610
Model327,228,939337,723,411
Model427,907,333337,612,235
Model527,221,797332,236,130
Model627,698,773332,112,244
Model727,896,532338,333,759
Publisher’s Note: MDPI stays neutral with regard to jurisdictional claims in published maps and institutional affiliations.

