Abstract
Over the last few decades, public programs have driven the gradual adoption of information and communication technologies (ICTs) in education. The most ambitious project in Spain so far was Escuela 2.0, which provided students from the regions that opted into the program with laptops. The objective of this paper is to evaluate the impact of this program on school performance and productivity. To do this, we developed a new methodological approach based on combining causal inference techniques and the analysis of production frontiers. We calculated the differences in productivity and performance between treated and control schools using the base-group Camanho–Dyson Malmquist index and the base-group performance gap index. We estimate the impact of the program as the variation of these differences, following the essence of the difference-in-differences analysis. The main results are that Escuela 2.0 had a negative impact on performance and productivity.
1. Introduction
Over the last two decades, different authors have analyzed the impact on student outcomes of introducing information and communication technologies (ICT) in the classroom [1,2,3]. The mainstream approaches for performing this evaluation are econometrics and causal inference, including regression models [4], randomized controlled trials [5], regression discontinuity designs [6], difference in differences (DiD) [7] or instrumental variables [8]. However, no conclusive empirical evidence has been found on the impact of these programs on student outcomes.
For example, ref. [9] found that a computer-based mathematics learning program in India effectively raised the grades of participating students, while [5] noted the positive impact of a computer-based instruction program on mathematics outcomes. In the same vein, ref. [10] reported that executing a computer-based instruction program in a primary school in Guayaquil successfully raised mathematics, but not literature, scores. Likewise, ref. [8] found that increased investment in ICT in primary schools in England positively impacted performance in English and science, but not in mathematics. In contrast, other studies have not found that the introduction of ICT in the classroom has any significant effects on increased funding to subsidize ICT implementation in US school districts [11] or on schools that benefited from programs to purchase computers and software [6]. Indeed, ref. [12] analyzed the impact of the Plan Ceibal, one of the largest ICT programs in Uruguay, and concluded that it had no effect on mathematics and reading scores 2 years after its implementation. Some papers, such as [4] or [7], even show a potential adverse effect of ICT. Furthermore, ref. [3] analyzed the impact of a one laptop per child program introduced by the Catalan government on student achievement and found that this program had a negative impact on student performance in Catalan, Spanish, English, and mathematics. They also found that it had an even stronger impact on boys than girls. There are diverse reasons why these types of programs have no (or negative) effects on student outcomes, but we can highlight the lack of provision of training programs for teachers, the fact that the laptops might have been used primarily for internet searches, or the failure by teachers to incorporate the technology into the curriculum.
The doubts about the actual effects of ICT on education are even more significant if we consider that ICT programs have continuously changed over the last decade. In the beginning, ICT programs in schools applied a computer classroom model. This model concentrated technological resources at a single location in the school outside of the student’s usual learning space. However, different programs worldwide began to adopt technologies based on the “1-to-1” or “one laptop per child” model in the first decade of the 21st century. These new modalities aimed to give students access to technology in their everyday learning environment and facilitate its assimilation in teaching practice [13].
As most public educational policies are implemented at schools, another recent research line sets out to measure the impact of an intervention directly on the efficiency or productivity of schools using nonparametric frontier approaches (for a review see [14]). Data envelopment analysis (DEA)-based techniques and Malmquist-related indices are widely used in the measurement of technical efficiency [15] and productivity changes in education [16]. The reason is that DEA is very flexible. With just few assumptions about the production technology, like weak disposability and convexity, it is capable of handling multiple inputs and outputs to draw the production frontier and estimate the efficiency levels or the productivity change indexes of a set of decision-making units.
Taking all this into account, the aim of this paper is twofold. First, it contributes to this recent literature by analyzing the impact of the most ambitious ICT program developed in Spain over the last few decades: Escuela 2.0. This project was the first educational policy in Spain to employ the “one laptop per child” model, providing primary (fifth- and sixth-grade) and later secondary (seventh- and eighth-grade) school pupils with technological resources. We were able to evaluate this program because the policy was co-funded by Spain’s national and regional governments. Regional governments were given the choice of whether to opt in or out of the program. To perform this evaluation, we use data from the 2009 and 2015 Program for International Student Assessment (PISA) reports. In 2009, Escuela 2.0 had not started, whereas the pupils assessed in PISA 2015 should potentially have benefited from the program.
Second, we apply an original approach to evaluate a public policy, consisting of combining insights from production frontiers and difference-in-differences (DiD) analysis. This approach tries to respond to situations where several cross-sections of DMUs representing a population are available. To this end, we use the base-group Camanho–Dyson Malmquist index (CDMI) proposed by [17] to measure differences in productivity across schools, and the base-group performance gap index (PGI) developed by Aparicio et al. (2020) [18] for differences in performance. Then, we measure the impact of the intervention as the change in productivity and performance gaps measured before and after the program between treated and control DMUs as in the DiD framework.
To achieve the two goals, the paper is organized as follows. Section 2 provides an overview of the methodology and discusses how our estimation strategy combines production frontiers and DiD. Section 3 explains the main features of the Escuela 2.0 one laptop per child program developed in Spain and describes the data and variables from the PISA 2009 and 2015 waves used in the empirical analysis. Section 4 reports the results. Finally, the paper ends with some conclusions and directions for further research.
2. Materials and Methods
In this section, we introduce the notation and the base-group Camanho–Dyson Malmquist index (CDMI) and performance (PGI) gaps for measuring the productivity of two or more groups of DMUs introduced by [17,18] respectively. These theoretical grounds will be applied later to measure the impact of the Escuela 2.0 program on schools’ performance and productivity results under this framework. The main goal of the program Escuela 2.0 was to integrate ICT in schools, fostering the use of one laptop per child. This objective implies a greater endowment of resources to schools, so it can be expected that the academic performance of students and the use of computers will improve. Therefore, we understand school productivity as making the best possible use of the public resources available for achieving the best educational outcomes in terms of academic performance, acquisition of new skills, etc.
Following the theoretical definition of educational production function originally proposed by [19,20], suppose that we are interested in analyzing the production performance of two groups of DMUs considering a multi-output multi-input setting. Let A and B be these two groups of schools and consider N schools in group A, and M schools in group B, . Schools use a vector of inputs to produce a vector of outputs . For example, for DMUs in group A, a feasible production technology can be defined as , which is assumed to satisfy the set of axioms detailed in [21].
Within this scenario, the input–output information for two DMUs, j and i, operating in groups A and B can be represented as and , respectively. We can define the Shephard output distance function for school j in group A to the frontier technology of group B, as , where is the efficiency score for the evaluated unit j in group A. Based on the reciprocal value of the Shephard output distance function, for example, , we find that the DMU j can equi-proportionately expand the production of all its outputs by 15% with a constant input vector to reach the production frontier defined by DMUs in group B. A value equal to one indicates that the DMU is efficient, because it lies on the production boundary.
Although the output distance function to the production technology can be estimated in different ways, we resort in this paper to the well-known DEA under constant returns to scale (CRS), originally proposed by [22], where is the production technology for a set of production units belonging to group A operating in period t, and are the weights for identifying the best performers in group A in order to draw the production frontier.
2.1. The Camanho and Dyson Malmquist Index (CDMI)
The Malmquist index was proposed by [23] with the aim of measuring the total factor productivity changes between a set of DMUs in two time periods as the ratio of the distances of each DMU relative to a common frontier. Following [24], the index may be built and decomposed using different DEA programs to compute different distances between the evaluated production unit and the frontier for each period. The output-oriented Malmquist productivity index for a group of DMUs observed in two time periods and under CRS technology is defined as follows:
A Malmquist index higher (lower) than one implies productivity gains (losses) from period t to period t + 1. The first ratio in Equation (1) measures the efficiency change (EC). When EC > 1 (EC < 1), the value captures the efficiency improvements (cutbacks) in period t + 1 with respect to period t. The second component in square brackets in Equation (1) denotes the technological change (TC) in period t + 1 with respect to period t. This value may be analyzed in a similar way to EC, where TC > 1 (TC < 1) now represents technological progress (regress), whereas TC = 1 indicates that there are no technical changes in the two periods.
Ana Camanho and Robert Dyson [25] originally adapted the Malmquist index to compare the performance of two groups of DMUs operating under different conditions in one and the same period. Briefly, Camanho and Dyson [25] set out to replace the superscripts t and t + 1 related to the periods in Equation (1) by the geometric means related to the distance functions of DMUs in groups A and B to be compared. Formally, the original CDMI [25] designed to measure the performance gap and its components between the groups A and B in one time period t can be defined as:
where is the geometric average distance of the N DMUs in group A relative to the technology of group B. The CDMI is sound and easy to interpret; a value higher than one indicates better average performance in group A than in group B, whereas the opposite holds when the index is lower than one. Like the Malmquist index, the CDMI can be decomposed into two parts (Equation (2)). On one hand, the compares average technical efficiencies within the two groups and measures the efficiency gap between both groups. On the other hand, the component evaluates the productivity gap between the two production frontiers drawn by DMUs in A and B. Both components interpret the CDMI in the same way, with values greater than one indicating better efficiency or technology in group A than in group B. As we said above, if we replace A and B by t + 1 and t then Equation (2) is very similar to Equation (1).
The CDMI is appealing. Indeed, it has been very often applied throughout the literature to address empirical problems. For example, it has been used to compare the performance of airports from different continents [26], hospitals managed by different types of ownerships [27], different public and private universities [28], retail stores within homogenous groups of supermarkets and hypermarkets [29], or the quality of life in cities that gained and lost population [30], among others. However, the CDMI has a major drawback because it does not satisfy the circularity property for more than two groups. This means that with three groups of DMUs, .
2.2. Base-Group Indexes for Comparing Productivity and Performance Gaps
To overcome this problem with the CDMI, [17] introduced a new base-group Camanho–Dyson Malmquist index based on previous work by [31] who showed that a base-period Malmquist index fulfils the circular relation. This idea can be developed as follows. Suppose that we want to evaluate the performance of two groups of DMUs, A and B. We also observe a third group of DMUs belonging to a base or reference group R. The base-group Camanho–Dyson Malmquist index for comparing the difference in productivity between groups A and B in a single time period t with respect to a reference group R is defined as:
This interpretation of is straightforward: a means that the average productivity of DMUs in group A is greater than the average productivity in group B. As in Equation (2), the can be decomposed into two subcomponents:
While the first components on the right-hand side of Equations (2) and (4) measure the efficiency gap, the second terms compare the production technologies in A and B. However, the technology gap measured in Equation (4) satisfies the circularity property with more than two groups, as well as the .
In order to briefly illustrate , suppose that we have an output-oriented production set with two outputs and one input.
Figure 1
shows three production frontiers defined as FF’, GG’, and HH’ for DMUs in groups A, B and the reference group R, respectively. Distances and represent the numerator and denominator in Equation (3), where the ratio is the productivity gap between both groups. The productivity gap can be defined by the distances between each group, its own frontiers, and the reference group frontier. The efficiency gap is represented in
Figure 1
by the distances AA’ and BB’. Finally, the technology gap accounts for how far apart the two production frontiers of the groups under evaluation are on average. This distance is illustrated in
Figure 1
as the product of distances and .
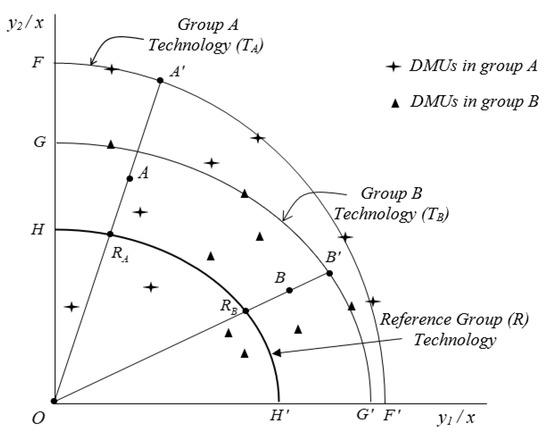
Figure 1.
The base-group Camanho–Dyson Malmquist Index in a two-output one-input setting.
Based on these insights, [18] developed the base-group performance gap index to analyze differences in the performance dimension, i.e., on the output side irrespective of the input quantities managed by DMUs. The calculus is similar to Equation (3). In this case, however, we replace the input vector by a single input equal to one for all DMUs.
Juan Aparicio, Sergio Perelman and Daniel Santín [18] demonstrate that can be decomposed into two terms: the efectiveness gap and the outcome possibility set gap (.
2.3. Measuring Productivity and Performance Changes over Time through a DiD Framework
An appealing factor of this methodology based on measuring productivity differences among groups of DMUs in one period is that it can be easily adapted to incorporate a DiD analysis, using mean productivity and performance scores as dependent variables. The DiD approach estimates the impact of an intervention or policy change, the so-called treatment, by comparing the average outcomes of the treated and control groups both before and after the treatment.
Although this methodology is widely used in econometrics for evaluating educational reforms [32,33], some recent papers have proposed combining DiD with production frontiers to evaluate efficiency changes caused by different policies. For example, [34] employed a DiD specification to examine whether the certification had an impact on hospital efficiency in Germany. Likewise, [35] used a DiD analysis to evaluate the impact of merging the Swedish district courts on their technical efficiency. Finally, [36] combine DEA and DiD to evaluate the efficiency of energy reforms in 48 countries.
Therefore, the combination of frontier techniques and DiD is a natural extension for disentangling how school reforms or changes in the legal framework affect the productivity of the treated and control schools [16,37]. This is an expanding research line that, broadly speaking, combines the results of efficiency and productivity analysis with causal inference techniques for analyzing the impact of public policies. For a recent systematic review of this literature that introduces this issue, see [14].
In this paper, we combine the and the DiD to measure the impact of an intervention on productivity gaps as follows. In the simplest scenario, we have only two periods, the pre-intervention and the post-intervention periods, and two groups, the treated and the control groups. Let us change the notation slightly to replace A and B by T and C to denote the treated (T) and the control (C) school groups, while t and t + 1 are the periods before and after the treatment, respectively. In this case, we have two productivity gaps measured in two time periods, before and after the intervention. According to Equation (4), represents the first difference measured between the two evaluated groups of DMUs, T and C, before the intervention, while interprets the second difference between the two groups after the intervention. Based on these two components, the pseudo-panel Malmquist index proposed by [17] is, in this context, the DiD productivity gap index.
Equation (7) measures how productivity differences and their components evolved over time, that is, before and after the intervention. In order to interpret the PPMI, it is necessary to analyze its value, but also the values of its components, and , as follows. If and are both greater (less) than one in both periods, a means that the treated group has improved its productivity with respect to the control group. For example, a means that the treated group is 10% relatively more productive than the control group. If , the productivity of the treated group dropped with respect to the control group, where indicates the percentage by which the relative performance of the treated group has declined.
When and , then , the performance of the control group improved with respect to the treated group. Finally, when and , then , the productivity of the treated group improved from period t to period t+1, and the value of the PPMI signals by how much the relative performance gap between the treated and the control group grew over time.
Finally, the performance gap index change, introduced by [18] can be defined as follows:
where the ; as well the effectiveness gap change, ; and the outcome possibility set gap change, , are interpreted in the same way as the analogous terms in Equation (7), albeit taking into account only the output dimension in the calculus of the distances to the production frontier.
In summary, [16] initially suggested relating the DiD technique to a metafrontier framework. However, the PPMI and the PGIC, which are calculated using a reference technology, also correspond to DiD measures, adapted to the production frontier framework. Therefore, they constitute an alternative approach for evaluating educational programs. We consider that this approach has two main advantages. First, this technique facilitates the evaluation of programs developed at school level, simultaneously accounting for different inputs and outputs managed by schools. Second, the use of production frontiers in the analysis allows us to observe the total effect of the program and disentangle what part of the impact is due to changes in the technology or to the internal effectiveness/efficiency caused by the treatment.
This methodology takes us back to the original idea for evaluating public policies contained in [38], where the aim of using production frontiers is that “differences in decision making efficiency need to be allowed for since, evidently, a ‘good program’ may be ‘badly managed,’ and vice versa, so that one needs some way of identifying this possible source of contamination in arriving at a ‘program’ evaluation”.
In the following sections, we use this methodology to evaluate the performance and productivity differences caused by an educational program in Spain.
3. Research Design
3.1. One Laptop per Child (Escuela 2.0)
Escuela 2.0 was an ambitious program linked to Plan-E, a Keynesian public expenditure policy promoted by the Spanish socialist government led by Prime Minister José Luis Rodríguez Zapatero in 2009. The program was approved by the Spanish Royal Decree-Law 8/2009, June 12. According to the Spanish Government, the cost of this program was around 200 million euros for the first academic year (2009–2010). The program was co-funded by the central state and the regional governments that decided to participate. In round numbers, 200 million euros by three academic years mean a total cost of around 600 million euros. More details (in Spanish) officially published by the Government of Spain about the program can be found in https://www.lamoncloa.gob.es/Paginas/archivo/040409-enlace20.aspx (accessed on 15 September 2021) to reactivate the economy. It was the first educational policy in Spain to adopt the one laptop per child model [13]. According to [39], Escuela 2.0 constituted “a Spanish commitment aimed at facilitating, on a massive scale, access to ICT to all pupils and encouraging teachers to integrate them pedagogically into their classroom practice”. However, the change of government at the end of 2011, together with budget cuts due to the high public deficit during the global crisis, spelled the end of this program in 2012.
Initially, the program targeted fifth- and sixth-grade primary school students and was then to be extended to other grades, such as the first- and second-year secondary education pupils. The funded activities had four major goals: (1) transform fifth- and sixth-grade public primary school and first- and second-year public secondary school classrooms into digital classrooms; (2) provide fifth- and sixth-grade primary and first- and second-year secondary students with laptops for personal use according to a 1-to-1 ratio; (3) carry out teacher training actions to ensure the effective use of the resources included in the program, and (4) develop digital educational contents that teachers could use.
Escuela 2.0 was not deployed by all Spanish regions, the so-called Autonomous Communities, since the regional governments had the last say on whether to opt in or out of the program. As a result, we can consider that the program generated a quasi-experiment, where there was a set of treated schools and control schools. Spanish regions that did not implement the program were the Community of Madrid and the Valencian Community, mainly due to political differences with the central government.
At the beginning of Escuela 2.0 in the 2009–10 school year, no students tested in PISA 2009 had been treated. Therefore, we selected this year as our ‘before’ period. The next year available for analysis is the PISA 2012 wave. However, most non-repeating students, which account for the majority of the PISA 2012 sample, had not had the opportunity to participate in Escuela 2.0 by then. In contrast, non-repeaters tested in PISA 2015 had participated more actively in the program and for longer time period, as had repeaters. For this reason, we chose PISA 2015 as our ‘after’ period to evaluate the implementation of Escuela 2.0, as the students in this cohort had more intensive exposure to the program. A first rigorous evaluation of Escuela 2.0 using a DiD econometric approach with students in PISA 2012 exposed to the program, most of them repeaters, was conducted by [7]. In general terms, their results are coincident with the conclusions obtained in this paper with non-repeater students.
For the evaluation, we selected only those Spanish regions with an extended representative sample of their schools in PISA 2009 and PISA 2015. Of the regions that did not apply Escuela 2.0, the only one that meets this requirement is the Community of Madrid, which thus constitutes the control group for our analysis. In order to facilitate the discussion, we chose the Spanish regions that implemented Escuela 2.0 where we observed a significant increase in the provision of technological resources in public primary and secondary schools: Andalusia, Asturias, the Balearic Islands, Galicia, and the Basque Country.
In this sense, Figure 2 and Figure 3 show that, in contrast to the stagnation in Madrid, these regions experienced significant increases in the average number of computers used for teaching per student in both educational stages.
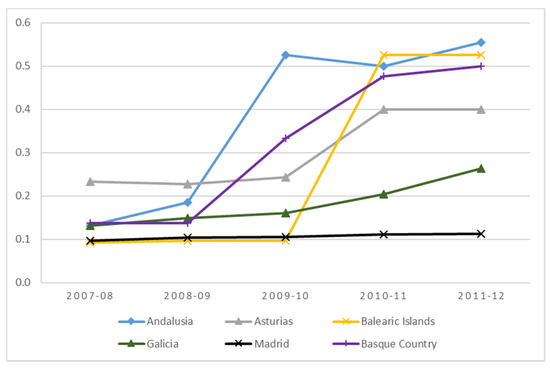
Figure 2.
Average number of computers used for teaching per student in public primary schools in regions participating in Escuela 2.0 compared to Madrid.
Source: Own elaboration based on data from the Spanish Ministry of Education.
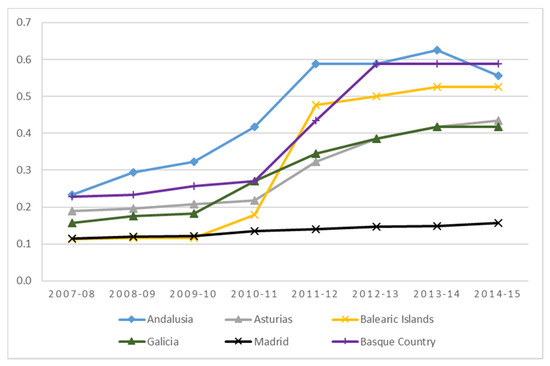
Figure 3.
Evolution of the average number of computers used for teaching per student in public secondary schools in regions participating in Escuela 2.0 compared to Madrid.
Source: Own elaboration based on data from the Spanish Ministry of Education.
3.2. Data and Variables
As mentioned above, we use data collected by PISA for 2009 and 2015. PISA aims to assess the extent to which 15-year-old students have acquired the knowledge and skills needed to function in society [40]. This database also collects information on student socio-educational background and school resources from the responses to two questionnaires completed by students and principals. Our analysis is confined to public schools in the regions selected for the analysis. In this sense, we need to choose a group of DMUs as a reference technology to ensure circularity in the calculation of the base-group CDMI and PGI indices [18]. Although there is no fixed rule for selecting such a group, we, like the authors of the abovementioned paper, opted to choose a group of schools not included in the study, the public schools of Castile-La Mancha participating in PISA 2015. This region was not included in our analysis because it did not have an extended sample in PISA in 2009. Using a similar methodological approach with directional distance functions, Aparicio et al (2020) [18] show that the price for gaining circularity is paid with the base technology dependence. This means that although efficiency and effectiveness gaps coincide regardless the reference, measures of technology gap and the outcomes possibility sets gap would be slightly different depending on the reference. However, the robustness check made in this paper with two different references shows that correlations between the same measures vary between 0.9402 and 0.9883.
According to the literature, we selected two inputs and three outputs required for measuring school productivity. Regarding the choice of outputs, note that ICT implementation programs in the educational environment pursue two main objectives: computer literacy training and computer-assisted teaching of skills not necessarily related to technology [4,7]. For these reasons, we consider two types of outputs for the evaluation of Escuela 2.0: educational outcomes and computer use. For educational competencies, we use the average test scores of schools in mathematics and reading. Moreover, we also measure the possible impact of Escuela 2.0 on technological skills through the use of computers by students for school activities in the classroom and at home. To do so, we create a new variable based on student responses about the frequency with which they use computers for different tasks, which we call ‘computer use’. This variable is calculated at school level as the average values of 15 items related to students’ use of computers for school activities at school or home, such as the frequency of e-mail use, surfing the Internet for homework, doing homework on school computers, etc. The minimum value for frequency of use items is 1 (never or almost never), and the maximum is 4 (every day or almost every day).
Table 1 shows a general increase in the results for both academic subjects from 2009 to 2015, except in the case of the Basque Country, where reading scores decreased. Table 1 also highlights a general increase in average computer skills in all regions, including Madrid where, even in the absence of program implementation, there appears to have been a widespread increase in the use of computers.

Table 1.
School sample and average PISA scores in mathematics, reading, and computer skills by year and region.
As inputs we include the average family background, which is regarded as the raw material for producing education [41]. We proxy this variable with PARED, an index included in PISA for capturing the highest level of parental education, measured by the number of years of schooling according to the International Standard Classification of Education (ISCED) [42]. As education is a labor-intensive public production service, we approximate school resources using the teacher/student ratio (STRATIO), defined as the number of teachers per hundred students. The ratio is built as the total number of teachers weighted by their working hours (part-time teachers contribute 0.5 and full-time teachers 1) to the total number of pupils and multiplied by 100. Table 2 summarizes the input variables.
Table 2.
Mean and standard deviation of STRATIO and PARED inputs in public schools by year and region.
On one hand, Table 2 shows how the average STRATIO values decrease from 2009 to 2015 in all the regions selected for the study. This generalized decrease is explained by the budget deficit caused by the global economic crisis over the period. The need to maintain a balanced budget led to the introduction of different reforms to limit public spending. Although cutbacks arrived in different ways, one of the educational policies that might have had a significant impact on figures in Table 2 was the Royal Decree-Law 14/2012 of 20 April on urgent measures to rationalize public spending in education approved in 2012. Basically, this law allowed to increase the maximum number of students by up to 20%. On the other hand, it should be noted that the PARED means increased in all regions, especially in the Community of Madrid (+5.92%) or Galicia (+6.84%). Table 3 summarizes the variables used in this paper.
Table 3.
Inputs and outputs from PISA included in the analysis. Student average at school level.
In Section 4, we measure the potential impact of Escuela 2.0 based on the indexes explained in Section 2, using the inputs and outputs mentioned in
Section 3 for their calculation. In this sense, we first estimate the performance gap index change () and the pseudo-panel Malmquist index () of the regions that implemented the program with respect to the control unit (Madrid) to evaluate the effects on performance and productivity, respectively. Likewise, we use the decomposition of the respective indexes to analyze whether the evolution of the differences in performance and productivity are due to changes in the technological frontier of the region’s schools ( and ) or to the improvement/worsening of the internal effectiveness/efficiency of the group ( and ).
4. Results and Discussion
Using the methodology explained in Section 2, we seek to evaluate the evolution of productivity and performance gaps between regions that did and did not generally increase the use of ICT in the classroom thanks to Escuela 2.0.
4.1. Performance Gap and Decomposition
Table 4 and Table 5 show the results of the evolution of the performance of the schools in each region that applied Escuela 2.0 with respect to Madrid. Table 4 shows the differences in performance using the PGI between the treated and control regions, as well as its decomposition into EfG and technology frontier gap (OPSG) for the two considered waves, 2009 and 2015. Firstly, we found that in 2009, before the implementation of Escuela 2.0, there were regions whose schools operated with a slightly higher or lower performance than educational institutions in Madrid. While the performance of regions like Asturias (+2.6%) and the Basque Country (+3.3%) was higher, with a PGI above one, the performance of others, like the Balearic Islands (−2.2%) and Andalusia (−2.6%), was lower, with a PGI below one, while the average performance results in Galicia (+0.03%) were more or less equal to Madrid’s. However, it is noteworthy that schools in all regions operated with lower performance levels than the control unit in 2015, after the intervention, with PGIs ranging from 0.948 to 0.984. Scores are even below the figures for 2009, which indicates the potentially negative effects of the educational program.
Table 4.
PGI scores and decomposition.
Table 5.
PGIC and its decomposition into effectiveness gap change and outcome possibility gap change over the period 2009–2015.
Table 5 reports the PGIC used to compare the changes in the level of performance between schools in the regions that implemented Escuela 2.0 with respect to the control region of Madrid and infers the impact of the program. The PGICs are reported together with their respective decompositions into EfGC and OPSGC, which we use to disentangle how the program influenced performance. In general terms, a value lower than one in PGICs for all regions shows that Escuela 2.0 may reduce the performance levels of the regions where it was applied. The PGICs calculated show that the relative performance of schools dropped by 2.7% in Andalusia, 3.2% in Asturias, 1.9% in Galicia, and 6.4% in the Basque Country compared to Madrid, where the Balearic Islands was the only region with an index close to 1 (0.997).
Regarding the possible channels through which the program could modify the relative performance of the regions with respect to Madrid, there are two possible explanations: the OPSGC and the EfGC. Table 5 reports that all the regions register an OPSGC of less than 1, except the Balearic Islands, which registered a relative improvement in its outcome possibility set gap with respect to Madrid of 2.3%. In any case, we find that the main reason for the drop in performance was the relative decline in the regional production frontiers compared to Madrid. This decline was particularly significant in the Basque Country, where the outcome possibility set gap fell by 4.8%.
On the other hand, the results of the EfGC show that, except in Galicia, regions register an EfGC of less than 1, which would indicate a worsening of the effectiveness gap with respect to Madrid. In summary, the program’s poor performance is mainly reflected in regions like the Basque Country, Asturias, and Andalusia, where there is a joint negative evolution of both OPSGCs and EfGCs, which are the two possible channels whereby an intervention can have an impact on performance. Regarding the outputs only, Escuela 2.0 brings about a slight decline in school performance results of around 2% on average.
4.2. Productivity Gap and Decomposition
After analyzing the impact on school performance considering only the output dimension, we should look at the possible effects on productivity also taking into account the inputs used in the educational production process. As described in
Section 3, we use the average socioeconomic level and the number of teachers per 100 students by school as inputs for the productivity calculations.
In this regard, Table 6 reports the productivity differences between the treated regions and Madrid using the base-group CDMI and its respective decomposition into EG and TG. Analogously to performance in 2009, there were regions with schools operating at both higher and lower levels of productivity than schools in Madrid. For example, the CDMIs show that schools in Andalusia (+13.2%) and Galicia (+2.2%) were more productive than Madrid, as opposed to Asturias (−2.3%) and the Basque Country (−5.8%), where CDMIs were less than 1, with productivity differences in the Balearic Islands (+0.03%) being negligible. However, all treated schools operated with a significantly lower productivity than educational institutions in the control unit in 2015, with CDMIs below 1 in all regions.
Table 6.
Base-group CDMI productivity scores and decomposition.
The PPMI is used as a DiD estimator to measure productivity changes that occurred before and after the program in order to infer the program’s effect. Table 7 reports PPMIs together with their respective decompositions into efficiency gap change (EGC) and technology gap change (TGC), which we use to study the channels whereby the program impacts productivity.
Table 7.
Pseudo-panel Malmquist index for productivity and its decomposition.
The PPMIs unequivocally reflect a sizeable decline in the productivity levels of all regions applying Escuela 2.0 compared to Madrid with all PPMIs less than 1. For example, the PPMIs reflect a double-digit decline of the relative productivity of 13.3% in Andalusia, 11.5% in Asturias, 11.0% in the Balearic Islands, 15.3% in Galicia, and 15.1% in the Basque Country compared to Madrid.
Regarding the potential channels whereby the program could change relative productivity, as with the performance, there are two possible explanations: the TGC and EGC. Firstly, the EGC ranges from 0.961 to 1.022, where the average is almost equal to 1. Secondly, all regional TGCs were less than 1. In almost all the cases, the TGCs are even lower than 0.9, which means that the educational production technology of schools in all regions dropped by more than 10%, and on average by 13.1%, with respect to Madrid. This indicates that the main reason for the fall in the relative productivity of the regions that applied Escuela 2.0 with respect to Madrid was the comparative contraction of their technological frontiers.
The program’s poor performance as inferred from the results of our analysis may be due to several factors. Firstly, it should be noted that Escuela 2.0 was very short-lived and might not have been fully implemented due to its premature cancellation as a result of the global financial crisis [43]. Therefore, this obstacle may have prevented the correct assimilation of ICT in the classroom and a real change in teachers’ teaching methods. Another factor that could explain the poor results is the possibility that the planning of Escuela 2.0 fell into what is known as “technological determinism or utopianism” by assuming that the mere provision of a large number of technologies would produce immediate improvements in teaching [44]. In this sense, its link with Plan-E may have meant that the program focused on laptop procurement, with less expenditure on promoting pedagogical innovation with this new technological equipment. In this regard, it is worth noting the work by [45] about the attitudes and practices of teachers in relation to Escuela 2.0. These authors found that, even if 62% of teachers supported this kind of policy, the majority of teachers (two thirds of the sample) did no integrate technologies or they did it in a wrong way.
5. Conclusions
This paper has shown the potential of combining causal inference techniques and production frontier analysis to evaluate educational programs. In this sense, this new approach may be helpful for evaluating the performance and productivity of schools that implement new programs, such as Escuela 2.0. The first advantage of this approach is to perform a joint analysis of interventions capable of modifying different outputs, in this case mathematics, reading, and computer use, while controlling inputs’ levels. Secondly, the analysis makes it possible to disentangle whether changes in performance and productivity are driven by variations in the treated regions’ internal efficiency/effectiveness or by the production technologies with respect to the control region (Madrid).
Regarding the possible effects of Escuela 2.0, the results described in Section 4 show that the program had a negative impact in terms of performance and productivity. Results point out that there was a slight simultaneous fall, by on average 2.9%, in the relative performance across all regions compared to Madrid. Based on this result, it can be inferred that school performance may have had a modest decrease in terms of both vehicular educational competencies and computer use due to Escuela 2.0, regardless of the input side.
However, the most striking result is that productivity dropped in double digits, 13.3% on average, in all regions that applied Escuela 2.0 with respect to Madrid. Most of this loss in school productivity is due to technology changes, implying that public schools in Madrid raised their production frontier compared with the treated regions.
As already mentioned, a generalized negative effect was observed across all the regions that implemented the program, and the sharpness of the decline depended on each case. The Basque Country was the region with the largest drop in performance and productivity of its public schools compared to Madrid, whereas decreases in other regions such as the Balearic Islands and Asturias were relatively smaller. For this reason, the institutional factors in each region, such as teachers’ conceptions and attitudes, should be taken into account, as they may influence the adoption of ICT-related pedagogical innovations.
Although our evaluation of Escuela 2.0 proves a potential negative impact in terms of performance and productivity, it is important also to remark on the main limitations of this research. Firstly, due to the short duration of the program and to the lack of a representative sample for Madrid previous to 2009, in our analysis we could only use two time periods: 2009 (before) and 2015 (after), to measure changes in productivity and performance in treated and control regions before and after the intervention. More pre-treatment observations for the control and treatment group were desirable to check the common trend assumption before the intervention. Secondly, Madrid constituted the control group for our analysis, so we must be aware of the potential distortions that this could provoke in our results since this region is characterized by its possibility of exploiting greater economies of scale and a less dispersed network of schools.
Regarding the limitations of our methodological approach, we must recall again the relevance of the reference choice. Selecting one group of DMUs or another as the reference technology ensures circularity in the calculation of the base-group CDMI and PGI indices. As we mentioned, there is no fixed rule for selecting such a group, and the indices calculated could change depending on the group of DMUs selected. The price for gaining circularity is paid with reference dependency. For this reason, the results of a research and its conclusions could vary depending on the selection criteria adopted to choose the reference group. In order to overcome the abovementioned limitation and to increase the robustness of the results, one promising research avenue is to calculate confidence intervals for base-group CDMI and PGI indices, using resampling methods such as the bootstrapping procedure.
Finally, based on the results of this study, we can suggest a series of recommendations when implementing educational programs such as Escuela 2.0. Firstly, the evidence obtained in this evaluation follows the line of previous studies that find a non-significant or even negative impact of the implementation of ICT programs in the classroom [3,4,7,11,12]. For this reason, although these programs are very popular among the population, policy makers should consider that their impact could be small compared to their opportunity cost in budgetary terms. Secondly, these programs should be implemented with a broad political and social consensus, as their premature cancellation can be an obstacle to their proper functioning, as in the case of Escuela 2.0 [43]. In addition, governments could avoid falling into “technological determinism or utopianism” by assuming that the mere provision of technological equipment is enough to foster students’ academic outcomes. Among other measures, this endowment should be complemented by educational policy actions that provide resources and training to those teachers holding a positive attitude towards educational technology and information about potential benefits of ICT to those who hold a negative one [45]. Moreover, we should put in a word, from the taxpayer’s viewpoint, for randomized controlled trials run to test the possible impact of an intervention before implementing generalized expensive public programs like Escuela 2.0.
Author Contributions
Conceptualization, D.F., L.L.-T. and D.S.; data curation, D.F.; formal analysis, D.F. and D.S.; funding acquisition, L.L.-T.; investigation, D.F., L.L.-T. and D.S.; methodology, D.S.; software, D.F.; writing—original draft, D.F. and D.S.; writing—review & editing, L.L.-T. All authors have read and agreed to the published version of the manuscript.
Funding
This research was funded by the Region of Madrid (Spain) and University of Alcalá, project ref. CM/JIN/2019-015.
Institutional Review Board Statement
Not applicable.
Informed Consent Statement
Not applicable.
Data Availability Statement
Data used in this paper are publicly available in the OECD website. For PISA 2015: https://www.oecd.org/pisa/data/2015database/ (accessed on 15 October 2021). For PISA 2009: https://www.oecd.org/pisa/data/pisa2009database-downloadabledata.htm (accessed on 15 October 2021).
Conflicts of Interest
The authors declare no conflict of interest. The funders played no role in the design of the study, the data collection, analyses, or interpretation; the writing of the manuscript, or the decision to publish the results.
References
- Gimenez, G.; Vargas-Montoya, L. ICT Use and Successful Learning: The Role of the Stock of Human Capital. Mathematics 2021, 9, 1648. [Google Scholar] [CrossRef]
- Gómez-García, M.; Hossein-Mohand, H.; Trujillo-Torres, J.M.; Hossein-Mohand, H.; Aznar-Díaz, I. Technological factors that influence the mathematics performance of secondary school students. Mathematics 2020, 8, 1935. [Google Scholar] [CrossRef]
- Mora, T.; Escardíbul, J.O.; Di Pietro, G. Computers and students’ achievement: An analysis of the One Laptop per Child program in Catalonia. Int. J. Educ. Res. 2018, 92, 145–157. [Google Scholar] [CrossRef]
- Angrist, J.; Lavy, V. New evidence on classroom computers and pupil learning. Econ. J. 2002, 112, 735–765. [Google Scholar] [CrossRef] [Green Version]
- Barrow, L.; Markman, L.; Rouse, C.E. Technology’s edge: The educational benefits of computer-aided instruction. Am. Econ. J. Econ. Policy 2009, 1, 52–74. [Google Scholar] [CrossRef] [Green Version]
- Leuven, E.; Lindahl, M.; Oosterbeek, H.; Webbink, D. The effect of extra funding for disadvantaged pupils on achievement. Rev. Econ. Stat. 2007, 89, 721–736. [Google Scholar] [CrossRef]
- Jiménez–Martín, S.; Vilaplana, C. Programa Escuela 2.0 a Partir de los Resultados en Matemáticas de PISA 2012; Instituto Nacional de Evaluación Educativa: Madrid, Spian, 2014. Available online: http://www.educacionyfp.gob.es/inee/eu/dam/jcr:a3982af3-75a0-4d65-a422-5642fb757460/pctescuela20sjv2.pdf (accessed on 15 September 2021).
- Machin, S.; McNally, S.; Silva, O. New technology in schools: Is there a payoff? Econ. J. 2007, 117, 1145–1167. [Google Scholar] [CrossRef]
- Banerjee, A.V.; Cole, S.; Duflo, E.; Linden, L. Remedying education: Evidence from two randomized experiments in India. Q. J. Econ. 2007, 122, 1235–1264. [Google Scholar] [CrossRef]
- Carrillo, P.E.; Onofa, M.; Ponce, J. Information Technology and Student Achievement: Evidence from a Randomized Experiment in Ecuador; IADB WP No. 223; Inter-American Development Bank: Washington, DC, USA, 2011. [Google Scholar]
- Goolsbee, A.; Guryan, J. The impact of Internet subsidies in public schools. Rev. Econ. Stat. 2006, 88, 336–347. [Google Scholar] [CrossRef] [Green Version]
- De Melo, G.; Machado, A.; Miranda, A. The Impact of a One Laptop per Child Program on Learning: Evidence from Uruguay; IZA DP No. 8489; IZA: Bonn, Germany, 2014. [Google Scholar]
- Area, M.; Sanabria, A.L. Opiniones, expectativas y valoraciones del profesorado participante en el programa Escuela 2.0 en España. Educar 2014, 50, 15–39. [Google Scholar]
- Mergoni, A.; De Witte, K. Policy evaluation and efficiency: A systematic literature review. Int. Trans. Oper. Res. 2021, in press. [Google Scholar] [CrossRef]
- Farrell, M.J. The measurement of productive efficiency. J. R. Stat. Soc. Ser. A Gen. 1957, 120, 253–290. [Google Scholar] [CrossRef]
- De Witte, K.; López-Torres, L. Efficiency in education: A review of literature and a way forward. J. Oper. Res. Soc. 2017, 68, 339–363. [Google Scholar] [CrossRef]
- Aparicio, J.; Santín, D. A note on measuring group performance over time with pseudo-panels. Eur. J. Oper. Res. 2018, 267, 227–235. [Google Scholar] [CrossRef] [Green Version]
- Aparicio, J.; Perelman, S.; Santín, D. Comparing the evolution of productivity and performance gaps in education systems through DEA: An application to Latin American countries. Oper. Res. Int. J. 2020, in press. [Google Scholar] [CrossRef]
- Levin, H.M. A conceptual framework for accountability in education. Sch. Rev. 1974, 82, 363–391. [Google Scholar] [CrossRef]
- Hanushek, E.A. Conceptual and empirical issues in the estimation of educational production functions. J. Hum. Resour. 1979, 351–388. [Google Scholar] [CrossRef]
- Färe, R.; Primont, D. Multi-Output Production and Duality, Theory and Applications; Kluwer Academic Publishers: Boston, MA, USA, 1995. [Google Scholar]
- Charnes, A.; Cooper, W.W.; Rhodes, E. Measuring the efficiency of decision-making units. Eur. J. Oper. Res. 1978, 2, 429–444. [Google Scholar] [CrossRef]
- Caves, D.W.; Christensen, L.R.; Diewert, W.E. The economic theory of index numbers and the measurement of input, output, and productivity. Econom. J. Econom. Soc. 1982, 50, 1393–1414. [Google Scholar] [CrossRef]
- Färe, R.; Grosskopf, S.; Norris, M.; Zhang, Z. Productivity growth, technical progress, and efficiency change in industrialized countries. Am. Econ. Rev. 1994, 84, 66–83. [Google Scholar]
- Camanho, A.S.; Dyson, R.G. Data envelopment analysis and Malmquist indices for measuring group performance. J. Product. Anal. 2006, 26, 35–49. [Google Scholar] [CrossRef]
- Cunha-Ferreira, D.; Cunha-Marques, R.; Pedro, M.I. Comparing efficiency of holding business model and individual management model of airports. J. Air Transp. Manag. 2016, 57, 168–183. [Google Scholar] [CrossRef]
- Ferreira, D.; Marques, R.C. Did the corporatisation of Portuguese hospitals significantly change their productivity? Eur. J. Health Econ. 2015, 16, 289–303. [Google Scholar] [CrossRef]
- De la Torre, E.M.; Gómez-Sancho, J.M.; Perez-Esparrells, C. Comparing university performance by legal status: A Malmquist-type index approach for the case of the Spanish higher education system. Tert. Educ. Manag. 2017, 23, 206–221. [Google Scholar] [CrossRef]
- Vaz, C.B.; Camanho, A.S. Performance comparison of retailing stores using a Malmquist-type index. J. Oper. Res. Soc. 2012, 63, 631–645. [Google Scholar] [CrossRef]
- Amado, C.A.F.; Barreira, A.P.; Santos, S.P.; Guimarães, M.H. Comparing the quality of life of cities that gained and lost population: An assessment with DEA and the Malmquist index. Pap. Reg. Sci. 2019, 98, 2075–2097. [Google Scholar] [CrossRef]
- Berg, S.A.; Førsund, F.R.; Jansen, E.S. Malmquist Indices of Productivity Growth during the Deregulation of Norwegian Banking, 1980–89. Scand. J. Econ. 1992, 94, S211–S228. [Google Scholar] [CrossRef]
- Schlotter, M.; Schwerdt, G.; Woessmann, L. Econometric methods for causal evaluation of education policies and practices: A non-technical guide. Educ. Econ. 2011, 19, 109–137. [Google Scholar] [CrossRef]
- Cordero, J.M.; Cristobal, V.; Santín, D. Causal inference on education policies: A survey of empirical studies using PISA, TIMSS and PIRLS. J. Econ. Surv. 2018, 32, 878–915. [Google Scholar] [CrossRef] [Green Version]
- Lindlbauer, I.; Schreyögg, J.; Winter, V. Changes in technical efficiency after quality management certification: A DEA approach using difference-in-difference estimation with genetic matching in the hospital industry. Eur. J. Oper. Res. 2016, 250, 1026–1036. [Google Scholar] [CrossRef]
- Agrell, P.J.; Mattsson, P.; Månsson, J. Impacts on efficiency of merging the Swedish district courts. Ann. Oper. Res. 2020, 288, 653–679. [Google Scholar] [CrossRef] [Green Version]
- Mohsin, M.; Hanif, I.; Taghizadeh-Hesary, F.; Abbas, Q.; Iqbal, W. Nexus between energy efficiency and electricity reforms: A DEA-based way forward for clean power development. Energy Policy 2021, 149, 112052. [Google Scholar] [CrossRef]
- Santín, D.; Sicilia, G. Impact evaluation and frontier methods in education: A step forward. In Handbook of Contemporary Education Economics; Edward Elgar Publishing: Cheltenham, UK, 2017. [Google Scholar]
- Charnes, A.; Cooper, W.W.; Rhodes, E. Evaluating program and managerial efficiency: An application of data envelopment analysis to program follow through. Manag. Sci. 1981, 27, 668–697. [Google Scholar] [CrossRef]
- Area Moreira, M.; Alonso Cano, C.; Correa Gorospe, J.M.; Moral Pérez, M.E.D.; Pablos Pons, J.D.; Paredes Labra, J.; Valverde Berrocoso, J. Las políticas educativas TIC en España después del Programa Escuela 2.0: Las tendencias que emergen. RELATEC Rev. Latinoam. Tecnol. Educ. 2014, 13, 11–34. [Google Scholar]
- OECD. What is PISA? In PISA 2015 Assessment and Analytical Framework: Science, Reading, Mathematic, Financial Literacy and Collaborative Problem Solving; OECD Publishing: Paris, France, 2017; pp. 11–18. [Google Scholar] [CrossRef] [Green Version]
- Bradley, S.; Johnes, J.; Little, A. Measurement and determinants of efficiency and productivity in the further education sector in England. Bull. Econ. Res. 2010, 62, 1–30. [Google Scholar] [CrossRef]
- OECD. Classifying Educational Programmes, Manual for ISCED-97 Implementation in OECD Countries; OCDE: Paris, France, 1999. [Google Scholar]
- Area Moreira, M.; Sanabria Mesa, A.L.; Vega Navarro, A. Las políticas educativas TIC (Escuela 2.0) en las Comunidades Autónomas de España desde la visión del profesorado. Campus Virtuales: Revista Científica Iberoamericana de Tecnología Educativa 2013, 2, 74–88. [Google Scholar]
- Area Moreira, M. Los efectos del modelo 1: 1 en el cambio educativo en las escuelas. Evidencias y desafíos para las políticas iberoamericanas. Rev. Iberoam. Educ. 2011, 56, 49–74. [Google Scholar]
- Sáez López, J.M.; Rodriguez Torres, J. Reviews of Educational Policy regarding one laptop per child: Escuela 2.0 program in Castilla-La Mancha, Spain. Digit. Educ. Rev. 2016, 29, 86–109. [Google Scholar]
Publisher’s Note: MDPI stays neutral with regard to jurisdictional claims in published maps and institutional affiliations. |
© 2021 by the authors. Licensee MDPI, Basel, Switzerland. This article is an open access article distributed under the terms and conditions of the Creative Commons Attribution (CC BY) license (https://creativecommons.org/licenses/by/4.0/).