1. Introduction
Compositional data sets have played a valuable role in the medical, genetics and biological sciences due to the relative information conveyed through proportions, probabilities and percentages, as stated by [
1]. Reference [
1] describes the sample space of a compositional data set to be on a simplex, where the sum of all data points equals one or some whole number.
The most popular distribution that is well-known in modeling compositional data sets is the Dirichlet distribution (see for example [
2]). Literature contains varying generalizations of the Dirichlet distribution that have been well studied in the application of various compositional data sets (see for example [
3,
4,
5,
6,
7,
8]). Other generalizations that are studied in the literature are part of the Liouville distribution as described in [
9,
10,
11]. In Bayesian statistics, the Dirichlet distribution is known as a conjugate prior of the multinomial distribution and it is best used in estimating categorical distributions.
An extension of the Dirichlet distribution, known as the Dirichlet-generated class of distributions, has recently been introduced and developed by [
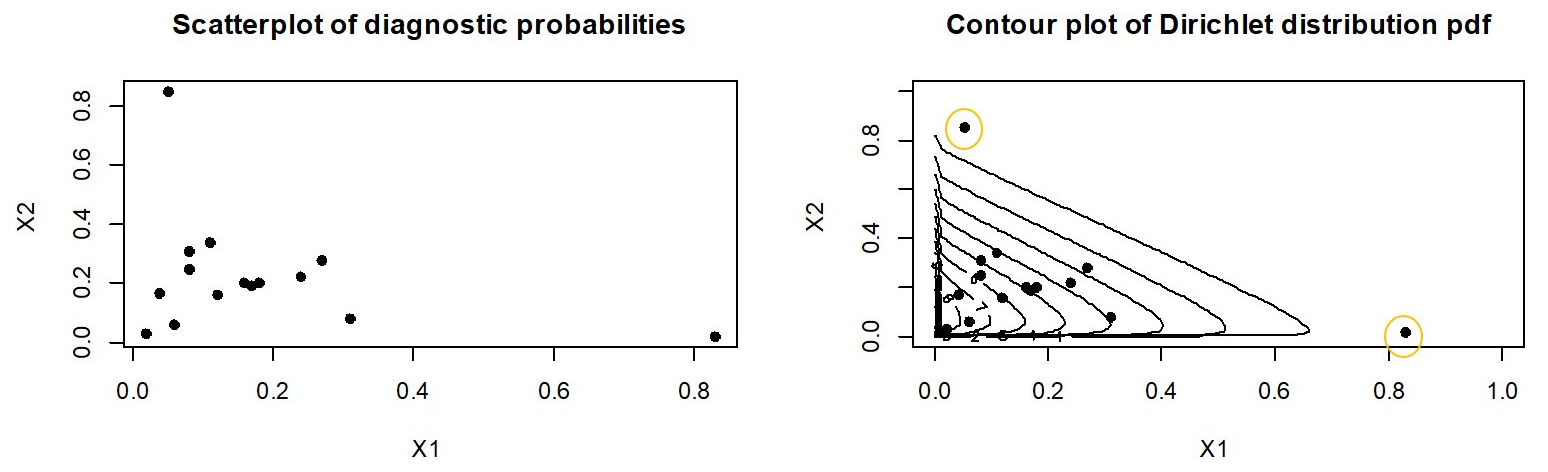
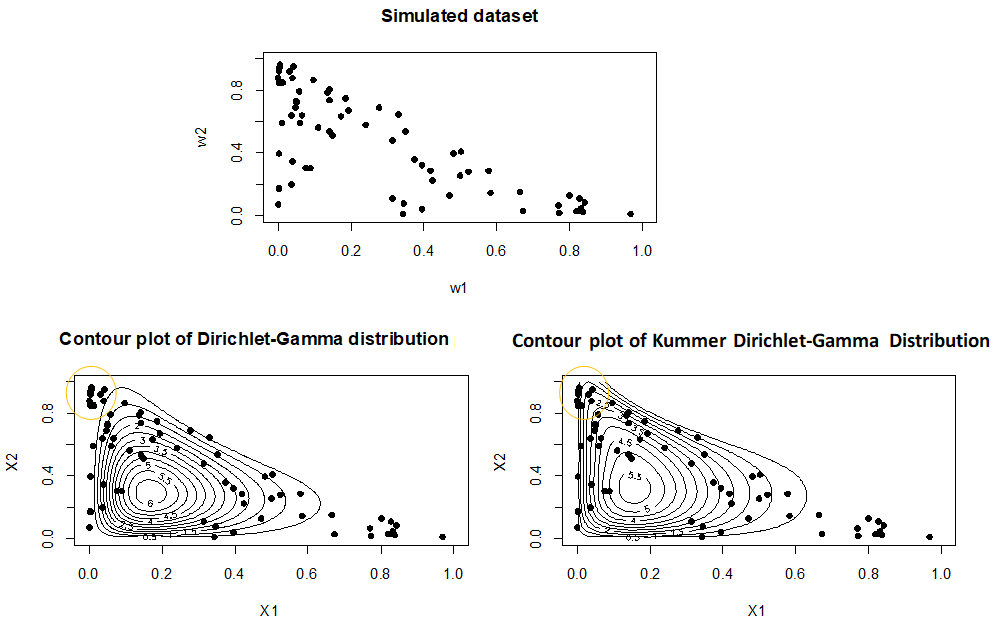
12]. This extension served as a flexible alternative to the well-known Dirichlet and generalized Dirichlet distributions, where its aim is to address the limitations that the Dirichlet distribution may pose when modeling certain compositional data sets. Consider a compositional data set, where diagnostic probabilities of a sample of 15 students are assigned by clinicians. The background of this data set is further explained in
Section 6.
Figure 1 gives a scatterplot of the probabilities and illustrates the fit of the Dirichlet distribution (bivariate case) to this data set.
Figure 1 illustrates an opportunity where the fit of the Dirichlet distribution could be improved upon.
In [
12], the beta-generating construction technique (pioneered and developed by [
13]) is implemented to improve the fit of the Dirichlet distribution. The technique was an evolution from the univariate framework described below into a multivariate setting:
with the probability density function (pdf)
where
is a continuous cumulative distribution function (cdf) and
is the pdf of a random variable with support
. By introducing extra parameters in
and
, the resulting distribution provides greater flexibility in adapting modality and skewness.
Motivated by (
1), from a multivariate viewpoint, in the methodology of [
12], a new distribution
for a random vector
,
, is constructed by nesting the cdf of a baseline distributions
within the pdf of the generator distribution:
with the pdf
for
,
,
and where
is the multivariate beta function. Here
and
and
are the pdf and cdf of the baseline distributions, respectively. The authors [
12] developed the Dirichlet-gamma distribution, where in this case, the gamma distribution is taken as the baseline distribution
,
, and the Dirichlet distribution is taken as the generator distribution.
In the univariate case, the Kummer-beta distribution is seen as an extension of the beta distribution (see the studies of [
14,
15,
16]), it then follows that the multivariate Kummer-beta (refer as to Kummer–Dirichlet hereafter) distribution is also considered as an extension of the Dirichlet distribution (see [
17]). Authors such as [
14,
15,
16,
18] have applied the generating technique to the Kummer-beta distribution, by coupling the cdf of different baseline distributions with the pdf of the Kummer-beta distribution. The development of generated distributions using the Kummer-beta distribution, has introduced distributions that add more flexibility in modeling data sets that are in the
domain (see [
19] for an example).
In this paper, we propose a general multivariate construction methodology using the Kummer–Dirichlet (KD) pdf as the generator. This KD-generated class serves as a good alternative to the Dirichlet distribution for the statistical representation of specific proportional data. This class can be viewed as an evolution from the univariate framework into a multivariate setting as described in (
3) but with the aim of offering more flexibility in modeling compositional data sets.
Thus, we introduce the KD distribution as the generating distribution, and a new class is proposed, with the following cdf
with
for
,
,
C as the normalizing constant,
,
,
and
,
, as the cdfs of a baseline distribution with
. Distributions with cdf (
5) and normalizing constant (
9) shall be referred to as Kummer–Dirichlet generated distributions, where
,
, are the cdfs of a baseline distribution.
The contribution of this construction (
5) highlights the importance of developing distributions that can improve the modeling of extreme observations in compositional data sets, where the Dirichlet might not be suitable or at a shortfall, as illustrated in
Figure 1. For such cases and others that may arise, we propose a model with cdf (
5). Thus, this novel study contributes to multivariate distribution theory from the following aspects:
- 1
The well-known beta-generator in the univariate case is extended to the Kummer–Dirichlet in the multivariate case.
- 2
A technique is proposed to construct multivariate distributions that combines a baseline distribution with a multivariate generator and evolves generating a plethora of possibilities of results.
- 3
We proposed a multivariate distribution that can be used for modeling compositional data with outliers.
- 4
Mathematical techniques are developed to derive the moment generating function of multivariate distributions.
The following showcases the organization of our contribution; in
Section 2, the building blocks for the KD generator distribution, such as the normalizing constant of the pdf that corresponds to (
5) is derived. In
Section 3, the KD-gamma distribution is introduced, where we provide some technical results to derive the moments. In
Section 4, the usefulness of the KD-Gamma distribution, as compared to the Dirichlet-gamma distribution, is seen through the application of a synthetic data analysis. Two real data sets, where outliers are present, are analyzed in
Section 5. Finally, some conclusions are given in
Section 6. Proof of the main results are put in the
Appendix A.
3. The Kummer–Dirichlet Gamma Distribution
In this section, we focus on the gamma distribution as the chosen baseline distribution. The gamma distribution, which belongs to the exponential class, is a flexible distribution model with a shape parameter, that may offer a good fit to a variety of different data sets [
24]. The cdf and pdf of the gamma distribution with shape parameter
and scale parameter
are given as
and pdf
where
is the incomplete gamma function
.
Thus, here, we explore the impact of the gamma distribution as the considered baseline distribution, where the cdf and pdf of the baseline distribution is given by (16) and pdf (17), respectively. In this case, for are the cdfs of the gamma distribution with shape and scale parameters for , , we denote random vector as Kummer–Dirichlet gamma (KDGa) distributed where .
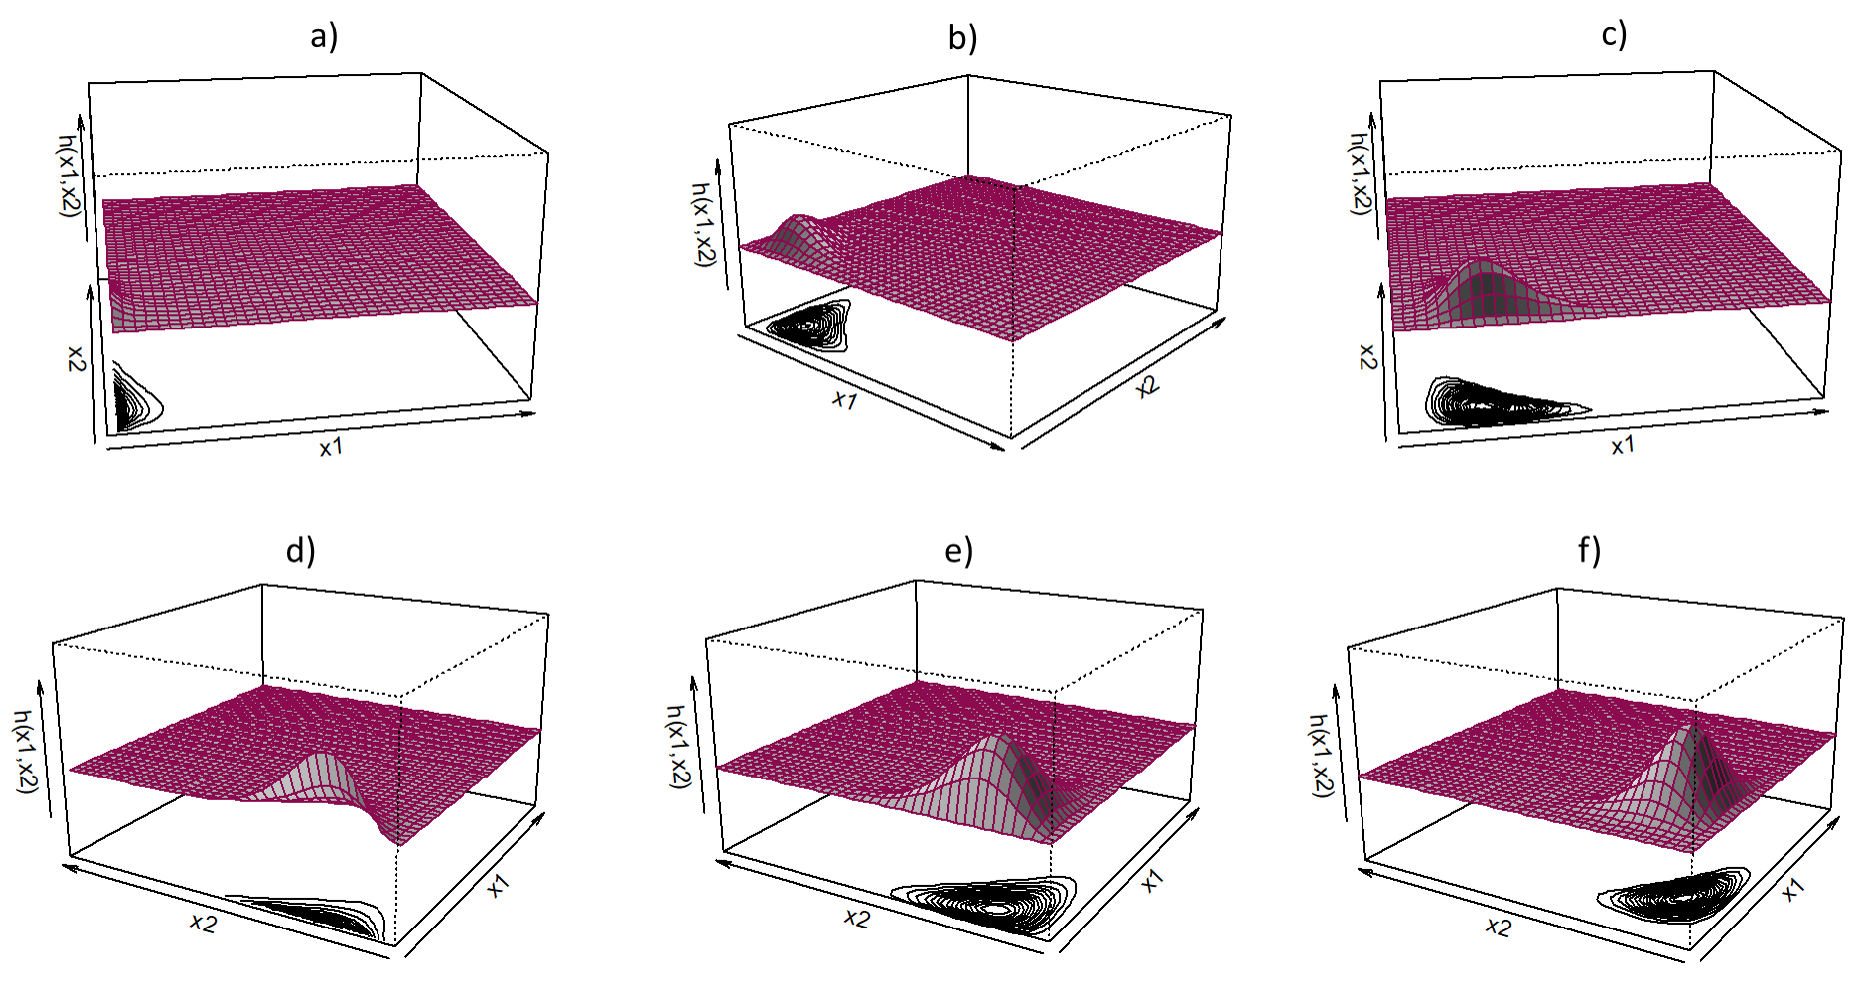
Figure 2,
Figure 3 and
Figure 4 illustrate the effect of the parameters
of the pdf (
10). It is observed in
Figure 2 that parameters
illustrate the influence or “weight” of each random variable
, in this case
. From
Figure 2, it is observed that larger values of
leads to skewness and heavier tails for random variable
. Symmetry is observed in the first row of
Figure 2 when
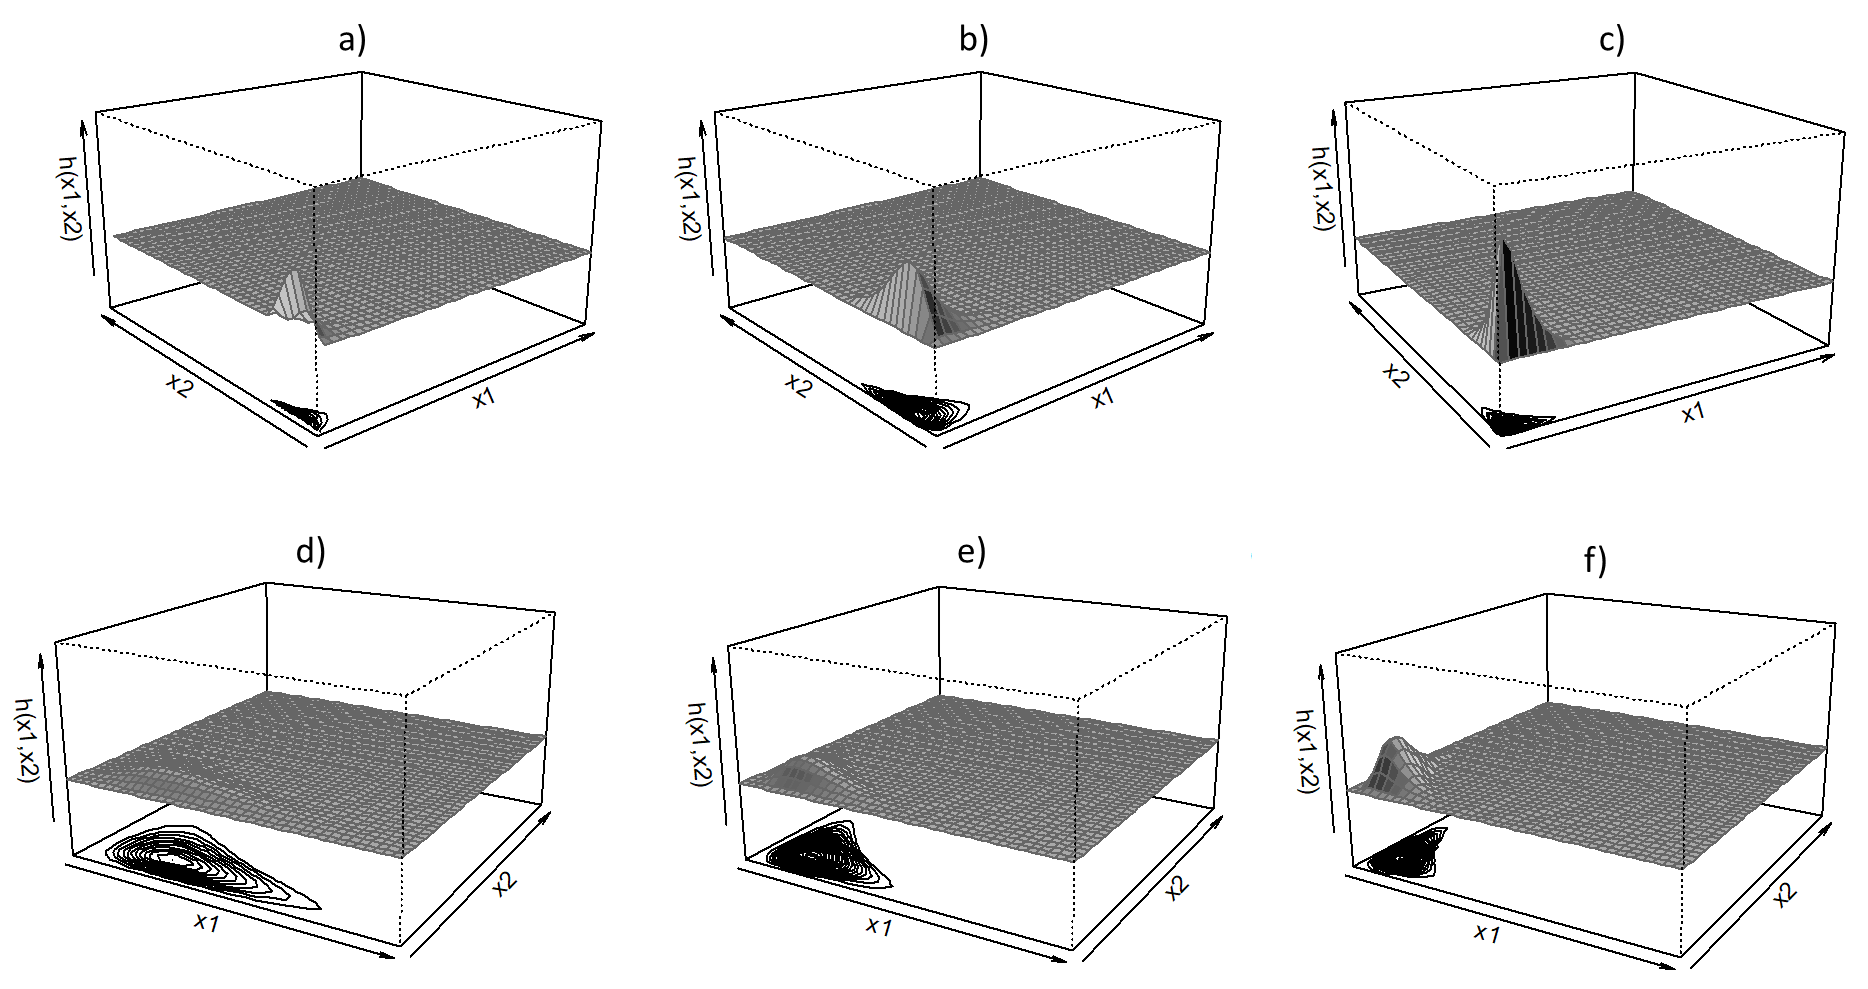
. The parameters
influence the shape, peakness and the scale of the pdf (
10). It is observed in
Figure 3 that smaller values of
,
results in the pdf (
10) concentrated on a smaller scale, while larger values of
,
results in the pdf (
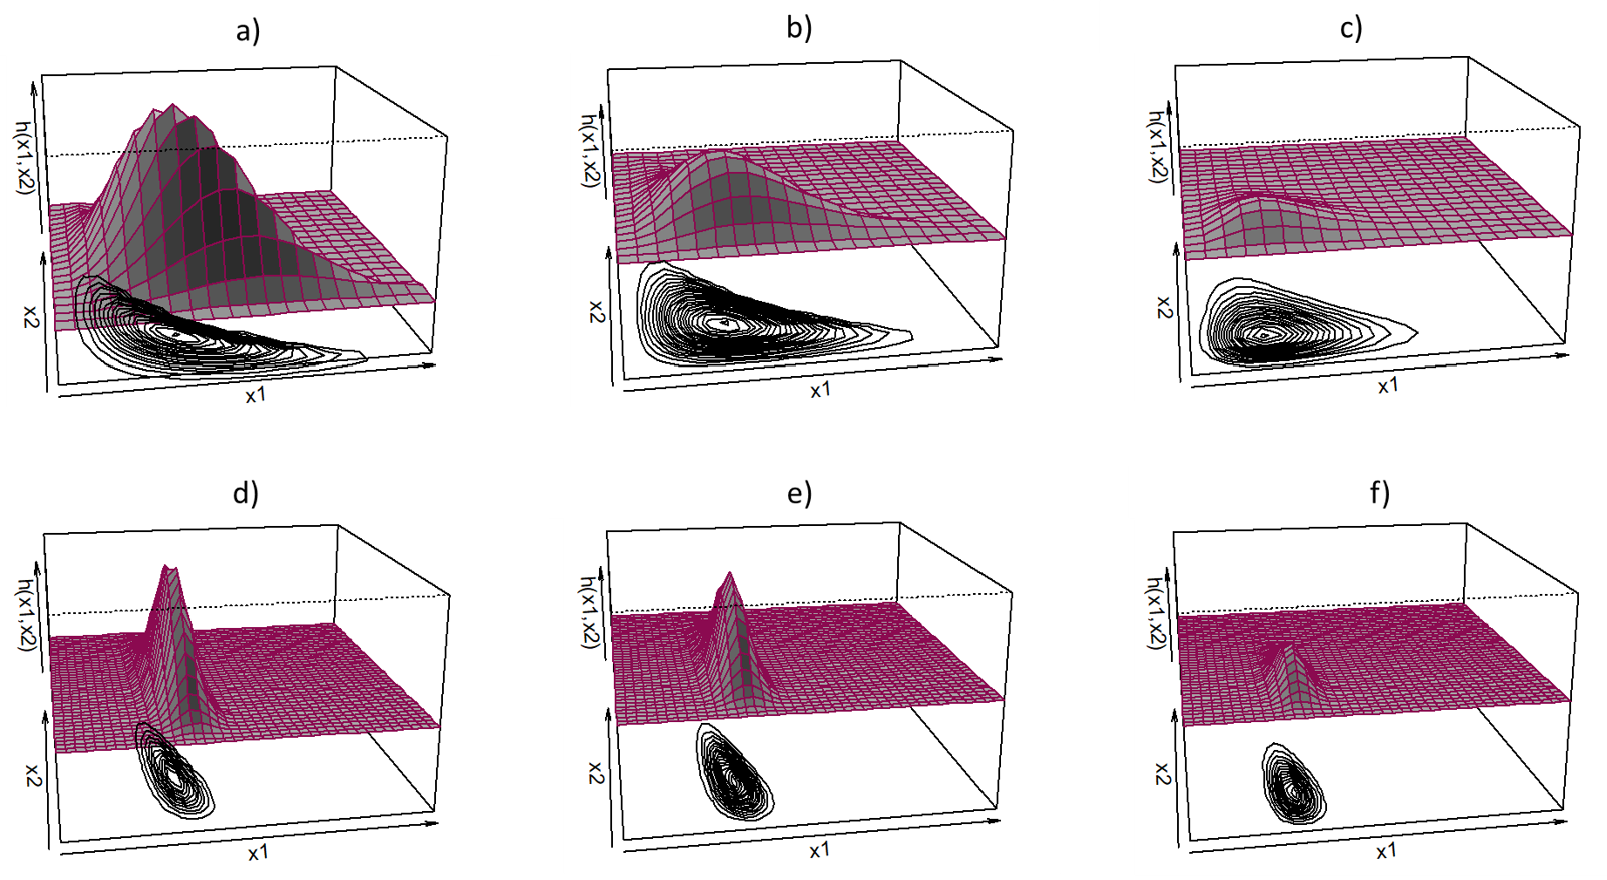
10) spread across a bigger scale of values. It is observed in
Figure 4 that
influences the tails, peakness and narrowness of the pdf (
10). It is observed in the first row of
Figure 4 that smaller values of
results in heavier tails.
Moment Generating Function of the KDG
In this section, the moment generating function (mgf) and product moments of random vector , where are derived.
Theorem 2. The mgf of random vector is given bywhere , is the normalizing constant (9), shape parameters , as the coefficient given by (14) for , , shape parameter and scale parameter for . Theorem 3. Let , be positive integer values. Then, the product moments of is expressed in the following formwhere is the normalizing constant (9), shape parameters , as the coefficient given by (14) for , , shape parameter and scale parameter for . For the illustration section and ease of reader, the moments for the bivariate case (
) of the Kummer=-Dirichlet gamma distribution is given as
using the result of (15) and (19).
5. Application
5.1. Diagnostic Probabilities Data Set Analysis
In this data, three behavioral states of attitudes or “diseases” of students known under the generic title of “newmath syndrome” are investigated and recorded using diagnostic probabilities. A sample of 15 students take part in this study, where diagnostic probabilities are assigned by clinicians for variables algebritis, bilateral paralexia and calculus deficiency.
The performance of the Dirichlet-gamma and the newly developed Kummer–Dirichlet gamma distributions are investigated here to see if these are suitable models for this data set, where the data has a correlation matrix given by
The initial parameter values needed for this performance test are obtained through a grid search using R software. The initial parameter values for the Dirichlet-gamma distribution are given as and as initial values for the Kummer–Dirichlet gamma distribution. Goodness-of-fit measures such as the Akaike information criterion (AIC) and the Bayesian information criterion (BIC) are used to illustrate the overall performance of the Kummer–Dirichlet gamma and Dirichlet-gamma distribution, where the model with the lowest values of AIC and BIC measures is considered to preferred.
The results of
Table 2 and
Figure 6 illustrate that the Kummer–Dirichlet gamma distribution serves an alternative model for compositional data sets. Reference [
12] illustrated that the Dirichlet-gamma is flexible in modeling compositional data sets; however, in this example, it is shown that the additional parameter
adds flexibility, covering outliers where the Dirichlet-gamma distribution might not reach. The maximum likelihood value (
), and the AIC and BIC measures also proves that the Kummer–Dirichlet gamma is a better alternative for this data set.
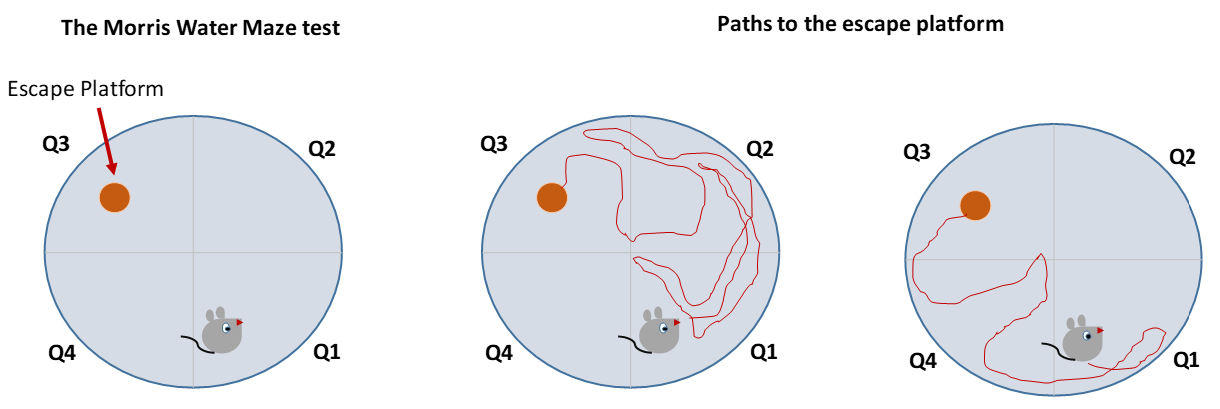
5.2. The Mice Morris Water Maze Behavior Data Set Analysis
In this experiment, the time spent by rodents in the four different quadrants of a water maze is analyzed. The Morris water maze is a behavioral test mostly used on rodents (see [
25]). The experiment begins by placing a rodent in a circular pool of water, where it is required to swim until it finds an escape platform in the pool. The aim of the experiment is to investigate the memory abilities and or memory loss of different rodents.
Figure 7 illustrates the experiment. In this data, seven wild-type rodents are placed in a pool of water, where the time spent in the different quadrants is recorded.
In the study [
25], the Dirichlet distribution was used as a suitable model for distinguishing the proportion of time spent across the different quadrants. In this example, the performance of Dirichlet distribution and the newly developed KDGa distribution is thus compared to see if the KDGa distribution is superior, for this data set. The correlation matrix of this data is given by
The initial parameter values needed for this performance test, are obtained through a grid search using the R software. The initial parameter values for the Dirichlet distribution are given as and as the initial values for the Kummer–Dirichlet gamma distribution.
Results of
Table 3 illustrate that the Kummer–Dirichlet gamma distribution is a good competitor for this compositional data set. The estimation values of the parameters
indicates the “weight" of each quadrant. For both the Dirichlet and the KDGa distribution, the value of
is higher than the values of
, indicating that more time was spent in the first quadrant. The maximum likelihood value (
), and the AIC and BIC measures also illustrate that the Kummer–Dirichlet gamma can be viewed as a good addition in analyzing this type of data set.


