Article

Evaluation of Paris MoU Maritime Inspections Using a STATIS Approach

1
Department of Maritime Studies, University of Cádiz, 11003 Cádiz, Spain
2
Department of Statistics, University of Salamanca, 37008 Salamanca, Spain
3
Department of Computer Engineering, University of Cádiz, 11003 Cádiz, Spain
4
Department of Statistics and Operational Research, University of Cádiz, 11003 Cádiz, Spain
*
Author to whom correspondence should be addressed.
Mathematics 2021, 9(17), 2092; https://doi.org/10.3390/math9172092
Submission received: 9 July 2021 / Revised: 22 August 2021 / Accepted: 26 August 2021 / Published: 29 August 2021
(This article belongs to the Special Issue Multivariate Statistics: Theory and Its Applications)

Abstract

:
Port state control inspections implemented under the Paris Memorandum of Understanding (MoU) have become known as one of the best instruments for maritime administrations in European Union (EU) Member States to ensure that the ships docked in their ports comply with all maritime safety requirements. This paper focuses on the analysis of all inspections made between 2013 and 2018 in the top ten EU ports incorporated in the Paris MoU (17,880 inspections). The methodology consists of a multivariate statistical information system (STATIS) analysis using the inspected ship’s characteristics as explanatory variables. The variables used describe both the inspected ships (classification society, flag, age and gross tonnage) and the inspection (type of inspection and number of deficiencies), yielding a dataset with more than 600,000 elements in the data matrix. The most important results are that the classifications obtained match the performance lists published annually by the Paris MoU and the classification societies. Therefore, the approach is a potentially valid classification method and would then be useful to maritime authorities as an additional indicator of a ship’s risk profile to decide inspection priorities and as a tool to measure the evolution in the risk profile of the flag over time.

1. Introduction

Maritime transport is one of the pillars of globalisation. However, a proliferation of open registries, referred to as “flags of convenience” by the International Transport Federation (ITO), has accompanied the resulting increase in traffic. In recent years, maritime transport has undergone a generalisation of these so-called open registries. In evidence, in 2015 they accounted for 71.3% of the global fleet compared with just 21.6% in 1970 [1]. As a consequence, modifications have been applied to the tools used to enforce international regulatory principles, as established by the International Maritime Organisation (IMO), in matters of safety and pollution prevention [2].
To monitor compliance with safety standards, the IMO equipped the international community with control elements through periodic ship inspections in ports. This led to the 1982 Memorandum of Understanding (Paris MoU), which implemented port state control (PSC) inspections. These are inspections of foreign ships made by each country’s maritime administration, typically conducted by inspectors that first check statutory certificates of compliance with international conventions, such as the Safety of Life at Sea (SOLAS), Maritime Pollution (MARPOL), and Standards of Training, Certification, and Watchkeeping for Seafarers (STCW), among others. If the preliminary inspection leads to the suspicion of violation of any of these, the vessel may undergo a more exhaustive inspection to ensure its compliance with safety standards. If the ship does not then comply with international law, depending on the severity of the infraction, the ship can be seized by the competent authority [3,4,5].
However, the PSC inspection system does not apply globally and is instead divided into regions, each with their own memorandum. For instance, the European Union (EU) is part of the Paris MoU region, which is the subject of this study. The regulation of these foreign ship inspections is subject to a series of directives, the newest being the 2009/16/CE (ERIKA III), which introduces the New Inspection Regime (NIR): a series of new laws to co-ordinate and harmonise PSC inspections within Europe. One of the novelties of this new system is its ability to apply “prioritized inspections” in the Paris MoU. These are processes adopted to replicate good experiences obtained in other international ports using this system. The prioritised inspections consist of determining a “risk profile” for ships based on the shipping company, flag and the results of previous inspections, to automatically apprise the maritime administration and PSC inspectors of the priorities and type of inspection required.
This recent system, which came into effect in 2011, standardised laws and PSC inspection criteria throughout the EU, and implemented a co-ordinated maritime safety inspections system with the objective of avoiding differences in inspection procedures within EU ports. In addition, this new regulation unifies the criteria for ship immobilisation and detention [6], thereby allowing for a more homogeneous application of law, and thus avoiding a concentration of maritime traffic in certain ports where shipping companies take advantage of less exhaustive inspections and benefit from the lack of effective control. With the objective of exercising control and informing maritime administrations of ships with flags and classification societies that could present a danger to maritime safety, the Paris MoU publishes annual flag and society performance lists. The International Association of Classification Societies (IACS) also certifies several classification societies, creating a list of those that have passed appropriate quality controls [7,8].
These inspections are associated with The Hybrid European Targeting and Inspection System (THETIS) [9], an information system managed by the European Maritime Safety Agency (EMSA). The system analyses all PSC inspections conducted in the EU, creating a risk profile for each ship based on historic results. It then uses this to determine the inspection criteria applied by each maritime administration, thereby establishing ship inspection priorities. THETIS also connects to the European network SafeSeaNet, which is an additional guarantee of implementation and supervision. We obtained the requisite data for this study from the THETIS platform.

Review of the Latest Studies on Safety Controls

In terms of existing studies on safety controls, an early study by Brooks [10] already highlighted the tendency for privatisation in maritime safety control. Later, Håvold [11] introduced the importance of quantitative risk analysis to promote maritime safety. For the development of the PSC tools, Knapp and Frances [12,13,14] were the first to apply econometric methodologies, using binary–logistic regressions to identify differences between the different inspection regimes. They suggested revising the inspection frequencies based on ship risk profiles, with their recommendations implemented in the Paris MoU. The NIR, coming into effect in 2011 as a result of the Paris MoU, has been analysed by [15,16,17]. Subsequently, Li and Zheng [18] examined the effectiveness of the system and the methods adopted by the regional PSC agreements to select ships for inspection. This study revealed that the application of PSC is effective in improving maritime transport safety. Later studies, such as those by [19] and [20], use Bayesian networks to explore the relationship between PSC inspections and the incidence of ship accidents. Özçayir [21] and Wu et al. [22] follow the same line.
On the influence of an inspector’s professional profile on inspection results, Knapp and Franses [13] concluded that the average probabilities of detention differ depending on the inspector’s training. In a more recent study, Ravira and Piniella [23] also concluded that both professional training and the use of (or the lack of the use of) teams in conducting the inspections influence the results of inspections. In other work, Graziano et al. [24] analysed 25 inspection reports prepared by the EMSA concerning Member State inspections to determine the levels of implementation, compliance and harmonisation of the established Directive 2009/16/CE [25], and to detect any gaps between the policy and practice of inspections. Subsequently, [24] also evaluated the discrepancies between Member States after the directive and the NIR came into effect.
Wang et al. [26] developed a Bayesian network classifier based on tree augmented naive Bayes to identify high-risk foreign ships docked in ports. The classifier is an additional tool that can aid PSC authorities in the identification of ships with lower compliance standards and in the assignment of resources for their inspection. In this sense, our analysis also provides interesting results in that we can identify substandard (high-risk) ship profiles within the structure of the chosen variables, obtained using the extended statistical information system (X-STATIS) method. Chen et al. [27] conducted an empirical analysis of detention data from port states in the Asia-Pacific region (Tokyo MoU) collected in the last decade, providing port states with effective measures in improving ship safety inspections.
In one of the most recent studies, [28] shows there is improvement to be made in the identification of ships for inspection and in determining priority areas. In that analysis, the method proposed treats detentions and incidents as separate risks and evaluates seven methods against aleatory ship selection using empirical data from 2018. Potentially, its application may serve as a guide to maritime administrations by classifying ship risk into categories and selecting inspection objectives. This is where our study provides more relevant information, as the classification obtained by X-STATIS can also serve as an indicator of a ship’s risk profile. Thus, inspection priorities can be decided more effectively as we compare the classification results with the Paris MoU and IACS lists. Moreover, our method allows for societies and flags not included on these lists to be classified.
One of the latest contributions to the increase in maritime safety was made by Chen et al. [29] through behavioural analysis of ships using a video-based and automatic identification (AIS) detection system and applying the convolutional neural network in a you only look once (YOLO) model. The result was that ships could be correctly detected with higher precision (over 90%) and the implementation of this system in maritime traffic terminals could improve their waters’ safety. Baoying Li et al. [30] also proposed an inspection system to improve safety which used unmanned aerial vehicles (UAV) and draws on a feasible trajectory planning method, which in turn is based on the continuous Hopfield neural network (CHNN) and genetic algorithm (GA) to minimise the inspection distance.
Lastly, Wang et al. [31] developed a new probabilistic model of PSC risk based on Bayesian networks to analyse the dependency and interdependency between risk factors influencing PSC inspections employing big data between 2014 and 2017 from the Tokyo MoU inspection database. The results revealed that ship safety condition deficiencies, along with the technical characteristics of the inspected vessel, were the most influential factors determining PSC inspections and ship detentions. This study validates the choice of one of the most important variables in our analysis, as the detected deficiencies in ship safety were also an indicator of the result of an inspection.
In this paper, we analyse PSC inspections over the last few years within the Paris MoU with the objective of observing different ship profiles and classifying them using X-STATIS. With this methodology we can identify high risk ships, which is an additional indication of a ship’s profile that administrations can use to improve maritime safety. We have also analysed the evolution of flag and classification societies’ performances throughout the years, with the objective of observing which of them comply the most and more consistently with the quality criteria established during the study period. The organisation of the remainder of the paper is as follows. Section 2 details the database and provides a brief description of the methods and techniques employed. Section 3 discusses the results and Section 4 presents the conclusions.

2. Materials and Methods

Our sample comprises PSC inspections conducted in major EU ports from 2013 to 2018. The inspection data, as discussed in the introduction, are obtained from the THETIS platform [9], comprising a total of 17,880 ship inspections. The data were obtained from the 10 most important ports participating in the Paris MoU during the study period. The selection criteria was the highest weight of transported goods, as provided by the Eurostat database [32].
The variables used in the investigation are the inspected ship’s characteristics (Table 1) and the type and results of inspection (Table 2).
The technique we apply is X-STATIS [33], an approach used when data are structured in a three-mode format. With our data, the first mode is the flag (country of registry), the second mode is the variables that evaluate the ship’s characteristics and inspection results (ship dimensions, age, inspection type and number of detected deficiencies) and the third mode is the sample years included in the analysis (2013–2018). This technique belongs to the STATIS method family [34,35] whose objective is to extract relevant information from k data tables, our data table being (51 × 4) × 6 years. The X-STATIS approach consists of the following steps: study of the interstructure, the compromise analysis and the study of the intrastructure.
  • The study of the interstructure (Figure 1) consists of a general comparison between k data tables, which in our case is to study the relationship between years, as each table represents a year. A vectorial covariance matrix is created, containing the between-table scalar products, where the element in row k and column l is calculated as C o v v   X k ,   X l = T r   X k t   D n   X l   D p , Xk is table k in the sequence and Dn and Dp are the metrics for the rows and columns, respectively. Dn and Dp are the diagonal matrices of order n and p created by placing the standard deviations of the n individuals and p variables in the main diagonal. This first step allows us to ascertain the similarities between study years and if the study period is stable or undergoes significant changes. To do this, each table (year) is represented as a point in a low-dimensional Euclidean subspace, and by connecting each one of these points to the origin and evaluating the angles between vectors, a correlation estimate is obtained; positive correlations are represented by narrow angles.
  • The compromise analysis (Figure 2) synthesises the information found in the k tables into a single matrix known as the “compromise”. Its creation follows the process described in the flow chart in Figure 2, where we represent the original data by the six tables (one for each year, 2013–2018) of 51 × 4 (51 rows for the different countries and 4 columns for the different variables describing ship characteristics: Gross Tonnage “Ton”; “Age”; Inspection type “Ins”; Number of deficiencies “Def”). The vectorisation of these original matrices creates column vectors used to populate the Z matrix, i.e., the first column of matrix Z is made up of the vertically stacked column vectors of the 2013 matrix, the second column is for the year 2014 and so on until completing the matrix with the year 2018; the final result is a Z matrix of 204 rows (51 countries × 4 variables) and 6 columns (one for each original data table, one per year). We decompose the Z matrix into singular values and vectors ( Z = U Λ V t ) to create the ZV matrix, which has the same dimensions as Z, but whose columns are the resulting component vectors in decreasing order. Each of these components contains conjoint information from all the tables, as they are lineal combinations of the Z columns, which refer to each of the original matrices. Selecting the first component (204 rows) from ZV, which is the component comprising the most information, we obtain the “compromise” matrix, horizontally unpacking the information and positioning 51 individuals per column until completing the 204 rows, when the compromise matrix once again has the same dimensions as the original matrices, 51 rows × 4 columns. This matrix filters out noise and synthesises the stable information from the k tables of original data, i.e., it contains the relevant information for the 2013–2018 study period. Once the compromise matrix has been obtained, its structure can be represented on a two-dimensional plane; this will allow us to determine the relationships between the study variables (represented as vectors, where narrow angles indicate positive correlations) and determine the specific characteristics of the countries of registry (the countries are represented by points, and similarities are indicated by proximity on the plane).
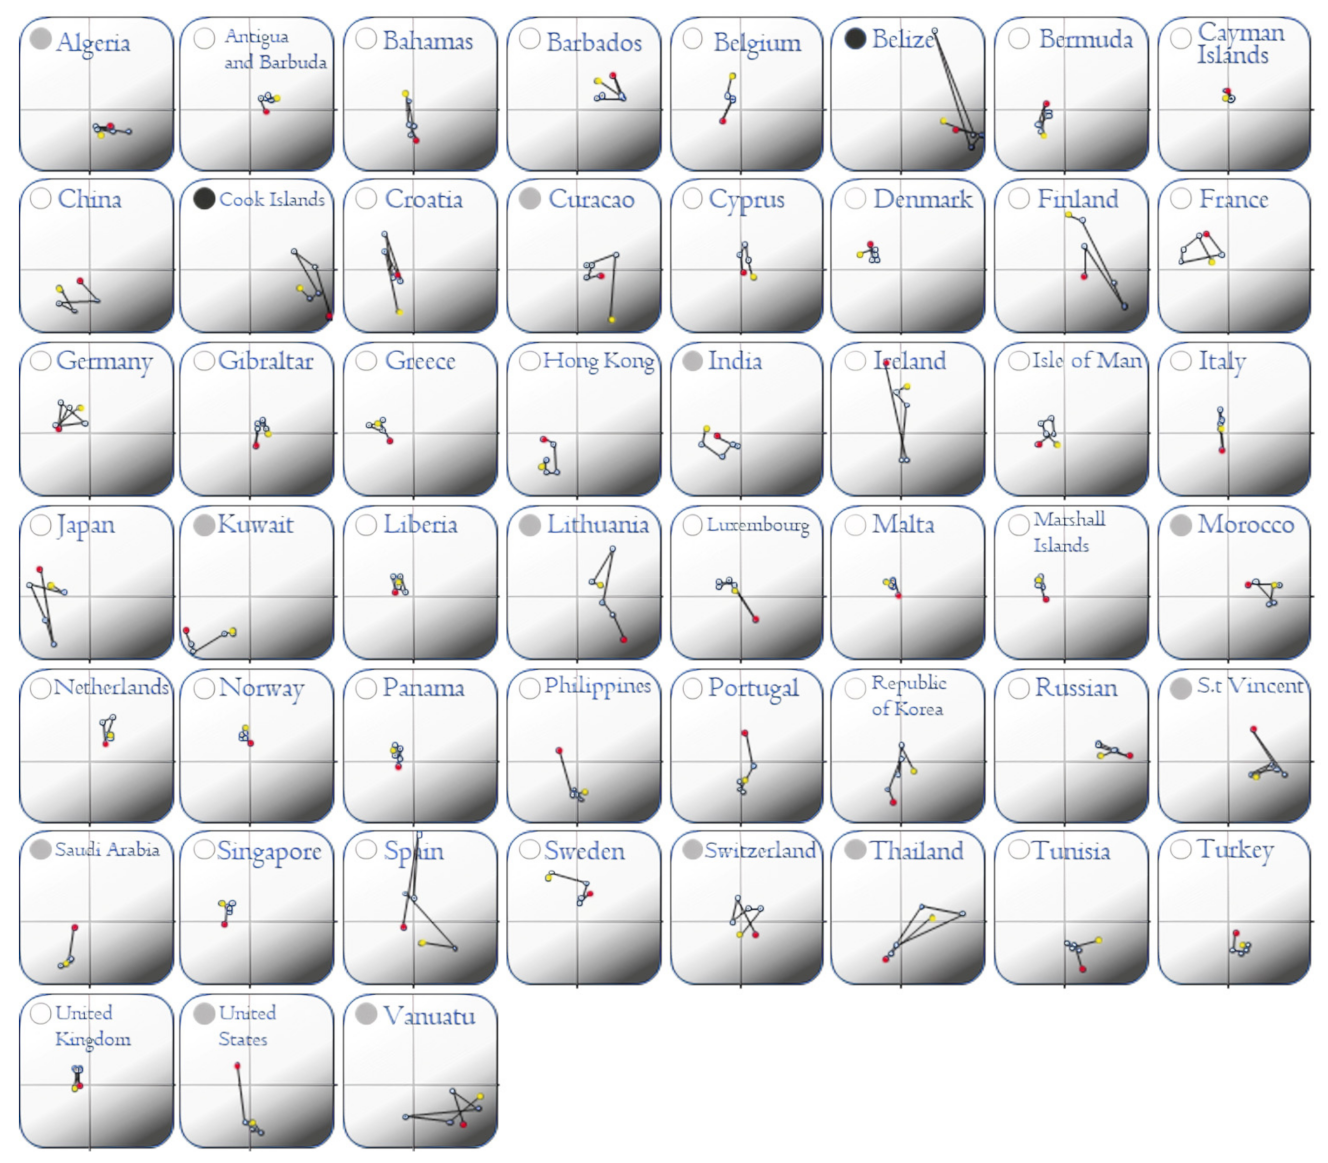
  • The intrastructure study (Figure 2) analyses the evolution of individuals and variables in time by projecting rows and/or columns of each k table on the “compromise” subspace. Let V r be the first r eigenvectors matrix from the compromise analysis; the co-ordinates of the rows of table X k are the rows of X k   D p   V r , and the co-ordinates of the columns are the rows of X k t   D n   U r , where U r is the first r eigenvector of X c   D p   X c t   D n . The study of the trajectories allows us to represent, on a two-dimensional plane, the individuals and variables from each of the k tables by projecting their values on the compromise subspace. This shows each country’s evolution individually from 2013 to 2018. This information is of great interest as we can use it to investigate which countries are stable in this period and compare them with their position on the Paris MoU lists; equally, countries that display abrupt or significant changes in certain years would be interesting to study individually to determine the reason these changes occurred. Finally, all this information is of potentially significant use in classification and in the study of each country’s position on future Paris MoU lists.
All of the calculations and two-dimensional representations of the X-STATIS analysis are carried out using ADE-4 [36] software.

3. Results and Discussion

3.1. X-STATIS Analysis of Countries of Registry for Inspected Ships

The first application of the X-STATIS analysis results in the projection of the countries of registry with respect to the inspected ship variables, comprising ship dimension, age, inspection type and number of deficiencies detected between 2013 and 2018. The data used were the four variables (GrossTonnage–Age–InspectionType–Ndeficiencies) from 17,880 inspections conducted in 51 different countries during the 6 years of the sample period. Table S1 (Supplementary Materials) presents the frequency distributions of the inspections by flag and year.
In this application, the first step is to compare the structures of the different years via the three-mode X-STATIS interstructural analysis (1st mode: 51 countries, 2nd mode: four variables, 3rd mode: six years). This analysis provided a graphical estimation of the vectorial correlation coefficient between matrices, i.e., between years (Figure 3). As shown, the angles between vectors are narrow, signifying strong relationships and similarities between years, although we observe a slight separation between the first three years (2013–2015) and the last three years (2016–2018). This representation exhibits structural similarities across years and contains about 76% of the information in the 1–2 factorial plane. A positive conclusion from this analysis is that it validates the choice of the PSC inspection variables as they are strongly correlated, irrespective of the year.
The second step of the analysis is the creation of the compromise matrix. This matrix constitutes a global overview of all the tables, and therefore summarises all the information collected during the study period. This means that in the subspace created by the compromise matrix, each country is represented by a value that synthesises the information over all six years and four variables. Thus, we can study each country’s behaviour in comparison with each other country, capturing the multivariant information, “filtering out” the noise and maintaining only statistically relevant information. The representation on the first two factorial axes includes about 84% of the information, and all the study years are weighted similarly in the compromise (Table 3, column “Weights”) and are well represented in the subspace (Table 3, column “Cos2”).
This information is represented in Figure 4, where the position of the 51 countries of registry over the period 2013–2018 is visualised with respect to the four variables chosen to evaluate their characteristics.
The different countries display high variance and are distributed all over the plane, which facilitates the visualisation of differences according to the ship country registrations. The positions of the countries are based on the structure of the variables, which display a clear tendency. As depicted, there is a clear relationship between a ship’s age “Age” and the number of deficiencies detected “NDeficiencies”; that is, older ships generally have more deficiencies. The results are interesting as the relationships between variables can be used to identify a substandard ship profile [13]: older, smaller ship (“Age” and “GrossTonnage” are inversely related) with a high number of deficiencies detected in inspections. Ultimately, we can use the structure obtained with these variables to identify ships that are a high risk in terms of maritime safety.
Countries located in the left semi-plane of the graph have younger ships, which are also larger; here, countries such as Hong Kong, Japan, Kuwait or Saudi Arabia can be found (for example, for Japan, ships are on average six years old, have one deficiency and an average gross tonnage of 80,000 tons). In addition, countries found in the top left-hand side (second quadrant) have fewer deficiencies; there are countries such as France, Belgium, Germany, Denmark, Sweden, Norway, Isle of Man, Ireland and the United Kingdom (North Sea) in the Atlantic, and others such as Greece, Italy and Malta in the Mediterranean, and Panama, Cayman Islands and Antigua and Barbuda in the Caribbean. All these countries are on the Paris MoU “white list”, which means they have new ships with few deficiencies (for this reason, we represent them with a white dot in Figure 4).
The opposing profile, being substandard ships, are in the right semi-plane, mostly the fourth quadrant, where we represent the countries with a grey or black dot in reference to the Paris MoU lists. These ships are older, smaller and have a higher number of deficiencies (for example, the Cook Islands, where ships are on average 23 years old, have seven or more deficiencies and an average gross tonnage of 6000 tons). The further the countries appear to the right of the graph, the worse are their ship characteristics (older ships with more deficiencies). Countries such as Curacao, Morocco, Lithuania, St. Vincent, Thailand, Vanuatu and Algeria belong on the Paris MoU “grey list”, while Belize and the Cook Islands are on the Paris MoU “black list”. We also represent these countries by their list colours (grey and black) in Figure 4.
To summarise, the classification obtained using the X-STATIS analysis coincides with the performance lists published by the Paris MoU throughout the study period. For this reason, this methodology could be adequate in the existing classification of a flag’s performance or for those countries as yet unclassified. For example, countries such as Djibouti, Iceland, Equatorial Guinea and Jamaica that are not yet classified could, according to our results, belong to the Paris MoU black list as they display similar characteristics to countries already on the black list. We compared the results in this section with the 2019 Performance List to validate the classification technique.
A fundamental step of the X-STATIS analysis is the study of trajectories, which describes the evolution of the countries on an individual basis from 2013 to 2018. Figure 5 illustrates these trajectories in the compromise subspace, where grey and black list characteristics appear in the 4th quadrant. Each point represents a year, the first year, 2013, appears in red and the last year, 2018, appears in yellow.
This representation highlights that the classification of most countries has remained stable throughout the study period. Countries such as Algeria, Antigua and Barbuda, Cayman Islands, Denmark, Gibraltar, Greece, Liberia, Malta, Netherlands, Norway, Panama, Singapore and the United Kingdom, among others, exhibit no movement in the six years of the sample period, and are therefore unlikely to change list, and this has been proven correct after the sample period as all have remained in their original list in both 2019 and 2020. In contrast, other countries have exhibited noticeable changes, such as Lithuania, whose trajectory began in the dark area and has since moved toward the white area. Consulting the Paris MoU lists, Lithuania was in the grey list until 2019 when it changed to the white list, coinciding with the presented trajectory.
Likewise, the United States moved from the white list to the grey list in 2018, where our data show high stability; hence, it remained on the grey list in 2019. Countries such as Spain and Portugal remain at the limit between white and grey characteristics, appearing at the bottom of the white list. On the black list, Belize showed significant movement, even belonging to the grey list before stabilising in the black area; it currently appears at the top of the black list. Finally, while the Cook Islands has improved in recent years, it has not been enough to move it to the grey list, although the country did move up a few places on the black list. Overall, these results are relevant in that using our proposed method, the evolution of a country’s performance over time can be analysed and the classification obtained can be compared with the country´s classification in the Paris MoU lists, which identifies whether registered ships comply with maritime safety standards. We again verify the evolution in performance as the results coincide with the Paris MoU lists, even for 2019 and 2020, thanks to the high stability of the data.

3.2. X-STATIS Analysis of the Different Classification Certificates Recorded in PSC Inspections

We can also differentiate between the PSC inspections using the ship’s classification society. For this part of the investigation, we employed heterogeneous data from thirty different classification certificates (Table S2). In this case, there are matrices (years) with missing data. Therefore, in an analogous process to that described in the previous section, the objective centres around the creation of the compromise matrix, which summarises the information from the study period.
In the compromise subspace created by the resulting matrix, a value that synthesises the yearly information of the chosen variables (GrossTonnage, Age, InspectionType, Ndeficiencies) represents each classification certificate. This describes the behaviour of the different classification certificates and allows for comparison with their position in the Paris MoU lists. The subspace describes about 88% of the total information with the first two factorial axes (Figure 6).
In Figure 6, the grey, black and white coloured points represent the corresponding Paris MoU classification societies’ performance lists (white: high performance level; grey: medium performance level; black: low–very low performance level). As shown, there are differences between the variables depending on the classification certificate of each ship. The variables maintain the same structure as the previous analysis, although the relationship between inspection type and number of deficiencies is stronger. These two variables characterise the fourth quadrant, which means that certificates located in the quadrant have a larger number of deficiencies and are thus subjected to more exhaustive inspections. In contrast, certificates in the second quadrant have fewer deficiencies and are therefore subjected to less in-depth inspections. The variable GrossTonnage dominates the third quadrant, which indicates that certificates in this quadrant mostly represent large and young ships, while in the first quadrant the opposite holds.
This means that ships with a classification certificate from INCLAMAR, VRS, ML, IS and NASHA have a greater number of deficiencies, whereas classification certificates such as CCS, ABS, KRS, LR, NKK and DNVGL (Table S2) are associated with larger and younger ships with fewer deficiencies. These results coincide with the classification societies’ performance lists published annually by the Paris MoU across all levels of classification. For example, the first group of classification societies all appear on the low–very low Paris MoU performance list, while the second group are all on the high-performance list. As with the flags, the positions of the classification societies coincide with those on the Paris MoU performance lists, which means we could use our method for classification. We use the list published in 2019 as a verification test, and the results coincide with this study.
We also conduct a second verification test using the classification societies in the IACS, including ABS, BV, CCS, DNV, IR, KR, LR, NKK, PRS, RINA and RS. We find that all societies in the IACS are in the group with the least number of deficiencies, and thereby associated with younger and larger ships.

4. Conclusions

This study analysed PSC inspections using a new methodology, which detected a series of trends within the variability of the variables selected, from the starting point of ten ports (the most important ports in the Paris MoU region). In the X-STATIS structure formed by the variables, there is a clear and direct relationship between ship age and the number of deficiencies, as well as between age and ship dimensions. Both relationships mark the characteristics of a substandard ship profile: that of smaller, older vessels having many deficiencies. At the other extreme are the larger, newer vessels, with far fewer deficiencies. This analysis technique allows us to identify ships of high risk to maritime safety. The structure formed by the variables also validates the choice of these variables as they are strongly related to each other.
The X-STATIS analysis of the country of registry yields three distinct groups:
  • Countries found in the left semi-plane in Figure 4 have younger ships with a higher gross tonnage and fewer deficiencies and appear on the Paris MoU white list, which verifies and validates this analysis.
  • Countries with older vessels of a smaller dimension have a higher number of deficiencies. All these countries appear on the Paris MoU grey list and are found in the right semi-plane of Figure 4.
  • Countries classified on the Paris MoU black list, appear on the rightmost area of the plane, and display the worst characteristics.
This classification based on flag coincides entirely with the Paris MoU performance lists published throughout our study period. For this reason, we could use this methodology to classify the performance of these flags in the future or even flags that are as yet unclassified. Additionally, it could be an adequate tool to analyse the evolution of the flags over time. We also measure the results against the Paris MoU lists from 2013 to 2018 and validated them using the 2019 list.
The analysis of the different classification certificates identified in the PSC inspections indicates a differentiation into definite groups. We can easily associate vessels with a larger number of deficiencies with a specific group of classification societies (GMB, INCLAMAR, VRS, ML, IS and NASHA). Conversely, we can also associate larger, younger vessels with fewer deficiencies with a different group (CCRS, CCS, ABS, KRS, LR, NKK and DNVGL), all belonging to the IACS. This analysis coincides with the results of the annually published Paris MoU performance lists, which reaffirms this as a valid classification method.
With respect to the chosen variables and the application of the STATIS method, we can confirm that representing an inspection result with the number of detected deficiencies is a good indicator for classifying ships and societies. In conclusion, this multivariant methodology applied to PSC inspections serves to ably classify both flag and classification society performance, and therefore could serve as a complementary indicator of ship risk profile. This would assist maritime authorities with inspection priority decisions and would therefore help improve maritime safety.

Supplementary Materials

The following are available online at https://www.mdpi.com/article/10.3390/math9172092/s1. Table S1: Frequency distribution of inspections by flag and year; Table S2: Frequency distribution of Inspection by Classification certificate and year.

Author Contributions

Conceptualisation, F.P. and I.T.; methodology, D.A., V.A. and I.T.; software, V.A. and J.M.P.; validation, F.P. and I.T.; formal analysis, D.A. and V.A.; investigation, J.M.P.; resources, F.P. and I.T.; data curation, V.A.; writing—original draft preparation, J.M.P., V.A. and D.A.; writing—review and editing, J.M.P., V.A. and D.A.; visualisation, F.P. and I.T.; supervision, F.P., I.T. and D.A.; project administration, F.P. and I.T.; funding acquisition, F.P., I.T. and D.A. All authors have read and agreed to the published version of the manuscript.

Funding

This research was funded by University of Cádiz.

Institutional Review Board Statement

Not applicable.

Informed Consent Statement

Not applicable.

Data Availability Statement

Paris Memorandum of Understanding (Paris MoU), https://www.parismou.org/publications-category/performance-list (accessed on 9 July 2021); International Association of Classification Societies (IACS), https://www.iacs.org.uk/quality/members-certificates/ (accessed on 9 July 2021); European Maritime Safety Agency (EMSA), https://portal.emsa.europa.eu/web/thetis (accessed on 9 July 2021); Eurostat, https://ec.europa.eu/eurostat/web/main/data/database (accessed on 9 July 2021).

Acknowledgments

We would like to thank Lafuente Molinero, Luis for his assistance in processing the data.

Conflicts of Interest

The authors declare that there is no conflict of interest regarding the publication of this paper.

References

  1. Piniella, F.; Alcaide, J.I.; Rodríguez-Díaz, E. The Panama Ship Registry: 1917–2017. Mar. Policy 2017, 77, 13–22. [Google Scholar] [CrossRef]
  2. Piniella, F.; Alcaide, J.I.; Rodríguez-Díaz, E. Identifying stakeholder perceptions and realities of Paris MoU inspections. WMU J. Marit. Aff. 2020, 19, 27–49. [Google Scholar] [CrossRef]
  3. International Maritime Organization. Port State Control, Model Course 3.09; IMO Pub: London, UK, 2001. [Google Scholar]
  4. International Maritime Organization. Procedures for Port State Control, Code of Good Practice, Resolution A. 1052(27); Adopted on 30 November 2011; IMO Pub: London, UK, 2011. [Google Scholar]
  5. International Maritime Organization. Procedures for Port State Control: Resolution A.787(19); as amended by resolution a.882(21); IMO Pub: London, UK, 2012. [Google Scholar]
  6. International Maritime Organization. Procedures for Port State Control. 2019. Available online: https://www.imo.org/en/OurWork/IIIS/Pages/Port%20State%20Control.aspx (accessed on 2 June 2021).
  7. Paris MoU. Performance Lists. Available online: https://www.parismou.org/publications-category/performance-list (accessed on 12 June 2021).
  8. International Association of Classification Societies (IACS). Members’ Certificates. Available online: https://www.iacs.org.uk/quality/members-certificates/ (accessed on 21 June 2021).
  9. European Maritime Safety Agency (EMSA), THETIS. Available online: https://portal.emsa.europa.eu/web/thetis (accessed on 6 May 2021).
  10. Brooks, M.R. The privatization of ship safety. Marit. Policy Manag. 1996, 23, 271–288. [Google Scholar] [CrossRef]
  11. Havold, J.I. Culture in maritime safety. Marit. Policy Manag. 2000, 27, 79–88. [Google Scholar] [CrossRef]
  12. Knapp, S. Analysis of Themaritime Safety Regime: Risk Improvement Possibilities for the Port State Control Target Factor (Paris MoU). Master’s Thesis, Erasmus University Rotterdam, Rotterdam, The Netherlands, 2004. Available online: https://personal.eur.nl/knapp/Erasmus%20Thesis%20Knapp%20final.pdf (accessed on 5 May 2021).
  13. Knapp, S.; Franses, P.H. A global view on port state control: Econometric analysis of the differences across port state control regimes. Marit. Policy Manag. 2007, 34, 453–482. [Google Scholar] [CrossRef]
  14. Knapp, S.; Franses, P.H. Econometric analysis on the effect of port state control inspections on the probability of casualty: Can targeting of substandard ships for inspections be improved? Mar. Policy 2007, 31, 550–563. [Google Scholar] [CrossRef]
  15. Knapp, S.; Van de Velden, M. Visualization of Differences in Treatment of Safety Inspections across Port State Control Regimes: A Case for Increased Harmonization Efforts. Transp. Rev. 2009, 29, 499–514. [Google Scholar] [CrossRef]
  16. Bijwaard, G.E.; Knapp, S. Analysis of ship life cycles—The impact of economic cycles and ship inspections. Mar. Policy 2009, 33, 350–369. [Google Scholar] [CrossRef]
  17. Knapp, S.; Franses, P.H. Comprehensive Review of the Maritime Safety Regimes: Present Status and Recommendations for Improvements. Transp. Rev. 2010, 30, 241–270. [Google Scholar] [CrossRef]
  18. Li, K.X.; Zheng, H. Enforcement of law by the Port State Control (PSC). Marit. Policy Manag. 2008, 35, 61–71. [Google Scholar] [CrossRef]
  19. Bang, H.-S.; Jang, D.-J. Recent Developments in Regional Memorandums of Understanding on Port State Control. Ocean Dev. Int. Law. 2012, 43, 170–187. [Google Scholar] [CrossRef]
  20. Li, K.X.; Yin, J.; Fan, L. Ship safety index. Transp. Res. Part A Policy Pract. 2014, 66, 75–87. [Google Scholar] [CrossRef]
  21. Özcayir, Z.O. The use of port state control in maritime industry and application of the Paris MOU. Ocean Coast. Law J. 2008, 14, 201–240. Available online: https://digitalcommons.mainelaw.maine.edu/oclj/vol14/iss2/4 (accessed on 18 May 2021).
  22. Wu, J.; Jin, Y.; Fu, J. Effectiveness evaluation on fire drills for emergency and PSC inspections on board. TransNav Int. J. Mar. Navig. Saf. Sea Transp. 2014, 8, 229–236. [Google Scholar] [CrossRef] [Green Version]
  23. Ravira, F.J.; Piniella, F. Evaluating the impact of PSC inspectors’ professional profile: A case study of the Spanish Maritime Administration. WMU J. Marit. Aff. 2016, 15, 221–236. [Google Scholar] [CrossRef] [Green Version]
  24. Graziano, A.; Cariou, P.; Wolff, F.-C.; Mejia, M.Q.; Schröder-Hinrichs, J.-U. Port state control inspections in the European Union: Do inspector’s number and background matter? Mar. Policy 2018, 88, 230–241. [Google Scholar] [CrossRef] [Green Version]
  25. EUR-Lex. Directive 2009/16/EU, of the European Parliament and of the Council, of the 23 April, on the Control of Ships by the Port State Control Amended by Directive 2013/38/EU. 2009. Available online: https://eur-lex.europa.eu/eli/dir/2013/38/oj (accessed on 5 June 2021).
  26. Wang, S.; Yan, R.; Qu, X. Development of a non-parametric classifier: Effective identification, algorithm, and applications in port state control for maritime transportation. Transp. Res. Part B Methodol. 2019, 128, 129–157. [Google Scholar] [CrossRef]
  27. Chen, J.; Zhang, S.; Xu, L.; Wan, Z.; Fei, Y.; Zheng, T. Identification of key factors of ship detention under Port State Control. Mar. Policy. 2019, 102, 21–27. [Google Scholar] [CrossRef]
  28. Knapp, S.; Heij, C. Improved strategies for the maritime industry to target vessels for inspection and to select inspection priority areas. Safety 2020, 6. [Google Scholar] [CrossRef] [Green Version]
  29. Chen, X.; Qi, L.; Yang, Y.; Lou, Q.; Postolache, O.; Tang, J.; Wu, H. Video-Based Detection Infrastructure Enhancement for Automated Ship Recognition and Behavior Analysis. J. Adv. Transp. 2020, 2020, 1–12. [Google Scholar] [CrossRef] [Green Version]
  30. Li, B.; Gao, S.; Li, C.; Wan, H. Maritime Buoyage Inspection System Based on an Unmanned Aerial Vehicle and Active Disturbance Rejection. Control. IEEE Access 2021, 9, 22883–22893. [Google Scholar] [CrossRef]
  31. Wang, Y.; Zhang, F.; Yang, Z. Incorporation of deficiency data into the analysis of the dependency and interdependency among the risk factors influencing port state control inspection. Reliab. Eng. Syst. Saf. 2021, 206, 107–277. [Google Scholar] [CrossRef]
  32. Eurostat. Database. Maritime Transport of Goods, (n.d.). Available online: https://ec.europa.eu/eurostat/web/main/data/database (accessed on 7 May 2021).
  33. Jaffrenou, P.A. Sur L’analyse des Familles Finies de Variables Vectorielles: Bases Algébriques et Application à la Description Statistique. Postgraduate Thesis, University of Saint-Etienne, Saint-Etienne, France, 1978. [Google Scholar]
  34. Escoufier. Opérateur associé à un tableau de données. Ann. Insee 1976, 165. [Google Scholar] [CrossRef]
  35. L’Hermier des Plantes, H. Structuration des Tableaux à Trois Indices de la Statistique: Théorie et Application d’une Méthode d’Analyse Conjointe. Ph.D. Thesis, Languedoc University of Sciences and Techniques, Montpellier, France, 1976. [Google Scholar]
  36. Thioulouse, J.; Chessel, D.; Dolédec, S.; Olivier, J.M. ADE-4: A multivariate analysis and graphical display software. Stat. Comput. 1997, 7, 75–83. [Google Scholar] [CrossRef]
Figure 1. Interstructure analysis flow chart in X-STATIS.
Mathematics 09 02092 g001
Figure 2. Compromise analysis flow chart in X-STATIS.
Mathematics 09 02092 g002
Figure 3. Representation of the X-STATIS interstructural analysis by year.
Mathematics 09 02092 g003
Figure 4. Representation of the 51 countries and four variables on the compromise matrix subspace.
Mathematics 09 02092 g004
Figure 5. X-STATIS analysis trajectories for countries between 2013 and 2018.
Mathematics 09 02092 g005
Figure 6. Representation of the compromise matrix subspace, 30 classification certificates and four variables.
Mathematics 09 02092 g006
Table 1. Inspected ship variables.
VariableDescription
Classification certificateClassification society
Recognised private organisation that certifies the ship is in good condition (chosen by shipowner)
FlagCountry of registry
Country where the ship is registered (chosen by shipowner)
AgeAge of ship
Gross tonnageRegistered gross tonnage (GT)
Dimensional number indicating ship size
Table 2. Inspection variables.
VariableDescription
Type of InspectionType of inspection a ship undergoes
The type and depth of inspection depends on the ship’s risk profile and the priority factor
Number of DeficienciesNumber of deficiencies found during inspection
Table 3. Weights and quality of representation of each matrix on the compromise.
YearWeightsCos2
20134.09 × 1020.575
20143.29 × 1020.502
20154.31 × 1020.639
20163.97·× 1020.505
20174.21 × 1020.617
20183.99 × 1020.533
Publisher’s Note: MDPI stays neutral with regard to jurisdictional claims in published maps and institutional affiliations.

