1. Introduction
The concept of electronic learning (e-learning) was developed to offer online courses to learners where they can perform educational activities from anywhere using electronic devices. Consequently, the transition from traditional to e-learning education has introduced numerous opportunities, goals, and challenges for schools, teachers, and learners. On the other hand, technological advances have gradually increased the quality in lecture delivery and effectiveness of learning materials [
1]. In just a few years, researchers have identified multiple challenges related with e-learning or online education. For example, measuring e-learning’s effectiveness, solving technological issues [
2], facilitating teacher/learner communication, conducting online assessments [
3], and evaluating their impact on student performance all require further study [
4]. However, scholars have identified positive developments that will ultimately enhance the credibility and importance of e-learning. Learning management systems (LMS) represent one of these major developments in the e-learning and online education field.
LMS has been playing an essential role in the success of e-learning tools used to facilitate different stakeholders such as teachers, students, and administrative staff. These tools create a symbiotic digital classroom environment where teachers and students communicate effectively with each other. Screen sharing, conduct and attendance monitoring, and online assessment and reporting are some essential feature of LMS [
5]. Over time, with support of modern e-learning tools (i.e., LMS), enhanced network infrastructure and high-speed internet service have overcome several hurdles and provide extra support to the educational institutions by improving the quality of online education [
6]. Meanwhile, schools’ and teachers’ main concerns are to analyze the effectiveness of e-learning tools and proactively assess the student’s performance from multiple perspectives. Researchers have developed several methods to measure student performance using diverse and innovative techniques; machine learning (ML) is one of them.
ML is a branch of artificial intelligence (AI) that provides a number of approaches for data analytics to discover hidden patterns and train systems for future prediction [
7]. Recently, one study demonstrated that ML algorithms could predict student performance. The main purpose of that research was to identify student engagement during various tasks required during the virtual session. Random forest and logistic regression were two models used in that study that obtained 66% and 63% accuracy, respectively [
8]. One of the key features of ML is a training model using different dependent and independent attributes, which further depends on the type of learning algorithm (supervised, semi-supervised, or unsupervised). ML algorithms are widely used for prediction purposes and applied to provide solutions to questions such as global solar radiation [
9], accuracy in determining the mortality rate in COVID-19 patients [
10], and efficient processes for manufacturing industries [
11]. In addition, ML algorithms assist the educational sector to evaluate student performance [
12], forecast student dropout rates in any course [
13], and understand students’ unique learning styles [
14]. Due to ML’s vast and dynamic implementation and its capability to learn from any dataset, and predict and classify future transactions, we have selected multiple ML algorithms for this study.
Accordingly, this study proposes a model illustrating an intelligent decision support system using ML algorithms. The main purpose of an intelligent system is to provide a comprehensive and efficient mechanism for predicting student performance. Similar ideas presented in research show positive implementation of a three-layer machine learning approach in the proposed intelligent system [
15]. This highlights the fact that ML algorithms can provide high support to an intelligent decision support system. Based on the performance of the system, educational institutions can find support in making decisions about a variety of issues such as potential dropouts, pass and fail ratios, grading and assessment schemes, participation levels, and learning styles.
This study focuses on one of the major challenges identified in an e-learning environment: “how to predict the students’ performance based on their participation and involvement recorded on an e-learning tool”. Therefore, this paper presents “an integrated ML approach using ensemble methods to predict student performance and make intelligent decisions for improving their performance”. This paper is organized as follows: the next section summarizes related work in this area of research.
Section 3 explains the methodological approaches applied in this study. Model implementation and results are presented in
Section 4 and
Section 5, respectively. Finally, the paper concludes by providing the major findings and future directions in this research field.
2. Related Work
This research seeks to develop an integrated model for analyzing student data collected from e-learning systems, precisely to help educational institutions predict student performance. The idea has been presented previously by scholars from diverse perspectives. It is often explained using attributes such as student advising and monitoring [
16]. Others articulated the performance model based on student educational outcome [
17] and assessment of student’ achievements [
18]. Whereas predicting the dropout ratio in an online educational system was frequently applied and investigated with different datasets and using multiple techniques [
19,
20,
21], nevertheless, the idea of building frameworks for analyzing, measuring, and predicting educational performance has been widely implemented using either traditional classroom data [
22] or e-learning educational data [
23].
Earlier research postulates several machine learning algorithms used for predictive learning, applied using different datasets. Predictive learning is a common approach used for statistically analyzing the previous dataset to understand, assess, and explain common patterns from the dataset. The main purpose of this learning process is to predict future datasets based on the assumptions identified in previous step. There are different approaches used for prediction purposes such as random forests, neural networks, support vector machines, and others [
24]. Regarding educational institutions, a predictive machine learning approach can be useful to improve the quality of education and student performance by understanding the relationship among different attributes [
25]. For example, a predictive model was presented [
26] using multiple classifiers: artificial neural network (ANN), naïve Bayes (NB), and decision tree (DT) applied to an e-learning management system dataset known as Kalboard 360. In addition, the model was integrated by ensemble techniques (bagging, boosting, and random forest) to further enhance the model’s performance. Specifically, the idea was somewhat unique as the dataset contains students’ behavioral features in addition to academic performance attributes. The use of ensemble methods with behavioral factors has demonstrated better accuracy; whereas the “visited resources” is considered one of the most effective features expressed in the dataset.
Similarly, using the same dataset extracted from Kalboard 360, another approach explored the idea, importance, and credibility of the dataset to measure the student’s performance using multiple features [
27]. However, the prediction model used a different strategy by applying multiple regression models—logistic, decision tree, and others. The results indicated that out of seven supervised ML models, the log-linear regression model demonstrated better performance. The research further provides evidence and supports the idea of using behavioral factors to improve the performance of the model by merging them with academic features.
As discussed earlier, virtual learning environments highlight unique challenges, especially engagement and communication between students and teachers. The same challenge was discussed in a recently published article focusing on the level of student involvement by analyzing live interactive sessions [
8]. During the sessions, 18 students were asked various questions by the moderator. The dataset analyzed the answers using different supervised ML algorithms to detect the students’ performance on regional bases. Overall, random forest obtained high accuracy and recorded 67% predictions correctly. Another experiment using an ensemble meta-based approach integrated the ensemble technique with other classification models. Naïve Bayes, multilayer perceptron, J48, and decision table algorithms used in the experiment employed boosting and bagging methods [
28]. This research also used the dataset generated from the learning management system, providing another example of the machine learning approach applied to illustrate the connection between student’s interaction with an e-learning system and to predict their academic performance. The experiment results produced the highest prediction performance recorded by multiplayer perceptron, measured at 80.33%.
Since the research problem undertaken in this study has been discussed by multiple scholars using different ML algorithms in datasets, this study mainly focused on predicting student performance using academic and behavioral features. Specifically, the dataset selected in this work is generated from the e-learning management system called Kalboard 360. The above discussion presented a comparative overview of the research conducted in the same area. Furthermore, based on the initial finding of this study, with the help of a literature review, we have selected the most implemented and common models to predict student performance. The details of each model and procedural step applied in this paper is presented in the next section. At this stage, we have presented the major findings of this study in
Table 1, which highlights the number of models used and specifically their performances measured in previous work using Kalboard 360 dataset. This study’s focus is improving the prediction performance by integrating multiple machine learning models applied together in a single process. Moreover, the hybrid approach applied in this research used different combinations of algorithms to enhance the prediction ratio.
3. Intelligent Decision Support System—Methodology
This section describes the overall approach used in this study to illustrate the implementation of an intelligent decision support system that can predict the student’s performance using an ML approach. This study applies the predictive decision-making approach that can learn the behavior of multiple attributes from the given dataset and can be useful for future applications. Therefore, an explanation of the research framework for intelligent decision support systems, datasets, and a description of decision tree models is presented in the following sub-sections.
3.1. Proposed Framework—Stepwise Implementation
The significance of online education, specifically during a pandemic, is very crucial for educational institutions. Countries around the world are trying to set new policies, standards, and procedures to facilitate their educational systems. Online e-learning is one of the strategies applied broadly to continue uninterrupted education and learning [
30,
31]. Meanwhile, their main concern is to understand, analyze, and measure student learning performance using different measures. The thesis presented in this study supports schools by providing them an intelligent system that can measure the student’s e-learning performance based on the data extracted from online tools.
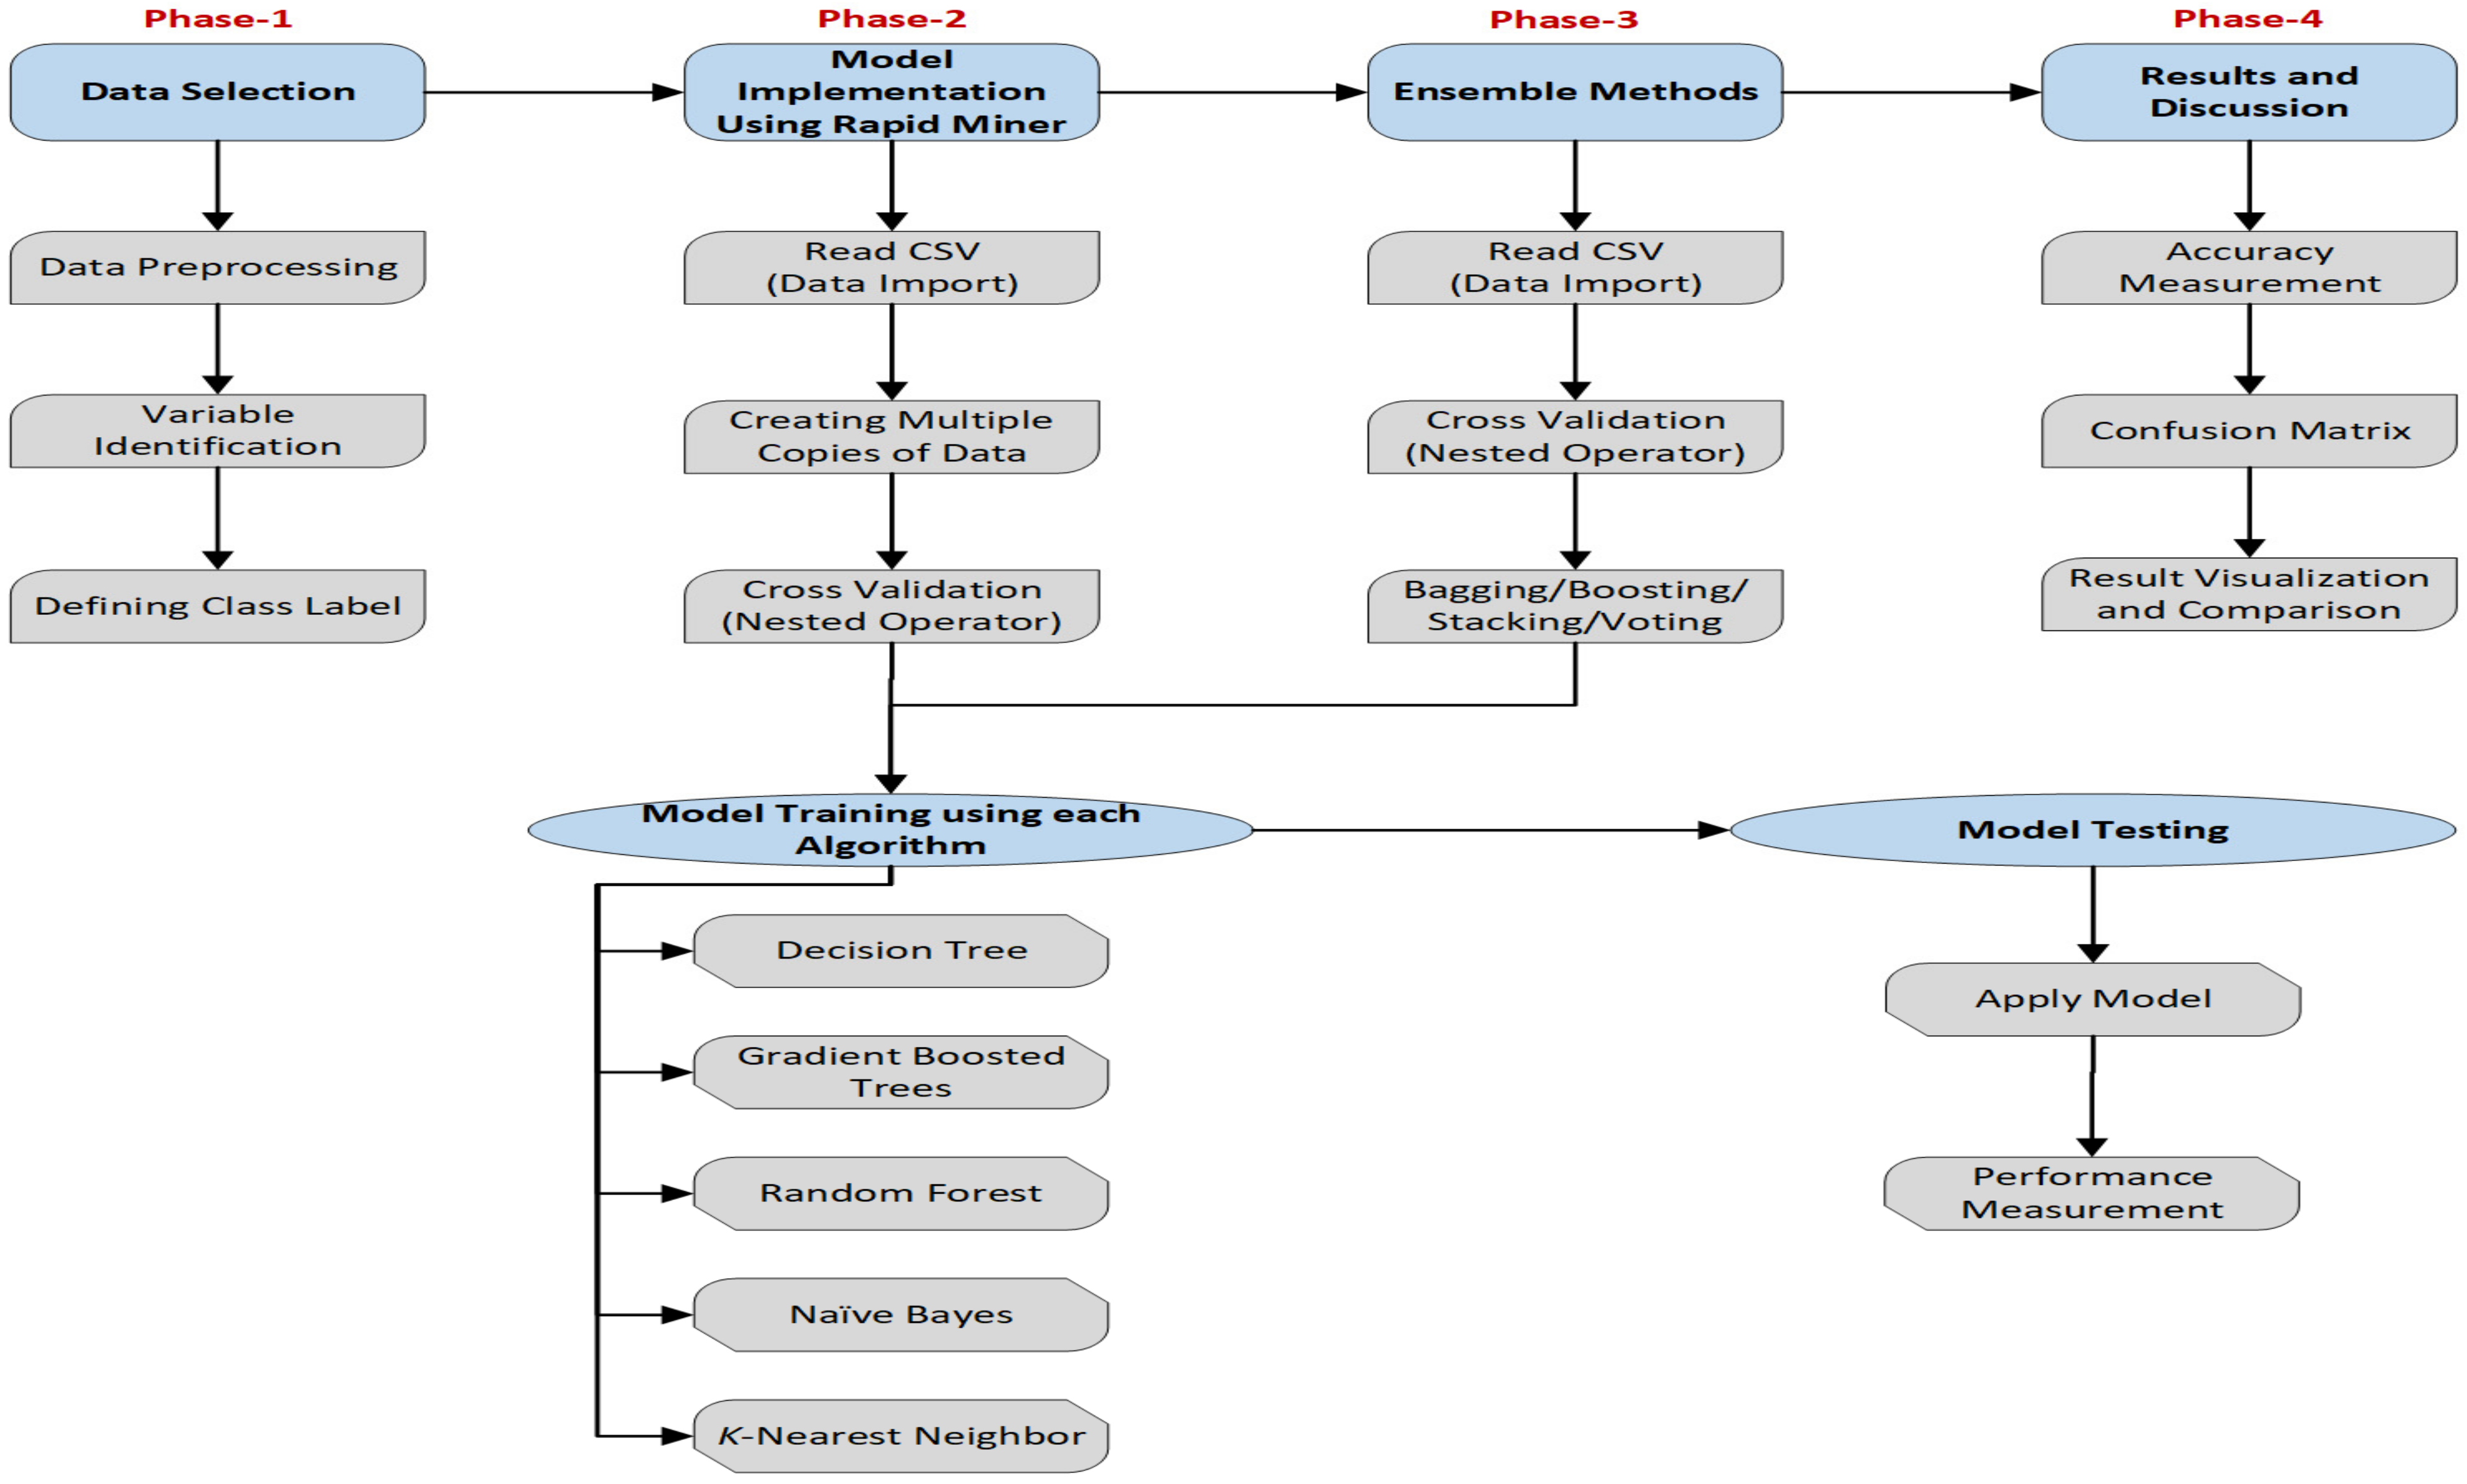
Therefore, this study proposes a framework, as shown in
Figure 1, that represents a stepwise approach for implementing intelligent systems. The framework has five major phases as can be seen in the following diagram. Phase 1 is data collection; in this study, we used the Kalboard 360 e-learning dataset. In this phase, further multiple pre-processing techniques applied such as missing values adjustment, normalization, outlier detection, and others. Originally, the dataset was extracted by Elaf et al. from Kalboard 360 LMS using a learner activity tracker tool [
26]. This study collected the dataset published on the Kaggle website [
32]. The data has been analyzed and checked thoroughly and there was no missing data in the file. Further variable identification and class label definition occurred after a thorough review of the dataset. At that point, the dataset was ready for the next phase.
Phase 2 in the proposed system prepares and applies the ML model using Rapid Miner (RM), an open source software developed specifically for data science and machine learning tasks [
33]. The first step in this phase is to connect or import the dataset using Read_CSV (an operator in RM). To prepare and run the experiment simultaneously using all algorithms, multiple copies of data were created in the next step. Finally, each copy of the dataset was connected with a different cross-validation operator, which was embedded further with DT, GBT, and RF for training and testing purposes, respectively.
Moreover, to check and enhance the model performance, four ensemble methods—bagging, boosting, stacking, and voting—were applied in phase 3. In this phase, all ensemble methods are applied separately in different experiments. All of the ensemble methods were used as nested operators in the Rapid Miner. For example, bagging (nested operator in RM) was applied and executed five times using five different ML models; therefore, each ML algorithm was applied in the training section and validated in the testing part. Finally, phase 4, the last step, provides comprehensive feedback, analysis, and comparison among all experiments. This phase is important to learn the identified patterns and association found in the dataset using ML algorithms. In addition, different metrics have been used to illustrate the results from multiple perspectives. In the last part of this study, the authors provide a comparative study by exploring the model’s performance and accuracy with previous work.
Overall, eleven different experiments were conducted for the proposed framework implementation and to predict student performance using multiple factors. To make it a fair test, each experiment used the same copy of the dataset using a 10-fold cross validation approach but different model criteria. The configuration and criteria for each ML model and framework implementation using RM is presented in
Section 4.
3.2. Dataset Description
The main purpose of this study is to assess student performance and participation recorded with an online learning management system. To implement and validate the model, there is a need to use a dataset collected for similar research. The authors applied multiple approaches to collect the dataset from educational institutions, but due to confidentiality reasons, the schools were unable to provide datasets. Subsequently, the researchers explored different online repositories by using keywords such as “student performance”, “machine learning data”, “learning management system data” and found a suitable dataset from the Kaggle repository [
32]. The chosen dataset neatly dovetailed with the research questions and objectives of this study; additionally, the dataset was prepared for classification and the predictive learning approach.
As discussed earlier, this study used the Kalboard 360 dataset collected from Kaggle. The dataset was collected initially to measure student performance specifically in an e-learning environment. The dataset was extracted with the help of an activity tool known as experience API (xAPI). Altogether, it has 17 attributes and 480 records having different characteristics. Mainly, all attributes can be classified as integer or categorical types. Furthermore, the dataset contained 305 male and 175 female students, which belong to multiple countries of origin. For example, 172 students belong to Jordan, 179 from Kuwait, 22 from Iraq, and so on [
32]. The selected dataset contains unique types of attributes compared to a traditional student dataset. For example, to understand student participation or usage of an online learning management system, the dataset has extracted multiple attributes such as “Visited Resources”, “Announcement View”, “Discussion”, and “Raise Hands”. This provides additional data to assess the students’ overall performance as these attributes help measure the students’ active participation during or after the lecture time. Occasionally, a student might need to miss all or part of a lecture; however, consistent responses to questions and participation in discussion room ultimately enhances student performance.
The dataset is useful for classification tasks and predictive ML models and can be categorized into three different sections based on its features: (i) demographic, (ii) academic, and (iii) behavioral. Apart from academic features in this dataset, it was selected for its inclusion of a novel feature known as behavioral factors. These factors represent student behavior during the lecture while connected with Kalboard 360 LMS. For instance, a raised hand during a lecture, a survey response, learning satisfaction, and the use of available resources demonstrate overall learner engagement. Other attributes selected in this dataset are gender, nationality, semester, discussion, and more. Finally, the dataset was classified using a “label” column known as a “Class” attribute. This attribute has three-level categories, e.g., “Low”, “Medium”, and “High”, to evaluate student performance in the class. The main purpose of using this dataset is to measure the performance of the students using different factors, specifically behavioral ones.
3.3. Description of Machine Learning Algorithms and Ensemble Methods
3.3.1. Decision Tree
Decision tree (DT) is one of the common algorithms belonging to the classification approach and it is useful for observing data by splitting them using a tree-based structure. The main purpose of splitting the data is to identify common behavior of the dataset, which further helps to measure the prediction accuracy [
34]. Based on logical rules, this algorithm creates and trains the classification tree consisting of leaf nodes and decision nodes. Furthermore, leaf nodes resemble routes, where, using logical values, the passing route will reach a particular decision node [
35]. It is commonly used, easy to implement, and specifically useful for classification and prediction at the same time. Recently, the algorithm has been widely applied by researchers and practitioners for different purposes such as telemarketing for banks [
36], retail banking [
37], medical data [
38], inventory systems [
39], and customer purchasing behavior prediction [
40]. In this study, the implementation of the DT algorithm is applied to the dataset collected from an e-learning management system’s data predicting student performance using different assessment and behavior factors. In addition, the DT algorithm was applied with ensemble methods such as boosting, bagging, stacking, and voting techniques to analyze the potential enhancement in the prediction ratio.
3.3.2. Random Forest
Random forest (RF) is another supervised learning method that can perform tasks related to classification and regression. It makes decisions using a collective approach by creating multiple trees (i.e., a forest). The benefit of this collective approach is that it trains multiple models and then combines them into a single tree. RF is known as an ensemble method that uses a single base learner model by combining and associating multiple decision trees. For combining trees, this algorithm normally uses the bagging or voting approach with random trees [
41,
42]. Ensemble learning uses different techniques such as bagging, boosting, voting, and stacking [
43].
The main purpose of creating multiple decision trees and merging them together is to achieve higher prediction and accuracy. By building multiple trees, the approach minimizes the variance and typically provides more accurate results [
44]. This method was applied several times on the educational dataset dealing with different problems [
13,
45,
46]. Therefore, the separation of multiple attributes using splitting rules make it easy to understand and useful for prediction purposes. This classification tree model of multiple attributes and data values will further help to reach the target node. In this study, firstly, the model was applied using the RM tool as an independent model. Secondly, the experiment was repeated by executing the process using multiple ensemble methods.
3.3.3. Gradient Boosted Trees
The purpose of this research is to create a classification model that can predict student performance using multiple attributes mainly related with student participation during the semester. Therefore, the third model selected in this study is known as gradient boosting trees (GBT). This is another example of a decision tree model falling under the category of classification and regression. This algorithm is also known as the forward learning ensemble method, which generates new predictions based on learning from the previous predictions. The word “boosted” is used for this model as it can perform extra efforts to improve the precision and accuracy of the decision model by learning from previous mistakes. The model is useful for analytical learning and provides a predictive score using a forward learning mechanism. It is also a tree-structure model that uses collaborative approach by combining weak trees and then converting them into a single strong model [
44].
GBT is commonly applied to educational datasets, which proved its implementation and usefulness for predicting multiple educational attributes. For instance, the idea of creating GBT to analyze and predict student performance was recently applied to the Brazilian public school system. The study proved that internal grades and number of absences are some of the major attributes that helped to generate good accuracy of the predicting model [
45]. In addition, to forecast the dropout ratio of registered students for online and on-campus studies, the gradient boosted decision tree model has been applied several times and successfully proved its prediction capability [
46,
47,
48]. Therefore, this classifier was also shortlisted in this study, which was applied with and without the ensemble method to assess the classifier performance and to check the effectiveness of the ensemble approach in providing better model accuracy.
3.3.4. Naïve Bayes
Naïve Bayes (NB) is another classification model used in this study. It is compatible with large datasets, easy to use, and applicable to analyze and predict using high-dimensional data [
49]. Using the Bayesian theorem, this algorithm calculates the probability for each class using multiple independent input variables. It has been described as a powerful ML algorithm due to its vast and strong implementation in different scenarios such as spam classification [
50], weather forecasting system [
51], and sentiment analysis [
52]. In this study, we used the NB model for predicting the student’s performance using multiple attributes. Firstly, the model applied as a single learner using different parameters to analyze the prediction accuracy. In addition, it further applied using different ensemble methods such as boosting, bagging, stacking, and voting. All scenarios are discussed in the implementation section, whereas model performance is shown in the result section.
3.3.5. k-Nearest Neighbor
The
k-nearest neighbor (KNN) is known as a supervised classification algorithm suitable for the ML approach. It is based on comparing unknown examples with
k training examples known as k nearest neighbor. The classification of a particular example to the nearest training example is based on distance measurement [
53]. As the dataset used in this study has a mixed type, the “Mixed Euclidean Distance” approach used to calculate the distance. KNN applied to the dataset for prediction purposes with and without ensemble methods. The performance of the classifier is further discussed in the result section.
3.3.6. Ensemble Method 1: Boosting
Boosting is a common ensemble technique used in machine learning for generating a strong model by combining multiple models. It performs this task simply by training a set of learning models in a row and then combining them based on identified errors found in learning models [
26]. AdaBoost, short for adaptive boosting, is one of the boosting algorithms that can be applied in combination with other learning algorithms. Implementing AdaBoost in the RM tool is known as a meta-algorithm and has the capability to execute the process by adding another algorithm as a sub-process. As it runs and trains multiple models, it then creates a single strong learner by combining weak learners, thus requiring extra computation and running time [
54]. The application of AdaBoost on educational datasets found in previous studies highlights the importance of boosting techniques [
55,
56].
In this study, AdaBoost is used as an ensemble method to train the classification model by combining five other algorithms as sub-processes. The main purpose of selecting AdaBoost is to reveal the performance and accuracy of decision-making models with and without boosted methods. Overall analysis and performance of the model is discussed in the results and discussion section.
3.3.7. Ensemble Method 2: Bagging
Bagging is the second ensemble technique selected in this study in conjunction with other classification models. The main purpose of selecting the second ensemble method is to enhance the performance of the classification model. Similar to boosting, bagging is also famous for its aggregation capability and is known as a meta-algorithm. The working scenario of this technique is based on bootstrapping, dividing the original dataset into multiple training datasets called bootstraps [
57]. The main purpose behind dividing the datasets is to create multiple models and then combine them to produce a strong learner. Recently, researchers applied this approach to build an educational decision support system, where the accuracy was recorded above 90% [
58]. In this study, the experiment was conducted with an RM tool using a learning management system’s data. This operator is also known as a nested operator, where the sub-process will have different learner models.
3.3.8. Ensemble Method 3: Stacking
Stacking is an approach that provides the facility to combine multiple models of different types to improve the prediction performance. The learning process in stacking is based on multiple models rather than selecting a single model from them. It is also known as a stacked generalization, where we can combine heterogeneous classifiers in a single run [
59]. In comparison with the bagging and boosting approach, the stacking approach provides a unique idea of ensemble learning by training the model using multiple classifiers and generate a meta-learner using the output [
60]. Therefore, this approach is known as a multi-layer approach, where the first layer is used for the base learner (multiple models) and the second layer known as meta-learning phase, which performs learning using the output generated by the first (base learner) layer. Finally, the model can be validated using a testing dataset [
61]. Due to its better learning process and performance, the stacking method applied in multiple fields such as earthquake causality prediction [
62], cancer classification [
59], and network intrusion detection [
63].
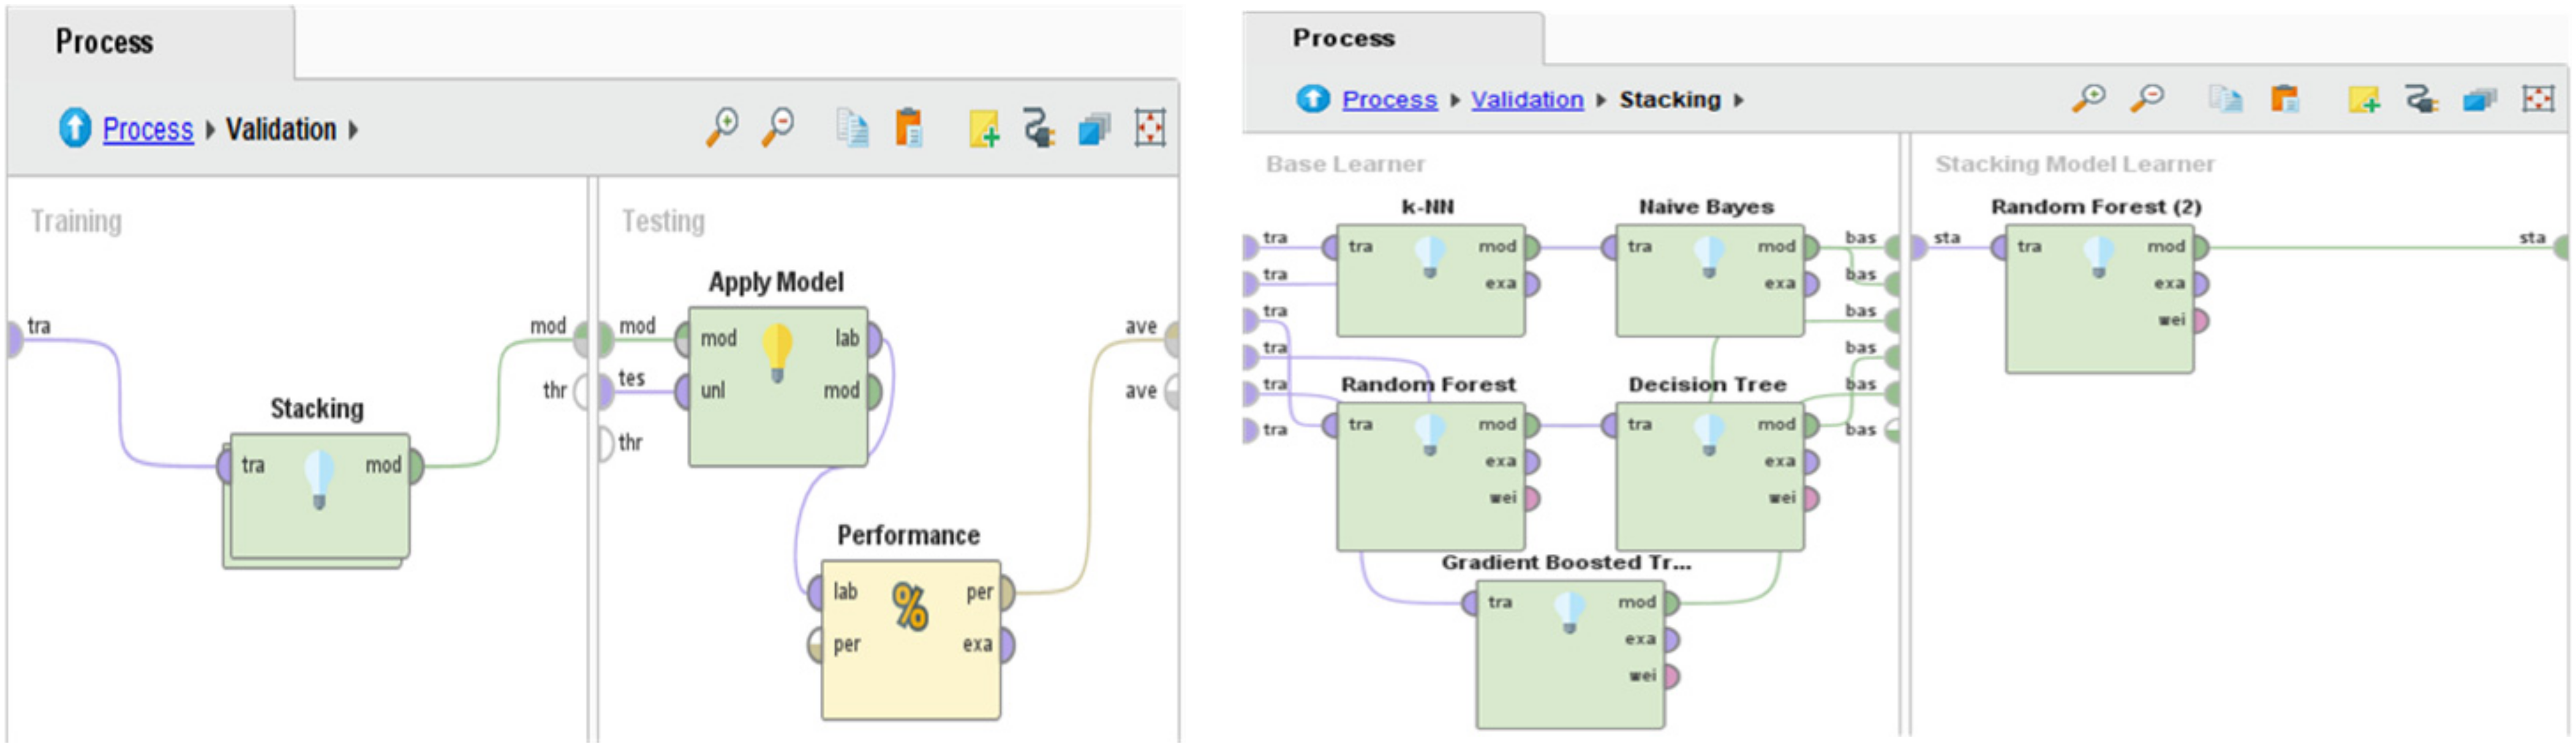
The process is applied in the Rapid Miner tool, where it consists of two main processes known as (i) Base Learner Process and (ii) Stacking Model Learner. The main purpose of stacking in this research is to perform evaluation by combining multiple models and to predict student performance better. We tried different combinations of base learners and meta-learner to assess, analyze, and compare the performances of different classifiers. For example, in stacking model 1, we selected KNN, NB, RF, DT, and GBT as base learners, and RF with information gain criteria were selected as a meta-learner. In stacking model 2, KNN, NB, ad RF used as base learners, and KNN applied as a meta-learner. In the last scenario (stacking model 3), KNN, NB, and RF were used as base learners and GBT as a meta-learner. The purpose of applying different types of classifiers is to search for the best performer and winning scenario.
3.3.9. Ensemble Method 4: Voting
This ensemble approach uses a voting procedure by integrating multiple ML algorithms. The voting procedure works as majority voting (for classification) and average voting (for regression) voted by the learning classifiers. The maximum vote or average received for a particular class will be predicted finally [
64]. In this study, we used classification approaches for predicting purposes; therefore, the “Vote” operator takes an example dataset from the input node and generates a classification model. The prediction process uses a majority voting strategy by taking votes from each classifier used under the “Vote” operator. For each instance, the maximum vote class will be assigned to the unknown example. The implementation of the voting ensemble approach implemented in this research using different classifiers. For comparison, we applied three voting scenarios by adding different classifiers in each model. The ML algorithms selected for each model are as follows: Voting Model 1 (GBT, KNN, NB, RF, and DT), Voting Model 2 (DT, RF, GBT), and Voting Model 3 (NB, KNN, RF). The performance of each model is discussed in the result section.
4. Model Implementation Using RM
The experiment was conducted using a tool known as RM, which is a common software developed for data science and machine learning tasks [
33]. This tool is widely selected and used by researchers around the world based on its range of capabilities and easy application [
65,
66,
67]. In the previous section, the description and details of the selected dataset were presented. Altogether, there were 17 attributes presented in the dataset and all of them were selected in this study. Out of 17, one variable was known as class column, while the remaining were independent variables. The dataset was applied in the experiment after proper pre-processing and preparation as discussed in the previous section. Moreover, the implementation used the same steps to proceed as defined in
Section 3.1.
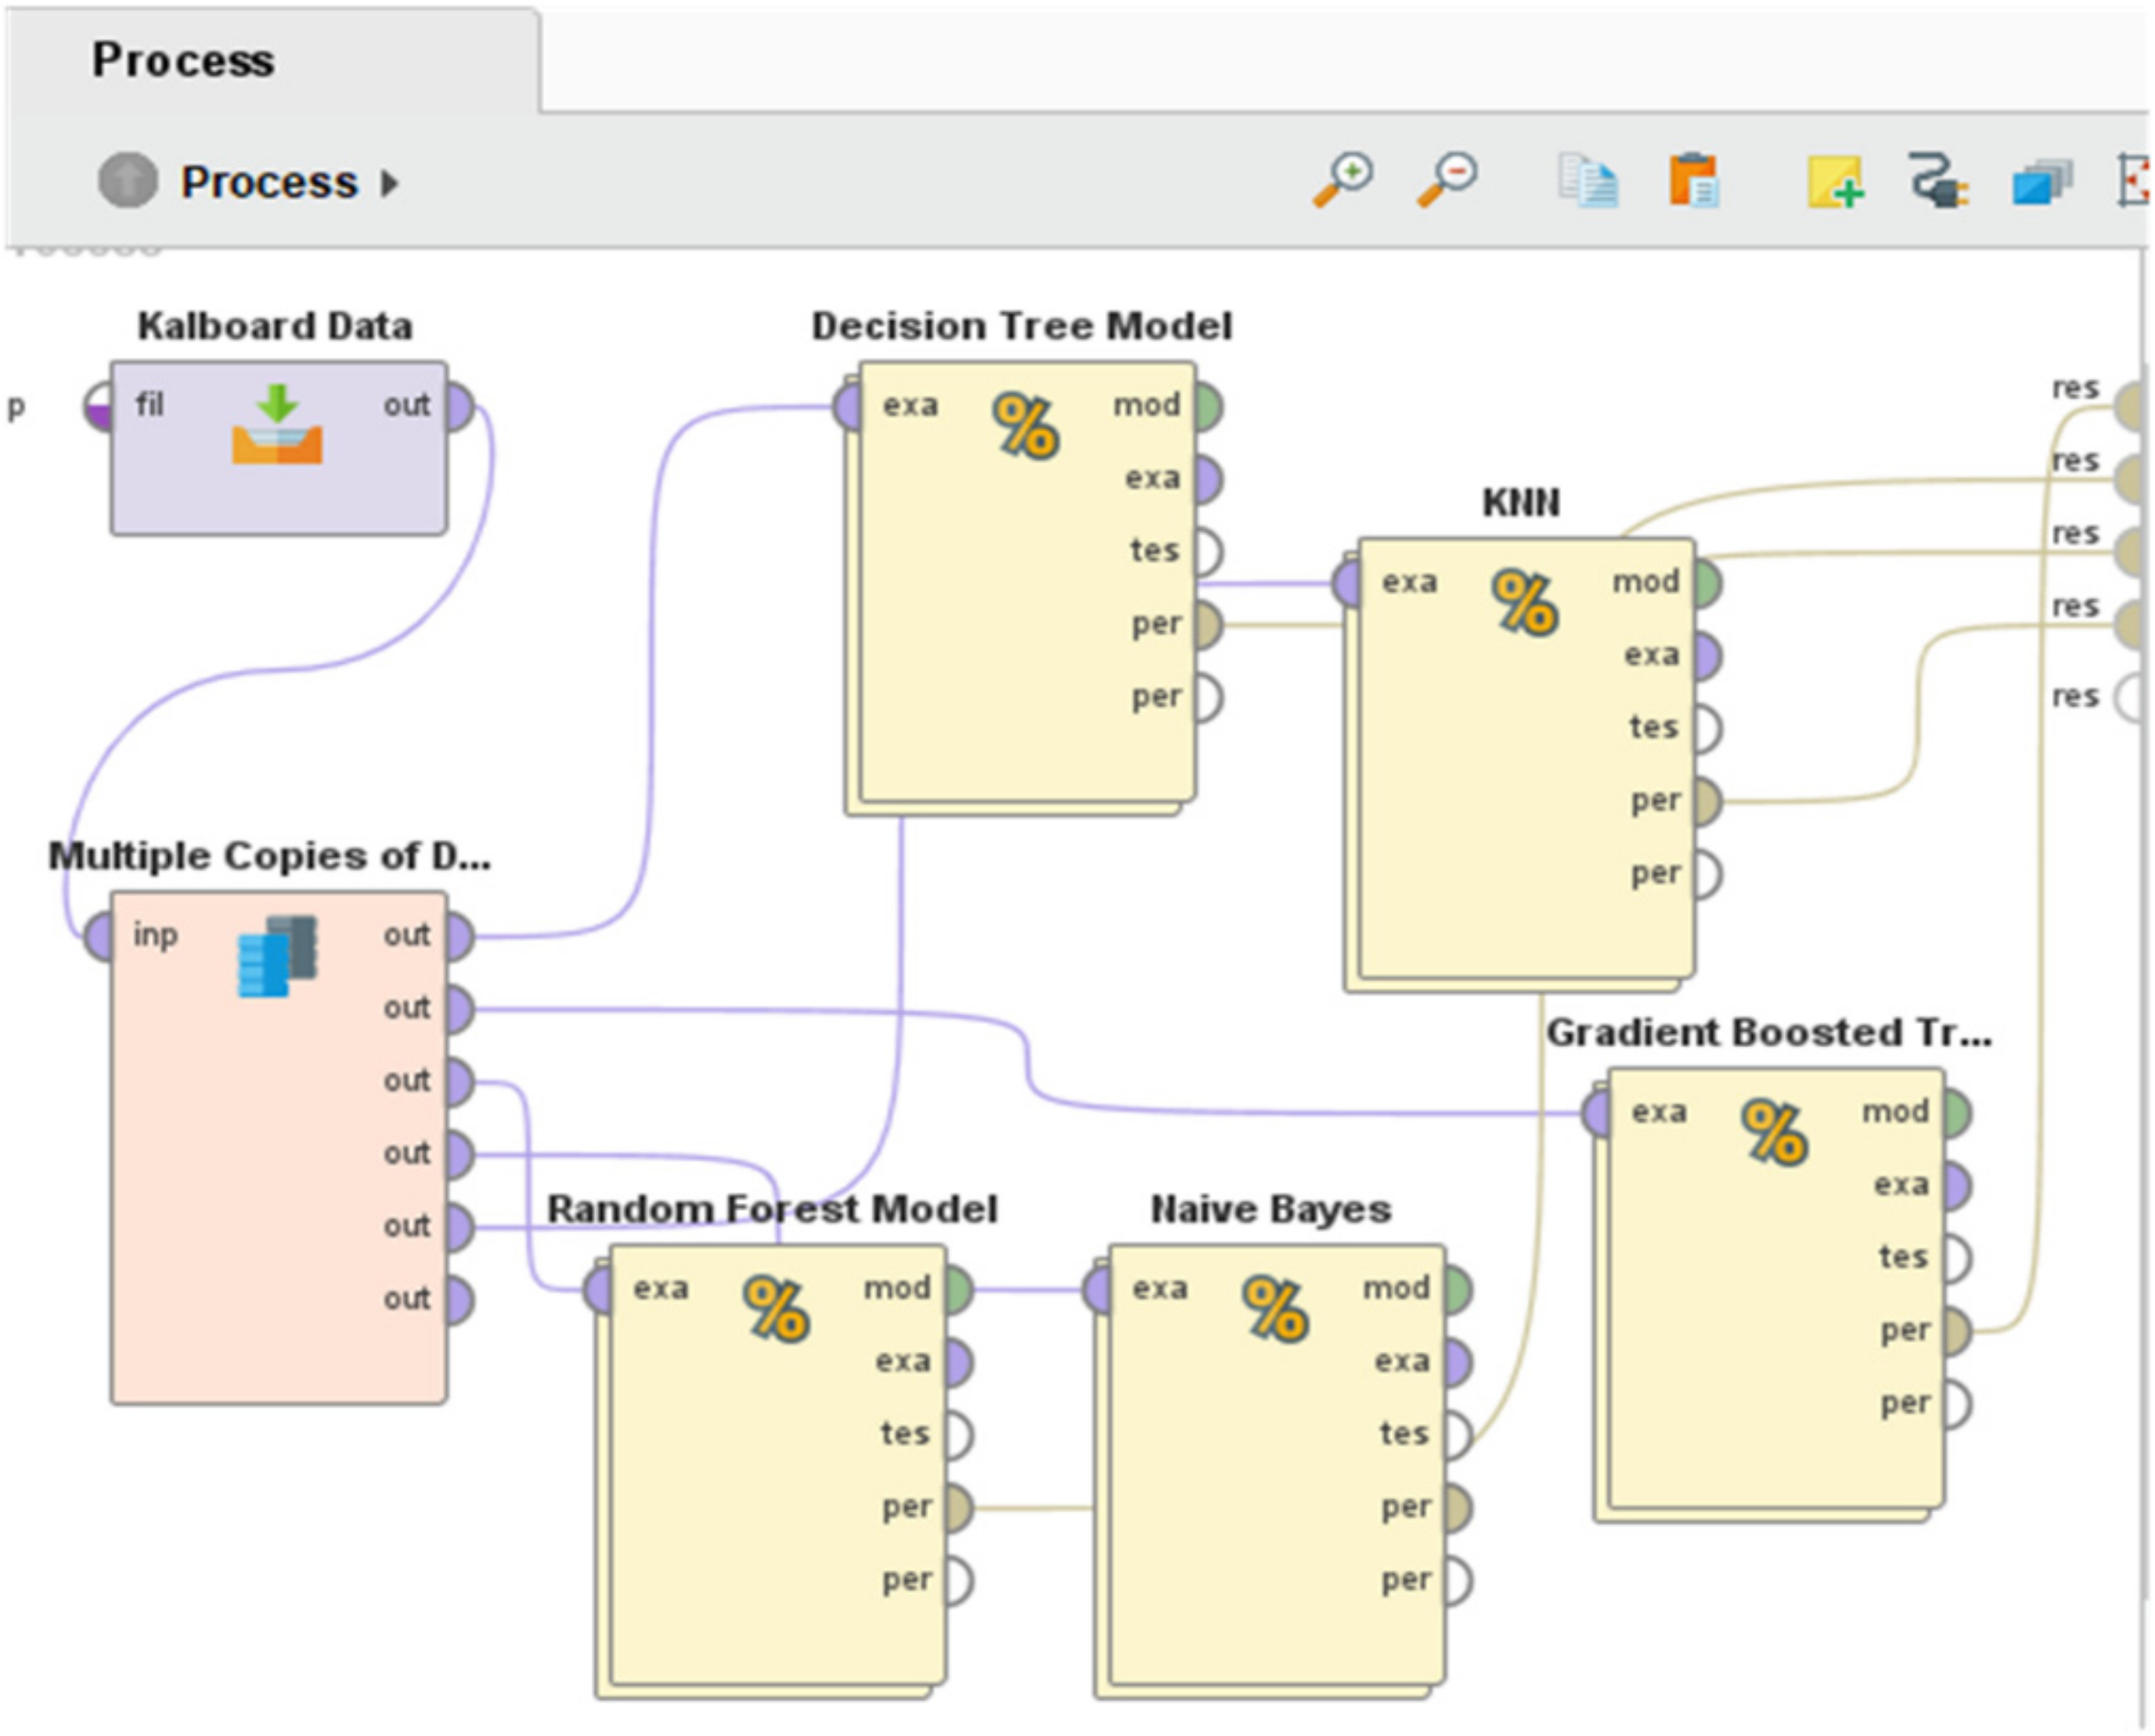
Firstly, the Kalboard dataset were named in the RM using operator “Read.CSV”, which is commonly used for reading data from the comma separated values file as shown in
Figure 2. This figure illustrates the first step applied in this experiment in which the model was prepared by applying ML algorithms without ensemble methods. Moreover, multiple copies of data were created as the dataset needs to be connected with multiple ML models. Furthermore, the model was applied using a 10-fold cross validation approach to achieve optimal accuracy by estimating the statistical performance of the learning model. As can be seen in this figure, the dataset connected with the “Cross Validation” operator, known as a nested operator in RM. It consists of two main sub-processes: training and testing. In this cross-validation process, the dataset was partitioned into
K (number of fold) subsets, whereas, in every iteration, one subset was used for testing and remaining partitions of the datasets were used for training. In this way, the training and validation of the model were applied simultaneously in a single process, considered a fair test as the dataset used in testing data is unseen.
Figure 2 represents data connected with DT, GBT, NB, KNN, and RF models, which are embedded under the operator (i.e., cross-validation).
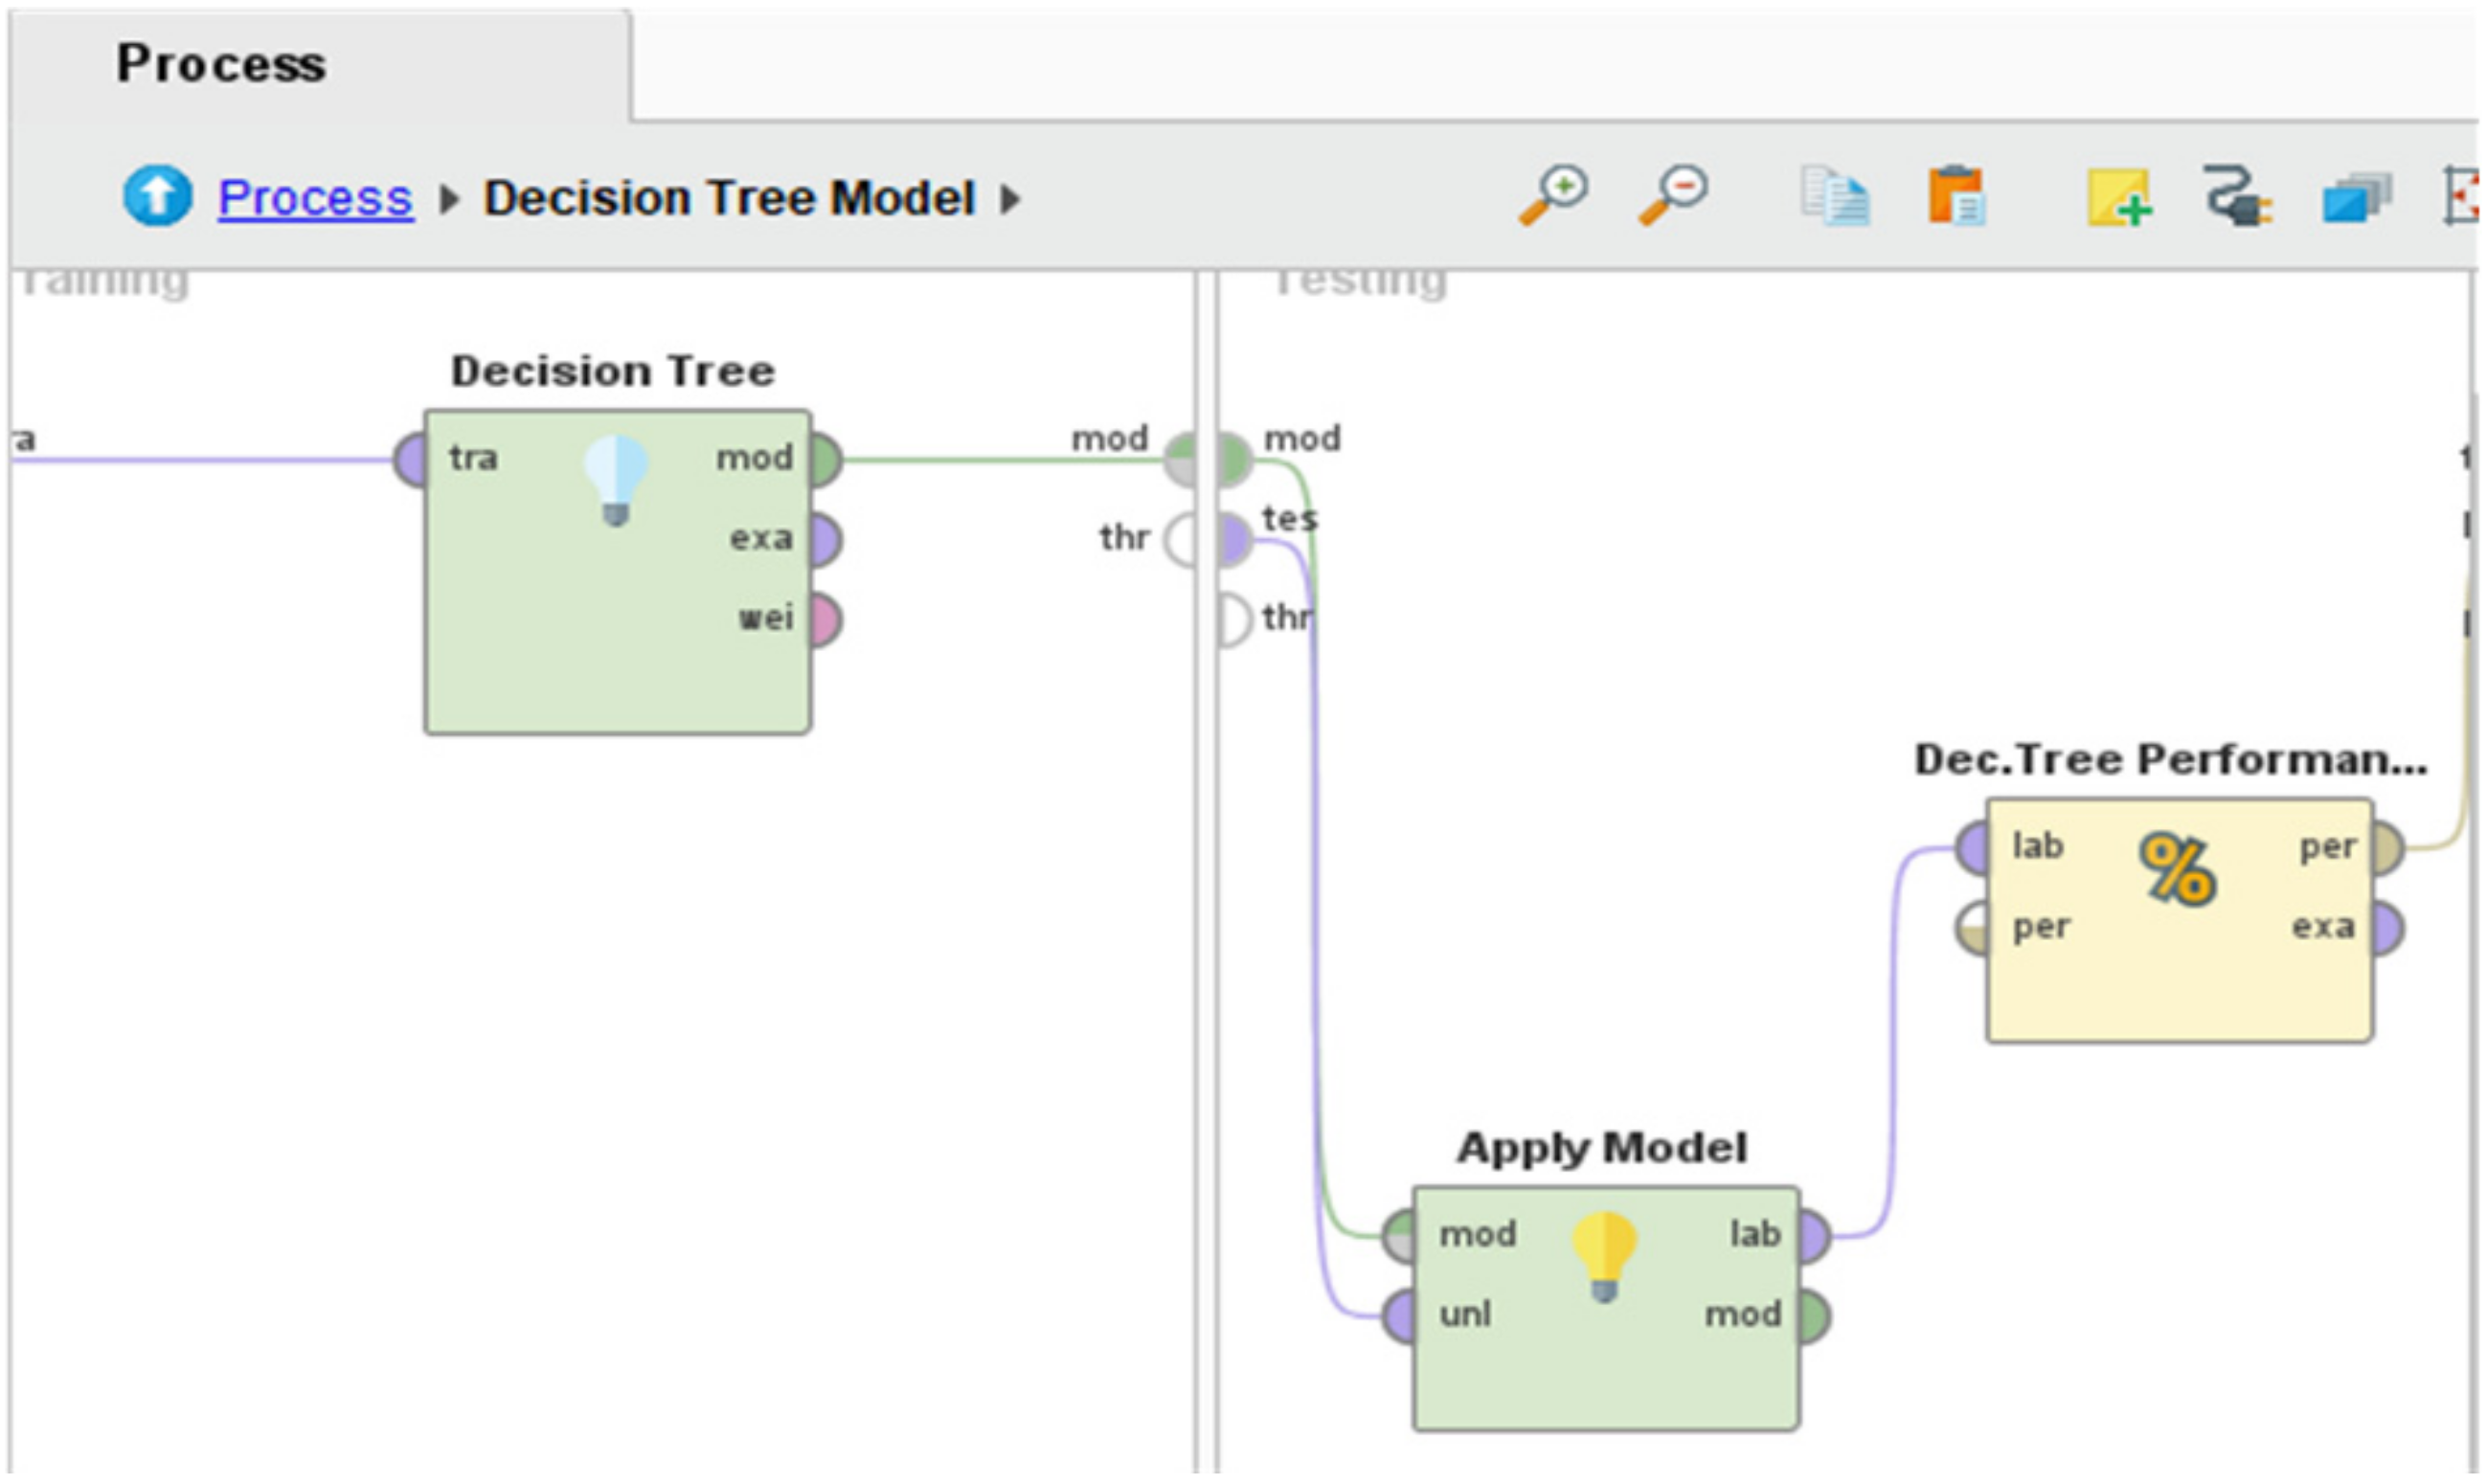
Continuing, the inner view of cross-validation operator is depicted in
Figure 3. It can be noticed in this diagram that the process is sub-divided into two parts: training and testing. The figure illustrates the DT model used in training while the training dataset arrived from the input port (from left side) and connected with the DT. Moreover, after the learning process, the trained model forwarded to the testing section, which further applied the testing process using testing data. Finally, the “Apply Model” operator was used to validate the model and connect with the “Performance” operator that helps measure different attributes of the classification model. Similarly, other algorithms follow the same procedure as shown in
Figure 3.
Moreover, each algorithm has multiple parameters to be set before running the experiment. For example, maximal depth (10), minimal gain (0.01), and criterion (information gain) are some parameters set for DT. In the same way, model configuration for RF, GBT, NB, and KNN is shown in
Table 2. During the implementation, the authors tried different combinations of the parameters to see the performance of the models. The table is showing the optimal configuration of the models, by which achieved the highest accuracy.
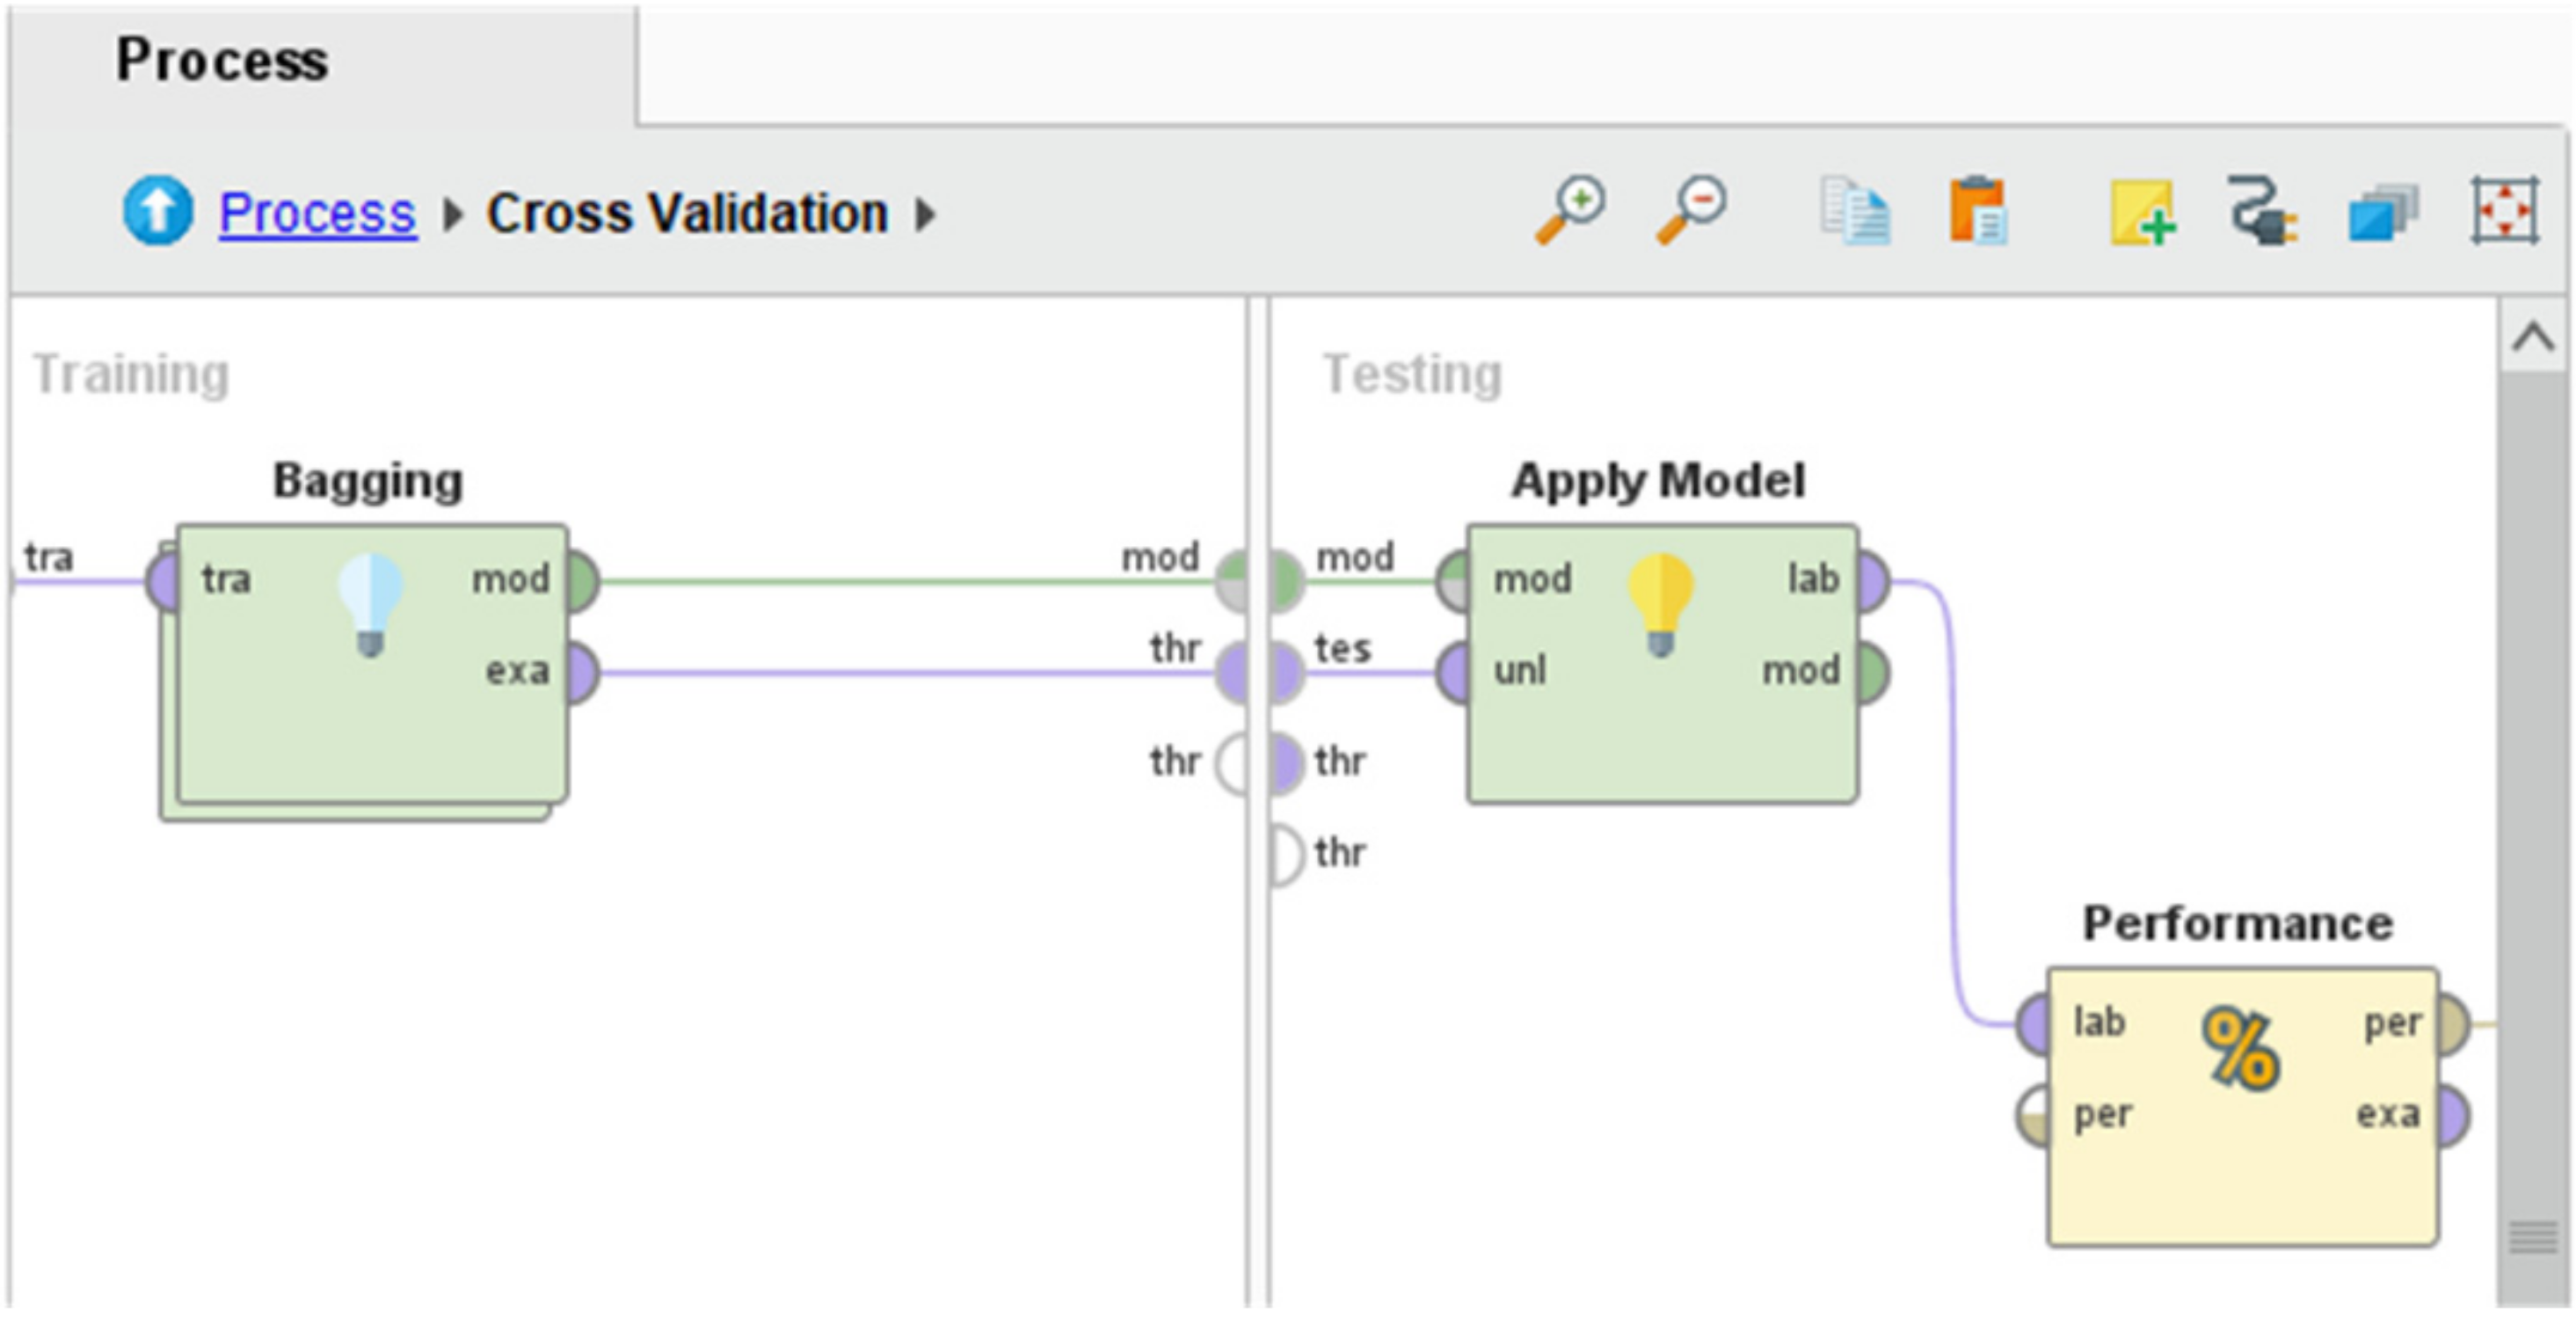
The next step (phase 3) of model implementation is to use bagging as an ML ensemble method. Bagging is a technique useful for enhancing the performance of the model using collaborative strategy. In other words, we can explain it as improving the model performance by joining group of classifiers. In RM tool, this can be applied using nested operator called “Bagging”.
Figure 4 represents the execution of the model, where the “Bagging” operator is placed under the cross-validation operator. This means the bagging operator was applied in the training section during the validation process, where it was used for 10 iterations.
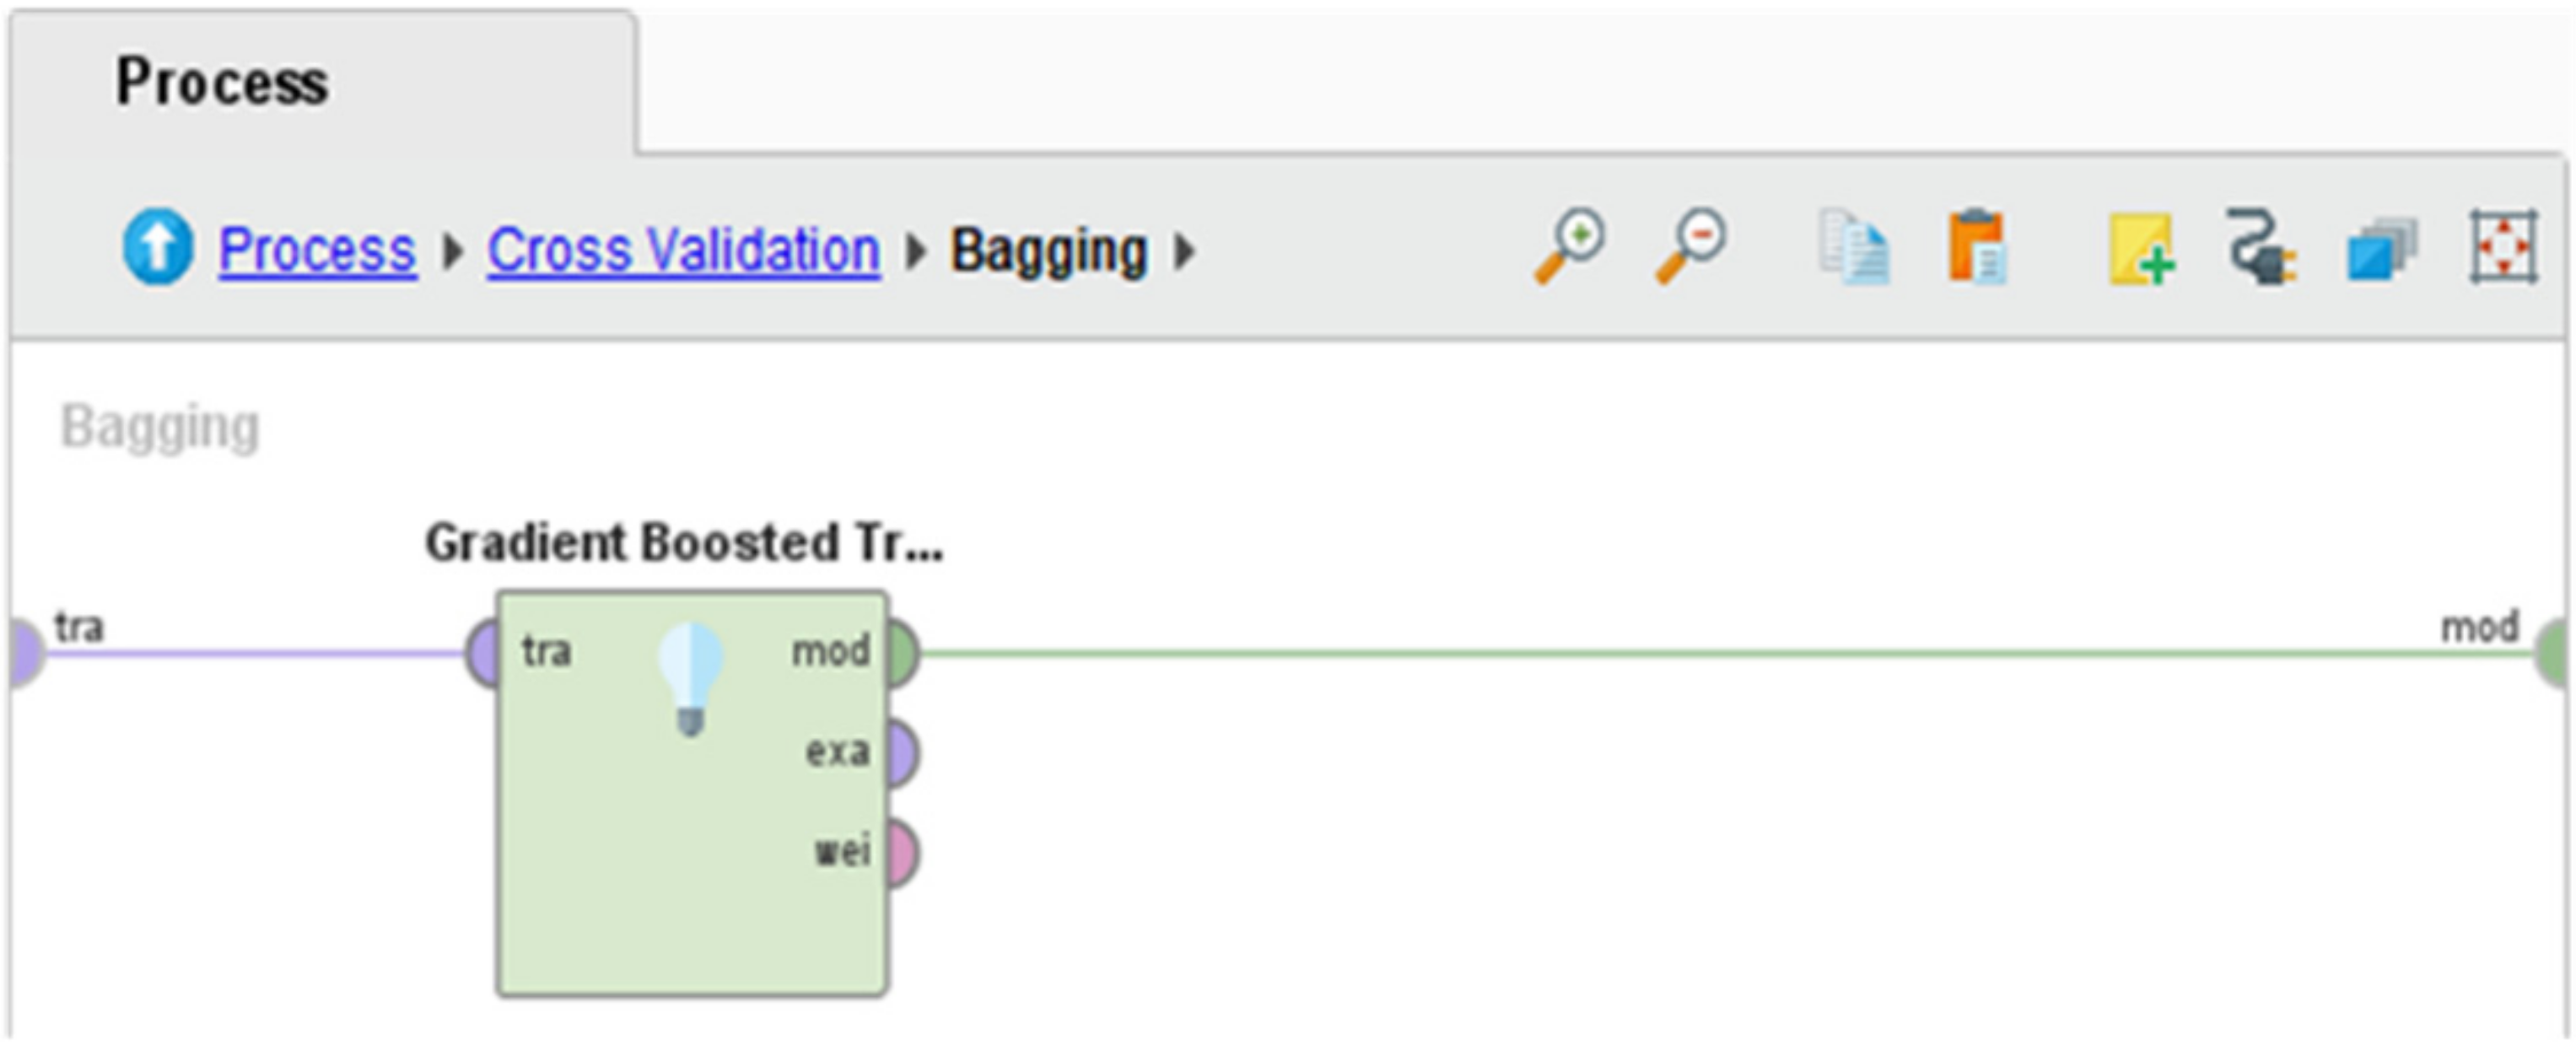
In addition, as discussed earlier, a nested operator (i.e., bagging) has to run sub-processes as well to complete its execution. The inner view of the bagging operator is shown in
Figure 5, representing the implementation of GBT for example. The same process applied for all five algorithms selected in this study are DT, RF, NB, KNN, and GBT. Similarly, the same procedure applied for the second ensemble method used in this study is known as “Boosting”. Overall, the experiment can be described as follows:
- ✓
Cross Validation (10-fold) → Training AND Testing
- ✓
Training Phase → Bagging (10 iterations)/Boosting (10 iterations) → DT/RF/GBT/NB/KNN (one by one)
- ✓
Testing Phase → Testing Data + Apply Model + Performance Measurement
The next two ensemble methods applied in this study are stacking and voting ensemble approaches. Both of them can be applied using nested operators in the rapid miner, which means they have sub-processes to combine multiple ML algorithms. For example,
Figure 6 represents the stacking process, which integrated five different classifiers in the base learner section, whereas RF is shown as a meta learner algorithm. Finally, meta learner output forwarded to the validation node, where the model validation and performance measurement process applied. The same steps applied for implementing different combinations of classifiers and performance measured through stacking and voting ensemble approach.
5. Major Findings, Discussion, and Comparison
Finally, this section presents the results after successful implementation of the model measuring student performance using ML algorithms. This research used RM for the research framework implementation. RM measures the output of the validation process using the “Performance” operator shown in
Figure 2 and
Figure 4. Specifically, this operator has the ability to calculate different features in the form of a confusion matrix, which can be useful for calculating other measuring factors: precision, recall, and F1 score. The summary of the results for each experiment (with and without ensemble) is shown in
Table 3,
Table 4,
Table 5,
Table 6 and
Table 7 and further illustrated in
Figure 7. For better understanding, the results are presented in in the form of precision, recall, and F1 values.
The confusion matrix represents the results based on the ratio of positive/negative predicted/actual values. In this dataset, the “label” column was defined as the “Class” attribute, categorized in three classes (“L”,”M”, and “H”). Therefore, results are presented using multiple metrics calculated for each class: “Low (L)”, “Medium (M)”, and “High (H)”. These three classes represent the performance of the students as low, medium, or high, based on the remaining independent variable presented in the dataset. According to the dataset, the class breakdown was as follows: Class “L” (127 transactions), Class “H” (142 transactions), and Class “M” (211 transactions). The explanation of the results is presented in the following four sub-sections.
5.1. Recall
Recall is a common validation criterion used for measuring the performance of the learning model applied for prediction purposes. This factor has been used in previous research where the classification task was applied for calculating correct prediction [
68,
69]. It analyzes the result with the help of a confusion matrix, calculating all “True Positive (TP)” values identified in the dataset divided by number of “True Positive (TP) and “False Negative (FN)” values extracted during the validation process [
70]. The common formula for calculating recall factor is as follows:
In this study, eleven different experiments were conducted in different phases in which the experiment without ensemble ran simultaneously with all five algorithms. After that, ensemble methods (bagging, boosting, stacking, and voting) were executed separately.
Table 3 illustrates the performance metrics for all ML models without the ensemble method. Overall, the recall values for each algorithm are measured above 50%, except for class “M” by the DT algorithm, which is calculated less than 50%. In addition, it happened four times that recall value measured more than 80% for class “L”. This highlights that the learning process for class “L” is more efficient than other classes. Additionally, the data values for class “L” are more associated than other attributes. Overall, the recall values for the NB classifier calculated for all classes was the lowest among all classifiers.
Moreover,
Table 4,
Table 5,
Table 6 and
Table 7 demonstrates the performance metrics for all models using different ensemble approaches. Overall, the recall values have improved by ensemble methods. Specifically, the DT algorithm enhanced the recall value from 0.675 (without ensemble) to 0.729 (with bagging) and 0.714 (with boosting). RF improved the recall from 0.777 (without ensemble) to 0.785 (with bagging) and 0.783 (with boosting). The maximum improvement (from 0.654 to 0.710) is shown by NB with boosting. In comparison between stacking and voting ensemble methods, stacking model 1 using all five base learners and RF (meta-learner) measured maximum recall value (0.8195) among all models. This performance is also outperformed among all models.
5.2. Precision
From the results and with the help of a confusion matrix, the second factor measured in this study is “Precision”. It analyzes the correctness of a model to assess how many positive predictive values are provided by the learnt model. In other words, it computes the ratio of actual positive transactions divided by the sum of positive predictions that occurred in the experiment [
69], as shown in the following equation:
TP and FP denote true positive and false positive, respectively.
With reference to
Table 3, the precision is measured suitably better and more than 60% by almost all algorithms for all classes except DT for class “H” (0.5800). Furthermore, it can be evident from this table that two times precision value calculated more than 80% for class “L” by DT and RF, which represents the good association between true and predicted values for this class.
Table 4 and
Table 5 represent the precision values calculated using ensemble methods bagging and boosting, respectively. Minimum precision value was achieved by NB with bagging (0.590) for class “H” and by KNN with boosting (0.630) for class “M”, demonstrating that the learning process for these classes require more transactions for clear understanding. This will help to return fewer
FP values, which ultimately improve the precision value.
Those tables also present the overall and weighted precision valued measure from all classifiers. As far as overall precision is concerned, the improvement has been shown from a single learner to ensemble approach, which is the main finding in this study that ensemble (combining multiple models) can improve the performance as compared to the single classifier. For example, DT single (0.687) enhanced the precision value as 0.729 (with bagging) and 0.715 (with boosting). Moreover, GBT single (0.713) improved the precision performance by 0.744 (with bagging) and 0.751 (with boosting), and the same was the case with RF. However, KNN precision values were measured almost the same, whereas NB has the maximum modification from 0.652 (single) to 0.708 (with boosting). In addition, stacking and voting have shown a remarkable enhancement in precision values. The stacking model 1 has shown the maximum weighted precision value (0.8199) using five different base learners and RF as meta learner. It has outperformed among all models in this study and found the best ensemble approach using five different base learners, which shows the high number of TP values for all classes returned by stacking model 1. Accordingly, it can be suggested for future transactions.
5.3. F1 Score
F1 score is a common multi-class metric used to assess the performance of the classifiers. It can be calculated using two other metrics known as precision and recall. This metric is useful to know the overall performance and association between precision and recall values [
71]. We can calculate F1 score using following formula:
As per the class level performance by a single classifier, minimum F1 score is calculated by DT (0.573) for class “M”, whereas the overall minimum F1 is recorded by NB (0.654). On the other side, the highest F1 score is recorded by RF (0.860) for class “L”, as well as overall F1 score measured by RF (0.776). The values of F1 score for all experiments are directly associated with precision and recall values. The results proved that boosting and bagging have improved the F1 score for almost all classifiers except NB with bagging, which reduced the value by 1%. In addition, DT with bagging improved F1 value by 5%, RF with boosting 1%, GBT with boosting 4%, NB with boosting 6%, but KNN has not shown any further improvement. As far as stacking and voting are concerned, the highest F1 was measured by stacking ensemble. Combining five base learners in a stacking ensemble approach has shown remarkable performance (0.8195) among all models. Moreover, voting using DT, RF, and GBT classifiers also improved the performance and recorded F1 as (0.784). In comparison with single classifier DT (0.668), RF (0.777), and GBT (0.714), the voting approach by combining all three classifiers in one model has improved the F1 score (0.784).
5.4. Final Discussion and Comparison
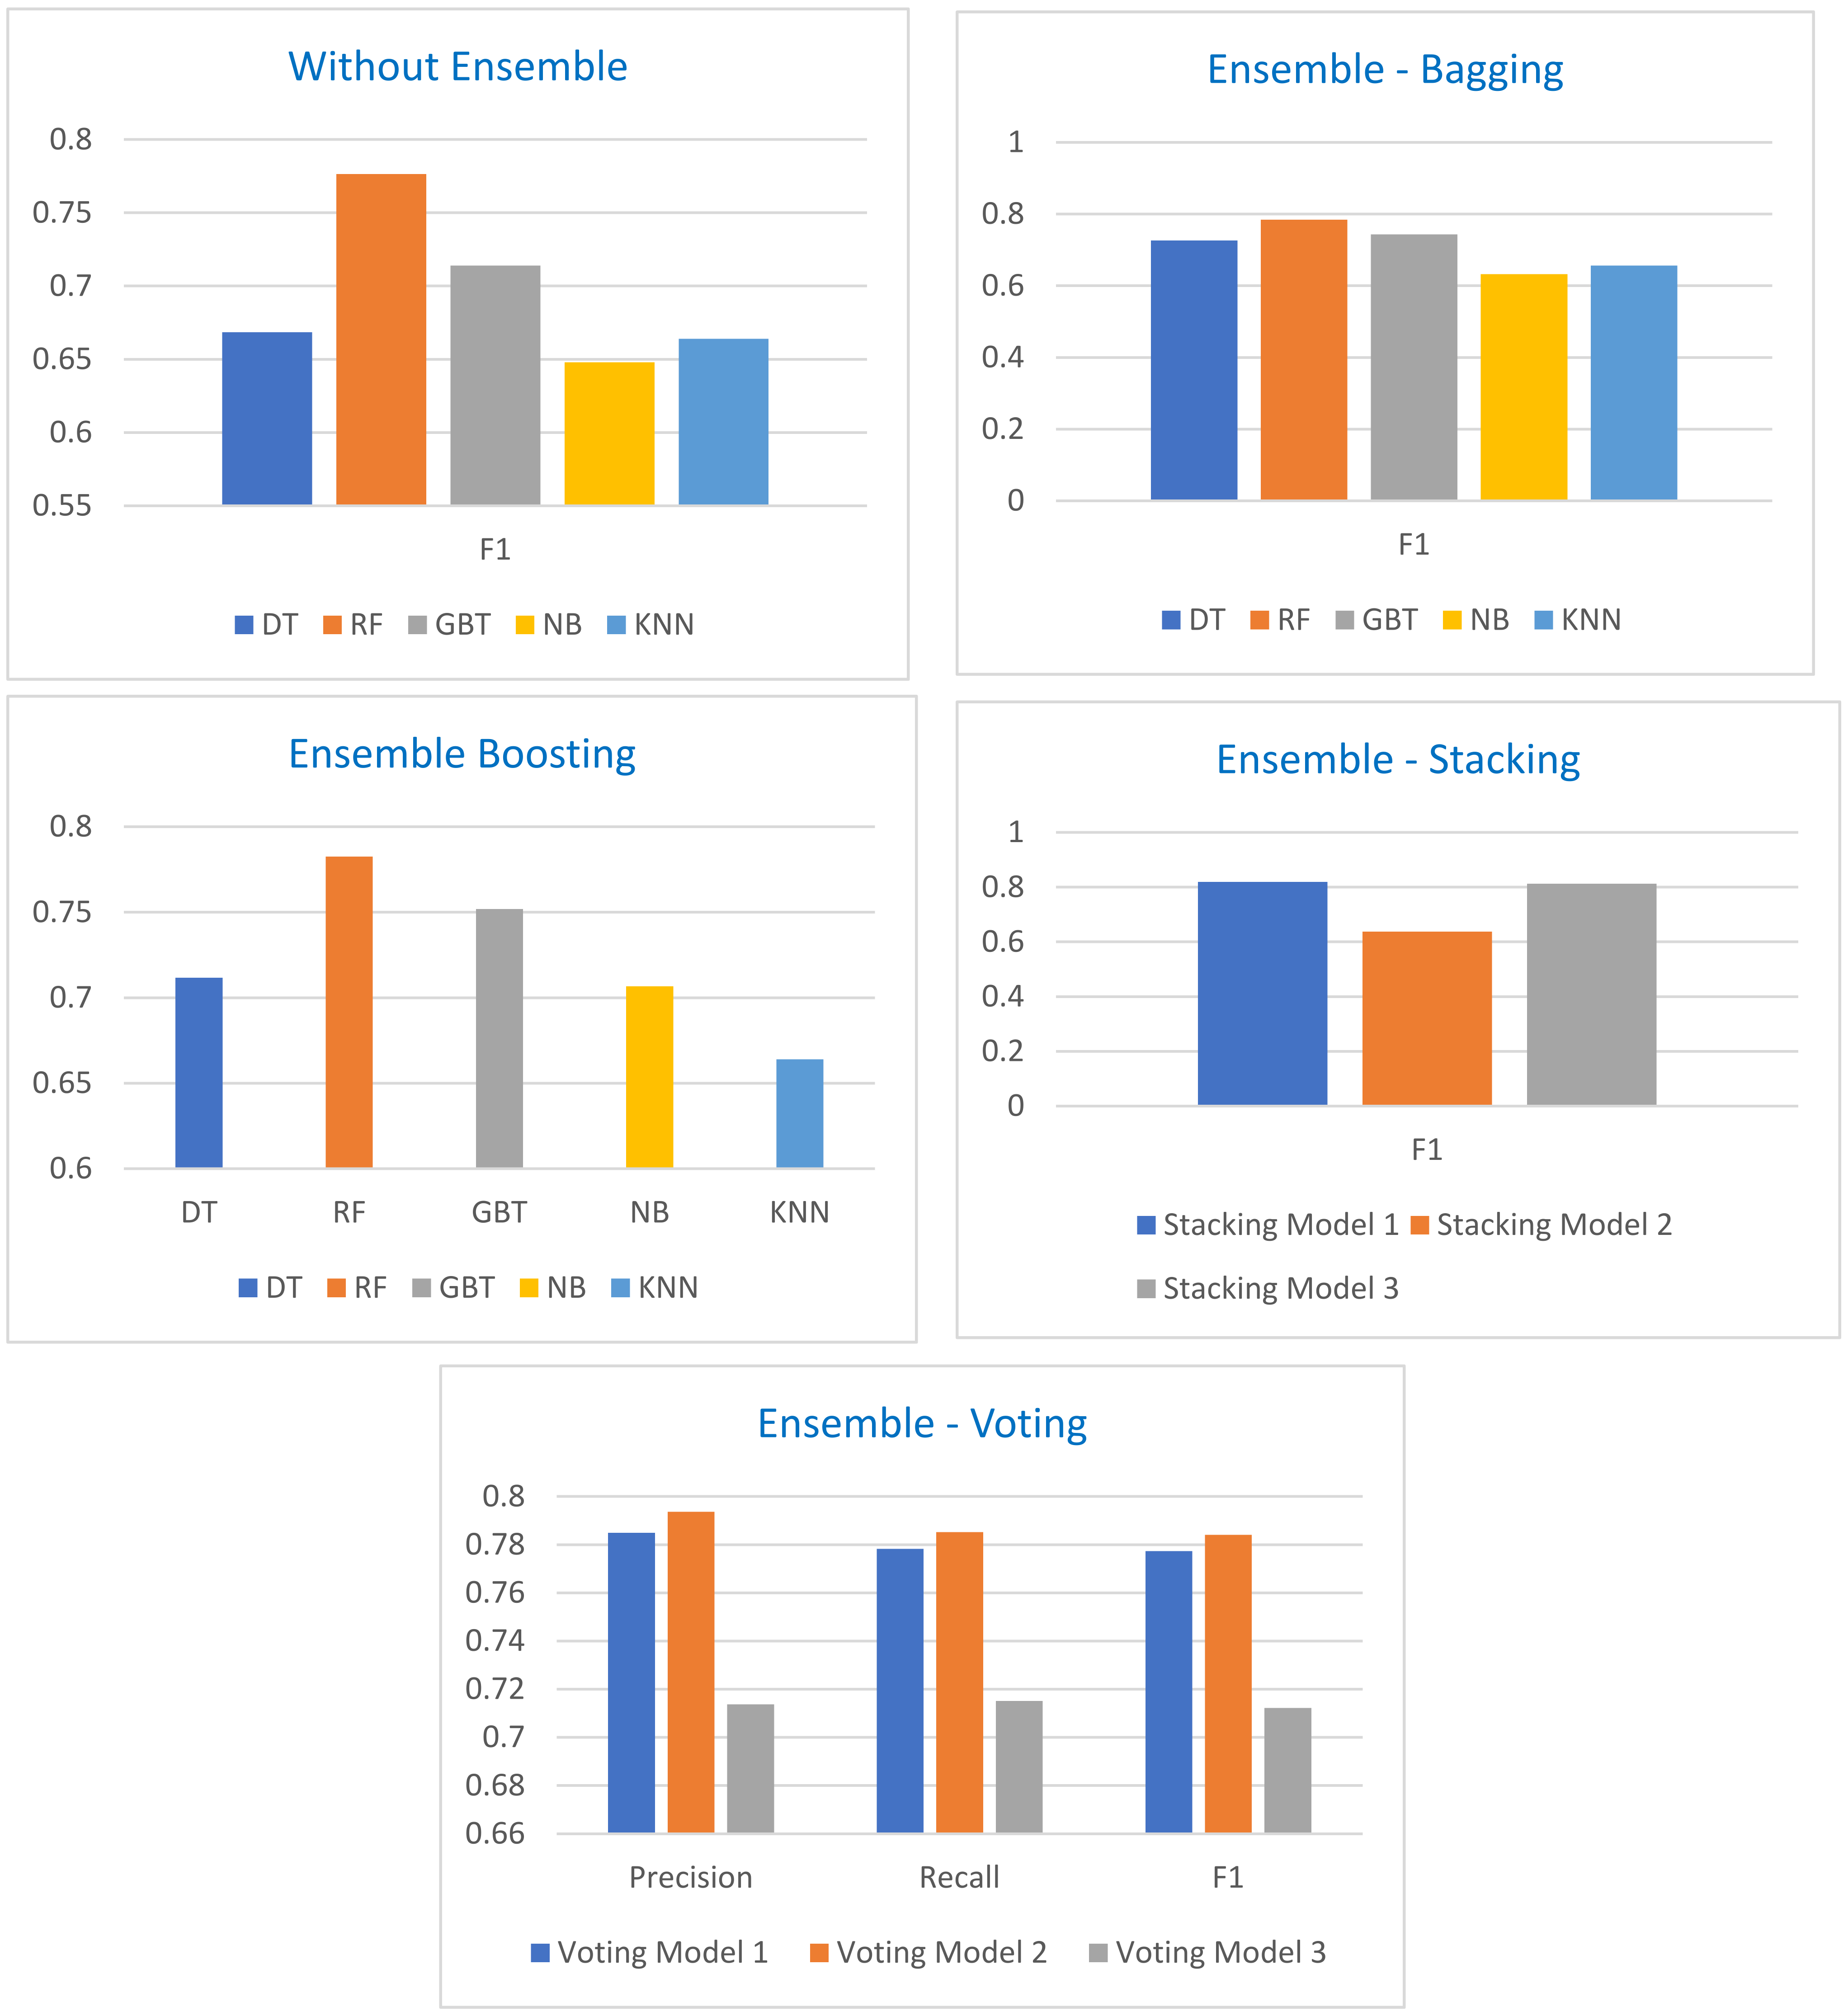
Firstly, this study conducted the experiment using five ML models—DT, RF, NB, KNN, and GBT—without ensemble. All models were trained and validated in a single experiment. Moreover, the four ensemble methods applied to combine ML models and assess the achievement level in the form of precision, recall, and F1 score. For further analysis, we ran the stacking and voting approach using different combinations of ML models. The performance metrics are separately discussed briefly in the previous section. Overall, the result of this study emphasizes that the ensemble approach is feasible and can work better to improve prediction accuracy. We presented the result summary of all models as shown in
Figure 7.
As illustrated in
Figure 7, from the single classifier perspective, the maximum overall and weighted F1 achieved by RF (0.777), which shows better performance among all algorithms. It also obtained a high association between actual and predicted values for all classes (L, M, H). Therefore, the results suggested that RF can be better among all five algorithms used in this study as a single classifier. More experiments were conducted to see if an ensemble approach can further enhance the accuracy of the model. RF also achieved high accuracy using bagging (0.785) and boosting (0.783) approaches. In addition, almost all models obtained better accuracy through bagging and boosting approaches. It is further illustrated in the figure that the stacking ensemble approach reached above 80% in predicting correct instances, which is the highest among all approaches. This shows that stacking (combining different models) can help to learn the model with the help of multiple classifiers and is better than selecting a single classifier from them. It further elaborates that the learning process of multiple base learners is important to prepare meta learner; therefore, this study tried different combinations of base and meta learners to attain maximum accuracy.
Comparatively, if we see the performance of single classifiers, the same approach was applied in previous research, wherein the researcher used multiple algorithms without ensemble technique. As shown in
Table 1, the performance of single-classifier DT (0.758) in the related work [
26] is higher than the performance recorded (0.675) in this study with a similar dataset. However, the RF model with information gain criterion in this study has shown better performance (0.777) than previous work (0.756). In addition, comparing the results generated in this study with another related work published recently [
29] reveals that, among all models, the performance of RF classifier has enhanced (0.777) the performance over previous work (0.743). On the other hand, the performance of DT and GBT remained lower than the previous work. The potential reason behind performance variation in the models is the number of random transactions selected during model learning phase. In addition, the number of transactions and model configurations and the number of iterations impact the model performance as shown in
Table 2.
Secondly, a series of experiments was conducted to assess the performance of the ML models by implementing ensemble methods. Boosting and bagging ensemble methods were applied by combining each ML model separately, as illustrated in
Figure 1. The results for each experiment generated from bagging and boosting are presented in
Table 4 and
Table 5, respectively. The performance of the classifiers clearly represents the enhancement achieved by both ensemble techniques, which emphasizes that the integration of multiple approaches can improve the prediction ratio. Overall, the maximum recovery attained by the NB model improved the performance from 0.645 (single) to 0.706 (with boosting), which is much better than previous work (0.672). In the same way, GBT gained around 4% higher accuracy by integrating the GBT with AdaBoost. The combinations of the models have shown improved learning procedure.
Finally, the main finding of this study is to apply the stacking and voting approaches by combining multiple ML classifiers. The main purpose of this study is to propose a new model that can be helpful for predicting student performance using online studies data. Comparatively, this approach was not applied in the previous work. Bagging and boosting approaches helped to achieve more accuracy than previous work but stacking provided extra success in the learning process. The stacking learning model developed in this study using five base learners has improved the performance of meta learner (RF). The proposed stacking model has overcome different weaknesses of ML models such as fitting and generalization. Integrating multiple ML models showed the best learning process, where five base learner’s capabilities were used in a single model. Compared to the single ML classifier, the stacking model proposed in this study has improved the performance by 6.76%. Overall, the result of this study showed that the reliability and implementation of the proposed stacking model can be useful for predicting the student’s performance in the e-learning management system.
6. Conclusions
E-learning management systems are essential software for running educational processes virtually. Multiple LMS generate a vast amount of data associated with different stakeholders, especially students. This study mainly focused on learning the attributes of LMS related with student’s online usage of LMS called Kalboard360. In this regard, we proposed an integrated model to analyze, learn, and predict the student’s performance based on their usage. The dataset used in this study was classified in three divisions (low, medium, high) according to the students’ routine participation recorded on LMS. The proposed model has shown successful implementation of ML algorithms to predict the student’s performance. The overall F1 score of the single models was recorded as follows: DT (0.675), RF (0.777), GBT (0.714), NB (0.654), and KNN (0.664). The model performance has shown remarkable improvement using ensemble approaches. The stacking model, by combining five classifiers, has outperformed and recorded the highest F1 score (0.8195). The integration of the ML models has improved the prediction ratio and performed better than all other ensemble approaches. The model is suitable for educational institutions to make intelligent decisions for improving student performance. Timely decisions can encourage students to improve performance in future courses. The model accuracy can further be assessed by increasing the number of records and other ML algorithms in future. In future, the authors plan to implement the proposed framework on several educational institutes using online learning management systems due to the pandemic. The ML framework presented in this study can enhance the quality of education as well as students’ participation level online during the current pandemic situation.


