Article

Profiting on the Stock Market in Pandemic Times: Study of COVID-19 Effects on CESEE Stock Markets

by
Tihana Škrinjarić
Croatian National Bank, Trg Hrvatskih Velikana 3, 10000 Zagreb, Croatia
The author states that the views presented in this paper are those of the authors and not necessarily representing the institution she works at.
Mathematics 2021, 9(17), 2077; https://doi.org/10.3390/math9172077
Submission received: 4 August 2021 / Revised: 25 August 2021 / Accepted: 25 August 2021 / Published: 27 August 2021
(This article belongs to the Special Issue Mathematical and Statistical Methods Applications in Finance)

Abstract

:
This research deals with stock market reactions of Central Eastern and South Eastern European (CESEE) markets to the COVID-19 pandemic, via the event study methodology approach. Since the stock markets react quickly to certain announcements, the used methodology is appropriate to evaluate how the aforementioned markets reacted to certain events. The purpose of this research was to evaluate possibilities of obtaining profits on the stock markets during great turbulences, when a majority of the participants panic. More specifically, the contrarian trading strategies are observed if they can obtain gains, although a majority of the markets suffer great losses during pandemic shocks. The contributions to the existing literature of this research are as follows. Firstly, empirical research on CESEE stock markets regarding other relevant topics is still scarce and should be explored more. Secondly, the event study approach of COVID-19 effects utilized in this study has (to the knowledge of the author) not yet been explored on the aforementioned markets. Thirdly, based on the results of CESEE market reactions to specific announcements regarding COVID-19, a simulation of simple trading strategies will be made in order to estimate whether some investors could have profited in certain periods. The results of the study indicate promising results in terms of exploiting other investors’ panicking during the greatest decline of stock market indices. Namely, the initial results, as expected, indicate strong negative effects of specific COVID-19 announcements on the selected stock markets. Secondly, the obtained information was shown to be useful for contrarian strategy in order to exploit great dips in the stock market indices values.

1. Introduction

As of today, much research exists on the novel coronavirus (COVID-19 henceforward), which examines effects on the stock markets, economies, health institutions, and overall human health [1,2,3,4,5,6]. The research has exploded over the last couple of months as of writing this research. Since stock markets react more quickly to the economic, political, social, and other (un)expected events, the bulk of literature that focuses on short- and long-term effects of the COVID-19 happenings has been growing rapidly. As more than 300 different factors affect stock price movements [7], news and events such as epidemics and pandemics affect the financial markets, as already previously documented ([8], see later in text; [9], who estimated that total costs of the SARS outbreak would be 1.5% of China’s GDP; [10], who developed a single country Computable General Equilibrium model to estimate the economic impact of pandemic influenza; [11], implications of HIV/AIDS for government finance and public services), as well as what could be done regarding future pandemics and epidemics [12].
Stock market reactions to pandemic news could be classified in the field of behavioral finance, whose roots start in [13,14,15,16,17]. This is due to investors’ under-reaction and over-reactions to different news, which has a consequence of different stock market movements (of risk and return series) during specific periods [18]. Refs. [19,20] are some of the most popular explanations of investor sentiment affecting the stock market movements. Emergencies, such as the COVID-19 situation, should have impacts on investors’ psychological state and sentiment, which will, in return, affect the stock price movements [3]. As the uncertainty regarding COVID-19 is still present all over the world, it is expected to negatively affect the stock market returns. This is due to previous findings of negative correlations between stock returns and uncertainty [21].
However, there exist opposite opinions, such as the “three rules” of [22]: ”First, the stock market is not the economy. Second, the stock market is not the economy. Third, the stock market is not the economy”. The under- and over-reactions of investors due to the COVID-19 issues have been discussed in [23] as well, where authors question if the COVID-19 crisis does or not imply inefficiency of the stock markets, in terms of EHM (efficient market hypothesis). Part of the “COVID” literature focuses on volatility reactions [24,25,26,27] (and partly focuses on the return or price value [5,28]. Of course, research that focuses on macroeconomic effects is growing as well, but it was not in the focus of this research. For such analyses, see, e.g., [29,30,31], etc. Furthermore, different financial assets have been the focus of the recent research, as the COVID-19 panic has affected all aspects of life and economics (see [32], for banking, insurance, government, and publics; [33], for oil prices, or crypto currencies in [34]).
Although the literature on various relationships between economic and financial variables is extremely large, there still exist gaps in the literature. The gap is found in estimating the effects of exploiting such news regarding the spread of the COVID-19 virus, as well as economic and political decisions regarding closing the economies and various economic subjects. The contributions of this research are as follows. Firstly, empirical research on CESEE (Central Europe and South Eastern Europe) stock markets regarding other relevant topics is still scarce [35,36] and should be explored more. This is due to CESEE markets still experiencing country-specific factors that dominate those markets [37]. This means that potential gains could be exploited if some specific events affect those markets in a way that is different compared to other developed markets. Furthermore, CESEE markets have attractive risk-adjusted returns, as stated in [38]. Secondly, the event study approach of COVID-19 effects utilized in this study has (to the knowledge of the author) not yet been explored on the aforementioned markets. This is seen in an extensive study in the literature review, in which only several CESEE countries were found as a part of the panel data analysis. Thus, more insights are obtained into the investors’ reactions on these specific markets. In that way, the effects of future similar events of pandemics or epidemics could be forecasted in a better way possibly. This enables the (potential) investors to adjust their anticipations and trading strategies. Thirdly, based on the results of CESEE market reactions to specific announcements regarding COVID-19, a simulation of simple trading strategies will be made in order to estimate whether some investors could have profited in certain periods. If profits were not possible to make when the first news was announced regarding the development of pandemic problems, some investors could have adjusted their anticipations regarding other announcements. As some authors state that epidemics could be observed as black swan events, leading to panic-selling responses on financial markets [39], the contrarian followers could thus make profits. Although the analysis is provided from the macro aspect, i.e., national stock market indices are observed, a first glance will be given in the reactions of the CESEE markets. However, such markets are characterized by less liquid stocks [40], which could be exploited in studies such as [41] where 867 companies were included in the study. The main purpose of this study was to evaluate the magnitude of the negative effects of COVID-19 on selected CESEE markets and to obtain information about trading possibilities based on the results. The main goals included testing the significance of negative effects on stock return series regarding specific announcements about the pandemic dynamics and formulating trading strategies that try to utilize the results via contrarian strategies. Thus, the research wants to show that such strategies can obtain profits due to not panicking as the rest of the market. Two main hypotheses were the following ones. The first hypothesis was that specific negative news regarding the pandemic had short-term negative effects on CESEE stock markets. The second hypothesis was that contrarian strategies could have exploited such results in order to obtain profits in pandemic times. The main contribution of this research is twofold. Firstly, a detailed analysis of the CESEE market reactions to COVID-19 outbreak was done (to the knowledge of the author) for the first time in the literature and, secondly, the results were extended via simulating trading strategy that exploits such information. The second contribution is a novel one in literature, as related work (please see second section) usually does not observe this.
The rest of the paper is structured as follows. The Section 2 deals with an overview of the related literature and the Section 3 describes the methodology used in the study. The Section 4 includes the empirical analysis with the discussion and the final, Section 5 concludes the paper.

2. Related Literature Review

As the research on the COVID-19 effects exploded in the year 2020, bibliometric analysis already existed [42,43,44] that analyzes different aspects of published work. Thus, this part of the paper will focus on the research closely related to this paper, as much has already been said about the effects of COVID-19 information on economies and financial markets. The majority of focus here will be on similar markets, methodology, and research questions. The consensus in the literature is that news regarding COVID-19 is classified as “bad news” [45,46], with exceptions regarding the vaccine. A lot of COVID-19 literature focuses on the Chinese stock market, due to the outbreak being in China: [47,48,49,50,51], etc. Reference [47] observed short-term effects of the COVID-19 outbreak on 21 leading stock markets, via event study methodology, but the authors focused on the most developed markets. Thus, none of the markets included in this study were examined in the mentioned study. Reference [49] also focused on the more developed markets, including the Chinese one. This study utilized regression and the GARCH (generalized autoregressive conditional heteroskedasticity) approach for individual markets by including a binary variable regarding the COVID outbreak. Short-term negative effects were found on the analyzed markets, with a quick rebound due to mean reverting process in the return series. The severe effects on the Chinese stock markets were spilling over to other markets, as [50] found an increase of the transmissions of shocks between the Chinese and other markets, not only regarding stock trading, but oil and commodity markets. Reference [51] observed the Chinese and the American stock market reactions to the COVID-19 outbreak, in March of 2020, in which significant effects of new confirmed cases were significant in explaining the market movements.
Some different approaches of analyzing the COVID-19 effects on stock markets are found in, e.g., [52], where (M)GARCH (multivariate generalized autoregressive conditional heteroskedasticity) was utilized on selected stocks, whose names were similar to the virus name (e.g., Corona drink). Of course, negative effects of COVID were found on these companies, although they did not have anything to do with the spread of the disease. Reference [27] used GARCH methodology to observe the effects of media coverage and frenzy, which the authors called media panic. The authors focused on 23 sectoral indices of the Dow Jones US index, for the period 1 January–30 April 2020. The increases in volatility in the observed period were partially caused by the media coverage regarding the pandemic. Sectoral and firm-level analysis of Chinese companies was analyzed in [48], where authors utilized the Event Study Methodology (ESM) as well as regression analysis based on the results of CARs (cumulative abnormal returns). Reversals of returns were found on both levels, with overreactions on the Chinese markets found mostly from the side of retail investors. Other approaches include panel regressions, such as panel least-squares of VAR (vector autoregression) model in [53], where authors found negative effects on different financial markets over the world; panel regression on GCC (Gulf Cooperation Council) countries in [54], where authors observed that the observed stock markets react negatively to the confirmed new cases of the COVID pandemic; panel analysis of 13 major stock markets in Europe, Asia, and USA in [55], where authors constructed a Google search variable regarding the COVID virus as an additional variable in the return modeling process; GARCH-MIDAS (mixed data sampling) in [56], where authors focused (again) on the more developed markets, but here, the study focused on the stock market volatility reaction to government interventions across the world; etc.
Existing literature does not provide much discussion on previous disease outbreaks and their effects on stock markets. This was done in this paper so that more insight on stock market reactions can be obtained for the future, unfortunately inevitable, disease outbreaks. As different investors exist in financial markets, some try to exploit different events, no matter the type of news (good or bad). Earlier studies that observe the effects of epidemics/pandemics/disease outbreaks on the stock markets include the following papers. Reference [57] observed the SARS (severe acute respiratory syndrome CoV-1) effects on selected markets that were most representative in the world press at that time (China, Canada, Hong King, Indonesia, Singapore, Philippines, Thailand, and Vietnam). Event Study Methodology (ESM) was utilized for the period 1 June 2002 to 22 March 2003 for the short-term event window analysis (t-test and Mann–Whitney test). In short, the SARS had a negative effect only on the Chinese and Vietnamese markets. Thus, the authors concluded that results were contradictory to the press stories that SARS would have a big negative impact in the countries that were affected by the mentioned disease. However, the current situation regarding the COVID-19 disease has much different and greater side effects, already documented all over the world.
This is confirmed in [46], in which authors concluded that previous infectious diseases, including the Spanish Flu, did not affect the stock markets in such intensity. Reference [58] focused on infectious diseases in Taiwan (H1N1, SARS, Dengue Fever, Enterovirus 71), and applied the ESM to the biotechnology industry companies. The results indicated that significant positive cumulative abnormal returns (CAR) before day 2 (of the outbreak), and negative CARs after day 12. Not surprisingly, the outbreak had positive effects on the return series of medical product companies. Reference [59] utilized the ESM, regression analysis with the GARCH approach for the volatility modeling part for the Taiwanese hotel stock return and risk performance during the SARS outbreak. The results showed negative effects of the outbreak on the performance of hotel returns, especially in the first couple of days of the event. The study of [60] focused on the Ebola and Arab Spring events. In this study, 78 equity mutual funds, specialized in African countries, were analyzed, where it was found that retail investors overreacted to the events, controlling for fund performance, market returns, and expenses. Media coverage contributed to the higher withdrawals from funds, when the coverage was negative, of course.
Studies on CEE, SEE, or CESEE markets are, to the knowledge of the author, non-existent. Extensive research was made on major journal indexing archives, and there are just several cases of including some of the markets in the total panel regression analysis. The majority of found evidence or comments refer to newspapers, such as [61] or the IMFs’ [62] report on these countries, but solely from macroeconomic and infrastructure aspects. Global Impact Investing Network [63] estimated that investors will reduce capital inflows to emerging markets such as the CESEE ones, due to COVID problems and uncertainties.
To conclude this section, it is evident that the research is constantly growing, but there still exist gaps that need to be filled. A lot of papers are focusing on the markets that are most developed and that are closely linked to the Chinese market. There are much fewer studies that observe other markets, such as the CESEE ones, that are the focus of this paper. Maybe the international investors are not so much interested in such markets (although different reasoning has already been covered in the introduction). Due to fewer diversification possibilities nowadays, which have extensively been documented [64,65,66,67], markets such as CESEE ones could provide investors profitable strategies, even in bad news times such as the COVID-19 frenzy. Furthermore, the possibilities of exploiting such results have not been explored. Despite research comments on the dynamics and specific reactions of return or risk series (or other financial variables), some specific guidance for investors interested in obtaining profits on such events has not yet been explored. That is why the empirical section tries to evaluate how the investor can act based on the obtained information if similar events and announcements occur in the future.

3. Methodology and Data Description

3.1. Event Study Methodology

Event Study Methodology (ESM) is widely used to assess the questions of “what if” scenarios, to assess the value of stocks, portfolios, or investment funds if a scenario did happen or did not, or if something happened and what would the value be if it did not. Since stock markets react very quickly to different (un)expected announcements, the ESM methodology is very useful to detect abnormal changes in return or volatility series a few days before and after the announcement. ESM has been extensively used over the last couple of decades to estimate the effects of announcements on stock markets (examples include [68,69,70,71,72,73]. Within this methodology, it is assumed that the markets are efficient and new information will be observed quickly, which was happening on major stock markets, mentioned in the previous section. Here, reference [73,74] methodology is followed, alongside [75,76] in the brief description of the ESM approach used in the main part of the analysis.
The focus of the empirical part of the research was stock market indices. Thus, in the market factor model, the regional market index was included as the explanatory variable of the individual stock market indices, with the inclusion of inflation rates, exchange rates (those countries that do not yet have Euros), unemployment rates, and short-term interest rates, as previous studies included these variables [77]. It was supposed that the researcher had data on N actual returns of stock market indices on date t, rit, where i ∈ {1, 2, …, N}, t ∈ {1, 2, …, T}. The conditional returns, which are estimated based on a model, E(rit|It), are based on the information I up to date t. These conditional returns were used to evaluate, i.e., estimate, the effects of an event on the stock returns. The idea was to compare the true returns, rit, to the conditional returns E(rit|It). The difference between the actual and conditional returns is called the abnormal return, in notation ARit:
ARit = ritE(rit|It).
The conditional returns were estimated within a timeframe that is before the event happens, i.e., in the pre-event window. The most basic approach was to estimate the mean of the return series in the pre-event window (as it often yields similar results to more sophisticated models, see [73,74]. Other approaches include the market model, where the return series is estimated by including the regional stock market index. Next, in order to control for country-specific effects, each conditional return can be estimated as follows:
E(rit|It) = αi + βiRit + γ1iexcit + γ2iirateit + εit,
where Rit is the regional stock market return, exc is the exchange rate (for those countries that do not have a total fixed exchange rate: Czechia, Croatia, Hungary, Poland, Romania, and Serbia) of local currency to the Euro, and irate is the short-term interest rate of country i, all on days t. Other potential control variables were not available on a daily basis (such as the inflation rate or unemployment rate).
However, the problem with Equation (2) is that the COVID-19 effects are found in the right-hand side of that model as well. So, it cannot be used in this analysis. The aforementioned authors did not explain how they controlled for such effects, as the regional indices and interest rates were affected by the COVID-19 as well. Models such as Equation (2) can be used when the stocks or county indices were the only ones affected by some events, but not the explanatory variables. As reference [78] found effects of COVID-19 on the exchange rates of the Visegrad Group of countries (which are included in this study), such variables cannot be used as control ones.
The εit is the error term, which can be white noise. If not, literature either estimates model Equation (2) by using the [79] corrected standard errors or [80] corrections. Furthermore, if any of the variables are found to be non-stationary, they will be translated into a stationary version to estimate Equation (2). Some researchers estimate the Equation (2) with a GARCH specification included in the model. Either way, Equation (2) has to be estimated in the pre-event window. The length of the window varies in the literature. Thus, in this study, some typical approaches were used for robustness checking. Reference [81] observes that research uses the length of the pre-event window ranging from 30 to 750 days. References [82,83] showed that the results are not sensitive to the variation of the window length, as long as the length exceeds 100 days.
Based on the previous analysis, the empirical approach of the study included the estimation of the mean return in the pre-event window and, regarding the window length, a starting point was 100 days, then for robustness checking 150 days as in [84], and, finally, the whole trading year before the event window, as [59] used 232 days, and [8] used 252 days.
Next, the event-window length needs to be chosen. Since stock markets react quickly, and the reactions die rather quickly, usually the event window is short. From a statistical standpoint, reference [85] observed that the test properties tithing the event window are affected by its length. Short-horizon window tests are well specified in terms of the power of the test and type II errors (see [86]). That is why usually the days before and after the event that are included in the event window are chosen so that the total length is 21 days (10 days prior, zero date, i.e., event date, 10 days after), 11 days (five days prior, five days after) or 41 days (20 days prior and 20 days after the zero date). A length of 21 days will be included, as some events happened very close one to another, which would lead to overlapping results if greater window lengths were chosen.
Then, based on the estimation of the E(rit|It) in the pre-event window, the ARit values were estimated as in Equation (1) in the event window for every country. Now, the null hypothesis was tested in which it is assumed that a certain event did not have any effects on the stock market returns. Firstly, the average abnormal return A R ¯ τ was calculated as follows:
A R ¯ τ   =   1 N i = 1 N A R i τ ,
and its variance var( A R ¯ τ) = 1 N 2 i = 1 N σ ε i 2 for every day τ in the event window. Next, cumulative average abnormal returns C A R ¯ (τ1, τ2) were calculated between days τ1 and τ2 as:
C A R ¯ τ 1 ,   τ 2   = τ = τ 1 τ 2 A R ¯ τ ,
The corresponding variance was calculated as var( C A R ¯ (τ1, τ2)) = τ = τ 1 τ 2 var A R ¯ τ . The first test value that could can be used was calculated as:
θ 1   =   C A R τ ¯ var ( C A R τ ¯ ) 0.5   ~   N 0 , 1
The second test was a non-parametric test, the sign test, in which it is assumed that the abnormal returns are independent across stock markets. That is why the proportion of positive abnormal returns should be equal to the proportion to the negative ones, i.e., H0 assumes that p ≤ 0.5, where p is the proportion of the positive abnormal returns on day τ. The second test value was calculated as:
θ 2 = N + 0.5 N N ~   N 0 , 1 ,
where N+ is the number of stock indices that have positive abnormal returns on day τ. As reference [75] indicated that the test value in Equation (6) is better for samples with more stocks (or indices; sample size greater than 30), the value in Equation (6) as a non-parametric one is better for smaller samples, as this research deals with. Three other rank tests were observed as well, as additional robustness checking, as a small number of countries in the analysis was included, which makes the test value in Equation (1) problematic. These tests are such that the H0 assumes that the median value of a series is equal to some value. In this specific case, it was assumed that the median of abnormal returns on day τ was equal to 0. The alternative refers to the value being lower than 0 (i.e., one-sided test). The three tests utilized here were the binomial sign test, normal approximation sign test, and the Wilcoxson signed-rank test [86]. Reference [87] stated that a small cross-section analysis should include the sign or Wilcoxson tests.

3.2. Robustness Checking

Robustness checking of the results means that one needs to reevaluate the results in a different way in order to obtain results that are reliable and meaningful. This could be done in a variety of ways, depending on the initial research questions and used methodology. The main idea always is to test if the results are robust to changing something in the whole approach of modeling or empirical analysis. Besides the robustness checking, which was already mentioned in the previous section (regarding the length of the pre-event windows), other approaches were analyzed as well. Although the methodology that will be described here was different compared to the previous subsection, it was used in previous literature as an alternative source of identifying the effect of the COVID-19 on the return and risk series. The regression approach of modeling the return series, alongside the GARCH modeling regarding the volatility part, is popular [49,88]. One approach is to include a binary variable that is equal to 1 during the COVID-19 pandemic outbreak in the mean equation and the volatility equation as well. Another approach is to include the daily number of infected people, as well as the number of deaths per day. Since the focus was on the reactions a few days before and after certain announcements or events, the first approach of the binary COVID variable was included in the conditional mean and variance equations’ estimation to evaluate the effects on each stock market.

3.3. Data Description

The following countries were included in the CESEE group of countries, as OECD (Organization for economic cooperation and development) [89,90] classifies them as such: Bosnia and Herzegovina, Bulgaria, Croatia, Czechia, Hungary, Poland, Romania, Serbia, Slovakia, Slovenia, and Ukraine (11 countries in total). These countries had the most data available to perform the analysis. From the website [91], daily data on the stock market indices for the mentioned countries were collected. The abbreviations for the rest of the paper are provided in Table 1, with the starting date being 1 October 2018, and the end dates varied depending on each event, with 1 April 2020 and 1 July 2020 for the robustness checking section.
Next, the important event dates had to be collected, in order to observe if effects were visible on these markets and if they could have been exploited. Previous literature includes official dates when WHO (World Health Organization) announced some specific statements/guidelines that had effects on almost all national economies, as well as the financial markets. The events are given as follows, with detailed dates in Table 2, as some event dates differ one from another for the same event. This was, of course, taken into consideration in the calculation part.
  • Event 1: WHO declared Public Health Emergency of International Concern (PHEIC) regarding COVID-19 on 30 January 2020;
  • Event 2: WHO announced the name “COVID-19”;
  • Event 3: First person to be infected in the country;
  • Event 4: WHO officially declared the pandemic on 11 March 2020;
  • Event 5: Official first lockdown date of the economy.
The return series for every index was calculated via the formula: rt = ln (pt/pt-1), where rt denotes the return series for country i, and pt is the stock index value on day t. For every country, the peak day value of the index before the decline of that index was normalized and values after that day, in order to have comparable results of the values of the indices. This is shown in Figure 1, where a first glance is given into conclusions that indices suffered the most, in terms of the strength of the plunge and not recovering fast enough to the value before the COVID-19 events. The indices that reacted the most were wig, px, and budapest, whereas smaller reactions were found in pfts, birs, and sax. Thus, it is expected that the results that followed, when disaggregated (in terms of individual CARs or ARs) would show this. This means that following future events and announcements regarding COVID-19 and similar problems could result in similar results, and investors should carefully observe reactions of individual country indices. All of the calculation analysis in this research was done in 2 h, as the Rstudio software provides a quick and easy analysis, with graphics done in Excel.

4. Empirical Results

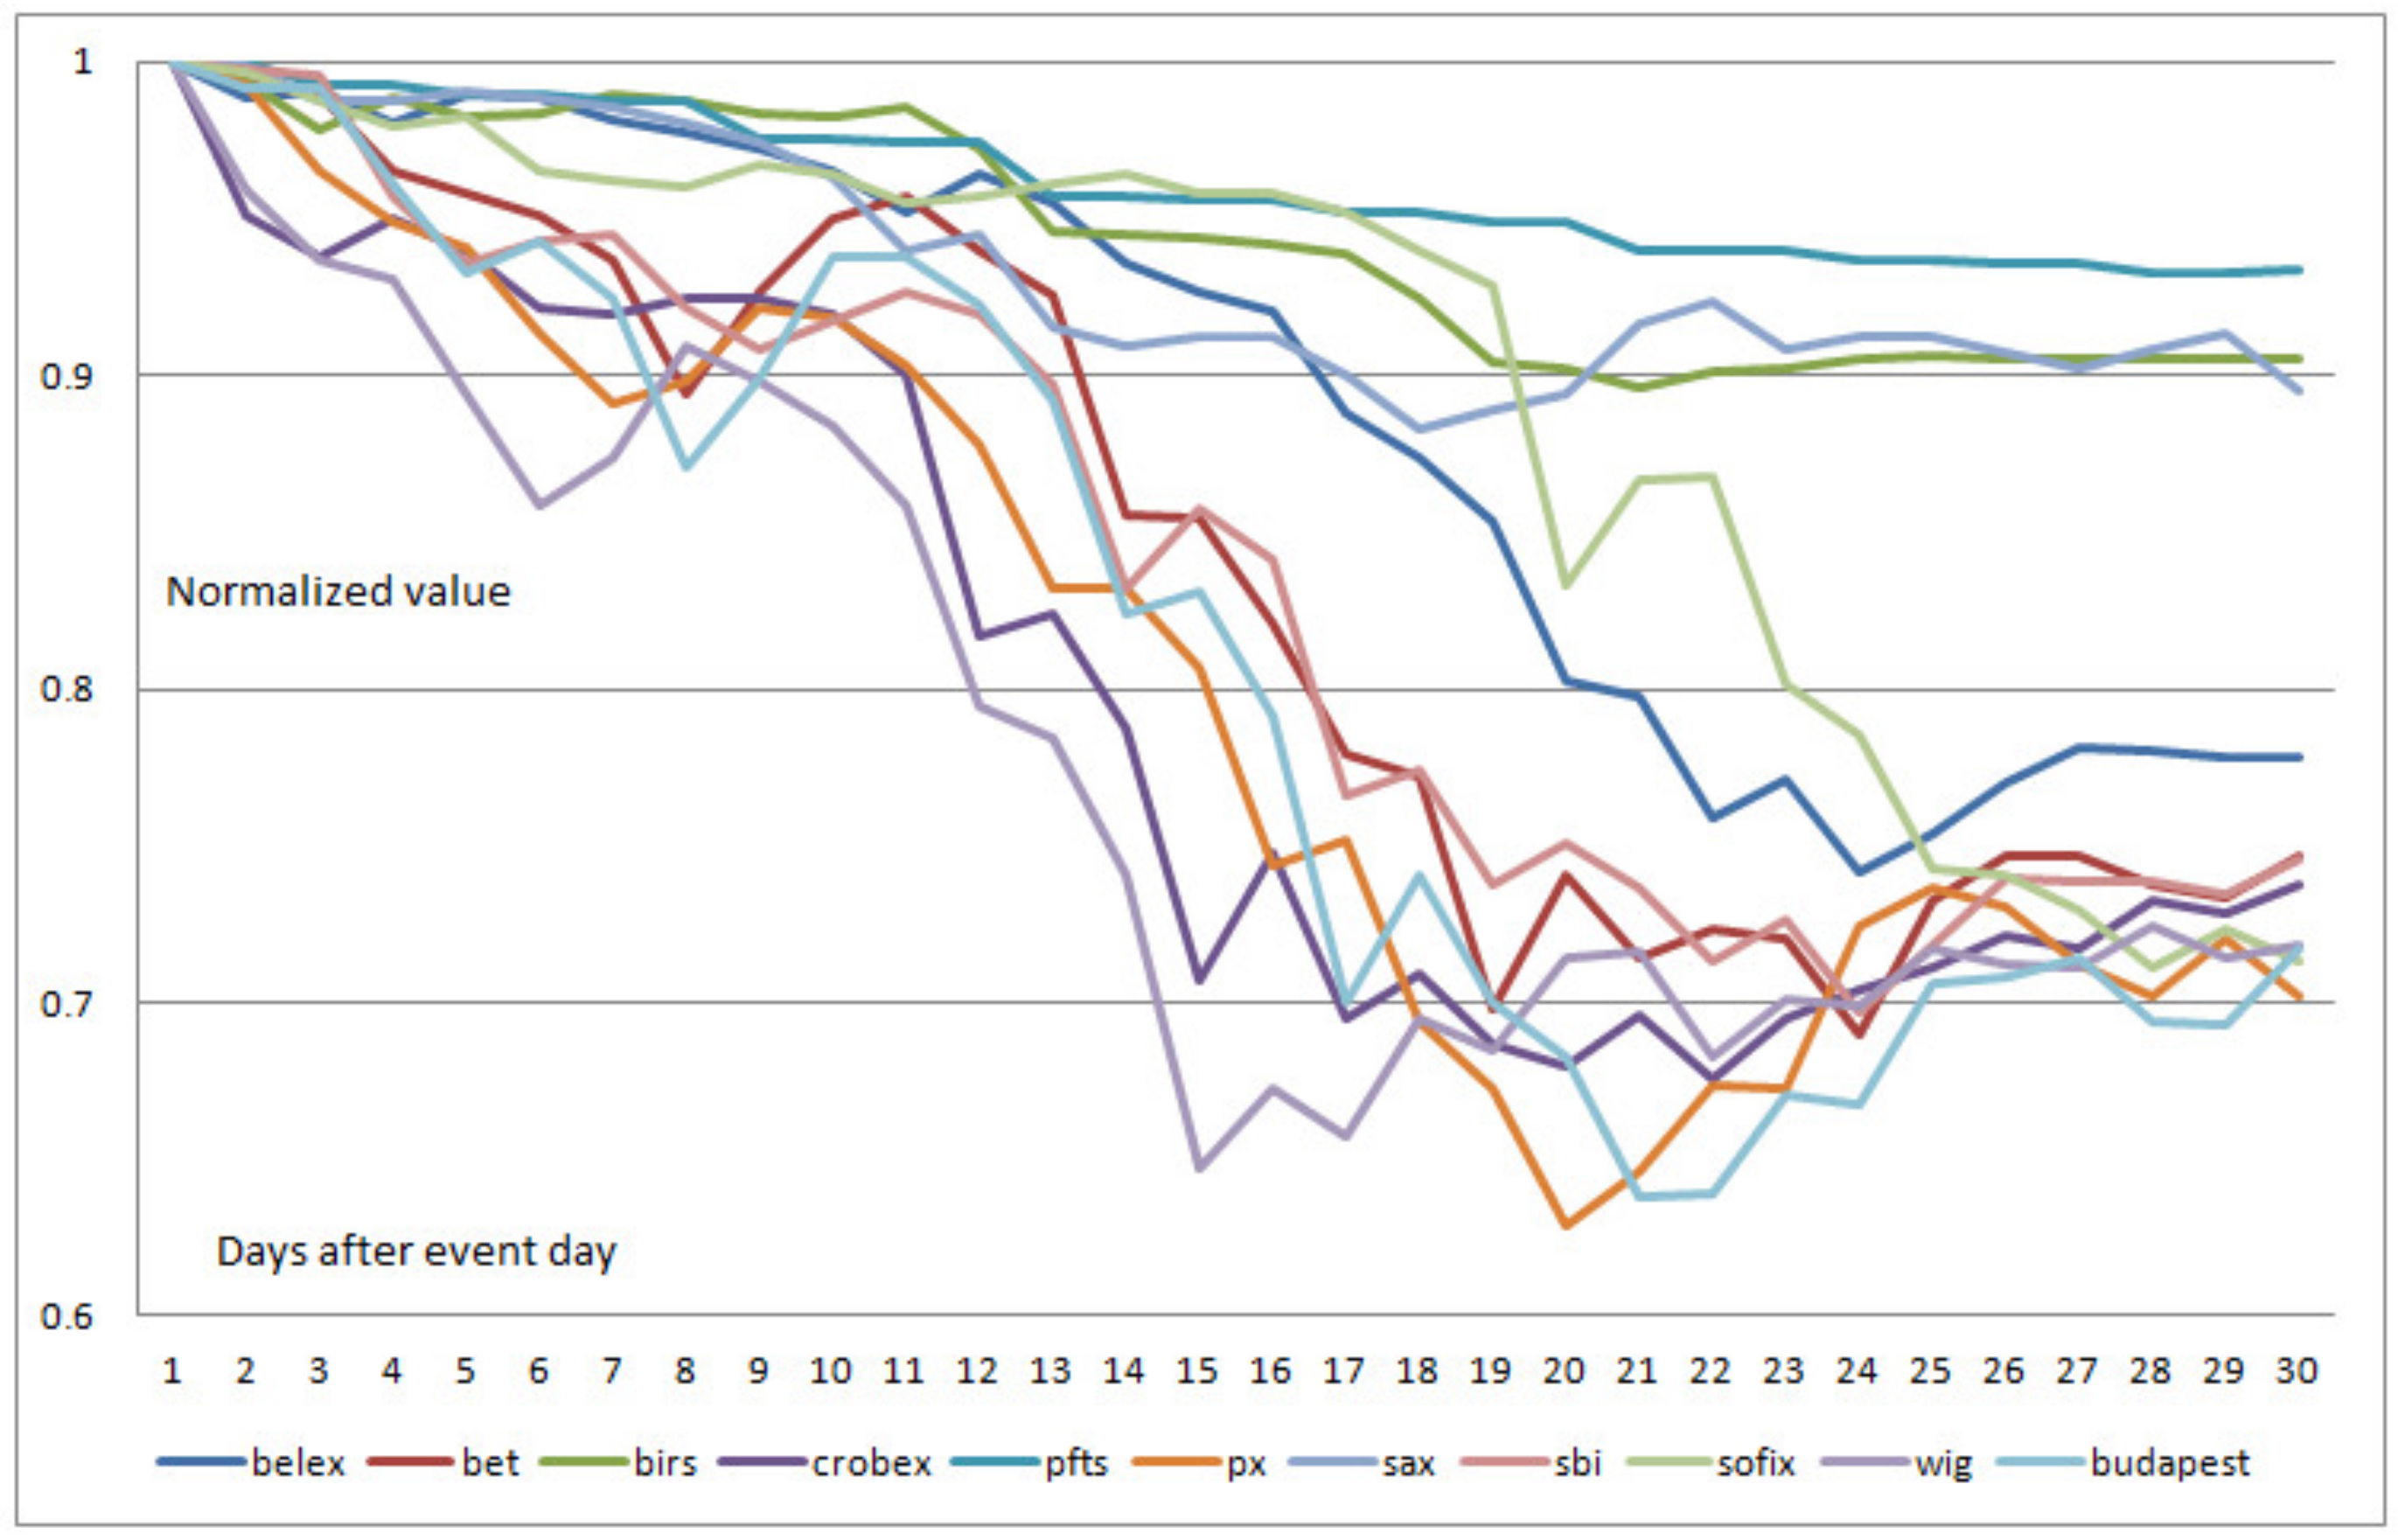
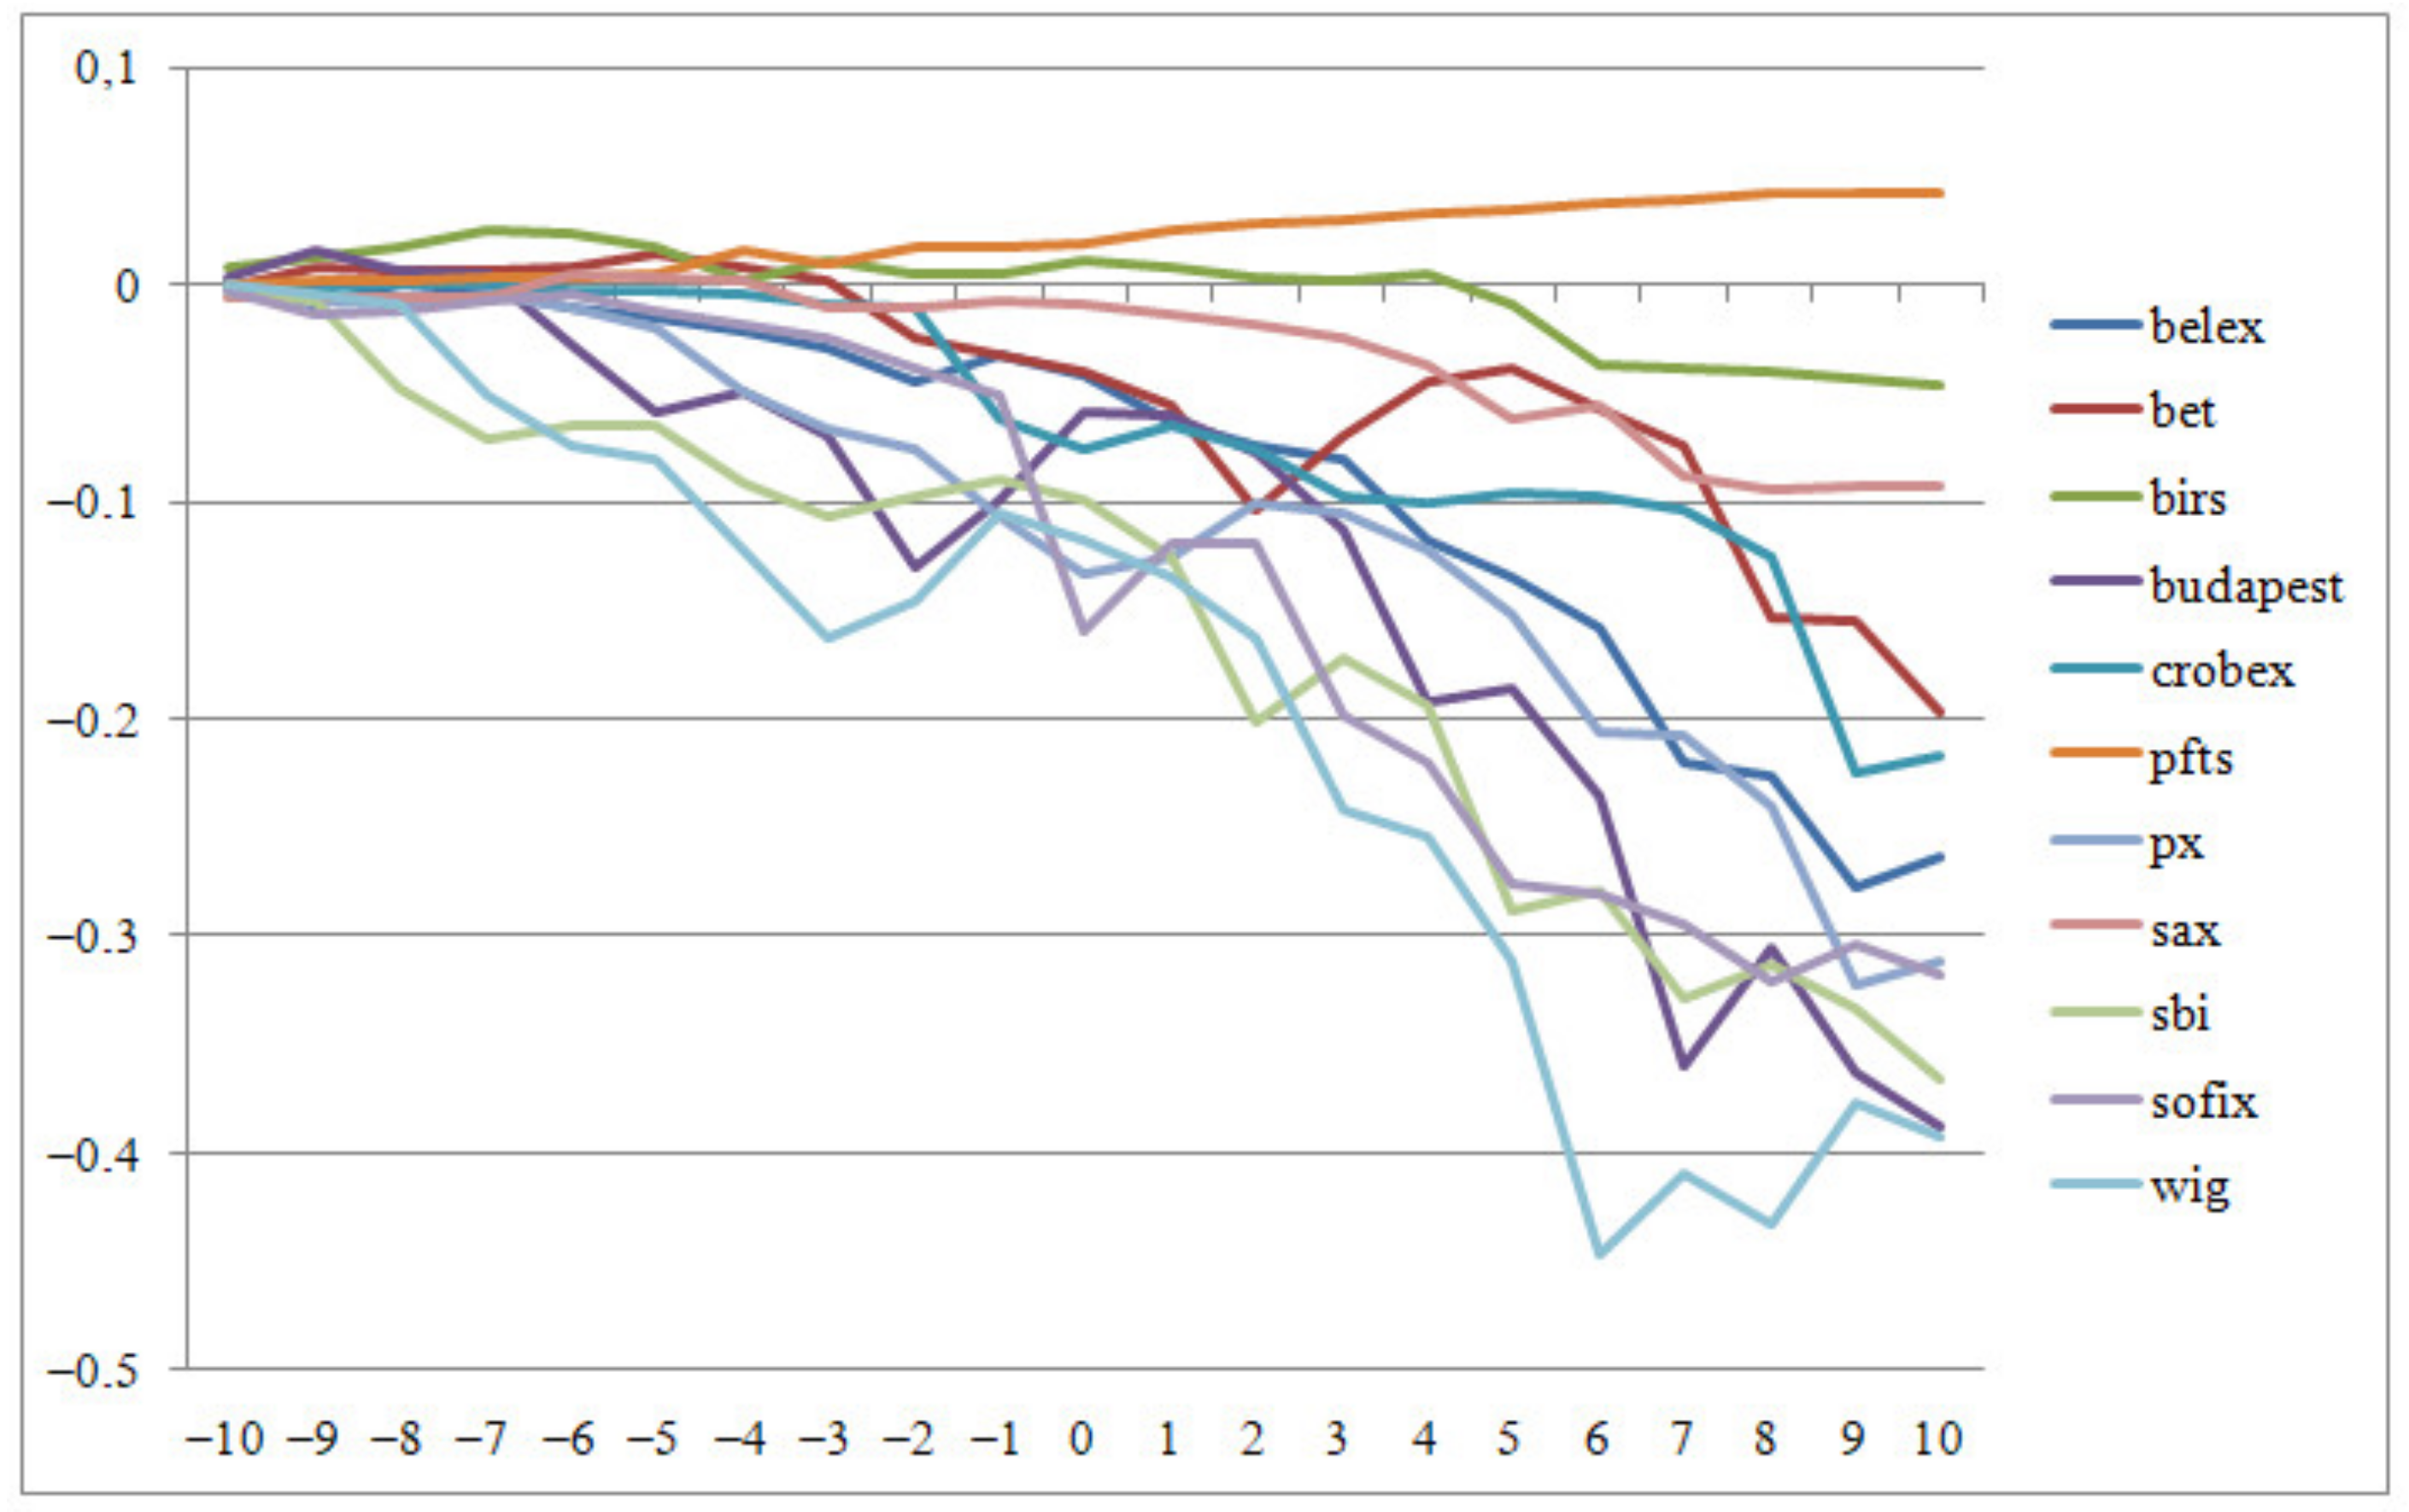
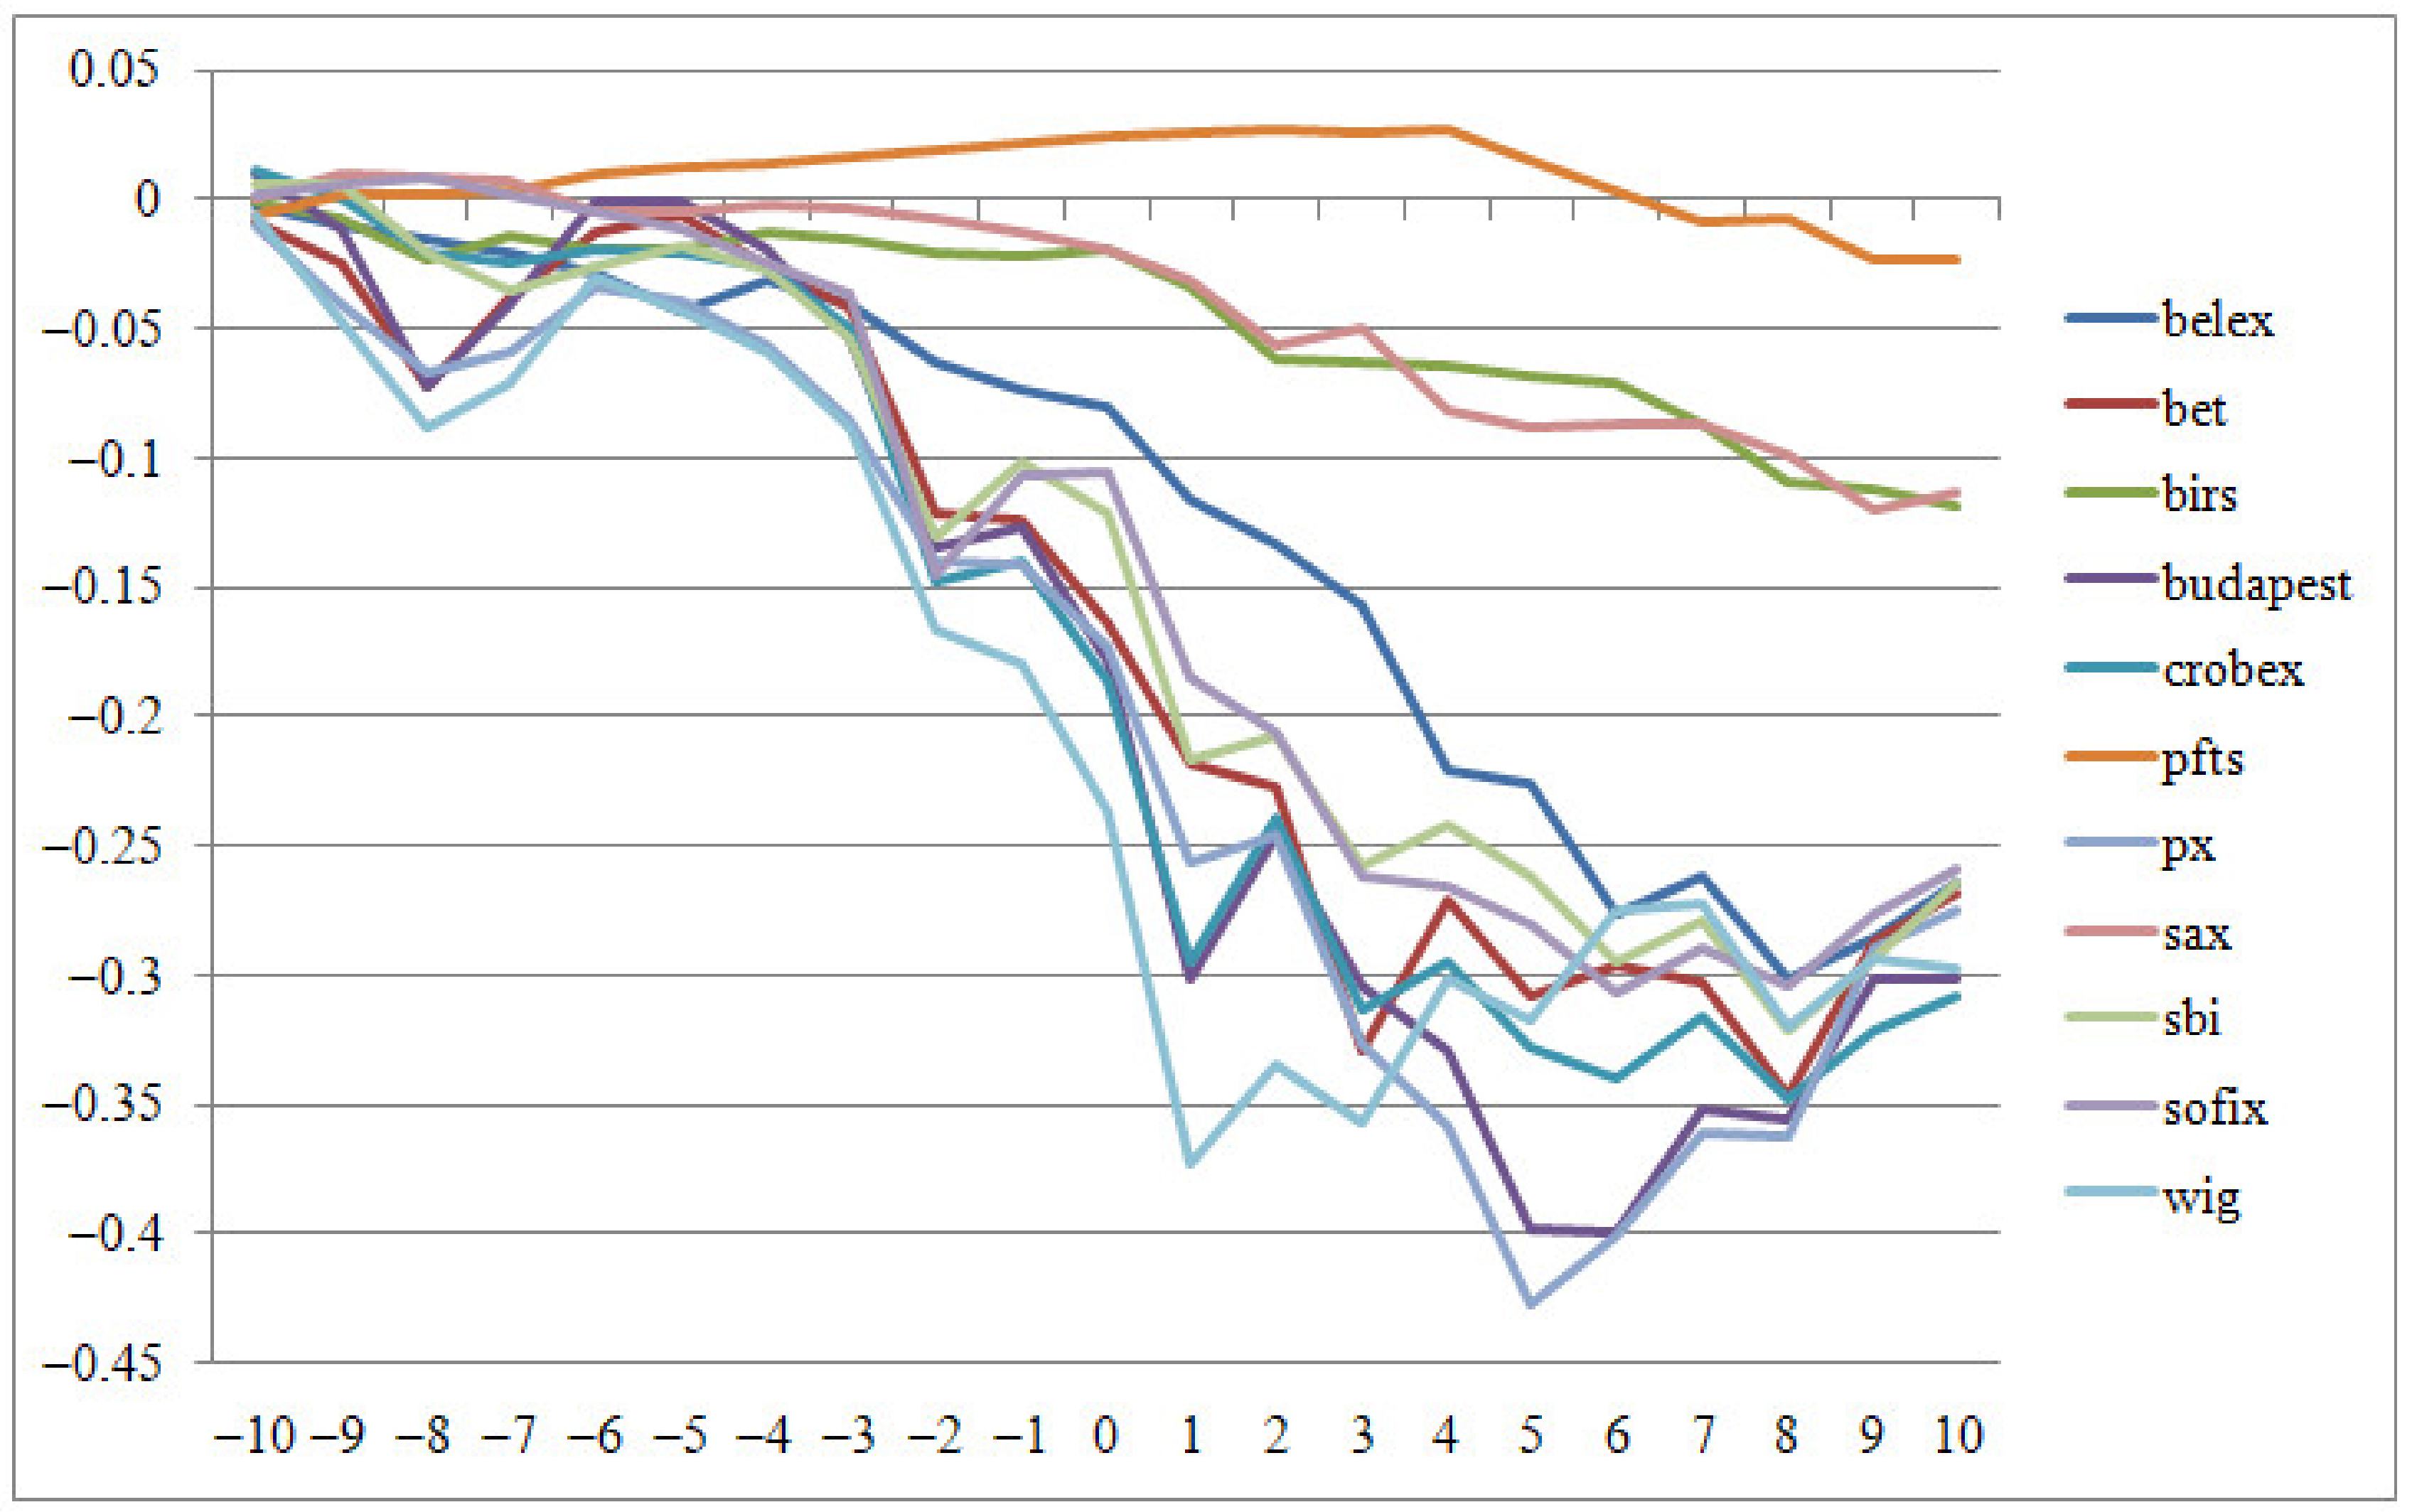
4.1. Main Analysis: ESM Estimation Results

For every mentioned event, the average return in the 100-days window length of the pre-event window was estimated. The abnormal returns, and test values, with corresponding p-values, are given in Table 3, Table 4, Table 5, Table 6, Table 7. Each table corresponds to each of the events described in Table 2. Events 1 and 2 (i.e., Table 3 and Table 4) do not indicate the significance of the stock market reactions to those announcements. Although there are some significant results (please see asterixis in each table), the results are mixed, as not all tests confirmed the same (non)rejection of the null hypothesis. Thus, it could be said that the observed stock markets did not react to the PHEIC and formal name announcement. This is in line with [95], who found that countries that did not suffer the SARS outbreak in 2003 underreacted to the announcement of the COVID outbreak. All of the countries in this study did not experience SARS in 2003.
Next, results of events 3, 4, and 5 indicated significant reactions of the selected markets. Firstly, event 3, the announcement of the first person to be infected in the country, had significant results in the majority of cases after the announcement. The reactions were negative, i.e., ARs and CARs were significantly negative in days +1 to +10. This is in accordance with [4], in which negative reactions are found even up to day +20. In order to obtain insights into how individual CARs evolved over the event period for event 3, Figure 2 was constructed. It depicts the values of all CARs. Due to significant results in Table 4 and Table 5, individual CARs are shown in Figure 3 and Figure 4. The late reaction of returns on the examined markets, when compared to some Asian ones, was found as in [96], as well as the results here, which coincide with previous findings that lockdowns mitigated the negative effects on stock markets, which is visible in Figure 4, which depicts the CARs around the national lockdowns. It is visible that these CARs were not so big in absolute value when compared to those in Figure 2.
The stock returns that reacted the most (when observing Figure 2, Figure 3, Figure 4) are wig, budapest, sbi, and px, which is in line with findings in [97,98], where these markets were found to be most responsive to systematic shocks, as well as bad news reactions to the Brexit vote in [35]. The reaction of sbi and wig is in line with [72] as well, where negative shocks in economic uncertainties spilled over to those two returns in a great manner (i.e., the return series of sbi and wig were found to be net receivers of outside shocks). Furthermore, the least reactions found regarding returns on pfts, birs, and sax are in line with [97], in which the author found that systematic outside-country shocks had the least effects on the mentioned markets, and as [72] found that uncertainties, especially for the pfts series, were found not to affect certain country index returns in a significant manner. Some of the reasoning on why certain index returns reacted so strongly and some had almost no reaction at all to certain events is as follows. Firstly, some differences were found in the size of the observed stock markets, market development, and concentration, as explained in [37], and due to greater connectedness of certain stock markets with the West European ones [99]. Other differences can be found in [8,100]: Investor sentiment is different in countries that are different in terms of cultural independence or interdependence. Analyzed countries differ one from another in these terms. When the investor sentiment is affected such that the herding effects distort the market expectations, reactions differ from country to country as well (see [101]). More about the cultural independence and herding on stock markets is analyzed in [102]. Other explanations include [103], as the investor actions rely on their trust in the actions of formal institutions, such as the macroeconomic policy responses (more details and references are in [96,104,105,106].

4.2. Robustness Checking: GARCH Estimation Results

For a robustness check, each return series was estimated as an ARMA(p,q)-GARCH process, with a binary variable included for the period regarding Event 3 onwards. The selection of the appropriate lengths p and q, as well as the GARCH specification for every return series, was made based upon the Schwartz information criteria (detailed results are available upon request). The idea was to test the significance of the binary variable “COVID-19” in the whole observed period, from 3 January 2019 until 1 July 2020 for long-term effects and until 1 April 2020 for short-term effects, as the majority of previous findings indicated short-term stock market reactions to the COVID crisis. The results of the estimated parameter besides the COVID variable and its significance are given in Table 8. The short-term negative effects were more prominent in the mean equation, whereas the variance of the return series was more affected in the long term. The aforementioned analysis concluded similar results regarding (non)significance of the return reactions of individual countries.

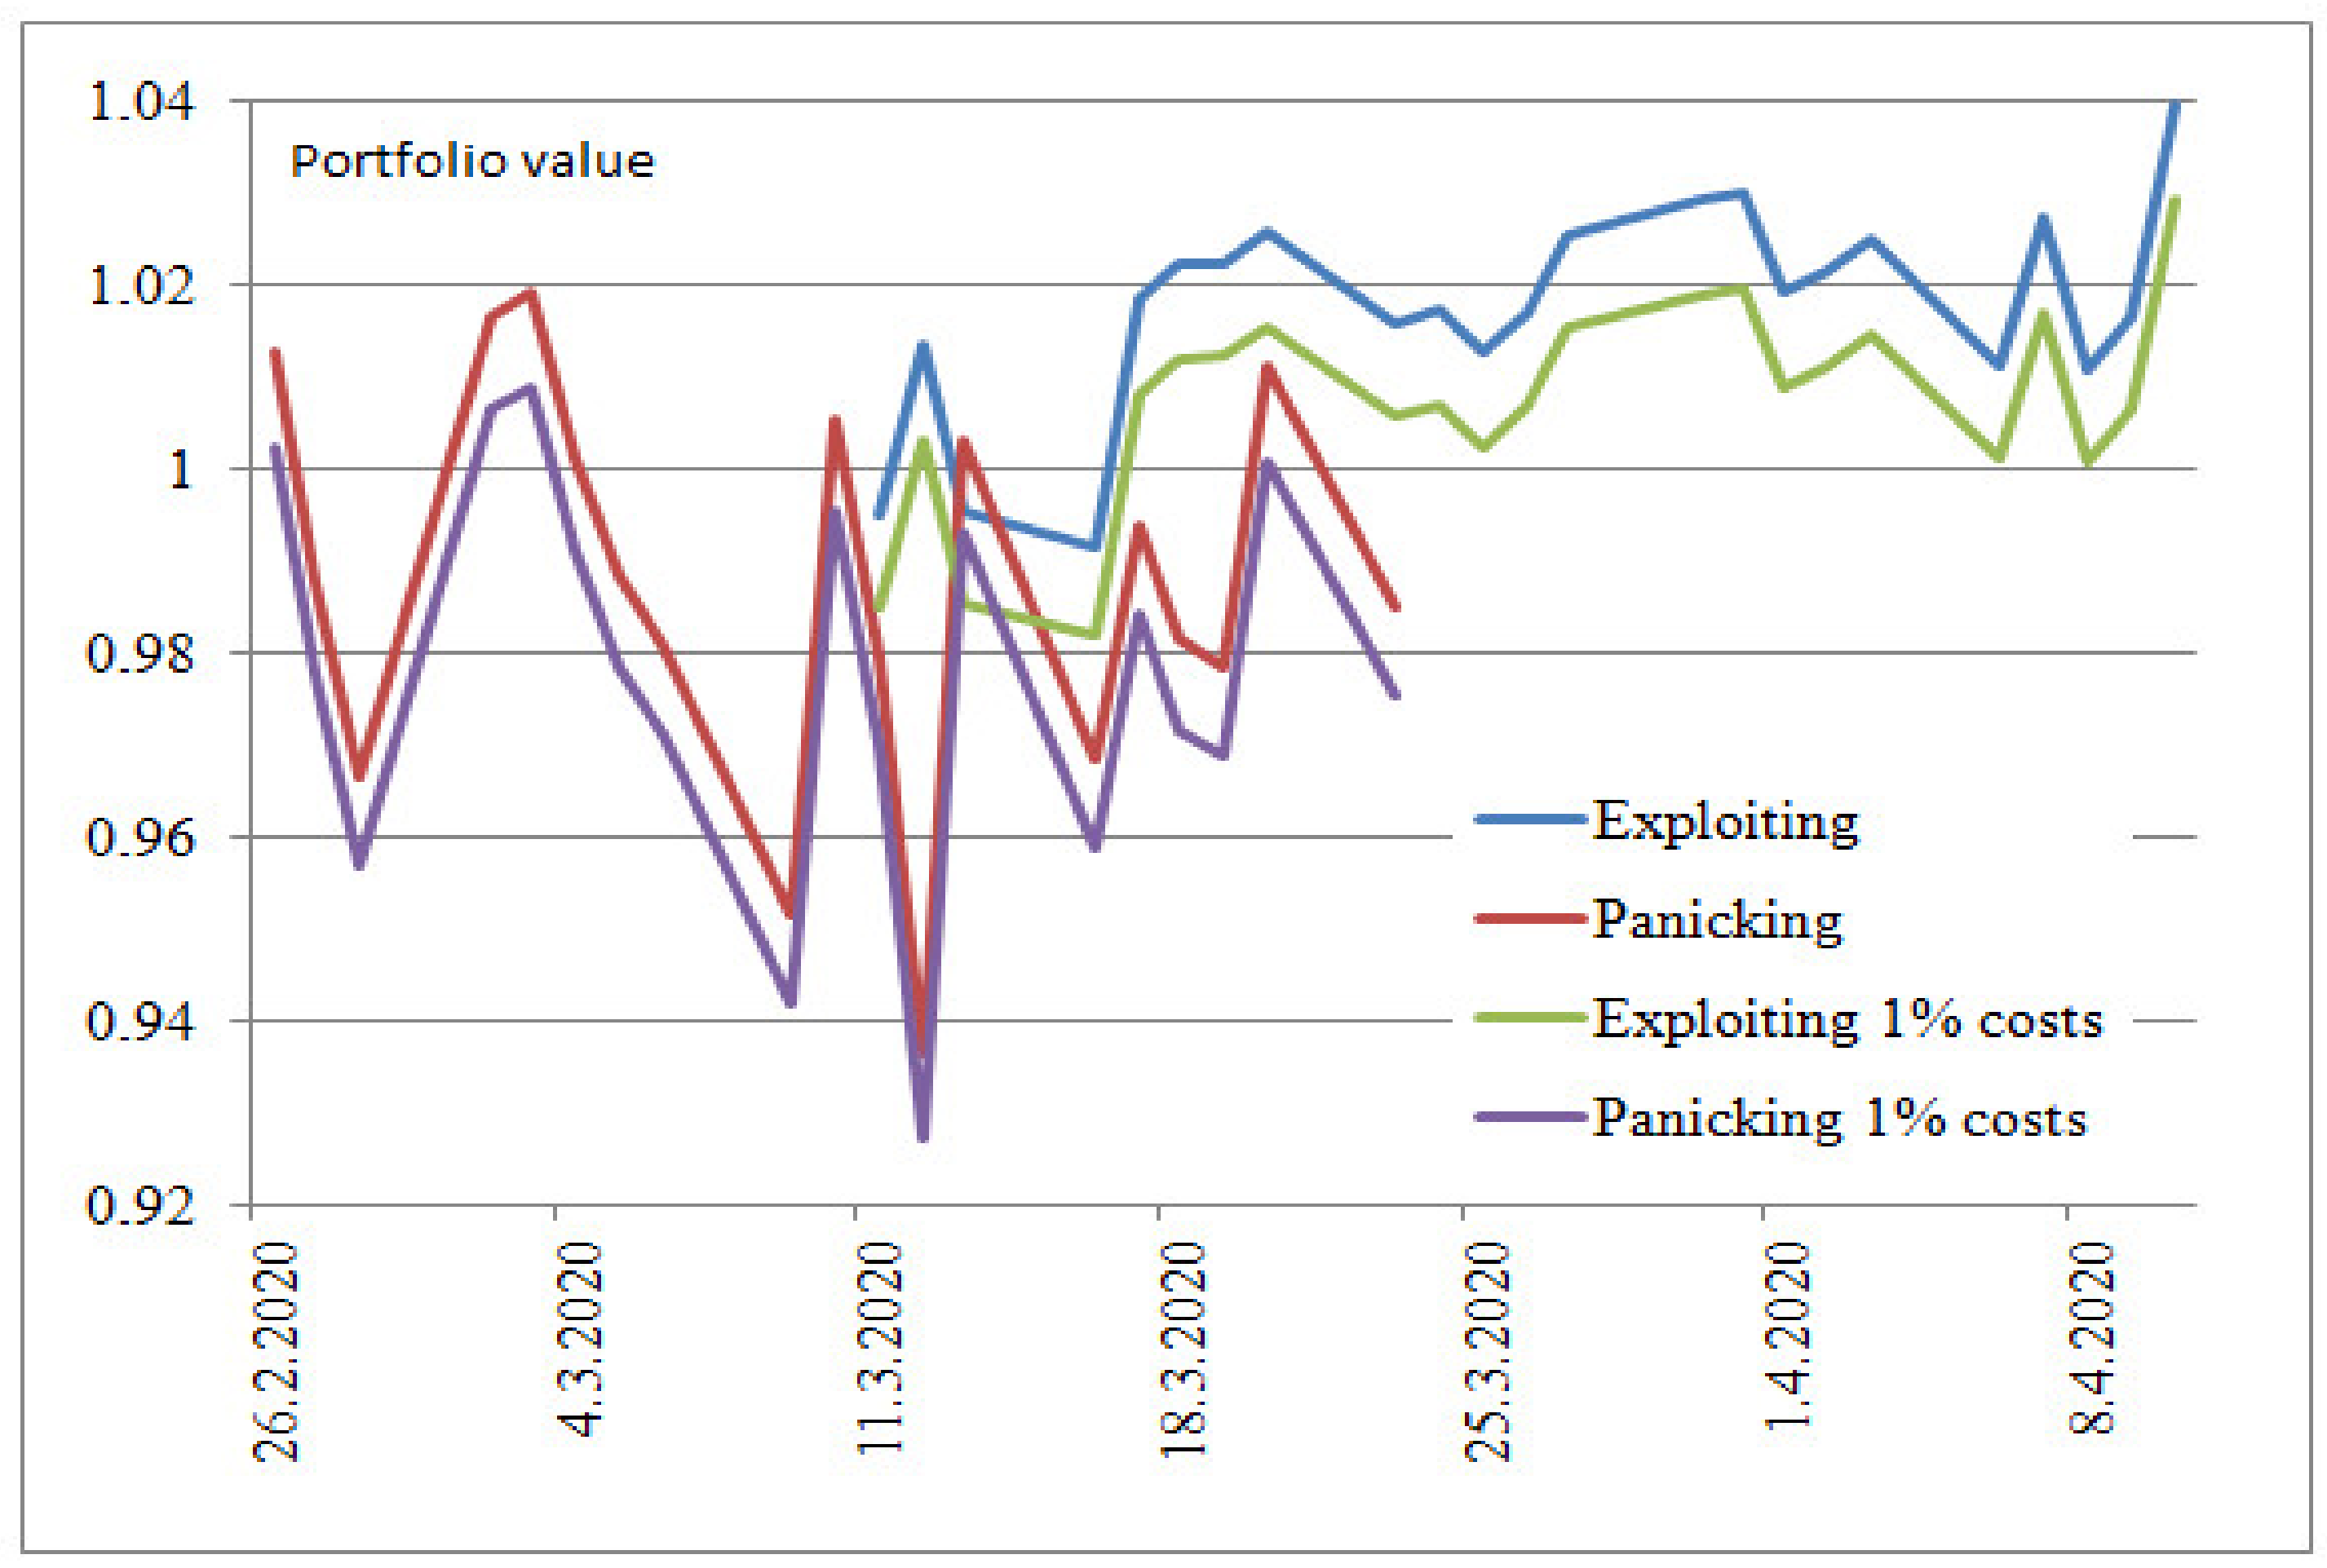
4.3. Trading Simulation Results

Finally, due to the obtained insights that the CESEE stock markets reacted the most in the case of the event 3 onwards (first person affected by the disease in the country), the following simulations were made. It was assumed that the investor observed that the CARs were declining after the zero date in event 3. Then, the investor decided on the +10 day to buy all of the indices. This means that he would have bought the indices when the lowest values of each index were achieved. Afterward, it was assumed that the investor was holding equal weights of every index in his portfolio, until the stock markets recovered around 10 April. This strategy is shown as the blue line on Figure 5, in which the portfolio value of the strategy titled “exploiting” was the value the investor would be tracking over the observed period. The values were normalized concerning the assumption that one monetary unit value was invested during the simulation process.
Another strategy is called the “panicking” one, in which the red line in Figure 5 depicts portfolio value if the investor has panicked during the event 3. Namely, it was assumed that the investor sold his portfolio of all of the CESEE indices at the +1 day, then if he decided to sell it on +2 day, etc., until the last day. Thus, the red line depicts the values of a portfolio if the investor sold it on a particular date. Although some investors could have obtained positive returns in the panicking scenario (around 3 March 2020), this could have been pure luck. On the other side, the contrarian strategy, of buying when stock markets were low and holding the portfolio until the initial panic settled down, would have provided certain gains. Additionally, the strategies were corrected via 1% transaction costs per transaction. The conclusions are the same (Figure 5).
These simple strategies provide useful information of those future similar events, if the investors observe a plunge of stock values or stock market indices, that the exploiting strategies could be profitable.

5. Conclusions

The focus of this paper was on whether the CESEE stock market returns reacted and in which manner. Due to the extensive research already done, the literature overview done before this paper indicated that, as usual, CESEE markets are often neglected. Thus, as a starting point, several major announcements that could have affected the observed market were examined, due to significant results found for other, more developed ones. The main idea was to obtain insights into the collective reaction, but also if there exist differences in the CAR series. The reasoning lies in the fact that, if due to the explained differences of the selected stock markets, the reactions are somewhat mixed, how could have the investor profited if he followed a contrarian strategy, i.e., not panicked. The panic was more prominent in countries that were found to be more reactive to systematic shocks outside the country in the previous literature, as well as due to the herding mentality, especially during the bad times (bear markets). This could be exploitable in the future. If new strains of the COVID-19 develop over the future even more (compared to the time of writing this study), if new vaccines are not efficient or distributed as quickly as now, such problems exist and some markets could react more to such news compared to others. That is why investors need to follow certain announcements and observe what is going on in the next few days after the event. Those interested in exploiting negative (or positive news) could have similar approaches made in the simulation part of this research. The results of this study are in line with previous related research, Liu et al. (2020), as this research finds significant negative effects on the selected stock markets, with investors’ fear, i.e., panicking, being the transmission channel for the negative return realizations. Moreover, this study found short-term effects on the selected stock markets. Although the effects were short termed, investors could have obtained some profits. These effects are in line with [49], where the markets were found to be self-correcting systems, as explained by irrational exuberance. Furthermore, the results are in line with [55], where the results of risk-averted investors spreading quickly over the markets is explained via the attention-induced price pressure hypothesis.
When comparing the results of this study to the results from other crises, such as the dot-com crisis and the global financial crisis (GFC), the conclusions are as follows. Early work found that the contagion effects increased during the 1987 crash [107,108]. These effects mean that the negative crisis effects spill over more quickly and with more severe consequences compared to the normal times. Furthermore, the dot-com crisis was also characterized by such effects [109], as was the global financial crisis [110] and the Eurozone debt crisis as well [111]. The negative effects of the COVID-19 crisis compared to the aforementioned ones was confirmed in [112], where authors found similar characteristics regarding stock markets’ reactions to those of previous crises. However, if the investor utilizes the “pairs trading” strategy (see [113,114,115]), in which a trader tries to profit due to short-term mispricing of stocks, as utilized in this study, this could be an arbitrage trading strategy in which the investor can obtain profits. The link between this strategy and the one used in this study is found in the idea of the “pairs trading” strategy, where a short position is taken in the overperforming stock and a long position is held for the underperforming one. The idea is that, due to the mean reverting process in every stock price, the values of stocks will eventually converge to their true long-term values. A shock such as the negative news about the COVID-19 pandemic is something a contrarian investor knows is temporary, and, by utilizing some kind of “pairs trading” strategy approach, he can either save the value of his portfolio or even achieve extra gains in the short run. Thus, if other bad news occurs regarding the pandemic or other news related to vaccines and eventual medicines arise, investors can observe them as short-term shock deviations from long-term values and utilize a “pairs trading” strategy to obtain extra profits.
However, there exists awareness of the shortfalls of the study. As mentioned in the introduction, the liquidity of CESEE stock markets is not a new problem. This makes it difficult to collect significant data on a sectoral or individual stock level. Thus, the reactions obtained in this study are, in general, averaged. If better (more quality) data are obtained in the future, the analysis could be made for other lockdowns (currently, some countries are in the second lockdown and some are starting the third one). This could provide a better picture of sectoral reactions regarding new announcements regarding vaccines, the tourism industry, and other relevant sectors that are sometimes affected the most, not only by the announcements but by the macroeconomic policy reactions regarding saving the economy, employment, and other relevant aspects of the economy.

Funding

This research received no external funding.

Institutional Review Board Statement

Not applicable.

Informed Consent Statement

Not applicable.

Data Availability Statement

Data is available upon request.

Conflicts of Interest

The author declares no conflict of interest. The author states that the views presented in this paper are those of the author and not necessarily representing the institution she works at.

References

  1. Zhang, D.; Hu, M.; Ji, Q. Financial Markets under the Global Pandemic of COVID-19. Financ. Res. Lett. 2020, 36, 101528. [Google Scholar] [CrossRef]
  2. Barro, R.J.; Ursua, J.F.; Weng, J. The Coronavirus and the Great Influenza Pandemic: Lessons from the “Spanish Flu” for the Coronavirus’s Potential Effects on Mortality and Economic Activity; Working Papers No. w26866; National Bureau of Economic Research: Cambridge, MA, USA, 2020. [Google Scholar] [CrossRef]
  3. He, P.; Sun, Y.; Zhang, Y.; Li, T. COVID–19′s Impact on Stock Prices Across Different Sectors—An Event Study Based on the Chinese Stock Market. Emerg. Mark. Financ. Trade 2020, 56, 2198–2212. [Google Scholar] [CrossRef]
  4. Ashraf, B.N. Stock markets’ reaction to COVID-19: Cases or fatalities? Res. Int. Bus. Financ. 2020, 54, 101249. [Google Scholar] [CrossRef]
  5. Al-Awadhi, A.; Alsafi, K.; Al-Awadhi, A.; Alhammadi, S. Death and contagious infectious disease: Impact of the COVID-19 virus on stock market returns. J. Behav. Exp. Financ. 2020, 27, 100326. [Google Scholar] [CrossRef]
  6. Mazur, M.; Dang, M.; Vega, M. COVID-19 and the march 2020 stock market crash. Evidence from S&P1500. Finance Res. Lett. 2020, 38, 101690. [Google Scholar]
  7. Harvey, C.; Liu, Y.; Zhu, H. and the Cross-Section of Expected Returns. Rev. Financ. Stud. 2015, 29, 5–68. [Google Scholar] [CrossRef] [Green Version]
  8. Donadelli, M.; Kizys, R.; Riedel, M. Dangerous infectious diseases: Bad news for Main Street, good news for Wall Street? J. Financ. Mark. 2017, 35, 84–103. [Google Scholar] [CrossRef]
  9. Hanna, D.; Yiping, H. The impact of SARS on Asian Economies. Asian Econ. Pap. 2004, 3, 102–112. [Google Scholar] [CrossRef]
  10. Smith, R.D.; Keogh-Brown, M.R.; Barnett, T. Estimating the economic impact of pandemic influenza: An application of the computable general equilibrium model to the UK. Soc. Sci. Med. 2011, 73, 235–244. [Google Scholar] [CrossRef]
  11. Haacker, M. The Impact of HIV/AIDS on Government Finance and Public Services; International Monetary Fund: Washington, DC, USA, 2004. [Google Scholar]
  12. Bloom, D.E.; Cadarette, D.; Sevilla, J.P. Epidemics and economics: New and resurgent infectious diseases can have far-reaching economic repercussions. Financ. Dev. 2018, 55, 46–49. [Google Scholar]
  13. Kahneman, D.; Tversky, A. Prospect theory: An analysis of decision under risk. Econometrica 1979, 47, 263–291. [Google Scholar] [CrossRef] [Green Version]
  14. Shefrin, H.; Statman, M. The disposition to sell winners too early and ride losers too long: Theory and evidence. J. Financ. 1985, 40, 777–790. [Google Scholar] [CrossRef]
  15. De Long, J.B.; Shleifer, A.; Summers, L.H.; Waldmann, R.J. Noise trader risk in financial markets. J. Political Econ. 1990, 98, 703–738. [Google Scholar] [CrossRef]
  16. Lee, C.; Shleifer, A.; Thaler, R.H. Investor sentiment and the closed-end fund puzzle. J. Financ. 1991, 46, 75–109. [Google Scholar] [CrossRef]
  17. Shleifer, A. Inefficient Markets: An Introduction to Behavioral Finance; Oxford University Press: New York, NY, USA, 1999. [Google Scholar]
  18. Škrinjarić, T.; Golubić, Z.L.; Orlović, Z. Empirical analysis of dynamic spillovers between exchange rate return, return volatility and investor sentiment. Studies in Economics and Finance. Stud. Econ. Finance 2020, 38, 86–113. [Google Scholar] [CrossRef]
  19. Baker, M.; Wurgler, J. Investor Sentiment and the Cross-Section of Stock Returns. J. Financ. 2006, 61, 1645–1680. [Google Scholar] [CrossRef] [Green Version]
  20. Baker, M.; Wurgler, J. Investor sentiment in the stock market. J. Econ. Perspect. 2007, 21, 129–152. [Google Scholar] [CrossRef] [Green Version]
  21. Chiang, T.C. Financial risk, uncertainty and expected returns: Evidence from Chinese equity markets. China Financ. Rev. Int. 2019, 9, 425–454. [Google Scholar] [CrossRef]
  22. Krugman, P. Crashing Economy, Rising Stocks: What’s Going On? New York Times. 30 April 2020. Available online: https://www.nytimes.com/2020/04/30/opinion/economy-stock-market-coronavirus.html (accessed on 20 January 2021).
  23. Malkiel, B.; Shiller, R. Does Covid-19 Prove the Stock Market Is Inefficient? A Wealth of Common Sense. 11 May 2020. Available online: https://awealthofcommonsense.com/2020/05/does-covid-19-prove-the-stock-market-is-inefficient/ (accessed on 20 January 2021).
  24. Baek, S.; Mohanty, S.K.; Glambosky, M. COVID-19 and stock market volatility: An industry level analysis. Financ. Res. Lett. 2020, 37, 101748. [Google Scholar] [CrossRef]
  25. Bouri, E.; Demirer, R.; Gupta, R.; Pierdzioch, C. Infectious Diseases, Market Uncertainty and Oil Market Volatility. Energies 2020, 13, 4090. [Google Scholar] [CrossRef]
  26. Li, Y.; Liang, C.; Ma, F.; Wang, J. The role of the IDEMV in predicting European stock market volatility during the COVID-19 pandemic. Financ. Res. Lett. 2020, 36, 101749. [Google Scholar] [CrossRef]
  27. Haroon, O.; Rizvi, S.A.R. COVID-19: Media coverage and financial markets behavior-A sectoral inquiry. J. Behav. Exp. Financ. 2020, 27, 100343. [Google Scholar] [CrossRef]
  28. Ali, M.; Alaam, N.; Rizvi, S.A.R. Coronavirus (COVID-19)—An epdicemic or pandemic for financial markets. J. Behav. Exp. Financ. 2020, 27, 100341. [Google Scholar] [CrossRef] [PubMed]
  29. Rojas, F.; Jiang, X.; Montenovo, L.; Simon, K.I.; Weinberg, B.A.; Wing, C. Is the Cure Worse than the Problem Itself? Immediate Labor Market Effects of COVID-19 Case Rates and School Closures in the U.S.; NBER Working Paper No. 27127; National Bureau of Economic Research: Cambridge, MA, USA, 2020. [Google Scholar]
  30. Haddad, V.; Moreira, A.; Muir, T. When Selling Becomes Viral: Disruptions in Debt Markets in the COVID-19 Crisis and the Fed’s Response; NBER Working Paper No. 27168; National Bureau of Economic Research: Cambridge, MA, USA, 2020. [Google Scholar]
  31. Jordà, Ò.; Singh, S.R.; Taylor, A.M. Longer-Run Economic Consequences of Pandemics; CEPR Discussion Paper DP14543; CEPR: London, UK, 2020. [Google Scholar]
  32. Goodell, J.W. COVID-19 and finance: Agendas for future research. Financ. Res. Lett. 2020, 35, 101512. [Google Scholar] [CrossRef]
  33. Sharif, A.; Aloui, C.; Yarovaya, L. COVID-19 pandemic, oil prices, stock market and policy uncertainty nexus in the US economy: Fresh evidence from the wavelet-based approach. Int. Rev. Financ. Anal. 2020, 70, 101496. [Google Scholar] [CrossRef]
  34. Yarovaya, L.; Matkovskyy, R.; Jalan, A. The Effects of a ‘Black Swan’ Event (COVID-19) on Herding Behavior in Cryptocurrency Markets: Evidence from Cryptocurrency USD, EUR, JPY and KRW Markets. SSRN, 29 April 2020. Available online: https://ssrn.com/abstract=3586511 (accessed on 20 January 2021).
  35. Škrinjarić, T. Stock Market Reactions to Brexit: Case of Selected CEE and SEE Stock Markets. Int. J. Financ. Stud. 2019, 7, 1. [Google Scholar] [CrossRef] [Green Version]
  36. Trenca, I.; Petria, I.; Pece, A.M. Empirical inquiry of gregarious behavior: Evidence from European emerging markets. Rev. Econ. 2015, 67, 143–160. [Google Scholar]
  37. Baele, L.; Bekaert, G.; Schäfer, L. An Anatomy of Central and Eastern European Equity Markets; Columbia Business School: New York, NY, USA, 2015; pp. 15–71. [Google Scholar]
  38. Golab, A.; Allen, D.E.; Powell, R. Aspects of Volatility and Correlations in European Emerging Economies. In Emerging Markets and Sovereign Risk; Finch, N., Ed.; Palgrave Macmillan: London, UK, 2015. [Google Scholar]
  39. Burch, T.R.; Emery, D.R.; Fuerst, M.E. Who Moves Markets in a Sudden Marketwide Crisis? Evidence from 9/11. J. Financ. Quant. Anal. 2016, 51, 463–487. [Google Scholar] [CrossRef]
  40. Vidović, J. Investigation of stock illiquidity on Central and South East European markets in naïve portfolio framework. Ekon. Misao I Praksa 2013, 2, 537–550. [Google Scholar]
  41. Heyden, K.J.; Heyden, T. Market Reactions to the Arrival and Containment of COVID-19: An Event Study. Finance Research Letters, Forthcoming; SSRN: Rochester, NY, USA, 2020. [Google Scholar]
  42. Verma, S.; Gustafsson, A. Investigating the emerging COVID-19 research trends in the field of business and management: A bibliometric analysis approach. J. Bus. Res. 2020, 118, 253–261. [Google Scholar] [CrossRef]
  43. Aristovnik, A.; Ravšelj, D.; Umek, L. A Bibliometric Analysis of COVID-19 across Science and Social Science Research Landscape. Sustainability 2020, 12, 9132. [Google Scholar] [CrossRef]
  44. Arslan, H.M.; Bilal, C.S.; Bashir, M.F.; Naseer, K. Contemporary research on spillover effects of COVID-19 in stock markets. A systematic and bibliometric review. In Proceedings of the 3rd International Electronic Conference on Environmental Research and Public Health—Public Health Issues in the Context of the COVID-19 Pandemic session Health Economics, Online, 11–25 January 2020. [Google Scholar]
  45. Baker, S.R.; Bloom, N.; Davis, S.J.; Kost, K.; Sammon, M.; Viratyosin, T. The Unprecedented Stock Market Reaction to COVID-19. 2020. Available online: https://www.policyuncertainty.com/media/StockMarkets_COVID.pdf-24-03-2020 (accessed on 20 January 2021).
  46. Baker, S.; Bloom, N.; Davis, S.J.; Terry, S.J. COVID-Induced Economic Uncertainty. 2020. Available online: http://www.policyuncertainty.com/media/COVID-Induced%20.pdf (accessed on 20 January 2021).
  47. Liu, H.; Manzoor, A.; Wang, C.; Zhang, L.; Manzoor, Z. The COVID-19 outbreak and affected countries stock markets response. Int. J. Environ. Res. Public Health 2020, 17, 2800. [Google Scholar] [CrossRef] [PubMed] [Green Version]
  48. Huo, X.; Qiu, Z. How Does China’s Stock Market React to the Announcement of the COVID-19 Pandemic Lockdown? (Working Paper). 2020. Available online: https://ssrn.com/abstract=3594062 (accessed on 20 January 2021).
  49. Chaudhary, R.; Bakhski, P.; Gupta, H. Volatility in International Stock Markets: An Empirical Study during COVID-19. J. Risk Financ. Manag. 2020, 13, 208. [Google Scholar] [CrossRef]
  50. Ahmed, A.D.; Huo, R. Volatility transmissions across international oil market, commodity futures and stock markets: Empirical evidence from China. Energy Econ. 2020, 93, 104741. [Google Scholar] [CrossRef]
  51. Sansa, N.A. The impact of the COVID-19 on the financial markets: Evidence from China and USA. Electron. Res. J. Soc. Sci. Hum. 2020, 2, 29–39. [Google Scholar] [CrossRef]
  52. Corbet, S.; Hou, G.; Yang, H.; Lucey, B.M.; Oxley, L. Aye Corona! The contagion effects of being named corona during the COVID-19 pandemic. Financ. Res. Lett. 2020, 38, 101591. [Google Scholar] [CrossRef]
  53. Hassan, S.M.; Riveros Gavilanes, J.M. First to React Is the Last to Forgive: Evidence from the Stock Market Impact of COVID 19. J. Risk Financ. Manag. 2021, 14, 1–25. [Google Scholar]
  54. Bahrini, F.; Filfilan, A. Impact of the novel coronavirus on stock market returns: Evidence from GCC countries. Quant. Financ. Econ. 2020, 4, 640–652. [Google Scholar] [CrossRef]
  55. Papadamou, S.; Fassas, A.P.; Kenourgis, D.; Dimitriou, D. Direct and Indirect Effects of COVID-19 Pandemic on Implied Stock Market Volatility: Evidence from Panel Data Analysis; MPRA Paper No. 100020; MPRA: Munich, Germany, 2020; Available online: https://mpra.ub.uni-muenchen.de/100020/ (accessed on 20 January 2021).
  56. Bai, L.; Wei, Y.; Wei, G.; Li, X.; Zhang, S. Infectious disease pandemic and permanent volatility of international stock markets: A long-term perspective. Financ. Res. Lett. 2021, 40, 101709. [Google Scholar] [CrossRef]
  57. Nippani, S.; Washer, K. SARS: A Non-Event for Affected Countries’ Stock Markets? Appl. Financ. Econ. 2004, 14, 1105–1110. [Google Scholar] [CrossRef]
  58. Wang, Y.-H.; Yang, F.-J.; Chen, L.-J. An investor’s perspective on infectious diseases and their influence on market behavior. J. Bus. Econ. Manag. 2013, 14 (Suppl. 1), S112–S127. [Google Scholar] [CrossRef] [Green Version]
  59. Chen, M.-H.; Jang, S.C.S.; Kim, W.G. The Impact of the SARS Outbreak on Taiwanese Hotel Stock Performance: An Event-study Approach. Int. J. Hosp. Manag. 2007, 26, 200–212. [Google Scholar] [CrossRef]
  60. Del Giudice, A.; Paltrinieri, A. The impact of the Arab Spring and the Ebola outbreak on African equity mutual fund investor decisions. Res. Int. Bus. Financ. 2017, 41, 600–612. [Google Scholar] [CrossRef]
  61. Intellinews. 2020. Available online: https://www.intellinews.com/central-southeast-europe-stock-markets-jump-in-anticipation-of-covid-free-future-197421/ (accessed on 20 January 2021).
  62. Ari, A.; Bartolini, D.; Boranova, V.; di Bella, G.; Dybczak, K.; Honjo, K.; Huidrom, R.; Jobst, A.; Jovanovic, N.; Ozturk, E.; et al. Infrastructure in Central, Eastern, and Southeastern Europe: Benchmarking, Macroeconomic Impact, and Policy Issues; IMF eLibrary: New Brunswick, NJ, USA, 2020. [Google Scholar]
  63. Global Impact Investing Network. The Impact Investing Market in the COVID-19 Context. An Overview. Response, Recovery, and Resilience Investment Coalition. 2020. Available online: https://thegiin.org/assets/The%20Impact%20Investing%20Market%20in%20the%20COVID19%20Context_An%20Overview.pdf (accessed on 20 January 2021).
  64. Longin, F.; Solnik, B. Is the Correlation in International Equity Returns Constant: 1960–1990? J. Int. Money Financ. 1995, 14, 3–26. [Google Scholar] [CrossRef]
  65. Longin, F.; Solnik, B. Correlation Structure of International Equity Markets During Extremely Volatile Periods. J. Financ. 2001, 56, 649–676. [Google Scholar] [CrossRef]
  66. Erb, C.; Campbell, H.; Viskanta, T. Forecasting International Equity Correlations. Financ. Anal. J. 1994, 50, 32–45. [Google Scholar] [CrossRef]
  67. De Santis, G.; Gerard, B. International Asset Pricing and Portfolio Diversification with Time-Varying Risk. J. Financ. 1997, 52, 1881–1912. [Google Scholar] [CrossRef]
  68. Davidson, W.N.; Chandy, P.R.; Cross, M. Large losses, risk management and stock returns in the airline industry. J. Risk Insur. 1987, 54, 162–172. [Google Scholar] [CrossRef]
  69. Bradford, B.M.; Robinson, H.D. Abnormal returns, risk, and financial statement data: The case of the Iraqi invasion of Kuwait. J. Econ. Bus. 1997, 49, 193–204. [Google Scholar] [CrossRef] [Green Version]
  70. Pantzalis, C.; Stangeland, D.A.; Turtle, H.J. Political elections and the resolution of uncertainty: The international evidence. J. Bank. Financ. 2000, 24, 1575–1604. [Google Scholar] [CrossRef]
  71. Ramchander, S.; Schwebach, R.G.; Staking, K. The informational relevance of corporate social responsibility: Evidence from DS400 index reconstitutions. Strateg. Manag. 2012, 33, 303–314. [Google Scholar] [CrossRef]
  72. Škrinjarić, T.; Orlović, Z. Effects of economic and political events on stock returns: Event study of Agrokor case in Croatia. Croat. Econ. Surv. 2019, 21, 47–86. [Google Scholar] [CrossRef]
  73. Brown, S.; Warner, J. Measuring security price performance. J. Financ. Econ. 1980, 8, 205–258. [Google Scholar] [CrossRef]
  74. Brown, S.; Warner, J. Using daily stock returns: The case of event studies. J. Financ. Econ. 1985, 14, 3–31. [Google Scholar] [CrossRef]
  75. MacKinlay, C. Event Studies in Economics and Finance. J. Econ. Lit. 1997, 35, 13–39. [Google Scholar]
  76. Binder, J. The event study methodology since 1969. Rev. Quant. Financ. Account. 1998, 11, 111–137. [Google Scholar] [CrossRef]
  77. Topcu, M.; Gulal, O.S. The Impact of COVID-19 on emerging stock markets. Financ. Res. Lett. 2020, 36, 101691. [Google Scholar] [CrossRef]
  78. Czech, K.; Wielechowski, M.; Kotyza, P.; Benešova, I.; Laputkova, A. Shaking Stability: COVID-19 Impact on the Visegrad Group Countries’ Financial Markets. Sustainability 2020, 12, 6282. [Google Scholar] [CrossRef]
  79. White, H. A heteroskedasticity-Consistent Covariance Matrix Estimator and a Direct Test for Heteroskedasticity. Econometrica 1980, 48, 718–838. [Google Scholar] [CrossRef]
  80. Newey, W.; West, K. A Simple, Positive Semi-definite, Heteroskedasticity and Autocorrelation Consistent Covariance Matrix. Econometrica 1987, 55, 703–708. [Google Scholar] [CrossRef]
  81. Holler, J. Event-study methodology and statistical significance. 2014, Germany: O1WIR Publisher for Economics, Computer Science and Law.
  82. Armitage, S. Event Study Methods and Evidence on Their Performance. J. Econ. Surv. 1995, 9, 25–52. [Google Scholar] [CrossRef]
  83. Park, N. A guide to using event study methods in multi-country settings. Strateg. Manag. J. 2004, 25, 655–668. [Google Scholar] [CrossRef]
  84. Singh, B.; Dhall, R.; Narang, S.; Rawat, S. The Outbreak of COVID-19 and Stock Market Responses: An Event Study and Panel Data Analysis for G-20 Countries. Glob. Bus. Rev. 2020, 1–26. [Google Scholar] [CrossRef]
  85. Kothari, S.P.; Warner, J.B. Econometrics of event studies. In Handbook of Corporate Finance: Empirical Corporate Finance; Eckbo, B.E., Ed.; Elsevier: Amsterdam, The Netherlands, 2007; Volume 1, pp. 3–36. [Google Scholar]
  86. Sheskin, D.J. Handbook of Parametric and Nonparametric Statistical Procedures, 4th ed.; CRC Press: Boca Raton, FL, USA, 2004. [Google Scholar]
  87. Fama, E.; Fisher, L.; Jensen, M.; Roll, R. The adjustment of stock prices to new information. Int. Econ. Rev. 1969, 10, 1–21. [Google Scholar] [CrossRef]
  88. Benzid, L.; Chebbi, K. The Impact of COVID-19 on Exchange Rate Volatility: Evidence Through GARCH Model. SSRN, 28 May 2020. Available online: https://ssrn.com/abstract=3612141 (accessed on 28 May 2020).
  89. OECD. 2018. Available online: https://stats.oecd.org/glossary/detail.asp?ID=303 (accessed on 20 January 2021).
  90. OECD. 2018. Available online: https://www.oecd.org/south-east-europe/economies/ (accessed on 20 January 2021).
  91. Investing. 2021. Available online: https://www.investing.com (accessed on 20 January 2021).
  92. Eurostat. 2021. Available online: https://ec.europa.eu/eurostat/data/database (accessed on 20 January 2021).
  93. WHO. 2020. Available online: https://www.who.int/news/item/27-04-2020-who-timeline---covid-19 (accessed on 20 January 2021).
  94. WHO. 2020. Available online: https://www.who.int/emergencies/diseases/novel-coronavirus-2019/interactive-timeline#event-29 (accessed on 20 January 2021).
  95. Ru, H.; Yang, E.; Zou, K. What Do We Learn from SARS-CoV-1 to SARS-CoV-2: Evidence from Global Stock Markets; SSRN Working Paper; SSRN: Rochester, NY, USA, 2020. [Google Scholar]
  96. Capelle-Blancard, G.; Desroziers, A. The stock market is not the economy? Insights from the COVID-19 crisis. Covid Economics: Vetted and Real-Time Papers. CEPR Covid Econ. 2020, 28, 20–70. [Google Scholar]
  97. Škrinjarić, T. Stock market stability on selected CEE and SEE markets: A quantile regression approach. Post-Communist Econ. 2019, 32, 352–375. [Google Scholar] [CrossRef]
  98. Ferreira, P. What guides Central and Eastern European stock markets? A view from detrended methodologies. Post Communist Econ. 2018, 30, 805–819. [Google Scholar] [CrossRef]
  99. Égert, B.; Kočenda, E. Interdependence between Eastern and Western European stock markets: Evidence from intraday data. Econ. Syst. 2007, 31, 184–203. [Google Scholar] [CrossRef]
  100. Zouaoui, M.; Nouyrigat, G.; Beer, F. How Does Investor Sentiment Affect Stock Market Crises? Evidence from Panel Data. Financ. Rev. 2011, 46, 723–747. [Google Scholar] [CrossRef] [Green Version]
  101. Pochea, M.-M.; Filip, A.-M.; Pece, A.-M. Herding Behavior in CEE Stock Markets Under Asymmetric Conditions: A Quantile Regression Analysis. J. Behav. Financ. 2017, 18, 400–416. [Google Scholar] [CrossRef]
  102. Hofstede, G. Culture’s Consequences: Comparing Values, Behaviors, Institutions, and Organizations Across Nations; Sage Publication: Beverly Hills, CA, USA, 2001. [Google Scholar]
  103. Johnston, R.B.; Nedelescu, O.M. The impact of terrorism on financial markets. J. Financ. Crime 2006, 13, 7–25. [Google Scholar] [CrossRef]
  104. Ding, W.; Levine, R.; Lin, C.; Xie, W. Corporate Immunity to the COVID-19 Pandemic; NBER Working Paper No. 27055; National Bureau of Economic Research: Cambridge, MA, USA, 2020. [Google Scholar] [CrossRef]
  105. Fahlenbrach, R.; Rageth, K.; Stulz, R.M. How Valuable is Financial Flexibility when Revenue Stops? Evidence from the COVID-19 Crisis; NBER Working Papers 27106; National Bureau of Economic Research: Cambridge, MA, USA, 2020. [Google Scholar]
  106. Landier, A.; Thesmar, D. Earnings Expectations in the COVID Crisis; NBER Working Paper No. 27160; National Bureau of Economic Research: Cambridge, MA, USA, 2020. [Google Scholar]
  107. Geert, B.; Campbell, H.; Ng, A. Market integration and contagion. J. Bus. 2005, 78, 39–70. [Google Scholar]
  108. King, M.A.; Wadhwani, S. Transmission of volatility between stock markets. Rev. Financ. Stud. 1990, 3, 5–33. [Google Scholar] [CrossRef]
  109. Hon, M.T.; Strauss, J.; Yong, S.-K. Contagion in financial markets after September 11: Myth or reality? J. Financ. Res. 2004, 27, 95–114. [Google Scholar] [CrossRef]
  110. Park, C.-Y.; Kwanho, S. Contagion through National and Regional Exposures to Foreign Banks during the Global Financial Crisis. J. Financ. Stab. 2020, 46, 100721. [Google Scholar] [CrossRef]
  111. Bashir, U.; Yu, Y.; Hussain, M.; Zebende, G. Do foreign exchange and equity markets co-move in Latin American region? Detrended cross-correlation approach. Physica A 2016, 462, 889–897. [Google Scholar] [CrossRef] [Green Version]
  112. Huthaifa, A.; Canepa, A. Evidence of Stock Market Contagion during the COVID-19 Pandemic: A Wavelet-Copula-GARCH Approach. J. Risk Financ. Manag. 2021, 14, 329. [Google Scholar] [CrossRef]
  113. Vidyamurthy, G. Pairs Trading: Quantitative Methods and Analysis; John Wiley & Sons: Hoboken, NJ, USA, 2004. [Google Scholar]
  114. Elliott, R.J.; van der Hoek, J.; Malcolm, W.P. Pairs trading. Quant. Financ. 2005, 5, 271–276. [Google Scholar] [CrossRef]
  115. Liu, B.; Chang, L.-B.; Geman, H. Intraday pairs trading strategies on high frequency data: The case of oil companies. Quant. Financ. 2017, 17, 87–100. [Google Scholar] [CrossRef] [Green Version]
Figure 1. Normalized values of indices, peak day and one month later. Note: Peak day value normalized such that value of index is equal to 1, days of decline after the peak day, 30 days. Peak day is defined as the highest value of the stock market index, after which the decline of the value continued for more than two weeks.
Mathematics 09 02077 g001
Figure 2. CARs for all countries, event 3.
Mathematics 09 02077 g002
Figure 3. CARs for all countries, event 4.
Mathematics 09 02077 g003
Figure 4. CARs for all countries, event 5.
Mathematics 09 02077 g004
Figure 5. Values of simulated portfolios.
Mathematics 09 02077 g005
Table 1. Description of the data and sources.
CountryAbbreviation
Bosnia and HerzegovinaBirs
BulgariaSofix
CroatiaCrobex
CzechiaPx
HungaryBudapest
PolandWig
RomaniaBet
SerbiaBelex
SlovakiaSax
SloveniaSbi
UkrainePfts
Sources: [91,92].
Table 2. Main event dates to be tested.
Country/DatesEvent 1Event 2Event 3Event 4Event 5
Bosnia and Herzegovina30 January11 February5 March11 March24 March
Bulgaria8 March13 March
Croatia25 February18 March
Czechia1 March16 March
Hungary4 March28 March
Poland4 March13 March
Romania26 February25 March
Serbia6 March15 March
Slovakia6 March13 March
Slovenia5 March12 March
Ukraine3 March17 March
Source: [93,94]. Note: all dates are in 2020.
Table 3. Event study test, event 1.
DayTheta 1p-vTheta 2p-vSignp-vSign (Normal Approx)p-vWilcoxonp-v
−10−0.4000.344−0.3020.382100.006 ***2.4120.008 ***2.3560.009 ***
−9−0.2660.3950.3020.61860.5≈00.51.0220.158
−8−0.2510.401−0.3020.38260.5≈00.50.0440.484
−7−0.5500.291−1.5080.066 *60.5≈00.5−0.0440.484
−60.0570.5231.5080.93480.1131.2060.1142.0000.027 **
−5−0.0950.462−1.5080.066 *80.1131.2060.1141.9120.028 *
−4−0.0020.4990.9050.81780.1131.2060.1140.9330.087 *
−3−0.5990.275−2.1110.017 **70.2780.6030.5470.7560.225
−2−0.4790.316−0.3020.38290.065 *1.8090.070 *2.4450.015 **
−1−0.9160.180−1.5080.066 *60.5≈00.50.0440.484
0−0.9290.1760.3020.61880.2271.2060.2282.0890.037 **
1−0.8690.1920.3020.61860.5≈00.50.0440.015 **
2−1.0760.1410.3020.61860.5≈00.50.0440.484
3−0.8490.1981.5080.93460.5≈00.50.0490.362
4−0.9270.1770.9050.81780.1131.2060.1142.0890.018 **
5−0.4150.3391.5080.93470.2780.6030.2781.2890.098 *
6−0.3290.371−0.3020.38280.1131.2060.1141.4670.071 *
7−0.3970.346−1.5080.066 *60.5≈00.50.1330.447
8−0.5810.281−0.3020.38280.1131.2060.1141.0220.258
9−0.7720.220−0.3020.38260.5≈00.50.4000.344
10−0.5410.2940.9050.81760.5≈00.5−0.0440.484
Note: *, **, and *** denote significance on 10%, 5%, and 1%.
Table 4. Event study test, event 2.
DayTheta 1p-vTheta 2p-vSignp-vSign (Normal Approx)p-vWilcoxonp-v
−10−0.0480.481−0.3020.38260.5≈00.50.0440.482
−9−0.3250.373−1.5080.06680.1131.2060.1142.0890.037 **
−8−0.3720.3550.3020.61860.5≈00.50.0440.482
−7−0.3490.3630.3020.61860.5≈00.50.0440.482
−6−0.5110.3050.3020.61860.5≈00.50.0490.362
−5−0.2630.3961.5080.93460.5≈00.50.0490.362
−4−0.1300.4480.9050.81780.1131.2060.1142.0890.037 **
−30.1030.5411.5080.93470.2740.6030.2741.2890.098 *
−20.1350.554−0.3020.38280.1131.2060.1141.4670.071 *
−10.1570.562−1.5080.066 *60.5≈00.50.1330.223
00.1890.575−0.3020.38280.1131.2060.1141.0220.153
10.3050.620−0.3020.38260.5≈00.50.4000.344
20.2420.5960.9050.81760.5≈00.5−0.0440.482
30.2590.6020.9050.81770.2740.6030.2740.2220.412
40.4890.6880.9050.81770.2740.6030.2740.3110.378
50.0940.5380.3020.61870.2740.6030.2741.0220.152
60.3050.6200.9050.81760.5≈00.50.4000.344
70.0180.507−2.1110.017 **90.037 **1.8090.035 **2.0000.045 **
8−0.1350.446−0.9050.18370.2740.6030.2741.0220.079 *
9−0.9420.173−2.1110.017 **90.037 **1.8090.035 **2.3560.009 **
10−0.9580.169−1.5080.066 *80.1131.2060.1141.8230.034 **
Note: * and ** denote significance on 10% and 5%.
Table 5. Event study test, event 3.
DayTheta 1p-vTheta 2p-vSignp-vSign (Normal Approx)p-vWilcoxonp-v
−10−0.0560.4780.3020.61860.5≈00.50.4000.344
−9−0.1110.456−0.9050.18370.2740.6030.2740.5770.281
−8−0.2400.405−0.3020.38260.5≈00.50.2220.412
−7−0.3510.363−0.3020.38260.5≈00.50.1330.412
−6−0.5470.292−0.3020.38260.5≈00.50.7560.275
−5−0.9220.178−0.9050.18370.2740.6030.2741.8230.034 **
−4−1.2210.111−2.1110.017 **90.037 **1.8090.035 **1.7340.041 **
−3−1.5200.064 *−2.7140.003 ***100.006 ***2.4120.008 ***2.3560.009 ***
−2−1.5840.057 *−1.5080.066 *80.1131.2060.1141.2890.098 *
−1−1.1530.1240.3020.61860.5≈00.50.0440.482
0−1.0950.137−1.5080.066 *80.1131.2060.1141.5460.050 *
1−1.2800.100−0.9050.18370.2740.6030.2740.5790.281
2−1.8790.030 **−1.5080.066 *80.1131.2060.1141.9120.028 **
3−1.5850.057 *−1.5080.066 *80.1131.2060.1141.3780.084 *
4−1.8740.030 **−1.5080.066 *80.1131.2060.1141.8230.034 **
5−2.4510.007 ***−0.9050.18370.2740.6030.2742.0000.027 **
6−2.3210.010 **−1.5080.066 *80.1131.2060.1141.9120.028 **
7−2.3470.009 ***−2.1110.017 **90.037 **1.8090.035 **1.9120.028 **
8−2.7730.003 ***−1.5080.066 *80.1131.2060.1141.3780.084 *
9−2.9500.002 ***−0.9050.18370.2740.6030.2741.3780.084 *
10−3.7870.000 ***−1.5080.066 *80.1131.2060.1141.5560.060 *
Note: *, **, and *** denote significance on 10%, 5%, and 1%.
Table 6. Event study test, event 4.
DayTheta 1p-vTheta 2p-vSignp-vSign (Normal Approx)p-vWilcoxonp-v
−101.0550.8542.7140.99770.2740.6030.2740.3110.378
−90.0250.510−0.9050.18370.2740.6030.2741.8230.034 *
−8−0.4610.322−0.9050.18390.037 **1.8090.035 **2.5340.005 ***
−7−0.9080.182−2.1110.017 **60.5≈00.50.9340.174
−6−0.7360.2310.3020.61870.2740.6030.2741.3780.084 *
−5−0.4560.3240.9050.81780.006 ***1.2060.1141.0220.153
−4−0.6940.244−1.5080.066 *70.2740.6030.2741.7340.041 **
−3−1.3910.082 *−0.9050.183100.006 ***2.4120.016 **2.7120.004 ***
−2−1.7900.037 **−2.7140.003 ***100.006 ***2.4120.016 **2.8010.002 ***
−1−1.8790.030 **−2.7140.003 ***60.5≈00.50.4000.344
0−1.6810.046 **−0.3020.38280.006 ***1.2060.1142.3560.009 ***
1−3.0690.001 ***−1.5080.066 *100.006 ***2.4120.016 **2.8000.002 ***
2−2.7040.003 ***−2.7140.003 ***60.5≈00.50.4000.344
3−2.3410.010 ***0.3020.618100.006 ***2.4120.016 **2.6230.004 ***
4−3.3990.000 ***−2.7140.003 ***60.5≈00.50.3110.378
5−3.1240.001 ***−0.3020.382110.000 ***3.0150.001 ***2.8900.001 ***
6−4.2180.000 ***−3.3170.000 ***70.2740.6030.2740.7560.275
7−5.2180.000 ***−0.9050.18370.2740.6030.2741.5560.006 *
8−5.3260.000 ***0.9050.817100.006 ***2.4120.016 **2.8010.002 ***
9−7.1240.000 ***−2.7140.003 ***80.006 ***1.2060.1142.1780.019 **
10−5.1630.000 ***1.5080.93490.037 **1.8090.035 **2.1780.019 **
Note: *, **, and *** denote significance on 10%, 5%, and 1%.
Table 7. Event study test, event 5.
DayTheta 1p-vTheta 2p-vSignp-vSign (Normal Approx)p-vWilcoxonp-v
−10−0.0680.473−0.3020.38260.5≈00.50.0440.487
−9−0.2370.406−0.9050.18370.2790.6030.2731.1110.183
−8−0.4470.327−2.1110.017 **90.037 **1.8090.035 **1.8230.034 **
−7−0.9000.184−2.1110.017 **90.037 **1.8090.035 **2.3560.009 ***
−6−0.7850.2160.3020.61860.5≈00.50.2220.824
−5−1.2610.104−2.1110.017 **90.037 **1.8090.035 **1.7340.045 **
−4−1.3140.094 *−2.1110.017 **90.037 **1.8090.035 **2.1780.015 **
−3−1.1410.127−0.9050.18370.2790.6030.2730.4000.344
−2−1.6110.054 *−0.9050.18370.2790.6030.2731.7340.046 **
−1−1.5940.055 *−0.9050.18370.2790.6030.2731.2000.165
0−1.7950.036 **−1.5080.066 *80.1131.2060.1131.6450.050 *
1−3.0740.001 ***−2.1110.017 **90.037 **1.8090.035 **2.1780.015 **
2−3.2370.001 ***−0.9050.18370.2790.6030.2730.8450.199
3−3.4860.000 ***−1.5080.066 *80.1131.2060.1131.2000.115
4−4.3010.000 ***1.5080.93480.1131.2060.1130.7560.224
5−4.3920.000 ***−0.3020.38260.5≈00.50.4000.344
6−4.0070.000 ***0.3020.61860.5≈00.50.2220.824
7−3.6430.000 ***−0.3020.38260.5≈00.50.3110.472
8−5.5190.000 ***0.9050.81770.2790.6030.2731.3780.084 *
9−5.4270.000 ***0.9050.81770.2790.6030.2731.4670.071 *
10−5.4040.000 ***−1.5080.066 *80.1131.2060.1130.8450.199
Note: *, **, and *** denote significance on 10%, 5%, and 1%.
Table 8. Significance of binary variable “COVID-19”.
Index3 January 2019–1 July 20203 January 2019–1 April 2020
Mean EquationVariance EquationMean EquationVariance Equation
Belex−0.001 ** −0.003 *
Bet 3.03 × 10⁻⁵ *−0.009 *0.0002 *
Birs −0.0004 ***
Budapest 0.0001 *−0.012 *
Crobex 6.02 × 10⁻⁵ ** 0.0003 *
Pfts
Px 8.07 × 10⁻⁵ *−0.014 ***
Sax
Sbi 8.07 × 10⁻⁵ **
Sofix
Wig 0.0004 **−0.003 *0.001 *
Note: Empty spaces denote no significance; *, **, and *** denote significance on 10%, 5%, and 1%.
Publisher’s Note: MDPI stays neutral with regard to jurisdictional claims in published maps and institutional affiliations.

