Article

A Hybrid Approach of VIKOR and Bi-Objective Decision Model for Emergency Shelter Location–Allocation to Respond to Earthquakes

School of Economics and Management, Beijing Jiaotong University, Beijing 100044, China
*
Author to whom correspondence should be addressed.
Mathematics 2021, 9(16), 1897; https://doi.org/10.3390/math9161897
Submission received: 21 June 2021 / Revised: 28 July 2021 / Accepted: 6 August 2021 / Published: 9 August 2021
(This article belongs to the Special Issue Recent Applications of Mixed-Integer Linear Programming)

Abstract

:
Earthquakes have catastrophic effects on the affected population, especially in undeveloped countries or regions. Minimizing the impact and consequences of earthquakes involves many decisions and disaster relief operations that should be optimized. A critical disaster management problem is to construct shelters with reasonable capacity in the right locations, allocate evacuees, and provide relief materials to them within a reasonable period. This study proposes a bi-objective hierarchical model with two stages, namely, the temporary shelter stage and the short-term shelter stage. The proposed objectives at different stages are to minimize the evacuation time, maximize the suitability based on qualitative factors, and minimize the number of sites while considering the demand, capacity, utilization, and budget constraints. The performance evaluation of the emergency shelter was carried out by fuzzy-VIKOR, and the most ideal location of the shelter was determined through multiple standards. Emergency management organizations can benefit from the collective expertise of multiple decision-makers because the proposed method uses their knowledge to automate the location and allocation process of shelters. In the case of Chengdu, Sichuan Province, China, the results of using this hybrid approach provide the government with a range of options. This method can realize the trade-off between efficiency and cost in the emergency shelter location and material distribution, and realize reliable solutions in disaster emergencies.

1. Introduction

From 1998 to 2017, all disasters worldwide were estimated to have caused 1.3 million deaths and 4.4 billion injuries [1]. The economic losses totaled USD 2.9 trillion, which was an increase of 2.2 times over the previous 20 years. These facts confirm that although science, technology, and management have advanced, in some cases, they have not been able to significantly decrease the number and impacts of disasters. Earthquake emergency shelters are safe places with service facilities, which can be used for the evacuation and living of residents [2]. Hence, constructing emergency shelters with reasonable locations is essential to provide safe places with sufficient supplies for evacuees with different demands at different stages of an earthquake.
The role of shelters is fundamental to two types of affected populations: those who cannot be directed to other safe places, and those with special requirements such as life, medical, and psychological treatment [3]. After an earthquake occurs, the environment is complex and changeable, and the evacuation of life is the disaster management operation that takes the longest time and involves the most links across the entire process. The shelter location–allocation process should not only consider the horizontal and diverse demands of evacuees, provide minimum living and medical security, but also that the medical conditions and environment of the shelter should be gradually improved over time to meet the vertical upgrade demands. Disaster rescue is initiated in a dynamic environment involving a high degree of uncertainty and risk due to the accumulation of many factors. In an unconventional environment, humanitarian aid organizations must deal with multiple conflicting goals based on unavailable and incomplete information. One of the major goals of disaster response activities is to ensure that the affected population is allocated to a safe area and has easy access to basic rescue services. Moreover, the quality of disaster response activities depends to a large extent on the degree of safety and convenience provided to the evacuees. The location of facilities and the distribution of people and materials have been extensively and individually studied in the general logistics context [4,5], but rarely analyzed in the context of disaster management. In the present research work, we combine the horizontal diversification and vertical time-varying demands of evacuees in emergency shelter location–allocation decisions and consider both the quantitative and qualitative factors. A hybrid method based on fuzzy-VIKOR and bi-objective programming model is proposed to solve the problems of emergency shelter location, evacuation and transfer of victims, and material distribution to improve the efficiency of post-disaster rescue projects. This method can realize a trade-off between the operating efficiency and cost of the emergency shelter system.
The rest of this manuscript is structured as follows. Section 2 provides a literature review on the research issue. Section 3 explains the adopted methodologies while Section 4 presents the problem for study along with the proposed mathematical model. Section 5 provides details on the description of the zone to which the models were applied. The efficiency of the model in a case study and the results are further discussed in Section 6. The last section provides the concluding remarks and future research suggestions.

2. Literature Review

Shelters are important facilities for the allocation of victims after earthquakes. The location of shelters is related to the efficiency of disaster relief and the level of living conditions. Many scholars have conducted a lot of research in this area. Shelter location belongs to the category of emergency facility location. Toregas et al. proposed the location of emergency facilities and simplified it to cover each demand node with one facility [6,7]. Most articles reflect the efficiency and response quality of emergency rescue systems through distance, time, or cost, and determine the quality, quantity, and service scope of the facilities. The P-median model minimizes the sum of the product of the distance between demand points and selected P facilities and the demand [8]. The P-center model minimizes the maximum distance from any demand point to the closest facility to the demand points [9]. For some residents whose demands are known, the collective coverage model covers all demand points by determining the minimum number of service facilities. Not only is the fairness and service capacity of rescue services met, but they can also be used for managers to make decisions that meet the actual demands based on existing resources [10]. The goal of this paper was to design an effective response strategy for earthquakes and minimize the casualties of large-scale earthquakes. The collective coverage model can be used to study the problem of emergency shelter location. One of the key assumptions of the collective coverage model is that if the distance between the demand point and the facility is not greater than r, the demand point is assumed to be completely covered, otherwise, the demand point is not covered [11]. However, in non-routine projects, it is difficult to accurately predict the integrity of the shelter and whether the victims are willing to go to the recommended shelter. The more realistic assumption is that the farther the shelter is from the residential area, the less demand it can meet. Therefore, this paper adopted the idea of multiple coverage levels proposed by Berman et al. [12,13]. A coverage attenuation function is proposed to determine the number and location of shelters so that each demand point has multiple coverage level sets and corresponding coverage radiuses.
Emergency shelters should consider the demands of the affected population and carry out the rapid allocation of victims by the principle of matching resource supply and demand to ensure the lives and safety of the evacuees. Some scholars have focused on the optimization of emergency facilities at different levels from the perspective of resource supply. They realized that a single-level emergency center has the shortcomings of insufficient rescue capabilities, and they need to consider constructing double-level emergency shelters [14]. Ozkapici et al. further distinguished the functions of emergency facilities, which are conducive to the rapid distribution of materials from different countries or international rescue agencies after a disaster [15]. However, these studies did not consider the impact of changes in the demands on emergency services. Other scholars have studied the problem of shelter rescue from the perspective of demand. For example, Perez et al. emphasized that the diverse demands of the people should not be ignored after the disaster. In addition to basic living demands, the victims also need medical and psychological aid. Emergency shelters and medical centers are arranged according to different demands, but in the face of the upgrading demands over time, there is still no better solution for how to make further arrangements for the location of shelters. Therefore, some scholars have noted the evacuation and transfer of victims in immediate shelters, short-term shelters, and long-term shelters under the time-varying demands to realize the high-quality living of evacuees [16]. However, the diverse needs of the affected population at different times after the disaster have failed to attract attention. Hence, to comprehensively and systematically solve the evacuation of people after the disaster, we will deal with the needs of victims in vertical and horizontal stratification. It is necessary to consider the vertical and time-varying demands as well as the horizontal and diversified demands in various periods. In response to vertical time-varying demands, the multi-stage optimization of different objectives in two stages has been used to improve the quality of life. For the horizontal and diversified demands of evacuees at various times, shelters can be divided into two types. One type of shelter only provides basic living services, and the other type provides medical or psychological aid.
At present, many studies assume that the function of shelters is mainly to provide safe areas. The proposed models optimize the layout of shelters and the allocation of victims to improve the overall evacuation efficiency [17,18]. After the resettlement of victims, the supply of materials is less considered. Evacuation strategies should consider comprehensive problems such as the stratification type, use time, and material distribution due to the uncertainty of demand points, which are unbalanced spatial layouts. Existing research has focused on the location of shelters and emergency resource management [19,20]. Shelters can store supplies on their premises or in supermarkets and health care units around shelters to ensure the supply of emergency materials in the short-term and meet the minimum survival demands of the affected population [21,22]. However, these studies have paid more attention to the allocation of resources for supply–demand but have ignored the horizontal and vertical stratification on the demand side, which makes it difficult to effectively match the supply and demand. Thomas and Kopczak proposed, from the perspective of humanitarian logistics, to plan, implement, and control the flow and storage of resources from the supply point to the demand point to alleviate the suffering of vulnerable groups [23]. Sheu et al. optimized the shelter network, medical network, and material distribution network by the time sequence, and proposed the importance of integrating the three sub-networks of disaster management, indicating that the selected shelters should fully consider the demands of victims, medical care, and supply distribution [24]. Some scholars have also considered the medical supply distribution center and the location of patients after the disaster and the severity of patients under limited budget to determine the temporary medical shelter location [18]. It reveals the relationship between the selected shelter site, the demands of the patients, and the distribution of supplies, and further explains the impact of demand and distribution on the shelter location.
Decision-making in emergency shelter location–allocation is a complex task, and there are conflicting trade-offs between different criteria (see Section 3.1.1 for details). The variability of perceptions of different stakeholders between relief organizations often vary, and the existence of differences in disaster scales is normal [25]. Tools and techniques that can deal with such complex issues and make decisions are needed. Multi-criteria decision-making (MCDM) is a method to help the individual or group of decision-makers to make appropriate and transparent decisions in complex situations. It has been widely used in the fields of social sciences, engineering, health care, and management [26,27,28]. There are many MCDM methods in the literature such as ELECTRE [29], PROMETHEE [30], TOPSIS [31], AHP [32], COMET [33], and VIKOR [34]. MCDM methods can be divided into two steps. In the first step, information related to the value and weight of the criteria needs to be obtained, and then in the second step, the ranking of the alternative is determined. Some studies have illustrated the application of the MCDM method in emergency rescue assessment and intervention strategies. Haldar et al. proposed a quantitative method for strategic supplier selection in a fuzzy environment after the disaster. It ranks suppliers based on the fuzzy decision-making technology of the ideal solution similarity ranking and the fuzzy comprehensive weight to reduce the fragility of the supply chain system [35]. Trivedi and Singh applied the fuzzy logic-based AHP method for evaluating emergency facilities in a disaster recovery program in the Gorkha district in Nepal [36]. Malekpoor et al. implemented the VIKOR method to conduct a performance evaluation of technologies such as fuel generators, wind turbines, and solar panels in disaster relief camps to prioritize the generation systems that performed favorably. An application of the fuzzy-VIKOR method for the tailored disaster relief blood supply chain was also presented [37]. In addition, studies have used ELECTRE and TOPSIS to solve the problems of floor disaster risk, or to rank the regional disaster risk [38].
As above-mentioned, there are many MCDM approaches to solving decision-making problems. Different types of MCDM methods have been adopted for different types of decision-making problems. The task of choosing the right method is difficult. There are several ways to choose a particular MCDM approach and may be based on the input required information such as data and the parameters of the method [39,40]. For our question, we wanted a complete ranking and evaluation score of the criteria and candidate shelters. Methods such as ELECTRE, PROMETHEE, AHP, TOPSIS, COMET, and VIKOR are used to obtain such outcomes. In the calculation process of AHP and COMET, experts are required to make corresponding scores for the comparison between component factors or characteristic targets. When the target has a relatively large number of influencing factors, experts need to judge the importance of a large number of two factors, which may cause difficulty in judging the importance of the two factors. Additionally, COPRAS is a step-by-step ranking and estimation based on the importance and utility of decision attributes. It is usually applied to the ranking and selection of decision-making schemes with multiple criteria and their relative importance is known [41]. However, many factors influence the decision-making of emergency shelter location–allocation, and it is necessary to provide a trade-off between various standards, that is, to allow a compromise between various standards. Hence, AHP, COMET, and COPRAS approaches were not used in this article. Among the remaining four MCDM methods, ELECTRE and PROMETHEE are methods of the relational model. They start from the priority order between attributes, using higher levels than relationships or priority functions to prioritize, sort, or classify solutions, while TOPSIS and VIKOR belong to the functional model decision-making methods. In fact, after an earthquake, the environment is complex and changeable, and it is difficult for decision-makers to provide a preference order with sufficient reason. TOPSIS and VIKOR methods are more suitable for evaluating the performance of candidate shelters. However, the working principles of TOPSIS and VIKOR are slightly different. TOPSIS is based on aggregate functions that represent close to the ideal. In TOPSIS, the selected alternative should be the shortest distance from the ideal solution and the farthest from the negative ideal solution. The TOPSIS method introduces two reference points, but does not consider the relative importance of the distance to these points [42]. Opricovic proposed the VIKOR method for the shortcomings of TOPSIS [34,43]. The advantage of this method is that the distance between each solution and the ideal solution and the negative ideal solution can be considered at the same time, so that the selected best solution is the closest to the ideal solution and the farthest to the negative ideal solution. Hence, the VIKOR method can find the best solution better than the multi-criteria decision-making method, which only considers the ideal solution and was adopted in this study to evaluate the criteria and potential shelter locations. Moreover, MCDM uses different methods in the fuzzy environment to help make the best decision such as triangular fuzzy numbers [44,45], hesitant fuzzy numbers [46,47], and linguistic fuzzy sets [48]. The application of fuzzy set theory provides a suitable solution for multi-objective decision-making problems in uncertain environments. Disaster rescue decisions are made under limited and incomplete information. Fuzzy sets can easily describe the uncertainty that exists after a disaster. Therefore, it is of great significance to combine fuzzy sets with the VIKOR method to analyze and process inaccurate information.

3. Hybrid Approach of Fuzzy-VIKOR and Bi-Objective Programming Model

The methodology adopted in this study includes two stages. First, different decision-makers (residents, humanitarian relief organizations, etc.) take part in the decision-making process, with evaluation among the candidate shelters. Second, to resolve multiple conflicting goals while supporting decision-making on emergency shelter locations, evacuee allocation, and material distribution. Figure 1 shows the process of the proposed solution for the development of the location–allocation plan for emergency shelters.

3.1. Phase 1: Fuzzy-VIKOR for Determining Candidate Shelters

As a strategic decision-making problem, the location of emergency shelters plays a critical role in disaster relief. A series of decisions need to be made to choose the best-fit locations for establishing an emergency shelter. Since the present work involves multiple attributes and objectives with regard to shelter site selection, the best-fit locations were those selected from a set of potential alternatives after evaluating and ranking the conflicting attributes. MCDM can be used to solve these problems, and it can realize more sensible and better decisions by considering multiple attributes.

3.1.1. Criteria for Planning Emergency Shelters

In this study, candidate locations of emergency shelters must be extracted from several alternative locations evaluated according to different criteria when planning shelter location, and topography, geological type, and slope are important factors [49,50]. The flat terrain avoids secondary catastrophes such as the post-earthquake debris flow [49]. The emergency facility must be separated from the fault line, and the large slope should preferably lie between 2% and 4% [51]. Furthermore, in rainy areas, vegetation is of great significance for strengthening soil and reducing losses from the secondary disaster [3,52]. The presence of trees also protects affected people from hot weather [36]. Electricity is also a fundamental consideration to maintain daily life [53]. Consequently, the power supply is a fundamental prerequisite for maintaining daily life [51,54]. This paper summarizes five qualitative factors affecting the location of emergency services (see Table 1).

3.1.2. Fuzzy-VIKOR

Now, the question is how to determine the importance of these criteria. For this reason, there are two minimum weighting techniques in the literature. The first category refers to subjective techniques, which specify the importance of each criterion based on the subjective judgement of the decision-maker. The second category consists of objective techniques, which are suitable for situations where reliable subjective weights are unlikely to be obtained [56,57]. In this section, we utilize the fuzzy-VIKOR method. It considers ranking the closest alternative to our hypothetical ideal solution while trying to avoid alternatives that perform satisfactorily in all other criteria, but are exceptionally weak in one of the criteria. The latter is very important for selecting emergency shelters because preventing potential risks is an important feature of shelters. At present, the methods for determining the weight of indicators are mainly the subjective weighting method and the objective weighting method [57]. Subjective weighting is a method to determine attribute weights according to the degree of importance the decision-makers attach to an indicator subjectively. The objective weighting method does not rely on human subjective judgments and determines the weights based on the relationship between the original data. Due to the limited rationality of decision-makers and the complexity of indicators, the weights given by the decision makers’ subjective evaluations are difficult to match with the actual situation. To make up for the deficiencies of the subjective weighting method, this paper used the entropy method of objective weighting to weight the indicators. The entropy method is an objective weighting method for evaluating index weights, and its evaluation results are hardly affected by subjective factors. It can not only reflect the experience of experts, but also reflect the new changes in objective conditions, and make up for the shortcomings of purely adopting subjective empowerment methods or objective empowerment methods. In addition, in order to eliminate the rank inverse problem that may cause the unreliability of the evaluation process, this paper adopted the R-VIKOR method proposed by Yang and Wu [58]. This method deals with data from a global perspective rather than being limited to local data. It is assumed that the historical maximum value and historical minimum value of each attribute can be determined separately based on the statistical data and expert knowledge of the evaluation problem. The detailed steps of the improved fuzzy-VIKOR are explained below [43,59,60]:
Step 1: In this step, a decision-making group with expertise and experience is formed. Questionnaires are used to record and establish their individual preferences. Consider various alternatives as A 1 , A 2 , , A i and i is the number of candidate shelters. The linguistic terms for criteria and alternatives are introduced based on the judgement of decision-makers.
Step 2: The responses collected from k decision-makers are converted to their equivalent fuzzy numbers to construct a fuzzy comparison matrix using Equations (1) and (2). The trapezoidal fuzzy conversion scale adopted to convert linguistic judgements into fuzzy values is shown in Table 2.
f i j 1 = min k f i j k 1 f i j 2 = 1 k k K f i j k 2 f i j 3 = 1 k k K f i j k 3 f i j 4 = max k f i j k 4
w j 1 s = min k w j k 1 s w j 2 s = 1 k k K w j k 2 s w j 3 s = 1 k k K w j k 3 s w j 4 s = max k w i j 4 s
The above formulations, F i j k = ( f i j k 1 , f i j k 2 , f i j k 3 , f i j k 4 ) , indicates that the kth decision-maker judges the value of alternative i for the jth criterion and W j s = ( w j k 1 s , w j k 2 s , w j k 3 s , w j k 4 s ) represents the subjective weights. Additionally, |I|, |J|, and |K| represent the number of candidate shelters, the number of criteria, and the number of decision-makers.
Step 3: The fuzzy rating and subjective weights are converted into crisp numbers using Equation (3). Then, the values are normalized under each criterion by Equation (4).
c r i s p ( f i j ) = f i j 1 f i j 2 + f i j 3 f i j 4 + 1 3 ( f i j 4 f i j 3 ) 2 1 3 ( f i j 2 f i j 1 ) 2 f i j 1 f i j 2 + f i j 3 + f i j 4
P i j = f i j i I f i j , j
Step 4: The entropy and divergence measures are calculated through Equations (5) and (6) and the criteria objective weights are constructed using Equation (7).
e j = 1 ln ( I ) i I P i j ln ( P i j )
d i v j = 1 e j
w j o = d i v j j J d i v j
The entropy and divergence measures indicate the contrast intensity of the standard, and the larger the value, the more important the standard.
Step 5: Determine the historical maximum M a x i and historical minimum M i n i of each alternative, respectively. For any attribute value f i j , the condition M i n i f i j M a x i is always satisfied whether to delete, add, or replace alternatives in the evaluation process. The normalized decision matrix U is constructed based on Equation (8) and the final performance matrix M is obtained by Equation (9). Then, the ideal and minimum performance values are obtained.
u i j = ( M a x i f i j 1 M a x i M i n i , M a x i f i j 2 M a x i M i n i , M a x i f i j 3 M a x i M i n i , M a x i f i j 4 M a x i M i n i )   if   criterion   ( j )   belongs   to   cost   function u i j = ( f i j 1 M i n i M a x i M i n i , f i j 2 M i n i M a x i M i n i , f i j 3 M i n i M a x i M i n i , f i j 4 M i n i M a x i M i n i )   if   criterion   ( j )   belongs   to   benefit   function
m i j = ( u i j 1 u i j 2 ) ( w j 1 s w j 2 s ) + ( u i j 3 u i j 4 ) ( w j 3 s w j 4 s ) + 1 3 ( u i j 4 w j 4 s u i j 3 w j 3 s ) 2 1 3 ( u i j 2 w j 2 s u i j 1 w j 1 s ) 2 u i j 1 w j 1 s u i j 2 w j 2 s + u i j 3 w j 3 s + u i j 4 w j 4 s
Step 6: The values of group utility ( S i ), individual regret ( R i ), and fuzzy-VIKOR index ( Q i ) are calculated by Equations (10)–(12).
S i = j J w j o ( m i * m i j ) ( m i * m i )
R i = max j w j o ( m i * m i j ) ( m i * m i )
Q i = υ ( S i S * S S * ) + ( 1 υ ) ( R i R * R R * )
In which υ is the weight of the maximum group utility strategy, and 1 υ is the weight of individual regret. If υ > 0.5 , the ranking will represent the majority of individuals, and if υ < 0.5 , the ranking will be more affected by the worst individuals.
Step 7: The alternatives are ranked based on the values Q i . The smaller the value of Q, the better the ranking of i in the candidate set.
Step 8: In addition to having the minimum Q value, if the following conditions are met, A1 is recommended as a compromised solution.
Condition 1.
WhenA2is the second-ranked alternative, if Q ( A 2 ) Q ( A 1 ) 1 i 1 , then A1is placed in the first position, where i is the number of alternatives.
Condition 2.
Alternative A1must be best when ranked by R i or S i .

3.2. Phase 2: Bi-Objective Programming Model

In the literature, various multi-objective disaster relief planning models have been proposed and solved using special multi-objective solution techniques such as the weighted sum method [61,62,63], lexicographic or hierarchical order [64,65], ε-constraint [66,67], and goal programming [68]. The purpose of the bi-objective model is to obtain a set of efficient solutions instead of a single value. A lexicographic method was discarded because of the lack of hierarchical structure among the objectives (i.e., evacuation time, suitability, and the number of shelters to be open). Goal programming was also not used because the threshold may be biased by optimistic or pessimistic decision-makers.
To find the non-dominated optimal Pareto set of the problem, two scalarization approaches were selected: the weighted sum method and the ε-constraint method. The weighted sum method is a traditional Pareto set acquisition method. The weighted sum of functions combines n number of objective functions into a unique equation, as shown below:
G ( x ) = n N p n g n ( x )
where p n is the weighting factor and g n ( x ) is the n-th objective function. The weight p n is systematically changed to find the Pareto frontier. The ε-constraint method was also selected to solve the problem that the weighted sum method cannot obtain an efficient set when the boundary is non-convex [69]. The ε-constraint method has two advantages: first, the objective functions are not required to be normalized or prioritized, and second, the decision-maker can modify the solution by selecting the ε parameter. The expression of the ε-constraint method is as follows:
min g n ( x ) s . t . g m ( x ) ε m m = 1 , 2 , , m ; m n
Since the bi-objective programming model in this paper incorporates discrete events to optimize emergency shelters, the weight coefficient was set to 1 U 2 L 2 + 1 in the weighted ε-constraint method [70,71]. In the weight coefficient, U 2 and L 2 are the upper and lower limits of the second objective function g 2 ( x ) , respectively. Then, U 2 is reduced to the lower limit of g 2 ( x ) to generate the non-dominated Pareto, until the problem is unfeasible to stop. Therefore, the mathematical model of the weighted ε-constraint method is given as:
min g 1 ( x ) + 1 U 2 L 2 + 1 g 2 ( x ) s . t . g 2 ( x ) L 2

4. Problem Description

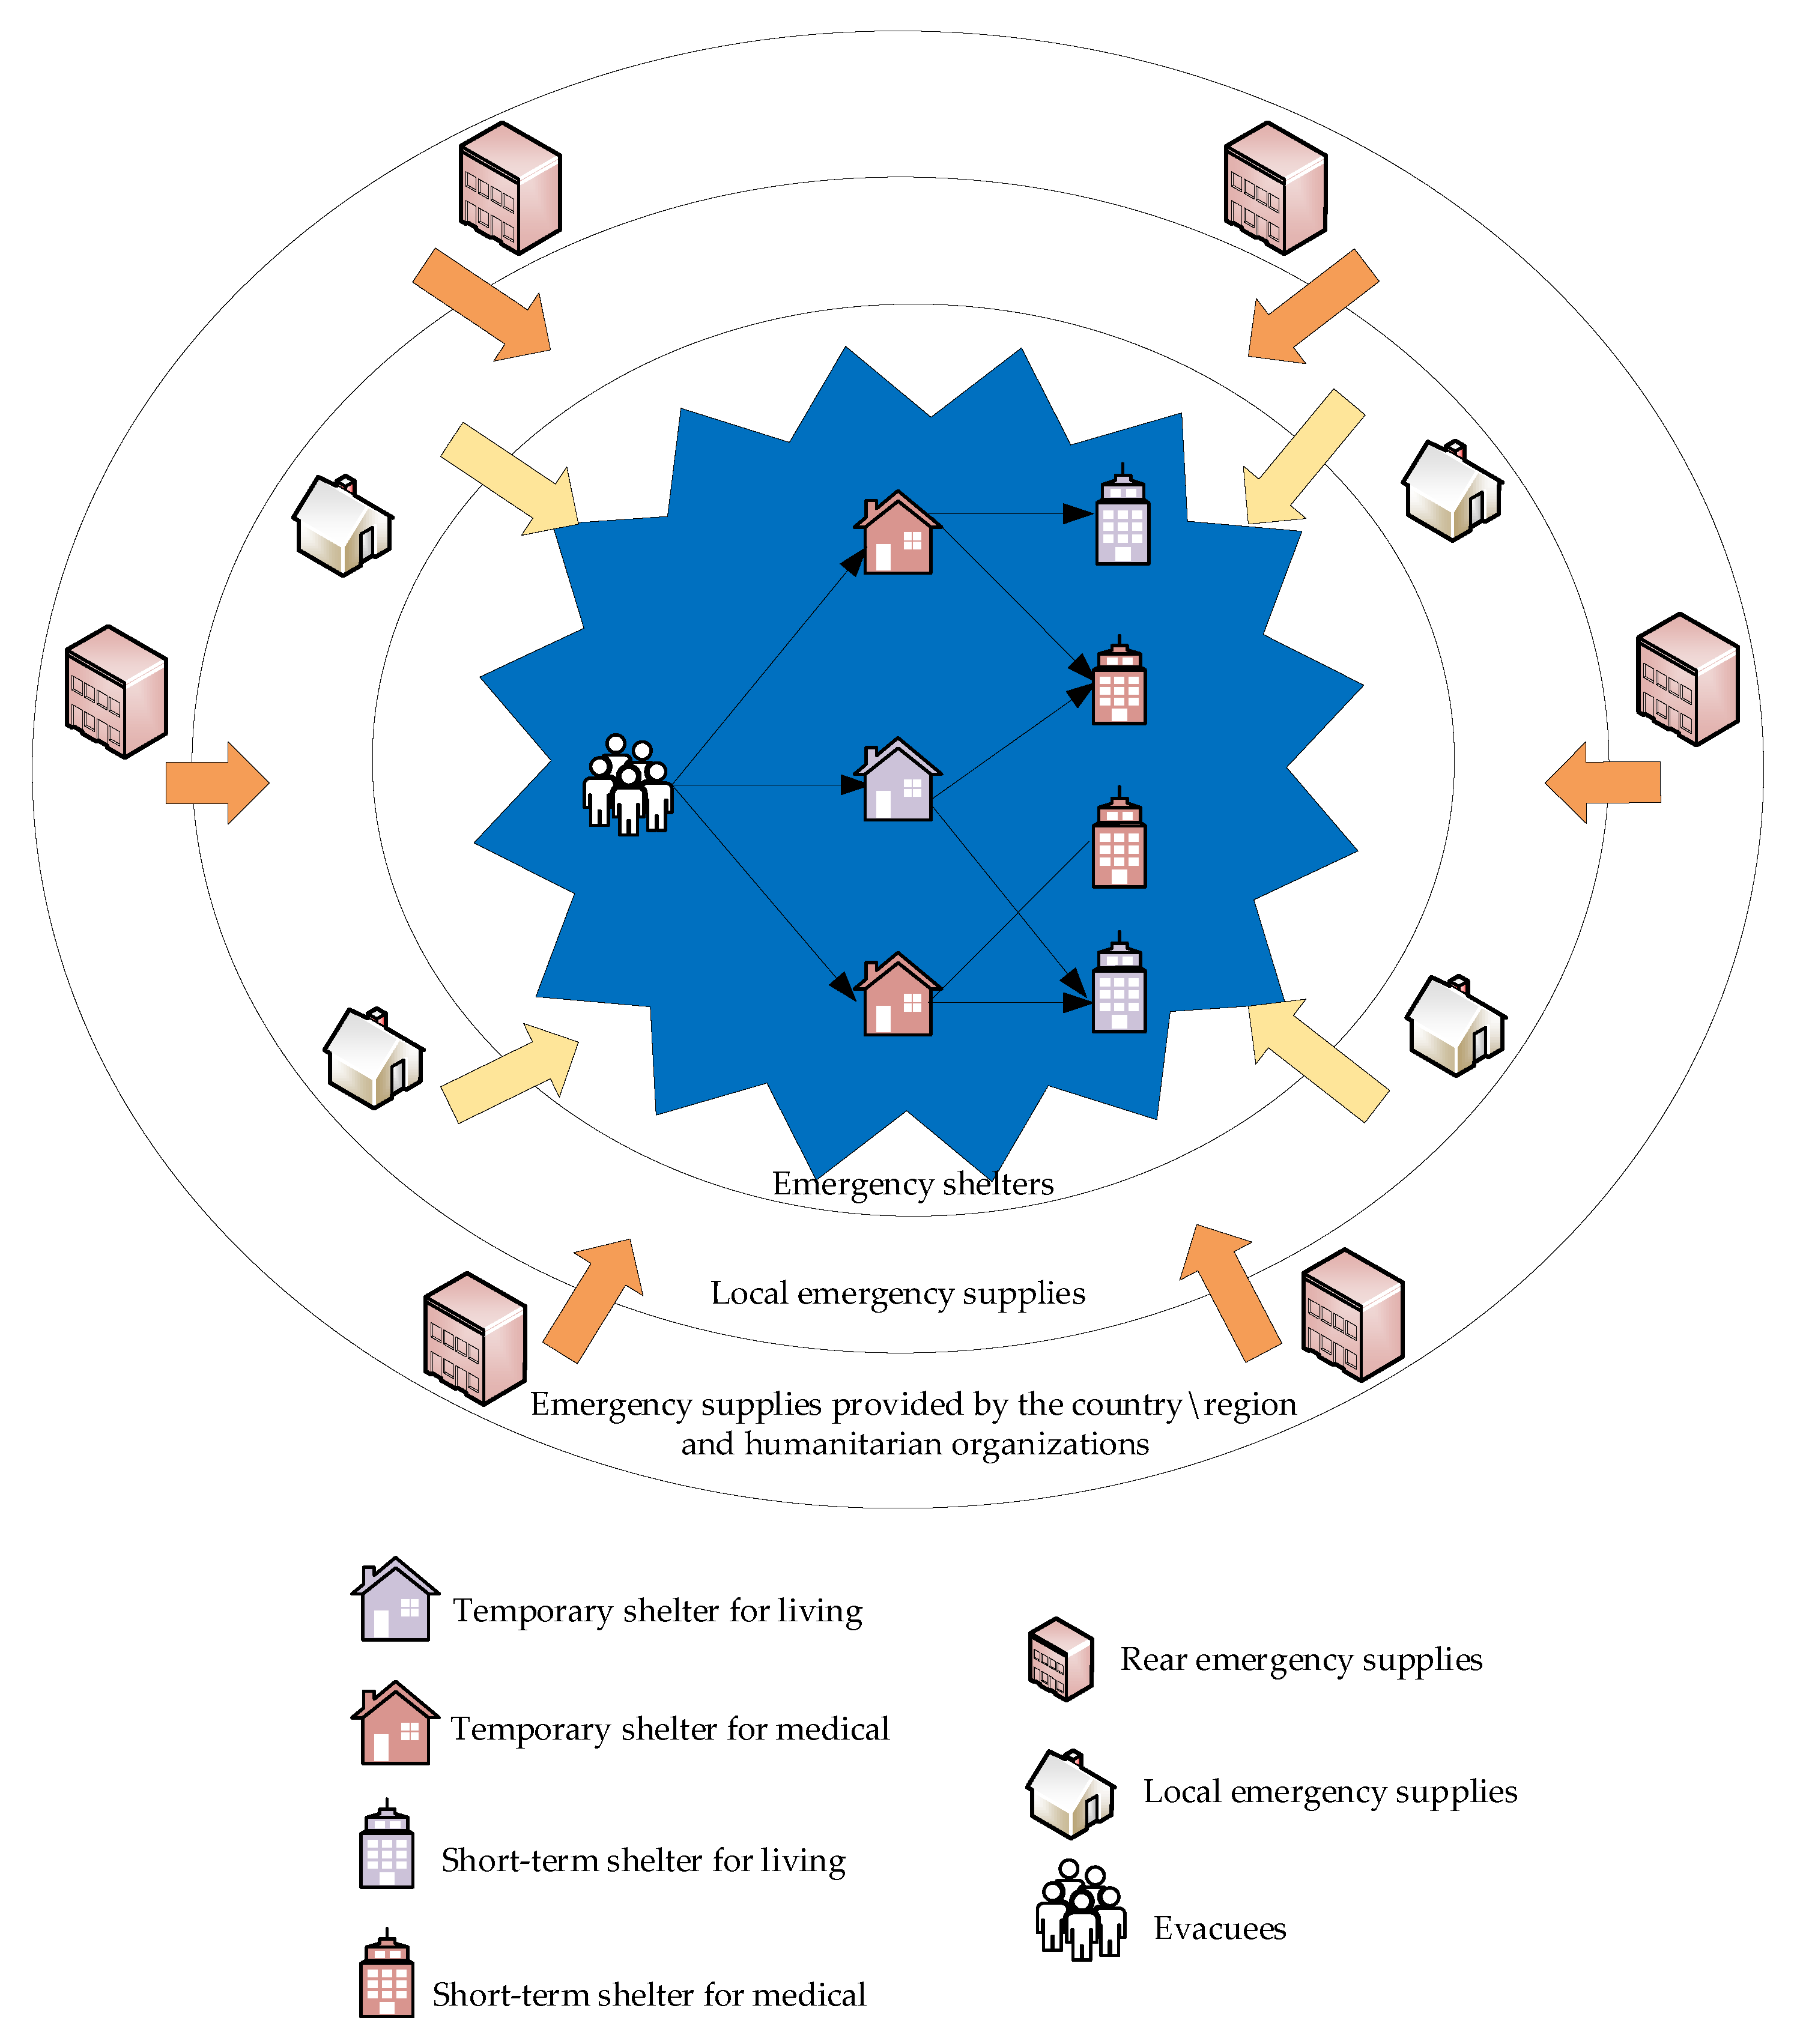
In the emergency shelter rescue network, shelters of various scales play different roles. Regardless of the length of time of the evacuation of life, an evacuation place that meets the daily and medical demands should be provided. Temporary shelters are the main resettlement locations after an earthquake to provide one-day emergency services. Afterward, the evacuation environment of short-term shelters gradually improves to provide better services. In addition to maintaining the basic living conditions of the evacuees, medical emergency shelters also play a role in the timely diagnosis and treatment of injuries. To quickly and accurately provide supplies to evacuees, the planning strategy of emergency shelters should be matched with the local materials distribution system. After the evacuation of life is stable, the supplies provided by the country/region or humanitarian organizations arrive in the affected area to eliminate the demand gap in the first stage. Figure 2 depicts a schematic review of the emergency shelter rescue.
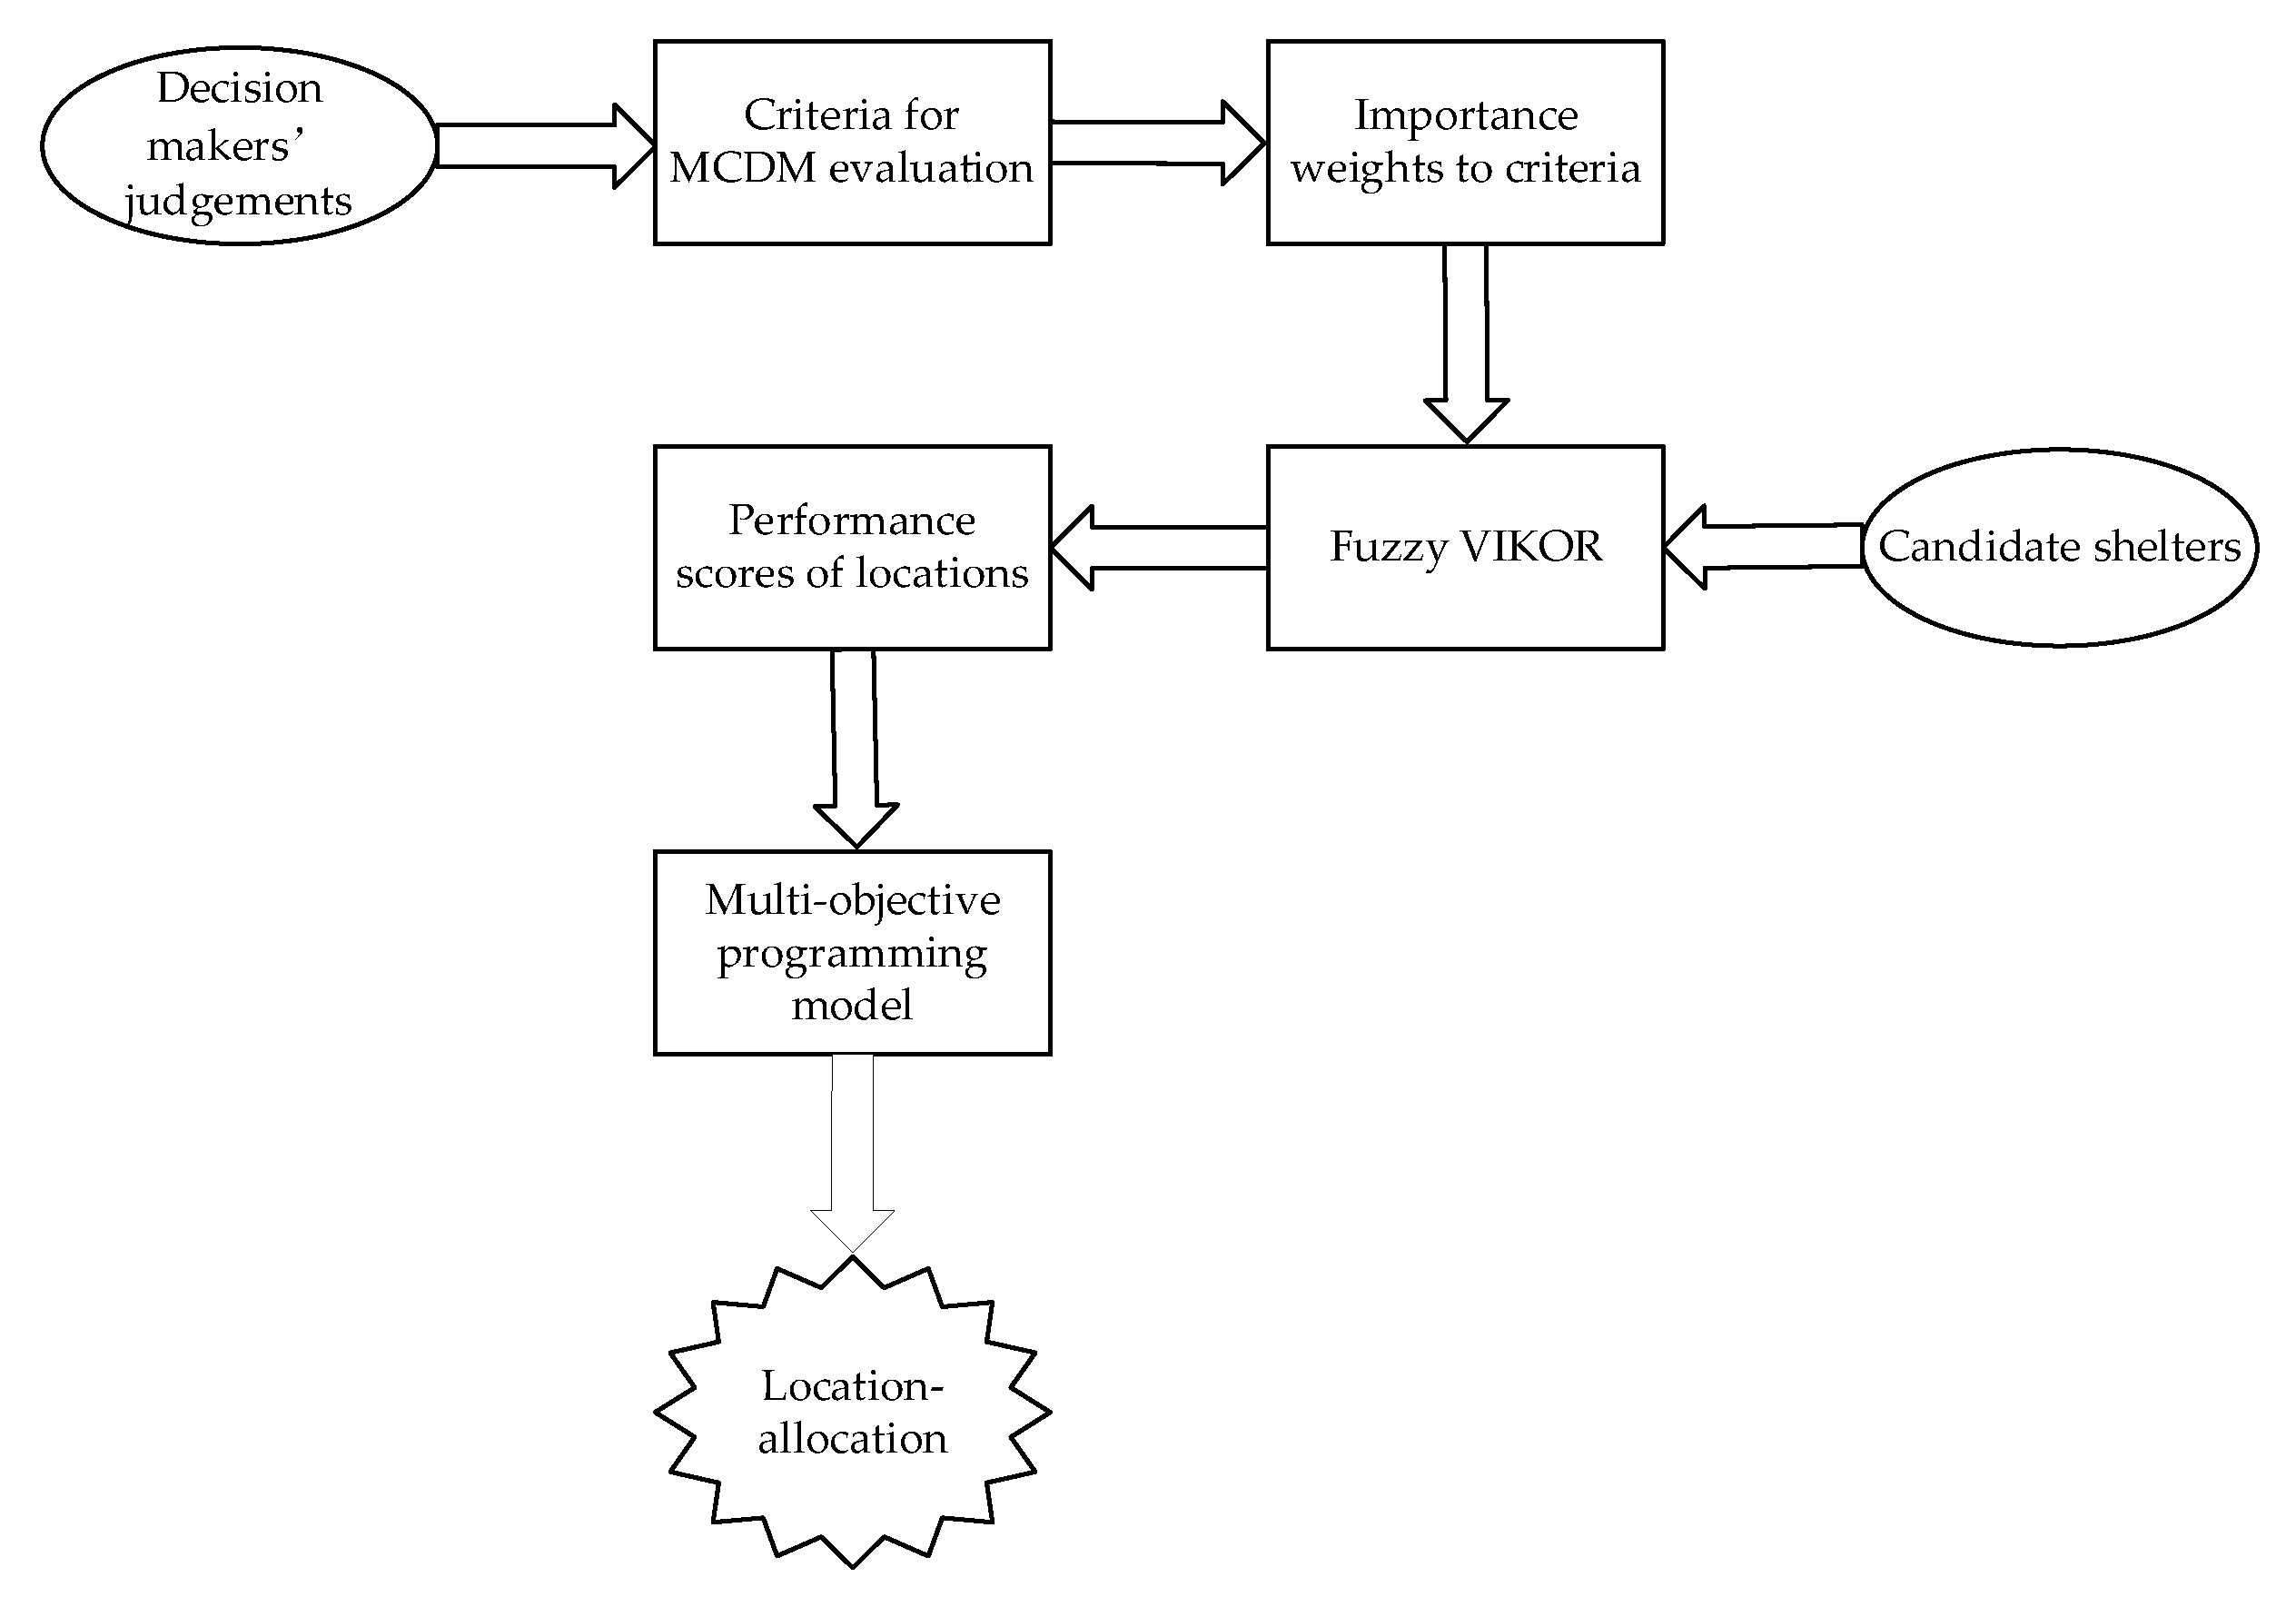
In the manuscript, we propose a model that combines the performance evaluation results obtained by fuzzy-VIKOR with a two-stage bi-objective programming model. The model aims to provide living and medical services for evacuees by considering different types of emergency shelters.
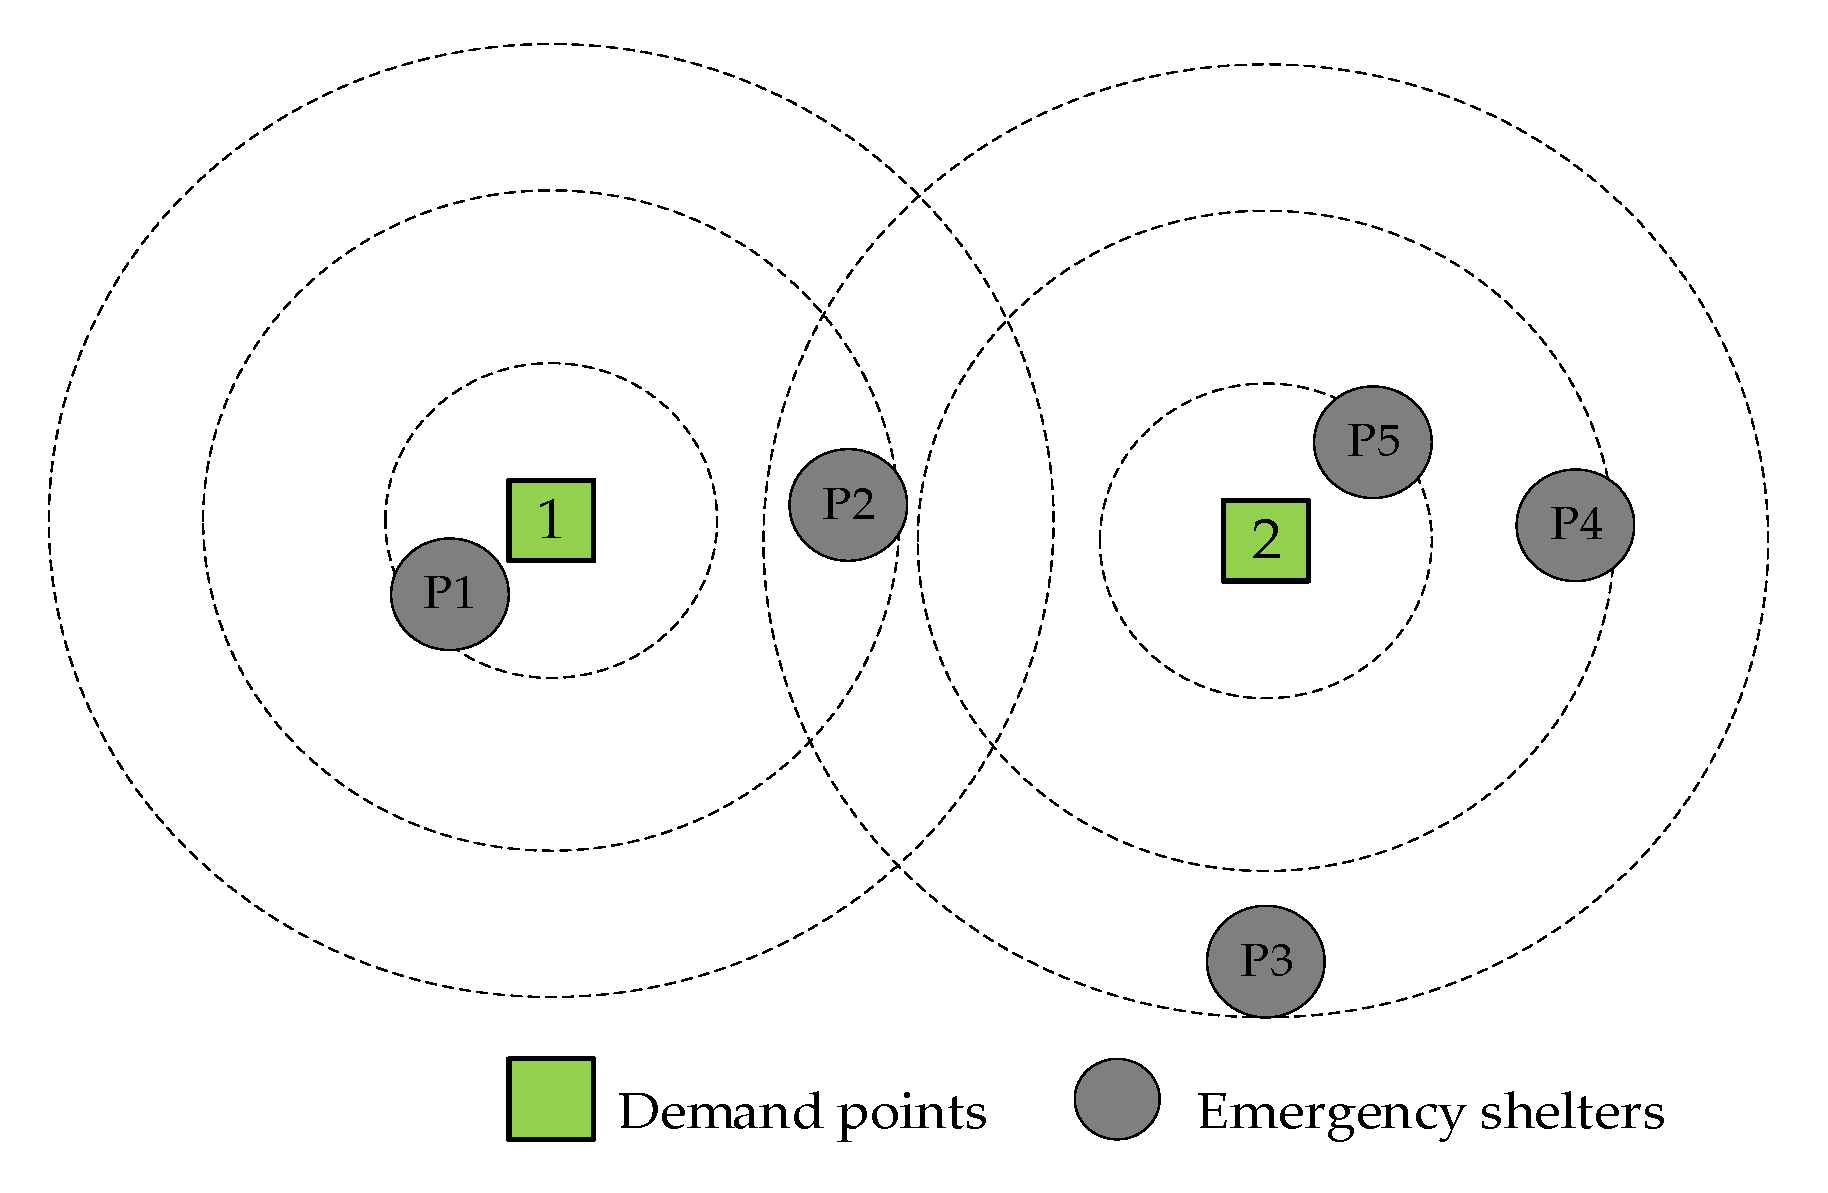
The multi-level coverage idea proposed by Berman and Krass has been adopted to construct the boundary coverage function [12]. As the distance between emergency shelter i and affected area j increases, the proportion of evacuation demand from demand point j to shelter i decreases. Suppose the distance relationship between two points is 0 < d 1 < d 2 < < d k , d k is the maximum evacuation distance set by the local government. The evacuation demand of demand point j is D j . p k represents the proportion of demand that can be covered by the distance between the demand point and the emergency shelter in the interval ( d k 1 , d k ) . The total demand of point j that can be covered is p k D j , where 1 > p 1 > p 2 > > p k > 0 . The specific situation of the boundary coverage function is shown in Figure 3. It is assumed that effective coverage can be divided into three levels. The demands of the affected points 1 and 2 are D 1 and D 2 , respectively. For example, the emergency shelters P1 and P2 located in the first and second layers can cover, at most, the demand of affected point 1 of min p 1 D 1 + p 2 D 1 , D 1 .
Table 3 shows the parameters in the multi-objective programming model.

4.1. Temporary Stage of the Model

min G 1 = a A i I Q i Z i a 1
min G 2 = j J i I ( X j i 11 + X j i 21 ) d j i + e E i I ( Y e i 1 1 + Y e i 2 1 ) d i e
i I X j i a 1 D j a 1 j J
e E Y e i 1 1 j J X j i 11 γ 1 1 ν 1 i I
e E Y e i 2 1 j J X j i 11 γ 2 1 ν 1 i I
e E Y e i 1 1 j J X j i 21 γ 1 2 ν 1 i I
e E Y e i 2 1 j J X j i 21 γ 2 2 ν 1 i I
j J X j i 11 C a p i Z i 11 i I
j J X j i 21 C a p i Z i 21 i I
i I Y e i m 1 C a p e m e E , m M
a A Z i a 1 1 i I
i | θ k 1 < d j i < θ k X j i a 1 p k D j a 1 a A , j J , k K
i I a A Z i a 1 F C + j J i I a A V C a X j i a 1 B 1
X j i a 1 , Y e j m 1 Z + , i I , j J , a A , e E , m M
Z i a 1 0 , 1 i I , a A
The first objective function (16) aims to maximize the share of the highest-ranked emergency shelter. The evaluation by fuzzy-VIKOR gives us the coefficients of the objective function design variable. In the second objective function (17), the distance travelled by evacuees and delivered by materials is minimized. d j i and d i e are the normalization of the distance d j i and d j e , d j i = 1 when d j i is the maximum and d j i = 0 when d j i is the minimum. Formally defined as: d j i = d j i d j i min d j i max d j i min , j J , i I , where d j i max and d j i min are the maximum distance in the d j i matrix. Equation (18) ensures that victims in need of shelter receive it. Equations (19)–(22) ensure that evacuees can be distributed more than the minimum proportion of materials. Equations (23) and (24) state that the number of evacuees assigned to a shelter should not exceed its capacity. Equation (25) maintains that the number of supplies delivered to evacuees should not exceed the capacity of the distribution centers. Equation (26) ensures that each emergency shelter is associated with only one type. Equation (27) is a boundary cover function that limits the number of evacuees that can be allocated to shelters in the kth coverage level of the demand point j. Equation (28) limits the expenses on shelters within the available budget. Equations (29) and (30) define the decision variables.

4.2. Short-Term Stage of the Model

After the first day of being allocated in the temporary shelters, the evacuees have initially grasped the disaster situation. Their physical conditions change and they will be reallocated to different types of short-term emergency shelters. The emergency facilities of short-term shelters are more complete to meet the needs of longer evacuation and living. The suitability of emergency shelters at the short-term stage is not the main purpose, but to reduce the rescue costs.
min G 3 = i I i I ( X i i 12 + X i i 22 ) d i i + e E i I ( Y e i 1 1 + Y e i 2 1 ) d i e
min G 4 = i I a A Z i a 2
i I 1 1 I 2 1 X i i 12 i I 1 1 j J X j i 11 ( 1 β 1 ) + i I 2 1 j J X j i 21 β 2 i I I 2 1
i I 1 1 I 2 1 X i i 22 i I 1 1 j J X j i 11 β 1 + i I 2 1 j J X j i 21 ( 1 β 2 ) i I I 1 1
e E Y e i 1 2 i I 1 1 I 2 1 X i i 12 γ 1 1 ν 2 i I I 2 1
e E Y e i 2 2 i I 1 1 I 2 1 X i i 12 γ 2 1 ν 2 i I I 2 1
e E Y e i 1 2 i I 1 1 I 2 1 X i i 22 γ 1 2 ν 2 i I I 1 1
e E Y e i 2 2 i I 1 1 I 2 1 X i i 22 γ 2 2 ν 2 i I I 1 1
i I X i i 12 Z i 12 C a p i i I I 2 1
i I X i i 22 Z i 22 C a p i i I I 1 1
i I Y e i m 2 C a p e m e E , m M
a A Z i a 2 1 i I
a A i | θ k 1 < d i i < θ k X i i a 2 p k D i a 1 i I , k K
D i 11 = j X j i 11 ( 1 β 1 ) i I 1 1
D i 11 = j X j i 21 β 2 i I 2 1
D i 21 = j X j i 11 β 1 i I 1 1
D i 21 = j X j i 11 ( 1 β 2 ) i I 2 1
i I I 1 1 I 2 1 a A Z i a 2 F C + i I i I a A V C a X i i a 2 B 2
X i i a 2 , Y e i m 2 Z + , i I , i I , a A , e E , m M
Z i a 2 0 , 1 i I , a A
Equation (31) aims to minimize the distance travelled by the evacuees and delivery of the materials. It is worth noting that the candidate set of short-term living shelters consists of unchosen candidate shelters and temporary living shelters and the candidate set of short-term medical shelters is composed of unselected candidate shelters and temporary medical shelters. Equation (32) aims to minimize the number of short-term shelters to be open, which express minimizing the total shelter construction investment. Equations (33) and (34) restrict all evacuees to be assigned to corresponding shelters. Equations (35)–(38) ensure that the minimum material requirements of evacuees are met. Equations (39) and (40) limit the number of supplies the warehouse provides to capacity. Equation (41) ensures that the warehouse does not exceed its capacity for emergency supplies. Equation (42) indicates that only one type of short-term shelter can be chosen. Equation (43) is the boundary cover function. Equations (44)–(47) indicate various evacuation demands in temporary emergency shelters at the end of the first stage. Equation (48) limits the cost of shelters to existing budgets. Equations (49) and (50) define the decision variables.

5. Case Study and Data

This section describes the case study used to evaluate the performance of the proposed approach. It is based on the earthquake that struck Sichuan Province in China in May 2008.

5.1. The Earthquake of May 2008 in Wenchuan

Being situated on one of the most seismic belts, Sichuan Province is a place that has experienced many earthquakes in the past few years [72]. Chengdu, the capital of Sichuan Province and a large city in the southeast region with a population of around 20.93 million (statistics in 2021), has been crossed by the Longquan Mountain fault zone in the past few years. The magnitude 8.0 earthquake in Sichuan Province is a sign, albeit a warning, of a more serious earthquake threat. As a result of this disaster, tens of millions of people have completely lost their houses or abandoned their homes due to insecurity and partial destruction. The Wenchuan earthquake had a great impact on Chengdu, resulting in 4276 deaths and 26,413 injuries [73]. Areas susceptible to natural disasters, especially capital cities, are in great need of an efficient emergency shelter network to respond and reliably provide fast and effective rescue for evacuees. In this paper, the Wuhou District with the highest population density in Chengdu was investigated in the context of earthquake scenarios. The location of Chengdu and Wuhou District is indicated in Figure 4a,b, respectively.
Next, Section 5.2 discusses detailed information of the studied area, explaining how to collect information about the demand points, the characteristics of the different shelters, and the distances between the facilities.

5.2. Data

The case study was created by using information obtained from the National Bureau of Statistics database, the geographical cloud data, and field surveys. Several potential alternatives for establishing emergency shelters have been considered according to the criteria defined in Section 3.1. There is not a single standard to determine the best locations for establishing emergency shelters. In this regard, based on the criteria defined by the decision-makers’ points of view, a group multi-criteria decision-making technique was used to support the decision on the best locations. Temporary shelters are normally schools, gyms, and parks with the appropriate characteristics. These facilities are quickly converted from daily functions to disaster functions to reduce the casualties of the evacuees. The evacuees are then reallocated to short-term emergency shelters with better services. Meanwhile, the distribution centers provide supplies to the evacuees quickly and accurately. This paper constructed an emergency shelter rescue network composed of demand points, emergency shelters, and material distribution centers (see Figure 5).
The network of the case study contained 49 nodes representing locations of the Wuhou District. According to their characteristics, they can be classified as:
  • The 20 demand points are located in the affected area, mainly in densely populated residential regions. The total number of the affected population and their demographic composition were obtained from the statistical data.
  • The 15 shelter nodes include the real evacuation sites corresponding to the real shelters enabled by the Chengdu special layout plan and large open spaces such as parks, green spaces, squares, and stadiums. Their locations and capacities were obtained from Baidu Maps and reports of the statistics.
  • Based on the time horizon and the total area of this case study, we considered 10 material distribution centers. These nodes are the storage points for local emergency supplies and the transit points for the distribution of supplies to the affected areas in the second stage.
For the multi-level coverage function, evacuees must reach the emergency shelters within half an hour in the first stage. The coverage radius of each open facility includes 1000, 2000, and 3000 m, assuming p 1 = 100 % , p 2 = 75 % , and p 3 = 50 % , respectively. In the short-term shelter stage, the disaster situation tends to be stable, and evacuees can be reallocated to short-term shelters with better services and longer distances. It was defined that the proportion of victims in temporary living shelters who need medical services in the second stage was 40%, and the ratio of evacuees who can be transferred to the short-term living shelters was 50%. That is, it was assumed that the earthquake was one of high impact. Correspondingly, the coverage radius of each short-term shelter were 2000, 3000, and 4000 m. Living and medical emergency supplies come in packages. Assume that the demands of the evacuees who need basic services for living and medical supplies are 1 and 0.5, respectively. Suppose that the demands of evacuees who need medical or psychological aid for living and medical supplies are 1 and 1, respectively. In the first stage, when supplies are scarce, the material satisfaction rate is 60%. In the second stage, a large number of supplies arrive at the affected areas, and all the material demands are met. All cost parameters used in the following experiments are shown in Table 4. As an estimate of only the operations and scope included in the case study, we considered an available budget of USD 2,800,000 in both stages.
The data regarding the affected population were estimated from the permanent population and the evacuation rate after the disaster, as displayed in Table 5. Only around 30% of the total population were evacuated to local emergency shelters [74]. The number of evacuees who need medical aid in the first stage was based on the number of children under nine years of age and individuals over 70. The capacities of the emergency shelters are shown in Table 6.

6. Results and Analysis

This section presents and analyzes the results obtained by solving the proposed model of the case study to conduct a deeper analysis of the performance of the model. The optimization problems were solved by MATLAB R2019b on an Intel (R) Core (TM) i5-8550U CPU 1.80 GH, 8G RAM running Windows 10.

6.1. Model Implementation and Results

6.1.1. Determining Candidate Shelters

In this section, a questionnaire was administrated to three experts with field and research experience in humanitarian relief. A set of 15 candidate shelters was investigated under the criteria, and then the steps to obscure the fuzzy-VIKOR method were as follows.
Step 1: The selection of experts was carefully conducted to obtain a reliable and robust priority order of criteria and alternative shelters, as shown in Table 7 and Table 8, respectively.
Step 2: The linguistic values described in Step 1 are transformed into trapezoidal fuzzy numbers by using Table 2. Table 9 and Table 10 show the results of each criterion and candidate shelter converted into equivalent fuzzy numbers.
Step 3: The aggregated fuzzy numbers of the candidate shelter rate and subjective weights are calculated according to Equations (1) and (2). Then, their crisp values are shown in Table 11, according to Equation (3).
Step 4: Using Equations (5)–(7), the objective weights of each criterion are obtained as shown in Table 12.
Step 5: Using Equation (8), the normalized values of weights and candidate shelter rate under each criterion is obtained (Table 13). As shown in Table 14, the clear decision matrix is determined based on Equation (9).
Step 6: In this step, the fuzzy-VIKOR index is calculated in Table 15 based on Equations (10)–(12). The value of the importance of group utility υ is considered to be 0.5.

6.1.2. Implementing the Proposed Bi-Objective Programming Model

The Q i index calculated in Table 15 was used as one of the input parameters in the bi-objective programming model. According to Section 3.2, we need the upper limit for one of the objective functions. Hence, the objective function related to the suitability of shelters in the first stage (Equation (16)) and the objective function related to the number of open shelters in the second stage (Equation (32)) were chosen to be included in the constraints. Because the objective function (17) related to the distance has a large number of levels, the logarithm is used to degrade it.
In the first stage, the lower limit of the objective function (Equation (16)) is obtained based on Table 16 by calculating the minimum value. Table 16 shows that 10 of the 15 candidate shelters were selected. Five points were selected as shelters that provide 1-Type services, and the remaining five sites are chosen as temporary shelters that provide 2-Type services. The numbers in the internal cell are the number of evacuees transferred from the demand points to the temporary emergency shelters in the first stage. Candidate points S03, S06, S07, S10, and S15 were not chosen, thus there were no evacuees to these points.
To obtain the non-dominated optimal Pareto, starting from the upper bound of the suitability function, 0.01 is subtracted at each iteration, therefore the optimal Pareto has been obtained (Figure 6). Along the Pareto optimal, when obtaining the emergency shelters’ location–allocation results, the convenience of evacuation and supply distribution is sacrificed to obtain a solution with a better evaluation score. Under the guidance of the convenience of evacuation after an earthquake, the value of the objective function related to the distance was lower than the value obtained by other plans. Contrary to convenience-oriented methods, service-oriented methods focus on the suitability of temporary shelters.
To visually see the sensitivity of the results to selectivity and the preference of the objectives, a sensitivity analysis was carried out on the solutions obtained. The results are recorded in Table 17. The percentage in the table represents the deviation between the bi-objective optimization result and the optimal value of a single objective. Figure 7 graphically shows the change in the target value when the weight of each target changes. It can be seen that the model is sensitive when considering qualitative factors to select emergency shelters. Candidate points that give higher preference to qualitative factors are included in the final selection. It indicates the importance of using a hybrid method since it effectively combines qualitative criteria and quantifiable factors to optimize the decision on refuge site selection.
Under the balanced location–allocation scheme of the first stage, short-term emergency shelters can be planned. We need the upper bound of the objective function (Equation (32)) related to the number of short-term emergency shelters to be open. It can be seen from the upper bound of Equation (32) (Table 18) that this approach significantly increases the cost of emergency rescue. By calculating the minimum value of open short-term emergency shelters, the lower bound of the objective function can be obtained according to Table 19. All evacuees are relocated to only eight sites. Starting from the upper bound of the quantity function, 1 is subtracted in each iteration, so the optimal Pareto has been obtained.
Starting from the upper bound of the quantity function, 1 is subtracted in each iteration, so that the optimal Pareto has been obtained (Figure 8). Table 20 shows the value of the achieved goal compared to its target value. The highest deviation was for the number of short-term emergency shelters selected, which was four more than the minimum number of open facilities.
The evacuation of victims after an earthquake is always unplanned. The affected population is randomly moved to nearby sites, which may not be able to comfortably meet their diverse demands, causing inconvenience in the long-term. Due to the lack of planning for the allocation of victims after the Wenchuan earthquake, most shelters were chosen spontaneously by the evacuees [75,76]. The evacuees living in facilities that were not suitable for setting up shelters had limited or hard-to-reach emergency resources. The results of the two-stage optimization showed that the proposed model provides significant efficiency in locating temporary shelters and short-term shelters, allocating the affected population, and distributing emergency supplies. It can combine important decision-making criteria in the actual situation after the earthquake to enhance the emergency shelter location–allocation decision.

6.2. Some Guidelines for the Use of Optimization Models

An emergency shelter rescue system is undertaken with the main objective to reduce casualties and provide rapid and accurate aid. Shelter life is a process, and there is a clear difference between asylum life and daily life. The performance of these shelters are not as effective as it should be and their locations are determined to be one of the main sources of poor performance [77], resulting in the inability of services to match the diverse and upgraded demands.
The present proposal aims to assist decision-makers in choosing emergency shelter locations with different functions. Hence, the affected population can access a variety of emergency resources to reduce the damage caused by the earthquake. The proposed hybrid method considers important factors required for the safe relocation of evacuees. It can also be used as an important tool to improve the decision-making ability of managers in shelter location, evacuee allocation, and materials distribution after disasters. It tends to generate reliable solutions based on key input variables and does not require other in-depth professional knowledge except that rescuers need to participate in the evaluation of candidate shelters. The solution method of the bi-objective programming model quickly finds the emergency shelter location–allocation plan suitable for different backgrounds, which reduces the computational complexity. It also adjusts the decisions based on the weight of the objective function and the cost that the humanitarian aid program can bear. For example, if the weather conditions are mild and no equipment requires energy, power facilities become less important. In other cases, the geological type is more important than other factors. The constructed bi-objective model considers different objectives at different stages. In the temporary stage, the first objective is to choose the most suitable temporary shelter location based on qualitative criteria. The next goal is to ensure the convenience of evacuation and supply distribution for the evacuees. In the second stage, in addition to optimizing the convenience, the number of sites selected is also considered to ensure that the cost of the emergency shelter rescue system is minimized. Decision-makers can fine-tune the model according to specific priorities and needs by adjusting the input values of the model.
Sensitivity analysis of the scheme obtained by the proposed model can provide management insights to the decision-makers of the emergency shelter rescue system. They can determine the appropriate rescue plan by observing the critical value of the objective function. Therefore, the proposed model helps to effectively plan and accelerate the evacuation process of the evacuees after the earthquake.

7. Conclusions

Several unmeasured factors and conflicting objectives will be encountered when planning and implementing emergency shelters. The motivation behind this research work is to propose a hybrid integrated method of fuzzy-VIKOR and bi-objective programming model to support emergency shelter location and evacuee allocation decisions. This paper emphasizes the hierarchical evacuation demands of the victims, the suitability of the selected sites, and the planning of emergency shelters with different functions. The objective function minimized the distance of evacuees to the shelter and the distance of supply distribution as well as the number of open shelters, and maximizes the share of the shelter that obtains better performance scores through fuzzy-VIKOR evaluation. These solutions not only consider the convenience and cost of evacuation, but also several other significant criteria, which are effective in improving the reliability of emergency shelter systems and the service quality. The proposed method of fuzzy-VIKOR and bi-objective programming model can help decision-makers to promote an optimized emergency shelter system by considering the demands of the evacuees and local actual conditions. The applicability of the approach was verified using the case description of the Wenchuan earthquake. The different solutions generated were evaluated by measuring the deviation from the single-objective optimization result.
Further development of the model will include considering the uncertainty of parameters, increasing the total number of parameters, and expanding the coverage of the emergency shelter system. Additionally, another meaningful research direction is to eliminate the inconsistency that may occur in the VIKOR method when the original evaluated object is added, deleted, or replaced. With the advent of the era of big data, it is difficult to change the nature of the instability and randomness of preference information in the MCDM process under the fuzzy environment after a disaster. How to solve the uncertainty and randomness of information evaluation in the big data environment is also an important research direction in the future. Moreover, better-trained people may be willing to become involved in rescue activities as volunteers. Such a social network may interfere with the shelter-designed one. Future research will examine the benefit–risk of having installed a network of shelters to explore their effects on training the whole population for catastrophic events.

Author Contributions

S.G. designed and revised this paper; S.G. and Z.Z. collected and analyzed documents related to emergency shelters; H.H. provided valuable research insights into the analysis and investigation. All authors have read and agreed to the published version of the manuscript.

Funding

This research was funded by the National Key Research and Development Program in China (grant number 2016YFC0803207) and the Longitudinal Research Project of Science and Technology Division in China (grant number B21M200010).

Institutional Review Board Statement

Not applicable.

Informed Consent Statement

Not applicable.

Data Availability Statement

Not applicable.

Conflicts of Interest

The authors declare no conflict of interest.

References

  1. Jones, K.; Pascale, F.; Wanigarathna, N.; Morga, M.; Sargin, S. Critical evaluation of the customisation process of the UNDRR disaster resilience scorecard for cities to earthquake-induced soil liquefaction disaster events. Bull. Earthq. Eng. 2021, 19, 4115–4143. [Google Scholar] [CrossRef]
  2. Bayram, V.; Yaman, H. Shelter location and evacuation route assignment under uncertainty: A benders decomposition approach. Transp. Sci. 2017, 52, 416–436. [Google Scholar] [CrossRef]
  3. Li, A.; Nozick, L.; Xu, N.; Davidson, R. Shelter location and transportation planning under hurricane conditions. Transp. Res. Part E Logist. Transp. Rev. 2012, 48, 715–729. [Google Scholar] [CrossRef]
  4. Segura, M.; Maroto, C.; Segura, B.; Casas-Rosal, J. Improving food supply chain management by a sustainable approach to supplier evaluation. Mathematics 2020, 8, 1952. [Google Scholar] [CrossRef]
  5. Wang, C.; Nhieu, N.; Chung, Y.; Pham, H. A robust multi-objective optimization model for inventory and production management with environmental and social consideration: A real case of dairy industry. Mathematics 2021, 9, 379. [Google Scholar] [CrossRef]
  6. Toregas, C.; Swain, R.; Revelle, C.; Bergman, L. The location of emergency service facilities. Oper. Res. 1971, 19, 1363–1373. [Google Scholar] [CrossRef]
  7. Klose, A.; Drexl, A. Facility location models for distribution system design. Eur. J. Oper. Res. 2005, 162, 4–29. [Google Scholar] [CrossRef] [Green Version]
  8. Jena, S.D.; Cordeau, J.F.; Gendron, B. Modeling and solving a logging camp location problem. Ann. Oper. Res. 2012, 232, 1–27. [Google Scholar] [CrossRef]
  9. Fischetti, M.; Ljubić, I.; Sinnl, M. Benders decomposition without separability: A computational study for capacitated facility location problems. Eur. J. Oper. Res. 2016, 253, 557–569. [Google Scholar] [CrossRef]
  10. Ko, Y.D.; Song, B.D.; Hwang, H. Location, capacity and capability design of emergency medical centers with multiple emergency diseases. Comput. Ind. Eng. 2016, 101, 10–20. [Google Scholar] [CrossRef]
  11. Wang, S.; Chen, T. Using NSGA-II to solve multi-objective competitive location problem with cooperative coverage for distance-based attractiveness. J. Intell. Fuzzy Syst. 2021, 40, 7723–7734. [Google Scholar] [CrossRef]
  12. Berman, O.; Krass, D.; Drezner, Z. The gradual covering decay location problem on a network. Eur. J. Oper. Res. 2003, 151, 474–480. [Google Scholar] [CrossRef]
  13. Mumtaz, K. A multi-objective facility location problem in the presence of variable gradual coverage performance and cooperative cover. Eur. J. Oper. Res. 2017, 262, 1040–1051. [Google Scholar] [CrossRef]
  14. Wenyan, Y.; Yun, P.; Fengmei, Y. Two-level emergency centers location model based on the hazardous chemicals’ accidents. Syst. Eng. Theory Pract. 2015, 35, 728–735. [Google Scholar]
  15. Ozkapici, D.B.; Ertem, M.A.; Aygünes, H. Intermodal humanitarian logistics model based on maritime transportation in Istanbul. Nat. Hazards 2016, 83, 345–364. [Google Scholar] [CrossRef]
  16. Chen, Z.; Chen, X.; Li, Q.; Chen, J. The temporal hierarchy of shelters: A hierarchical location model for earthquake-shelter planning. Int. J. Geogr. Inf. Sci. 2013, 27, 1612–1630. [Google Scholar] [CrossRef]
  17. Trivedi, A.; Rao, S. Agent-based modeling of emergency evacuations considering human panic behavior. IEEE Trans. Comput. Soc. Syst. 2018, 5, 277–288. [Google Scholar] [CrossRef]
  18. Noyan, N.; Balcik, B.; Atakan, S. A stochastic optimization model for designing last mile relief networks. Trans. Sci. 2016, 50, 1092–1113. [Google Scholar] [CrossRef] [Green Version]
  19. An, S.; Cui, N.; Li, X.; Ouyang, Y. Location planning for transit-based evacuation under the risk of service disruptions. Transp. Res. Part B Methodol. 2013, 54, 1–16. [Google Scholar] [CrossRef]
  20. Gupta, S.; Starr, M.K.; Farahani, R.Z.; Matinrad, N. Disaster management from a POM perspective: Mapping a new domain. Prod. Oper. Manag. 2016, 25, 1611–1637. [Google Scholar] [CrossRef]
  21. Boonmee, C.; Arimura, M.; Asada, T. Facility location optimization model for emergency humanitarian logistics. Int. J. Disaster Risk Reduct. 2017, 24, 485–498. [Google Scholar] [CrossRef]
  22. Tavana, M.; Abtahi, A.-R.; DI Caprio, D.; Hashemi, R.; Zenouz, R.Y. An integrated location-inventory-routing humanitarian supply chain network with pre- and post-disaster management considerations. Socio-Econ. Plan. Sci. 2018, 64, 21–37. [Google Scholar] [CrossRef]
  23. Thomas, A.S.; Kopczak, L.R. From logistics to supply chain management: The path forward in the humanitarian sector. Fritz Inst. 2005, 15, 1–15. [Google Scholar]
  24. Sheu, J.B.; Pan, C. A method for designing centralized emergency supply network to respond to large-scale natural disasters. Transp. Res. Part B Methodol. 2014, 67, 284–305. [Google Scholar] [CrossRef]
  25. Ahmad, N.; Hasan, M.G.; Barbhuiya, R.K. Identification and prioritization of strategies to tackle COVID-19 outbreak: A group-BWM based MCDM approach. Appl. Soft. Comput. 2021, 111, 107642. [Google Scholar] [CrossRef]
  26. Prabhuram, T.; Rajmohan, M.; Tan, Y.; Johnson, R.R. Performance evaluation of Omni channel distribution network configurations using multi criteria decision making techniques. Ann. Oper. Res. 2020, 288, 435–456. [Google Scholar] [CrossRef]
  27. Suhi, S.A.; Enayet, R.; Haque, T.; Ali, S.M.; Moktadir, M.A.; Paul, S.K. Environmental sustainability assessment in supply chain: An emerging economy context. Environ. Impact Assess. Rev. 2019, 79, 106306. [Google Scholar] [CrossRef]
  28. Zangoueinezhad, A.; Azarf, A.; Kazazi, A. Using SCOR model with fuzzy MCDM approach to assess competitiveness positioning of supply chains: Focus on shipbuilding supply chains. Marit. Policy Manag. 2011, 38, 93–109. [Google Scholar] [CrossRef]
  29. Figueira, J.R.; Mousseau, V.; Roy, B. ELECTRE methods. In Multiple Criteria Decision Analysis; Springer: Berlin/Heidelberg, Germany, 2016; pp. 155–185. [Google Scholar]
  30. Dias, L.C.; Costa, J.P.; Clímaco, J.N. A parallel implementation of the PROMETHEE method. Eur. J. Oper. Res. 1998, 104, 521–531. [Google Scholar] [CrossRef]
  31. Salih, M.M.; Zaidan, B.; Zaidan, A.; Ahmed, M.A. Survey on fuzzy TOPSIS state-of-the-art between 2007 and 2017. Comput. Oper. Res. 2019, 104, 207–227. [Google Scholar] [CrossRef]
  32. Saaty, T.L. Decision-making with the AHP: Why is the principal eigenvector necessary. Eur. J. Oper. Res. 2003, 145, 85–91. [Google Scholar] [CrossRef]
  33. Faizi, S.; Sałabun, W.; Ullah, S.; Rashid, T.; Więckowski, J. A new method to support decision-making in an uncertain environment based on normalized interval-valued triangular fuzzy numbers and comet technique. Symmetry 2020, 12, 516. [Google Scholar] [CrossRef] [Green Version]
  34. Opricovic, S.; Tzeng, G.-H. Compromise solution by MCDM methods: A comparative analysis of VIKOR and TOPSIS. Eur. J. Oper. Res. 2004, 156, 445–455. [Google Scholar] [CrossRef]
  35. Haldar, A.; Ray, A.; Banerjee, D.; Ghosh, S. Resilient supplier selection under a fuzzy environment. Int. J. Manag. Educ. Sci. Eng. Manag. 2014, 9, 147–156. [Google Scholar] [CrossRef]
  36. Trivedi, A.; Singh, A. A hybrid multi-objective decision model for emergency shelter location-relocation projects using fuzzy analytic hierarchy process and goal programming approach. Int. J. Proj. Manag. 2017, 35, 827–840. [Google Scholar] [CrossRef]
  37. Cheraghi, S.; Hosseini-Motlagh, S.M. Responsive and reliable injured-oriented blood supply chain for disaster relief: A real case study. Ann. Oper. Res. 2018, 291, 129–167. [Google Scholar] [CrossRef]
  38. Sun, R.; Gong, Z.; Gao, G.; Shah, A.A. Comparative analysis of Multi-Criteria Decision-Making methods for flood disaster risk in the Yangtze River Delta. Int. J. Disaster Risk Reduct. 2020, 51, 101768. [Google Scholar] [CrossRef]
  39. Guitouni, A.; Martel, J.M.; Vincke, P.; North, P.B. A Framework to Choose a Discrete Multicriterion Aggregation Procedure; Defence Research Establishment Valcatier (DREV): Ottawa, ON, Canada, 1998; Available online: https://pdfs.semanticscholar.org/27d5/9c846657268bc840c4df8df98e85de66c562.pdf (accessed on 1 June 2021).
  40. Ishizaka, A.; Nemery, P. Multi-Criteria Decision Analysis: Methods and Software; John Wiley & Sons: Chichester, UK, 2013. [Google Scholar]
  41. Wang, Q.; Geng, X. Multi-attribute group decision-making method of evaluation based on hesitant fuzzy COPRAS. Stat. Decis. 2019, 35, 47–51. [Google Scholar] [CrossRef]
  42. Chu, M.-T.; Shyu, J.; Tzeng, G.-H.; Khosla, R. Comparison among three analytical methods for knowledge communities group-decision analysis. Expert Syst. Appl. 2007, 33, 1011–1024. [Google Scholar] [CrossRef]
  43. Opricovic, S. Multicriteria optimization of civil engineering systems. Fac. Civ. Eng. Belgrade 1998, 2, 5–21. [Google Scholar]
  44. Amin, F.; Fahmi, A.; Abdullah, S.; Ali, A.; Ahmad, R.; Ghani, F. Triangular cubic linguistic hesitant fuzzy aggregation operators and their application in group decision making. J. Intell. Fuzzy Syst. 2018, 34, 2401–2416. [Google Scholar] [CrossRef]
  45. Tseng, M.-L.; Lim, M.; Wu, K.-J.; Zhou, L.; Bui, D.T.D. A novel approach for enhancing green supply chain management using converged interval-valued triangular fuzzy numbers-grey relation analysis. Resour. Conserv. Recycl. 2018, 128, 122–133. [Google Scholar] [CrossRef]
  46. Montes, R.; Sanchez, A.M.; Villar, P.; Herrera, F. Carpooling Collaborative Consumption Community with multi-criteria hesitant fuzzy linguistic term set opinions to build confidence and trust. Appl. Soft. Comput. 2018, 67, 941–952. [Google Scholar] [CrossRef]
  47. Rodríguez, R.M.; Martinez, L.; Torra, V.; Xu, Z.; Herrera, F. Hesitant fuzzy sets: State of the art and future directions. Int. J. Intell. Syst. 2014, 29, 495–524. [Google Scholar] [CrossRef]
  48. Wang, J.-Q.; Wu, J.-T.; Wang, J.; Zhang, H.-Y.; Chen, X.-H. Interval-valued hesitant fuzzy linguistic sets and their applications in multi-criteria decision-making problems. Inf. Sci. 2014, 288, 55–72. [Google Scholar] [CrossRef]
  49. Xu, J.; Yin, X.; Chen, D.; An, J.; Nie, G. Multi-criteria location model of earthquake evacuation shelters to aid in urban planning. Int. J. Disaster Risk Reduct. 2016, 20, 51–62. [Google Scholar] [CrossRef]
  50. Amin Hosseini, S.M.; Albert, D.; Pons, O. Multicriteria decision-making method for sustainable site location of post-disaster temporary housing in urban areas. J. Constr. Eng. Manag. 2016, 142, 04016036. [Google Scholar] [CrossRef] [Green Version]
  51. Knay, Ö.B.; Saldanha-Da-Gama, F.; Kara, B.Y. On multi-criteria chance-constrained capacitated single-source discrete facility location problems. Omega Int. J. Manag. Sci. 2019, 83, 107–122. [Google Scholar] [CrossRef]
  52. Yahyaei, M.; Bozorgi-Amiri, A. Robust reliable humanitarian relief network design: An integration of shelter and supply facility location. Ann. Oper. Res. 2018, 283, 897–916. [Google Scholar] [CrossRef]
  53. GB/T33744-2017. Emergency Shelter for Earthquake Disasters-Guidelines on the Operation and Management; China National Standardizing Committee: Beijing, China, 2017. [Google Scholar]
  54. Gu, J.; Zhou, Y.; Das, A.; Moon, I.; Lee, G.M. Medical relief shelter location problem with patient severity under a limited relief budget. Comput. Ind. Eng. 2018, 125, 720–728. [Google Scholar] [CrossRef]
  55. Kılcı, F.; Kara, B.Y.; Bozkaya, B. Locating temporary shelter areas after an earthquake: A case for Turkey. Eur. J. Oper. Res. 2015, 243, 323–332. [Google Scholar] [CrossRef]
  56. Deng, H.; Yeh, C.H.; Willis, R.J. Inter-company comparison using modified TOPSIS with objective weights. Comput. Oper. Res. 2000, 27, 963. [Google Scholar] [CrossRef]
  57. Al-Aomar, R. A combined ahp-entropy method for deriving subjective and objective criteria weights. Int. J. Ind. Eng. Theory Appl. Pract. 2010, 17, 12–24. [Google Scholar]
  58. Yang, W.; Wu, Y. A new improvement method to avoid rank reversal in VIKOR. IEEE Access. 2020, 8, 21261–21271. [Google Scholar] [CrossRef]
  59. Shemshadi, A.; Shirazi, H.; Toreihi, M.; Tarokh, M.J. A fuzzy VIKOR method for supplier selection based on entropy measure for objective weighting. Expert Syst. Appl. 2011, 38, 12160–12167. [Google Scholar] [CrossRef]
  60. Chang, T.H. Fuzzy VIKOR method: A case study of the hospital service evaluation in Taiwan. Inf. Sci. 2014, 271, 196–212. [Google Scholar] [CrossRef]
  61. Sabouhi, F.; Tavakoli, Z.S.; Bozorgi-Amiri, A.; Sheu, J.B. A robust possibilistic programming multi-objective model for locating transfer points and shelters in disaster relief. Transp. A 2019, 15, 326–353. [Google Scholar] [CrossRef]
  62. Hu, Z.; Sheu, J.; Xiao, L. Post-disaster evacuation and temporary resettlement considering panic and panic spread. Transp. Res. Part B Methodol. 2014, 69, 112–132. [Google Scholar] [CrossRef]
  63. Alizadeh, M.; Amiri-Aref, M.; Mustafee, N.; Matilal, S. A robust stochastic Casualty Collection Points location problem. Eur. J. Oper. Res. 2019, 279, 965–983. [Google Scholar] [CrossRef]
  64. Najafi, M.; Eshghi, K.; Dullaert, W. A multi-objective robust optimization model for logistics planning in the earthquake response phase. Transp. Res. Part E Logist. Transp. Rev. 2013, 49, 217–249. [Google Scholar] [CrossRef]
  65. Wilson, D.T.; Hawe, G.I.; Coates, G.; Crouch, R.S. Online optimization of casualty processing in major incident response: An experimental analysis. Eur. J. Oper. Res. 2016, 252, 334–348. [Google Scholar] [CrossRef] [Green Version]
  66. Kimms, A.; Maiwald, M. Bi-objective safe and resilient urban evacuation planning. Eur. J. Oper. Res. 2018, 269, 1122–1136. [Google Scholar] [CrossRef]
  67. Liu, Y.; Cui, N.; Zhang, J. Integrated temporary facility location and casualty allocation planning for post-disaster humanitarian medical service. Transp. Res. Part E Logist. Transp. Rev. 2019, 128, 1–16. [Google Scholar] [CrossRef]
  68. Li, S.; Lay, T.K. Post-disaster multi-period road network repair: Work scheduling and relief logistics optimization. Ann. Oper. Res. 2018, 283, 1345–1385. [Google Scholar] [CrossRef]
  69. Rodriguez-Espindola, O.; Albores, P.; Brewster, C. Dynamic formulation for humanitarian response operations incorporating multiple organisations. Int. J. Prod. Econ. 2018, 204, 83–98. [Google Scholar] [CrossRef]
  70. Malekpoor, H.; Chalvatzis, K.; Mishra, N.; Ramudhin, A. A hybrid approach of VIKOR and bi-objective integer linear programming for electrification planning in a disaster relief camp. Ann. Oper. Res. 2019, 283, 443–469. [Google Scholar] [CrossRef] [Green Version]
  71. ÖZlen, M.; AzizogLu, M. Multi-objective integer programming: A general approach for generating all non-dominated solutions. Eur. J. Oper. Res. 2009, 199, 25–35. [Google Scholar] [CrossRef]
  72. Parsons, T.; Ji, C.; Kirby, E. Stress changes from the 2008 Wenchuan earthquake and increased hazard in the Sichuan basin. Nature 2008, 454, 509–510. [Google Scholar] [CrossRef]
  73. Liu-Zeng, J.; Zhang, Z.; Wen, L.; Tapponnier, P.; Sun, J.; Xing, X.; Hu, G.; Xu, Q.; Zeng, L.; Ding, L.; et al. Co-seismic ruptures of the 12 May 2008, M-s 8.0 Wenchuan earthquake, Sichuan: East-west crustal shortening on oblique, parallel thrusts along the eastern edge of Tibet. Earth Planet. Sci. Lett. 2009, 286, 355–370. [Google Scholar] [CrossRef]
  74. Zhao, L.; Wang, K.; Wang, J. Theories and Methods of Planning and Construction of Urban Emergency Shelters; Science Press: Beijing, China, 2014. [Google Scholar]
  75. Su, Y. Planning and Design of Urban Disaster Prevention and Refuge Sites; China Architecture & Building Press: Beijing, China, 2012. [Google Scholar]
  76. Hu, D.X.; Tang, J. Approach to Amalgamation of green spaces and emergency shelters–thinking after Wenchuan earthquake. Adv. Mater. Res. 2012, 368–373, 1819–1822. [Google Scholar] [CrossRef]
  77. Bashawri, A. An overview of the design of disaster relief shelters. Procedia Econ. Financ. 2014, 18, 924–931. [Google Scholar] [CrossRef] [Green Version]
Figure 1. The integrated decision support model.
Mathematics 09 01897 g001
Figure 2. The framework of the emergency shelter location–allocation.
Mathematics 09 01897 g002
Figure 3. Multi-level coverage function.
Mathematics 09 01897 g003
Figure 4. Location of (a) Chengdu in Sichuan Province and (b) Wuhou District in Chengdu.
Mathematics 09 01897 g004
Figure 5. The geographical location of demand points, shelters, and distribution centers.
Mathematics 09 01897 g005
Figure 6. The first stage optimal Pareto solution.
Mathematics 09 01897 g006
Figure 7. Deviation from the target value under different target weights.
Mathematics 09 01897 g007
Figure 8. The second stage optimal Pareto solution.
Mathematics 09 01897 g008
Table 1. Qualitative factors of shelter planning.
FactorsReference
TopographyKılcı et al. [55], Trivedi and Singh [36], Xu et al. [49], Amin Hosseini et al. [50]
Geological typeKılcı et al. [55], Trivedi and Singh [36], Amin Hosseini et al. [50]
SlopeKılcı et al. [55], Trivedi and Singh [36], Knay et al. [51]
VegetationLi et al. [3], Yahyaei and Bozorgi-Amiri [52], GB/T33744-2017 [53]
Power facilitiesLi et al. [3], Knay et al. [51], GB/T33744-2017 [53], Gu et al. [54]
Table 2. Linguistic judgements and their fuzzy values.
Linguistic JudgementTrapezoidal Fuzzy ScaleRateTrapezoidal Fuzzy Scale
Low(0, 0.1, 0.2, 0.3)Poor(0, 0.1, 0.2, 0.3)
Medium Low(0.2, 0.3, 0.3, 0.4)Medium Poor(0.2, 0.3, 0.3, 0.4)
Medium(0.3, 0.4, 0.5, 0.6)Fair(0.3, 0.4, 0.5, 0.6)
Medium High(0.5, 0.6, 0.7, 0.8)Medium Good(0.5, 0.6, 0.7, 0.8)
High(0.8, 0.9, 0.9, 1)Good(0.8, 0.9, 0.9, 1)
Table 3. The definition of the sets, parameters, and decision variables.
SetsDefinition (Unit)
I Set of potential emergency shelters
J Set of demand points
E Set of distribution centers
T Stages of emergency shelters planning ( t = 1 , 2 )
A Set of services provided by the shelters, a = 1 basic service of shelter and a = 2 medical and psychological attention
M Set of supplies delivered by the distribution centers, m = 1 basic living materials and m = 2 medical materials
I a 1 Set of a-type shelters obtained in the first stage
Parameters
B t Total rescue budget for emergency shelters in the t stage ($)
C a p i Number of evacuees that can be accommodated in shelter i
C a p e m The number of material m that the distribution center e can provide
d j i Distance between the demand point j and the shelter i (m)
d i e Distance between the shelter i and the distribution center e (m)
d i i Distance between the shelter i and the shelter i′ (m)
D i a 1 The number of victims for service a from the shelter i at the end of the first stage
D j a 1 The number of victims in the demand point j requiring service a in the first stage
F C Fixed costs of opening emergency shelters ($)
Q i Coefficients related to evaluation scores for the shelter i based on fuzzy-VIKOR technique, the smaller the Q i index, the better the expected performance of the shelter
γ m a Quantity of materials m needed by evacuees requiring service a
V C a The variable unit cost of a-type services provided by emergency shelters ($)
ν t Minimum material satisfaction rate in the t stage (%)
θ k Radius from the demand point to the kth coverage level (m)
p k The proportion of demand covered by shelters in the interval ( d k 1 , d k ) from the demand point (%)
β 1 The proportion of evacuees moved from temporary medical shelters to short-term living shelters (%)
β 2 The proportion of evacuees moved from temporary living shelters to short-term medical shelters (%)
Decision Variables
X j i a 1 The number of evacuees going from demand point j to the shelter i requiring service a.
Y e i m t The number of the material m delivered by the distribution center e to the shelter i in the t stage
X i i a 2 The number of a-type evacuees going from the temporary shelter i to the short-term shelter i′ in the second stage
Z i a t 1 if shelter i is selected as type a in the t stage and 0 otherwise
Table 4. Cost parameters used in the case study.
CostValue
Fixed costs of opening emergency shelters$10,000
The variable unit cost of providing basic services$50
The variable unit cost of providing medical and psychological services$100
Table 5. Population data requiring evacuation.
ID1-Type2-TypeID1-Type2-Type
D0143001600D111210510
D021100510D121000430
D03630260D13740320
D041180500D14580230
D052200935D15717305
D061190510D161080456
D071846938D17673298
D081562640D18380160
D09940300D191090470
D101480634D201200255
Table 6. Shelter capacity distributions.
ID1-Type2-TypeID1-Type2-Type
S0180004750S0942002500
S0295005700S1044002640
S0313,7308240S1160003600
S0435302200S1251103100
S0547002800S1367004100
S0622701400S1410,6006400
S0731001850S1537302300
S0872704400
Table 7. The linguistic values of each criterion.
Decision-MakersCriteria
TopographyGeographical TypeSlopeVegetationPower Facilities
DM 1MediumMedium HighHighMediumMedium High
DM 2Medium HighHighMedium HighMediumHigh
DM 3Medium HighHighHighMedium LowMedium High
Table 8. The linguistic values of each criterion.
Candidate SheltersDecision-MakersCriteria
TopographyGeographical TypeSlopeVegetationPower Facilities
S01DM 1FairMedium GoodFairMedium GoodFair
DM 2FairFairFairMedium GoodMedium Poor
DM 3Medium GoodFairFairMedium GoodMedium Poor
S02DM 1Medium GoodMedium GoodFairMedium PoorFair
DM 2Medium GoodMedium GoodFairFairFair
DM 3FairGoodMedium GoodFairFair
S03DM 1Medium GoodFairFairFairGood
DM 2Medium GoodFairFairFairGood
DM 3FairMedium GoodMedium PoorFairGood
S04DM 1FairMedium GoodMedium PoorPoorMedium Poor
DM 2Medium GoodGoodFairPoorMedium Poor
DM 3Medium GoodMedium GoodMedium PoorPoorMedium Poor
S05DM 1PoorMedium PoorMedium PoorFairMedium Poor
DM 2PoorFairMedium PoorMedium PoorPoor
DM 3Medium PoorMedium PoorMedium PoorMedium PoorPoor
S06DM 1GoodMedium PoorMedium PoorMedium GoodFair
DM 2GoodFairPoorMedium GoodMedium Poor
DM 3Medium GoodFairMedium PoorGoodMedium Poor
S07DM 1FairMedium GoodFairMedium PoorFair
DM 2Medium PoorMedium GoodFairFairFair
DM 3Medium PoorMedium GoodFairFairMedium Poor
S08DM 1PoorMedium PoorGoodMedium GoodGood
DM 2PoorMedium PoorMedium GoodMedium GoodMedium Good
DM 3PoorMedium PoorGoodGoodMedium Good
S09DM 1FairMedium GoodGoodFairFair
DM 2Medium GoodMedium GoodMedium GoodFairFair
DM 3Medium GoodGoodGoodFairFair
S10DM 1Medium GoodFairMedium GoodFairGood
DM 2Medium GoodFairFairFairGood
DM 3FairFairFairFairGood
S11DM 1Medium PoorMedium GoodFairMedium GoodFair
DM 2Medium PoorFairFairGoodFair
DM 3PoorFairMedium GoodGoodMedium Poor
S12DM 1Medium GoodMedium GoodFairGoodGood
DM 2Medium GoodMedium GoodFairMedium GoodGood
DM 3FairGoodMedium GoodMedium GoodMedium Good
S13DM 1FairFairFairGoodMedium Poor
DM 2FairFairMedium GoodGoodFair
DM 3Medium PoorMedium GoodFairGoodFair
S14DM 1GoodFairMedium GoodFairFair
DM 2GoodMedium GoodGoodFairFair
DM 3Medium GoodMedium GoodMedium GoodFairFair
S15DM 1FairMedium GoodGoodMedium GoodGood
DM 2FairMedium GoodMedium GoodGoodGood
DM 3Medium PoorFairGoodGoodGood
Table 9. Fuzzy values of linguistic terms of criteria.
Decision-MakersCriteria
TopographyGeographical TypeSlopeVegetationPower Facilities
DM 1(0.3, 0.4, 0.5, 0.6)(0.5, 0.6, 0.7, 0.8)(0.8, 0.9, 0.9, 1)(0.3, 0.4, 0.5, 0.6)(0.5, 0.6, 0.7, 0.8)
DM 2(0.5, 0.6, 0.7, 0.8)(0.8, 0.9, 0.9, 1)(0.5, 0.6, 0.7, 0.8)(0.5, 0.6, 0.7, 0.8)(0.8, 0.9, 0.9, 1)
DM 3(0.5, 0.6, 0.7, 0.8)(0.8, 0.9, 0.9, 1)(0.8, 0.9, 0.9, 1)(0.2, 0.3, 0.3, 0.4)(0.5, 0.6, 0.7, 0.8)
Table 10. Fuzzy values of linguistic terms of candidate shelters.
Candidate SheltersDecision-MakersCriteria
TopographyGeographical TypeSlopeVegetationPower Facilities
S01DM 1(0.3, 0.4, 0.5, 0.6)(0.5, 0.6, 0.7, 0.8)(0.3, 0.4, 0.5, 0.6)(0.5, 0.6, 0.7, 0.8)(0.3, 0.4, 0.5, 0.6)
DM 2(0.3, 0.4, 0.5, 0.6)(0.3, 0.4, 0.5, 0.6)(0.3, 0.4, 0.5, 0.6)(0.5, 0.6, 0.7, 0.8)(0.2, 0.3, 0.3, 0.4)
DM 3(0.5, 0.6, 0.7, 0.8)(0.3, 0.4, 0.5, 0.6)(0.3, 0.4, 0.5, 0.6)(0.5, 0.6, 0.7, 0.8)(0.2, 0.3, 0.3, 0.4)
S02DM 1(0.5, 0.6, 0.7, 0.8)(0.5, 0.6, 0.7, 0.8)(0.3, 0.4, 0.5, 0.6)(0.2, 0.3, 0.3, 0.4)(0.3, 0.4, 0.5, 0.6)
DM 2(0.5, 0.6, 0.7, 0.8)(0.5, 0.6, 0.7, 0.8)(0.3, 0.4, 0.5, 0.6)(0.3, 0.4, 0.5, 0.6)(0.3, 0.4, 0.5, 0.6)
DM 3(0.3, 0.4, 0.5, 0.6)(0.8, 0.9, 0.9, 1)(0.5, 0.6, 0.7, 0.8)(0.3, 0.4, 0.5, 0.6)(0.3, 0.4, 0.5, 0.6)
S03DM 1(0.5, 0.6, 0.7, 0.8)(0.3, 0.4, 0.5, 0.6)(0.3, 0.4, 0.5, 0.6)(0.3, 0.4, 0.5, 0.6)(0.8, 0.9, 0.9, 1)
DM 2(0.5, 0.6, 0.7, 0.8)(0.3, 0.4, 0.5, 0.6)(0.3, 0.4, 0.5, 0.6)(0.3, 0.4, 0.5, 0.6)(0.8, 0.9, 0.9, 1)
DM 3(0.3, 0.4, 0.5, 0.6)(0.5, 0.6, 0.7, 0.8)(0.2, 0.3, 0.3, 0.4)(0.3, 0.4, 0.5, 0.6)(0.8, 0.9, 0.9, 1)
S04DM 1(0.3, 0.4, 0.5, 0.6)(0.5, 0.6, 0.7, 0.8)(0.3, 0.4, 0.5, 0.6)(0, 0.1, 0.2, 0.3)(0.2, 0.3, 0.3, 0.4)
DM 2(0.3, 0.4, 0.5, 0.6)(0.8, 0.9, 0.9, 1)(0.3, 0.4, 0.5, 0.6)(0, 0.1, 0.2, 0.3)(0.2, 0.3, 0.3, 0.4)
DM 3(0.5, 0.6, 0.7, 0.8)(0.5, 0.6, 0.7, 0.8)(0.3, 0.4, 0.5, 0.6)(0, 0.1, 0.2, 0.3)(0.2, 0.3, 0.3, 0.4)
S05DM 1(0, 0.1, 0.2, 0.3)(0.2, 0.3, 0.3, 0.4)(0.2, 0.3, 0.3, 0.4)(0.3, 0.4, 0.5, 0.6)(0.2, 0.3, 0.3, 0.4)
DM 2(0, 0.1, 0.2, 0.3)(0.3, 0.4, 0.5, 0.6)(0.2, 0.3, 0.3, 0.4)(0.2, 0.3, 0.3, 0.4)(0, 0.1, 0.2, 0.3)
DM 3(0.2, 0.3, 0.3, 0.4)(0.2, 0.3, 0.3, 0.4)(0.2, 0.3, 0.3, 0.4)(0.2, 0.3, 0.3, 0.4)(0, 0.1, 0.2, 0.3)
S06DM 1(0.8, 0.9, 0.9, 1)(0.2, 0.3, 0.3, 0.4)(0.2, 0.3, 0.3, 0.4)(0.5, 0.6, 0.7, 0.8)(0.3, 0.4, 0.5, 0.6)
DM 2(0.8, 0.9, 0.9, 1)(0.3, 0.4, 0.5, 0.6)(0, 0.1, 0.2, 0.3)(0.5, 0.6, 0.7, 0.8)(0.2, 0.3, 0.3, 0.4)
DM 3(0.5, 0.6, 0.7, 0.8)(0.3, 0.4, 0.5, 0.6)(0.2, 0.3, 0.3, 0.4)(0.8, 0.9, 0.9, 1)(0.2, 0.3, 0.3, 0.4)
S07DM 1(0.3, 0.4, 0.5, 0.6)(0.5, 0.6, 0.7, 0.8)(0.3, 0.4, 0.5, 0.6)(0.2, 0.3, 0.3, 0.4)(0.3, 0.4, 0.5, 0.6)
DM 2(0.2, 0.3, 0.3, 0.4)(0.5, 0.6, 0.7, 0.8)(0.3, 0.4, 0.5, 0.6)(0.3, 0.4, 0.5, 0.6)(0.3, 0.4, 0.5, 0.6)
DM 3(0.2, 0.3, 0.3, 0.4)(0.5, 0.6, 0.7, 0.8)(0.3, 0.4, 0.5, 0.6)(0.3, 0.4, 0.5, 0.6)(0.2, 0.3, 0.3, 0.4)
S08DM 1(0, 0.1, 0.2, 0.3)(0.2, 0.3, 0.3, 0.4)(0.8, 0.9, 0.9, 1)(0.5, 0.6, 0.7, 0.8)(0.8, 0.9, 0.9, 1)
DM 2(0, 0.1, 0.2, 0.3)(0.2, 0.3, 0.3, 0.4)(0.5, 0.6, 0.7, 0.8)(0.5, 0.6, 0.7, 0.8)(0.5, 0.6, 0.7, 0.8)
DM 3(0, 0.1, 0.2, 0.3)(0.2, 0.3, 0.3, 0.4)(0.8, 0.9, 0.9, 1)(0.8, 0.9, 0.9, 1)(0.5, 0.6, 0.7, 0.8)
S09DM 1(0.3, 0.4, 0.5, 0.6)(0.5, 0.6, 0.7, 0.8)(0.8, 0.9, 0.9, 1)(0.3, 0.4, 0.5, 0.6)(0.3, 0.4, 0.5, 0.6)
DM 2(0.5, 0.6, 0.7, 0.8)(0.5, 0.6, 0.7, 0.8)(0.5, 0.6, 0.7, 0.8)(0.3, 0.4, 0.5, 0.6)(0.3, 0.4, 0.5, 0.6)
DM 3(0.5, 0.6, 0.7, 0.8)(0.8, 0.9, 0.9, 1)(0.8, 0.9, 0.9, 1)(0.3, 0.4, 0.5, 0.6)(0.3, 0.4, 0.5, 0.6)
S10DM 1(0.5, 0.6, 0.7, 0.8)(0.3, 0.4, 0.5, 0.6)(0.5, 0.6, 0.7, 0.8)(0.3, 0.4, 0.5, 0.6)(0.8, 0.9, 0.9, 1)
DM 2(0.5, 0.6, 0.7, 0.8)(0.3, 0.4, 0.5, 0.6)(0.3, 0.4, 0.5, 0.6)(0.3, 0.4, 0.5, 0.6)(0.8, 0.9, 0.9, 1)
DM 3(0.3, 0.4, 0.5, 0.6)(0.3, 0.4, 0.5, 0.6)(0.3, 0.4, 0.5, 0.6)(0.3, 0.4, 0.5, 0.6)(0.8, 0.9, 0.9, 1)
S11DM 1(0.2, 0.3, 0.3, 0.4)(0.5, 0.6, 0.7, 0.8)(0.3, 0.4, 0.5, 0.6)(0.5, 0.6, 0.7, 0.8)(0.3, 0.4, 0.5, 0.6)
DM 2(0.2, 0.3, 0.3, 0.4)(0.3, 0.4, 0.5, 0.6)(0.3, 0.4, 0.5, 0.6)(0.5, 0.6, 0.7, 0.8)(0.3, 0.4, 0.5, 0.6)
DM 3(0, 0.1, 0.2, 0.3)(0.3, 0.4, 0.5, 0.6)(0.5, 0.6, 0.7, 0.8)(0.8, 0.9, 0.9, 1)(0.2, 0.3, 0.3, 0.4)
S12DM 1(0.5, 0.6, 0.7, 0.8)(0.5, 0.6, 0.7, 0.8)(0.3, 0.4, 0.5, 0.6)(0.8, 0.9, 0.9, 1)(0.8, 0.9, 0.9, 1)
DM 2(0.5, 0.6, 0.7, 0.8)(0.5, 0.6, 0.7, 0.8)(0.3, 0.4, 0.5, 0.6)(0.5, 0.6, 0.7, 0.8)(0.8, 0.9, 0.9, 1)
DM 3(0.3, 0.4, 0.5, 0.6)(0.8, 0.9, 0.9, 1)(0.5, 0.6, 0.7, 0.8)(0.5, 0.6, 0.7, 0.8)(0.5, 0.6, 0.7, 0.8)
S13DM 1(0.3, 0.4, 0.5, 0.6)(0.3, 0.4, 0.5, 0.6)(0.3, 0.4, 0.5, 0.6)(0.8, 0.9, 0.9, 1)(0.2, 0.3, 0.3, 0.4)
DM 2(0.3, 0.4, 0.5, 0.6)(0.3, 0.4, 0.5, 0.6)(0.5, 0.6, 0.7, 0.8)(0.8, 0.9, 0.9, 1)(0.3, 0.4, 0.5, 0.6)
DM 3(0.2, 0.3, 0.3, 0.4)(0.5, 0.6, 0.7, 0.8)(0.3, 0.4, 0.5, 0.6)(0.8, 0.9, 0.9, 1)(0.3, 0.4, 0.5, 0.6)
S14DM 1(0.8, 0.9, 0.9, 1)(0.3, 0.4, 0.5, 0.6)(0.5, 0.6, 0.7, 0.8)(0.3, 0.4, 0.5, 0.6)(0.3, 0.4, 0.5, 0.6)
DM 2(0.8, 0.9, 0.9, 1)(0.5, 0.6, 0.7, 0.8)(0.8, 0.9, 0.9, 1)(0.3, 0.4, 0.5, 0.6)(0.3, 0.4, 0.5, 0.6)
DM 3(0.5, 0.6, 0.7, 0.8)(0.5, 0.6, 0.7, 0.8)(0.5, 0.6, 0.7, 0.8)(0.3, 0.4, 0.5, 0.6)(0.3, 0.4, 0.5, 0.6)
S15DM 1(0.3, 0.4, 0.5, 0.6)(0.5, 0.6, 0.7, 0.8)(0.8, 0.9, 0.9, 1)(0.5, 0.6, 0.7, 0.8)(0.8, 0.9, 0.9, 1)
DM 2(0.3, 0.4, 0.5, 0.6)(0.5, 0.6, 0.7, 0.8)(0.5, 0.6, 0.7, 0.8)(0.8, 0.9, 0.9, 1)(0.8, 0.9, 0.9, 1)
DM 3(0.2, 0.3, 0.3, 0.4)(0.3, 0.4, 0.5, 0.6)(0.8, 0.9, 0.9, 1)(0.8, 0.9, 0.9, 1)(0.8, 0.9, 0.9, 1)
Table 11. Crisp values of candidate shelters.
Criteria
TopographyGeographical TypeSlopeVegetationPower Facilities
S010.540.540.450.650.38
S020.560.740.540.40.45
S030.560.540.40.450.9
S040.560.740.450.150.3
S050.20.380.30.380.2
S060.770.40.220.740.38
S070.380.650.450.40.4
S080.150.30.770.740.74
S090.560.740.770.450.45
S100.560.450.540.450.9
S110.220.540.540.770.4
S120.560.740.540.740.77
S130.40.540.540.90.4
S140.770.560..740.450.45
S150.40.560.770.770.9
Table 12. The objective weights.
Criteria
TopographyGeographical TypeSlopeVegetationPower Facilities
e j 0.970.990.980.970.97
d i v j 0.030.010.020.030.03
w j o 0.250.10.160.220.28
Table 13. The normalized values of weights and the candidate shelter rate.
Criteria
TopographyGeographical TypeSlopeVegetationPower Facilities
w j (0.3, 0.53, 0.63, 0.8)(0.5, 0.8, 0.83, 1)(0.5, 0.8, 0.83, 1)(0.2, 0.37, 0.43, 0.6)(0.5, 0.7, 0.77, 1)
S01(0.3, 0.47, 0.57, 0.8)(0.3, 0.47, 0.57, 0.8)(0.3, 0.4, 0.5, 0.6)(0.5, 0.6, 0.7, 0.8)(0.2, 0.33, 0.37, 0.6)
S02(0.3, 0.53, 0.63, 0.8)(0.5, 0.7, 0.77, 1)(0.3, 0.47, 0.57, 0.8)(0.2, 0.37, 0.43, 0.6)(0.3, 0.4, 0.5, 0.6)
S03(0.3, 0.53, 0.63, 0.8)(0.3, 0.47, 0.57, 0.8)(0.2, 0.37, 0.43, 0.6)(0.3, 0.4, 0.5, 0.6)(0.8, 0.9, 0.9, 1)
S04(0.3, 0.53, 0.63, 0.8)(0.5, 0.7, 0.77, 1)(0.3, 0.4, 0.5, 0.6)(0, 0.1, 0.2, 0.3)(0.2, 0.3, 0.3, 0.4)
S05(0, 0.17, 0.23, 0.4)(0.2, 0.33, 0.37, 0.6)(0.2, 0.3, 0.3, 0.4)(0.2, 0.33, 0.37, 0.6)(0, 0.17, 0.23, 0.4)
S06(0.5, 0.8, 0.83, 1)(0.2, 0.37, 0.43, 0.6)(0, 0.23, 0.27, 0.4)(0.5, 0.7, 0.77, 1)(0.2, 0.33, 0.37, 0.6)
S07(0.2, 0.33, 0.37, 0.6)(0.5, 0.6, 0.7, 0.8)(0.3, 0.4, 0.5, 0.6)(0.2, 0.37, 0.43, 0.6)(0.2, 0.37, 0.43, 0.6)
S08(0, 0.1, 0.2, 0.3)(0.2, 0.3, 0.3, 0.4)(0.5, 0.8, 0.83, 1)(0.5, 0.7, 0.77, 1)(0.5, 0.7, 0.77, 1)
S09(0.3, 0.53, 0.63, 0.8)(0.5, 0.7, 0.77, 1)(0.5, 0.8, 0.83, 1)(0.3, 0.4, 0.5, 0.6)(0.3, 0.4, 0.5, 0.6)
S10(0.3, 0.53, 0.63, 0.8)(0.3, 0.4, 0.5, 0.6)(0.3, 0.47, 0.57, 0.8)(0.3, 0.4, 0.5, 0.6)(0.8, 0.9, 0.9, 1)
S11(0, 0.23, 0.27, 0.4)(0.3, 0.47, 0.57, 0.8)(0.3, 0.47, 0.57, 0.8)(0.5, 0.8, 0.83, 1)(0.2, 0.37, 0.43, 0.6)
S12(0.3, 0.53, 0.63, 0.8)(0.5, 0.7, 0.77, 1)(0.3, 0.47, 0.57, 0.8)(0.5, 0.7, 0.77, 1)(0.5, 0.8, 0.83, 1)
S13(0.2, 0.37, 0.43, 0.6)(0.3, 0.47, 0.57, 0.8)(0.3, 0.47, 0.57, 0.8)(0.8, 0.9, 0.9, 1)(0.2, 0.37, 0.43, 0.6)
S14(0.5, 0.8, 0.83, 1)(0.3, 0.53, 0.63, 0.8)(0.5, 0.8, 0.83, 1)(0.5, 0.8, 0.83, 1)(0.8, 0.9, 0.9, 1)
S15(0.2, 0.37, 0.43, 0.6)(0.3, 0.53, 0.63, 0.8)(0.5, 0.8, 0.83, 1)(0.5, 0.8, 0.83, 1)(0.8, 0.9, 0.9, 1)
Table 14. Crisp decision matrix.
Criteria
TopographyGeographical TypeSlopeVegetationPower Facilities
S010.600.460.370.280.32
S020.360.620.460.190.36
S030.360.460.340.190.69
S040.150.360.320.190.18
S050.150.360.320.190.18
S060.480.350.200.330.32
S070.250.530.370.190.33
S080.110.250.640.330.60
S090.360.620.640.200.36
S100.360.370.460.200.69
S110.160.460.460.340.33
S120.360.620.460.330.62
S130.260.460.460.370.33
S140.650.650.950.250.51
S150.260.480.640.340.69
Table 15. The values of the fuzzy-VIKOR index.
S01S02S03S04S05S06S07S08S09S10S11S12S13S14S15
Q i 0.630.370.670.690.030.880.710.840.850.600.750.440.5900.38
Table 16. The plan obtained under the best suitability of emergency shelters.
Selection1-Type010100010001100
2-Type100010001010010
S01S02S03S04S05S06S07S08S09S10S11S12S13S14S15
D011-Type043000000000000000
2-Type13800002200000000000
D021-Type000000000000110000
2-Type00000000005100000
D031-Type0000000472000158000
2-Type00000000000002600
D041-Type000000000000118000
2-Type3750000000001250000
D051-Type000110000000001100000
2-Type7010002340000000000
D061-Type000000011900000000
2-Type3820000000001280000
D071-Type018460000000000000
2-Type00000000000009380
D081-Type000000015620000000
2-Type0000320000000003200
D091-Type00000009400000000
2-Type00000000000003000
D101-Type00014800000 00004750
2-Type00000000159000000
D111-Type0000000605000060500
2-Type00000000000005100
D121-Type000000000000100000
2-Type0000000021502150000
D131-Type00000000000740000
2-Type00000000000003200
D141-Type05800000000000000
2-Type172000000000580000
D151-Type07170000000000000
2-Type00000000000003050
D161-Type000000000001080000
2-Type45600000000000000
D171-Type0336000000000033700
2-Type00000000002980000
D181-Type0190000000000019000
2-Type00000000001600000
D191-Type0817000000000027300
2-Type0000235000002350000
D201-Type0000000600000600000
2-Type25500000000000000
Table 17. Deviations in different solutions in the first stage.
NumberObjective WeightsSuitabilityDistance
1(1, 1)60.22%3.57%
2(1, 0.72)53.16%8.70%
3(1, 0.49)40.71%15.01%
4(1, 0.36)27.51%21.53%
5(1, 0.30)16.36%26.32%
6(1, 0.24)038.71%
Table 18. Solution with the maximum number of short-term shelters to be open.
Selection1-Type011101010001100
2-Type100010101110011
S01S02S03S04S05S06S07S08S09S10S11S12S13S14S15
S011-Type0930000931000000000
2-Type0010590002010006010000
S021-Type003954000000000131800
2-Type00005320175700001225000
S031-Type000000000000000
2-Type000000000000000
S041-Type000154800000000000
2-Type0000009308720000067
S051-Type34500000000000000
2-Type00000000003450000
S061-Type157000046904680000000
2-Type00000000000000468
S071-Type00160000000000000
2-Type000000000012000400
S081-Type000114200011420000000
2-Type00381000000000011420
S091-Type00187000000000000
2-Type000014000000470000
S101-Type00032000310000000
2-Type0000000000000630
S111-Type0040100000000040100
2-Type0000000002016010000
S121-Type00165500552000000000
2-Type00000000368011030000
S131-Type000000028110000000
2-Type00004140000001460000
S141-Type0085700857000000000
2-Type000017140000000000
S151-Type000000000000000
2-Type000000000000000
Table 19. Solution with the minimum number of short-term shelters to be open.
Selection1-Type001100000000101
2-Type100000001100010
S01S02S03S04S05S06S07S08S09S10S11S12S13S14S15
S011-Type008590000000004010601
2-Type000000001861000000
S021-Type003461000000000181100
2-Type000000000000035140
S031-Type000000000000000
2-Type000000000000000
S041-Type00038700000000001161
2-Type2580000000000007140
S051-Type0001720000000017300
2-Type34500000000000000
S061-Type0046800000000000469
2-Type0000000015700004680
S071-Type00160000000000000
2-Type00000000000001600
S081-Type00571000000000001713
2-Type00000000038100011420
S091-Type00187000000000000
2-Type00000000000001870
S101-Type0006300000000000
2-Type0000000000000630
S111-Type0004010000000040100
2-Type00000000080200000
S121-Type001104000000000110300
2-Type11030000000368000000
S131-Type000000000000281100
2-Type85900000000101500000
S141-Type001714000000000000
2-Type162200000000000000
S151-Type000000000000000
2-Type000000000000000
Table 20. Deviations in different solutions in the second stage.
NumberObjective WeightsDistanceNumber
1(1, 1)31.35%12.50%
2(1, 0.5)27.00%25.00%
3(1, 0.25)19.92%37.50%
4(1, 0.17)8.62%50.00%
Publisher’s Note: MDPI stays neutral with regard to jurisdictional claims in published maps and institutional affiliations.

