Abstract
The increasing consumption of fossil fuel resources in the world has placed emphasis on flow measurements in the oil industry. This has generated a growing niche in the flowmeter industry. In this regard, in this study, an artificial neural network (ANN) and various feature extractions have been utilized to enhance the precision of X-ray radiation-based two-phase flowmeters. The detection system proposed in this article comprises an X-ray tube, a NaI detector to record the photons, and a Pyrex-glass pipe, which is placed between detector and source. To model the mentioned geometry, the Monte Carlo MCNP-X code was utilized. Five features in the time domain were derived from the collected data to be used as the neural network input. Multi-Layer Perceptron (MLP) was applied to approximate the function related to the input-output relationship. Finally, the introduced approach was able to correctly recognize the flow pattern and predict the volume fraction of two-phase flow’s components with root mean square error (RMSE), mean absolute error (MAE), and mean absolute percentage error (MAPE) of less than 0.51, 0.4 and 1.16%, respectively. The obtained precision of the proposed system in this study is better than those reported in previous works.
1. Introduction
Optimization of separation processes is not possible except with enough knowledge of the quantitative measurement of gas and oil components. The type of flow pattern impacts the efficiency of the separation process in such a way that the percentage of each component indicates whether the drilling needs to be stopped or not. The mixture of gamma radiation and ANNs have contributed in a lot of researches as a practical tool [1,2,3,4,5,6,7]. In [1], a calculation of volumetric percentages in three-phase flows was performed by using a dual-energy source and three detectors. Simulations were performed by MCNP-4C code. In addition, Abro and Johansen [2] researched the gas volume ratio by measuring two-phase flows. Their method consisted of a single 241Am source and three detectors. The MRE% achieved was less than 3%. Adineh et al. presented a method to study the two-phase flow by a two-detector model of NaI and a single 137Cs source [3]. The use of feature extraction methods can definitely lead to a qualitative improvement in the accuracy of flowmetry. In this regard, Sattari et al. [4] introduced a 137Cs source and a single NaI detector to perform the flow measurement. In the research, the input ports of the GMDH neural network were time-domain features, which were extracted from the recorded spectrum. In similar studies, to establish the volume percentages and type of flow patterns with high accuracy, researchers evaluated many time- and frequency-domain characteristics, and they presented the best separator characteristics using an innovative method [5,6]. Some structures of MLP neural networks were investigated for the volume fraction calculation in 3-phase flows [7]. In that research, annular and homogeneous flow patterns were considered as the main flow regime. Complete diagnosis of the kind of flow regime and determining the volume fraction with an RMSE of 1.28 were the research findings. In addition to radioisotope sources, it has been proved that X-ray tubes can be potentially used in radiation-based multiphase flowmeters [8,9]. The X-ray tube has some advantages over radioisotope sources, for example, it has the capability of energy adjustment of emitted photons, it releases photons more intensely than fundamental radioisotope sources; it has the capability of turning on and off, etc.
Although X-ray radiation-based two-phase flowmeters have a lot of advantages over the radioisotope-based ones, they suffer from lower measurement accuracy. One reason might be that the registered X-ray spectrum has been analyzed in a simple way. The X-ray sources generate multi-energy photons despite radioisotopes that generate single energy photons. Therefore, data analysis of radioisotope sources would be easier than X-ray ones. As mentioned, one of the problems researchers have encountered is the lower measurement accuracy of the X-ray radiation-based two-phase flowmeters. The current project’s goal is to resolve this problem by improving the precision of the X-ray radiation-based two-phase flowmeter using an artificial neural network (ANN) and feature extraction techniques.
In Section 2.1, the details of the modeled detection system, including one X-ray tube and one detector, will be discussed. Section 2.2 and Section 2.3 are dedicated to processing and extracting features of the registered signals. In Section 2.4, the employment of ANN for flow pattern identification and volume ratio prediction will be explained. The results of all four sub-sections in part 2, will be discussed in Section 3. Figure 1 depicts the flowchart of the presented methodology used in the current investigation.
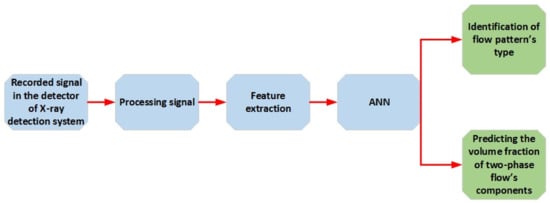
Figure 1.
Flowchart of the presented methodology in this investigation.
2. Materials and Methods
2.1. X-ray System
In present article, the detection system that is consisted of an X-ray tube and a NaI detector which are located on both sides of the Pyrex-glass pipe, was modeled using the MCNP code. This code has been employed for modeling measuring instruments based on ionizing radiation [10,11,12,13,14,15,16].
In Figure 2, a geometric sketch of the designed system is shown. The emitted photons from the X-ray tube pass through the pipe, in which the two-phase flow components are being examined, and then, the portion of them that is not attenuated inside the pipe is detected by the detector. In fact, the attenuation of the radiation beam is based on the quantity of gas and liquid components inside the pipe.
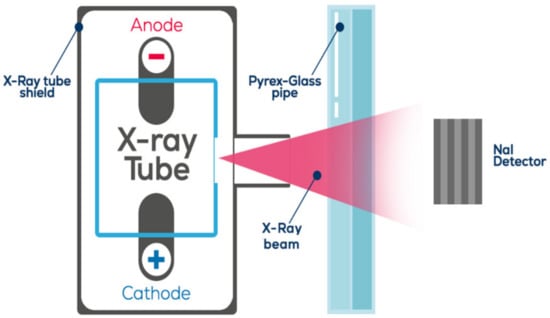
Figure 2.
Modeled detection system using the MCNP code.
Since perfect modeling of an industrial X-ray tube including a cathode (electron source) and an anode (tungsten target) embedded in a cylindrical shield, using the MCNPX code is time consuming, in this work, a more efficient geometry including a photon source mounted inside a metal shield was defined. In other words, since photon tracking in the MCNPX code is much faster than electron tracking, a photon source mounted in a metal shield was just deemed in the present investigation instead of modeling the cathode-anode accumulation. To provide the X-ray energy spectrum for the photon source, the acquired spectrum by the TASMIC, a free software represented by Hernandez et al. [17], was employed. The employed X-ray spectrum including the X-ray characteristic peaks related to the tungsten anode is depicted in Figure 3. Fundamentally, the X-ray tube’s cylinder-shaped shields are usually made of steel or lead to prevent leakage of radiation. On the shield surface, a section is left open, which is described as the output window to emit congenially produced X-ray photons. The output window’s radius of the simulated X-ray in this study is 5 cm. To filter the low energy photons with the aim of reducing scattering, an aluminum filter having 2.5 mm thickness was embedded in front of the output window.
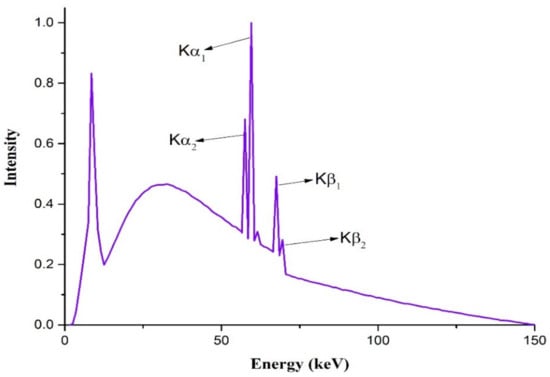
Figure 3.
The applied X-ray energy spectrum in simulations obtained by the TASMIC package [17].
2.2. Signal Processing
In this investigation, 3 typical flow patterns (shown in Figure 4) and 19 different volume fractions from 5% void fraction to 95% with the step of 5%, are simulated (57 simulations were used in total). As an example, the recorded spectra in the detector for the 4 different void fractions of 25%, 45%, 65%, and 95% are shown in Figure 5.
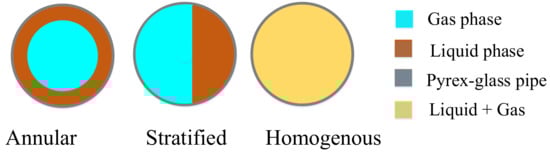
Figure 4.
Simulated flow regimes.
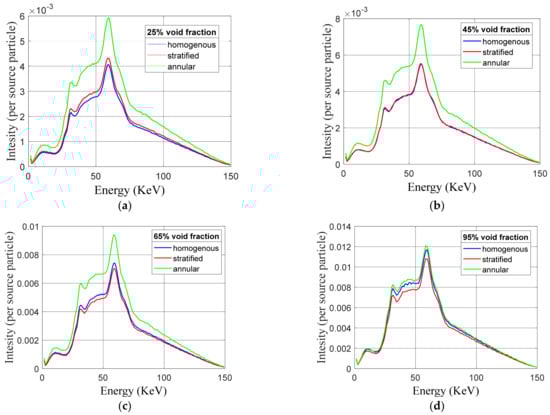
Figure 5.
Recorded spectra in the detector for different void fractions of: (a) 25%, (b) 45%, (c) 65%, (d) 95%.
The tremendous data are collected for each simulation, as can be seen in Figure 5. In this context, to minimize the amount of data and preserve the data specifications simultaneously, the feature extraction techniques in the time domain have been employed. The extracted aspects are explained in detail in the following sections.
2.3. Feature Extraction
In this scrutiny, 12 time-domain characteristics (average value, variance, 4th-order moment, root mean square, skewness, kurtosis, median, waveform length (WL), SSR, MSR, SVER, and maximum value) were extracted from the recorded data. These characteristics were used as network inputs to determine the flow pattern and the volume percentages. Therefore, an attempt was made to determine the efficient characteristics. To do this, various neural networks were configured with different combinations of the extracted features, and finally, it was observed that use of the Variance, Skewness, Kurtosis, SSR, and SVER can provide sufficient and high accuracy in detecting the mentioned parameters.
Five effective characteristics were extracted from the registered signals using the following equations. , where is the number of datasets:
- Variance:
- Skewness:
- Kurtosis:
- Summation of square roots (SSR):
- Summation of variable exponent roots (SVER):
The extracted features are indicated in Figure 6.
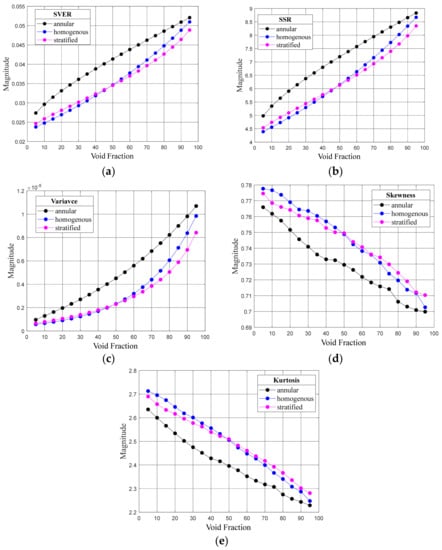
Figure 6.
Extracted characteristics: (a) SVER, (b) SSR, (c) variance, (d) skewness, (e) kurtosis.
Two variables that are uncorrelated are not certainly independent, however, they may have a nonlinear relationship. In fact, two variables that have a little or insufficient correlation may have a strong nonlinear relationship. Since in this study there is not sufficient linear relation between the input and target, an MLP network with nonlinear parameters was used to find the relationship between input and output with high accuracy. Correlation analysis of each feature with respect to the target value is shown in Figure 7.
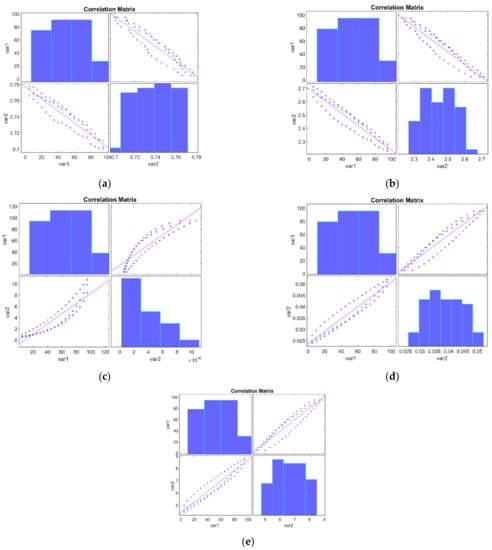
Figure 7.
Correlation analysis of extracted features: (a) Skewness, (b) Kurtosis, (c) Variance, (d) SVER, and (e) SSR.
2.4. Artificial Intelligence
In the last few years, various computational techniques have been utilized for various applications in the engineering research area [18,19,20,21,22,23,24,25,26,27,28,29,30,31,32]. In this study, ANN has been implemented for flow pattern identification and volume ratio prediction. As a mathematical system, ANNs are described to be formed by the plain processing components called neurons acting in parallel and are produced as one or multiple layers [23,24]. MLP acquires nonlinear function mappings and could learn the abundant diversity of nonlinear decision surfaces as well. Figure 8 depicts the presented MLP model, in which the inputs are the extracted features described in the former section, and the outputs are the volume fraction ratios regardless of the flow pattern. The neuron output in the output layer is achieved by the following equations [33,34]:
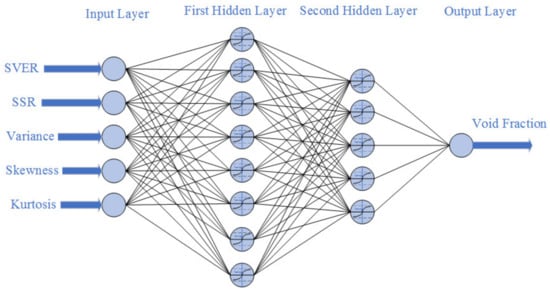
Figure 8.
The configuration of the presented network for predicting void fraction.
The equation related to the tansig activation function is given below:
where a, b, w, and f present the input parameters, the bias term, the weighting factor, and the activation function, respectively. The index i is the input number, and j is the neuron number in every hidden layer. The Levenberg-–Marquardt algorithm was used for training of the presented MLP networks, where the 1st and 2nd derivatives (i.e., the gradient and Hessian) were utilized for network weight correction [35]. The available data are organized into three categories: training, validation, and testing data.
Training dataset: The sample of data utilized to fit the model. The model sees and learns from these data.
Validation dataset: The validation set is utilized to assess the performance of a model, but this is for frequent evaluation. The model encounters these data on occasion, but never does it “Learn” from these data.
Testing dataset: The sample of data utilized to offer an unbiased assessment of a final model fit on the training dataset. The test dataset serves as the gold standard against which the model is assessed. It is only utilized once after completing the network training.
The use of validation data in the network training process as well as final network testing using test datasets will give us the reassurance to avoid under-fitting and over- fitting problems. The training, validation, and testing samples data are 39 (70% of data), 9 (15% of data), and 9 (about 15% of data), respectively. In the present article, two ANN models of MLP were trained to recognize the type of flow regime and to predict the volumetric fraction. Several ANN configurations were tested and enhanced to obtain the optimum ANN configuration with the least error. Several configurations with 1, 2, and 3 hidden layers owning different neuron numbers in every layer and diverse activation functions were examined. MATLAB-2018b was utilized for training the ANN model. The structure of neurons as predictors and clarifiers of ANNs are indicated in Figure 8 and Figure 9, respectively. The specification of the implemented MLP ANNs is described in Table 1 and Table 2. The outputs of the classifier network are the type of flow patterns: 1, 2 and 3 were deemed as the annular, homogenous and stratified flow pattern, respectively.
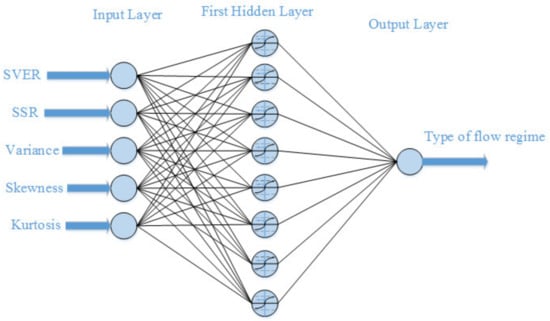
Figure 9.
The configuration of presented ANN for classifying the flow regimes.

Table 1.
Specifications of the presented network for void fraction prediction.
Table 2.
Characteristics of the presented flow regime classifier network.
Many different architectures with different configurations were tested based on the algorithm detailed below in order to find the optimized structure:
- (1).
- The dataset is defined;
- (2).
- The counter parameters with zero initial value are defined;
- (3).
- The root mean square error is defined;
- (4).
- The initial values of other parameters in order to break loops are set;
- (5).
- Several nested loops are generated to test all of the structures;
- (6).
- The ANN with various number of hidden layers, various number of neurons in each layer, various epochs and various activation functions are tested in created loops utilizing the specified counter parameters and other parameters’ initial values;
- (7).
- The network’s effectiveness in each step is checked utilizing the specified error;
- (8).
- The best network with lowest error is saved.
3. Results and Discussions
The function of the enacted network to the volumetric fraction project is displayed in Figure 10, Figure 11 and Figure 12 using a fitting, regression, and histogram diagram. Both the given output and the network output are plotted in the fitting diagram. The blue star in the regression diagram depicts the network output, and the red line depicts the given output. Apparently, as the blue star is close to the red line, the planned network is more precise. The diagram of error histogram illustrates the error distribution. To show the precision of the flow regime classifier network, the confusion matrix is utilized and depicted in Figure 13 for training, validation, and testing of the dataset.
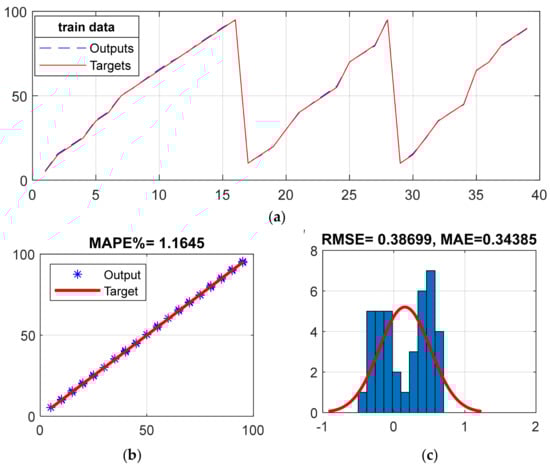
Figure 10.
(a) Fitting, (b) regression, and (c) error histogram diagram for training the ANN to estimate the gas volume ratio percentage.
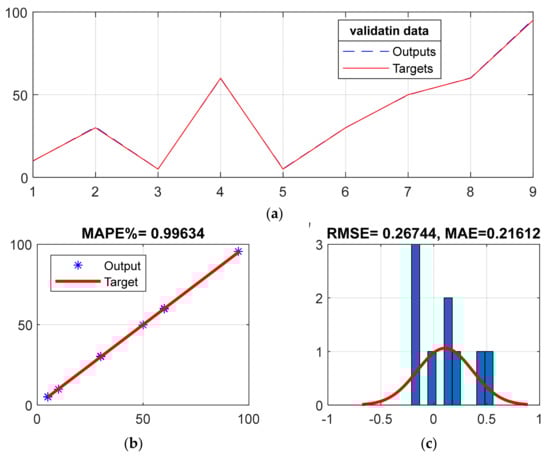
Figure 11.
(a) Fitting, (b) regression, and (c) error histogram diagram for validation of the ANN to estimate the gas volume ratio percentage.
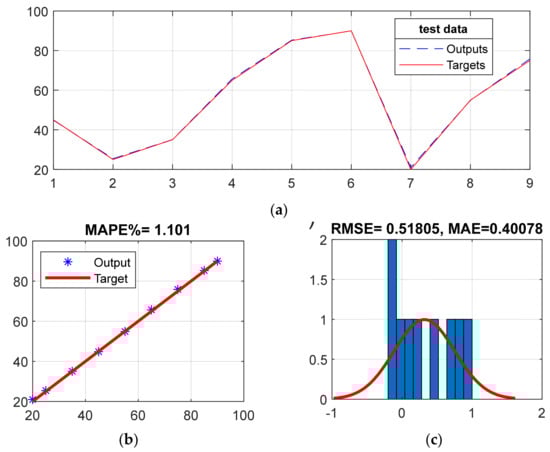
Figure 12.
(a) Fitting, (b) regression, and (c) error histogram schematic for testing the ANN to estimate the gas volume ratio percentage.
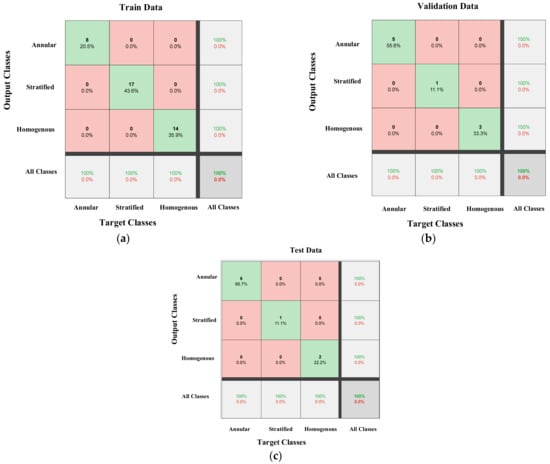
Figure 13.
Precision of the flow regime classifier network: (a) train data, (b) validation data, (c) test data.
The MAPE, MAE, and RMSE of the network are computed by:
where X(Exp) and X(Pred) denote the experimental and forecasted (ANN) void fractions, respectively. The errors of the given predictor network are listed in Table 3.
Table 3.
Computed errors for training, validation, and testing dataset of the estimation network.
The results of the relevant investigations and the work are listed in Table 4. As it can be seen, the precision of the presented system in this paper is significantly higher than all of the previous meters in this category which demonstrates the superiority of the proposed method.
Table 4.
The results of the relevant investigations and the presented two-phase flow meter in this study.
4. Conclusions
The thirst of oil and gas companies for more and efficient access to fossil fuels has led the industry to find new development approaches for new production techniques. In this work, a system has been presented for accurate measurement of the volumetric percentages in two-phase flows independent of the flow pattern, in which an X-ray tube, a Pyrex-glass, and a sodium iodide detector, have been used. The different volume percentages of the three flow regimes have been simulated and the data obtained from each of them have been recorded. Five characteristics in the time-domain were acquired and deemed as the inputs of the multilayer perceptron. The capability for the proposed networks to classify the flow patterns with 100% accuracy and acquire the void percentages precisely with respect to the recorded values of 0.51 for RMSE and 1.16 for MAPE, represents the success of the approach presented in this work. The precision of the proposed X-ray-based system in this paper is significantly higher than all of the previous meters in this category. In addition, this meter has a safer and easier mechanism than other, radiation-based meters. The usage of appropriate soft computing methods and the suitable radiation source were the reason of this achievement.
Although the obtained results in this study are promising, the proposed methodology has been investigated for two-phase flow in static conditions. For future studies, it is planned to implement the proposed methodology for dynamic two-phase flows.
Author Contributions
Conceptualization, M.A.S., E.N. and O.T.; software, A.B., M.A.S., O.T.; writing—review and editing, M.A.S., E.N., O.T. and A.B.; funding acquisition, A.B., O.T. All authors have read and agreed to the published version of the manuscript.
Funding
This work was funded by the Deanship of Scientific Research (DSR), King Abdulaziz University, Jeddah, under grant No. (D1441-376-135). The authors, therefore, gratefully acknowledge the DSR technical and financial support.
Institutional Review Board Statement
Not applicable.
Informed Consent Statement
Not applicable.
Data Availability Statement
Data are contained within the article.
Conflicts of Interest
The authors declare no conflict of interest.
References
- Salgado, C.M.; Brandão, L.E.; Schirru, R.; Pereira, C.M.; da Silva, A.X.; Ramos, R. Prediction of volume fractions in three-phase flows using nuclear technique and artificial neural network. Appl. Radiat. Isot. 2009, 67, 1812–1818. [Google Scholar] [CrossRef]
- Åbro, E.; Johansen, G.A. Improved void fraction determination by means of multibeam gamma-ray attenuation measurements. Flow Meas. Instrum. 1999, 10, 99–108. [Google Scholar] [CrossRef]
- Adineh, M.; Nematollahi, M.; Erfaninia, A. Experimental and numerical void fraction measurement for modeled two-phase flow inside a vertical pipe. Ann. Nucl. Energy 2015, 83, 188–192. [Google Scholar] [CrossRef]
- Sattari, M.A.; Roshani, G.H.; Hanus, R. Improving the structure of two-phase flow meter using feature extraction and GMDH neural network. Radiat. Phys. Chem. 2020, 171, 108725. [Google Scholar] [CrossRef]
- Sattari, M.A.; Roshani, G.H.; Hanus, R.; Nazemi, E. Applicability of time-domain feature extraction methods and artificial intelligence in two-phase flow meters based on gamma-ray absorption technique. Measurement 2021, 168, 108474. [Google Scholar] [CrossRef]
- Hosseini, S.; Roshani, G.H.; Setayeshi, S. Precise gamma based two-phase flow meter using frequency feature extraction and only one detector. Flow Meas. Instrum. 2020, 72, 101693. [Google Scholar] [CrossRef]
- Khayat, O.; Afarideh, H. Design and simulation of a multienergy gamma ray absorptiometry system for multiphase flow metering with accurate void fraction and water-liquid ratio approximation. Nukleonika 2019, 64, 19–29. [Google Scholar] [CrossRef]
- Roshani, M.; Phan, G.; Roshani, G.H.; Hanus, R.; Nazemi, B.; Corniani, E.; Nazemi, E. Combination of X-ray tube and GMDH neural network as a nondestructive and potential technique for measuring characteristics of gas-oil–water three phase flows. Measurement 2021, 168, 108427. [Google Scholar] [CrossRef]
- Song, K.; Liu, Y. A compact x-ray system for two-phase flow measurement. Meas. Sci. Technol. 2017, 29, 025305. [Google Scholar] [CrossRef]
- Roshani, G.H.; Nazemi, E.; Roshani, M.M. Flow regime independent volume fraction estimation in three-phase flows using dual-energy broad beam technique and artificial neural network. Neural Comput. Appl. 2016, 28, 1265–1274. [Google Scholar] [CrossRef]
- Karami, A.; Roshani, G.H.; Khazaei, A.; Nazemi, E.; Fallahi, M. Investigation of different sources in order to optimize the nuclear metering system of gas–oil–water annular flows. Neural Comput. Appl. 2020, 32, 3619–3631. [Google Scholar] [CrossRef]
- Roshani, M.; Phan, G.; Faraj, R.H.; Phan, N.H.; Roshani, G.H.; Nazemi, B.; Corniani, E.; Nazemi, E. Proposing a gamma radi-ation based intelligent system for simultaneous analyzing and detecting type and amount of petroleum by-products. Neural Eng. Technol. 2021, 53, 1277–1283. [Google Scholar]
- Amiri, S.; Ali, P.J.M.; Mohammed, S.; Hanus, R.; Abdulkareem, L.; Alanezi, A.A.; Eftekhari-Zadeh, E.; Roshani, G.H.; Nazemi, E.; Kalmoun, E.M. Proposing a Nondestructive and Intelligent System for Simultaneous Determining Flow Regime and Void Fraction Percentage of Gas–Liquid Two Phase Flows Using Polychromatic X-Ray Transmission Spectra. J. Nondestruct. Eval. 2021, 40, 1–12. [Google Scholar] [CrossRef]
- Roshani, G.H.; Nazemi, E.; Feghhi, S.A.; Setayeshi, S. Flow regime identification and void fraction prediction in two-phase flows based on gamma ray attenuation. Measurement 2015, 62, 25–32. [Google Scholar] [CrossRef]
- Roshani, G.; Hanus, R.; Khazaei, A.; Zych, M.; Nazemi, E.; Mosorov, V. Density and velocity determination for single-phase flow based on radiotracer technique and neural networks. Flow Meas. Instrum. 2018, 61, 9–14. [Google Scholar] [CrossRef]
- Roshani, M.; Phan, G.T.; Ali, P.J.M.; Roshani, G.H.; Hanus, R.; Duong, T.; Corniani, E.; Nazemi, E.; Kalmoun, E.M. Evaluation of flow pattern recognition and void fraction measurement in two phase flow independent of oil pipeline’s scale layer thickness. Alex. Eng. J. 2021, 60, 1955–1966. [Google Scholar] [CrossRef]
- Hernandez, A.M.; Boone, J.M. Tungsten anode spectral model using interpolating cubic splines: Unfiltered x-ray spectra from 20 kV to 640 kV. Med Phys. 2014, 41, 042101. [Google Scholar] [CrossRef]
- Zhang, F.; Chen, K.; Zhu, L.; Appiah, D.; Hu, B.; Yuan, S. Gas–Liquid Two-Phase Flow Investigation of Side Channel Pump: An Application of MUSIG Model. Mathematics 2020, 8, 624. [Google Scholar] [CrossRef]
- Roshani, G.H.; Roshani, S.; Nazemi, E.; Roshani, S. Online measuring density of oil products in annular regime of gas-liquid two phase flows. Measurement 2018, 129, 296–301. [Google Scholar] [CrossRef]
- Moradi, M.J.; Hariri-Ardebili, M.A. Developing a Library of Shear Walls Database and the Neural Network Based Predictive Meta-Model. Appl. Sci. 2019, 9, 2562. [Google Scholar] [CrossRef]
- Ali, A.; Umar, M.; Abbas, Z.; Shahzadi, G.; Bukhari, Z.; Saleem, A. Numerical Investigation of MHD Pulsatile Flow of Micropolar Fluid in a Channel with Symmetrically Constricted Walls. Mathematics 2021, 9, 1000. [Google Scholar] [CrossRef]
- Moradi, M.J.; Roshani, M.M.; Shabani, A.; Kioumarsi, M. Prediction of the load-bearing behavior of spsw with rectangular opening by RBF network. Appl. Sci. 2020, 10, 1185. [Google Scholar] [CrossRef]
- Karami, A.; Roshani, G.H.; Nazemi, E.; Roshani, S. Enhancing the performance of a dual-energy gamma ray based three-phase flow meter with the help of grey wolf optimization algorithm. Flow Meas. Instrum. 2018, 64, 164–172. [Google Scholar] [CrossRef]
- Khaleghi, M.; Salimi, J.; Farhangi, V.; Moradi, M.J.; Karakouzian, M. Application of Artificial Neural Network to Predict Load Bearing Capacity and Stiffness of Perforated Masonry Walls. CivilEng 2021, 2, 48–67. [Google Scholar] [CrossRef]
- Roshani, G.; Nazemi, E.; Roshani, M. Identification of flow regime and estimation of volume fraction independent of liquid phase density in gas-liquid two-phase flow. Prog. Nucl. Energy 2017, 98, 29–37. [Google Scholar] [CrossRef]
- Mosorov, V.; Zych, M.; Hanus, R.; Sankowski, D.; Saoud, A. Improvement of Flow Velocity Measurement Algorithms Based on Correlation Function and Twin Plane Electrical Capacitance Tomography. Sensors 2020, 20, 306. [Google Scholar] [CrossRef]
- Moradi, M.; Daneshvar, K.; Ghazi-Nader, D.; Hajiloo, H. The prediction of fire performance of concrete-filled steel tubes (CFST) using artificial neural network. Thin-Walled Struct. 2021, 161, 107499. [Google Scholar] [CrossRef]
- Roshani, G.; Nazemi, E. Intelligent densitometry of petroleum products in stratified regime of two phase flows using gamma ray and neural network. Flow Meas. Instrum. 2017, 58, 6–11. [Google Scholar] [CrossRef]
- Waini, I.; Ishak, A.; Pop, I. Hybrid Nanofluid Flow over a Permeable Non-Isothermal Shrinking Surface. Mathematics 2021, 9, 538. [Google Scholar] [CrossRef]
- Roshani, G.; Nazemi, E.; Roshani, M. Usage of two transmitted detectors with optimized orientation in order to three phase flow metering. Measurement 2017, 100, 122–130. [Google Scholar] [CrossRef]
- Salimi, J.; Ramezanianpour, A.M.; Moradi, M.J. Studying the effect of low reactivity metakaolin on free and restrained shrinkage of high performance concrete. J. Build. Eng. 2020, 28, 101053. [Google Scholar] [CrossRef]
- Roshani, G.H.; Nazemi, E.; Roshani, M.M. Intelligent recognition of gas-oil-water three-phase flow regime and determina-tion of volume fraction using radial basis function. Flow Meas. Instrum. 2017, 54, 39–45. [Google Scholar] [CrossRef]
- Taylor, J.G. Neural Networks and Their Applications; John Wiley & Sons Ltd.: Brighton, UK, 1996. [Google Scholar]
- Gallant, A.R.; White, H. On learning the derivatives of an unknown mapping with multilayer feedforward networks. Neural Netw. 1992, 5, e129–e138. [Google Scholar] [CrossRef]
- Hagan, M.T.; Menhaj, M. Training feedforward networks with the Marquardt algorithm. IEEE Trans. Neural Netw. 1994, 5, e989–e993. [Google Scholar] [CrossRef]
- Nazemi, E.; Roshani, G.; Feghhi, S.; Setayeshi, S.; Zadeh, E.E.; Fatehi, A. Optimization of a method for identifying the flow regime and measuring void fraction in a broad beam gamma-ray attenuation technique. Int. J. Hydrogen Energy 2016, 41, 7438–7444. [Google Scholar] [CrossRef]
- Roshani, M.; Sattari, M.A.; Ali, P.J.M.; Roshani, G.H.; Nazemi, B.; Corniani, E.; Nazemi, E. Application of GMDH neural network technique to improve measuring precision of a simplified photon attenuation based two-phase flowmeter. Flow Meas. Instrum. 2020, 75, 101804. [Google Scholar] [CrossRef]
- Nazemi, E.; Feghhi, S.; Roshani, G.; Peyvandi, R.G.; Setayeshi, S. Precise Void Fraction Measurement in Two-phase Flows Independent of the Flow Regime Using Gamma-ray Attenuation. Nucl. Eng. Technol. 2016, 48, 64–71. [Google Scholar] [CrossRef]
- Falahati, M.; Vaziri, M.R.; Beigzadeh, A.; Afarideh, H. Design, modelling and construction of a continuous nuclear gauge for measuring the fluid levels. J. Instrum. 2018, 13, P02028. [Google Scholar] [CrossRef]
- Hanus, R. Application of the Hilbert Transform to measurements of liquid–gas flow using gamma ray densitometry. Int. J. Multiph. Flow 2015, 72, 210–217. [Google Scholar] [CrossRef]
Publisher’s Note: MDPI stays neutral with regard to jurisdictional claims in published maps and institutional affiliations. |
© 2021 by the authors. Licensee MDPI, Basel, Switzerland. This article is an open access article distributed under the terms and conditions of the Creative Commons Attribution (CC BY) license (https://creativecommons.org/licenses/by/4.0/).