Abstract
The extreme value theory is expanded by proposing and studying a new version of the Fréchet model. Some new bivariate type extensions using Farlie–Gumbel–Morgenstern copula, modified Farlie–Gumbel–Morgenstern copula, Clayton copula, and Renyi’s entropy copula are derived. After a quick study for its properties, different non-Bayesian estimation methods under uncensored schemes are considered, such as the maximum likelihood estimation method, Anderson–Darling estimation method, ordinary least square estimation method, Cramér–von-Mises estimation method, weighted least square estimation method, left-tail Anderson–Darling estimation method, and right-tail Anderson–Darling estimation method. Numerical simulations were performed for comparing the estimation methods using different sample sizes for three different combinations of parameters. The Barzilai–Borwein algorithm was employed via a simulation study. Three applications were presented for measuring the flexibility and the importance of the new model for comparing the competitive distributions under the uncensored scheme. Using the approach of the Bagdonavicius–Nikulin goodness-of-fit test for validation under the right censored data, we propose a modified chi-square goodness-of-fit test for the new model. The modified goodness-of-fit statistic test was applied for the right censored real data set, called leukemia free-survival times for autologous transplants. Based on the maximum likelihood estimators on initial data, the modified goodness-of-fit test recovered the loss in information while the grouping data and followed chi-square distributions. All elements of the modified goodness-of-fit criteria tests are explicitly derived and given.
1. Introduction
The extreme value theory (EVT) was firstly introduced by [1] then followed by [2] and completed by [3,4]. The EVT is devoted to stochastic series of independent and identical distributed (iid) random variables (RVs). The EVT was originally devoted toward studying the behavior of extreme values (EVs), even though these extremes have a very low chance to appear, these EVs can turn out to have a very high effect to the observed experiment. Insurance and finance are the best fields of research to observe the importance of extreme events in EVT. The EVT started in the last century as an equivalent theory to the central limit theory (CLT), which was devoted toward studying the asymptotic distribution of the average of a sequence of RVs. Assume that , , , is a sequence of iid-RVs with common cumulative distribution function (CDF) . One of the most interesting statistics is the sample maximum One is interested in the behavior of as the sample size increases to infinity.
then,
Suppose there are sequences of constants and , such that
Then, for any non-degenerate CDF, it will belong to one of the three main types of classic extreme value families, which include the Gumbel, Fréchet, and Weibull distributions. The Fréchet (F) model is one of the most important distributions in modeling extreme values. The F model was originally proposed by [1]. It has many applications, in ranging, accelerated life testing, earthquakes, floods, wind speed, horse racing, rainfall, queues in supermarkets, and sea waves. One can find more details about the F model in the literature, for example [5] investigated the exponentiated F distribution. Moreover, [6] discussed the odd Chen F random variables (RVs), [7] defined and applied a new version of the F distribution for relief times and survival times data. Eliwa et al. [8] proposed the exponentiated odd Chen F distribution, [9] proposed some applications of the Marshall–Olkin F (MO-F) distribution, [10] investigated the odd flexible Weibull F distribution, among others. Many other useful F model extensions are defined and studied by [11,12,13,14,15,16].
In this article, we expanded the EVT with proposing and studying a new version the F model, called the odd-Burr generalized Fréchet (OB-F) model. The new model is derived based on compiling the standard F model with the odd-Burr generalized (OB-G) family (see [17]). Many new bivariate type extensions using the Farlie–Gumbel–Morgenstern (FGM) copula, modified FGM copula, Clayton copula, and Renyi’s entropy copula, are derived. The bivariate type extensions may e useful in modeling the bivariate real data sets.
After a quick studying for its properties, different classical estimation methods under uncensored schemes are considered, such as the maximum likelihood estimation (MLE) method, Anderson–Darling estimation (ADE) method, ordinary least square estimation (OLSE) method, Cramér-von Mises estimation (CVME) method, weighted least square estimation (WLSE) method, left-tail Anderson–Darling estimation () method, and right-tail Anderson–Darling estimation () method. Numerical simulations are performed for comparing the estimation methods using different sample sizes for the three different combinations of parameters. The Barzilai–Borwein (BB) algorithm is employed via a simulation study for assessing the performance of the estimators with different sample sizes, as sample size tends to Three applications for measuring the flexibility and the importance of the OB-F model are presented and are also used for comparing the competitive distributions under the uncensored scheme. Using the approach of the Bagdonavicius–Nikulin goodness-of-fit (BN-GOF) test for validation under the right censored data, we propose a modified chi-square GOF tests for the OB-F model. The modified GOF statistic test is applied for the right censored real data set, called leukemia free-survival times (in months) for autologous transplants. Based on the maximum likelihood estimators (MLEs) on initial data, the modified BN-GOF test recovers the loss in information, while the grouping data follow chi-square distributions. All elements of the modified BN-GOF criteria tests are explicitly derived and given.
A RV is said to have the F distribution if its probability density function (PDF) and CDF are given by
and
where is a shape parameter. For we get the Inverse Rayleigh (IR) model. Due to [17], the CDF of the OB-G family is given by
where The PDF corresponding to (6) is given by
For , the OB-G family reduces to the Odd G (O-G) family (see [18]). For , the OB-G family reduces to the proportional reversed hazard rate (PRHR) family (see [19]). In this work, we define and study a new Fréchet model based on OB-G family, called generalized odd log-logistic F (OB-F) model. The OB-F survival function (SF) is given by
where For , the OB-F reduces to the O-F. For , the OB-F reduces to the PRHR-F. The PDF corresponding to (8) is given by
The hazard rate function (HRF) for the new model can be given from . Let , the asymptotics of the CDF, PDF, and HRF as are given by
and
The asymptotes of CDF, PDF, and HRF as are given by
and
For simulation of this new model, we obtain the quantile function (QF) of (by inverting based on (8)), say , as
Equation (16) is used for simulating the new model (see Section 5). The now OB-F model can be used in modeling extreme data, such as extreme floods, maximum sizes of ecological populations, the size of freak waves, the amount of large insurance losses, equity risks, day-to-day market risk, side effects of drugs (e.g., ximelagatran), survival times, large wildfires, repair data, and estimate fastest time of running (e.g., 100 m sprint) (see [11,12,13,14,15,16]).
2. Copula
For modeling the bivariate real data sets, we can consider the bivariate OB-F type generated via the FGM copula, modified FGM copula, Clayton copula, and Renyi’s entropy copula. Many other types of copula could be considered in separate works. In this section, we derive a new bivariate type OB-F (BOB-F) model using the theorems of FGM Copula, modified FGM Copula, Clayton Copula and Renyi’s entropy. The Multivariate OB-F (MvOB-F) type is also presented. However, future works may be allocated to study these new models. First, we consider the joint CDF of the FGM family, where where the marginal function , , is a dependence parameter and for every , which is “grounded minimum” and and which is “grounded maximum”, .
2.1. Via FGM Copula
Due to [20,21,22,23], a Copula is continuous in and where
is the stronger Lipschitz condition. For and we have
Then, setting and We can easily obtain the joint CDF of the FGM family from
The joint PDF can then be derived from
or from
2.2. Via Modified FGM Copula
According to [24], the modified FGM copula is defined as
or
where , and , where and are being two continuous functions on where Let
Then, where
and
- Type-I
Recalling the following functional form for both and . Then, the BOB-F–FGM (Type-I) can be derived from
where
- Type-II
Let and be two functional forms satisfying all the conditions stated earlier where and
Then, the corresponding BOB-F–FGM (Type-II) can be derived from
- Type-III
Let and be two functional form for satisfy all the conditions stated earlier where
and
In this case, one can also derive a closed form expression for the associated CDF of the BOB-F–FGM (Type-III) from
- Type-IV
The CDF of the BOB-F–FGM (Type-IV) model can be derived from
where and can be derived using (16).
2.3. Via Clayton Copula
The Clayton Copula can be considered as
Setting and Then, the BOB-F type can be derived from Similarly, the MvOB-F (-dimensional extension) from the above can be derived from
2.4. Via Renyi’s Entropy
Let and Then, using the theorem of [25], the Renyi’s entropy Copula can be expressed as
Then, the associated BOB-F can be directly derived from .
3. Mathematical Properties
3.1. Useful Representations
Due to [17], the PDF in (9) can be expressed as
where
and is the PDF of the F model with scale parameter and shape parameter . By integrating Equation (40), the CDF of becomes
where is the CDF of the F distribution with scale parameter and shape parameter .
3.2. Moments and Incomplete Moments
The ordinary moment of is given by
then we obtain
where and Setting and in (44), we have
where is the mean of . The incomplete moment, say , of can be expressed, from (42), as
then
where is the incomplete gamma function.
The first incomplete moment given by (11) with as
3.3. Moment Generating Function (MGF)
The MGF of can be derived from equation (40) as
where is the MGF of the F model with scale parameter and shape parameter , then
3.4. Residual Life and Reversed Residual Life Functions
The moment of the residual life can be derived using
Then, the moment of the residual life of is given also by
Therefore, using (40), we have
where and .
Analogously, the moment of the reversed residual life is
uniquely determines . We obtain Then, the moment of the reversed residual life of becomes
where
3.5. Numerical Calculations and Relevant Analysis
Numerical analysis for the mean , variance , skewness , kurtosis and are calculated in Table 1 (for the OB-F model) and Table 2 (for the F model) for some carefully selected parameters value. Based on Table 1 and Table 2 we note that, the (, ), whereas the (1.199258, 5.601109). Further, the spread for the is ranging from nearly 39.75302 to nearly , whereas the spread for the only varies from 5.69888 to 54524.95. Based on Table 1, the 1st and the 2nd incomplete moments and decreases as and increases. Based on Table 2, the 1st and the 2nd incomplete moments and decreases as increases.

Table 1.
E(Z), Var(Z), Skew(Z) and Kur(Z) of the GOLLRW model.

Table 2.
E(Z), Var(Z), Skew(Z) and Kur(Z) of the RW model.
4. Classical Estimation under Uncensored Scheme
4.1. The MLE Method
Let be a random sample from size from the OB-F distribution with parameters and . Let be the parameter vector. For determining the MLE of , we have the log-likelihood function
The components of the score vector is available if needed. Setting and solving them simultaneously yields the MLE, where . To solve these equations, it is usually more convenient to use nonlinear optimization methods, such as the quasi-Newton algorithm to numerically maximize . For interval estimation of the parameters, we obtain the observed information matrix
whose elements can be computed numerically.
4.2. The CVME Method
The CVME of the parameters are obtained via minimizing the following expression with respect to (WRT) to the parameters respectively, where
where and
Then, the CVME of the parameters are obtained by solving the two following non-linear equations
and
where and .
4.3. OLS Method
Let denotes the CDF of OB-F model and let be the ordered RS. The OLSEs are obtained upon minimizing
then, we have
where .The LSEs are obtained via solving the following non-linear equations
and
where and defined above.
4.4. WLSE Method
The WLSE is obtained by minimizing the function WRT
where
The WLSEs are obtained by solving
and
where and defined above.
4.5. The ADE Method
The ADE are obtained by minimizing the function
where
The parameter estimates follow by solving the nonlinear equations
4.6. The Method
The are obtained by minimizing
The parameter estimates follow by solving the nonlinear equations
4.7. The Method
The are obtained by minimizing
The parameter estimates follow by solving the nonlinear equations
5. Simulation Studies for Comparing Estimation Methods under Uncensored Scheme
A numerical simulation is performed in to compare the classical estimation methods. The simulation study is based on N = generated data sets from the OB-F version where and , and under the following three scenarios: , and . Figure 1a, Figure 1b and Figure 1c gives the density functions for three scenarios. The estimates are compared in terms of
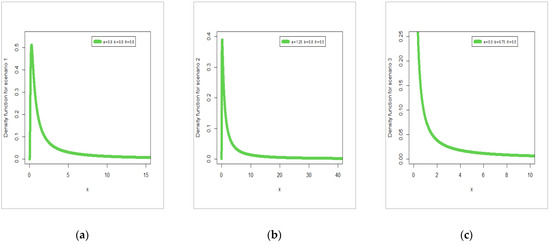
Figure 1.
Density functions for the three scenarios.
- Bias
- Root mean-standard error
- The mean of the absolute difference between the theoretical and the estimates ; and
- The maximum absolute difference between the true parameters and estimates .

Table 3.
Simulation results for parameters a = b = θ = 0.8.

Table 4.
Simulation results for parameters a = 1.25, b = 0.8, and θ = 0.5.

Table 5.
Simulation results for parameters a = 0.5, b = 0.75, and θ = 1.5.
- The BIAS (BIAS(a), BIAS(b) and BIAS(θ)) tends to when n increases and tends to which means that all estimators are non-biased.
- The RMSE (RMSE(a), RMSE (b) and RMSE (θ)) tends to when n increases, and tends to , which means incidence of consistency property.
- For “a = b = θ = 0.8” (see Table 3), the MLE has the lowest RMSE as illustrated below:
- RMSE (a)= (0.100754, 0.06959, 0.039482, and 0.03039).
- RMSE (b)= (0.117999, 0.082085, 0.046039, and 0.03483).
- RMSE (θ)= (0.09090, 0.060655, 0.03379, and 0.02604).
- For “a = 1.25, b = 0.8 and θ = 0.5” (Table 4), the MLE has the lowest RMSE as illustrated below:
- RMSE(a)= (0.158557, 0.108888, 0.060440, and 0.045951).
- RMSE(b)= (0.118178, 0.084967, 0.044982, and 0.035669).
- RMSE(θ)= (0.060194, 0.041468, 0.022886, and 0.017223).
- For “a = 0.5, b = 0.75 and θ = 1.5” (Table 5), the MLE has the lowest RMSE as illustrated below:
- RMSE(a)= (0.062856, 0.04356, 0.043363, and 0.019156).
- RMSE(b)= (0.11083, 0.074849, 0.058097, and 0.033038).
- RMSE(θ)= (0.146539, 0.102224, 0.001031, and 0.044046).
6. Modeling Uncensored Real Data for Comparing the Competitive Models
For illustrating the wide applicability of the new OB-F model, we consider the Cramér–von Mises (C) statistic, the Anderson–Darling (C) statistic, the Kolmogorov–Smirnov (K-S) statistic, and its corresponding p-value . Table 6 below gives the competitive models.

Table 6.
The competitive models.
6.1. Stress Data
The first data set is an uncensored data set consisting of 100 observations on breaking stress of carbon fibers (in Gba) given by [31] and these data are used by [32,33,34,35]. For exploring the empirical HRF of data set I, the total time test (TTT) (see [36]) plot is plotted in Figure 2a. Due to Figure 2a, the empirical HRF of data sets I is “monotonically increasing”. For exploring the initial shape of real data set I, the nonparametric Kernel density estimation (KDE) is provided in Figure 2b. In Figure 2b, it is noted that the nonparametric density of data I is “asymmetric right skewed with heavy tail”. For exploring the extreme value, the box plot is plotted in Figure 2c. Based on Figure 2c, we note that some extreme values were found and the quantile–quantile (Q–Q) plot (Figure 2d) confirms this fact.
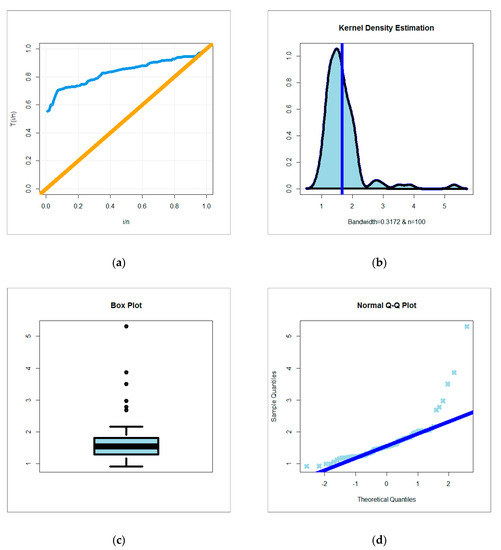
Figure 2.
(a) Total time test (TTT) plot; (b) Kernel density estimation (KDE) plot; (c) box plot; (d) quantile–quantile (Q–Q) plot for data set I.
The statistics C, C, K-S, and P-V for all fitted models are presented in Table 7. The MLEs and corresponding standard errors (SEs) are given in Table 8. From Table 7, the OB-F model gives the lowest values the C, C, K-S and the biggest P-V statistics (bold values) as compared to further F models, therefore, the OB-F can be chosen as the best model. Figure 3a, Figure 3b, Figure 3c and Figure 3d give the estimated (E-PDF), estimated CDF (E-CDF), probability-probability (P-P) plot and estimated HRF (E-HRF), respectively, for data set I. Based on Table 8 and for a = 5.8786, b = 0.5825 and θ = 1.1017 we have, mean = 1.653321, variance = 0.3408465, skewness = 6.36955 and kurtosis = 906.9166.

Table 7.
C, C, K-S and P-V for data set I.

Table 8.
MLEs and their standard errors (in parentheses) for data set I.
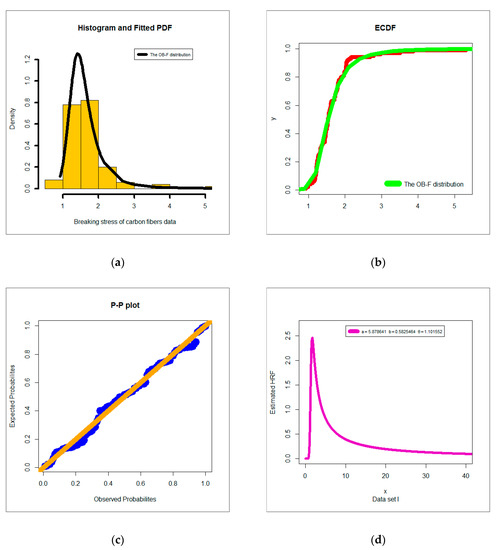
Figure 3.
(a) Estimated density; (b) estimated cumulative distribution function (CDF); (c) P-P plot; (d) estimated hazard rate function (HRF) for data set I.
6.2. Glass Fibers Data
The second data set is generated data to simulate the strengths of glass fibers, given by [37]. For exploring the empirical HRF of data set II, the TTT plot is plotted in Figure 4a. Due to Figure 4a, the empirical HRF of data sets II is “monotonically increasing”. For exploring the initial shape of real data II non-parametrically, the KDE is provided in Figure 4b. In Figure 4b, it is noted that the nonparametric density of data II is “asymmetric right skewed with heavy tail”. For exploring the extreme value, the box plot is plotted in Figure 4c. Based on Figure 4c, we note that some extreme values were found and the Q–Q plot (Figure 4d) confirms this fact. The C, C K-S, and P-V are listed in Table 9. The MLEs and SEs are given in Table 10. From Table 9, the OB-F model gives the lowest values the C, C K-S, and the biggest value of the P-V, therefore, the OB-F can be chosen as the best model. Figure 5a, Figure 5b, Figure 5c and Figure 5d gives the E-PDF, E-CDF, P-P plot, and E-HRF for data set II. Based on Table 10 and for a = 7.5535, b = 0.4841 and θ = 1.1588 we have, mean = 1.611337, variance = 0.2134206, skewness = 4.838406 and kurtosis = 232.3354.
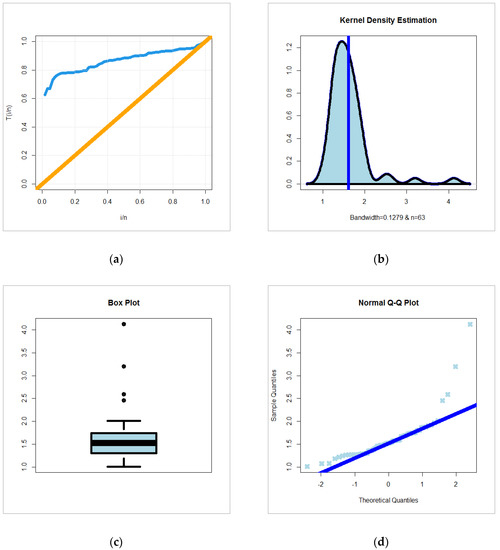
Figure 4.
(a) TTT plot; (b) KDE plot; (c) box plot; (d) Q–Q plot for data set II.

Table 9.
C, C, K-S, and P-V for data set II.

Table 10.
MLEs and their standard errors (in parentheses) for data set II.
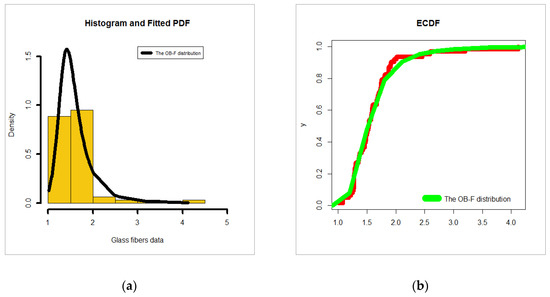
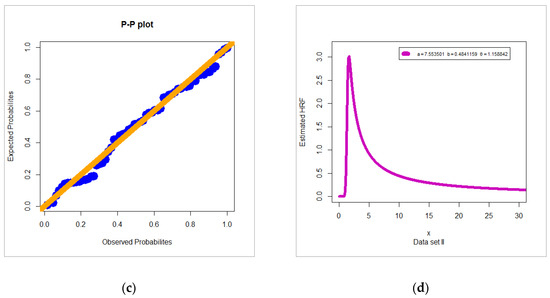
Figure 5.
(a) Estimated density; (b) estimated CDF; (c) P-P plot; (d) estimated HRF for data set II.
6.3. Relief Time Data
The 3rd data set (Wingo data) represents a complete sample from a clinical trial describe a relief time (in hours) for 50 arthritic patients [38]. For exploring the empirical HRF of data set III, the TTT plot is plotted in Figure 6 a. Due to Figure 6a the empirical HRF of data sets III is “monotonically increasing”. For exploring the initial shape of real data III, the nonparametric KDE is provided in Figure 6b. Figure 6b it is noted that the nonparametric density of data III is “nearly symmetric”. The box plot is presented in Figure 6c. Based on Figure 6c, we note no extreme values were found and the Q–Q plot (Figure 6d) confirms this fact. The C, C K-S, and P-V are listed in Table 11. The MLEs and SEs are given in Table 12. From Table 11, the OB-F model gives the lowest values the C, C K-S and the biggest value of the P-V, therefore the OB-F can be chosen as the best model. Figure 7a, Figure 7b, Figure 7c and Figure 7d gives the E-PDF, E-CDF, P-P plot and E-HRF for data set III. Based on Table 12 and for a = 29.50356, b = 0.64127 and θ = 0.14316 we have, mean = 16.20257, variance = 67.31756, skewness = 9.75092 and kurtosis = 1520.895.
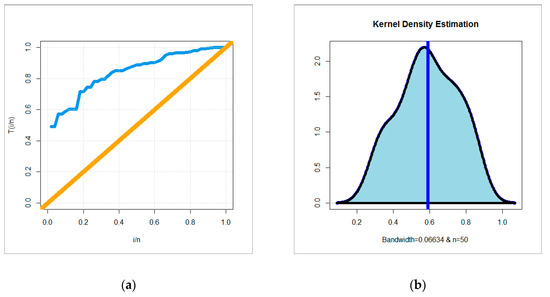
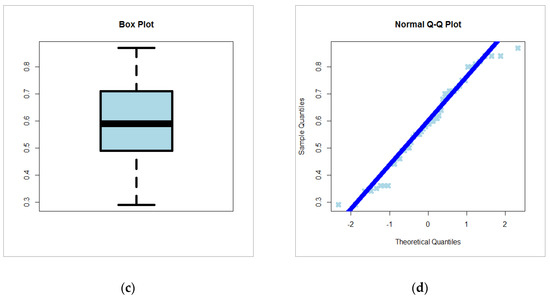
Figure 6.
(a) TTT plot; (b) KDE plot; (c) box plot; (d) Q–Q plot for data set III.

Table 11.
C, C, K-S, and P-V for data set III.

Table 12.
MLEs and their standard errors (in parentheses) for data set III.
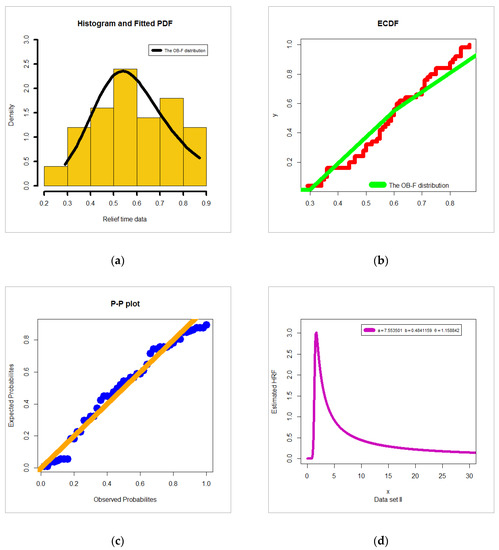
Figure 7.
(a) Estimated density; (b) estimated CDF; (c) P-P plot; (d) estimated HRF for data set III.
7. Validation under Censored Scheme
7.1. Maximum Likelihood Estimation for Censored Data
In reliability studies and survival analysis, data are often censored. If is a censored sample from the OB-F distribution, each observation can be written as
where are failure times and censoring times. The likelihood function is
The right censoring is assumed to be non-informative, so the log-likelihood function can be written as:
we pose
The MLEs of the unknown parameters and are derived from the nonlinear following score equations:
The explicit form of cannot be obtained, so we use numerical methods.
7.2. Test Statistic for Right Censored Data
Let be i.i.d. random variables grouped into classes . To assess the adequacy of a parametric model
when data are right censored and the parameter vector is unknown, [39] proposed a statistic test based on the vector
This one represents the differences between observed and expected numbers of failures ( and to fall into these grouping intervals
where is a finite time. The authors considered as random data functions such as the intervals chosen to have equal expected numbers of failures . The statistic test is defined by
where and are the expected and the observed numbers of failure in grouping intervals, other elements were defined in [38,39,40,41,42,43,44], where
The limits of random gouging intervals were chosen, such as the expected failure times to fall into these intervals, which were the same for each; The estimated is defined by
where is the cumulative HRF (CHRF) of the new distribution. This statistic test follows a chi-squared distribution. To calculate the quadratic form of the statistic , and, as its distribution doesn’t depend on the parameters, we can use the estimated matrices and and the estimated information matrix The elements of defined by
7.3. Criteria Test for OB-F
For testing the null hypothesis that data belong to the OB-F model, we construct a modified chi-squared type goodness-of-fit test based on the statistic . Suppose that is a finite time, and observed data are grouped into sub-intervals of The limit intervals are considered as random variables, such that the expected number of failures in each interval are the same, so the expected number of failures are obtained as
Therefore, the quadratic form of the test statistic can be obtained easily:
where matrices , and the estimated information matrix are derived as given in [40,41,42,43,44,45]. The matrix is defined in (99) and its elements are and are numerically evaluated in Section 8.
7.4. Simulations
An important simulation study is carried out to show the performance of the techniques used and the feasibility of the goodness-of-fit test developed in this work. At this end, we generated right censored samples with different sizes from the OB-F model with parameter values Firstly, we compute the MLEs of the unknown parameters, and then the criteria of the corresponding samples are provided. Using statistical software and the BB algorithm (see [46]), we calculate the MLEs of the unknown parameters, the corresponding bias and mean square errors (MSE). The BB algorithm is recently applied by [47,48,49,50]. The results are given in Table 13.

Table 13.
MLEs of a, b, θ, and MSE.
7.5. Test Statistic
For testing the null hypothesis that right censored data become from OB-F model, we compute the criteria statistic as defined above for simulated samples from the hypothezised distribution with different sizes .Then, we calculate empirical levels of significance, when , correponding to theoretical levels of significance , We choose . The results are reported in Table 14.

Table 14.
Simulated levels of significance for test for OB-F model against their theoretical values (ε 0.01, 0.05, 0.10).
The null hypothesis for which simulated samples are fitted by OB-F distribution, is widely validated for the different levels of significance. Therefore, the test proposed in this work, can be used to fit data from this new distribution.
8. Application to Leukemia Free-Survival Times
We consider sample data of 51 patients with advanced acute myelogenous leukemia reported to the International Bone Marrow Transplant Registry. These patients had received an autologous (auto) bone marrow transplant in which, after high doses of chemotherapy, their own marrow was reinfused to replace their destroyed immune system. Leukemia free-survival times (in months) for Autologous Transplants: 0.658, 0.822, 1.414, 2.5, 3.322, 3.816, 4.737, 4.836 *, 4.934, 5.033, 5.757, 5.855, 5.987, 6.151, 6.217, 6.447 *, 8.651, 8.717, 9.441 *, 10.329, 11.48, 12.007, 12.007 *, 12.237, 12.401 *, 13.059 *, 14.474 *, 15 *, 15.461, 15.757, 16.48, 16.711, 17.204*, 17.237, 17.303 *, 17.664 *, 18.092, 18.092 *, 18.75 *, 20.625 *, 23.158, 27.73 *, 31.184 *, 32.434 *, 35.921 *, 42.237 *,44.638 *, 46.48 *, 47.467 *, 48.322 *, 56.086. (* indicates the censorship). We use the statistic test provided above to verify if these data are modeled by the transmuted generalized linear exponential distribution OB-F, and at that end, we first calculate the MLEs of the unknown parameters
Data are grouped into intervals . We give the necessary calculus in the following Table 15.

Table 15.
Values of the limits (, observed numbers of failures (), and expected numbers of failures ().
Then we obtain the value of the statistic test :
For significance level , the critical value is superior than the value of so we can say that the proposed OB-F model fit these data.
9. Concluding Remarks
In this article, we expanded the extreme value theory by proposing and studying a new version of the Fréchet model called the odd-Burr generalized Fréchet model. The new model is based on compiling the standard Fréchet model with the odd-Burr generalized family. Many new bivariate type extensions using Farlie–Gumbel–Morgenstern Copula, modified Farlie–Gumbel–Morgenstern, Clayton Copula, and Renyi’s entropy Copula are derived. After a quick study for its properties, different classical estimation methods under an uncensored scheme are considered, such as the maximum likelihood estimation method, Anderson–Darling estimation method, ordinary least square estimation method, Cramér–von Mises estimation method, weighted least square estimation method, left-tail Anderson–Darling estimation method, and right-tail Anderson–Darling estimation method. Simulations were performed by comparing the estimation methods using different sample sizes for three different combinations of parameters. The Barzilai–Borwein algorithm is employed via simulation studies, assessing the performance of the estimators with different sample sizes as sample size tends to Three applications for measuring the flexibility and the importance of the new model are presented and used for comparing the competitive distributions under the uncensored scheme. Using the approach of the Bagdonavicius–Nikulin goodness-of-fit test for validation under the right censored data, we propose a modified chi-square goodness-of-fit test for the new model. The modified goodness-of-fit statistic test is applied for right censored real data set called leukemia free-survival times (in months) for autologous transplants. Based on the maximum likelihood estimators on initial data, the modified goodness-of-fit test recovers the loss of information. All elements of the modified GOF criteria tests are explicitly derived and given.
Author Contributions
M.M.S. (review and editing & conceptualization), M.E.-M. (review and editing & conceptualization), M.S.E. (review and editing & validation& conceptualization) and H.M.Y. (writing the original draft preparation, conceptualization conceptualization project administration). All authors have read and agreed to the published version of the manuscript.
Funding
Majmaah University, project number No. R-1441-184.
Acknowledgments
The authors extend their appreciation to the Deanship of Scientific Research at Majmaah University for supporting this work under project number No. R-1441-184.
Conflicts of Interest
The authors declare no conflict of interest.
References
- Fréchet, M. Sur la loi de probabilité de lécart maximum. Ann. Soc. Pol. Math 1927, 6, 93–116. [Google Scholar]
- Von Mises, R. La distribution de la plus grande de nvaleurs. Rev. Math. Union Interbalcanique 1936, 1, 141–160. [Google Scholar]
- Von Mises, R. Selected papers of Richard von Mises. Am. Math. Soc. 1964, 1. [Google Scholar]
- Kotz, S.; Johnson, N.L. Breakthroughs in Statistics: Foundations and Basic Theory; Springer: Berlin, Germany, 1992; Volume 1. [Google Scholar]
- Nadarajah, S.; Kotz, S. The exponentiated Fréchet distribution. Interstat Electron. J. 2003, 14, 1–7. [Google Scholar]
- Eliwa, M.S.; El-Morshedy, M.; Afify, A.Z. The odd Chen generator of distributions: Properties and estimation methods with applications in medicine and engineering. J. Natl. Sci. Found. Sri Lanka 2020, 48, 113–130. [Google Scholar] [CrossRef]
- Yousof, H.M.; Jahanshahi, S.M.A.; Sharma, V.K. The Burr X Fréchet Model for Extreme Values: Mathematical Properties, Classical Inference and Bayesian Analysis. Pak. J. Stat. Oper. Res. 2019, 15, 797. [Google Scholar] [CrossRef]
- Eliwa, M.S.; El-Morshedy, M.; Sajid, A. Exponentiated odd Chen-G family of distributions: Statistical properties, Bayesian and non-Bayesian estimation with applications. J. Appl. Stat. 2020, 1–27. [Google Scholar] [CrossRef]
- Krishna, E.; Jose, K.K.; Alice, T.; Risti, M.M. The Marshall-Olkin Fréchet distribution. Commun. Stat. Theory Methods 2013, 42, 4091–4107. [Google Scholar] [CrossRef]
- El-Morshedy, M.; Eliwa, M.S. The odd flexible Weibull-H family of distributions: Properties and estimation with applications to complete and upper record data. Filomat 2019, 33, 2635–2652. [Google Scholar] [CrossRef]
- Al-Babtain, A.A.; Elbatal, I.; Yousof, H.M. A new three parameter Fréchet model with mathematical properties and applications. J. Taibah Univ. Sci. 2020, 14, 265–278. [Google Scholar] [CrossRef]
- Al-babtain, A.A.; Elbatal, I.; Yousof, H.M. A New Flexible Three-Parameter Model: Properties, Clayton Copula, and Modeling Real Data. Symmetry 2020, 12, 440. [Google Scholar] [CrossRef]
- Yousof, H.M.; Altun, E.; Hamedani, G.G. A new extension of Frechet distribution with regression models, residual analysis and characterizations. J. Data Sci. 2018, 16, 743–770. [Google Scholar]
- Elsayed, H.A.H.; Yousof, H.M. The generalized odd generalized exponential Fréchet model: Univariate, bivariate and multivariate extensions with properties and applications to the univariate version. Pak. J. Stat. Oper. Res. 2020, 16, 529–544. [Google Scholar] [CrossRef]
- Korkmaz, M.C.; Yousof, H.M.; Ali, M.M. Some theoretical and computational aspects of the odd Lindley Fréchet distribution. İstatistikçiler Dergisi: İstatistik ve Aktüerya 2017, 10, 129–140. [Google Scholar]
- Yousof, H.M.; Butt, N.S.; Alotaibi, R.M.; Rezk, H.; Alomani, G.A.; Ibrahim, M. A new compound Fréchet distribution for modeling breaking stress and strengths data. Pak. J. Stat. Oper. Res. 2019, 1017–1035. [Google Scholar] [CrossRef]
- Alizadeh, M.; Cordeiro, G.M.; Nascimento, A.D.; Lima, M.D.C.S.; Ortega, E.M. Odd-Burr generalized family of distributions with some applications. J. Stat. Comput. Simul. 2017, 87, 367–389. [Google Scholar] [CrossRef]
- Gleaton, J.U.; Lynch, J.D. Properties of generalized loglogistic families of lifetime distributions. J. Probab. Stat. Sci. 2006, 4, 51–64. [Google Scholar]
- Gupta, R.C.; Gupta, R.D. Proportional reversed hazard rate model and its applications. J. Stat. Plan. Inference 2007, 137, 3525–3536. [Google Scholar] [CrossRef]
- Farlie, D.J.G. The performance of some correlation coefficients for a general bivariate distribution. Biometrika 1960, 47, 307–323. [Google Scholar] [CrossRef]
- Gumbel, E.J. Bivariate logistic distributions. J. Am. Stat. Assoc. 1961, 56, 335–349. [Google Scholar] [CrossRef]
- Gumbel, E.J. Bivariate exponential distributions. J. Am. Stat. Assoc. 1960, 55, 698–707. [Google Scholar] [CrossRef]
- Morgenstern, D. Einfache beispiele zweidimensionaler verteilungen. Mitteilingsblatt Mathematische Statistik 1956, 8, 234–235. [Google Scholar]
- Rodriguez-Lallena, J.A.; Ubeda-Flores, M. A new class of bivariate copulas. Stat. Probab. Lett. 2004, 66, 315–325. [Google Scholar] [CrossRef]
- Pougaza, D.B.; Djafari, M.A. Maximum entropies copulas. In Proceedings of the 30th International Workshop on Bayesian Inference and Maximum Entropy Methods in Science and Engineering, Chamonix, France, 4–9 July 2010. [Google Scholar]
- Mead, M.E.; Abd-Eltawab, A.R. A note on Kumaraswamy Fréchet distribution. Australia 2014, 8, 294–300. [Google Scholar]
- Mahmoud, M.R.; Mandouh, R.M. On the transmuted Fréchet distribution. J. Appl. Sci. Res. 2013, 9, 5553–5561. [Google Scholar]
- Karamikabir, H.; Afshari, M.; Yousof, H.M.; Alizadeh, M.; Hamedani, G.G. The Weibull Topp-Leone Generated Family of Distributions: Statistical Properties and Applications. J. Iran. Stat. Soc. 2020, 19, 121–161. [Google Scholar] [CrossRef]
- Barreto-Souza, W.M.; Cordeiro, G.M.; Simas, A.B. Some results for beta Fréchet distribution. Commun. Stat. Theory Methods 2011, 40, 798–811. [Google Scholar] [CrossRef]
- Shahbaz, M.Q.; Shahbaz, S.; Butt, N.S. The Kumaraswamy-Inverse Weibull Distribution. Pak. J. Stat. Oper. Res. 2012, 8, 479–489. [Google Scholar] [CrossRef]
- Nichols, M.D.; Padgett, W.J. A Bootstrap control chart for Weibull percentiles. Qual. Reliab. Eng. Int. 2006, 22, 141–151. [Google Scholar] [CrossRef]
- Yousof, H.M.; Rasekhi, M.; Altun, E.; Alizadeh, M. The extended odd Frechet family of distributions: Properties, applications and regression modeling. Int. J. Appl. Math. Stat. 2018, 30, 1–30. [Google Scholar]
- Chakraborty, S.; Handique, L.; Altun, E.; Yousof, H.M. A New Statistical Model for Extreme Values: Properties and Applications. Int. J. Open Probl. Compt. Math 2019, 12, 67–84. [Google Scholar]
- Haq, M.A.; Yousof, H.M.; Hashmi, S. A New Five-Parameter Fréchet Model for Extreme Values. Pak. J. Stat. Oper. Res. 2017, 617–632. [Google Scholar] [CrossRef][Green Version]
- Yousof, H.M.; Afify, A.Z.; Abd El Hadi, N.E.; Hamedani, G.G.; Butt, N.S. On six-parameter Fréchet distribution: Properties and applications. Pak. J. Stat. Oper. Res. 2016, 12, 281–299. [Google Scholar] [CrossRef]
- Aarset, M.V. How to identify a bathtub hazard rate. IEEE Trans. Reliab. 1987, 36, 106–108. [Google Scholar] [CrossRef]
- Smith, R.L.; Naylor, J.C. A comparison of maximum likelihood and bayesian estimators for the three-parameter Weibull distribution. Appl. Stat. 1987, 36, 358–369. [Google Scholar] [CrossRef]
- Wingo, D.R. Maximum likelihood methods for fitting the Burr type XII distribution to life test data. Biom. J. 1983, 25, 77–84. [Google Scholar] [CrossRef]
- Bagdonavičius, V.; Nikulin, M. Chi-squared goodness-of-fit test for right censored data. Int. J. Appl. Math. Stat. 2011, 24, 30–50. [Google Scholar]
- Goual, H.; Yousof, H.M. Validation of Burr XII inverse Rayleigh model via a modified chi-squared goodness-of-fit test. J. Appl. Stat. 2020, 47, 393–423. [Google Scholar] [CrossRef]
- Goual, H.; Yousof, H.M.; Ali, M.M. Lomax inverse Weibull model: Properties, applications, and a modified Chi-squared goodness-of-fit test for validation. J. Nonlinear Sci. Appl. 2020, 13, 330–353. [Google Scholar] [CrossRef]
- Goual, H.; Yousof, H.M.; Ali, M.M. Validation of the odd Lindley exponentiated exponential by a modified goodness of fit test with applications to censored and complete data. Pak. J. Stat. Oper. Res. 2019, 15, 745–771. [Google Scholar] [CrossRef]
- Mansour, M.M.; Ibrahim, M.; Aidi, K.; Shafique Butt, N.; Ali, M.M.; Yousof, H.M.; Hamed, M.S. A New Log-Logistic Lifetime Model with Mathematical Properties, Copula, Modified Goodness-of-Fit test for Validation and Real Data Modeling. Mathematics 2020, 8, 1508. [Google Scholar] [CrossRef]
- Mansour, M.; Korkmaz, M.C.; Ali, M.M.; Yousof, H.M.; Ansari, S.I.; Ibrahim, M. A Generalization of the exponentiated Weibull Model with Properties, Copula and Application. Eurasian Bull. Math. 2020, 3, 84–102. [Google Scholar]
- Mansour, M.; Rasekhi, M.; Ibrahim, M.; Aidi, K.; Yousof, H.M.; Elrazik, E.A. A New Parametric Life Distribution with Modified Bagdonavičius-Nikulin Goodness-of-Fit Test for Censored Validation, Properties, Applications, and Different Estimation Methods. Entropy 2020, 22, 592. [Google Scholar] [CrossRef]
- Ravi, V.; Gilbert, P.D. BB: An R package for solving a large system of nonlinear equations and for optimizing a high-dimensional nonlinear objective function. J. Stat. Softw. 2009, 32, 1–26. [Google Scholar]
- Ibrahim, M.; Yadav, A.S.; Yousof, H.M.; Goual, H.; Hamedani, G.G. A new extension of Lindley distribution: Modified validation test, characterizations and different methods of estimation. Commun. Stat. Appl. Methods 2019, 26, 473–495. [Google Scholar] [CrossRef]
- Yadav, A.S.; Goual, H.; Alotaibi, R.M.; Ali, M.M.; Yousof, H.M. Validation of the Topp-Leone-Lomax model via a modified Nikulin-Rao-Robson goodness-of-fit test with different methods of estimation. Symmetry 2020, 12, 57. [Google Scholar] [CrossRef]
- Abouelmagd, T.H.M.; Hamed, M.S.; Handique, L.; Goual, H.; Ali, M.M.; Yousof, H.M.; Korkma, M.C. A new class of distributions based on the zero truncated Poisson distribution with properties and applications. J. Nonlinear Sci. Appl. 2019, 12, 152–164. [Google Scholar] [CrossRef]
- Abouelmagd, T.H.M.; Hamed, M.S.; Hamedani, G.G.; Ali, M.M.; Goual, H.; Korkmaz, M.C.; Yousof, H.M. The zero truncated Poisson Burr X family of distributions with properties, characterizations, applications, and validation test. J. Nonlinear Sci. Appl. 2019, 12, 314–336. [Google Scholar] [CrossRef]
Publisher’s Note: MDPI stays neutral with regard to jurisdictional claims in published maps and institutional affiliations. |
© 2020 by the authors. Licensee MDPI, Basel, Switzerland. This article is an open access article distributed under the terms and conditions of the Creative Commons Attribution (CC BY) license (http://creativecommons.org/licenses/by/4.0/).