1. Introduction
High–throughput DNA sequencing has become a central tool in modern biological and medical research [
1,
2,
3,
4,
5], supporting applications ranging from infectious-disease surveillance and cancer genomics to metagenomic profiling and evolutionary analysis [
6,
7,
8]. Although sequencing technologies continue to advance in speed and throughput, most platforms still produce large collections of short DNA fragments rather than contiguous genomes. The task of computationally reconstructing a long DNA sequence from millions of short reads remains one of the core algorithmic challenges in bioinformatics, with direct implications for downstream analyses such as variant calling, genome annotation, and phylogenetic inference [
9,
10,
11].
A mathematical representation of this reconstruction problem is provided by the
k-mer model [
12,
13,
14], in which all substrings of length
k extracted from an unknown genome are assumed to be available. These
k-mers naturally define a directed multigraph whose vertices correspond to
-mers and whose edges represent overlaps between consecutive substrings. This construction yields a De Bruijn-type graph [
15,
16,
17] in which the genome corresponds to an Eulerian path or cycle, provided that the appropriate degree-balance conditions hold [
17,
18,
19,
20]. As a result, genome assembly can be defined in terms of classical objects in graph theory such as directed multigraphs, Eulerian traversals, and the combinatorial structure of overlap patterns. More specifically, graph theory allows reconstruction accuracy to be studied through discrete mathematical principles.
Full-scale assemblers such as Velvet [
21], SPAdes [
22], and ABySS [
23] have enabled this framework for real sequencing data by incorporating extensive preprocessing, error correction, graph pruning, and coverage normalization. While these tools are important in practice, their complexity makes it difficult to isolate the underlying mathematical mechanisms that guarantee successful reconstruction. In particular, the many engineering layers of practical assembly pipelines obscure the fundamental questions of how likely branching is in De Bruijn graphs, whether Eulerian paths are unique, and what the algorithmic cost of graph traversal is.
Beyond its algorithmic formulation, genome reconstruction is fundamentally constrained by biological sequence structure. Real DNA sequences are not arbitrary strings; they are shaped by evolutionary processes such as mutation, selection, and replication, which induce non-uniform nucleotide frequencies, local correlations, and repeated motifs. These features directly affect the structure of k-mer overlaps. From the perspective of graph-based assembly, such biological properties manifest as collisions among -mer prefixes in the associated De Bruijn graph, creating branching vertices that destroy the uniqueness of Eulerian paths and render exact reconstruction impossible without additional information. Consequently, even in idealized, error-free settings, reconstruction accuracy is limited by intrinsic properties of the genome rather than by shortcomings of the algorithm.
This work focuses on the mathematical structure underlying the reconstruction problem. We study genome assembly through directed graphs formed by k-mer overlaps, with the goal of identifying the conditions under which reconstruction is possible and understanding why it fails when those conditions are not met. In particular, we examine how the structure of the graph affects the existence and uniqueness of Eulerian paths. This approach separates fundamental limitations of reconstruction from the practical details of existing assembly software.
A central objective of this study is to relate these graph-theoretic limits to simple models of DNA sequence generation. In addition to uniformly random genomes, we consider basic stochastic models that reflect mutation processes, including the Jukes–Cantor model and related variants. These models allow us to quantify how sequence correlations and repeated patterns influence branching behavior and reconstruction success.
By focusing on mathematical structure rather than software-specific techniques, this study clarifies the main factors that determine reconstruction outcomes. The results show how graph structure and probability shape the limits of genome assembly. Rather than introducing a new algorithmic framework, the contribution of this work is a mathematically self-contained treatment of the foundational layer of genome assembly: it derives explicit closed-form thresholds for reconstruction success as a function of k and L, extends the branching-probability analysis to biologically motivated Markov models with matching closed-form expressions, and validates these predictions against simulation in a unified framework. Theoretical analyses of assembly from an information-theoretic perspective provide complementary views of identifiability limits; the branching-probability framework developed here can be understood as a combinatorial analogue of such conditions. This perspective also provides a starting point for studying more complex and biologically realistic models.
2. Materials and Methods
The reconstruction procedure developed in this work relies on the classical k-mer formulation of the genome assembly problem. Given a set of substrings of length k drawn from an unknown genome, the objective is to recover the original sequence by exploiting the combinatorial structure implicit in the overlaps between consecutive substrings. The method consists of three main components: representation of the input data as a directed multigraph, construction of an efficient data structure to store this graph, and extraction of an Eulerian traversal from which the genome can be recovered.
2.1. k-mer Representation and Graph Model
For a genome of length L, the set of k-mers consists of the overlapping substrings of length k. Each k-mer admits a natural decomposition into its -prefix and -suffix. These substrings form the vertices of a directed multigraph, while each k-mer corresponds to a directed edge from its prefix to its suffix. The resulting graph captures the adjacency constraints imposed by the genome itself: if a k-mer occurs in the sequence, then the prefix must be immediately followed by the suffix .
This graph-theoretic representation is a variant of the De Bruijn graph, adapted to the multigraph setting in which repeated k-mers are preserved rather than collapsed. Duplicates encode essential multiplicity information and must not be removed, since accurate reconstruction depends on maintaining correct indegree and outdegree relationships. When the graph satisfies the classical degree-balance conditions—namely, that every vertex has equal indegree and outdegree, aside from possibly two vertices whose imbalance differs by one—a directed Eulerian path exists and yields a valid reconstruction of the original genomic sequence.
2.2. Graph Construction Using a Balanced Search Tree
To construct the graph, it is necessary to store a potentially large set of -mers together with their adjacency lists. Rather than employing hash tables, which may exhibit unpredictable worst-case behavior for adversarial or highly repetitive inputs, we adopt a height-balanced binary search tree as the core data structure. In this framework, each distinct prefix or suffix encountered during input processing becomes a node of the tree, and each node maintains a list of outgoing edges corresponding to the k-mers originating from it.
The use of a balanced tree ensures that search and insertion operations occur in logarithmic time with respect to the number of vertices, even when the input contains large families of closely related substrings. This property provides a clear asymptotic bound on the cost of graph construction and isolates the structural complexity of the k-mer set from unpredictable hashing effects. Once all k-mers have been processed, the tree encodes both the vertex set and the adjacency structure of the directed multigraph.
The balanced binary search tree guarantees time per insertion and lookup, where V is the number of distinct -mers, yielding an overall graph construction cost of for k-mers. Hash tables achieve expected time per operation but may degrade to per operation in the worst case under adversarial or highly repetitive inputs—precisely the regime of interest when analyzing repeat-rich genomic sequences. Both approaches require space. The balanced tree is therefore chosen here for its worst-case analytical tractability, which supports the theoretical analysis of this paper, rather than as a claim of empirical superiority over hash-based implementations.
2.3. Eulerian Path Extraction
With the graph constructed, the reconstruction reduces to identifying an Eulerian path. This work implements a stack-based variant of Hierholzer’s algorithm, which is well suited to directed multigraphs and provides a straightforward mechanism for ensuring that every edge is used exactly once. The algorithm begins at a vertex whose outdegree exceeds its indegree, if such a vertex exists; otherwise, any vertex may serve as a valid starting point.
During traversal, edges are removed from adjacency lists as they are explored. Whenever the current vertex has no remaining outgoing edges, it is appended to the partial path, and the algorithm backtracks by popping a vertex from the auxiliary stack. This process continues until all edges have been exhausted. Reversing the order of the accumulated vertices yields the Eulerian path.
For clarity, the procedure is summarized in Algorithm 1.
| Algorithm 1 Stack-based Hierholzer Eulerian Path |
| Require: Directed multigraph satisfying Eulerian path conditions |
| Ensure: Eulerian path as an ordered list of vertices |
| 1: | Let vertex with , or any vertex if none exists |
| 2: | Initialize stack , path |
| 3: | while S is not empty do |
| 4: | |
| 5: | if v has remaining outgoing edges then |
| 6: | Remove one outgoing edge from G |
| 7: | |
| 8: | else |
| 9: | ; append v to P |
| 10: | end if |
| 11: | end while |
| 12: | return reverse of P |
2.4. Sequence Reconstruction
The final genome sequence is reconstructed directly from the Eulerian path. Given a sequence of vertices
each representing a
-mer, the assembled genome is obtained by concatenating the characters of
with the final character of each successive vertex. This procedure recovers every
k-mer exactly once and, under the usual degree-balance conditions, reproduces the genome that generated the input data.
The combination of balanced-tree graph construction and stack-based Eulerian traversal yields an algorithm that is efficient, transparent, and mathematically analyzable. The probabilistic behavior of the resulting graphs, particularly the likelihood of branching as a function of L and k, is examined in the Results section.
3. Results and Discussion
3.1. Illustrative Examples of Genome Reconstruction
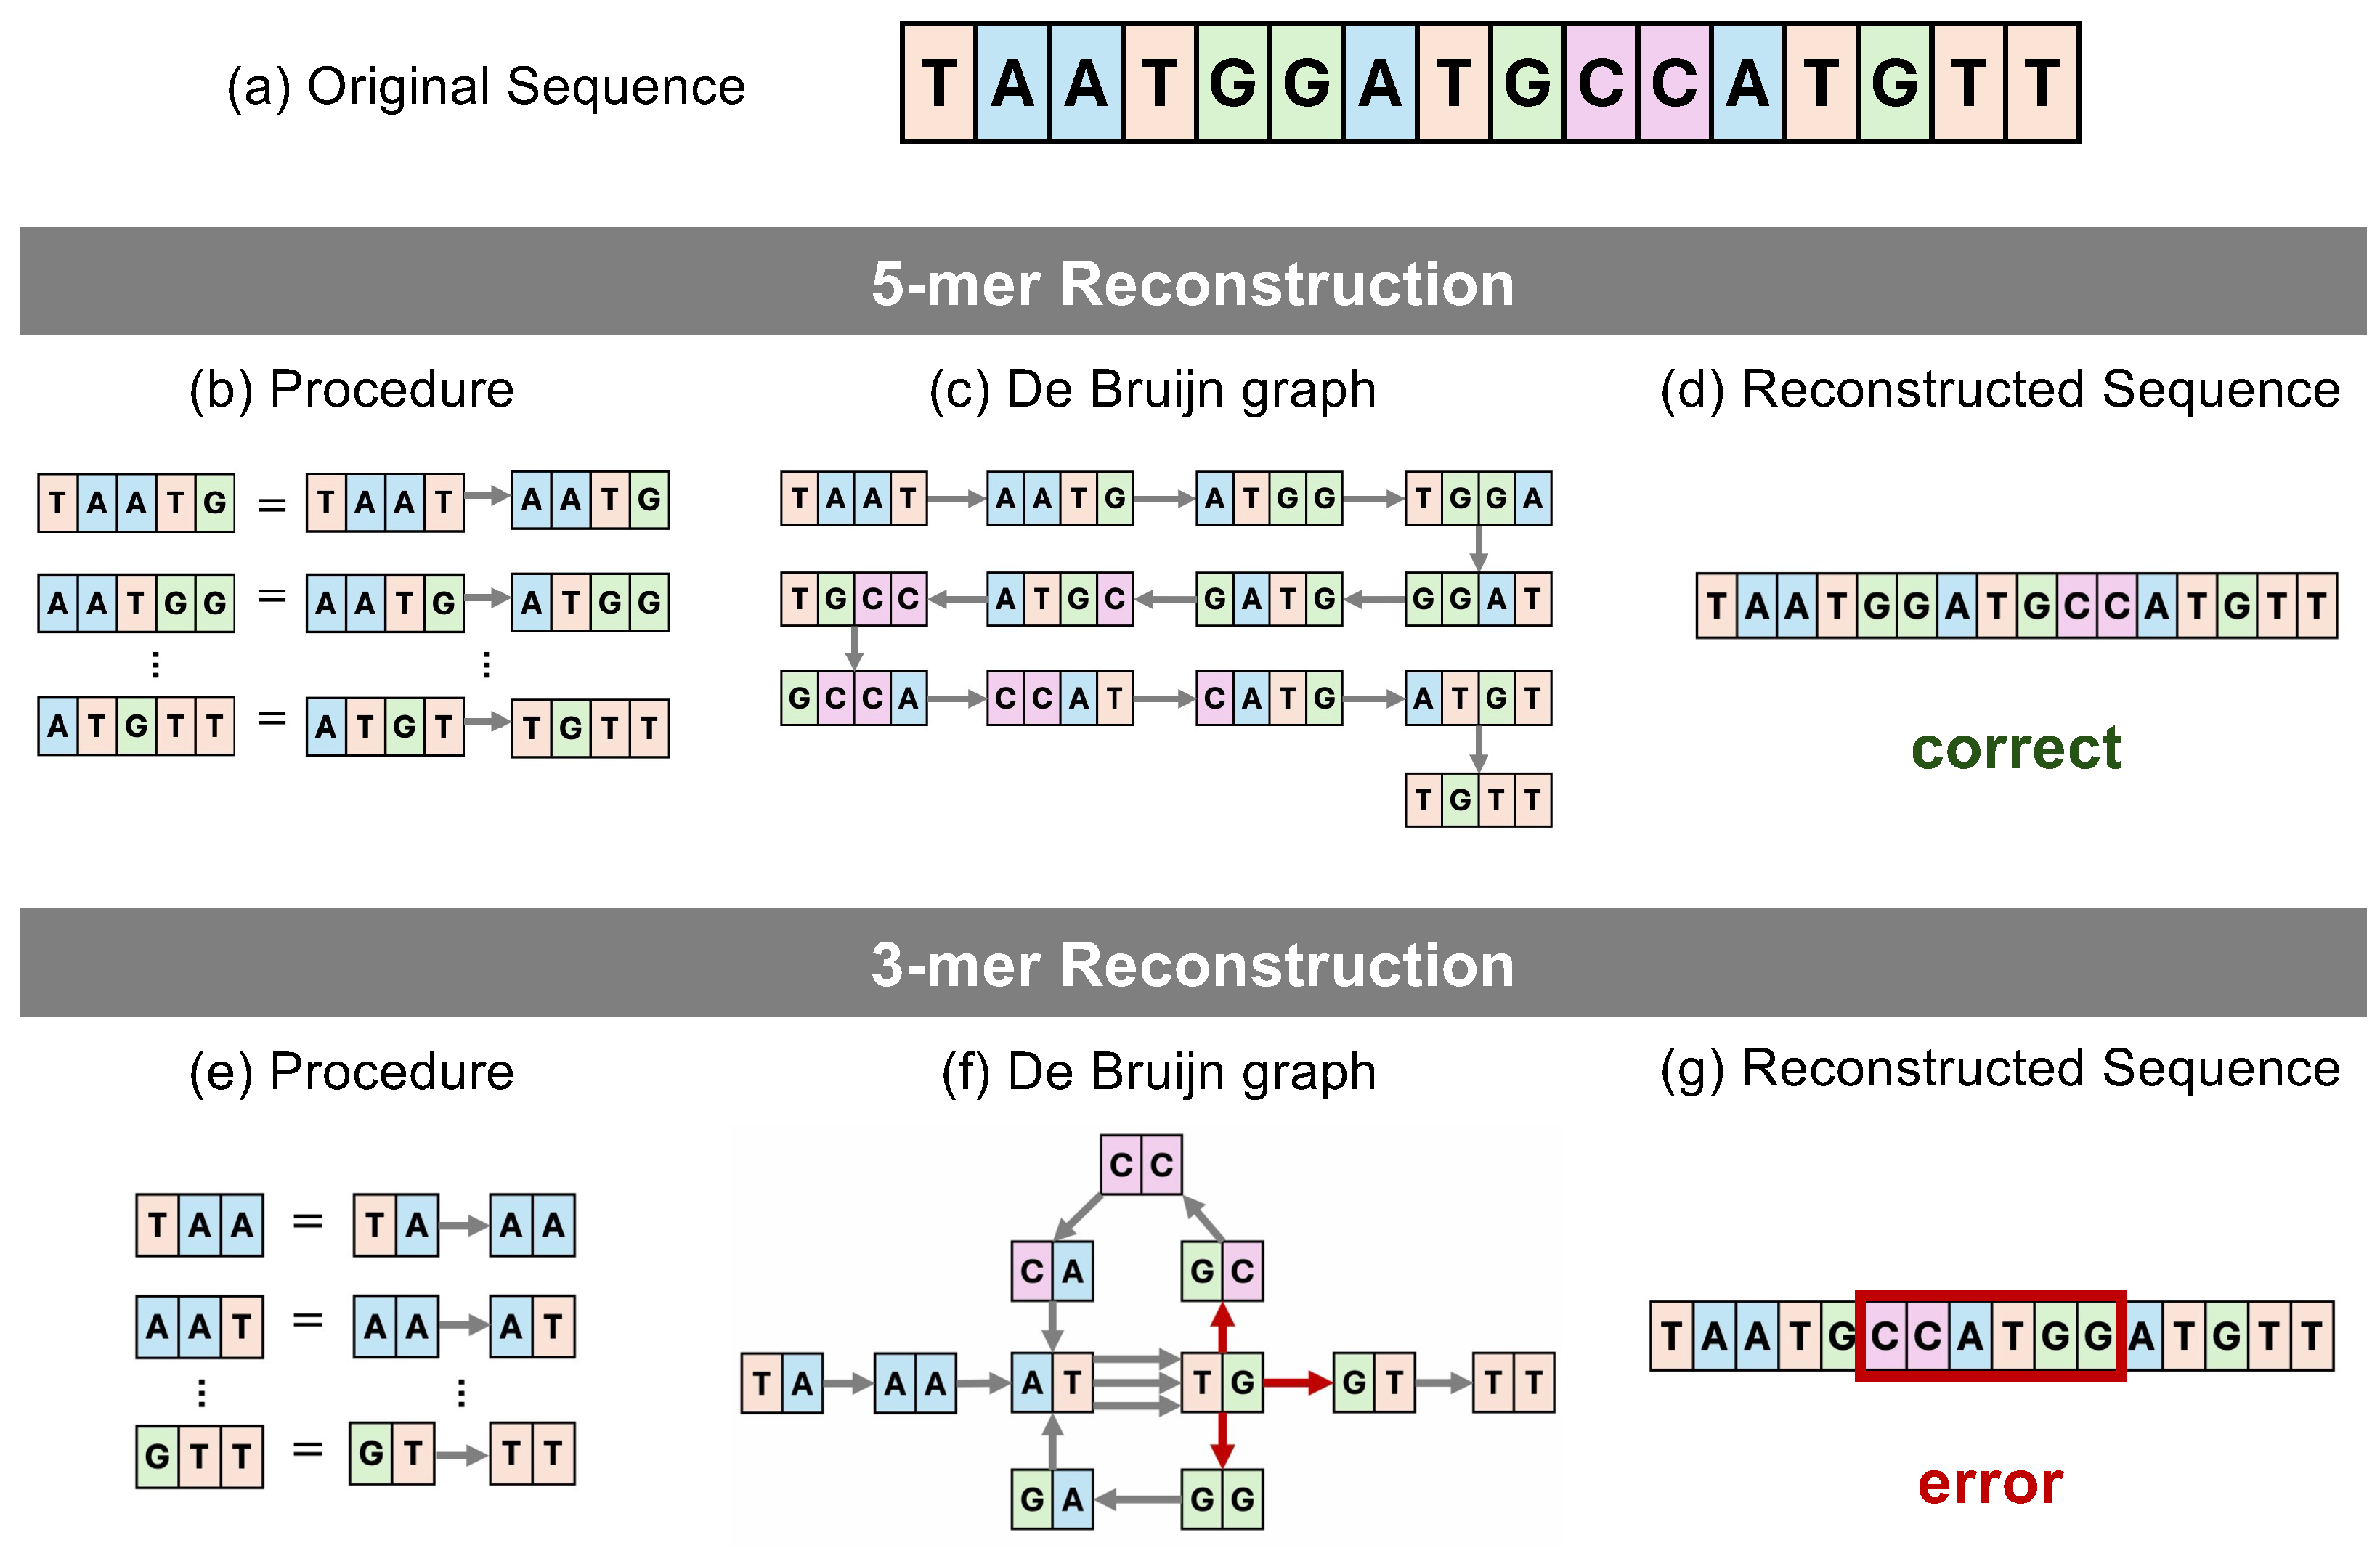
To verify the correctness of the reconstruction algorithm, we first consider a synthetic genome (
Figure 1a) with fragment length
. The original sequence is
which has genome length
, also as shown in
Figure 1a. This sequence contains 12 unique 5-mers. As shown in
Figure 1b, each 5-mer defines a prefix–suffix edge. Collectively, these edges form the directed multigraph shown in
Figure 1c. In this graph, there is a unique vertex,
TAAT, whose outdegree exceeds its indegree, identifying it as the sole possible starting point of an Eulerian path. Applying the traversal algorithm produces a path whose concatenation exactly reproduces the original genome (
Figure 1d).
This deterministic example illustrates the algorithm in an ideal setting where the De Bruijn graph contains no branching. When each vertex has at most one outgoing edge, the Eulerian path is unique, and the reconstruction is guaranteed to recover the true genome. This confirms the correctness of both the graph construction and the traversal routine.
In contrast, when we construct the De Bruijn graph using 3-mers (
), as shown in
Figure 1e, ambiguities arise. In particular, three distinct 3-mers share the same prefix:
TGT,
TGC, and
TGG. This leads to branching in the directed graph, highlighted by the red arrows in
Figure 1f. As a result, the Eulerian path is no longer unique.
Figure 1g shows an incorrectly reconstructed sequence,
which occurs because the algorithm incorrectly chooses the branch
TG→
GC at the first branching point. This example underscores the importance of selecting an appropriate fragment length
k to avoid ambiguities in genome reconstruction.
3.2. Empirical Reconstruction Accuracy on Random Genomes
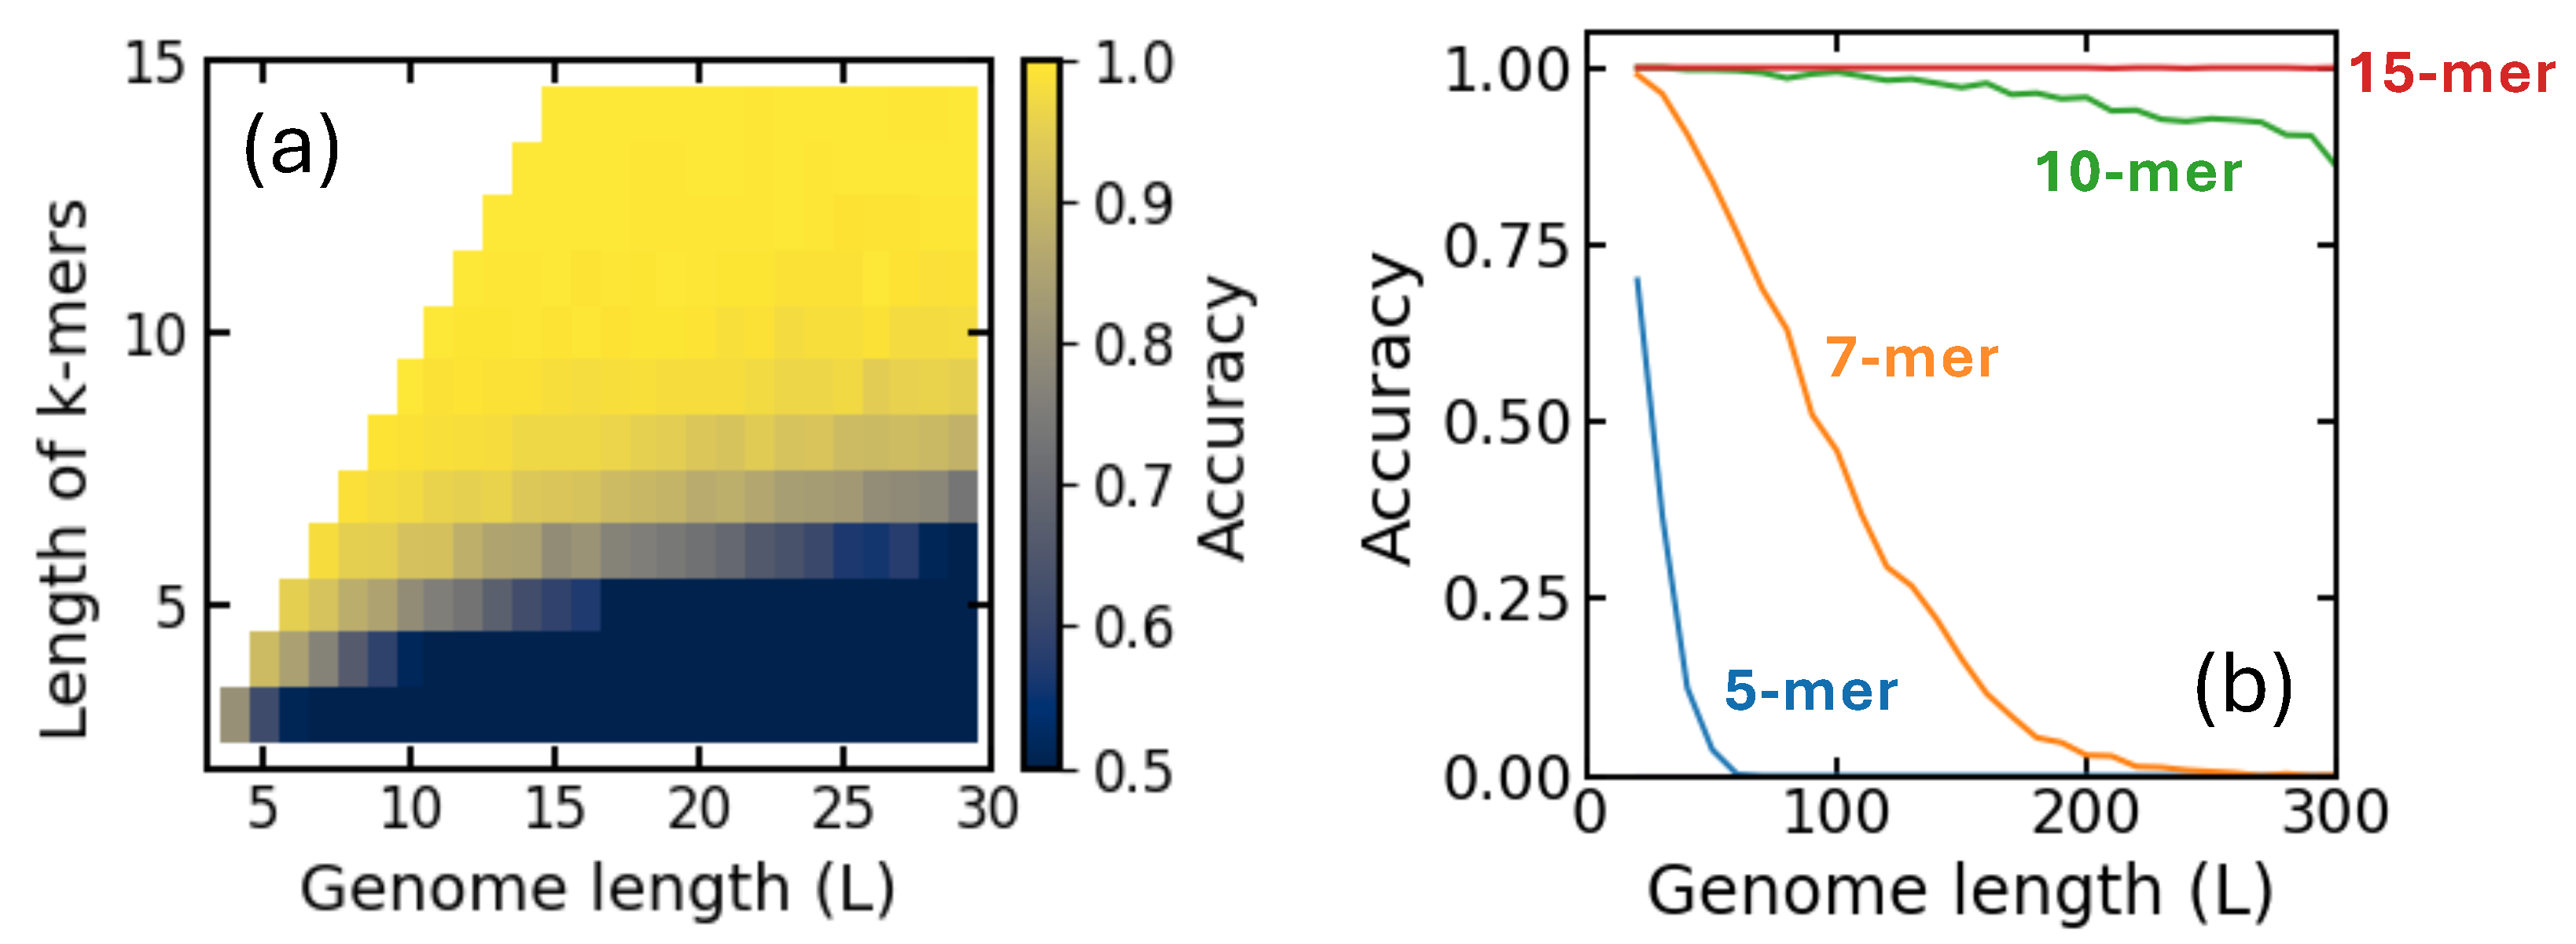
To assess the reconstruction algorithm under more general conditions, we evaluate its performance on randomly generated genomes of varying lengths. As shown in
Figure 2a, a heat map summarizes reconstruction accuracy across a range of values for the genome length
L and the fragment length
k. The color scale represents the empirical accuracy obtained from simulation. The results reveal a clear structural pattern. For a fixed fragment length
k, accuracy decreases as
L increases, reflecting the growing likelihood of distinct
k-mers sharing the same
-prefix in longer genomes. Such collisions introduce branching in the De Bruijn graph, producing multiple admissible Eulerian paths and thus destroying path uniqueness. In contrast, as
k increases, accuracy rises sharply. Since the number of possible
-mers grows exponentially as
, the probability that two substrings share the same prefix decreases rapidly as
k increases. As a result, branching in the De Bruijn graph becomes less likely, and reconstruction accuracy improves sharply. The heat map therefore shows a clear transition from low to high accuracy as
k increases, reflecting a threshold effect driven by the combinatorial growth of the
-mer space.
From a biological perspective,
Figure 2b represents a best-case baseline in which the genome behaves approximately as a uniform random sequence. Under this assumption,
-mer prefixes are sampled nearly uniformly from the set of all possible prefixes, and branching arises mainly from finite-length prefix collisions. The reconstruction accuracy shows a strong dependence on the fragment length
k. For
, accuracy drops rapidly as genome length increases and approaches zero for moderately long genomes. For
, accuracy also decreases with genome length, but the decline is slower and remains nonzero over a wider range. In contrast,
maintains high accuracy across most genome lengths shown, with only a gradual decrease for long genomes. For
, reconstruction accuracy remains 1 across the entire range, indicating that branching is rare. This progression illustrates how increasing
k suppresses prefix collisions and leads to a sharp transition from unreliable to reliable reconstruction.
3.3. Inferring Reconstruction Limits from Theoretical Probability
The empirical behavior displayed in
Figure 2 aligns closely with the theoretical branching model. The probability that reconstruction succeeds depends on the probability that no vertex in the De Bruijn graph has more than one outgoing edge. In random genomes, branching occurs when two
k-mers share the same
-prefix but differ in their final character. Approximating the
prefixes as independent samples drawn uniformly from an alphabet of size
, the probability that all prefixes are distinct is
where the approximation follows from the Poisson limit of the binomial distribution when
.
Branching occurs only when identical prefixes are followed by different suffixes. Under a uniform i.i.d. model over the four-letter alphabet
, the final nucleotide of each
k-mer is drawn uniformly and independently. The probability that two such nucleotides differ is
. Since two
k-mers sharing a prefix therefore have a probability
of differing in their final nucleotide, the probability that no branching occurs can be approximated by
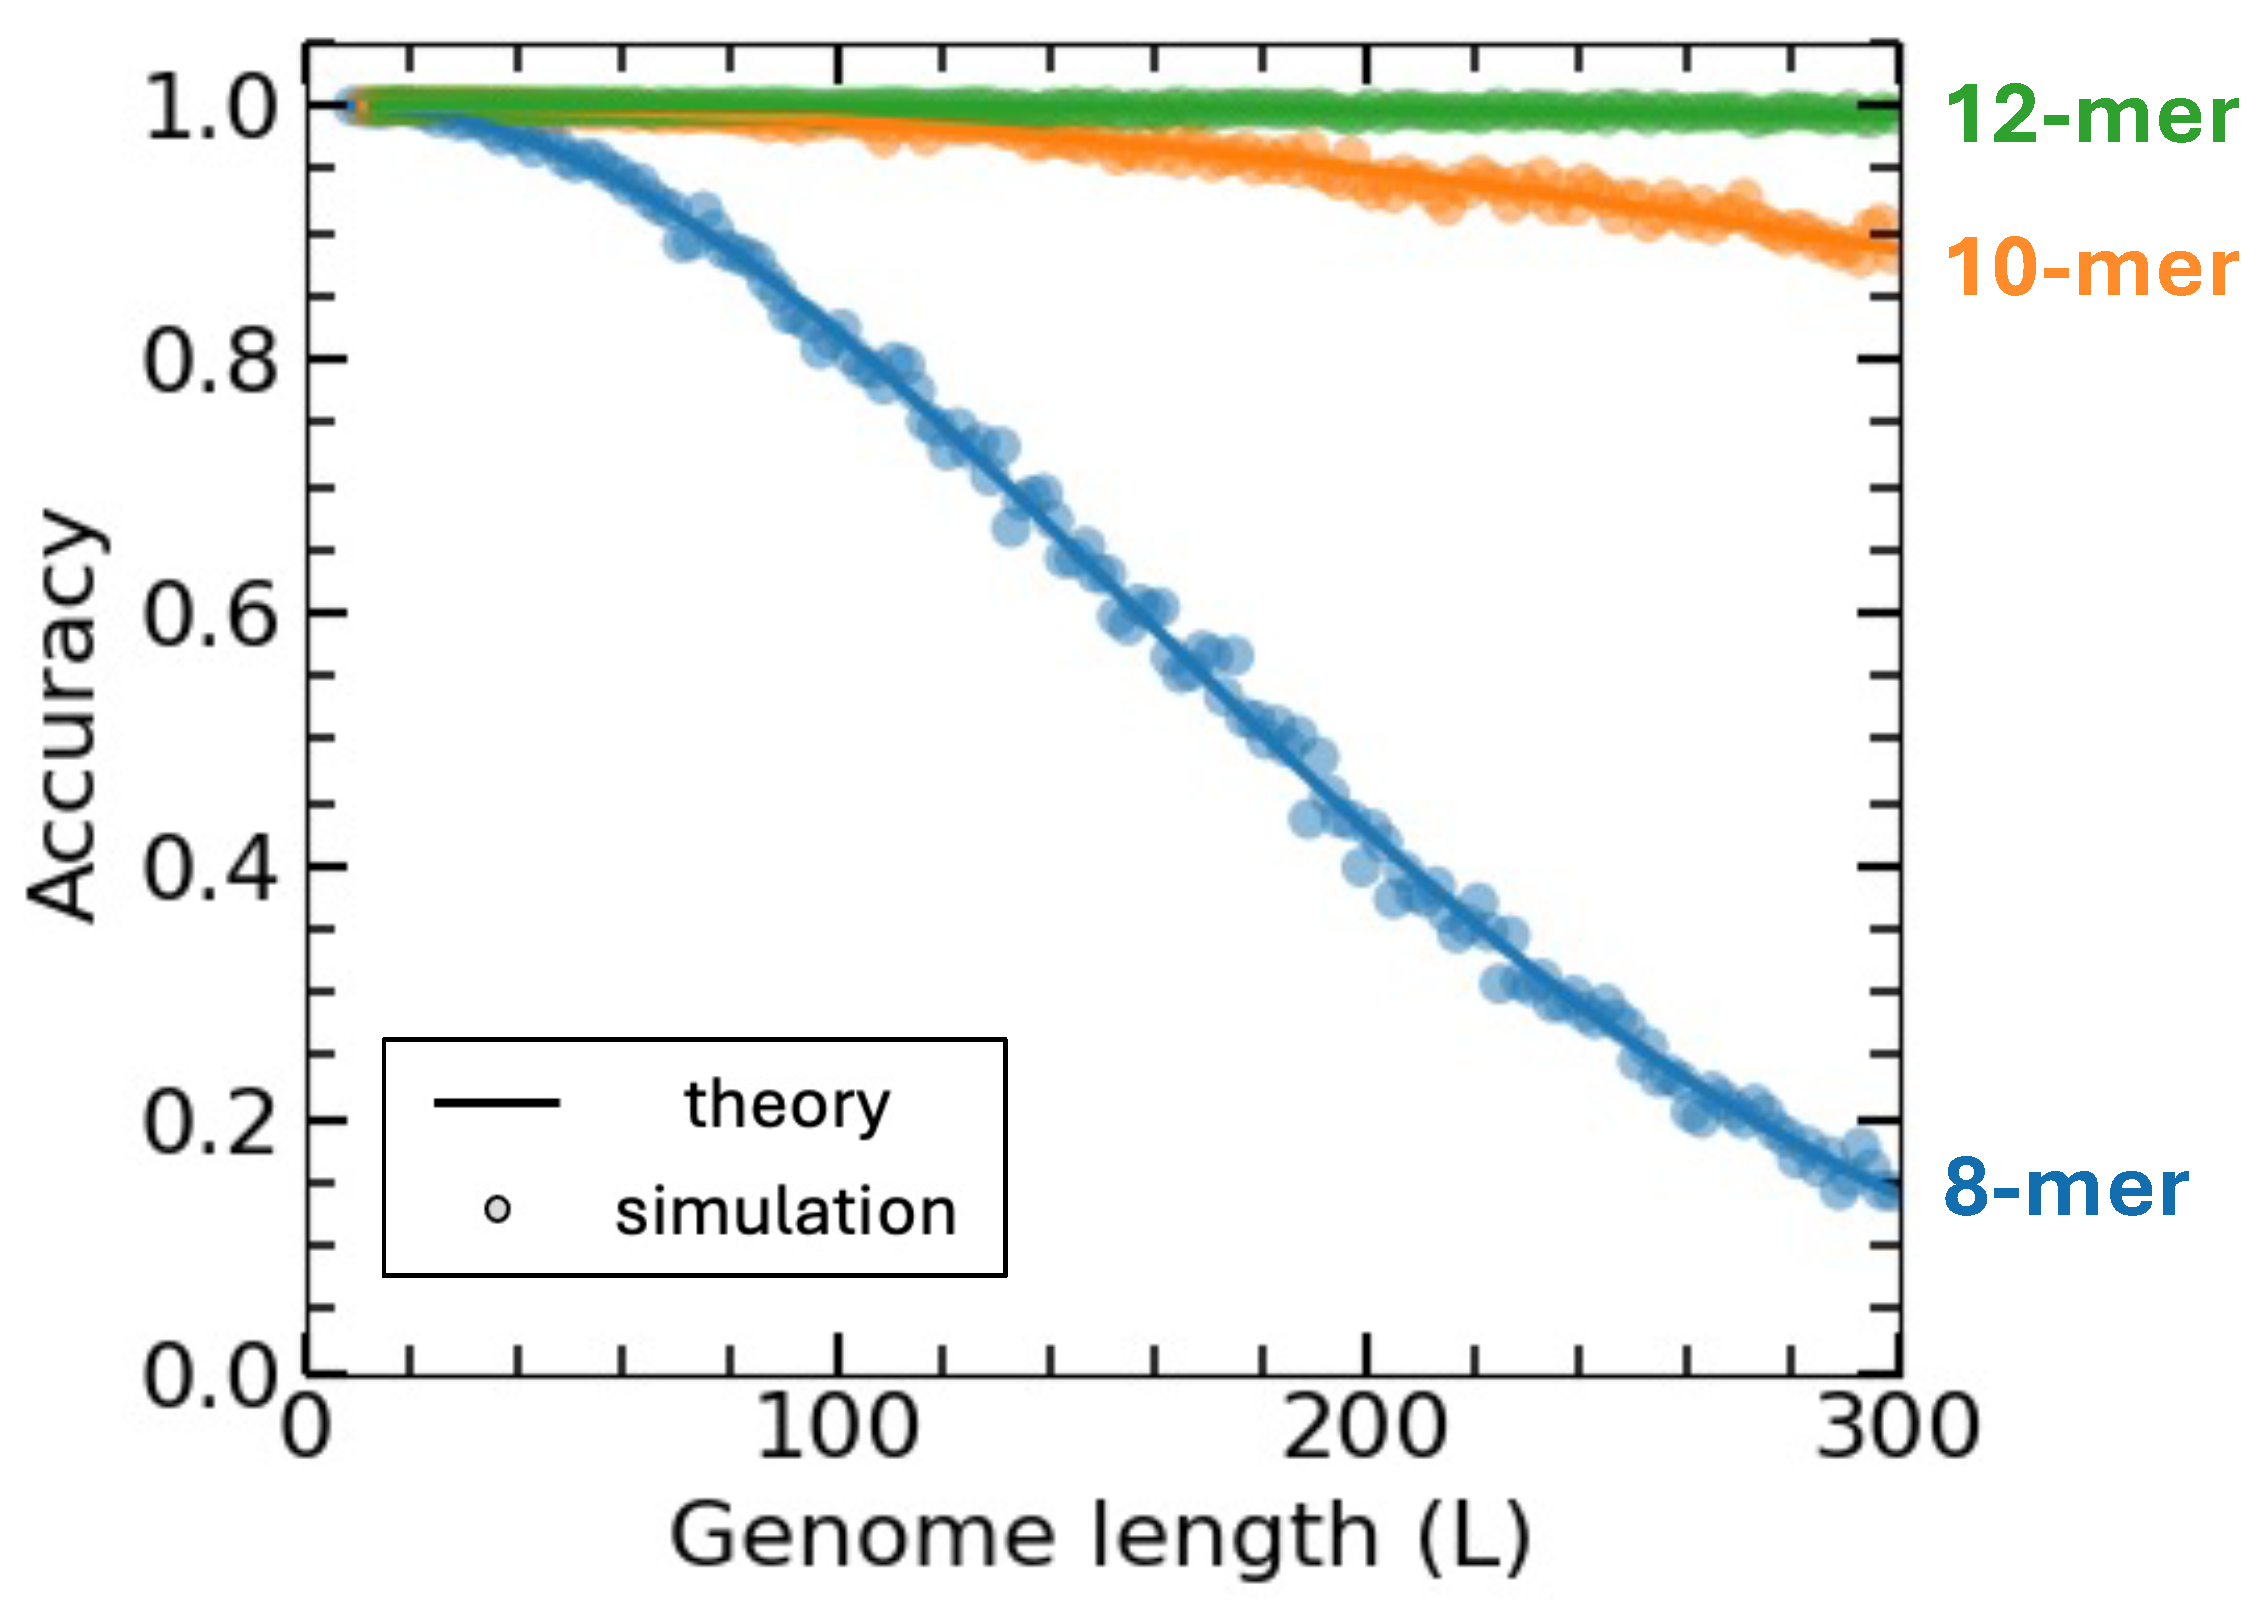
Figure 3 presents a direct comparison between this theoretical curve and simulation results for
and genome lengths up to
. The dots in the plot represent empirical accuracy values obtained from simulation, while the solid curves correspond to the theoretical prediction above. The alignment between the two demonstrates that branching is the dominant mechanism limiting exact reconstruction in the noiseless setting. More importantly, the sharp increase in accuracy predicted by theory as
k increases is mirrored almost exactly by the simulated accuracy points.
From a biological perspective, branching reflects a fundamental limitation on the ability to reconstruct a genome from short fragments. When different genomic locations share the same prefix, the same collection of k-mers can correspond to more than one underlying sequence. In such cases, the genome cannot be uniquely recovered from k-mer information alone, even in the absence of sequencing error.
Figure 3 compares theoretical predictions with simulation results for
,
, and
. For
, reconstruction accuracy decreases steadily as genome length increases, with substantial disagreement from perfect reconstruction at moderate lengths. This behavior indicates frequent prefix collisions and widespread branching. For
, accuracy remains high for shorter genomes but shows a gradual decline as genome length grows, reflecting a reduced but still non-negligible rate of branching. In contrast, for
, reconstruction accuracy stays close to 100% across the entire range of genome lengths shown, suggesting that prefix collisions are rare and branching events are uncommon. The strong agreement between simulation results and theoretical predictions in all three cases confirms that the branching probability captures the dominant mechanism limiting reconstruction.
The explicit expression for
provides a practical guideline for choosing the fragment length
k. Solving the condition
yields
which implies that a genome of length
requires only
to achieve at least
expected reconstruction accuracy. This scaling explains the sharp transition observed in
Figure 2. Once
k exceeds this logarithmic threshold, prefix collisions become unlikely, branching is strongly suppressed, and exact reconstruction becomes reliable.
Figure 2 and
Figure 3 therefore illustrate the same underlying effect from complementary perspectives. The heat map shows how reconstruction accuracy changes across a wide parameter range, while
Figure 3 demonstrates that this behavior is well predicted by a simple branching model. Together, these results show that reconstruction performance is limited primarily by sequence overlap structure rather than by algorithmic choices, and that fragment length plays a decisive role in determining whether a genome can be uniquely assembled.
Table 1 reports the empirical wall-clock runtime of the reconstruction pipeline at the recommended fragment length
across genome lengths spanning three orders of magnitude. The roughly linear growth in runtime with
L is consistent with the
theoretical complexity of the balanced search tree construction, confirming that the implementation scales predictably in practice.
3.4. Markov Models of DNA Sequence and Reconstruction
DNA sequences can be naturally modeled as Markov chains, where the four nucleotides
constitute the state space and the probability of observing a nucleotide depends on a finite number of preceding bases. This perspective captures local dependencies such as codon structure, regulatory motifs, and context-dependent mutation patterns that are not described by simple independent and identically distributed models. In practice, we specify the transition matrix
P over the four nucleotides and generate the sequence by sampling sequentially. When the current position in the sequence is
, the probability of the next nucleotide
y is given by
, where
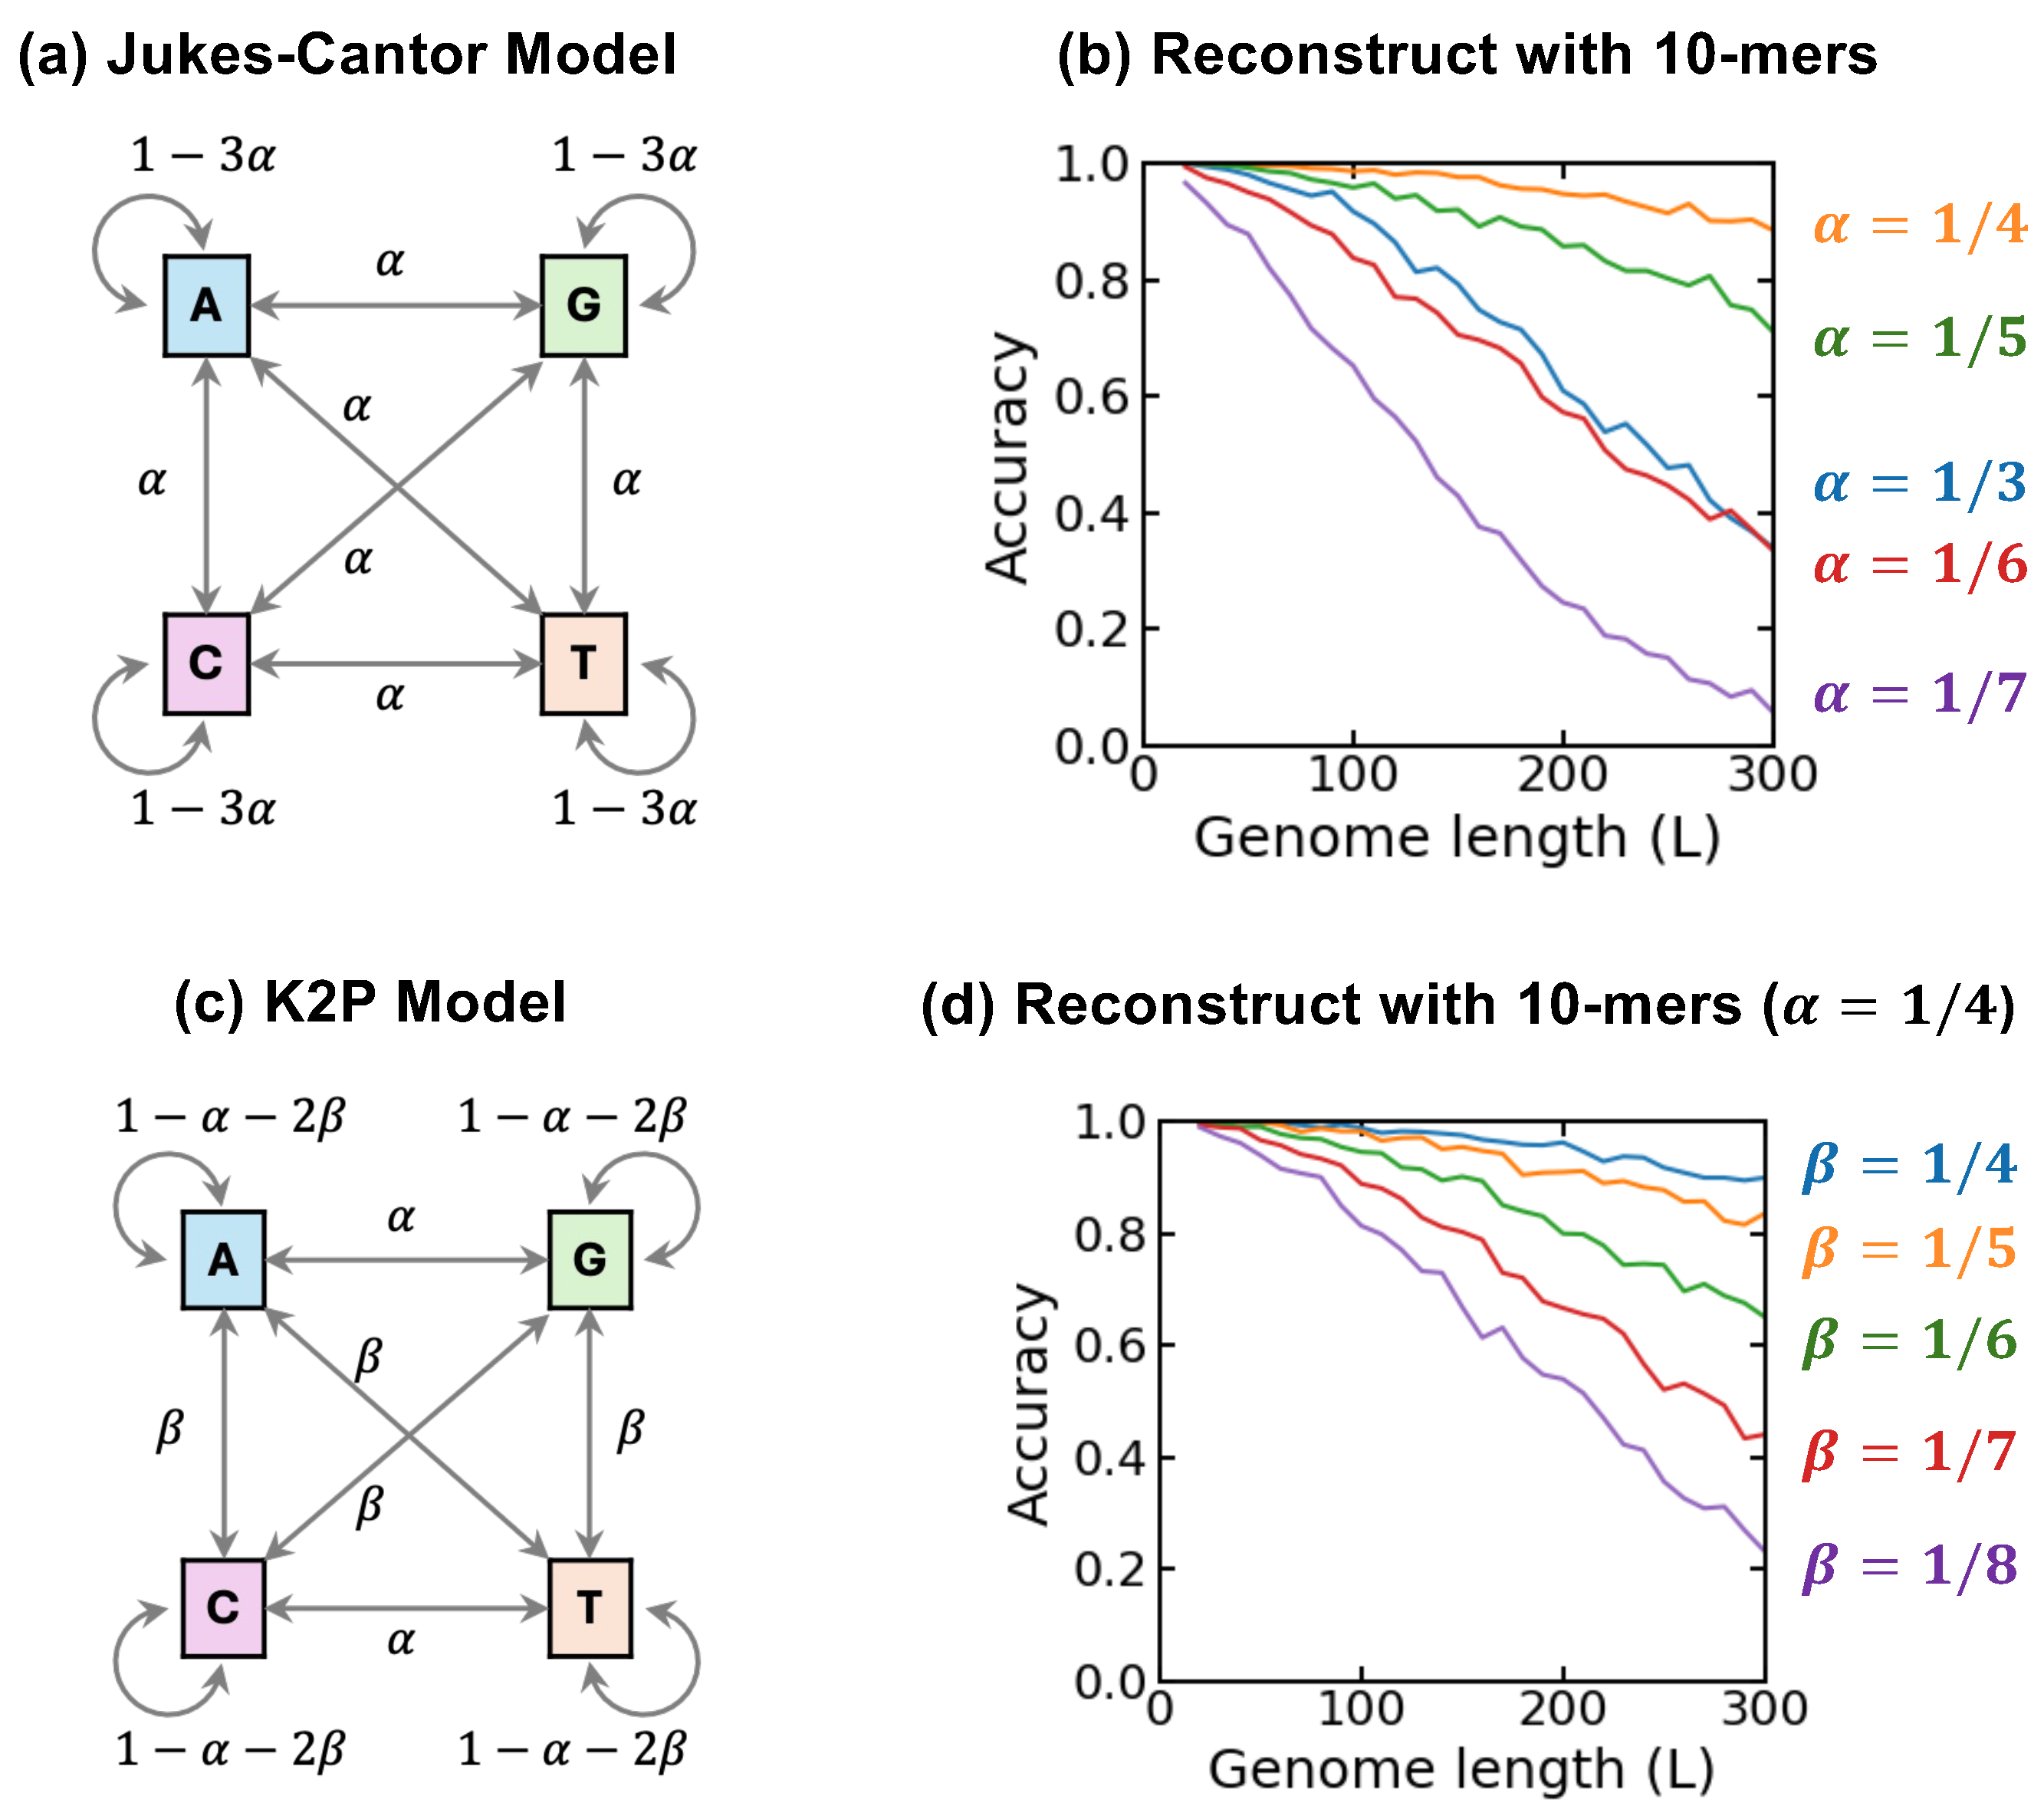
The simplest Markov model for DNA sequence generation is the Jukes-Cantor model, which assumes that all substitutions between different nucleotides occur with equal probability
. Under this assumption, the overall rate of substitution away from a given nucleotide is
, so the probability that the nucleotide at the next position is unchanged equals
. The graphical representation of the Jukes–Cantor model is shown in
Figure 4a. The corresponding transition probability matrix is:
The parameter lies in the range . In particular, corresponds to the extreme case in which consecutive nucleotides are never identical. The stationary distribution of the nucleotides for this Markov chain is , indicating that each nucleotide appears with equal probability in the long run.
Biologically, the Jukes–Cantor model can be viewed as a maximally symmetric “null” model for mutation: all substitutions between distinct nucleotides occur at the same rate, and the stationary nucleotide composition is uniform. Although real genomes often exhibit biases and context effects, this model provides a clean baseline in which k-mer diversity is close to the theoretical maximum, which in turn minimizes prefix collisions in the De Bruijn graph.
For Markov models with non-uniform transition probabilities, the most popular model is the Kimura 2 Parameter (K2P) model. In this model, we assume that transitions and transversions occur at different rates, denoted by
and
, respectively. Here, transition means substitutions between purines (A,G) or between pyrimidines (C,T), while transversion means substitutions between a purine and a pyrimidine. The transition probability matrix for the K2P model is:
Despite the asymmetric substitution structure, the stationary distribution of the K2P model remains uniform, .
3.5. Reconstruction Accuracy for Markov DNA Sequence
To evaluate how sequence correlations affect reconstruction, we generate synthetic genomes of fixed length L from the Markov models described above, varying the transition parameter(s), such as the Jukes–Cantor rate . For each simulated genome, we extract the full multiset of overlapping k-mers, construct the corresponding De Bruijn multigraph on -mers, and run the same Eulerian-traversal reconstruction algorithm as in the independent (random-genome) model.
Reconstruction accuracy is measured as the fraction of trials in which the assembled sequence exactly matches the original simulated genome. Equivalently, this corresponds to the probability that the associated De Bruijn graph admits a unique, non-branching Eulerian traversal. Repeating this experiment over many independent realizations yields empirical accuracy curves that can be compared with the branching-probability formulas derived for the Markov setting.
As shown in the accuracy panel of
Figure 4, reconstruction performance deteriorates as
moves away from
. Intuitively, non-uniform transition behavior increases local repetition and short-range correlations, which reduces the effective diversity of
-contexts. This, in turn, increases the likelihood of prefix collisions in the De Bruijn graph, leading to more branching and thus less reliable Eulerian reconstruction.
In
Figure 4b, the baseline
is compared with cases
, corresponding to an increased probability that consecutive nucleotides repeat. More frequent local repetition reduces the effective diversity of
-mer contexts, thereby amplifying prefix collisions and increasing branching in the associated De Bruijn graph.
For the Jukes-Cantor model, we classify the
-mer prefixes according to the number
r of repeated consecutive nucleotide pairs they contain. For example,
indicates that the next nucleotide is always different from the current nucleotide. The number of different
-mer prefixes of type
r is
The probability of observing any specific
-mer prefix of type
r is
Consequently, the probability that two independently sampled
-mer prefixes are identical is given by
For a DNA sequence of length
L, there are
prefixes that are approximately sampled independently. Given that two prefixes are identical, the probability that their final nucleotides differ is
. Under a Poisson approximation, the expected number of branching events is therefore
The probability that no branching occurs can thus be approximated by
This expression reduces to the previously derived result for the independent model when .
3.6. Biological Interpretation of Reconstruction Limits
The results above can be interpreted in terms of biological sequence structure and evolutionary constraints. In the random genome setting, nucleotides are assumed to be independently and uniformly distributed. Under this assumption, the number of distinct
-mers grows exponentially with
k. As
k increases, the probability that two substrings share the same
-mer prefix decreases rapidly, so prefix collisions become rare and the associated De Bruijn graph is likely to be non-branching once
k exceeds a logarithmic threshold in the genome length. This effect is illustrated in
Figure 1, where larger values of
k provide greater context specificity: distinct genomic locations are less likely to share the same prefix, which reduces ambiguity in the Eulerian traversal and improves reconstruction accuracy. The same trend appears in
Figure 2, where accuracy shows a sharp transition from low to high as
k increases. This transition is explained by the theoretical estimate.
which quantifies how quickly prefix collisions vanish as the number of possible
-mers increases.
When DNA sequences are generated using Markov models such as the Jukes–Cantor process, additional biological structure is introduced. Transition probabilities are no longer uniform, and repeated nucleotides become more common. This leads to low-complexity regions and short-range correlations in the sequence. Such patterns are common in real genomes and are often associated with replication processes and evolutionary constraints. From the perspective of assembly, these effects reduce the effective diversity of -mers, even though the total number of possible prefixes remains . As a result, prefix collisions become more frequent, and branching is more likely to occur.
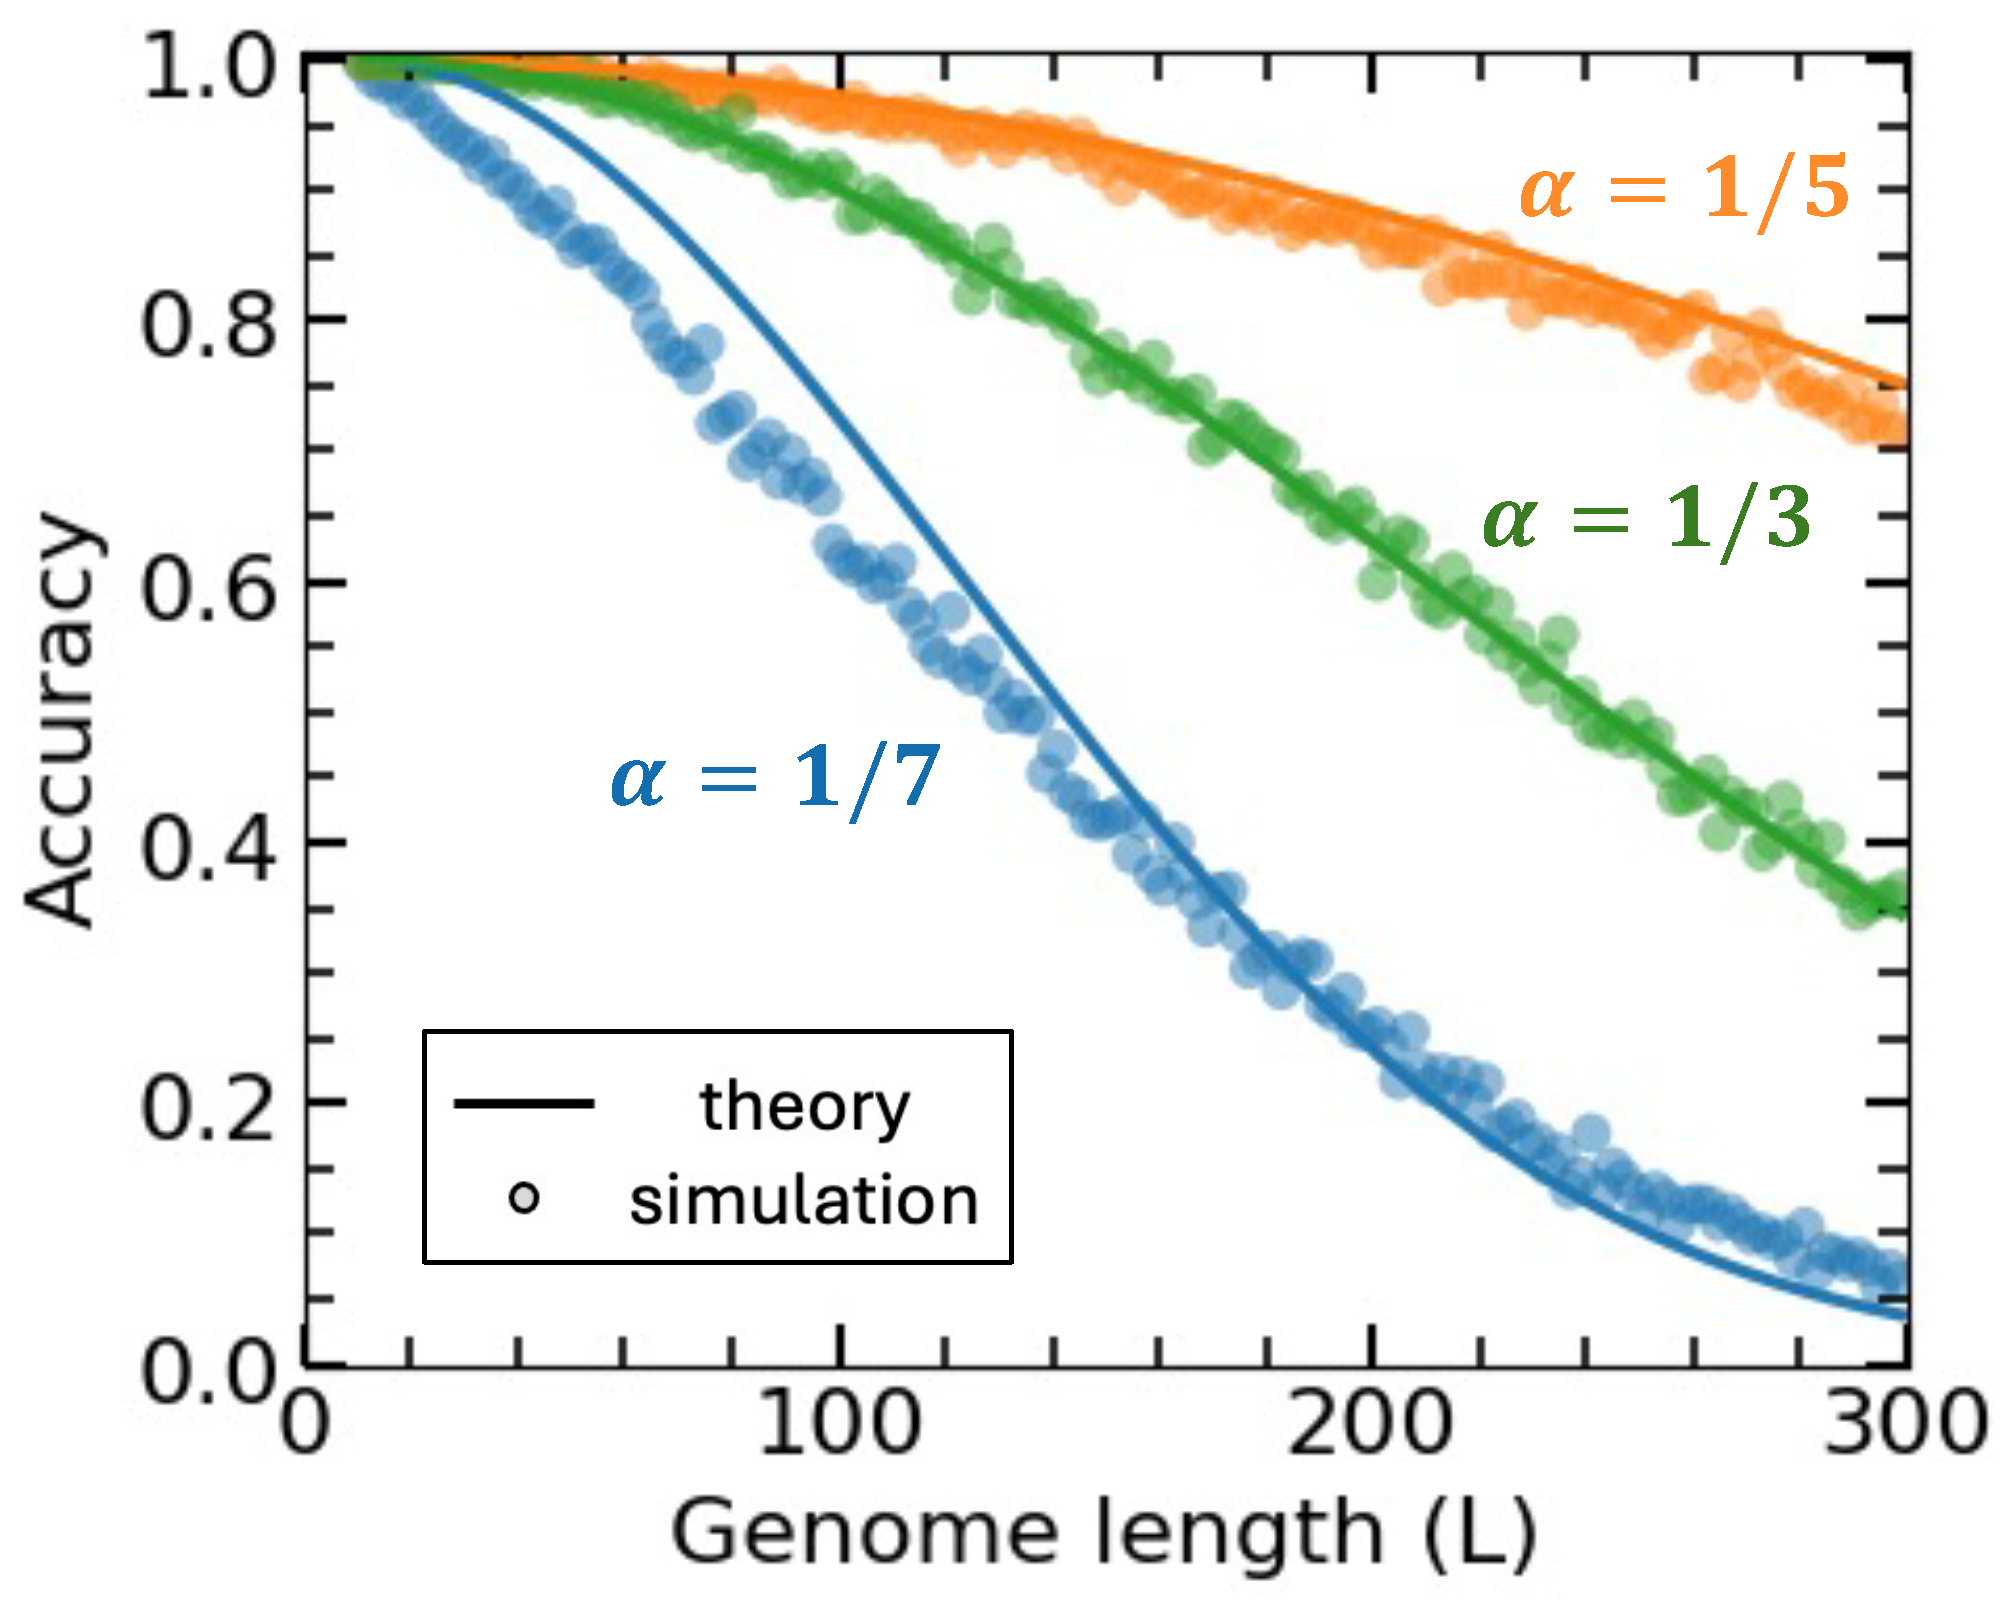
This behavior is shown in
Figure 4b and
Figure 5, where reconstruction accuracy decreases as the parameter
moves away from
. The analytical expression for
under the Jukes–Cantor model captures this effect through the factor
, which directly links sequence correlations to collision probability. The agreement between theoretical predictions and simulation results in
Figure 5 indicates that branching remains the main factor limiting reconstruction accuracy in this setting. These results show that some genomes or genomic regions are harder to reconstruct than others due to their sequence statistics. Even with complete
k-mer information and no sequencing error, exact reconstruction may fail when repeats and correlations create unavoidable branching in the De Bruijn graph.
4. Conclusions
This study examines genome reconstruction from a mathematical perspective, focusing on how k-mer overlap structure determines whether a genome can be recovered exactly. By modeling reconstruction using De Bruijn graphs and Eulerian paths, we show that exact reconstruction is possible when the overlap graph contains no branching and satisfies basic degree conditions, in which case the original sequence is uniquely determined by its k-mers. The results are derived under an idealized, error-free setting with complete k-mer coverage, which isolates the intrinsic combinatorial difficulty of reconstruction. The branching-probability bounds established here therefore serve as lower bounds on reconstruction difficulty: any practical assembler operating on noisy or incomplete data must contend with at least as much ambiguity as quantified here, in addition to further challenges from sequencing errors and uneven coverage.
Numerical experiments and theoretical analysis reveal a sharp transition in reconstruction accuracy as the fragment length k increases. For small k, prefix collisions are common and branching occurs frequently, leading to ambiguous reconstruction. As k increases, the space of possible -mer prefixes grows exponentially, collisions become rare, and reconstruction succeeds with high probability. A simple probabilistic model accurately predicts this transition and provides practical guidance for choosing k as a function of genome length.
The analysis also shows how biological sequence structure affects the feasibility of exact reconstruction. When correlations and repeated patterns are present, as in simple Markov models of DNA generation, prefix collisions become more likely and reconstruction accuracy decreases. This result highlights that some genomes or genomic regions are harder to reconstruct than others due to their sequence statistics, even in the absence of sequencing error.
Overall, this work clarifies that the main obstacle to exact genome reconstruction is branching in the overlap graph, rather than limitations of the traversal algorithm itself. By isolating this mechanism, the study provides a clear mathematical baseline for understanding the conditions under which reconstruction is uniquely determined as well as ambiguity is unavoidable. Future work can extend this framework to include sequencing errors, uneven coverage, and more realistic evolutionary models. In particular, the first-order Markov models considered here (Jukes–Cantor and K2P) are principled but simplified representations of genomic sequence statistics; incorporating higher-order dependencies or empirically observed repeat distributions represents a natural and important direction for future work.
Author Contributions
Conceptualization, B.Z., S.L. (Siqi Liu) and S.L. (Suwei Liu); methodology, B.Z. and S.L. (Siqi Liu); analysis, B.Z. and S.L. (Siqi Liu); writing—original draft preparation, B.Z., S.L. (Siqi Liu) and S.L. (Suwei Liu); writing—review and editing, S.L. (Suwei Liu); visualization, B.Z., S.L. (Siqi Liu) and S.L. (Suwei Liu); supervision, S.L. (Suwei Liu). All authors have read and agreed to the published version of the manuscript.
Funding
This research received no external funding.
Institutional Review Board Statement
Not applicable.
Informed Consent Statement
Not applicable.
Data Availability Statement
No new data were created or analyzed in this study. Data sharing is not applicable to this article.
Conflicts of Interest
The authors declare no conflicts of interest.
Abbreviations
The following abbreviations are used in this manuscript:
| DNA | Deoxyribonucleic acid |
| k-mer | Substring of length k |
| K2P | Kimura two-parameter model |
| NGS | Next-generation sequencing |
References
- Soon, W.W.; Hariharan, M.; Snyder, M.P. High-throughput sequencing for biology and medicine. Mol. Syst. Biol. 2013, 9, 640. [Google Scholar] [CrossRef]
- Boyd, S.D. Diagnostic applications of high-throughput DNA sequencing. Annu. Rev. Pathol. Mech. Dis. 2013, 8, 381–410. [Google Scholar] [CrossRef]
- Delseny, M.; Han, B.; Hsing, Y.I. High throughput DNA sequencing: The new sequencing revolution. Plant Sci. 2010, 179, 407–422. [Google Scholar] [CrossRef]
- Ye, F.; Samuels, D.C.; Clark, T.; Guo, Y. High-throughput sequencing in mitochondrial DNA research. Mitochondrion 2014, 17, 157–163. [Google Scholar] [CrossRef]
- Churko, J.M.; Mantalas, G.L.; Snyder, M.P.; Wu, J.C. Overview of high throughput sequencing technologies to elucidate molecular pathways in cardiovascular diseases. Circ. Res. 2013, 112, 1613–1623. [Google Scholar] [CrossRef]
- Sebat, J.L.; Colwell, F.S.; Crawford, R.L. Metagenomic profiling: Microarray analysis of an environmental genomic library. Appl. Environ. Microbiol. 2003, 69, 4927–4934. [Google Scholar] [CrossRef]
- Ng, C.; Li, H.; Wu, W.K.; Wong, S.H.; Yu, J. Genomics and metagenomics of colorectal cancer. J. Gastrointest. Oncol. 2019, 10, 1164. [Google Scholar] [CrossRef]
- Yan, C.; Wang, F.; Geng, H.; Liu, H.; Pu, S.; Tian, Z.; Chen, H.; Zhou, B.; Yuan, R.; Yao, J. Integrating high-throughput sequencing and metagenome analysis to reveal the characteristic and resistance mechanism of microbial community in metal contaminated sediments. Sci. Total Environ. 2020, 707, 136116. [Google Scholar] [CrossRef]
- Ejigu, G.F.; Jung, J. Review on the computational genome annotation of sequences obtained by next-generation sequencing. Biology 2020, 9, 295. [Google Scholar] [CrossRef]
- Pereira, R.; Oliveira, J.; Sousa, M. Bioinformatics and computational tools for next-generation sequencing analysis in clinical genetics. J. Clin. Med. 2020, 9, 132. [Google Scholar] [CrossRef]
- Dolled-Filhart, M.P.; Lee, M., Jr.; Ou-Yang, C.-w.; Haraksingh, R.R.; Lin, J.C.-H. Computational and bioinformatics frameworks for next-generation whole exome and genome sequencing. Sci. World J. 2013, 2013, 730210. [Google Scholar] [CrossRef]
- Chor, B.; Horn, D.; Goldman, N.; Levy, Y.; Massingham, T. Genomic DNA k-mer spectra: Models and modalities. Genome Biol. 2009, 10, R108. [Google Scholar] [CrossRef]
- Liu, B.; Shi, Y.; Yuan, J.; Hu, X.; Zhang, H.; Li, N.; Li, Z.; Chen, Y.; Mu, D.; Fan, W. Estimation of genomic characteristics by analyzing k-mer frequency in de novo genome projects. arXiv 2013, arXiv:1308.2012. [Google Scholar]
- Wen, J.; Chan, R.H.; Yau, S.C.; He, R.L.; Yau, S.S. K-mer natural vector and its application to the phylogenetic analysis of genetic sequences. Gene 2014, 546, 25–34. [Google Scholar] [CrossRef]
- Chikhi, R.; Limasset, A.; Jackman, S.; Simpson, J.T.; Medvedev, P. On the representation of de Bruijn graphs. In Proceedings of the International Conference on Research in Computational Molecular Biology; Springer: Cham, Switzerland, 2014; pp. 35–55. [Google Scholar]
- Fredricksen, H. A new look at the de Bruijn graph. Discret. Appl. Math. 1992, 37, 193–203. [Google Scholar] [CrossRef]
- Compeau, P.E.; Pevzner, P.A.; Tesler, G. Why are de Bruijn graphs useful for genome assembly? Nat. Biotechnol. 2011, 29, 987. [Google Scholar] [CrossRef]
- Medvedev, P.; Pop, M. What do Eulerian and Hamiltonian cycles have to do with genome assembly? PLoS Comput. Biol. 2021, 17, e1008928. [Google Scholar] [CrossRef]
- Pevzner, P.A.; Tang, H.; Waterman, M.S. An Eulerian path approach to DNA fragment assembly. Proc. Natl. Acad. Sci. USA 2001, 98, 9748–9753. [Google Scholar] [CrossRef]
- Zhang, Y.; Waterman, M.S. An Eulerian path approach to local multiple alignment for DNA sequences. Proc. Natl. Acad. Sci. USA 2005, 102, 1285–1290. [Google Scholar] [CrossRef]
- Zerbino, D.R.; Birney, E. Velvet: Algorithms for de novo short read assembly using de Bruijn graphs. Genome Res. 2008, 18, 821–829. [Google Scholar] [CrossRef]
- Bankevich, A.; Nurk, S.; Antipov, D.; Gurevich, A.A.; Dvorkin, M.; Kulikov, A.S.; Lesin, V.M.; Nikolenko, S.I.; Pham, S.; Prjibelski, A.D.; et al. SPAdes: A new genome assembly algorithm and its applications to single-cell sequencing. J. Comput. Biol. 2012, 19, 455–477. [Google Scholar] [CrossRef]
- Simpson, J.T.; Wong, K.; Jackman, S.D.; Schein, J.E.; Jones, S.J.; Birol, I. ABySS: A parallel assembler for short read sequence data. Genome Res. 2009, 19, 1117–1123. [Google Scholar] [CrossRef]
| Disclaimer/Publisher’s Note: The statements, opinions and data contained in all publications are solely those of the individual author(s) and contributor(s) and not of MDPI and/or the editor(s). MDPI and/or the editor(s) disclaim responsibility for any injury to people or property resulting from any ideas, methods, instructions or products referred to in the content. |