Article

Graph Neural Network-Guided TrapManager for Critical Path Identification and Decoy Deployment

by
Rui Liu
1,
Guangxia Xu
1,2,3,* and
Zhenwei Hu
1
1
Cyberspace Institute of Advanced Technology, Guangzhou University, Guangzhou 510006, China
2
Department of New Networks, Peng Cheng Laboratory, Shenzhen 518000, China
3
Guangdong Key Laboratory of Industrial Control System Security, Guangzhou 510006, China
*
Author to whom correspondence should be addressed.
Mathematics 2026, 14(4), 683; https://doi.org/10.3390/math14040683
Submission received: 20 January 2026 / Revised: 11 February 2026 / Accepted: 13 February 2026 / Published: 14 February 2026

Abstract

Static honeypot deployment and one-shot attack-path analysis often become ineffective against adaptive adversaries because fixed decoy layouts are easy to fingerprint and risk estimates quickly go stale. This paper presents a unified, mathematically grounded TrapManager framework that couples graph representation learning with budget-constrained combinatorial optimization for dynamic cyber deception. We model attacker progression on vulnerability-based attack graphs and learn context-aware node embeddings using a Graph Attention Network (GAT) that fuses vulnerability-driven risk signals (e.g., CVSS-derived node scores) with structural features. The learned representations are used to estimate edge plausibility and rank candidate source–target routes at the path level. Given limited resources, we formulate pointTrap placement as a Mixed-Integer Programming (MIP) problem that maximizes the expected interception of high-risk paths while penalizing deployment cost under explicit budget constraints, including mandatory coverage of the top-ranked critical paths. To enable online adaptiveness, a pointTrap-triggered, event-driven feedback mechanism locally amplifies risk around alerted regions, updates path weights without retraining the GAT, and re-solves the MIP for rapid redeployment. Experiments on MulVAL-generated benchmark attack graphs and cross-domain transfer settings demonstrate fast convergence, strong discrimination between attack and non-attack edges, and early interception within a small number of hops even with minimal decoy budgets. Overall, the proposed framework provides a scalable and resource-efficient approach to closed-loop attack-path defense by integrating attention-based learning and integer optimization.
MSC:
68T07; 90C11; 68M10

1. Introduction

Advanced persistent threats (APTs) and multi-stage intrusions increasingly exploit chained vulnerabilities and lateral movement, challenging purely static defenses. Honeypots and decoys can provide proactive detection, but their effectiveness depends on where and when limited decoys are deployed. In this work, we address resource-constrained, adaptive pointTrap placement to intercept attackers early while remaining computationally tractable.
We model attacker progression as paths on an attack graph, where nodes represent security-relevant states and edges represent exploitable transitions. Existing approaches are limited in complementary ways as follows: static attack-graph analysis and one-shot placement can become stale as the situation evolves [1,2,3,4], while probabilistic inference on Bayesian attack graphs can be costly for timely updates in larger networks [5,6]. Moreover, recent honeypot/decoy strategies highlight the need for deployment decisions that are both adaptive and budget-aware [7,8].
To tackle these issues, we propose a graph neural network-guided TrapManager framework that integrates attack-graph generation, graph representation learning, and mixed-integer programming (MIP) into a closed-loop deployment workflow. Specifically, we carry out the following: (i) construct an attack graph using MulVAL-style reasoning and associated extensions [9]; (ii) learn risk-aware node embeddings with a Graph Attention Network (GAT) [10] to score likely attack routes; (iii) optimize pointTrap placement under explicit budget constraints via MIP [11,12]; and (iv) trigger event-driven re-optimization when a pointTrap is activated, by locally amplifying risk signals around the suspected breach region.
Contributions: The main contributions of this work are as follows:
  • GNN-guided critical route scoring. We propose an attention-based approach to learn risk-aware embeddings on attack graphs, enabling path-level scoring to identify high-impact source–target routes.
  • Budget-constrained pointTrap deployment. We formulate pointTrap placement as a mixed-integer optimization problem that leverages learned route scores under explicit budget constraints.
  • Closed-loop adaptiveness and transferability. We design an event-triggered risk amplification mechanism for rapid re-optimization after detections and demonstrate transfer learning across graphs of different scales.
Difference from prior work. Unlike prior “GNN + honeypot placement” pipelines that primarily learn node/edge-level risk and then optimize a static layout, TrapManager couples path-level learning (ranking end-to-end source–target routes via a path-MLP on pooled GAT embeddings) with an event-driven re-optimization loop as follows: after a pointTrap trigger, we update path weights without retraining and re-solve a budgeted MIP once for rapid redeployment. This combination allows low-latency adaptation while keeping the learned representation fixed, which differs from works that require repeated retraining or rely on static heuristics for updates (e.g., [11,12]).

2. Background

2.1. PointTrap and TrapManager

PointTrap is a lightweight deception mechanism that exposes decoy interfaces or functions that legitimate users do not access during normal operation [13,14]. Any interaction with a pointTrap therefore provides a high-confidence alert that an attacker may have reached a particular region of the network. TrapManager orchestrates pointTrap configuration and deployment at scale, collects alerts and telemetry from triggered traps, and can initiate automated responses such as redeployment or reinforcement [13]. These capabilities motivate an event-driven defense workflow in which detections trigger rapid re-evaluation of placement decisions.

2.2. Attack Graph Construction and Risk Signals

We use vulnerability-based attack graphs to represent feasible multi-step exploit chains in a network. Rule-based reasoning systems (e.g., MulVAL) alert-driven attack graph extractors [15] encode host configurations, privileges, connectivity, and vulnerabilities as logical facts and inference rules, producing a directed attack graph that captures reachability between security-relevant states [3,9]. In this work, vulnerability severity is represented through node-level risk signals (e.g., CVSS-derived scores) that are later fused with graph-topological features for learning-based route scoring.

2.3. GNNs for Learning on Attack Graphs

Graph Neural Networks (GNNs) learn node representations by aggregating information from neighbors [16], with representative architectures including Graph Convolutional Networks (GCN) [17], Graph Attention Networks (GATs) [18] learn adaptive neighbor weights via attention, which is beneficial for heterogeneous graphs where different neighbors contribute unequally [10]. The expressive power of message-passing GNNs is closely related to the 1-WL test [19]. While message-passing GNNs have known limitations in expressiveness and long-range information propagation, in practice, these issues can be mitigated by informative input features and task-specific training objectives [20].

3. Related Work

The proposed framework leverages network environment information to autonomously guide the dynamic deployment of decoy nodes. This work has the following two main contributions: a novel graph neural network algorithm for critical attack path extraction and an autonomous framework for closed-loop optimization of dynamic deployment of decoy nodes. To highlight the innovation of our work, in this section, we will review the literature and distinguish our contribution from previous studies on deception trapping strategies (Section 3.1) and critical path identification based on graph neural networks (Section 3.2).

3.1. Deception Defense Technologies

Deception defenses have progressed from standalone honeypots to fully orchestrated TrapManager systems, which deploy decoy nodes in structured, graph-based layouts—often referred to as HoneyMaps [21]. Early HoneyMap approaches relied on manually crafted, rule-based policies to adjust decoy topologies in response to threat intelligence. While these methods improved coverage over static honeypots, their predictable patterns were vulnerable to advanced adversaries who could fingerprint and bypass them.
A key unmet need is automated HoneyMap generation that can adapt in real time to evolving attacker behaviors without human intervention. Graph-based anomaly detection techniques have also been explored for defending against advanced persistent threats (APTs) [22]. Modern frameworks must therefore integrate the following:
Architectural Components
  • Decoy Graph G d : A unified graph modeling both real assets and decoys,
    G d = V r V d , E r E d ,
    where V r and E r represent the real network’s assets and links, and V d and E d represent decoy nodes and artificial connections designed to lure attackers.
  • Policy Engine: Implements dynamic placement rules or optimization routines (e.g., Stackelberg games, MIP solvers [12]) to determine which nodes to decoy and how to reconfigure the decoy graph over time.
  • Alert Integration: Ingests signals from SIEM/IDS, intrusion detection systems, or custom PointTrap that trigger adaptive changes to the decoy layout. Machine learning-based traffic analysis methods further enhance threat awareness by identifying malicious encrypted communication patterns [23].
  • Orchestration Layer: Coordinates the actual deployment, migration, and removal of decoy nodes across the network, ensuring minimal impact on legitimate traffic.

3.2. GNN-Based Critical Path Identification

Identifying critical or “key” paths in a network—those sequences of edges whose disruption most degrades performance or connectivity—is a fundamental task in domains ranging from transportation planning to cyber-attack mitigation [24,25,26]. Traditional graph-theoretic algorithms (e.g., Dijkstra’s or Bellman–Ford) compute shortest or minimal-cost paths exactly but do not readily generalize to settings with noisy edge attributes or evolving topologies [27]. Graph Neural Networks (GNNs) have recently been explored as a data-driven alternative, learning to predict the importance or length of the path directly from graph structure and edge signals. Early work demonstrated that a simple message-passing model could reproduce shortest-path computations on synthetic graphs with high accuracy after training. Follow-up studies extended this idea to real-world road networks, showing that GNNs can approximate the shortest distances of a single source and highlight the segments most “critical”, whose removal increases travel time most [28].
Beyond the shortest-path approximation, specialized GNN architectures have been proposed to rank nodes or edges by their impact on global connectivity. An edge-centric GNN was applied to transportation networks to estimate a criticality score for each road segment, facilitating rapid post-disruption reroute decisions [29]. Similarly, a fast node-ranking GNN has been used to approximate centrality measures—closely related to path-based importance—with orders-of-magnitude speed-ups over exact algorithms [30].
Despite these advances, several challenges remain, as follows: learned models may overfit to specific topologies and fail to generalize to larger or structurally different graphs [31]; they often require substantial labeled data (e.g., precomputed paths) for supervision; and interpreting the learned “reasoning” behind critical-path scores is nontrivial for end-users. Recent surveys have cataloged these issues and proposed remedies such as graph rewiring to mitigate over-squashing, transfer-learning strategies, and attention-based explainers tailored for path-level tasks.
Compared with [11,12], which optimize honeypot placement using learned scores or dynamic attack-graph reasoning, our key distinction is that we explicitly perform path-level supervision and ranking and integrate it with a triggered, one-shot re-optimization mechanism. In particular, we keep the candidate path set fixed online and only update their weights after a trigger, enabling fast response while avoiding re-sampling/retraining overhead. We further quantify the cost–benefit trade-off against lightweight heuristics in Section 5.7.

4. Proposed Framework

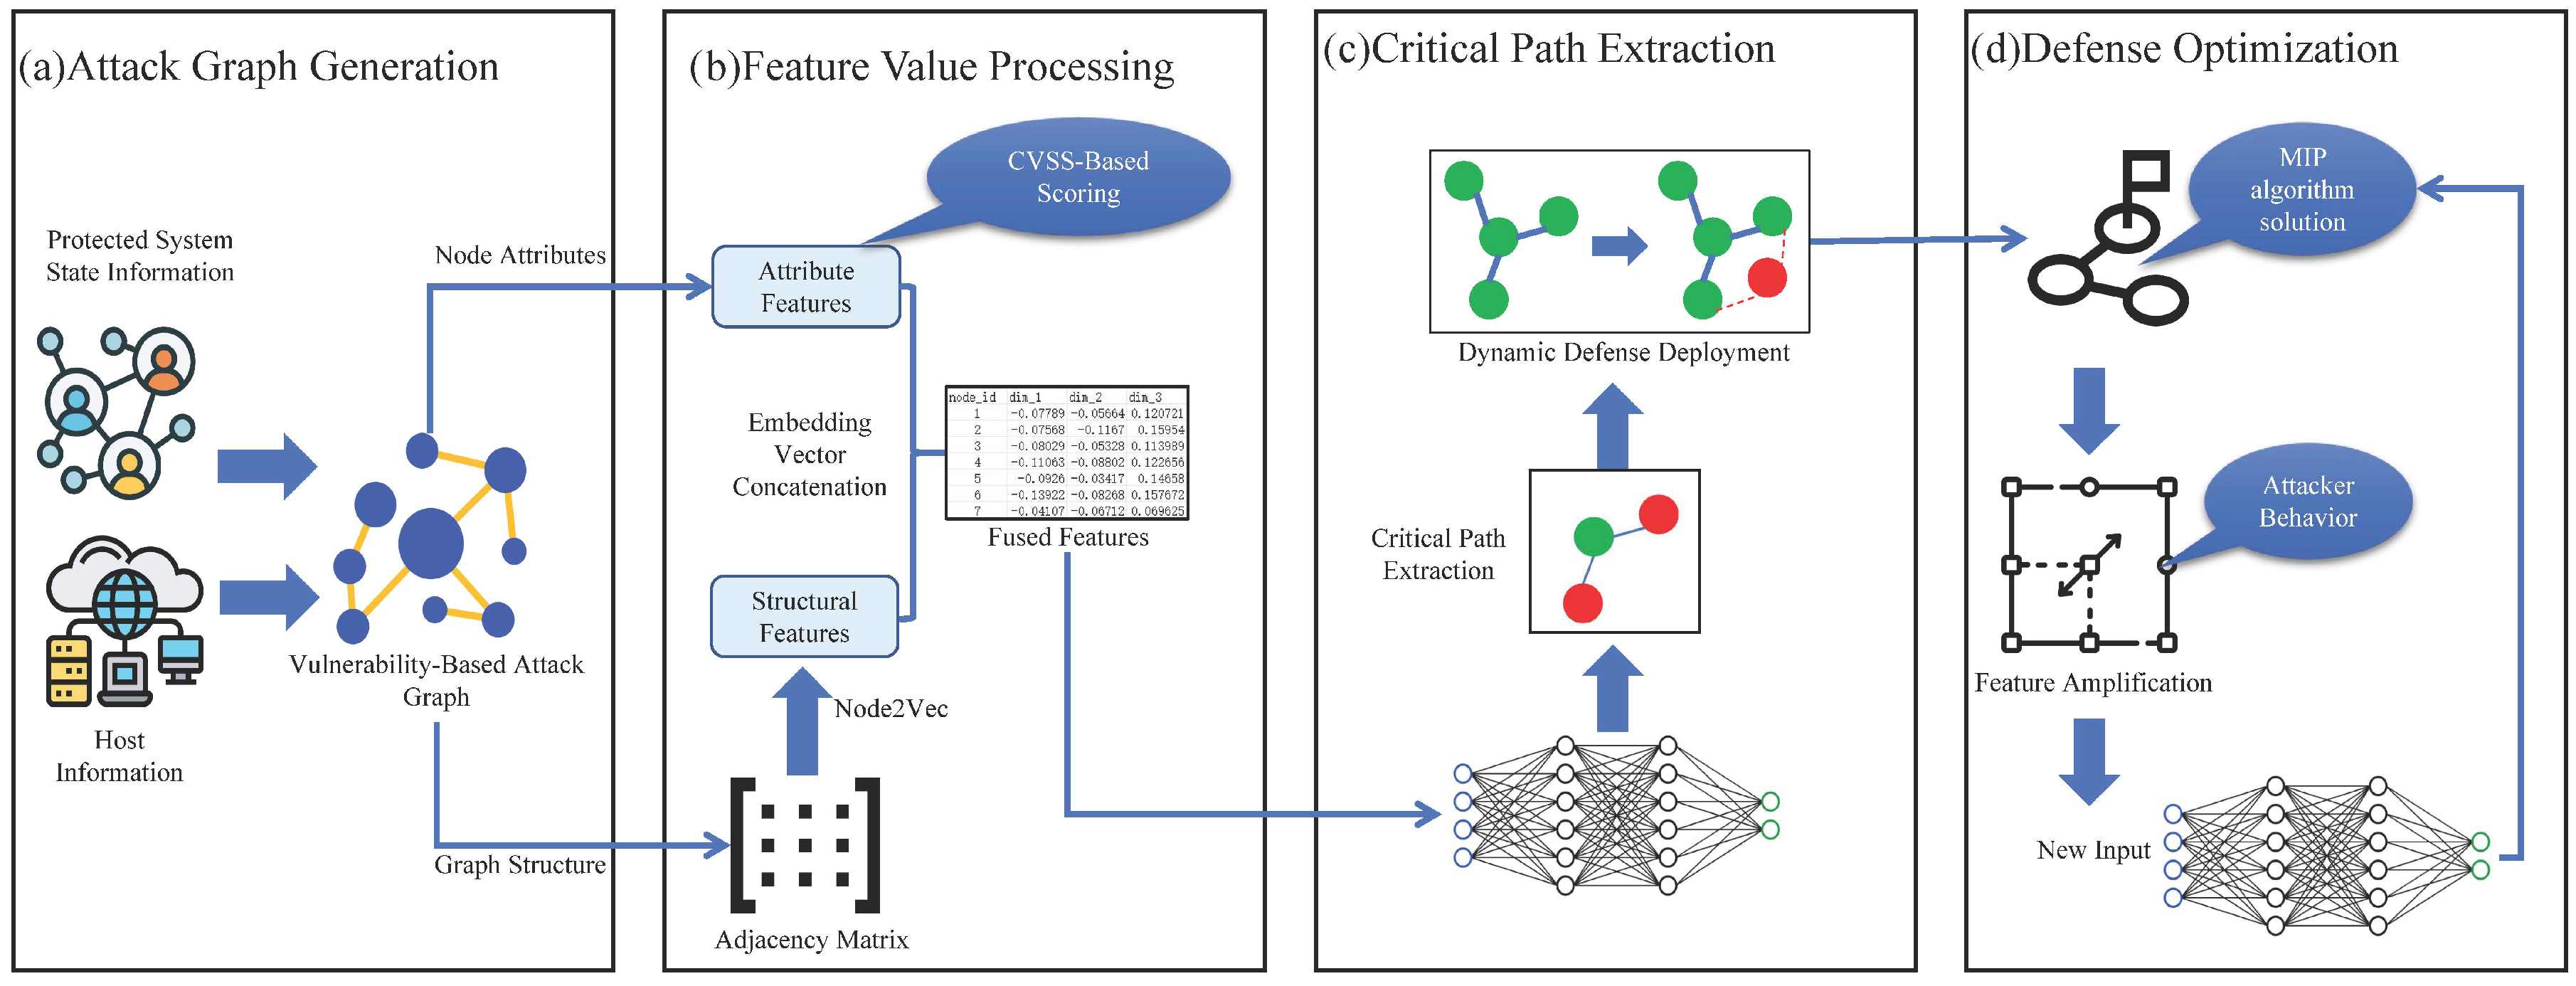
In this section, we propose a framework that aims to autonomously extract critical attack paths and closed-loop optimize defense strategies. As shown in Figure 1, our proposed framework consists of four modules as follows: (a) Attack Graph Generation, (b) Feature Value Processing, (c) Critical Path Extraction, and (d) Defense Optimization.

4.1. Attack Graph Generation

Graph Construction. The system first collects host information and security protection status from the network to generate an attack graph containing nodes and edges. The construction is based on network vulnerabilities, where nodes represent hosts and edges represent potential attack paths. The main purpose is to extract the graph structure from threat information. The attack graph is formally defined as follows:
G = ( V , E , O V )
where:
  • V: Set of nodes.
  • E: Set of edges.
  • O V : Set of node types (LEAF, AND, OR vulnerability nodes, attack methods, and attack targets)
Attack Graph Node Semantics and Computation. The attack graph generated by MulVAL contains four node types with different security semantics, and we define their computation rules as follows:
  • Basic LEAF Node
    -
    Semantics: Represents initial attack surfaces without direct vulnerabilities.
    -
    Computation: Constant baseline exposure score.
    I leaf = β
  • Vulnerable LEAF Node
    -
    Semantics: Assets with exploitable vulnerabilities.
    -
    Computation: CVSS v3.1 based scoring.
    I vleaf = β 1 + CVSS 10
  • OR Node
    -
    Logic: Logical disjunction of attack prerequisites.
    -
    Computation: Probability union of child nodes.
    I or = 1 j C ( 1 I j )
  • AND Node
    -
    Logic: Logical conjunction of attack prerequisites.
    -
    Computation: Joint probability of child nodes.
    I and = j C I j
Here, β is set to a fixed value. j represents the child node of the node. C represents the set of child nodes for the node. In our approach, we exclusively perform computations on different node types, while edges in the graph are not subjected to categorical computations but merely treated as representations of the reachability between nodes. Based on these computations, we derive importance scores for all nodes in the attack graph.

4.2. Feature Processing

In this step, feature processing is performed on the nodes of the generated attack graph. The features are divided into attribute features and structural features. The attribute features are derived from the node importance scores (Section 4.1), while structural features are generated using the Node2Vec algorithm to capture topological information. These are then concatenated to form a comprehensive feature matrix.
Node2Vec Feature Extraction. Node2Vec embeds graph nodes into low-dimensional space while preserving structural information. We employ Node2Vec to capture the graph’s underlying topology. While primarily designed for homogeneous graphs, we use it to generate a baseline structural embedding. We mitigate its limitation of not distinguishing between node types by concatenating these structural features with rich, type-aware attribute features. This fusion creates a comprehensive vector that informs the GAT model of both topology and semantics. It uses random walks combining DFS and BFS strategies:
  • Random Walks: From each node, we perform multiple walks. The walk length was set to 5 and the embedding dimension to 16 as a trade-off between capturing meaningful local neighborhood information and maintaining computational efficiency, values found to be effective in similar graph embedding tasks.
  • Embedding Generation: Outputs 16-dim vectors capturing node similarity and local structure.
  • Objective Function: Maximizes the risk score aggregation of predicting nodes co-occurring in walks as follows:
    max f u V log P ( N ( u ) | f ( u ) )
    where N ( u ) is the neighborhood of u and f ( u ) its embedding.
Attribute Features. To map the scalar node importance I i into a 16-dimensional input feature vector for a graph neural network, we adopt the Gaussian Radial Basis Function (RBF) expansion method.
f i = ϕ 1 ( I i ) ϕ 2 ( I i ) ϕ 16 ( I i )
where ϕ k ( I i ) = exp I i μ k 2 2 σ 2 , k = 1 , 2 , , 16 .
This method expands the scalar importance score I i into a 16-dimensional feature vector f i , providing a richer, high-dimensional description that improves the discriminative power of the GNN.
Feature Concatenation. We concatenate the 16-dimensional structural vector from Node2Vec and the 16-dimensional attribute vector from the RBF expansion to form a final 32-dimensional feature vector for each node. This combined vector allows the GNN to consider both a node’s topological position in the graph and its specific vulnerability severity, creating a holistic input for identifying critical paths.

4.3. Critical Attack Path Extraction

We identify critical attack paths by considering every pair ( s , t ) , where s S is an entry (source) node and t T is a goal (terminal) node. In our MulVAL-style attack graphs, we instantiate S as the set of LEAF (entry) nodes and T as the set of goal/privilege nodes with out-degree 0. Our goal is to score these candidate paths using node embeddings learned by a two-layer Graph Attention Network (GAT).
Node Embedding via GAT. Let each node v have an initial d in -dimensional feature x v (from CVSS, Node2Vec, etc.). A single GAT layer computes
h v ( l + 1 ) = σ ( u N ( v ) α v u ( l ) W ( l ) h u ( l ) ) ,
where h v ( 0 ) = x v , σ is an activation, W ( l ) a learnable matrix, and stacking two layers yields final 32-dimensional embeddings h v R 32 .
Training with Negative Sampling. For each true edge ( u , v ) , we sample k negative edges ( u , v n ) and minimize
L GAT = 1 N i = 1 N max 0 , 1 s i + + s i ,
where s i + and s i are GAT scores for positive and negative edges. For negative sampling, for each true edge (u, v), we sample edges (u, v_n) where v_n is a randomly chosen node not connected to u. This standard approach allows the model to learn to distinguish between true connections and non-existent ones in the graph’s latent space.
Edge-Level Link Prediction. Using the learned embeddings { h v } , we compute an edge-existence score for every candidate directed edge ( u , v ) as follows:
S edge ( u , v ) = σ h u W edge h v ,
where W edge is a learnable 32 × 32 matrix and σ the logistic function. These edge scores serve as priors for both path sampling and pseudo-label generation.

4.3.1. Path Sampling

For each ( s , t ) with at least one directed path, we build
P s , t = { P 1 , , P | P s , t | } , P i = ( v 0 = s , , v l i = t ) , l i L ,
by the following:
  • Random-walk sampling: Up to M independent walks from s, each of length L , retaining only those that reach t without revisiting.
  • Shortest-path supplement: Run one weighted shortest path (e.g., Dijkstra) on the graph where each edge cost is log S edge ( u , v ) , ensuring inclusion of the maximum-confidence path.
Our path sampling strategy, combining random walks with a shortest-path supplement, is designed to efficiently explore high-probability routes. While this may not exhaustively sample all possible long or convoluted paths that APTs typically employ, it prioritizes the most likely avenues of attack for resource-constrained decoy placement, aligning with the goal of maximizing interception probability for a given budget.

4.3.2. Path Representation

Pool node embeddings along each path as follows:
h P i = MeanPool ( { h v j } j = 0 l i ) R 32 ,
optionally appending the scalar l i .

4.3.3. Path Scoring and Ranking

Train an MLP f : R 32 ( + 1 ) R :
s i = w 2 ReLU ( W 1 h P i + b 1 ) + b 2 .
Construct pseudo-labels using the following edge scores:
  • Pseudo-positive  P + : Path in P s , t with highest ( u , v ) P S edge ( u , v ) .
  • Pseudo-negative  P : Sampled path with lower edge-score product.
  • Optimize
L path = 1 N i = 1 N max 0 , 1 f ( h P i + ) + f ( h P i ) ,

4.3.4. Inference

At test time, for each ( s , t ) , we have the following:
1.
Sample P s , t .
2.
Compute s i = f ( h P i ) .
3.
Sort by s i descending, select Top-K as critical attack paths.
Dynamic Feature Amplification. When an intrusion detection pointTrap signals that an attacker has reached node v , we locally amplify risk by updating the current node embeddings (Equation (11)) for v and its neighborhood. This operation increases the contribution of the suspected breach region in subsequent path re-scoring, thereby prioritizing routes that traverse recently alerted nodes.
Integration with MIP and Path Extraction. The critical-path extraction module outputs a candidate path set P = { A 1 , , A M } and their normalized weights { p k } k = 1 M for downstream optimization (Section 4.4). In the online stage, upon a trigger, we keep the candidate set P fixed for efficiency and only update the path weights by re-evaluating the path-MLP on amplified embeddings; this design avoids expensive re-sampling and enables low-latency re-optimization.
To improve reproducibility and readability, Algorithm 1 summarizes the offline/inference pipeline for candidate attack path construction and scoring. It fuses node-level risk signals (RBF-expanded importance scores) with Node2Vec structural embeddings to form the GAT input features, computes risk-aware node embeddings and edge confidence scores, and then generates a candidate path set by combining loop-free random-walk sampling with a shortest/highest-confidence path supplement. Finally, each candidate path A k P is pooled into a fixed-length representation and scored by a lightweight path-MLP, producing normalized weights { p k } k = 1 M for downstream optimization and a Top-K ranked subset of critical paths.

4.4. MIP-Based Deployment Optimization

Attack detection and feature amplification. An intrusion detection pointTrap monitors live traffic and flags when an attacker reaches node v . Immediately, we amplify the embeddings of v and its neighbors as follows:
h i h i + Δ sign ( h i ) , i { v } N ( v ) ,
where Δ is a small positive scalar. This “boost” makes recently breached regions more prominent in the subsequent optimization step, reflecting their elevated risk.
Algorithm 1 Candidate path inference and weighting with the proposed framework (offline/inference stage)
Mathematics 14 00683 i001
The update in Equation (11) is intentionally lightweight as follows: adding Δ sign ( h i ) increases the margin of nodes in the alerted region along existing embedding directions, which preserves semantic orientation while changing relative scores. The subsequent unit-length re-normalization prevents unbounded norm growth and keeps the scoring function in a stable range. Empirically, Section 5.7 shows that within a practical Δ range, the redeployment does not collapse into excessive neighborhood concentration and maintains low response latency.
Embedding normalization and solver input. After amplification, all embeddings are re-normalized to unit length to prevent scale drift. We then re-score the candidate paths in P using the path-MLP to update the normalized path weights { p k } k = 1 M , which serve as the direct input to the Mixed-Integer Programming solver. In the online stage, we do not re-train the GAT; instead, we update { p k } and re-solve the MIP in an event-triggered manner.
To improve the effectiveness of pointTrap deployment, we formulate a Mixed-Integer Programming (MIP) model [32] to determine the optimal locations for pointTraps. The goal is to maximize the interception of predicted attack paths while minimizing deployment costs under a fixed budget.
Assume that the predicted attack graph contains N nodes, and we have a set of M candidate attack paths P = { A 1 , , A M } constructed by Algorithm 1. Here, x j { 0 , 1 } indicates whether a pointTrap is placed at node j, and q k { 0 , 1 } indicates whether attack path A k is intercepted.
We also define the following parameters: p k (normalized weight of candidate path A k inferred by Algorithm 1), c j (deployment cost), B (total budget), and λ (penalty coefficient).
Objective Function. The goal is to maximize the expected interception probability while minimizing deployment cost as follows:
max x , q k = 1 M p k q k λ j = 1 N c j x j
Constraints. To ensure valid and efficient deployment with guaranteed coverage of the Top-K most critical paths, we add the following:
(13) j = 1 N x j B ( Total pointTrap budget ) (14) q k j A k x j k { 1 , , M } ( Coverage requires at least one trap on the path ) (15) j A π ( i ) x j 1 i { 1 , , K } ( Mandatory coverage of the Top - K critical paths ) (16) x j , q k { 0 , 1 } j { 1 , , N } , k { 1 , , M }
Here, { π ( i ) } is a permutation that sorts paths by probability, ensuring the Top-K are covered.
Algorithm 2 presents the online closed-loop deployment strategy. The mixed-integer program (MIP) is formulated over the full candidate path set P = { A k } k = 1 M using the inferred path weights { p k } k = 1 M (Equation (12)), while explicitly enforcing coverage of the Top-K most critical paths P ( K ) through additional constraints (Equation (15)). When a pointTrap is triggered at node v , we apply local embedding amplification (Equation (11)) to v and its neighborhood, re-normalize embeddings, and re-score paths to update { p k } , after which the MIP is re-solved. This event-triggered re-optimization updates the deployment without re-training the GAT, enabling low-latency adaptation to attacker movement.
Optimization Interpretation. This formulation prioritizes placing decoys on high-probability attack paths within a given cost constraint. The MIP model is solved periodically or, more importantly, is triggered on-demand when a decoy is activated. This event-triggered approach, involving a lightweight amplification step followed by resolving the MIP, avoids the prohibitive cost of continuous re-computation at every attack step, making it practical for real-time adaptation. We keep P fixed online because re-sampling paths is substantially more expensive than re-scoring and re-optimizing, and this would increase response latency after a trigger.
Scalability Notes. The online optimization is event-driven rather than continuous, so the effective solve frequency is bounded by trigger frequency. In larger networks, practical acceleration options include restricting decision variables to a trigger-centered candidate region, warm-starting the MIP from the previous solution, and using time limits to return near-optimal solutions. Our DT3 latency results (Section 5.7) suggest the pipeline can meet real-time requirements under moderate scales and single-trigger updates; scaling to substantially larger graphs and high-frequency triggers is left for future work.    
Algorithm 2 Closed-loop pointTrap deployment via event-triggered MIP (online stage).
Mathematics 14 00683 i002

5. Results and Evaluation

In this section, we evaluate the performance of our proposed framework. Our evaluation is designed to validate framework’s effectiveness against multi-stage attacks by using simulated attack paths on MulVAL-generated graphs. Furthermore, the dynamic redeployment experiments directly test the framework’s ability to adapt to an ‘evolving’ attack as the attacker moves through the network.

5.1. Evaluation of Deception-Triggered Feature Reinforcement Based on PointTrap Awareness

To assess the effectiveness of our proposed framework in practical defensive scenarios, we design an evaluation centered around pointTraps-triggered dynamic reinforcement. Unlike traditional predictive models that require full visibility of the attacker’s path, our method relies on localized threat awareness provided by pointTraps—decoy elements strategically deployed across the system. This setup mimics realistic intrusion detection systems, where partial detection signals guide defense adjustments.
Dataset Preparation: We select multiple graph-based datasets with labeled attack paths. For each dataset, we designate a subset of nodes as pointTrap, capable of detecting nearby attacker activity.
Trigger Simulation: During the simulated attack process, once the attacker interacts with a node connected to a pointTrap, that pointTrap is considered ‘triggered’, indicating the attacker’s potential location.
Feature Reinforcement: Upon pointTrap activation, the nearby node’s feature vector is enhanced directionally, using a predefined step size ( δ ), preserving its semantic direction but amplifying its influence.
Model Update and Evaluation: The updated feature matrix is re-evaluated using the model to assess how the local enhancement affects the model’s ability to distinguish attack and non-attack edges.

5.2. Experimental Settings

Our experiments were conducted in a virtualized test environment. To create a controlled and reproducible evaluation, attack graphs were generated using the MulVAL reasoning framework. This approach is common in the cybersecurity literature as it allows us to systematically vary graph size and complexity and, crucially, provides access to ground-truth attack paths for quantitative evaluation, which is often infeasible in real-world enterprise networks due to security and privacy constraints. Simulations assume a Bayesian attacker model to generate probable attack paths [33].
The GAT model is trained using the PyTorch (v1.8.1+cu111) and the Deep Graph Library (DGL, v0.6.1, CUDA 11.1), with the following key settings: input feature dimension of 32, two GAT layers with four attention heads, ELU activation, and a custom margin-based loss function designed for link prediction. The pointTrap deployment optimization is solved using a standard MIP solver.
We simulate attacker progression with a Bayesian path-selection model over the attack graph. In our evaluation protocol, the attacker is not assumed to reliably distinguish pointTraps from real services prior to interaction; each episode adopts a first-alert setting with exactly one trigger (the first pointTrap activation), followed by a single redeployment. Modeling fully trap-aware adversaries with repeated-trigger strategic adaptation (e.g., decoy fingerprinting and policy updates across multiple alerts) is outside the scope of this work and is discussed as a limitation.

5.3. Dataset

We use a combination of synthetic and real-world benchmark datasets to evaluate our framework comprehensively. The datasets are detailed in Table 1.
Justification for Datasets. The synthetic datasets (DT1, DT2, and DT3) were generated to analyze the model’s performance and scalability across different network sizes. DT1 (32 nodes) and DT2 (75 nodes) represent small, self-contained sub-networks for fine-grained analysis. DT3 (2030 nodes) serves as a larger-scale test to assess performance in more complex environments. The non-linear increase in size was chosen to test the model’s robustness at distinctly different orders of magnitude. The inclusion of the Cora citation network, a standard benchmark in GNN literature, serves the following specific purpose: to evaluate the transfer learning capability of our GNN architecture (Section 5.7). By testing on this domain-dissimilar graph, we assess the model’s ability to learn generalizable structural representations, a key feature for deployment in new networks.
The dataset contains both positive edges (observed attack paths) and synthetically constructed negative edges for link prediction training. The attack paths used for evaluation are simulated based on Bayesian probability distributions.
We emphasize that Cora pre-training does not transfer vulnerability semantics; rather, it provides an initialization that captures generic structural aggregation patterns in attention-based message passing. The observed AUC degradation relative to from-scratch training indicates partial but not perfect transfer, which is consistent with structural generalization instead of a claim of domain equivalence. A thorough disentanglement of distributional coincidence versus true generalization would require controlled cross-graph experiments (e.g., matching degree/cluster statistics), which we leave for future work.

5.4. Evaluation of Training Convergence Behavior

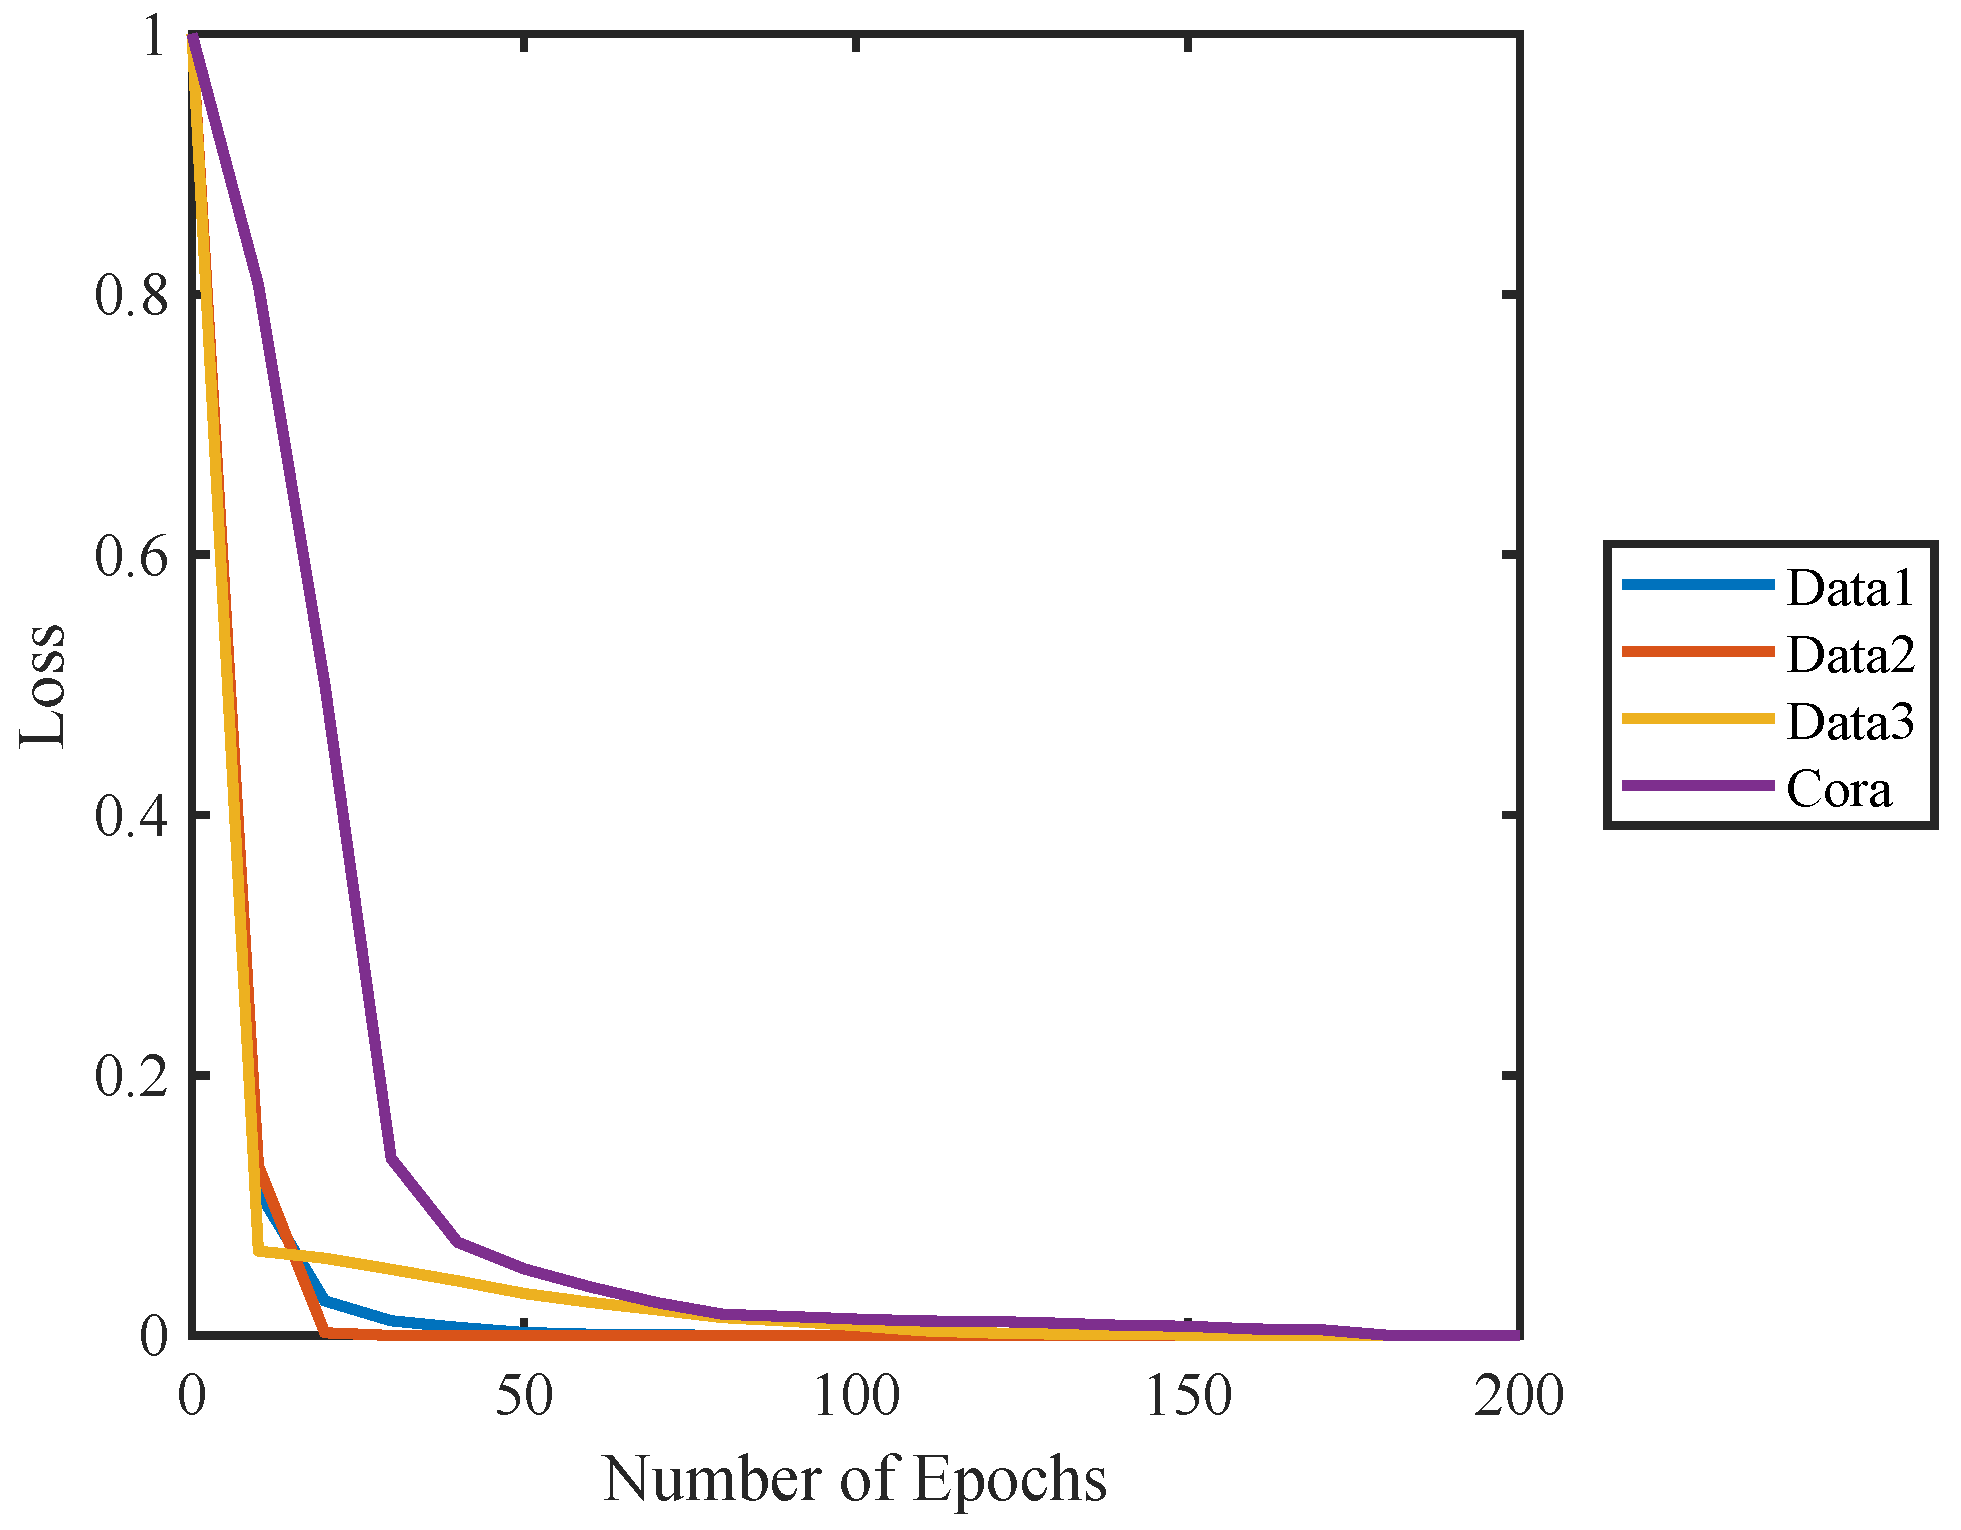
To analyze the convergence efficiency of the proposed model, we evaluate the training loss curves under two different experimental settings. Figure 2 shows the training loss curves of the same GNN model (the proposed framework based on GAT) applied to different datasets, including attack graphs of varying scales and the citation dataset CORA. It can be observed that across all datasets, the model converges within approximately 100 training steps. This demonstrates the robustness and generalization capability of the model across datasets of different domains and sizes.
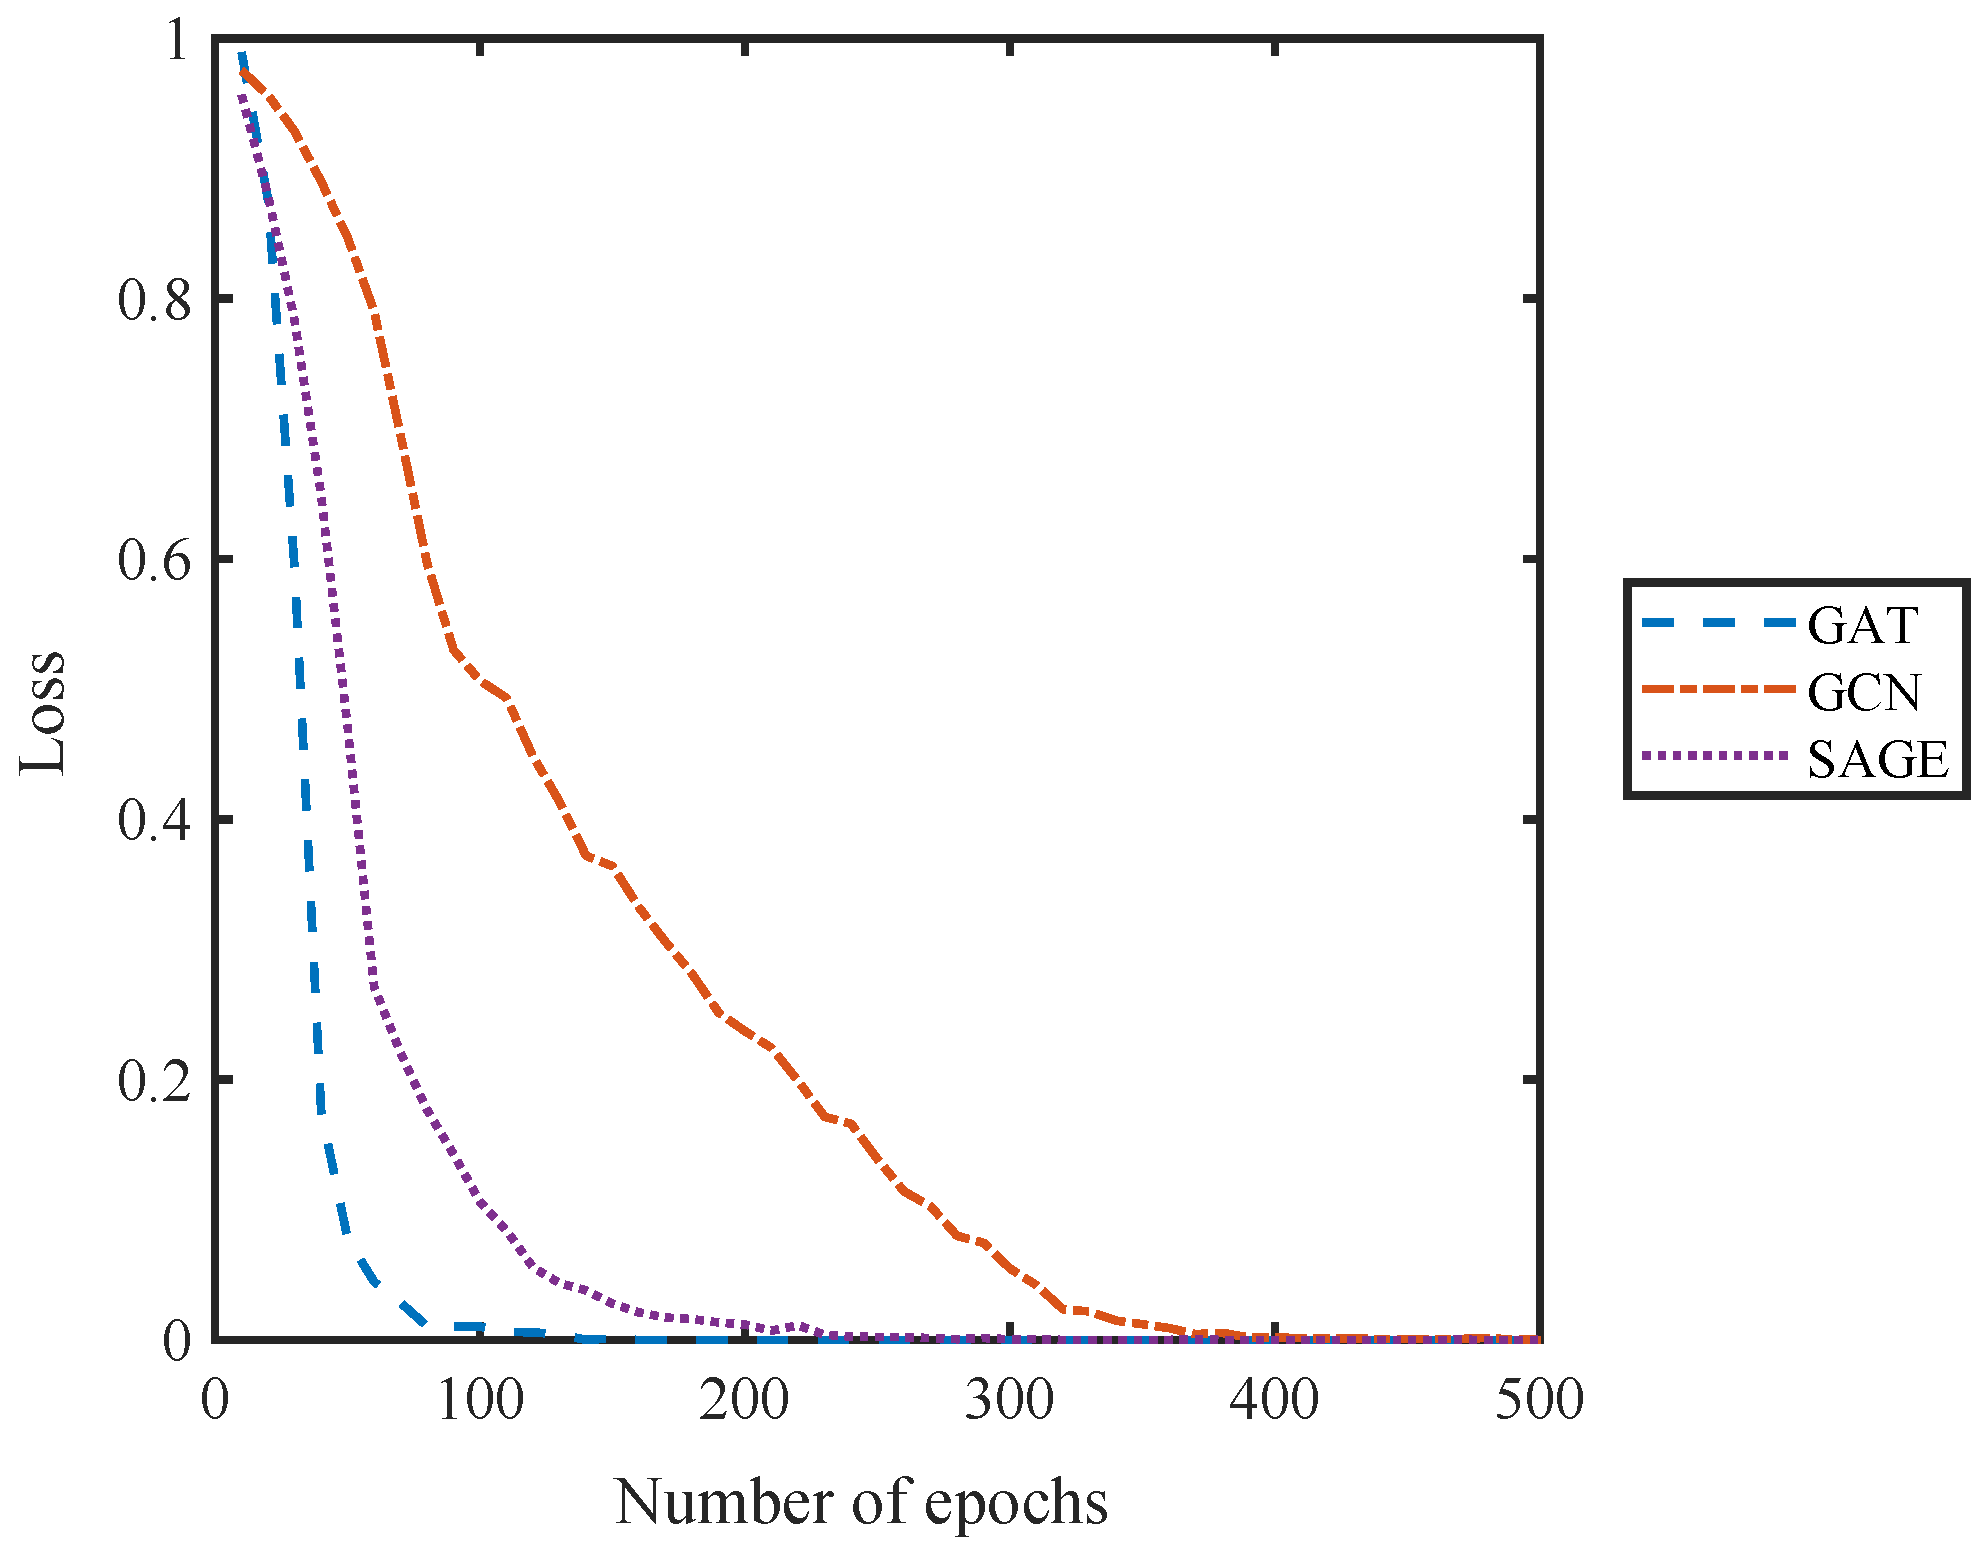
To further compare the convergence behavior of different GNN architectures, Figure 3 illustrates the loss values when applying GCN, GraphSAGE, and GAT on the same dataset. Among the three models, GAT exhibits the fastest convergence rate and reaches a lower final loss, suggesting its superior capability in capturing complex node relationships through attention mechanisms.

5.5. Evaluation of Capture Rate

To comprehensively assess the effectiveness of our proposed dynamic pointTrap deployment strategy, we conduct a comparative experiment against the following two key baselines: (1) an optimized static placement, where decoys are placed once based on the initial critical path analysis, representing standard, non-adaptive systems; and (2) a random placement strategy, which establishes a performance floor. The simulation environment uses a Bayesian probabilistic model to simulate attacker decision-making.
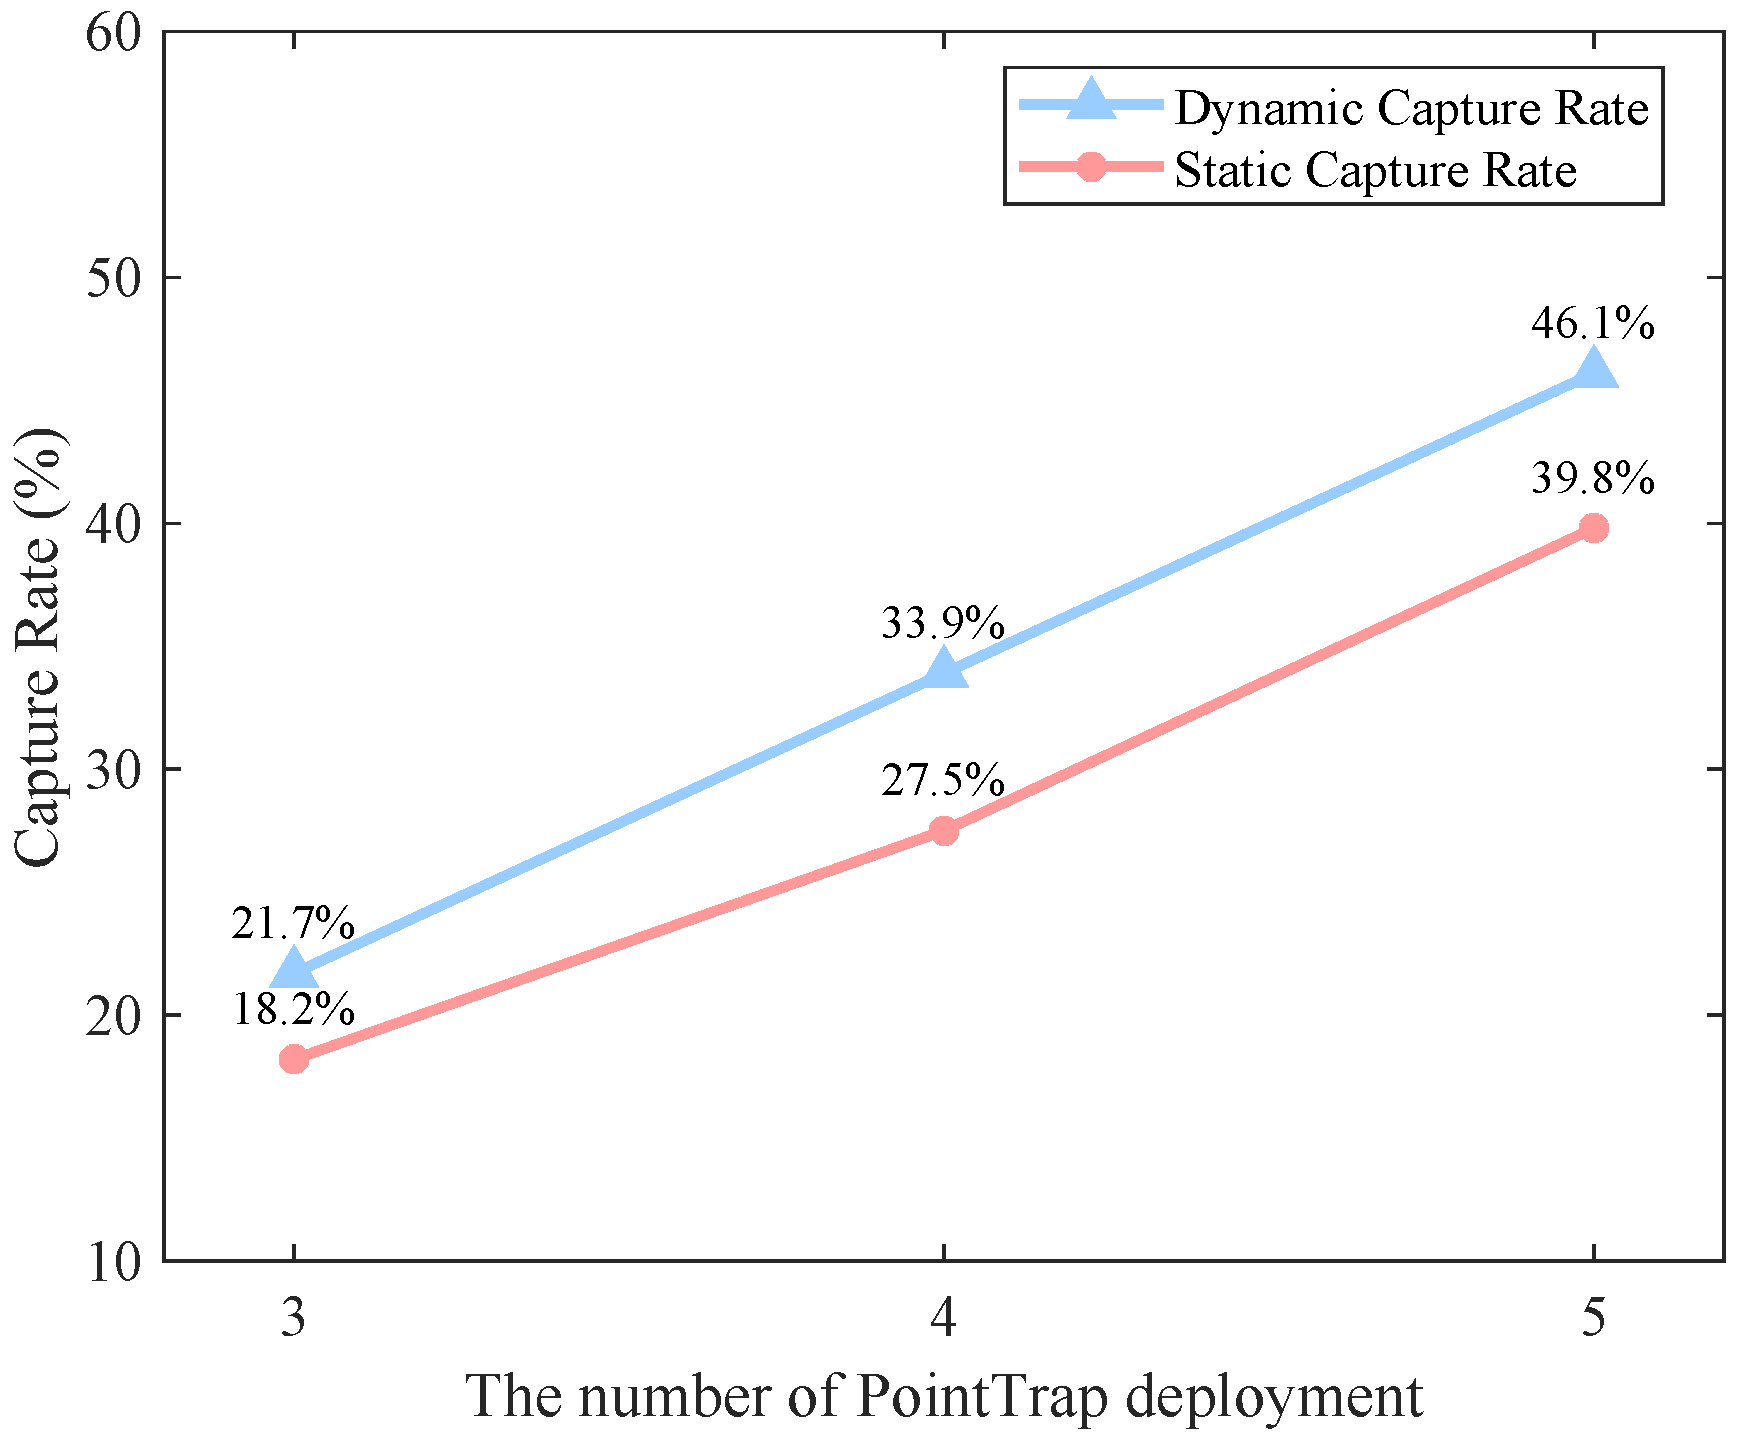
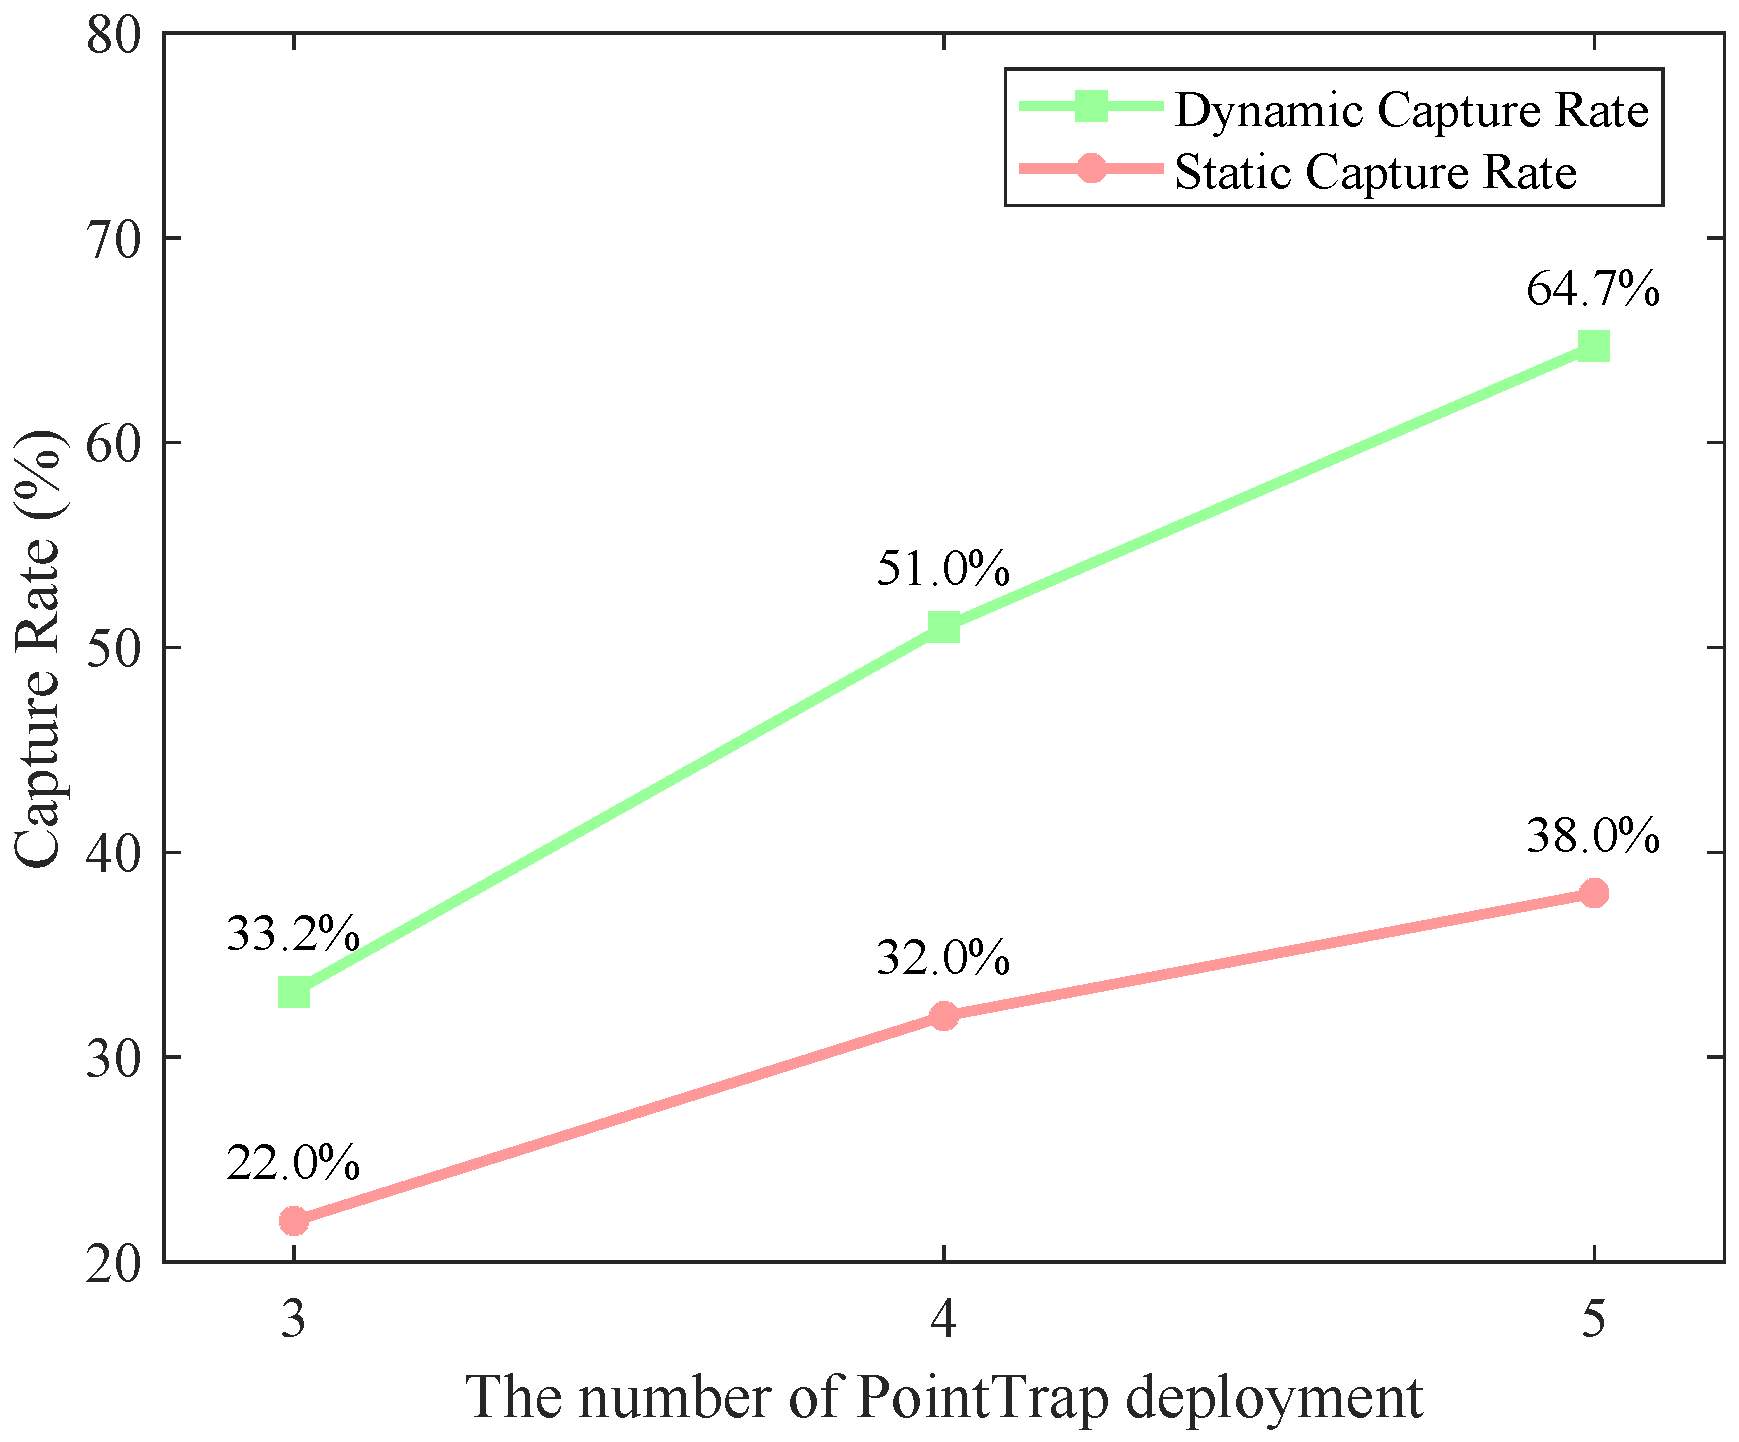
Figure 4 illustrates the attacker capture rate under our proposed framework, while Figure 5 shows the results of the random deployment strategy. Our dynamic deployment strategy consistently outperforms the static one. This improvement is particularly notable as it shows predictive features and frequent adaptation yield significant gains in threat interception. As expected, both random deployment strategies fall short compared to our optimized approach, due to the lack of guidance from node embedding values and attack path inference. This comparative analysis highlights the superiority of our feature-driven dynamic defense strategy.

5.6. Evaluation of Deceptive Trapping Effectiveness

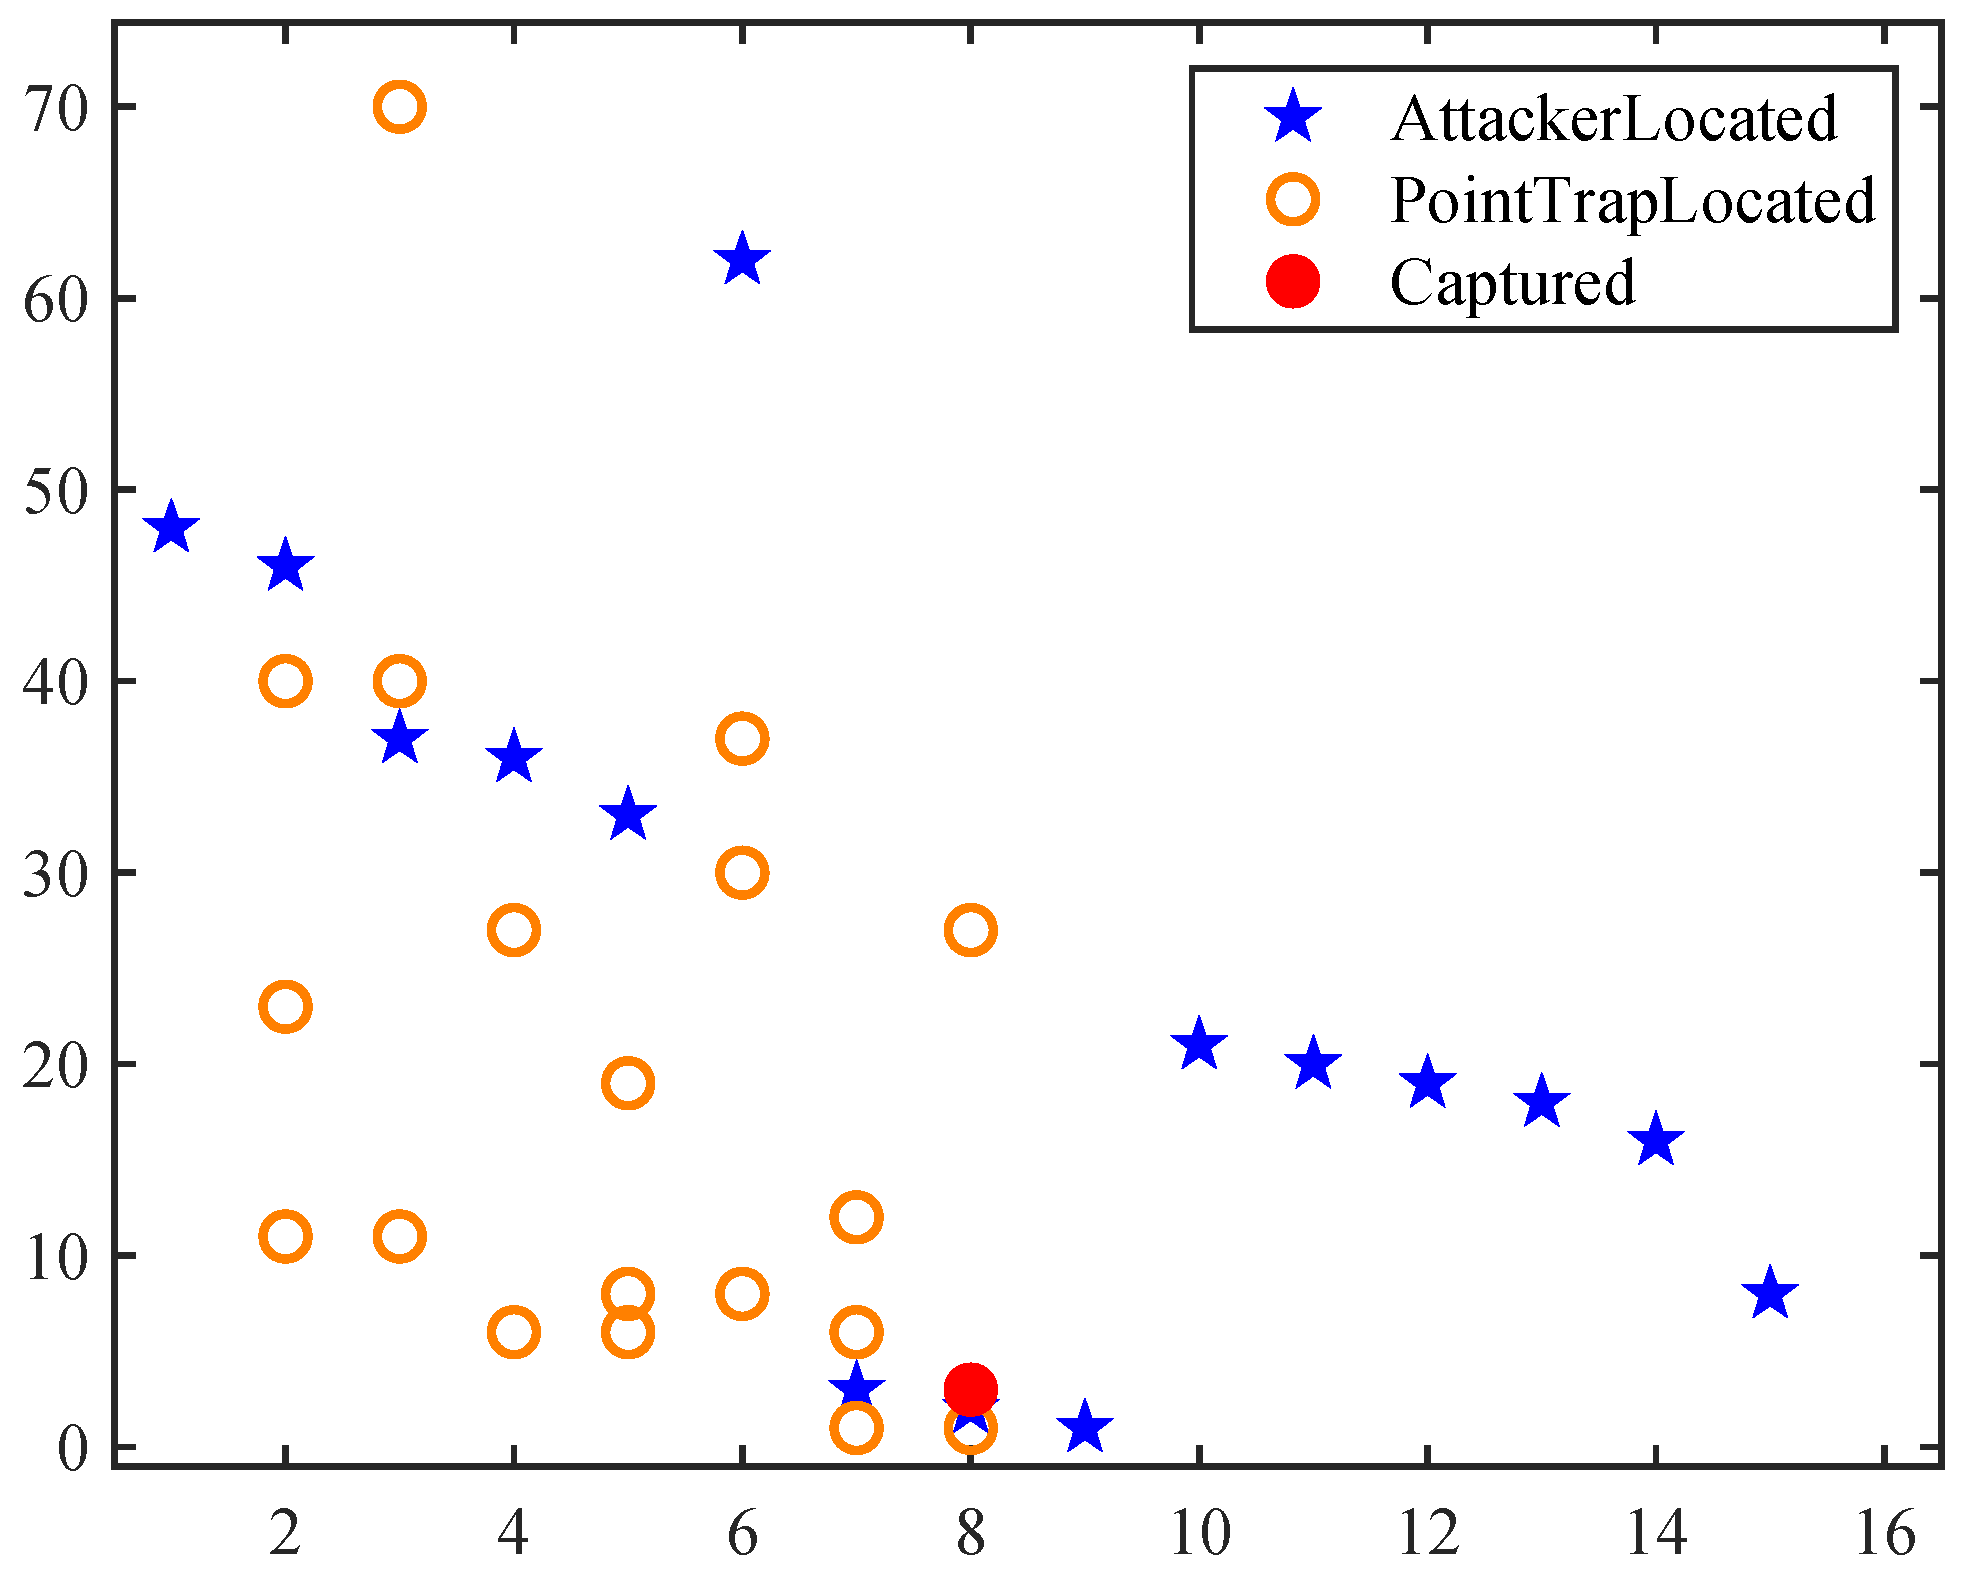
To evaluate the practical effectiveness of the proposed framework, we assess the model’s ability to guide the deployment of pointTraps that effectively intercept attackers. Figure 6 presents a representative example where three decoy nodes were deployed on a 75-node attack graph, successfully intercepting the attacker within 10 steps. This demonstrates the responsive nature of the model.
Table 2 shows a statistical evaluation of trapping efficiency. The data indicate that increasing the number of deployed decoys generally reduces the steps required to intercept the attacker. More importantly, even with only three decoys, a significant portion of attacks are intercepted within 10 steps, demonstrating the model’s efficiency under constrained deployment.

5.7. Unified Sensitivity, Stability, and End-to-End Cost–Benefit on DT3

Equation (11) introduces an amplification coefficient Δ to locally reinforce the triggered region during online redeployment. We therefore examine two practical aspects as follows: (i) how sensitive the defense performance and deployment stability are to Δ , and (ii) whether the full pipeline (path-level learning + event-driven MIP re-optimization) provides sufficient practical gain over lightweight heuristics given its computational overhead. To address both concerns in a compact and reproducible manner, we report a unified study on DT3, which we treat as the default benchmark for subsequent experiments.
Protocol (DT3 as default). Unless otherwise stated, we evaluate on DT3 with budget B = 4 pointTraps and run 200 attack episodes with different random seeds. Each episode follows the same Bayesian attacker simulation as described in Section 5.2. We use an event-driven online update as follows: exactly one trigger per episode (the first pointTrap activation), after which we apply local amplification (Equation (11)), re-score the fixed candidate path set P , and re-solve the MIP once using Gurobi to obtain a redeployed trap set.
Metrics. We report the (i) capture rate (percentage of episodes in which the attacker is intercepted), (ii) deployment concentration around the triggered node v ,
C = | D ( { v } N ( v ) ) | | D | ,
where D is the deployed trap set after triggering and N ( v ) is the one-hop neighborhood, and (iii) event-response latency (mean wall-clock time from trigger to redeployment decision, including embedding update, path re-scoring, and Gurobi solve time). A smaller C indicates less overconcentration around the alerted region and therefore better coverage diversity.
Baselines (lightweight heuristics). To quantify gain vs. simpler strategies, we compare our full pipeline with two lightweight baselines, each performing a single local update after the trigger as follows: (1) CVSS-weighted betweenness: rank nodes by betweenness centrality weighted by node importance I v (Section 4.1), deploy top-B nodes, and after a trigger perform one local replacement within the 1-hop neighborhood of v ; (2) Shortest-path coverage (greedy): construct top-K shortest/high-confidence source–target paths using edge costs derived from node risks, deploy traps by greedy path-coverage maximization under budget B, and after a trigger update once and redeploy.
Results and observations. Table 3 summarizes the unified results on DT3. Across a wide range of Δ , capture performance varies mildly while the concentration metric C remains controlled in the recommended region, indicating that the amplification step does not cause severe overconcentration under our single-trigger protocol. Moreover, compared with lightweight heuristics, the full pipeline yields higher capture rate while maintaining practical trigger-to-redeployment latency, supporting the cost–benefit rationale of event-driven MIP re-optimization. Based on this trade-off, we set Δ = 0.05 as the default in the remaining DT3-based experiments.

5.8. Evaluation of Attack vs. Non-Attack Edge Discrimination

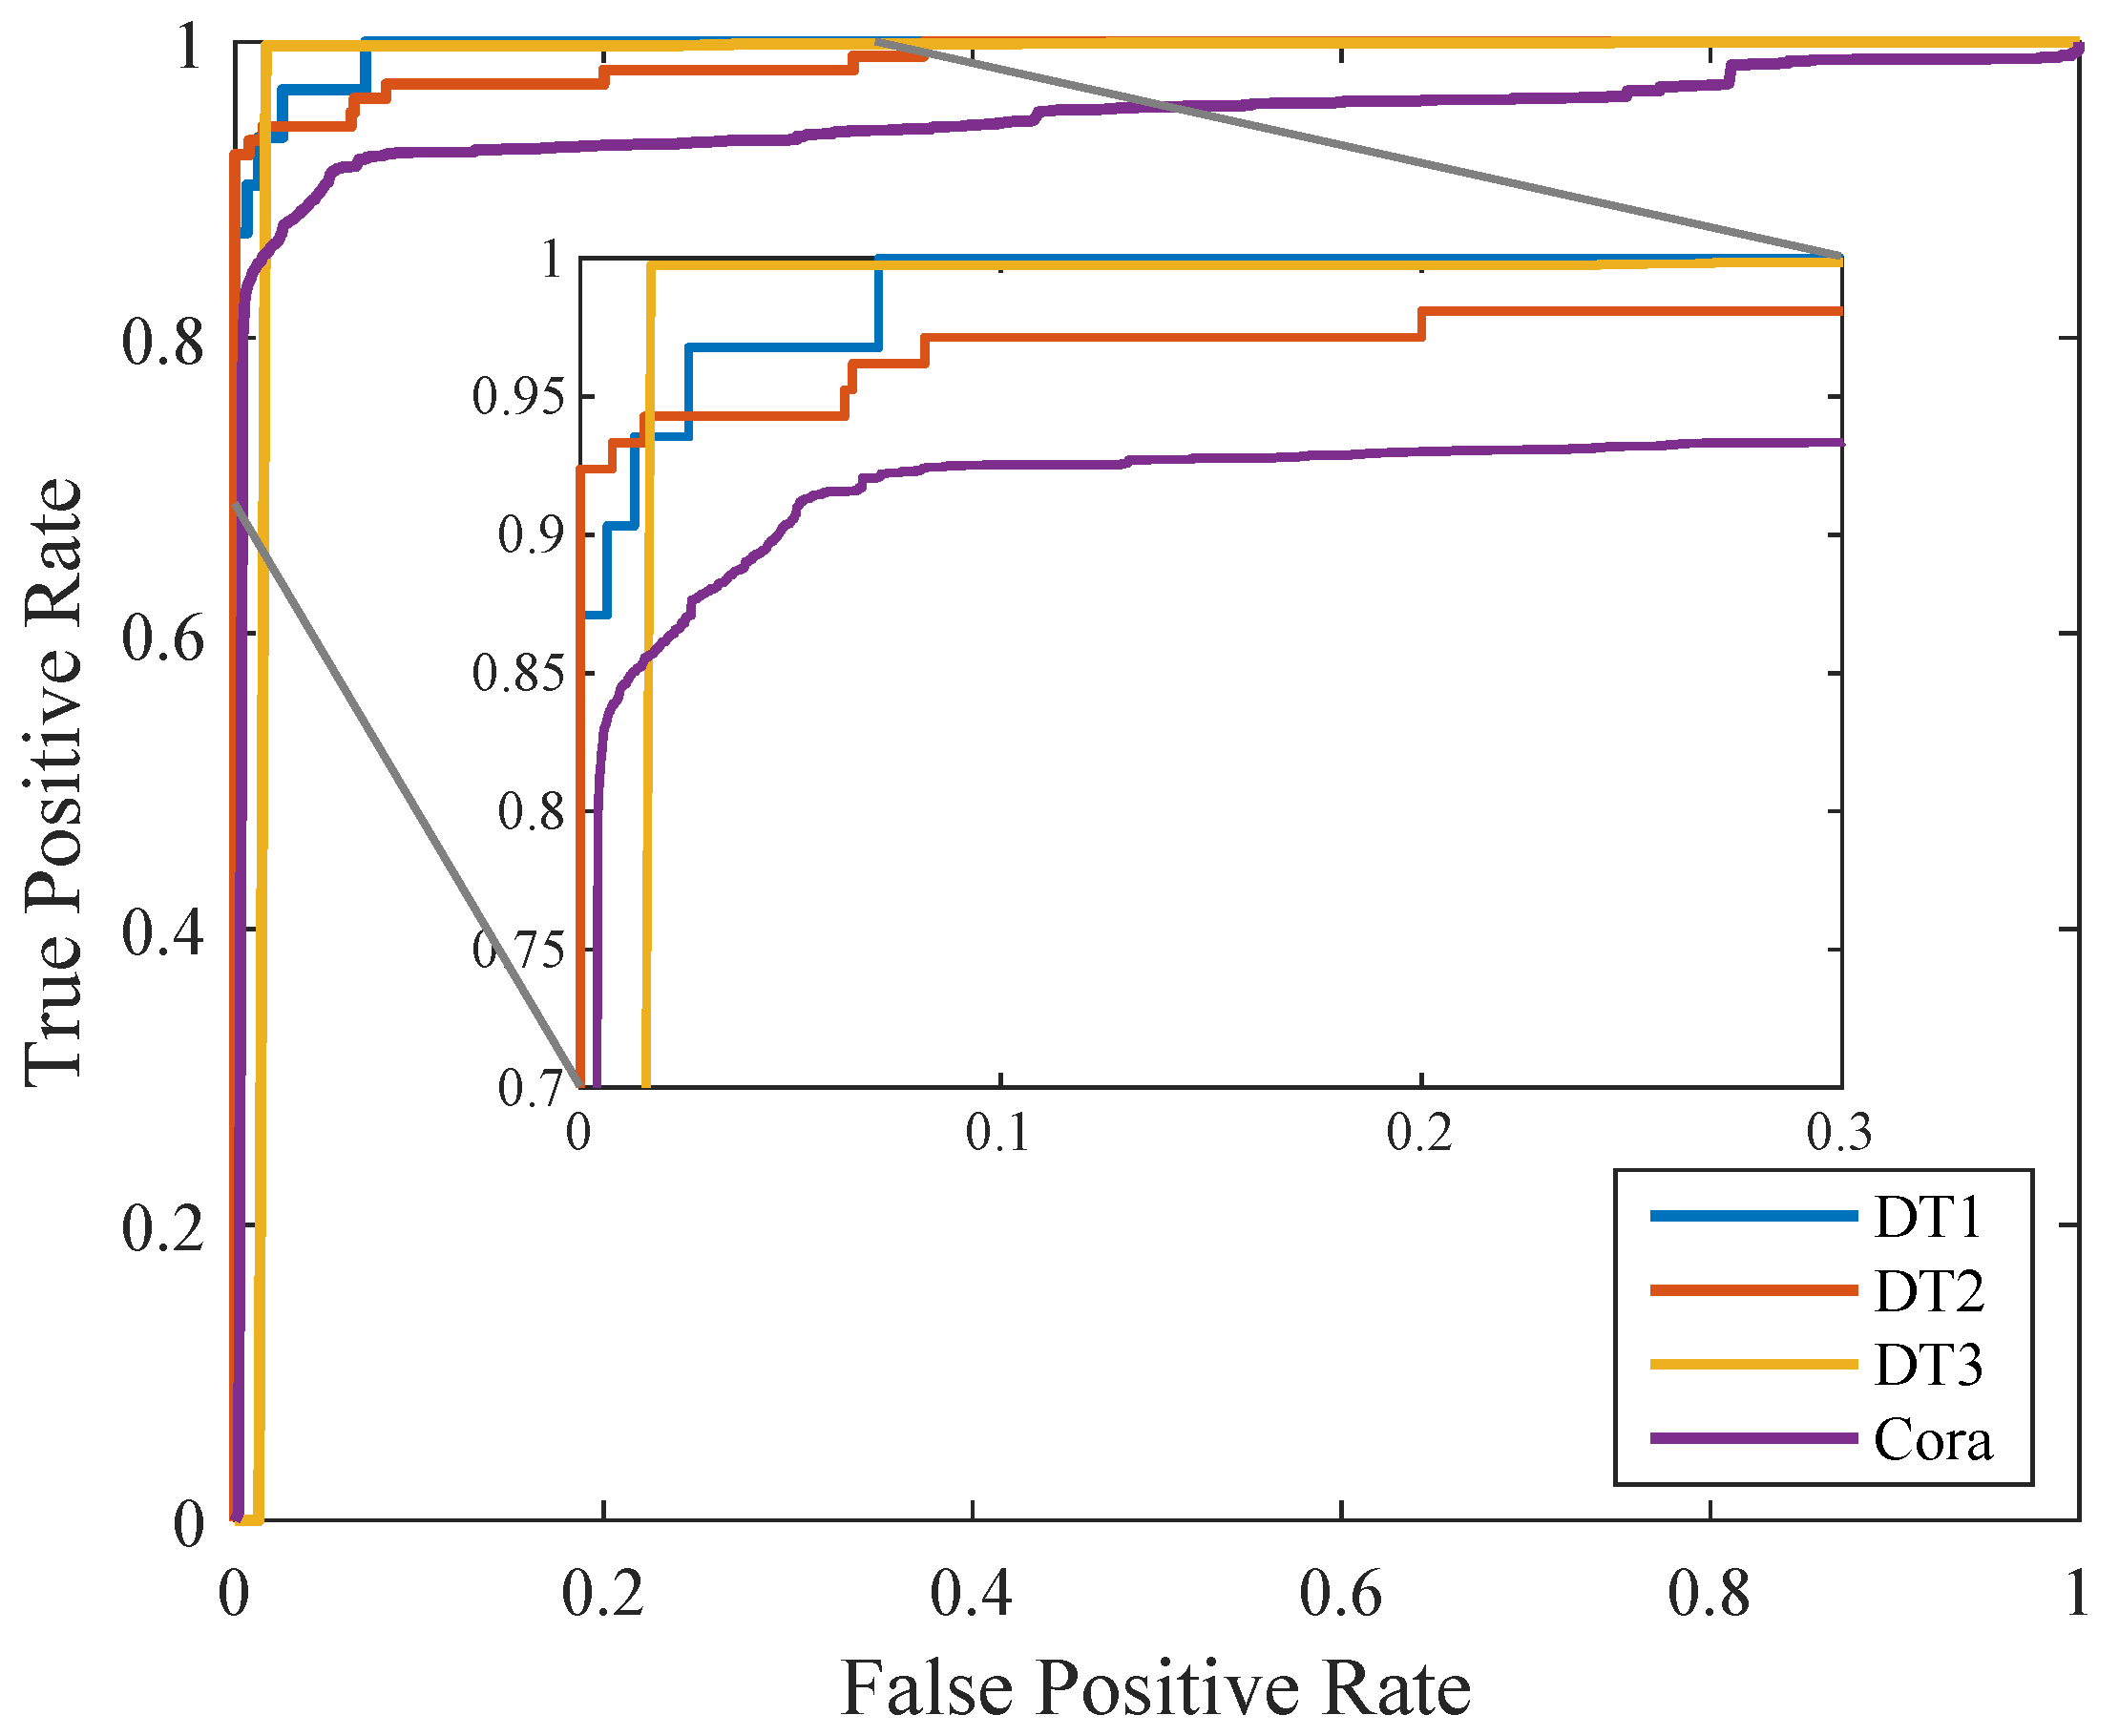
We evaluate the proposed framework’s ability to distinguish real attack edges (positive samples) from non-attack edges (negative samples) using ROC curves and AUC. ROC Evaluation on Native Attack Graph. We compare GT-GNN variants—GAT, GraphSAGE, and GCN backbones. Figure 7 plots their ROC curves as follows: GT-GNN(GAT) achieves AUC = 0.9891, significantly outperforming GraphSAGE (AUC = 0.845) and GCN (AUC = 0.798).
ROC/AUC evaluates the model’s ability to separate attack edges from non-attack edges across all decision thresholds, which is important because downstream path scoring relies on reliable edge plausibility estimates (Equation (6)) for pseudo-labeling and candidate path weighting. A high AUC indicates stable discrimination quality and reduces the risk that optimization is driven by spurious edges.
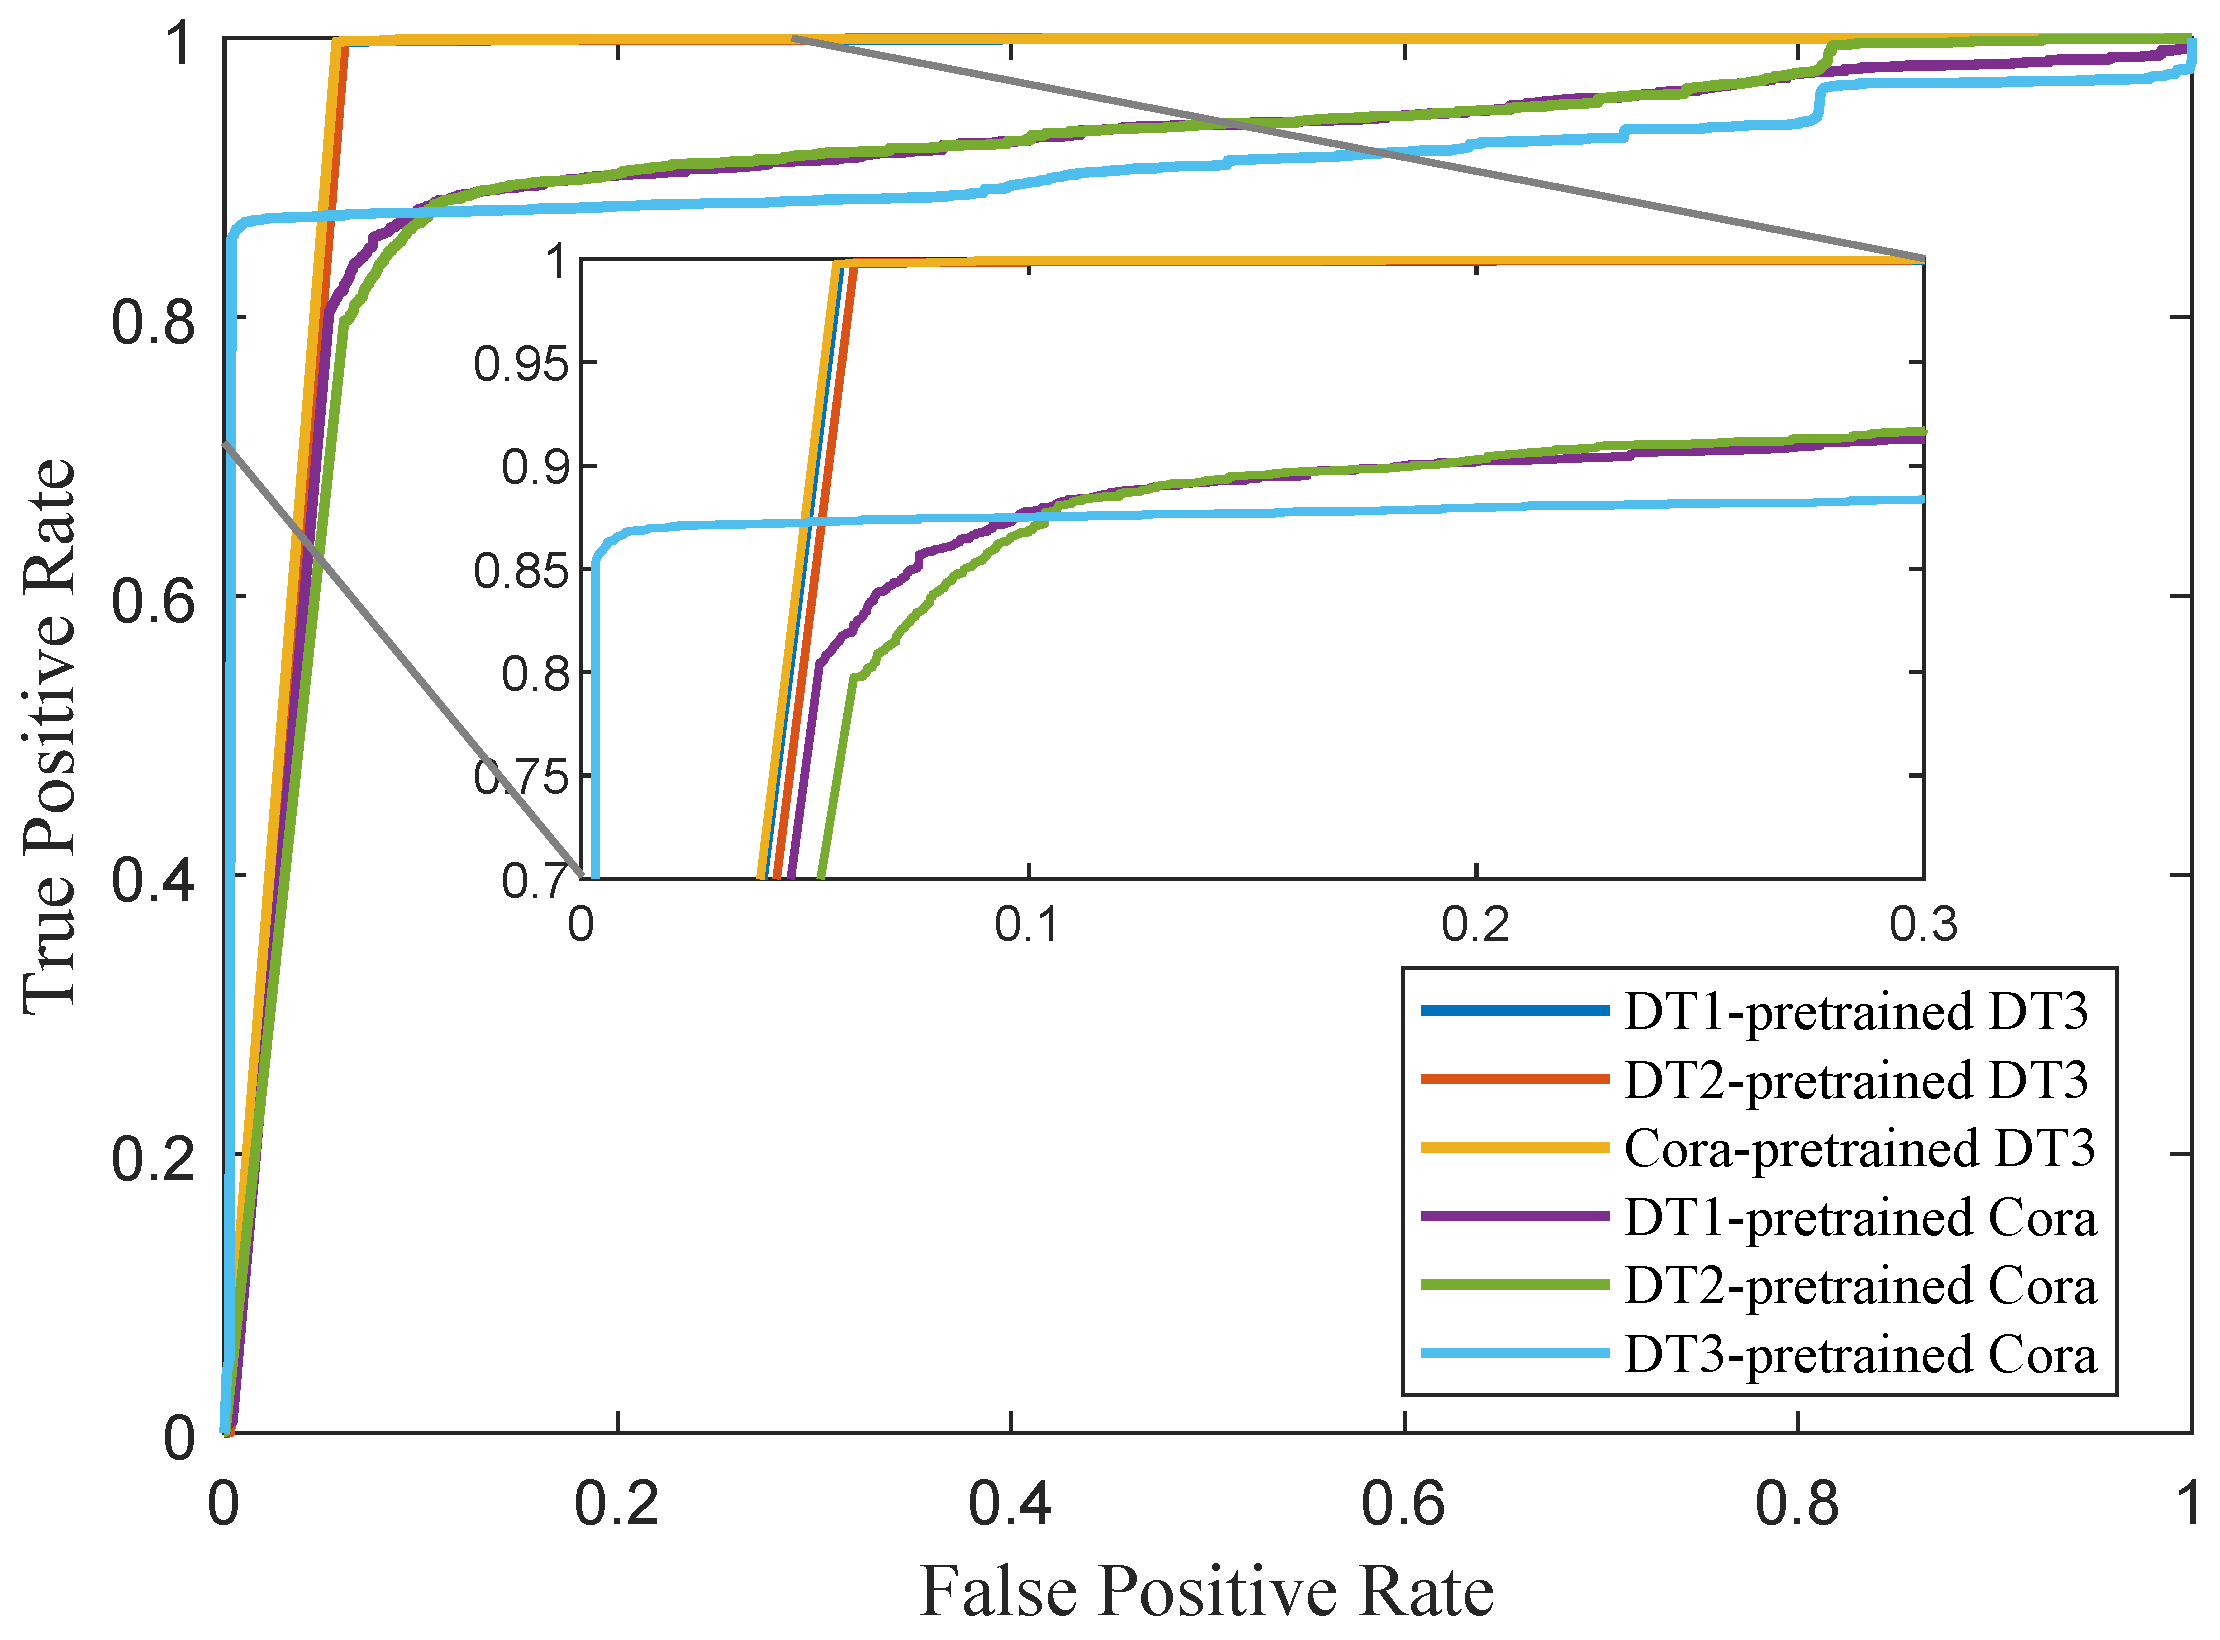
Transfer-Learning ROC Evaluation. To test cross-domain generalization, we pre-train the GAT-backbone GT-GNN on the Cora citation network and directly apply it to the 75-node attack graph. Figure 8 shows the transferred models achieve AUCs of 0.947 and 0.932, respectively, only slightly below the from-scratch baseline (AUC = 0.989). This indicates strong inductive transfer of graph structural representations, providing evidence the use of Cora for this specific test and demonstrating the model’s potential to be deployed in new environments with limited specific training data.

5.9. Evaluation Summary and Observations

Our experimental results indicate the following:
  • The GAT model trained on fused features achieves superior convergence and accuracy.
  • Feature enhancement after attacker movement can effectively guide dynamic redeployment.
  • Dynamic pointTrap strategies significantly outperform static ones.
  • The system performs well under various attacker behaviors simulated by Bayesian paths.

6. Conclusions

In this paper, we proposed a novel framework for dynamic decoy deployment guided by a graph neural network. Unlike traditional static defense strategies, the proposed framework leverages the rich topological and semantic information of attack graphs to optimize decoy placement in real time. Our model effectively captures the structural patterns of multi-stage attacks and provides an efficient solution for adaptive defense, with experiments indicating strong performance on moderately sized networks.
On DT3 with B = 4 , our event-driven pipeline improves the capture rate from 40 % (CVSS-weighted betweenness) to 51 % (ours), i.e., a relative gain of 30 % , while keeping the trigger-to-redeployment latency under 200 ms within the recommended Δ range (Section 5.7). Compared to the static placement shown in Figure 4, dynamic redeployment yields consistent improvements under the same budgets.
Through extensive experiments on synthetic datasets, we demonstrated that the proposed framework achieves high accuracy in distinguishing attack edges and exhibits rapid convergence. More importantly, our evaluation of deceptive trapping effectiveness shows that framework can guide deployment strategies that successfully intercept attackers within a limited number of steps, even under resource-constrained settings. The deployment decisions exhibit strong responsiveness and adaptability to evolving attacker paths, confirming the model’s practicality in dynamic scenarios.
Our evaluation focuses on the first-alert closed-loop response and does not model fully trap-aware attackers who may adapt after multiple triggers or actively fingerprint decoys. Extending the attacker model to incorporate repeated interactions, deception recognition, and game-theoretic adaptation is an important direction for future work.
In summary, the proposed framework integrates attack graph analysis, GNN-based learning, and MIP-based optimization into a unified, adaptive framework. It provides a promising direction for intelligent, proactive, and resource-efficient cyber defense. Future work will focus on extending the proposed framework to larger and more heterogeneous attack graphs, incorporating real-time threat intelligence, and integrating with moving target defense mechanisms to further enhance its robustness against advanced persistent threats.

Author Contributions

R.L. and G.X. conceived and designed the study. R.L. performed the experiments and collected and analyzed the data. Z.H. provided technical assistance. G.X. supervised the project and provided resources. R.L. wrote the manuscript with feedback from all authors. All authors have read and agreed to the published version of the manuscript.

Funding

This work is supported by the National Key R&D Program of China (Grant No. 2023YFB2703802); in part by the National Natural Science Foundation of China (Grant No. 62272120, 62572133, U25B2025); in part by the Natural Science Foundation of Guangdong Province (Grant No. 2024A1515011426); in part by the Jointly Funded Projects of Universities, Institutes and Enterprises under the Basic Research Program of Guangzhou (Grant No. 2024A03J0325); in part by the Science and Technology Innovation Key R&D Program of Chongqing (Grant No. CSTB2023TIAD-STX0031); in part by the Major Key Project of PCL (Grant No. PCL2024A05); and, in part by the Project of Guangdong Key Laboratory of Industrial Control System Security (Grant No. 2024B1212020010).

Institutional Review Board Statement

Not applicable.

Informed Consent Statement

Not applicable.

Data Availability Statement

The Cora dataset analyzed during the current study is available in the OpenDataLab repository, https://opendatalab.org.cn/OpenDataLab/Cora (accessed on 20 January 2026). Other data supporting the conclusions of this article will be made available by the authors upon request.

Acknowledgments

The authors acknowledge the support received during the course of this research.

Conflicts of Interest

The authors declare no conflicts of interest.

References

  1. Sheyner, O.; Haines, J.; Jha, S.; Lippmann, R.; Wing, J.M. Automated generation and analysis of attack graphs. In Proceedings of the 2002 IEEE Symposium on Security and Privacy, Oakland, CA, USA, 12–15 May 2002; pp. 273–284. [Google Scholar]
  2. Ammann, P.; Wijesekera, D.; Kaushik, S. Scalable, graph-based network vulnerability analysis. In Proceedings of the 9th ACM Conference on Computer and Communications Security, Washington, DC, USA, 18–22 November 2002; pp. 217–224. [Google Scholar]
  3. Ou, X.; Govindavajhala, S.; Appel, A.W. MulVAL: A logic-based network security analyzer. In Proceedings of the USENIX Security Symposium, Baltimore, MD, USA, 12–14 August 2005; pp. 113–128. [Google Scholar]
  4. Mauw, S.; Oostdijk, M. Foundations of attack trees. In International Conference on Information Security and Cryptology, Seoul, Republic of Korea, 1–2 December 2005; Springer: Berlin/Heidelberg, Germany, 2005; pp. 186–198. [Google Scholar]
  5. Poolsappasit, N.; Dewri, R.; Ray, I. Dynamic security risk management using bayesian attack graphs. IEEE Trans. Dependable Secur. Comput. 2011, 9, 61–74. [Google Scholar] [CrossRef]
  6. Muñoz-González, L.; Sgandurra, D.; Barrère, M.; Lupu, E.C. Exact inference techniques for the analysis of Bayesian attack graphs. IEEE Trans. Dependable Secur. Comput. 2017, 16, 231–244. [Google Scholar] [CrossRef]
  7. Wang, Y.; Su, Z.; Benslimane, A.; Xu, Q.; Dai, M.; Li, R. Collaborative honeypot defense in UAV networks: A learning-based game approach. IEEE Trans. Inf. Forensics Secur. 2023, 19, 1963–1978. [Google Scholar] [CrossRef]
  8. Commey, D.; Hounsinou, S.; Crosby, G.V. Strategic Deployment of Honeypots in Blockchain-based IoT Systems. In Proceedings of the 2024 IEEE 6th International Conference on AI Circuits and Systems (AICAS), Abu Dhabi, United Arab Emirates, 22–25 April 2024; pp. 134–138. [Google Scholar]
  9. Tayouri, D.; Baum, N.; Shabtai, A.; Puzis, R. A survey of MulVAL extensions and their attack scenarios coverage. IEEE Access 2023, 11, 27974–27991. [Google Scholar] [CrossRef]
  10. Veličković, P.; Cucurull, G.; Casanova, A.; Romero, A.; Lio, P.; Bengio, Y. Graph attention networks. arXiv 2017, arXiv:1710.10903. [Google Scholar]
  11. Osman, M.; Nadeem, T.; Hemida, A.; Kamhoua, C. Optimizing honeypot placement strategies with graph neural networks for enhanced resilience via cyber deception. In Proceedings of the 2nd on Graph Neural Networking Workshop 2023, Paris, France, 8 December 2023; pp. 37–43. [Google Scholar]
  12. Ngo, H.Q.; Guo, M.; Nguyen, H. Catch me if you can: Effective honeypot placement in dynamic ad attack graphs. In Proceedings of the IEEE Conference on Computer Communications (IEEE INFOCOM 2024), Vancouver, BC, Canada, 20–23 May 2024; pp. 451–460. [Google Scholar]
  13. Tian, Z.; Liao, B.; Fang, Q.; Sun, Y.; Wang, Y.; Yang, X.; Feng, J. Cybersecurity assurance system in the new era and development suggestions thereof: From self-defense to guard. Strateg. Study Chin. Acad. Eng. 2024, 25, 96–105. [Google Scholar] [CrossRef]
  14. Liu, H.; Zhou, Y.; Fang, B.; Sun, Y.; Hu, N.; Tian, Z. PHCG: PLC honeypoint communication generator for industrial IoT. IEEE Trans. Mob. Comput. 2024, 24, 198–209. [Google Scholar] [CrossRef]
  15. Nadeem, A.; Verwer, S.; Yang, S.J. Sage: Intrusion alert-driven attack graph extractor. In Proceedings of the 2021 IEEE Symposium on Visualization for Cyber Security (VizSec), Virtual, 27 October 2021; pp. 36–41. [Google Scholar]
  16. Wu, Z.; Pan, S.; Chen, F.; Long, G.; Zhang, C.; Yu, P.S. A comprehensive survey on graph neural networks. IEEE Trans. Neural Netw. Learn. Syst. 2020, 32, 4–24. [Google Scholar] [CrossRef] [PubMed]
  17. Kipf, T.N.; Welling, M. Semi-supervised classification with graph convolutional networks. arXiv 2016, arXiv:1609.02907. [Google Scholar]
  18. Hamilton, W.; Ying, Z.; Leskovec, J. Inductive representation learning on large graphs. In Proceedings of the Advances in Neural Information Processing Systems, Long Beach, CA, USA, 4–9 December 2017. [Google Scholar]
  19. Zopf, M. 1-wl expressiveness is (almost) all you need. In Proceedings of the 2022 International Joint Conference on Neural Networks (IJCNN), Padua, Italy, 18–23 July 2022; pp. 1–8. [Google Scholar]
  20. Xu, K.; Hu, W.; Leskovec, J.; Jegelka, S. How powerful are graph neural networks? arXiv 2018, arXiv:1810.00826. [Google Scholar]
  21. Sochor, T.; Zuzcak, M. Study of internet threats and attack methods using honeypots and honeynets. In International Conference on Computer Networks, Seoul, Republic of Korea, 1–2 December 2014; Springer: Berlin/Heidelberg, Germany, 2014; pp. 118–127. [Google Scholar]
  22. Schindler, T. Anomaly detection in log data using graph databases and machine learning to defend advanced persistent threats. arXiv 2018, arXiv:1802.00259. [Google Scholar] [CrossRef]
  23. Shen, M.; Ye, K.; Liu, X.; Zhu, L.; Kang, J.; Yu, S.; Li, Q.; Xu, K. Machine learning-powered encrypted network traffic analysis: A comprehensive survey. IEEE Commun. Surv. Tutor. 2022, 25, 791–824. [Google Scholar] [CrossRef]
  24. Abboud, R.; Dimitrov, R.; Ceylan, I.I. Shortest path networks for graph property prediction. In Proceedings of the Learning on Graphs Conference, Virtual, 9–12 December 2022. [Google Scholar]
  25. Xu, Y.; Fang, Y.; Liu, Z.; Zhang, Q. PWAGAT: Potential Web attacker detection based on graph attention network. Neurocomputing 2023, 557, 126725. [Google Scholar] [CrossRef]
  26. Ren, W.; Song, X.; Hong, Y.; Lei, Y.; Yao, J.; Du, Y.; Li, W. APT attack detection based on graph convolutional neural networks. Int. J. Comput. Intell. Syst. 2023, 16, 184. [Google Scholar] [CrossRef]
  27. Xu, Y.; Li, M.; Fang, B.; Liu, Y.; Tian, Z. Neural Honeypoint: An Active Defense Framework Against Model Inversion Attacks. IEEE Trans. Neural Netw. Learn. Syst. 2025, 36, 16186–16197. [Google Scholar] [CrossRef] [PubMed]
  28. Liu, T.; Meidani, H. Graph Neural Networks for Travel Distance Estimation and Route Recommendation Under Probabilistic Hazards. arXiv 2025, arXiv:2501.09803. [Google Scholar] [CrossRef]
  29. Jana, D.; Malama, S.; Narasimhan, S.; Taciroglu, E. Edge-based graph neural network for ranking critical road segments in a network. PLoS ONE 2023, 18, e0296045. [Google Scholar] [CrossRef] [PubMed]
  30. Maurya, S.K.; Liu, X.; Murata, T. Graph neural networks for fast node ranking approximation. ACM Trans. Knowl. Discov. Data 2021, 15, 1–32. [Google Scholar] [CrossRef]
  31. Akansha, S. Over-squashing in graph neural networks: A comprehensive survey. arXiv 2023, arXiv:2308.15568. [Google Scholar] [CrossRef]
  32. Wolsey, L.A. Mixed integer programming. In Wiley Encyclopedia of Computer Science and Engineering; Wiley: Hoboken, NJ, USA, 2007; pp. 1–10. [Google Scholar]
  33. Matthews, I.; Soudjani, S.; van Moorsel, A. Stochastic simulation techniques for inference and sensitivity analysis of Bayesian attack graphs. In International Conference on Science of Cyber Security, Shanghai, China, 13–15 August 2021; Springer: Berlin/Heidelberg, Germany, 2021; pp. 171–186. [Google Scholar]
Figure 1. The proposed framework architecture where (a) shows that by collecting information in the network, a Vulnerability-Based Attack Graph is constructed. Based on the CVSS score and Node2Vec, the node attributes and topological structure are quantified into feature values, which are fused and obtained as shown in (b). Next, as shown in (c), the Fused Features are input into the graph neural network to extract the key path in the attack graph, and decoy nodes are deployed. Finally, the output value of the graph neural network obtained in (c) is used as the input of the MIP algorithm for subsequent deployment, and the local feature values are amplified according to the attacker’s behavior to achieve closed-loop optimization deployment, as shown in (d).
Mathematics 14 00683 g001
Figure 2. Convergence comparison under different inputs.
Mathematics 14 00683 g002
Figure 3. Convergence performance of different GNN models.
Mathematics 14 00683 g003
Figure 4. Proposed method: feature-driven deployment.
Mathematics 14 00683 g004
Figure 5. Random baseline: uninformed deployment.
Mathematics 14 00683 g005
Figure 6. A case study: deploying 3 decoy nodes on a 75-node attack graph to successfully trap the attacker within 10 steps.
Mathematics 14 00683 g006
Figure 7. ROC Curves of the GAT Model Across Multiple Network Datasets.
Mathematics 14 00683 g007
Figure 8. Transfer-learning ROC curves of GAT pre-trained on multiple datasets.
Mathematics 14 00683 g008
Table 1. Dataset features and statistics.
DatasetNodesEdgesLEAFANDOR
DT132311688
DT275105303312
DT320304053101110127
Cora27085429N/AN/AN/A
Table 2. Steps required to capture the attacker under different deployment scales.
Capture Range3 PointTraps4 PointTraps5 PointTraps
<5 steps35.6%46.1%48.1%
≥5, <0 steps47.4%40.3%41.5%
≥10 steps17.0%13.6%10.4%
Table 3. Unified sensitivity/stability and end-to-end cost–benefit results on DT3 (budget B = 4 , 200 episodes, single trigger per episode, solved with Gurobi). Latency measures the mean trigger-to-redeployment time (ms).
Setting/MethodCapture Rate (%)ConcentrationLatency (ms)
Ours (event-driven + MIP)
Δ = 0.00 380.30150
Δ = 0.01 450.36155
Δ = 0.05 510.42172
Δ = 0.10 490.50194
Δ = 0.20 440.63225
Lightweight baselines
CVSS-weighted betweenness400.729
Shortest-path coverage (greedy)330.6117
Disclaimer/Publisher’s Note: The statements, opinions and data contained in all publications are solely those of the individual author(s) and contributor(s) and not of MDPI and/or the editor(s). MDPI and/or the editor(s) disclaim responsibility for any injury to people or property resulting from any ideas, methods, instructions or products referred to in the content.