Article

CB-OWL-ViT: A Multimodal Cost-Effective Framework for Contagious Disease Monitoring

by
Mohammad Fatahi
1,†,
Danial Sadrian Zadeh
2,†,
Ali Noormohammadi-Asl
2,†,
Behzad Moshiri
1,2,*,
Otman A. Basir
2,
Ebrahim Navid Sadjadi
3,
Jesús García-Herrero
3 and
José M. Molina
3
1
School of Electrical and Computer Engineering, College of Engineering, University of Tehran, North Kargar Street, Tehran 1439957131, Iran
2
Department of Electrical and Computer Engineering, University of Waterloo, 200 University Avenue West, Waterloo, ON N2L 3G1, Canada
3
Computer Science and Engineering Department, Universidad Carlos III de Madrid, Colmenarejo, 28270 Madrid, Spain
*
Author to whom correspondence should be addressed.
These authors contributed equally to this work.
Mathematics 2026, 14(4), 647; https://doi.org/10.3390/math14040647
Submission received: 6 December 2025 / Revised: 6 February 2026 / Accepted: 7 February 2026 / Published: 12 February 2026

Abstract

The rapid spread of diseases like COVID-19 highlights the need for adaptable monitoring systems to support public health measures such as mask compliance and social distancing. This study presents the CB-OWL-ViT framework: a Cluster-Based Open-World Localization Vision Transformer for mask detection and social distance estimation. It incorporates homography-based distance estimation for effective deployment with monocular cameras. The innovative integration of open-world vision-language detection with a clustering-based strategy enhances mask-wearing assessments, enabling adaptability without retraining. Evaluations on datasets including Kaggle, Roboflow, and a new dataset from the University of Waterloo show that CB-OWL-ViT improves mask detection precision by 0.37 and F1-score by 0.2 compared to the baseline. The homography module achieves a Mean Absolute Error of 0.1116 in distance estimation, and real-world tests demonstrate a recall of 0.98 for detecting noncompliance in the “Without Mask” class. This framework is a practical solution for large-scale disease monitoring across various settings.

1. Introduction

1.1. Research Background and Motivations

The outbreak of COVID-19 demonstrated how rapidly a global pandemic can disrupt daily social interactions, mental health, and economic stability. COVID-19 affected millions of people worldwide, resulting in numerous deaths, which in turn forced governments to establish strict measures and implement regulations, such as social distancing and face mask mandates, to prevent the rapid spread of the virus [1,2,3,4]. Since disparities in vaccine distribution, particularly in low-income countries, highlight the serious threat posed by pandemics [5], the use of face masks has become critical. Failure to comply with mask mandates, even after vaccination, remains a major factor in the further spread of the virus [6,7]. Consequently, the development of new tools is necessary to overcome these challenges and mitigate potential adverse outcomes [8].
Machine Learning (ML) has revolutionized various domains by enabling intelligent, data-driven solutions to complex problems [9,10]. Notably, ML-based methods have become cornerstone tools for monitoring and enforcing social distancing and face mask mandates during the pandemic [11]. ML-driven surveillance systems have been widely employed to detect human faces and identify individuals in crowded environments [12,13,14], thereby supporting the enforcement of social distancing and mask mandates [8]. Since 2020, there has been a rapid advancement in ML-based methodologies in pandemic monitoring and response. However, a critical limitation of many existing methods is their lack of flexibility and scalability for low-cost, large-scale deployment [2,3,8]. In this context, flexibility refers to the ability of mask detection models to adapt to new scenarios without requiring additional retraining. On the other hand, low cost implies that social distance estimation models can be deployed with minimal computational and financial resources. This raises two key research questions (RQs):
  • RQ 1: How can a mask detection model be developed to robustly adapt to new scenarios without requiring additional retraining?
  • RQ 2: How can a social distance estimation model be developed to cost-effectively operate with various types of cameras, including but not limited to stereo cameras?
In this paper, social distancing monitoring denotes systems that assess compliance with distancing rules by monitoring such practices and by computing or estimating interpersonal (physical) distances; accordingly, social distance estimation is also used to refer to the computation or estimation of these distances.

1.2. Problem Statements and Objectives

The overall problem can be divided into two key components: (i) face mask detection and (ii) social distance estimation.
Face Mask Detection: Existing methods for detecting face masks are commonly trained to classify a fixed set of predefined classes. These approaches struggle to generalize to new scenarios, such as detecting specific types of masks or monitoring particular population groups (e.g., children). On the other hand, object detection algorithms typically require large and diverse datasets to perform reliably [15]. Therefore, the present study develops a multimodal approach based on the Open-World Localization Vision Transformer (OWL-ViT) [16], which quickly adapts to new conditions without requiring additional training. However, OWL-ViT is unreliable in complex scenarios, such as assessing mask-wearing compliance. To address this limitation, the present study proposes integrating a clustering algorithm into the OWL-ViT framework to enhance its performance in complex scenarios.
Social Distance Estimation: Most existing methods for estimating the distance between individuals rely on depth sensors, such as stereo or RGB-D cameras, to obtain accurate real-world measurements. However, depth-sensing cameras are generally more expensive than monocular ones due to additional hardware components and calibration requirements. This added complexity not only increases hardware costs but also necessitates more advanced image-processing algorithms, rendering their deployment rather impractical for cost-sensitive applications. This issue becomes particularly critical in tasks such as condition monitoring during contagious disease outbreaks, where large-scale implementation across countries, including low-income regions, is essential. To address this challenge, this study proposes to integrate two well-established methods in the framework: (i) metric depth estimation and (ii) homography transformation, which are compatible with any camera, devising a cost-effective and practical solution for large-scale deployment.

1.3. Research Contributions

The key research contributions of the present study are summarized as follows:
  • Cluster-Based Integration of Open-World Vision-Language Detection: This study introduces Cluster-Based OWL-ViT (CB-OWL-ViT), a novel integration of OWL-ViT with a clustering-based decision mechanism that aggregates evidence from multiple semantically related textual queries. This strategy enhances robustness in mask-wearing assessment under ambiguous visual conditions, without modifying the underlying detection architecture or requiring retraining.
  • Practical Use of Established Distance Estimation Techniques: Homography transformation and metric depth estimation, two established geometric and learning-based methods, are incorporated to enable cost-effective social distance estimation using monocular cameras.
  • Flexible and Cost-Effective Monitoring Framework: The proposed framework enables rapid adaptation to new monitoring scenarios through query redefinition and supports deployment with a wide range of camera types, addressing practical constraints in large-scale public health monitoring.
  • New Dataset and Empirical Evaluation: This study introduces a newly curated dataset collected at the University of Waterloo to empirically evaluate the proposed framework under controlled indoor conditions.
  • Comprehensive Comparison with State-of-the-Art (SOTA) Closed-Set Detectors: Extensive experiments compare the proposed framework with recent YOLO variants, highlighting the trade-offs between closed-set supervised detectors and open-world Vision-Language Models (VLMs).
The structure of the rest of this manuscript is organized as follows. Section 2 surveys the prior research relevant to the present study. The core methodology and the proposed framework are detailed in Section 3. The experimental design and implementation settings are described in Section 4. Section 5 outlines the obtained results and provides an in-depth evaluation and discussion of these outcomes. Lastly, Section 6 concludes the paper with final remarks and outlines potential avenues for future investigation.

2. Related Work

The literature on social distancing monitoring and face mask compliance using deep learning approaches has grown substantially. In this context, this section provides an overview of the key research developments in three subsections: (i) object detection, (ii) depth estimation, and (iii) condition monitoring during contagious disease outbreaks.

2.1. Object Detection

Object detection is a computer vision technique that identifies and localizes objects within images or videos. Object detection, often implemented with deep learning models, is used to achieve precise recognition and classification of objects across various applications. Based on the input modality, object detection models can be classified into two main categories: (i) unimodal models and (ii) multimodal models [16], as described below.

2.1.1. Unimodal Object Detection Models

These models rely solely on visual data for object localization and classification within a scene. Based on their detection architecture, unimodal models are generally classified into two categories: (i) one-stage models and (ii) two-stage models.
One-stage models, designed for efficient object detection, directly predict object classes and bounding boxes in a single pass. Recent SOTA one-stage models, such as YOLOv10 [17], YOLOv12 [18], and RT-DETR [19,20,21], represent the latest advancements in real-time object detection by offering a balanced trade-off between accuracy and efficiency. These models are used in scenarios that require both accuracy and low-latency inference.
On the other hand, two-stage models perform localization and detection using separate networks. Despite the dominance of one-stage models, two-stage models remain valuable for face mask detection because the paucity of richly annotated datasets necessitates separate training of the localization and detection modules. Typically, the face localization module is trained on general human face datasets, whereas the mask detection module is trained on specific datasets for face mask detection. One common strategy employs the Dual-Shot Face Detector (DSFD) [22] for facial localization, followed by a Convolutional Neural Network (CNN)-based model for mask detection. A significant limitation of DSFD, however, is its large size (∼458 MB) and its high complexity (∼20 million parameters).

2.1.2. Multimodal Object Detection Models

Multimodal object detection models are designed to integrate multiple input modalities, such as images and text, to achieve richer, more robust feature representations. These models originate from pioneering language-supervision approaches [23,24], which leverage large-scale vision-language pre-training to align visual and textual features in a shared embedding space. By combining semantic understanding of natural language with visual perception, multimodal object detection enables more flexible and generalizable recognition. For example, such models can detect objects specified through textual prompts, making them suitable for open-vocabulary or zero-shot detection tasks. Here, textual input refers to queries provided to the model, such as “a photo of a human” or “a photo of a child.”
Among language supervision-based object detection models, OWL-ViT and YOLO-World [25] are notable examples. The primary difference between these models lies in their architectures: OWL-ViT is based on the Vision Transformer (ViT) [26], whereas YOLO-World relies on CNNs; as a result, OWL-ViT benefits from superior generalization capabilities.
OWL-ViT formulates object detection as a patch-level matching problem between image embeddings and text embeddings, enabling direct localization of objects specified by natural language queries without requiring task-specific retraining. Prior studies have shown that OWL-ViT achieves competitive performance on simple and moderately complex scenes, particularly for coarse object categories such as humans, vehicles, and everyday objects, making it suitable for scenarios that require semantic flexibility. However, OWL-ViT exhibits notable limitations in highly cluttered or fine-grained scenarios. In particular, its detection accuracy tends to degrade when objects differ only by subtle visual cues, such as distinguishing between masked and unmasked faces, or when multiple visually similar instances coexist in close proximity. These limitations stem from the model relying on global semantic alignment rather than fine-grained local discrimination.
Consequently, while OWL-ViT demonstrates relatively reliable performance in simple detection settings (e.g., detecting humans or faces in unconstrained environments), its effectiveness decreases in complex mask-wearing compliance scenarios that require precise discrimination under occlusion, pose variation, and background clutter. To overcome this limitation, the present study proposes CB-OWL-ViT, which enhances the robustness of OWL-ViT in such challenging scenarios by incorporating a clustering-based refinement strategy while preserving its open-vocabulary and training-free detection capability.

2.2. Depth Estimation

Monocular Depth Estimation (MDE) is a crucial component in numerous modern applications, providing essential depth information from a single image. This capability is particularly valuable in domains such as 3D reconstruction, navigation, and autonomous driving, where precise spatial awareness is vital. MDE enhances the ability to interpret the depth and distance of objects, significantly improving decision-making in complex environments. Recent advancements in MDE, driven by models based on discriminative architectures like BEiT [27] and DINOv2 [28], as well as generative approaches such as Stable Diffusion [29], underscore the growing significance of accurate depth prediction across traditional and emerging fields [30,31].
Furthermore, Depth Pro [32] employs a proposed metadata-free method to predict metric disparity maps, utilizing multi-scale ViTs to achieve superior performance. In this model, the focal length, a vital parameter for metric prediction from monocular camera output, is inferred from the image using a ViT-based network. The metric distance is computed by predicting the canonical inverse depth and then scaling it by the horizontal focal length and image width. In this context, the present study proposes using Depth Pro to estimate metric disparity maps, which are then used within the pinhole camera model to compute real-world distances.

2.3. Condition Monitoring During Contagious Disease Outbreaks

Table 1 presents an overview of related work on condition monitoring during contagious disease outbreaks. Most prior studies have focused on stereo camera setups and developed models restricted to predefined classes. In contrast, the CB-OWL-ViT proposed in the present study leverages natural-language supervision and a clustering algorithm to adapt to novel scenarios while maintaining robust performance. Moreover, the proposed social distance estimation method is compatible with any camera type, enabling large-scale deployment, unlike costly stereo-camera systems.
The study in [33] utilizes the Single-Shot MultiBox Detector (SSD) for mask-wearing detection and estimates interpersonal distance using a triangle-similarity method, which assumes a standard human height of 165 cm. Although this method uses a monocular camera, its accuracy is limited by the assumption of a uniform height across individuals. It also relies on a custom dataset that is not publicly available. The study in [34] uses a stereo-camera configuration and the Euclidean distance formula to monitor social distancing and employs a ResNet-50 [42] combined with the DSFD [22] for mask-wearing detection; the ResNet-50 model was trained on the Real-World Masked Face Dataset (RMFD) [35].
The studies in [36,40] use YOLOv2 [43] and YOLOv4 [44], respectively, to monitor mask-wearing status; both models are trained on custom, nonpublic datasets. For social distancing monitoring, they use stereo camera systems and Euclidean distance computation. In the same line of research, the studies in [37,39] employ Faster R-CNN [45] for mask-wearing detection and, together with stereo cameras, use the Euclidean distance formula to estimate social distance. In addition, the study in [37] uses the widely exploited, publicly available Kaggle dataset [38].
The study in [8] combines MobileNetV2 [46] with DSFD for mask-wearing detection and employs a DeepSORT-based [47] method integrated with the Hungarian algorithm [48] for social distancing monitoring. It tracks individuals across consecutive frames by assigning unique identifiers that leverage both appearance features and bounding-box positions, using the Hungarian algorithm to find the optimal assignment. Although it uses a monocular camera, the approach incurs a high computational cost and provides no quantitative evaluation.
Finally, the study in [41] exclusively focuses on mask-wearing detection. It proposes LFMD-YOLO, an approach that integrates attention-based modules (i.e., C3E and MECAPF) with a modified feature fusion neck (i.e., E-BiFPN) into a lightweight YOLO framework to enhance detection accuracy and computational efficiency.

3. Methodology and Framework

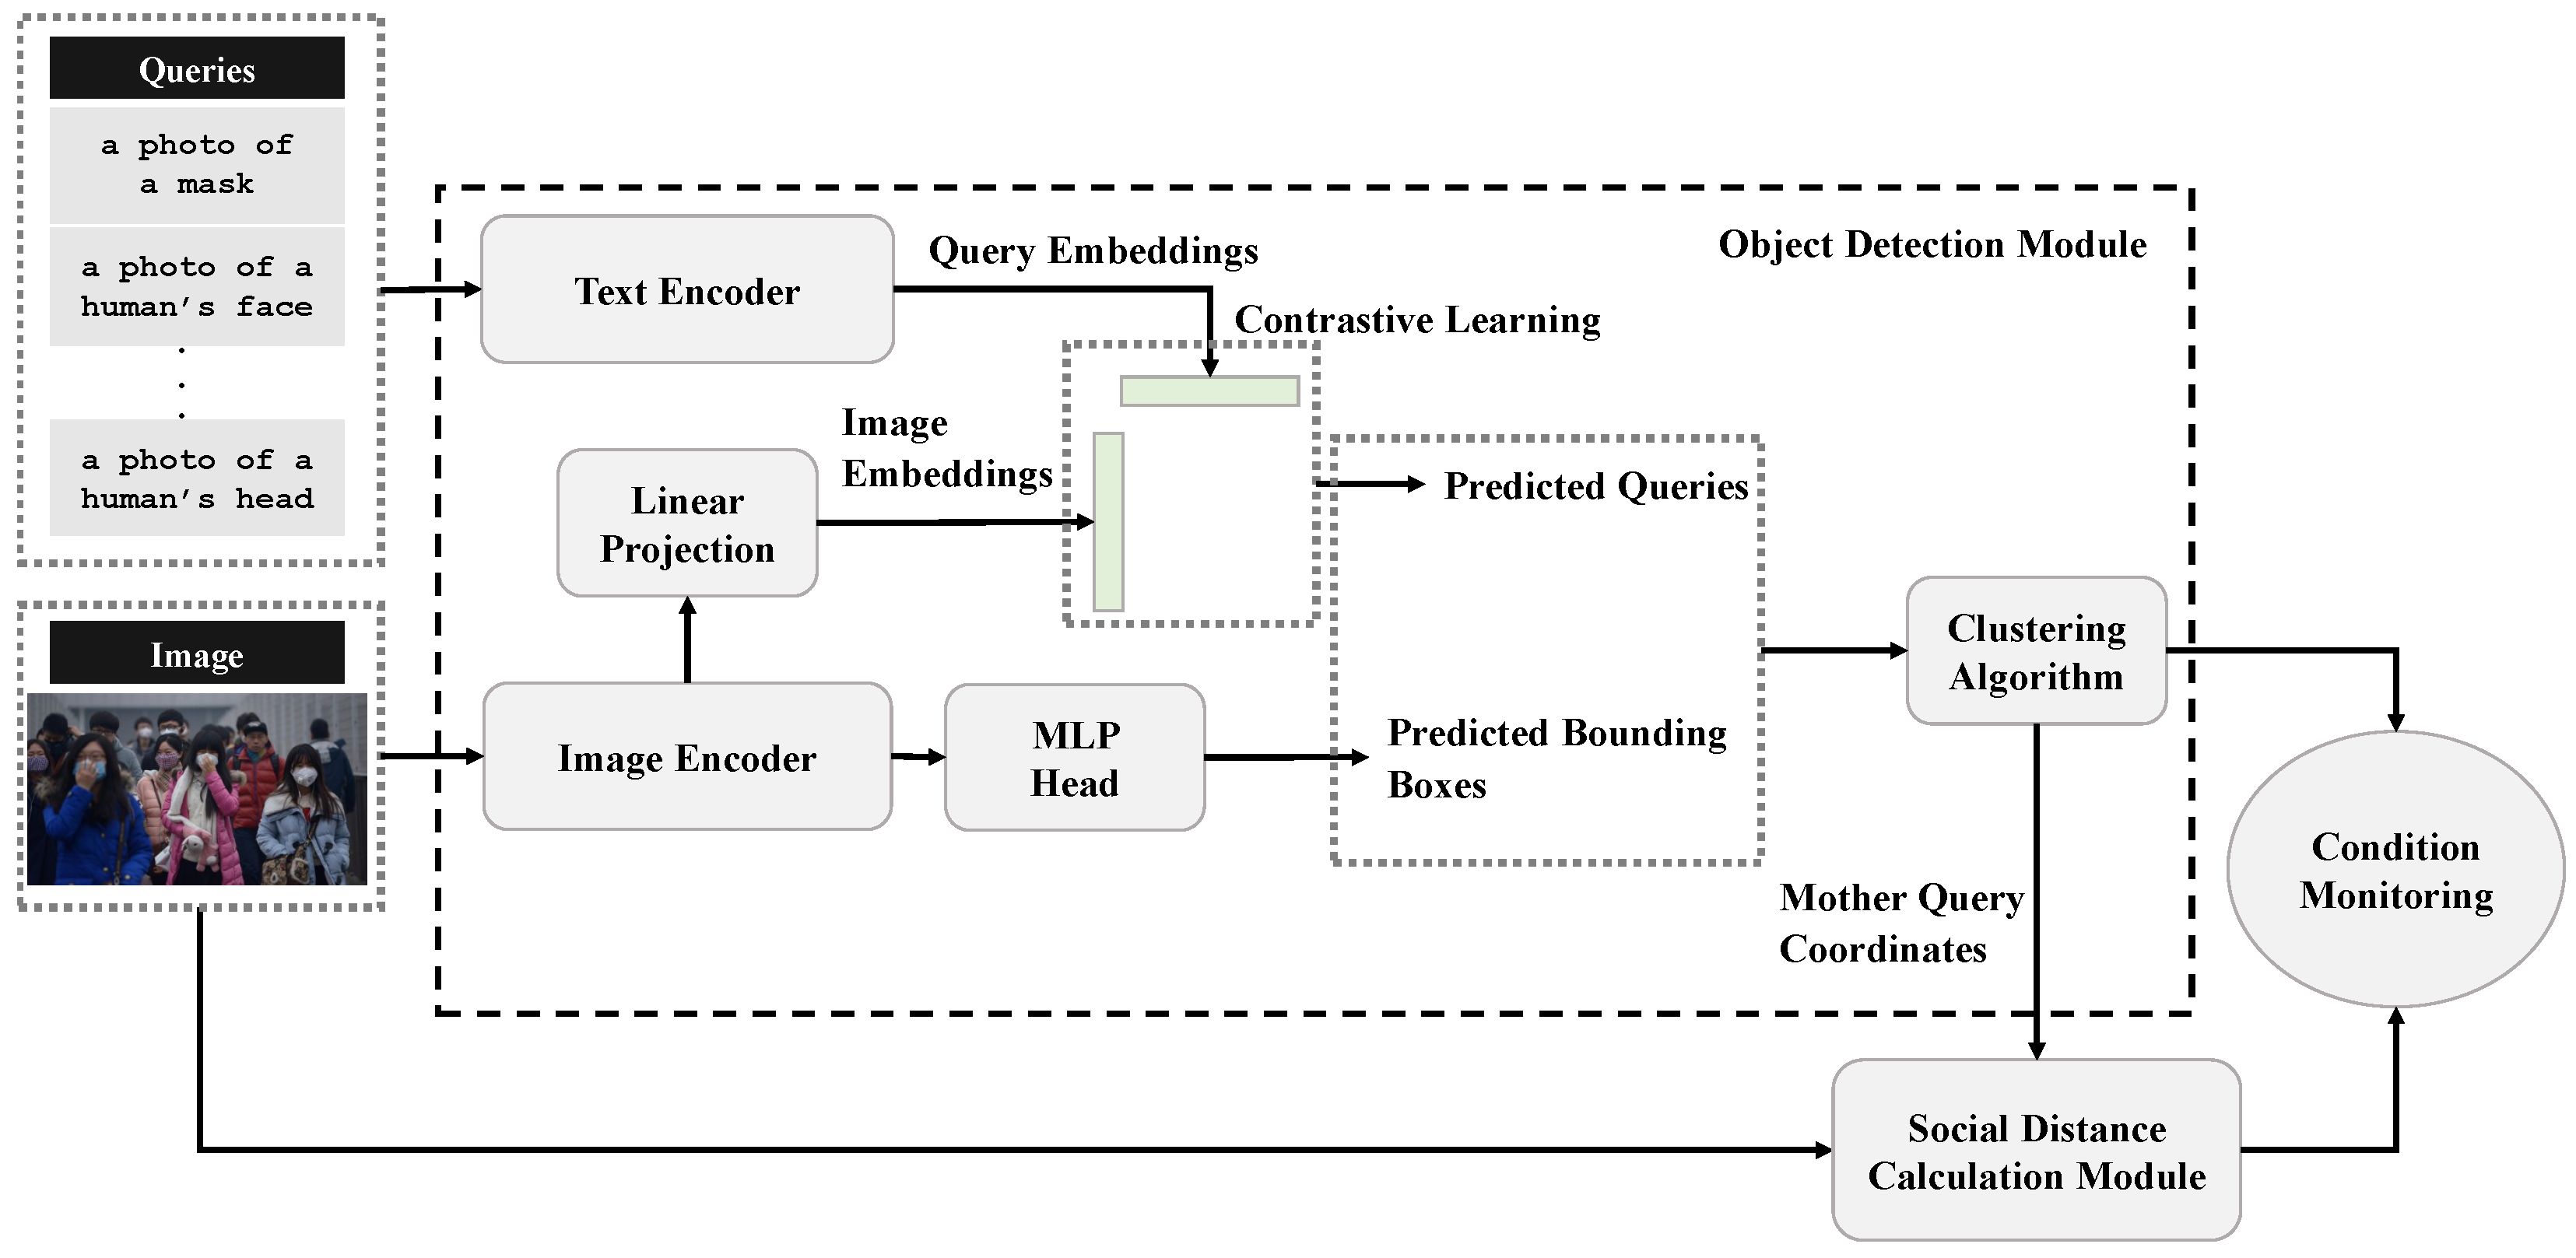
This section presents the proposed methodology and framework, illustrated in Figure 1, comprising two modules: (i) an object detection module and (ii) a social distance estimation module.
Formally, given an input image I R 3 × H × W , the objective is to detect a set of individuals P = { p k } k = 1 K , where each individual p k is characterized by (i) a bounding box b k R 4 , (ii) a semantic label y k { With Mask , Without Mask , Neutral } , and (iii) a physical location estimate X k R 2 .

3.1. Object Detection Module

As illustrated in Figure 1, the object detection module takes two input types (i.e., an image and a set of textual queries) and can rapidly adapt to new conditions by redefining the queries, thereby eliminating the need for additional training data. The architecture of the Text Encoder, Image Encoder, Linear Projection, and MLP Head follows OWL-ViT, initialized with its pre-trained weights. These components are detailed as follows:
  • Text Encoder consists of a 12-layer Transformer architecture incorporating Multi-Head Self-Attention (MHSA) layers with eight attention heads, a Feed-Forward Neural Network (FFNN) with a hidden dimension of 2048, layer normalization, residual connections, and positional embeddings. It employs a model-wide hidden dimension of 512 and generates query embeddings as output, extracted from the final End-Of-Sequence (EOS) token, for use in open-vocabulary object detection tasks.
  • Image Encoder employs the standard ViT-B/32 architecture to generate image embeddings from input image patches. It has a hidden dimension of 768 and produces token representations with a sequence length of 576.
  • Linear Projection comprises a single fully connected layer without any nonlinear activation function. It maps each output token representation from the ViT-B/32 model, which has a hidden dimension of 768, to an image embedding. This mapping facilitates direct comparison with query embeddings for object classification.
  • MLP Head comprises three fully connected layers configured for bounding box prediction. The input dimension is 768, corresponding to the hidden dimension of the ViT-B/32 model. The network includes two intermediate layers with a dimension of 2048, each followed by a ReLU activation function. The final output layer produces four numerical outputs corresponding to the bounding box coordinates— x center , y center , width , height . Consistent with standard Transformer design conventions, the intermediate layers have a dimensionality of 2048. The output layer applies no nonlinear activation function, and the predictions are intentionally biased toward the centers of the respective image patches to enhance localization accuracy.
The encoders form a contrastive learning pipeline that leverages large-scale image–text pairs to bring the embeddings of matching pairs close together while increasing the distance between those of nonmatching pairs.
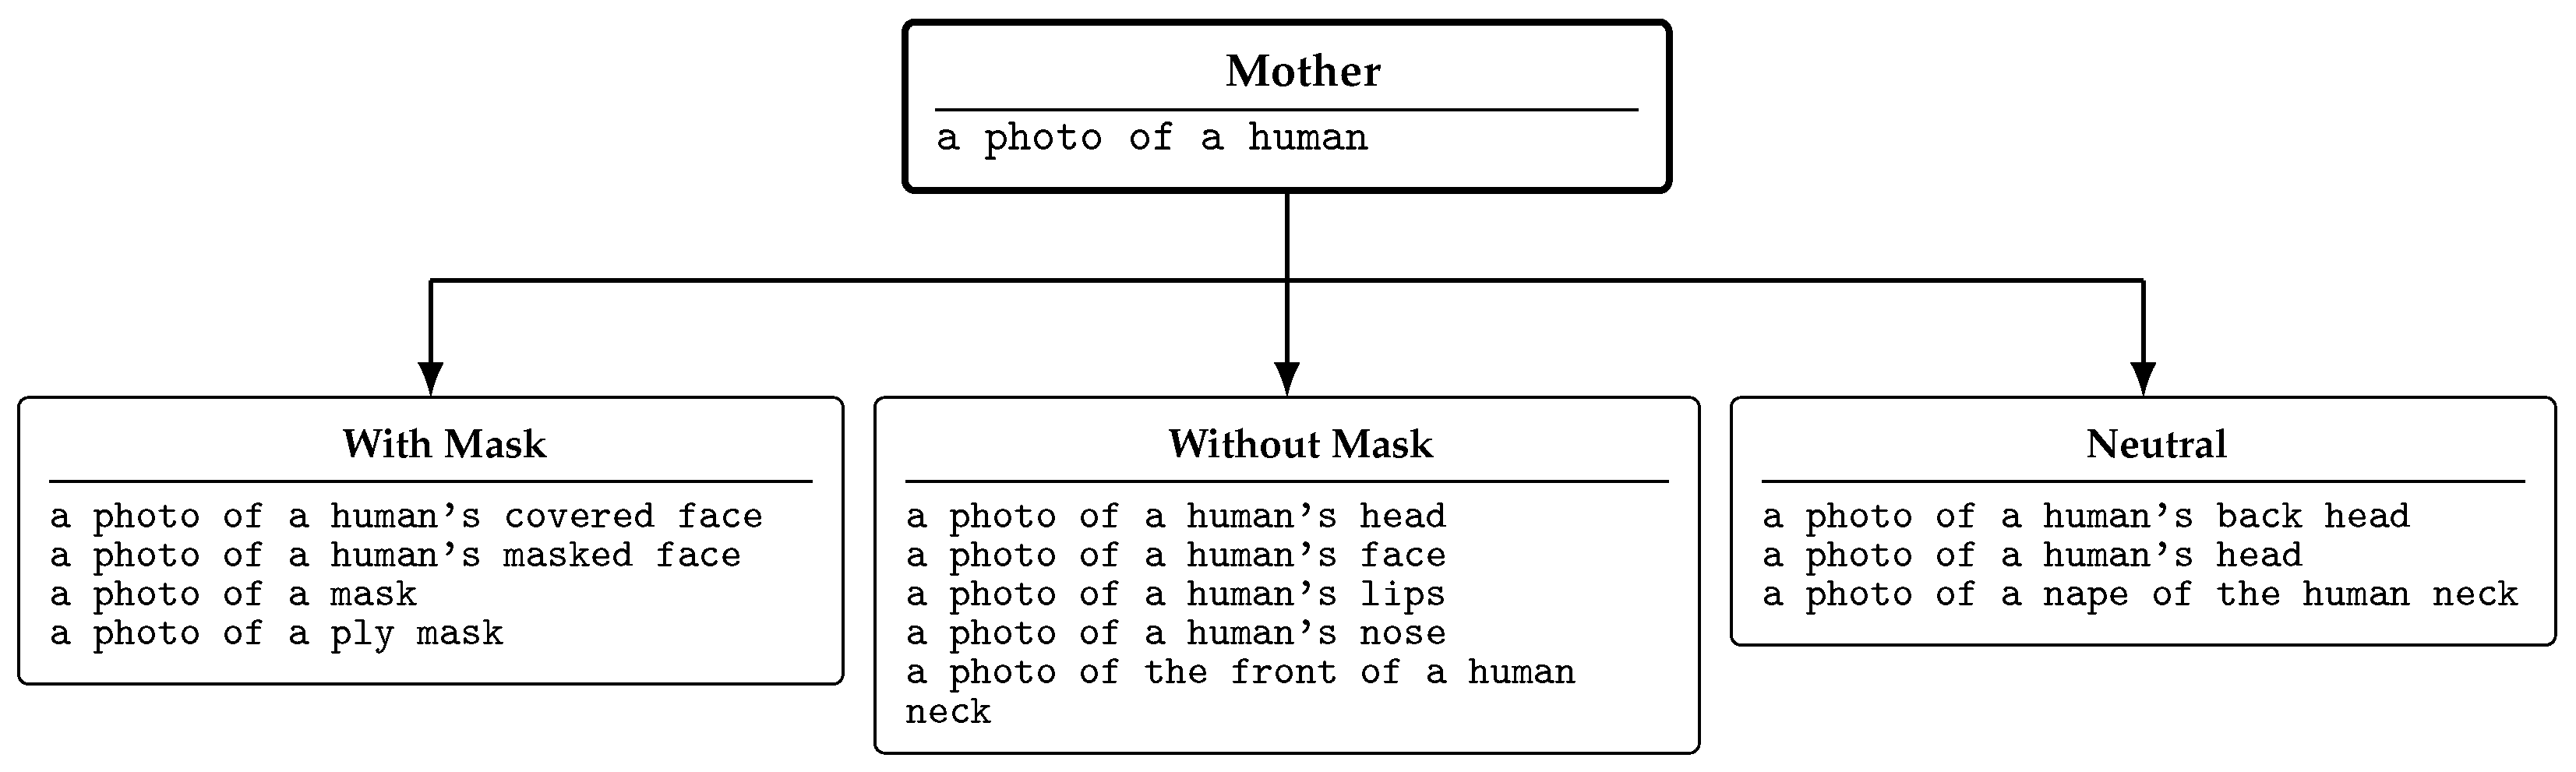
Defining effective queries is a significant challenge, as even minor wording variations can lead to substantial performance differences. For example, in the task of human face detection, queries such as “a photo of a human face” and “a photo of a face” appear nearly identical but may retrieve results with markedly different levels of accuracy and relevance. This illustrates how the precise formulation of a query directly shapes the scope and quality of the retrieved outputs. Figure 2 addresses this issue by providing queries categorized by their semantic relevance to mask-wearing status.
In the standard application of OWL-ViT to determine whether a person is wearing a mask, a single query is typically used per object. For instance, the queries “a photo of a human’s masked face” and “a photo of a human’s face” are used to identify individuals with and without masks, respectively. However, this structure often results in low accuracy. In certain instances, when a person is facing away from the camera and thus provides no visual cues about mask use, the model still incorrectly classifies the instance as class “a photo of a human’s face.” Additionally, it fails to consistently recognize a human’s masked face across different scenes.
In this regard, the present study proposes a strategy to enhance the performance of OWL-ViT in complex scenarios. This strategy is explained in Algorithms 1–3. Algorithm 1 performs the detection step. In this phase, the input image is preprocessed, and OWL-ViT is applied with both mother and target queries. The output of this algorithm consists of bounding boxes, confidence scores, and corresponding labels. Algorithm 2 groups detections into mother clusters. First, detections are filtered using Non-Maximum Suppression (NMS). Then, each target query result is assigned to the appropriate mother cluster based on the Intersection-over-Union (IoU) metric. To ensure reliability, only the highest-scoring target in each class is included in each cluster. Finally, Algorithm 3 determines the class of each mother cluster. The classification is based on the distribution of target queries within the cluster. If the cluster contains a target belonging to the set of “With Mask” queries, the class is set to “With Mask.” Otherwise, the scores of “Without Mask” and “Neutral” queries are compared, and the class is set to “Without Mask” or “Neutral” accordingly.   
Algorithm 1: Detection algorithm
Require: Image, Queries, OWL-ViT Model
Result: boxes, scores, labels
  • Preprocessing:
  • i m a g e R G B Convert image to RGB
  • q u e r i e s {mother queries, target queries}
  • Detection:
  • o u t p u t s OWL-ViT ( i m a g e R G B ,   q u e r i e s )
  • Extract b o x e s ,   s c o r e s ,   l a b e l s from o u t p u t s
  • Return boxes, scores, labels
Algorithm 2: Clustering algorithm
Mathematics 14 00647 i001
Algorithm 3: Classification algorithm
Mathematics 14 00647 i002
To rigorously define the object detection task, let I : = R 3 × H × W denote the image space. The objective is to map an input image I I and a set of text queries Q to a set of detections D . The query set is partitioned into mother queries  Q M (general object categories, e.g., “human face”) and target queries  Q T (specific attributes, e.g., “masked face”). The detection function f det : I × Q D outputs a set of detections D = { b i , s i , c i } i = 1 N , where b i R 4 denotes bounding box coordinates, s i [ 0 , 1 ] is the confidence score, and c i Q is the predicted query label. Detection confidence filtering s i τ conf with τ conf = 0.1 and IoU thresholding τ IoU = 0.5 are employed to balance recall and precision while ensuring robustness to minor localization errors.
Let D M and D T denote detections from mother and target queries, respectively. The clustering function M : D T D M assigns a target detection b t to a mother detection b m if
IoU b m , b t = | b m b t | | b m b t | τ IoU .
Assumptions include sufficient spatial overlap between queries, independence of textual prompts, and bounding box tangency to the human body. This aggregation acts as an ensemble across queries, reducing false positives and stabilizing predictions in the face of semantic ambiguity, similar to bagging in ensemble learning.
Now for each cluster, let S mask , S nomask , and S neutral denote confidence score sets for each semantic group. The final label y ^ is classified as
y ^ = With Mask , if S mask , Without Mask , if s S nomask s > s S neutral s , Neutral , otherwise .
This modular design improves flexibility—detection can be adapted to different human-related queries (e.g., “a photo of a child” or “a photo of a worker”), clustering reduces false positives by focusing only on mother queries, and classification incorporates auxiliary queries to refine mask recognition.
The proposed strategy enhances class accuracy by incorporating auxiliary queries. For example, combining “a photo of a ply mask” with “a photo of a human’s masked face” improves the accuracy of mask detection. Additionally, introducing a neutral class enables the model to distinguish more accurately without the mask class, thereby further reducing false positives. Such a strategy is also effective for identifying individuals wearing a specific type of mask (e.g., those wearing only black masks).
Clustering strategies have been widely explored in related domains, including general object detection, 3D object detection, and multi-object association, where they are primarily employed to group spatially or geometrically consistent object proposals. For example, the study in [49] proposed a size-adaptive clustering mechanism for 3D object detection in point clouds, in which clustering radii are dynamically inferred to accommodate objects with varying spatial scales. Similar clustering-based approaches have also been adopted in multi-object detection and tracking to enhance robustness against occlusion and noisy observations.
However, these methods focus on object-level grouping or geometric association during the detection stage. In contrast, the clustering strategy introduced in the present study operates at the decision level within an open-world VLM framework. Rather than generating or refining object proposals, the proposed clustering aggregates multiple query-level predictions produced by OWL-ViT and leverages their consensus to derive a stable semantic decision for mask-wearing assessment.
This design is particularly suited to open-world scenarios, where the detector may produce inconsistent or ambiguous predictions due to partial occlusion, varying viewpoints, or open-vocabulary uncertainty. By clustering semantically related detections and applying a decision rule over the resulting groups, the proposed strategy improves robustness without introducing additional training or modifying the underlying VLM.

3.2. Social Distance Estimation Module

For social distancing monitoring, two complementary monocular approaches are employed: (i) homography-based planar distance estimation and (ii) metric depth estimation. These approaches allow the use of various camera types, rather than being limited to stereo systems.
To identify social distancing violations, let P = { p k } k = 1 K be the detected individuals; then, pairwise distances d p i , p j are computed and compared against δ safe to identify violations.

3.2.1. Homography Transformation

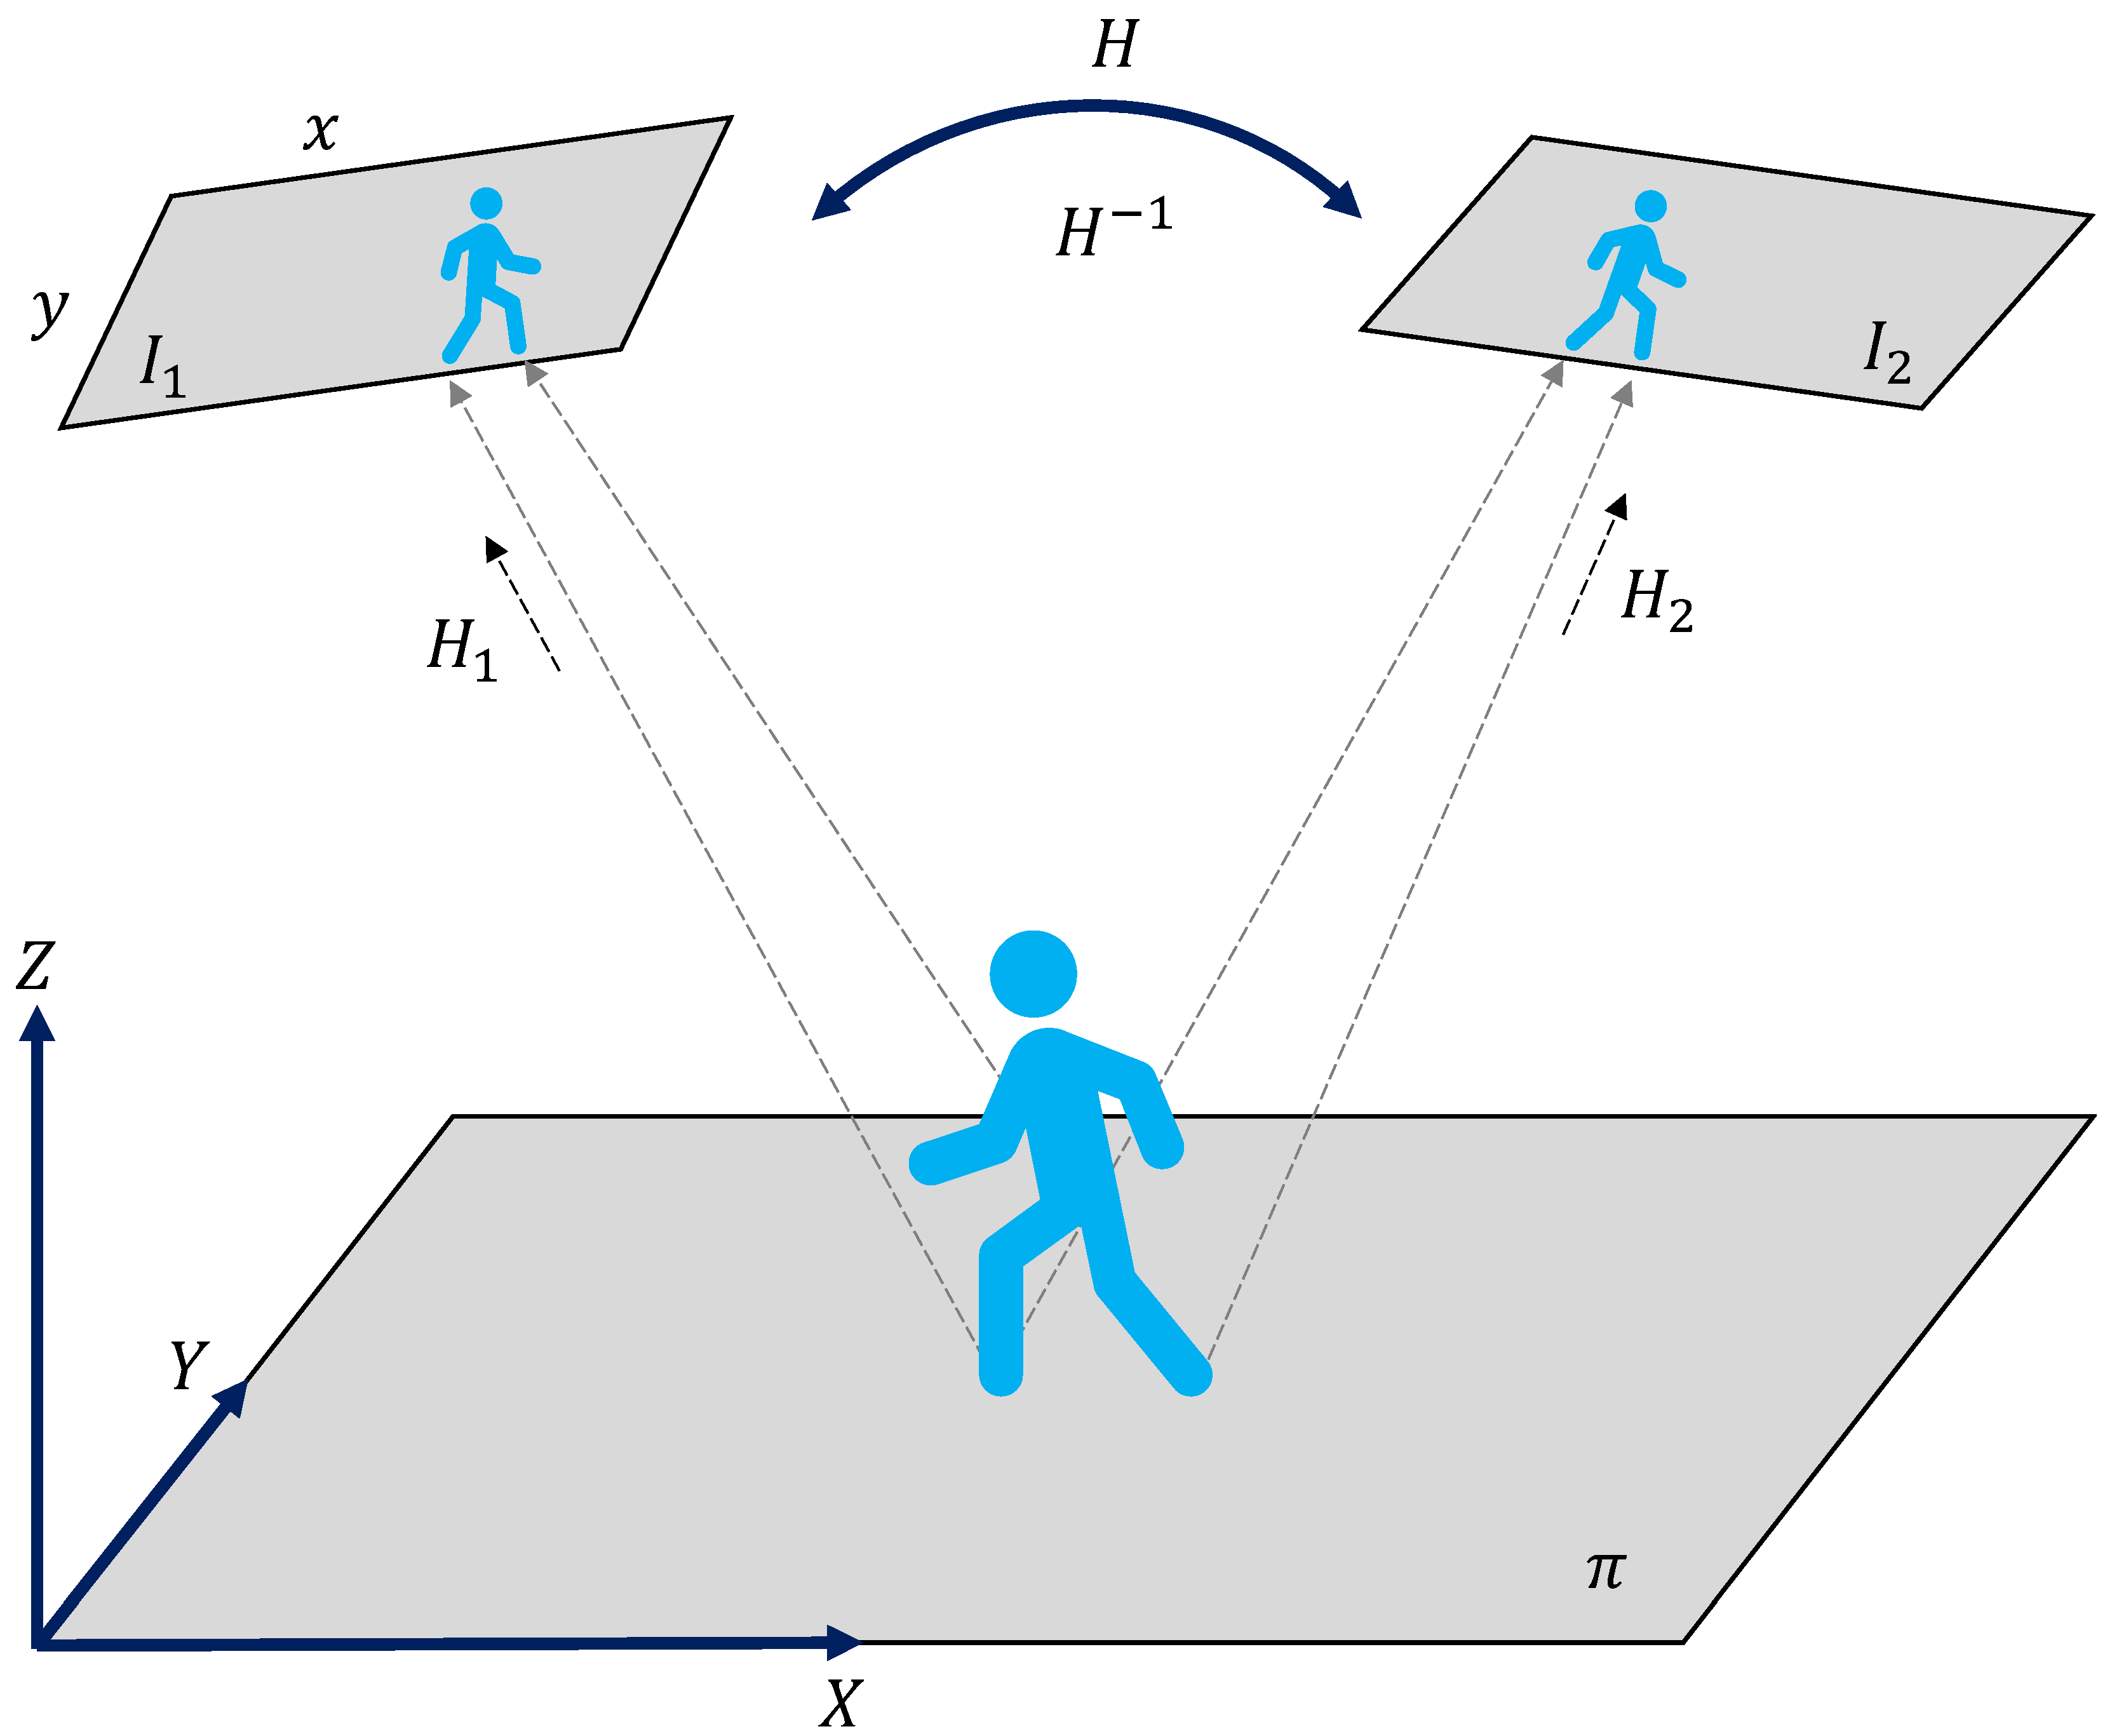
Assuming all ground contact points lie on a planar surface, the mapping between world and image coordinates is defined by a homography matrix H [50]. To clarify the workflow, consider Figure 3, which illustrates the homography setup. In this approach, each person’s ground contact point (typically the bottom-center of the bounding box) is projected onto the ground plane π to compute real-world coordinates.
In the experiments, small 1 m-by-1 m ground markers are placed primarily for scale calibration, enabling accurate computation of distances in meters. These markers are used only during the calibration stage to determine the scale factor between image-space and world-space coordinates. Once calibrated, the homography transformation can estimate distances between individuals without requiring additional markers for each scene.
Formally, the homography matrix H transforms image coordinates x y 1 T to real-world coordinates X Y 1 T on the planar ground, while its inverse H 1 allows mapping from world coordinates back to the image plane. The system can accommodate multiple cameras by computing separate homography matrices H i for each view, ensuring consistent distance estimation across different perspectives. This geometric approach leverages explicit scale information and, therefore, typically outperforms learning-based methods that infer distances implicitly. Finally, the homography transformation is written as
s x y 1 T = H X Y 1 T ,
where s denotes the scale factor arising from the projective nature of the transformation.
The homography matrix H is estimated using at least four point correspondences via the Direct Linear Transformation (DLT) algorithm, solved by singular value decomposition for numerical stability. Assumptions include planar ground geometry ( Z = 0 ), static camera pose, and known metric scale obtained through calibration (e.g., a chessboard).
Let u i = u i , x u i , y 1 T denote the bottom-center contact point of the i-th bounding box. The corresponding world coordinate is recovered as X i = H 1 u i / H 1 u i 3 . The distance between individuals is then d X i , X j = X i X j 2 .
Considering pixel noise Δ u N 0 , σ u 2 , the propagated position uncertainty satisfies Var Δ X H 1 T Σ u H 1 , yielding bounded distance errors (typically ± 0.1 m under calibration), thereby ensuring reliable violation detection.

3.2.2. Metric Depth Estimation

This method first locates the center of each detected bounding box. Let x 1 , y 1 and x 2 , y 2 denote the pixel coordinates of the top-left and bottom-right corners of the bounding box enclosing the detected person. The center of the bounding box, with pixel coordinates u c , x , u c , y , is then computed as
u c , x = x 1 + x 2 2 , u c , y = y 1 + y 2 2 .
Using this center point, the depth value is extracted from a predicted depth map as
Z = D u c , x , u c , y ,
where D u c , x , u c , y denotes the depth value, expressed in meters, at the pixel coordinates u c , x , u c , y , and Z denotes the estimated distance from the camera to the detected person.
The transformation from 2D pixel coordinates to 3D real-world coordinates is then carried out using the intrinsic parameters of the camera, represented by the matrix K as
K = f x 0 c x 0 f y c y 0 0 1 ,
where f x , f y denote the focal lengths, in pixels, along the horizontal and vertical axes, and c x , c y denote the pixel coordinates of the principal point, typically located near the image center.
The pinhole camera model [50] defines the projection from 3D coordinates X , Y , Z in the camera coordinate system to 2D image coordinates u c , x , u c , y as
u c , x = f x · X Z + c x , u c , y = f y · Y Z + c y .
By rearranging this relationship, the 3D point in the camera coordinate system can be expressed as
X Y Z T = u c , x c x Z f x u c , y c y Z f y Z T ,
where X , Y , Z denotes the reconstructed 3D coordinates of the point in the camera frame (i.e., the person in the real world), u c , x , u c , y specifies the image location of the point (i.e., the bounding box center), and f x , f y , c x , c y are the intrinsic parameters extracted from the camera calibration matrix K. The pinhole camera model treats image formation as the projection of 3D points onto a 2D image plane through an infinitesimal aperture, thereby neglecting optical effects such as lens distortion [51].
Next, the Depth Pro model [32], a Transformer-based monocular depth estimation, is applied to estimate the Z-coordinate. This model estimates canonical inverse depth, which is subsequently scaled by the horizontal focal length and image width to derive metric distances without requiring explicit camera intrinsic parameters.
Finally, the distance between two individuals is computed as the Euclidean distance between their reconstructed 3D coordinates, consistent with methodologies employed in prior studies.

4. Experimental Results

This section presents an experimental evaluation of the proposed methods for mask-wearing detection and social distance estimation. The datasets and experimental setup used for training, validation, and test-time inference are described. The evaluation metrics are then introduced, followed by a detailed comparison of the performance of the object detection and social distance estimation modules under real-world conditions. Supplementary Videos accompanying the results are available online at the following link: https://drive.google.com/drive/folders/1-HAUO15P6_e38_6HZSAq-bl-9mE4Nzzh?usp=sharing (accessed on 5 October 2025).

4.1. Setup

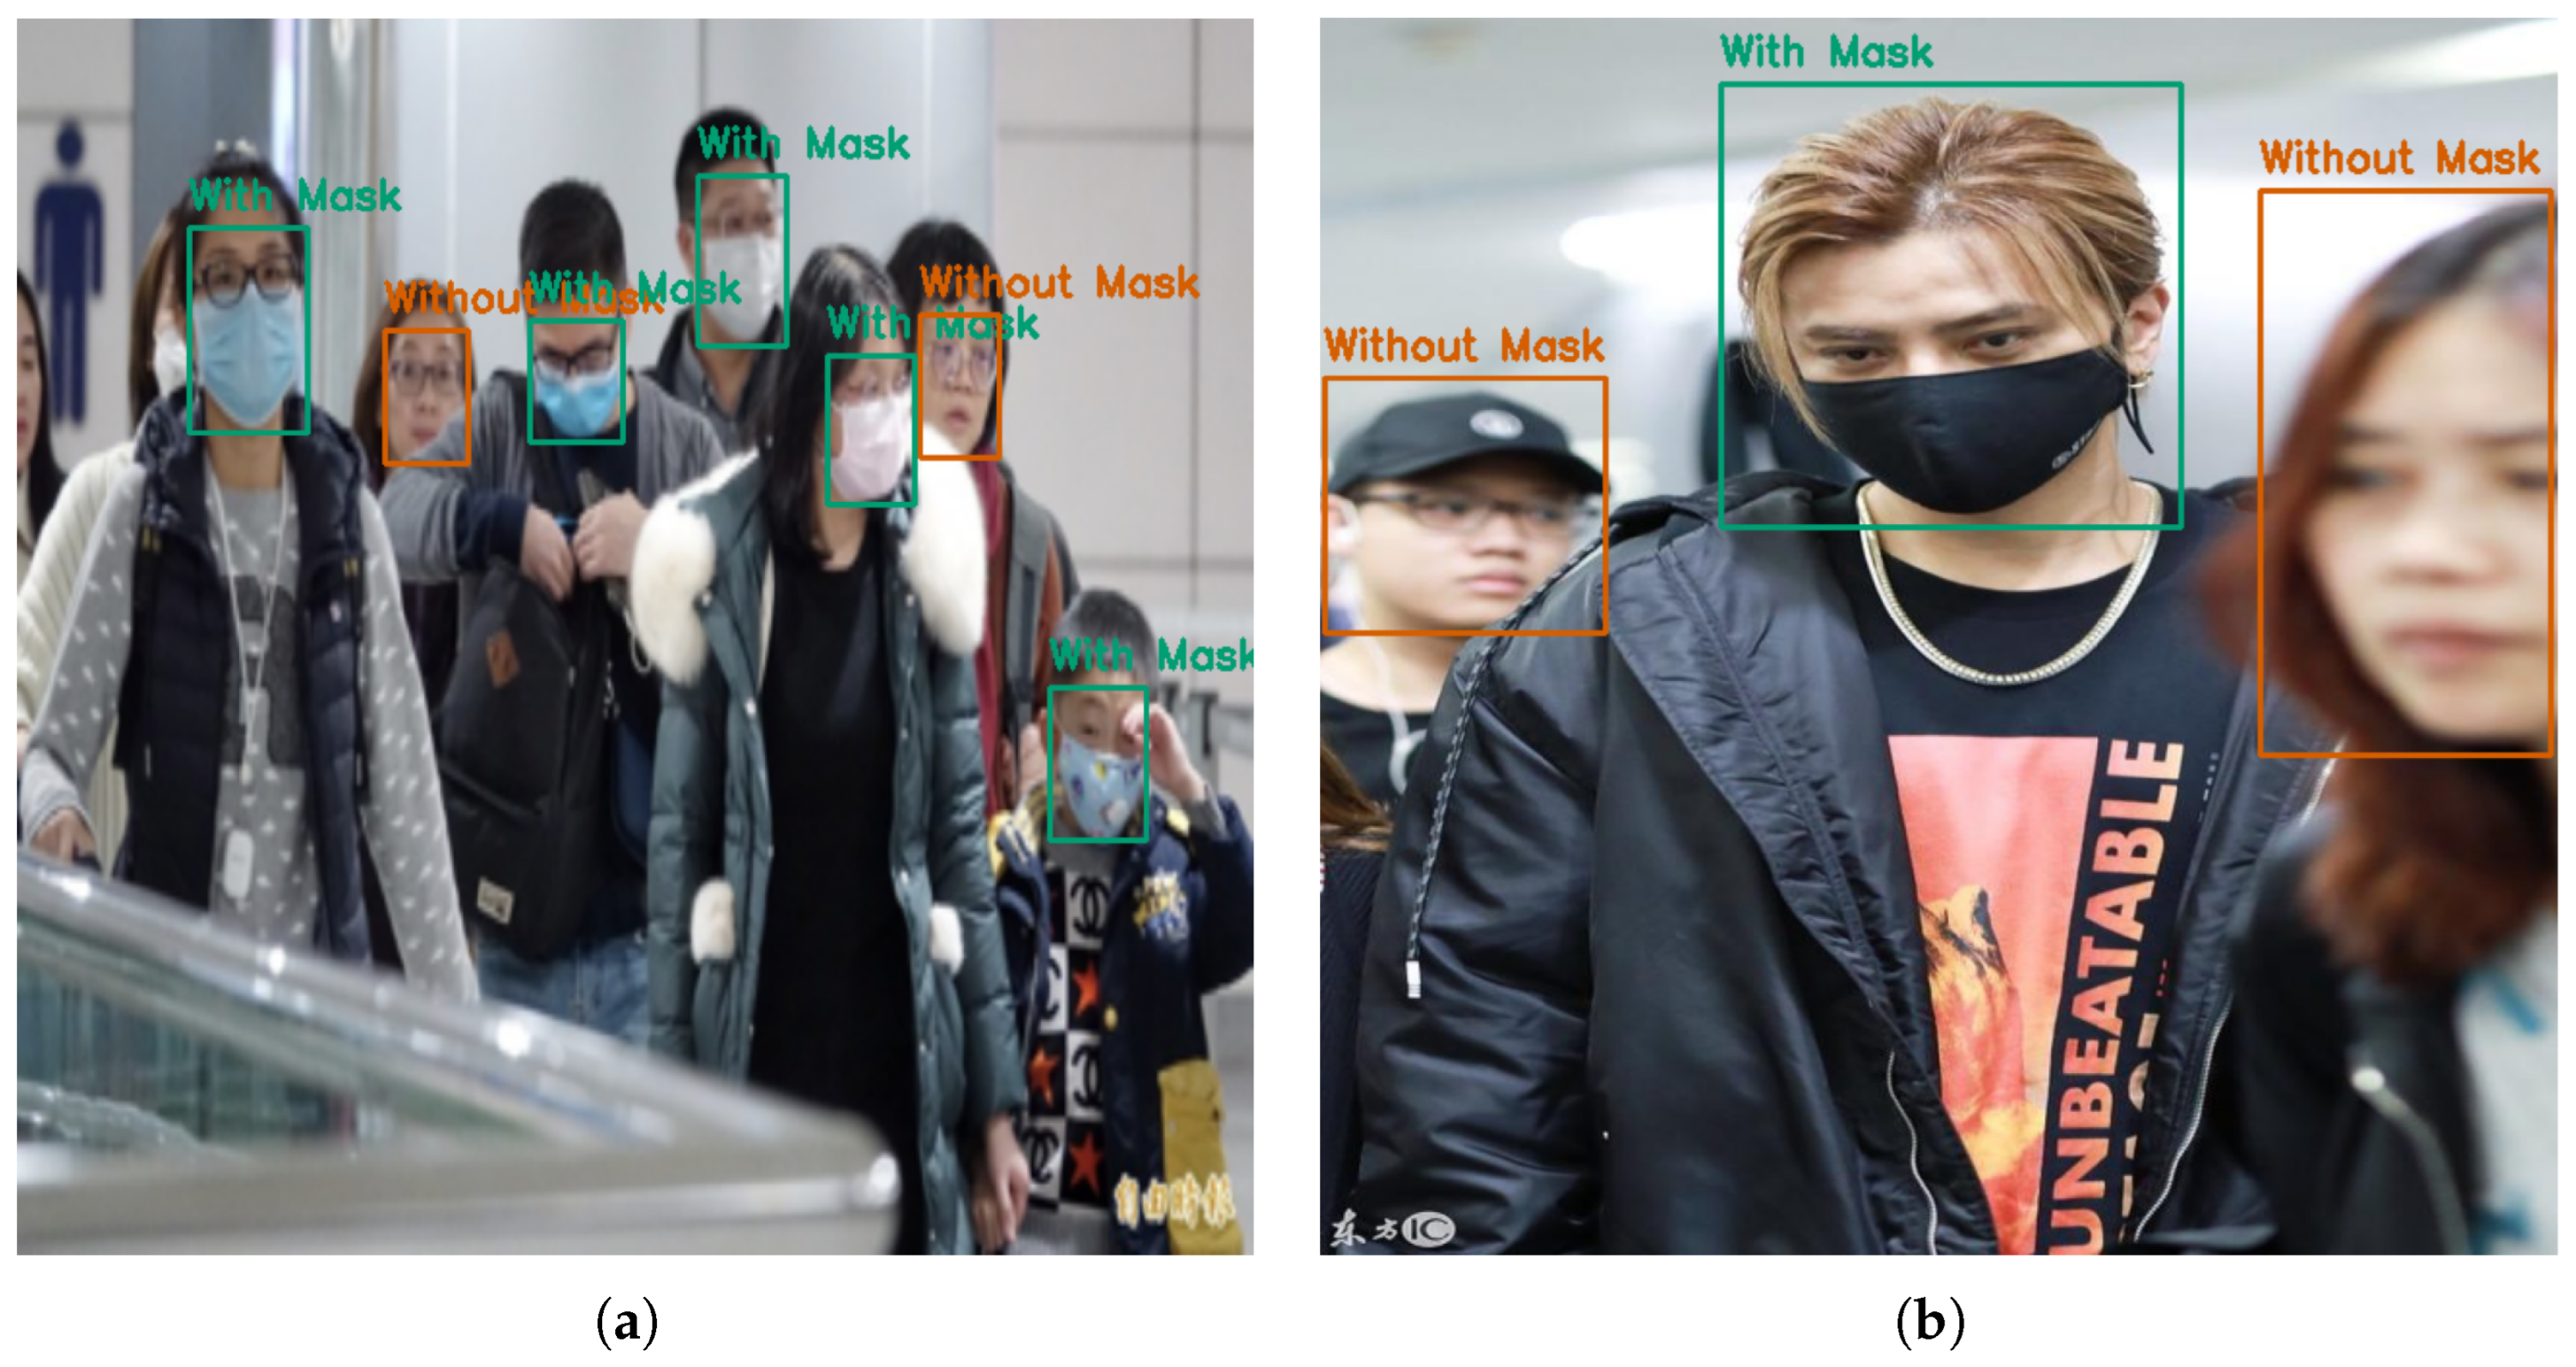
Training and Validation Datasets: This study utilizes two publicly accessible datasets sourced from Kaggle [38] and Roboflow [52]. Table 2 presents a detailed description of these datasets, and Figure 4 illustrates representative samples from them. Moreover, because this study collects its own dataset for test-time inference, the Kaggle and Roboflow datasets are exclusively utilized for training and validation.
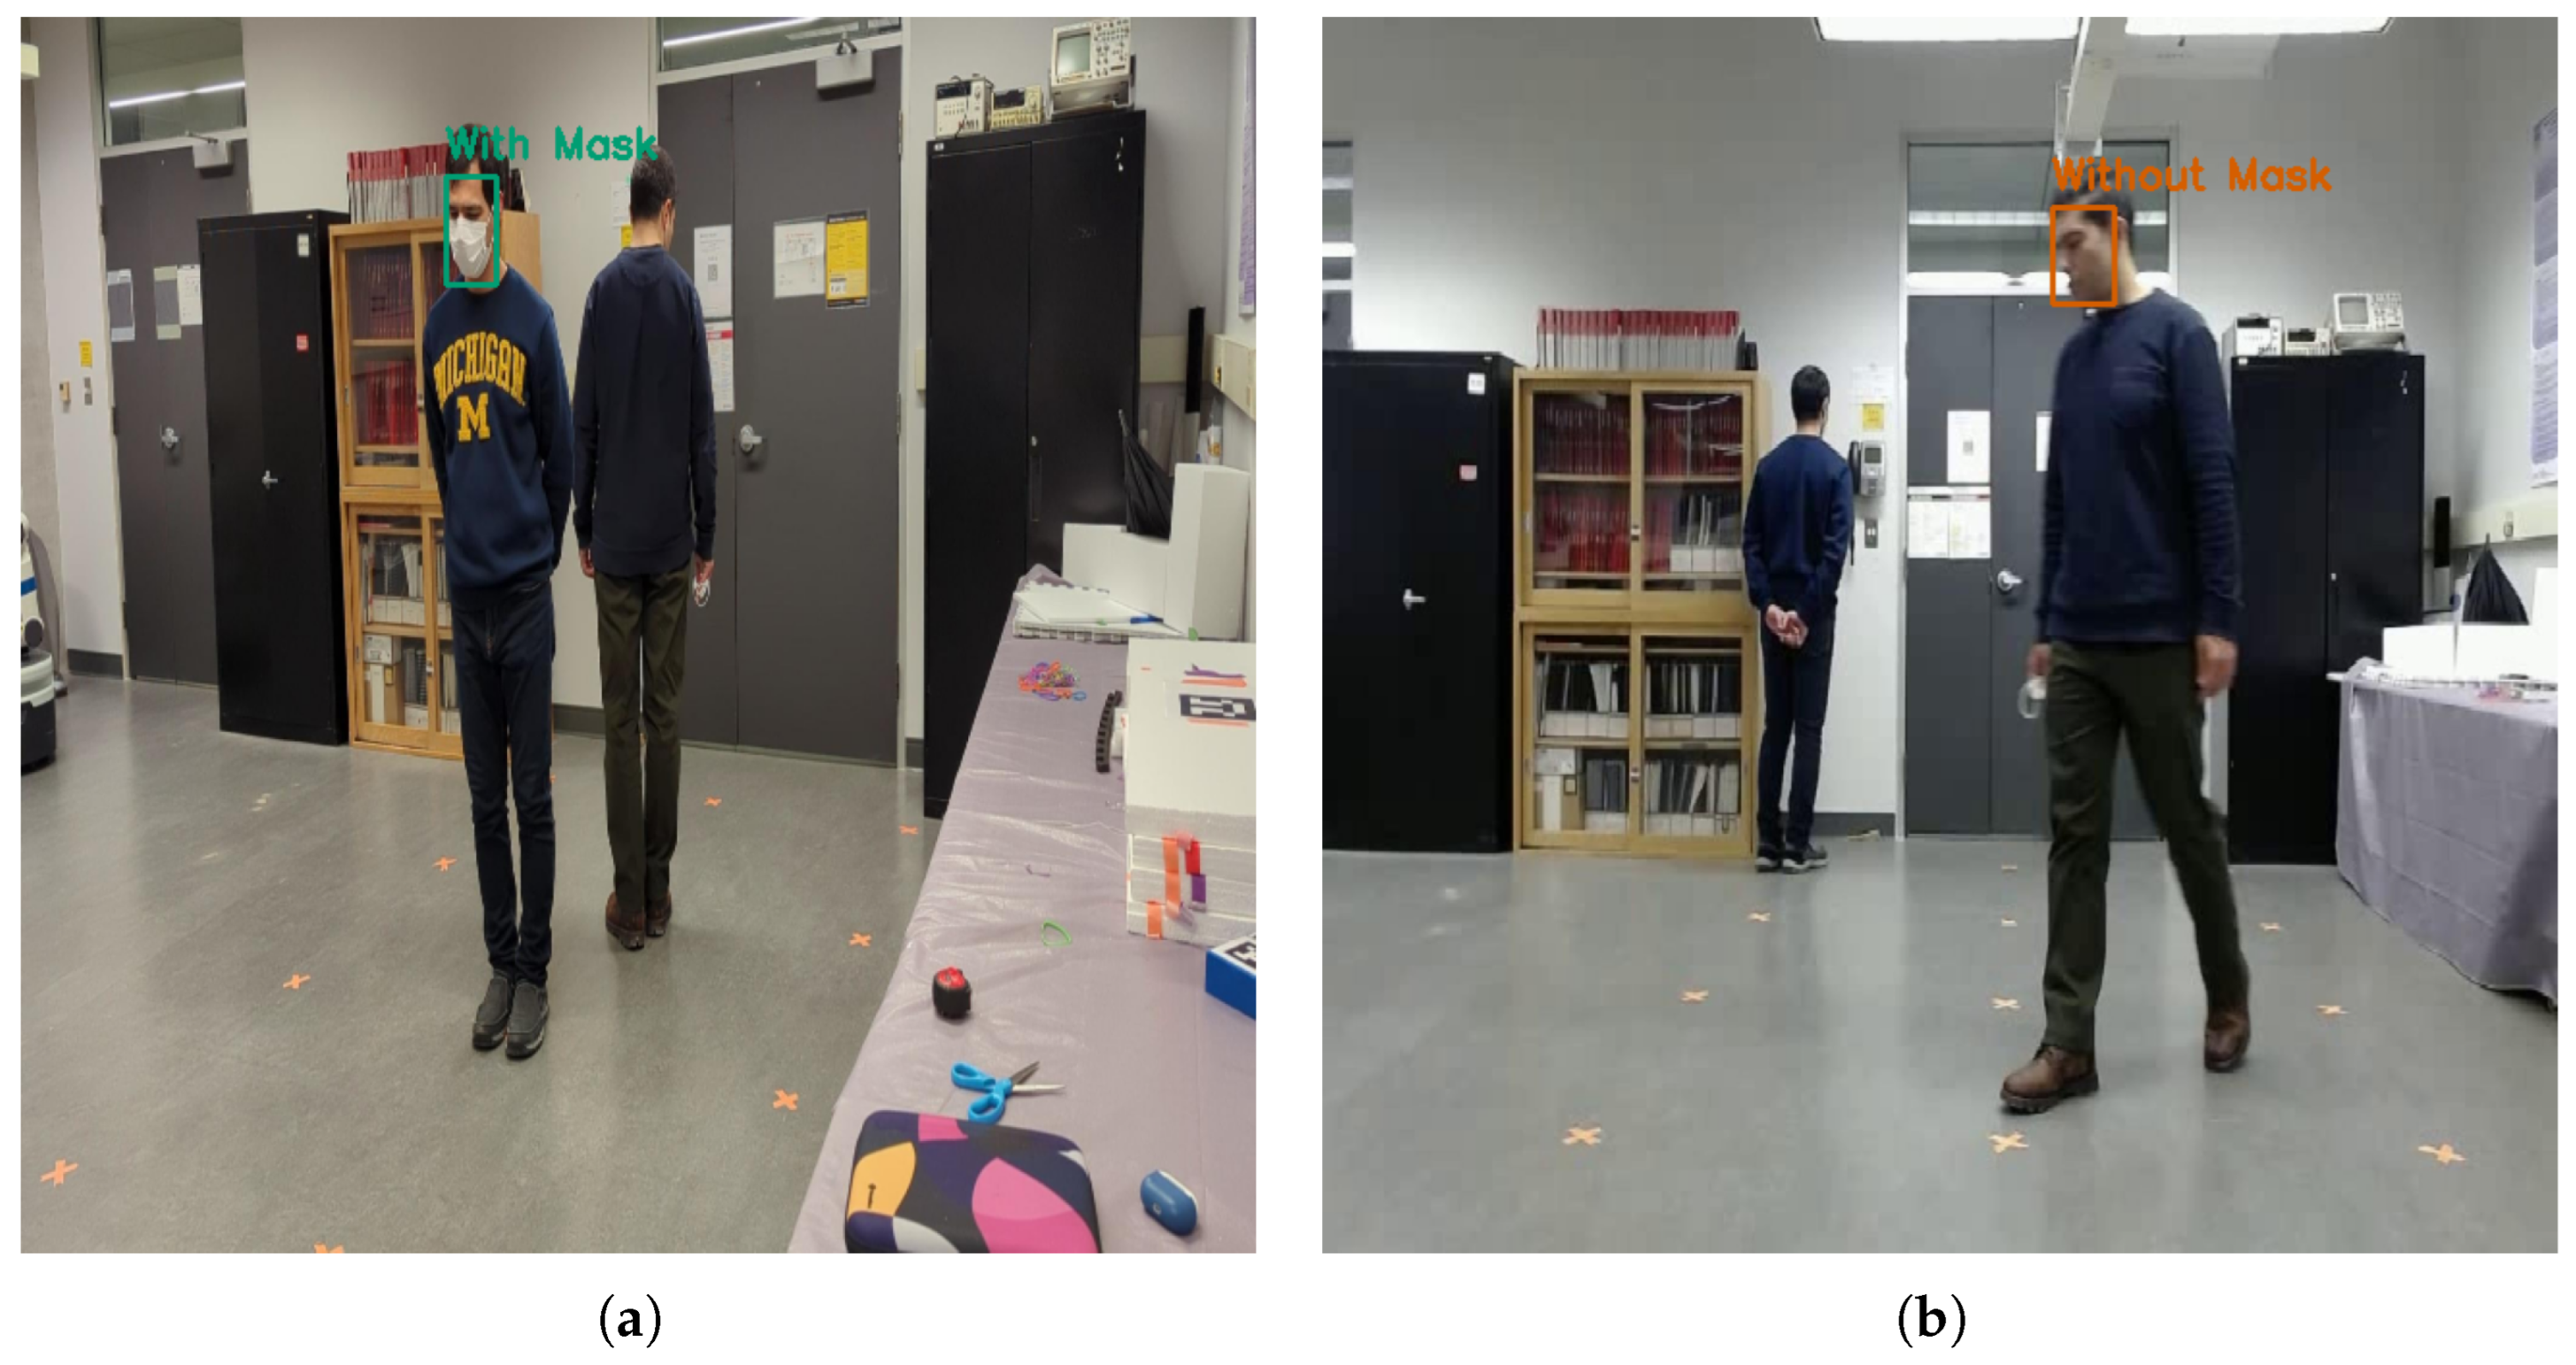
Test-Time Inference Dataset: This experiment was conducted at the University of Waterloo. The data was collected using a Google Pixel 7 Smartphone and a Logitech HD Webcam C615. During data collection, two subjects represented individuals moving at different distances and exhibiting various facial orientations, either wearing masks or remaining unmasked. Figure 5 illustrates an overview of the experimental setup used for data collection in the laboratory environment, and Figure 6 provides representative sample frames of the collected experimental dataset. Table 3 presents a detailed description of the collected dataset.

4.2. Evaluation Metrics

This study utilizes precision, recall, F1-score, and Average Precision (AP) as evaluation metrics for object detection models. To establish a foundation for these metrics, it is necessary first to reiterate the concepts of True Positives (TP), False Positives (FP), and False Negatives (FN).
TP is a correct detection (or prediction of the class label) where the predicted box matches a ground-truth object with an IoU above a specified threshold (e.g., IoU 0.5 ). FP is an incorrect detection where the predicted box has low IoU with any ground-truth object (e.g., IoU < 0.5 ), the class label is wrong, or the object does not exist. Lastly, FN is a misdetection where a ground-truth object is present, but no box with sufficient IoU is predicted. Next, precision, recall, and F1-score metrics are shown as
P = TP TP + FP , R = TP TP + FN , F 1 score = 2 · P · R P + R .
IoU threshold selection is inherently task-dependent. In this study, because a pre-trained OWL-ViT model is used, which was originally trained on datasets with annotation standards different from those in the present study, a lower threshold of 0.2 is adopted. This choice provides a more lenient localization criterion, better accommodating the annotation discrepancies.
Furthermore, AP and mean AP (mAP) are the primary evaluation metrics for object detection models. The former measures precision averaged across different recall levels and is computed per class, reflecting the detection performance for that class; the latter is the mean AP across all classes and serves as the standard metric for assessing overall performance on multi-class datasets.
For the social distance estimation methods, the evaluation metrics include Mean Absolute Error (MAE), Mean Squared Error (MSE), and Root Mean Square Error (RMSE).

4.3. Object Detection Module

Table 4 compares the performance of CB-OWL-ViT and OWL-ViT on different datasets. The CB-OWL-ViT model employs the queries described in Figure 2 and the strategy explained in Algorithms 1–3, whereas OWL-ViT uses only two queries: (i) “a photo of a human’s face” for the “Without Mask” class (i.e., class 0) and (ii) “a photo of a human’s masked face” for the “With Mask” class (i.e., class 1). These queries are selected by trial and error.
As shown in the Table 4, the CB-OWL-ViT model significantly outperforms the standard OWL-ViT across the Kaggle, Roboflow, Smartphone, and Webcam datasets, primarily due to its multi-query mechanism that conditions class predictions on multiple facial patterns (e.g., nose, chin). This approach mitigates the bias of the standard OWL-ViT, which often misclassifies class 0 based on minimal facial cues, leading to high FP rates.
The cluster-based method increases precision by 0.26, 0.37, 0.18, and 0.08 in the Kaggle, Roboflow, Smartphone, and Webcam datasets, respectively. Despite decreases of approximately 0.11 in the Kaggle dataset and 0.04 in the RoboFlow dataset, recall improved by 0.11 and 0.16 in the Smartphone and Webcam datasets, respectively. Overall, the CB-OWL-ViT shows significant improvement, achieving an average F1-score increase of around 0.2 across all datasets and consistent gains in mAP@0.20, underscoring its superior performance.

4.4. Social Distance Estimation Module

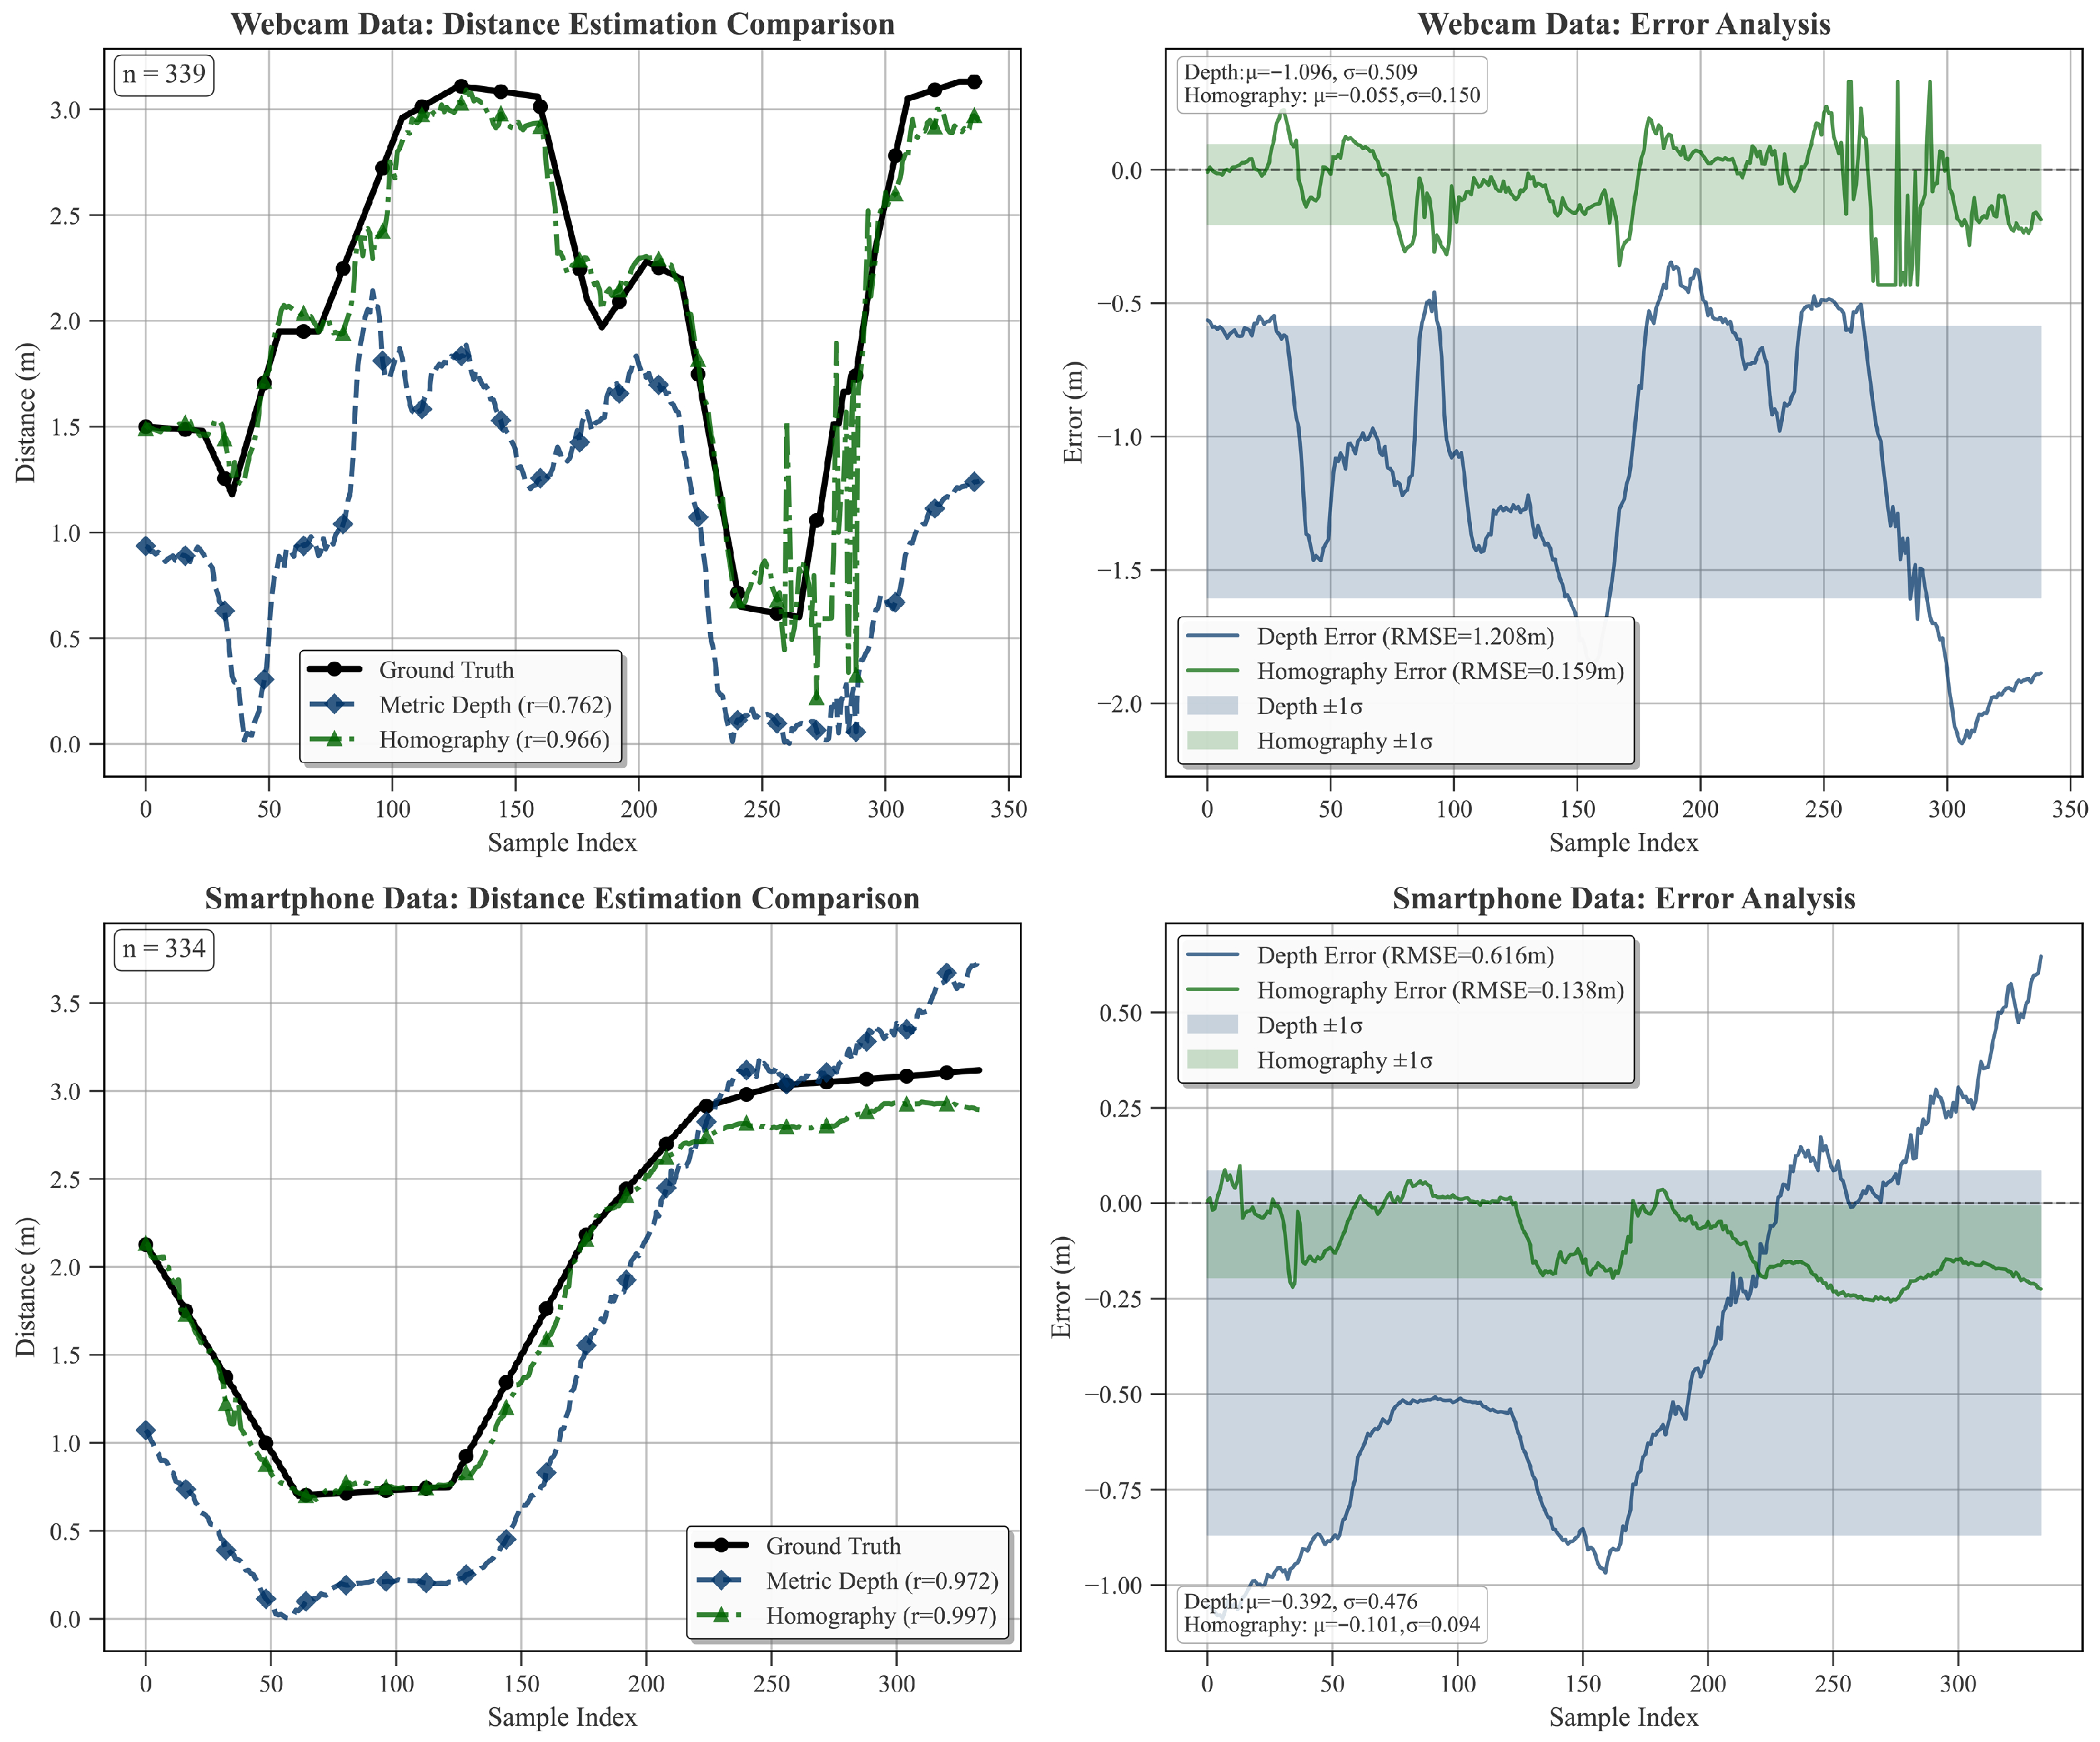
The performance of the proposed social distance estimation methods using real-world test data is shown in Figure 7. The metric depth estimation method (blue line) exhibits greater variability and larger deviations from the ground truth (black line) than the homography transformation method (green line), which closely follows the ground truth across both data sources. The corresponding error plots further highlight these differences, showing that the homography transformation method consistently yields lower errors, particularly for the smartphone data, indicating its robustness across diverse data sources for social distance estimation.
Additionally, quantitative analysis of the errors in social distance estimation is presented in Table 5. In both data sources, the homography transformation method outperforms other methods across all measures, underscoring its ability to estimate social distance. It is noteworthy that this method has a very low computational cost and can be implemented with any type of camera. Consequently, this strategy facilitates the large-scale deployment of social distance estimation models by minimizing costs and overhead while maintaining compatibility with a wide range of cameras.

5. Evaluation and Discussion

5.1. Comparative Analysis with Other Object Detection Models

This subsection presents a comprehensive comparison between the proposed framework and the recent SOTA object detection models, such as the latest variants of YOLO, which, to the best of the authors’ knowledge, have not been previously employed for face mask detection.
Table 6, Table 7, Table 8 and Table 9 report the performance comparison of multiple models trained on the Kaggle, Roboflow, Smartphone, and Webcam datasets, respectively, against the proposed CB-OWL-ViT model. Since these models were trained directly on the datasets mentioned earlier, they perform better on this dataset than the proposed CB-OWL-ViT model. Among the evaluated models, YOLOv12l achieves the highest precision of 0.92. RT-DETRl attains the best recall with a value of 0.90, whereas YOLOv10l demonstrates the most balanced trade-off between precision and recall, yielding an F1-score of 0.89. On the Roboflow dataset, both YOLOv12l and RT-DETRl achieve the highest precision, each reaching 0.88. In contrast, the proposed CB-OWL-ViT model achieves a significantly higher recall of 0.81 for class 0, highlighting its superior ability to detect non-compliant behavior during pandemic conditions, successfully identifying 81% of such cases. In terms of F1-score, YOLOv12m achieves the best overall performance with a score of 0.85.
It is worth noting that certain images from the Kaggle dataset are also present in the Roboflow dataset. As a result, since the models were trained on the Kaggle dataset, their evaluation across both datasets may not constitute a fully unbiased comparison. On the smartphone dataset, the proposed CB-OWL-ViT model achieves perfect precision of 1.00 for class 1. Nevertheless, when considering all classes, YOLOv10l attains the highest overall precision of 0.99 and an F1-score of 0.97. The proposed model remained competitive, obtaining an F1-score of 0.91. On the Webcam dataset, YOLOv10l delivers the strongest performance across precision (0.99), recall (0.91), and F1-score (0.94). However, for class 0 specifically, the proposed CB-OWL-ViT model achieves the highest recall of 0.98, underscoring its effectiveness in detecting high-risk cases. Overall, across the various datasets, YOLOv10l demonstrates the most consistent generalization among models trained on predefined classes. In contrast, the CB-OWL-ViT model specifically excelled over all other models in detecting class 0.

5.2. Comparative Analysis with Other SOTA Models

Table 10 compares the performance of the proposed model with SOTA models reported in previous studies on mask detection. The proposed model consistently achieves the highest recall for class 0 across all datasets and models. While the method presented in [34] demonstrates strong performance on the Kaggle and Roboflow datasets, its performance declines significantly on the Webcam dataset, suggesting that it has limited robustness. The model introduced in [8] achieves performance comparable to that of the proposed method and, in some cases, slightly surpasses it; however, it is restricted to predicting only predefined classes and requires retraining for new tasks.
Table 11 compares the methods proposed in the current study along with the approach presented in [33]. As shown, the methods introduced in this study outperform the baseline across all three evaluation metrics: MAE, MSE, and RMSE.

5.3. Practical Deployment Analysis and Model Validation

While the proposed framework demonstrates strong performance in controlled experimental settings, its practical applicability and reliability in real-world monitoring scenarios require further clarification and validation. Therefore, this subsection evaluates the computational efficiency and inference speed of the model, discusses its operational characteristics in terms of frame-by-frame processing versus temporal consistency, and clarifies the scope of real-time applicability. In addition, to strengthen the empirical validity of the proposed approach, a comparative evaluation against a representative VLM-based detector, namely YOLO-World, is conducted, and a series of ablation studies investigating the contributions of key architectural and training components are presented. Together, these analyses aim to offer deeper insights into both the practical feasibility and the underlying effectiveness of the proposed model.

5.3.1. Inference Speed and Computational Cost

To evaluate the practical feasibility of the proposed framework, computational efficiency in terms of inference speed, model size, and number of parameters is analyzed and compared with representative CNN-based and lightweight object detection models. This analysis aims to clarify the deployment characteristics of the proposed approach and address concerns regarding its real-world applicability.
All inference-time measurements reported here are conducted on an NVIDIA Tesla T4 GPU with a batch size of 1. This hardware configuration reflects a realistic deployment scenario for modern intelligent monitoring systems, where entry-level GPUs are commonly available to support computationally demanding vision models. CPU-only inference is not considered in this evaluation, as Transformer-based architectures and VLMs typically incur significantly higher latency without GPU acceleration.
As shown in Table 12, lightweight CNN-based detectors such as YOLOv8n achieve lower inference latency due to their compact architectures and task-specific supervision. In contrast, the proposed cluster-based OWL-ViT model has higher inference latency, primarily due to its Transformer backbone and the integration of language supervision for open-vocabulary reasoning. This increased computational cost reflects a deliberate design trade-off rather than a limitation of the proposed framework.
Unlike conventional object detection models that rely on fixed class definitions and require retraining or fine-tuning to adapt to new tasks, the proposed approach leverages language supervision to enable training-free adaptation to novel object categories and monitoring scenarios. This flexibility is particularly valuable in real-world monitoring applications, where operational requirements may evolve over time and pre-defined label sets are often insufficient. Consequently, the proposed framework prioritizes adaptability, semantic richness, and deployment flexibility over raw inference speed.
It is important to emphasize that strict real-time performance on resource-constrained or mobile devices is not the primary focus of this study. Instead, the proposed model is designed for GPU-equipped monitoring environments, where robustness, generalization, and semantic adaptability are more important than minimal latency. Under this setting, the reported inference time demonstrates that the proposed framework remains practically deployable for near-real-time or offline analysis pipelines.

5.3.2. Comparison with VLM-Based Detector (YOLO-World)

Table 13 summarizes the evaluation results for CB-OWL-ViT, OWL-ViT, and YOLO-World across four datasets. It can be observed that CB-OWL-ViT consistently achieves the highest performance across mAP, precision, recall, and F1-score, demonstrating the effectiveness of combining open-world vision-language detection with class-balanced training. OWL-ViT generally performs slightly lower than CB-OWL-ViT, with reductions in F1-score and mAP of up to 15% on some datasets. YOLO-World consistently underperforms OWL-ViT by approximately 10–15% across most metrics and datasets, indicating that while YOLO-World remains competitive, it does not exploit the open-world vision-language capabilities as effectively. Overall, the table shows that CB-OWL-ViT delivers the most robust performance, followed by OWL-ViT, while YOLO-World achieves the weakest, yet still reasonable, performance.

5.4. Discussion

The principal strength of the proposed model lies in its flexibility, which enables adaptation to new conditions without necessitating retraining on a different dataset. Moreover, the model achieves satisfactory performance in social distancing monitoring without dependence on stereo cameras. Nonetheless, the primary limitation of this flexible approach is its lower accuracy relative to unimodal, single-stage models, such as YOLO, when trained on rich, task-specific datasets.
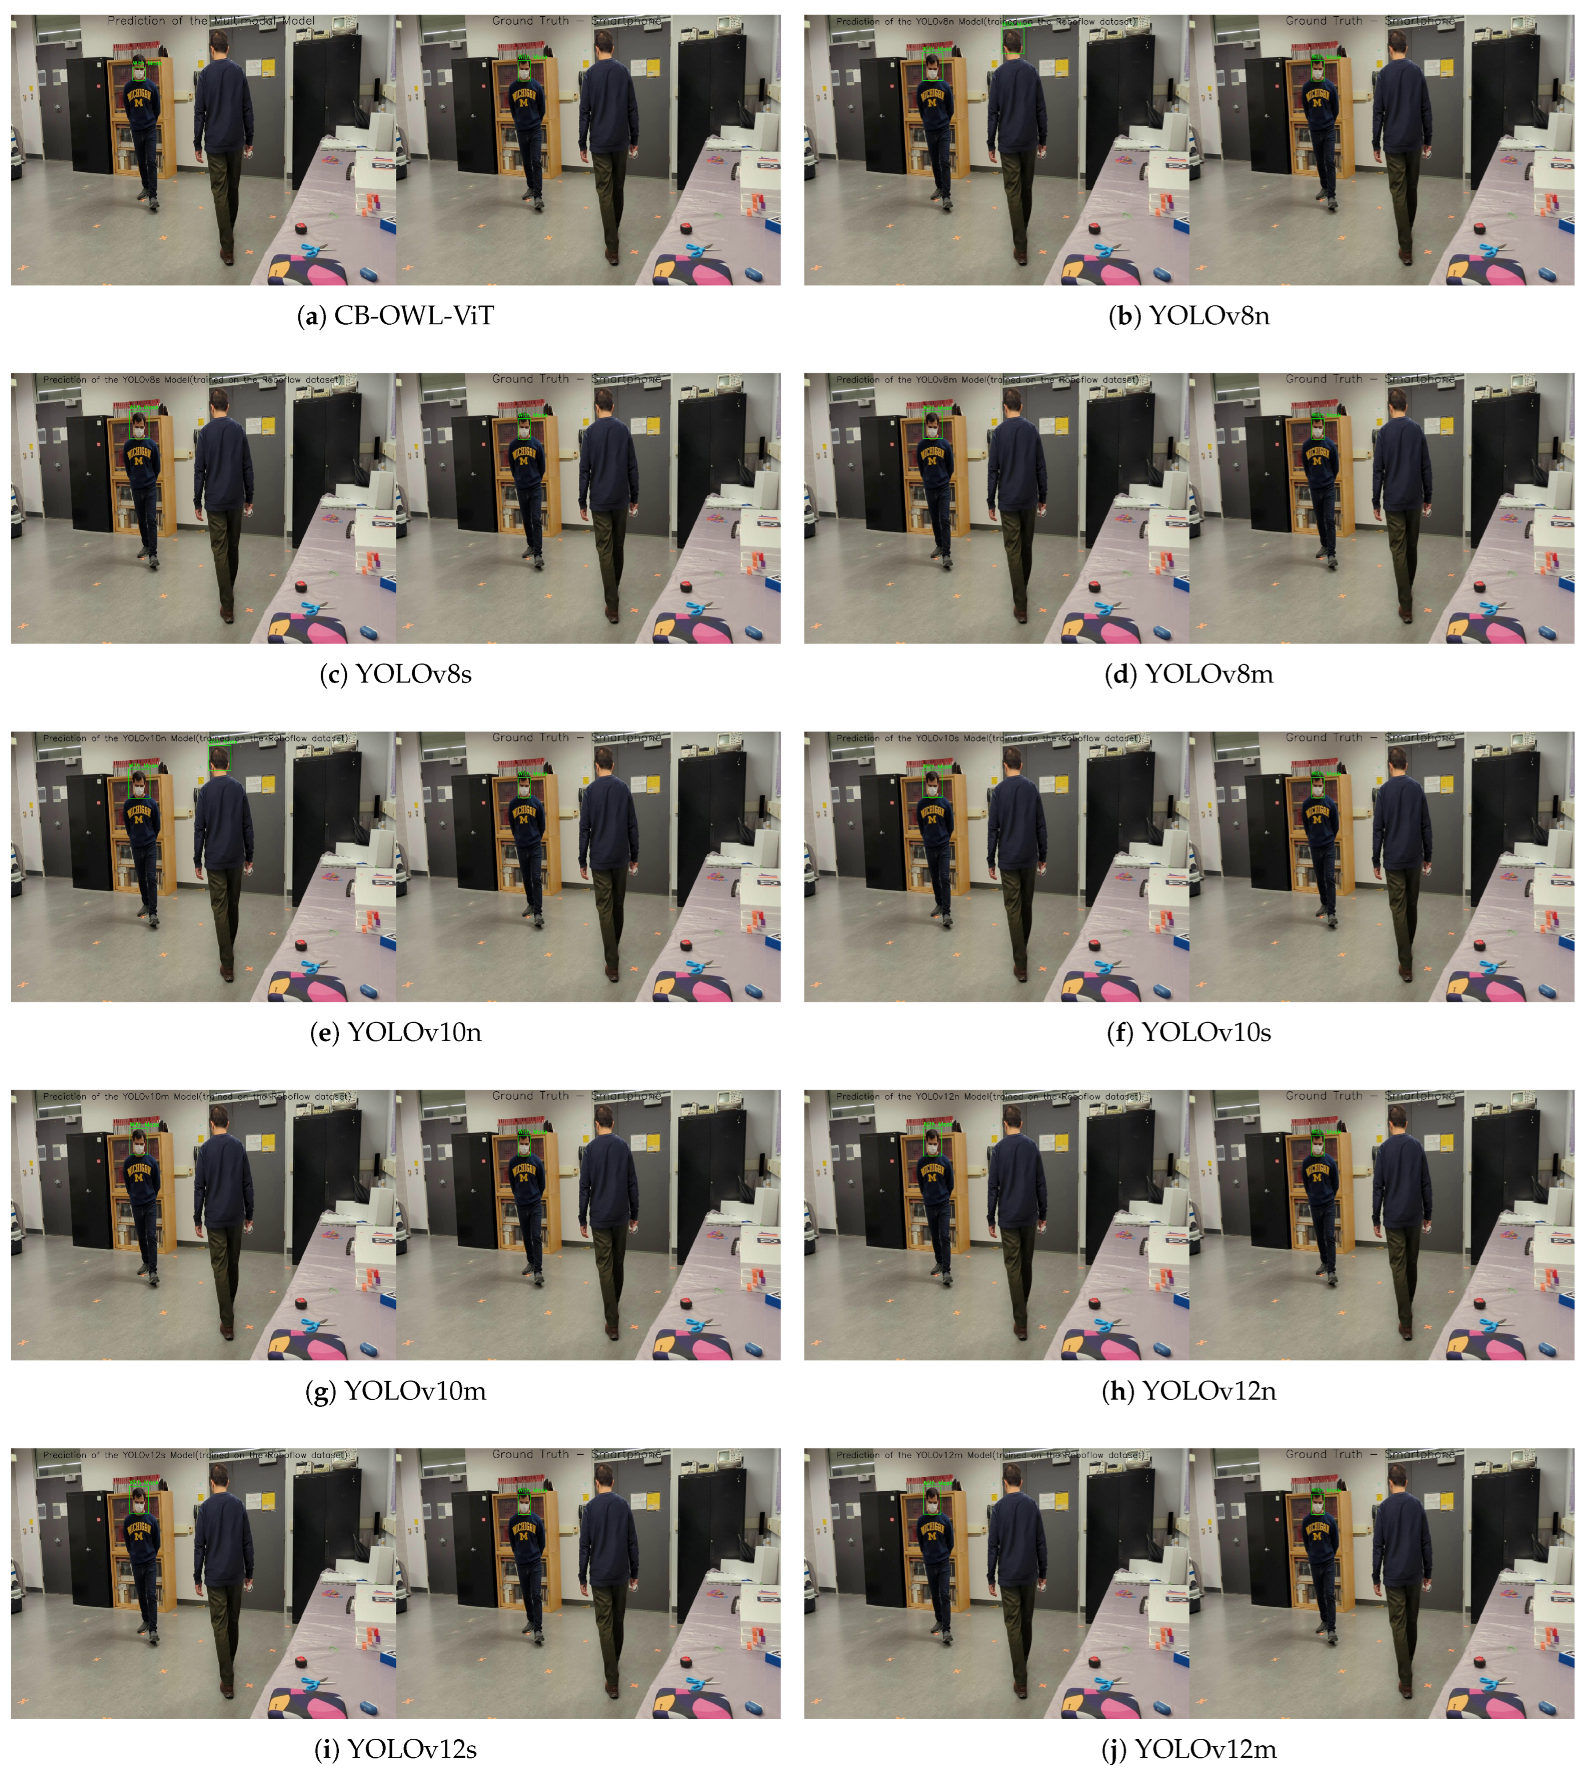
A comprehensive visual presentation of the detection results is provided in Appendix A and Appendix B.

6. Conclusions and Future Directions

This study presented a multimodal framework for monitoring compliance with contagious disease control measures, addressing the need for adaptable and cost-effective public health surveillance. The proposed CB-OWL-ViT model enhanced mask detection by enabling recognition beyond predefined classes, while the homography-based module enabled reliable social distance estimation with low-cost monocular cameras. The newly collected dataset enabled robust validation, and comprehensive comparisons with the SOTA models confirmed the competitive performance of the proposed model. The framework achieved notable results, including up to 0.37 higher precision and 0.2 higher F1-score than the baseline OWL-ViT, as well as a recall of 0.98 for the “Without Mask” class (i.e., class 0) in real-world testing. Overall, the proposed approach offers a flexible and practical solution for large-scale deployment in resource-constrained environments.
This study laid the foundation for scalable, flexible systems to monitor contagious diseases, thereby enhancing public health response strategies.
Note on Person Tracking in the Proposed Framework: The proposed framework does not include a dedicated multi-frame person tracker. Detection and social distance estimation are performed independently for each frame. This design choice was made to maintain methodological simplicity and avoid expanding the scope of the paper. However, standard tracking modules such as ByteTrack [53] or DeepSORT [47] can be integrated within this framework in the future, leveraging the features extracted in the proposed feature workflow (see Section 3) for identity association across frames.
Future research may pursue the following directions:
  • Dataset Expansion for OWL-ViT Fine-Tuning: Collecting a task-specific dataset that encompasses diverse mask-wearing scenarios and crowd conditions. This facilitates the effective fine-tuning of the OWL-ViT model, thereby enhancing its applicability to real-world public health monitoring.
  • Advanced Depth Modeling for Social Distance Estimation: Developing a more sophisticated and accurate depth estimation model. This approach extends beyond conventional pinhole camera assumptions and has the potential to significantly improve the accuracy of social distance estimates, particularly in complex 3D environments.

Supplementary Materials

Supplementary videos accompanying the results can be downloaded at: https://drive.google.com/drive/folders/1-HAUO15P6_e38_6HZSAq-bl-9mE4Nzzh?usp=sharing (accessed on 5 October 2025).

Author Contributions

Conceptualization, M.F., D.S.Z., A.N.-A., B.M., E.N.S.; methodology, M.F., D.S.Z., A.N.-A., and O.A.B.; software, M.F., D.S.Z., and A.N.-A.; validation, M.F., D.S.Z., A.N.-A., B.M., O.A.B., E.N.S., J.G.-H., and J.M.M.; formal analysis, M.F., D.S.Z., and A.N.-A.; investigation, M.F., D.S.Z., A.N.-A., O.A.B., and E.N.S.; resources, D.S.Z., A.N.-A., and O.A.B.; data curation, D.S.Z., A.N.-A., and O.A.B.; writing—original draft preparation, M.F., D.S.Z., A.N.-A., B.M., and O.A.B.; writing—review and editing, M.F., D.S.Z., A.N.-A., B.M., O.A.B., E.N.S., J.G.-H., and J.M.M.; visualization, M.F., D.S.Z., A.N.-A., and E.N.S.; supervision, B.M. and O.A.B.; project administration, D.S.Z., B.M., J.G.-H., and J.M.M.; All authors have read and agreed to the published version of the manuscript.

Funding

This research received no external funding.

Data Availability Statement

The original contributions presented in this study are included in the article and Supplementary Material. Further inquiries can be directed to the corresponding author.

Conflicts of Interest

The authors declare no conflicts of interest.

Abbreviations

The following abbreviations are used in this manuscript:
MLMachine Learning
OWL-ViTOpen-World Localization Vision Transformer
CB-OWL-ViTCluster-Based OWL-ViT
SOTAState-of-the-Art
VLMVision-Language Model
DSFDDual Shot Face Detector
CNNConvolutional Neural Network
ViTVision Transformer
MDEMonocular Depth Estimation
SSDSingle Shot MultiBox Detector
RMFDReal-World Masked Face Dataset
MHSAMulti-Head Self-Attention
FFNNFeed-Forward Neural Network
EOSEnd-Of-Sequence
NMSNon-Maximum Suppression
IoUIntersection over Union
DLTDirect Linear Transformation
APAverage Precision
TPTrue Positives
FPFalse Positives
FNFalse Negatives
mAPmean AP
MAEMean Absolute Error
MSEMean Squared Error
RMSERoot Mean Square Error

Appendix A. Comparative Detection Results Across Models

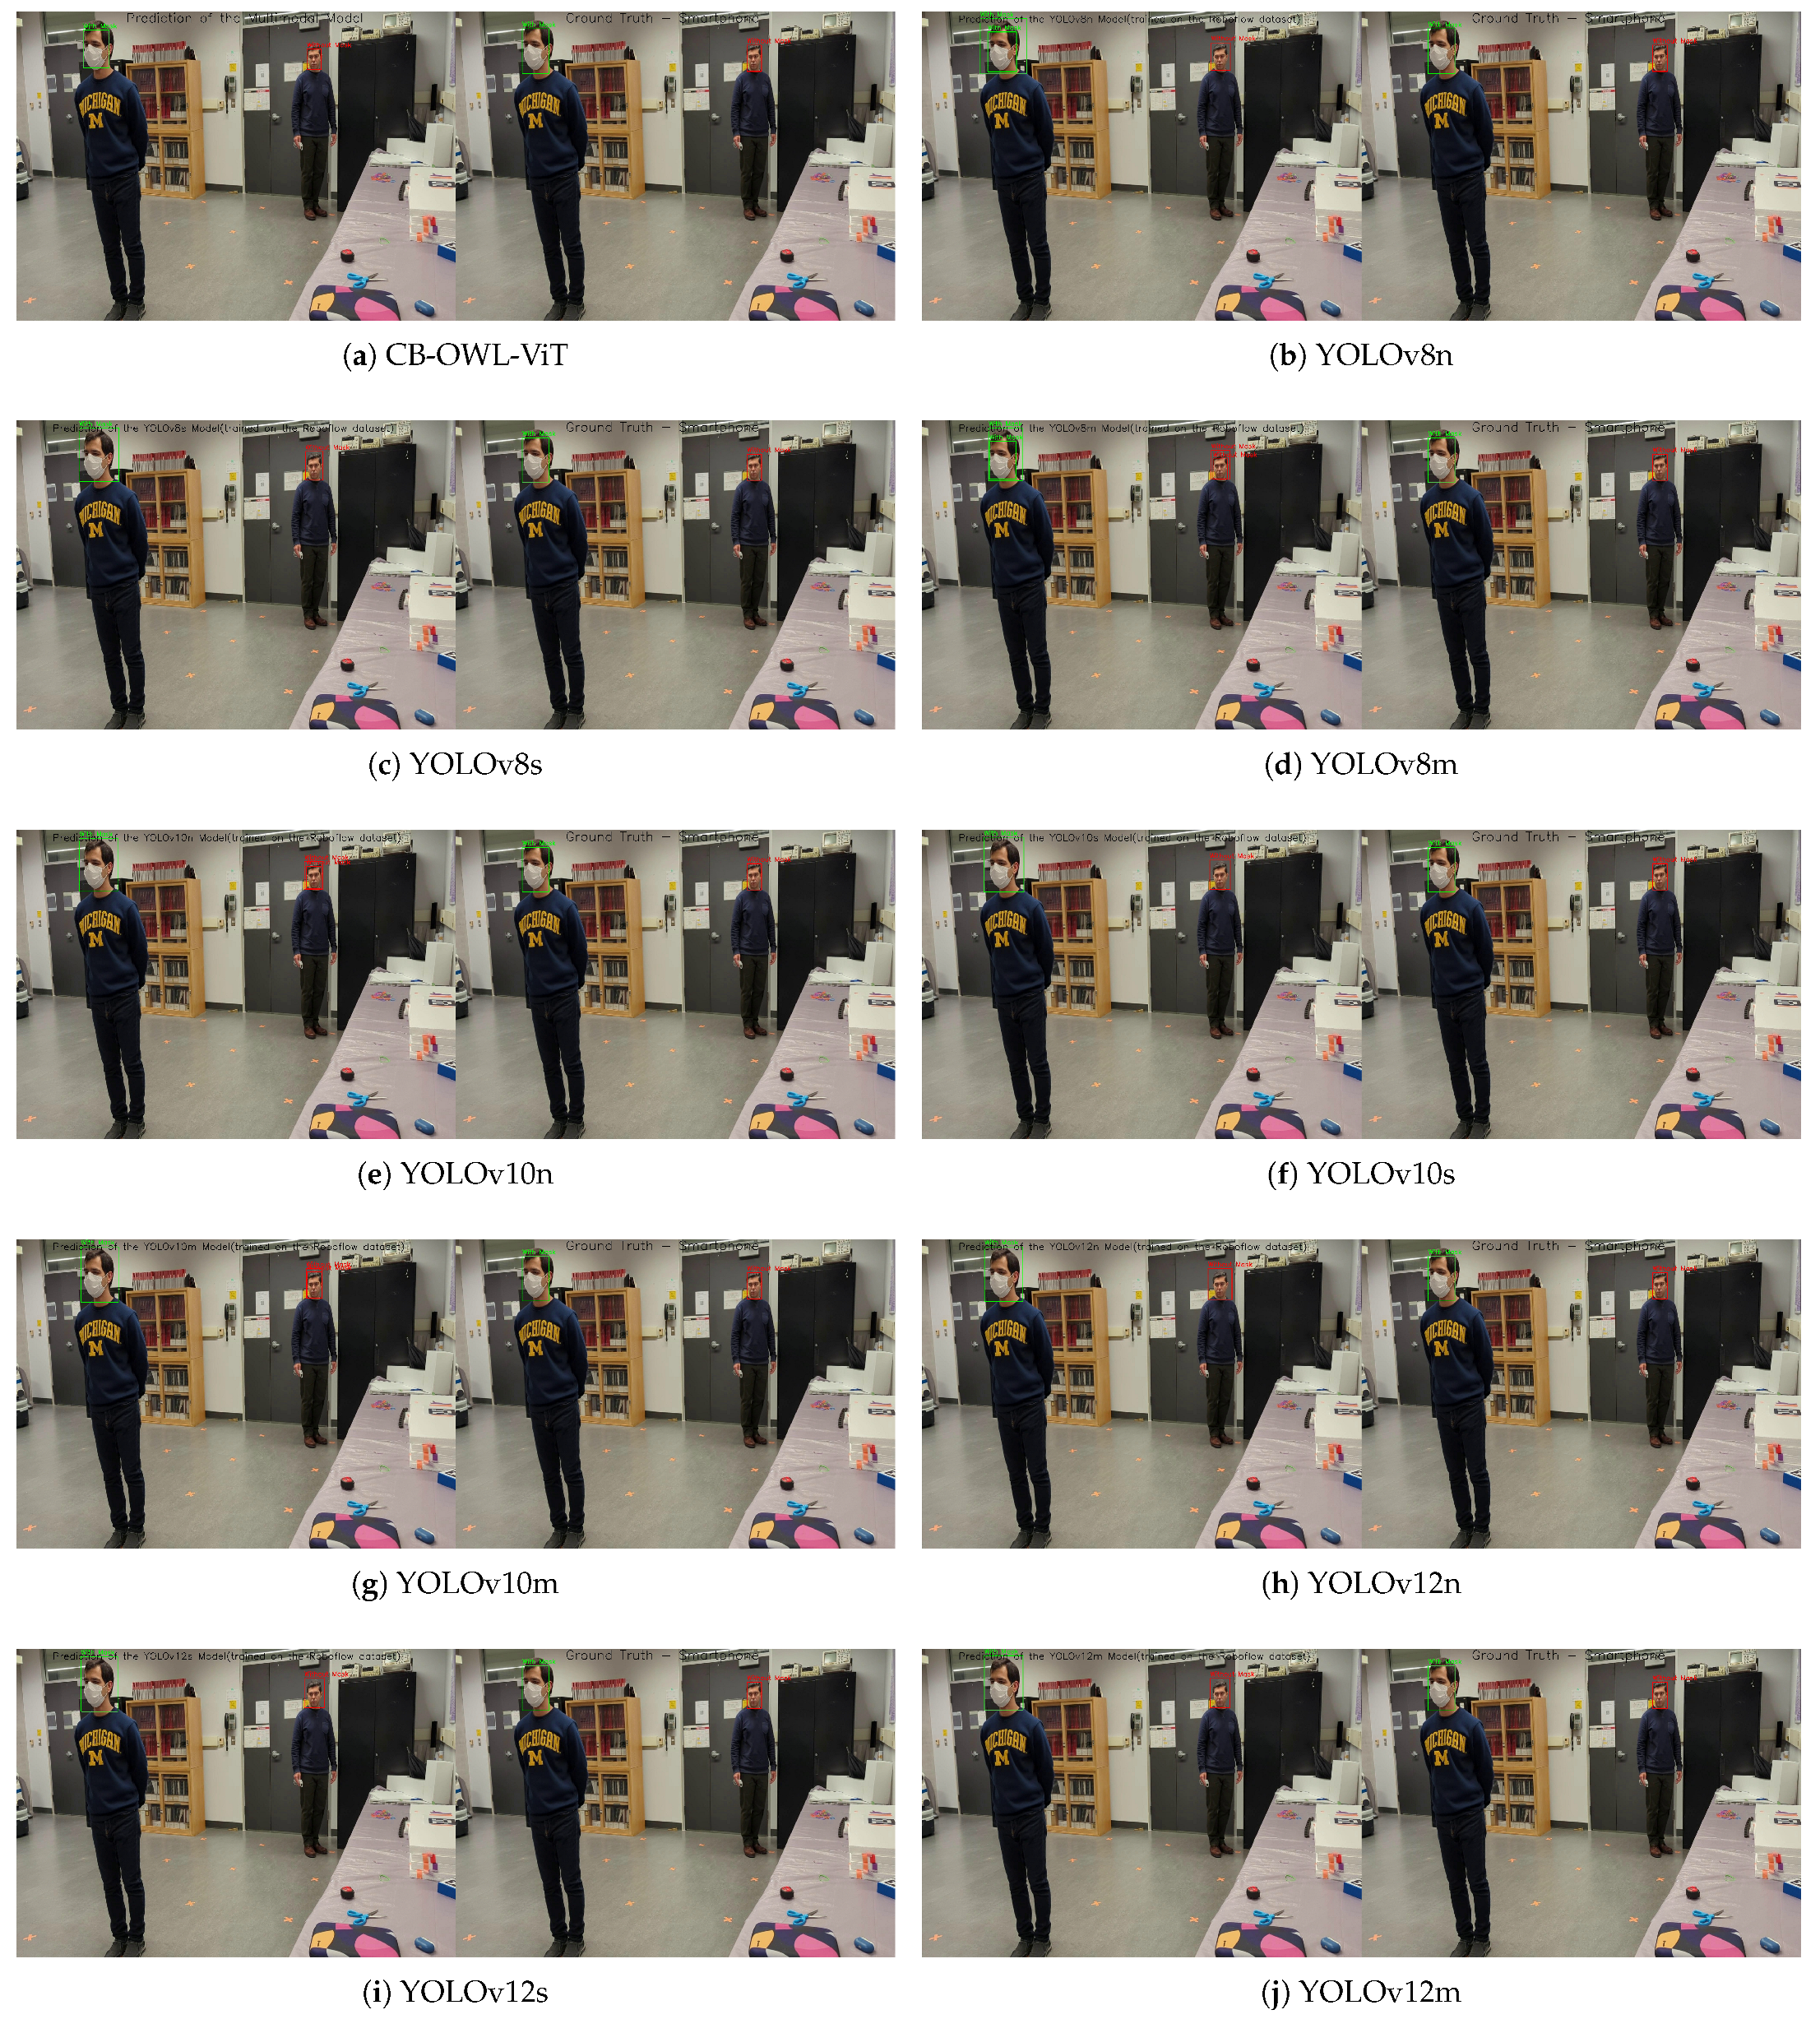
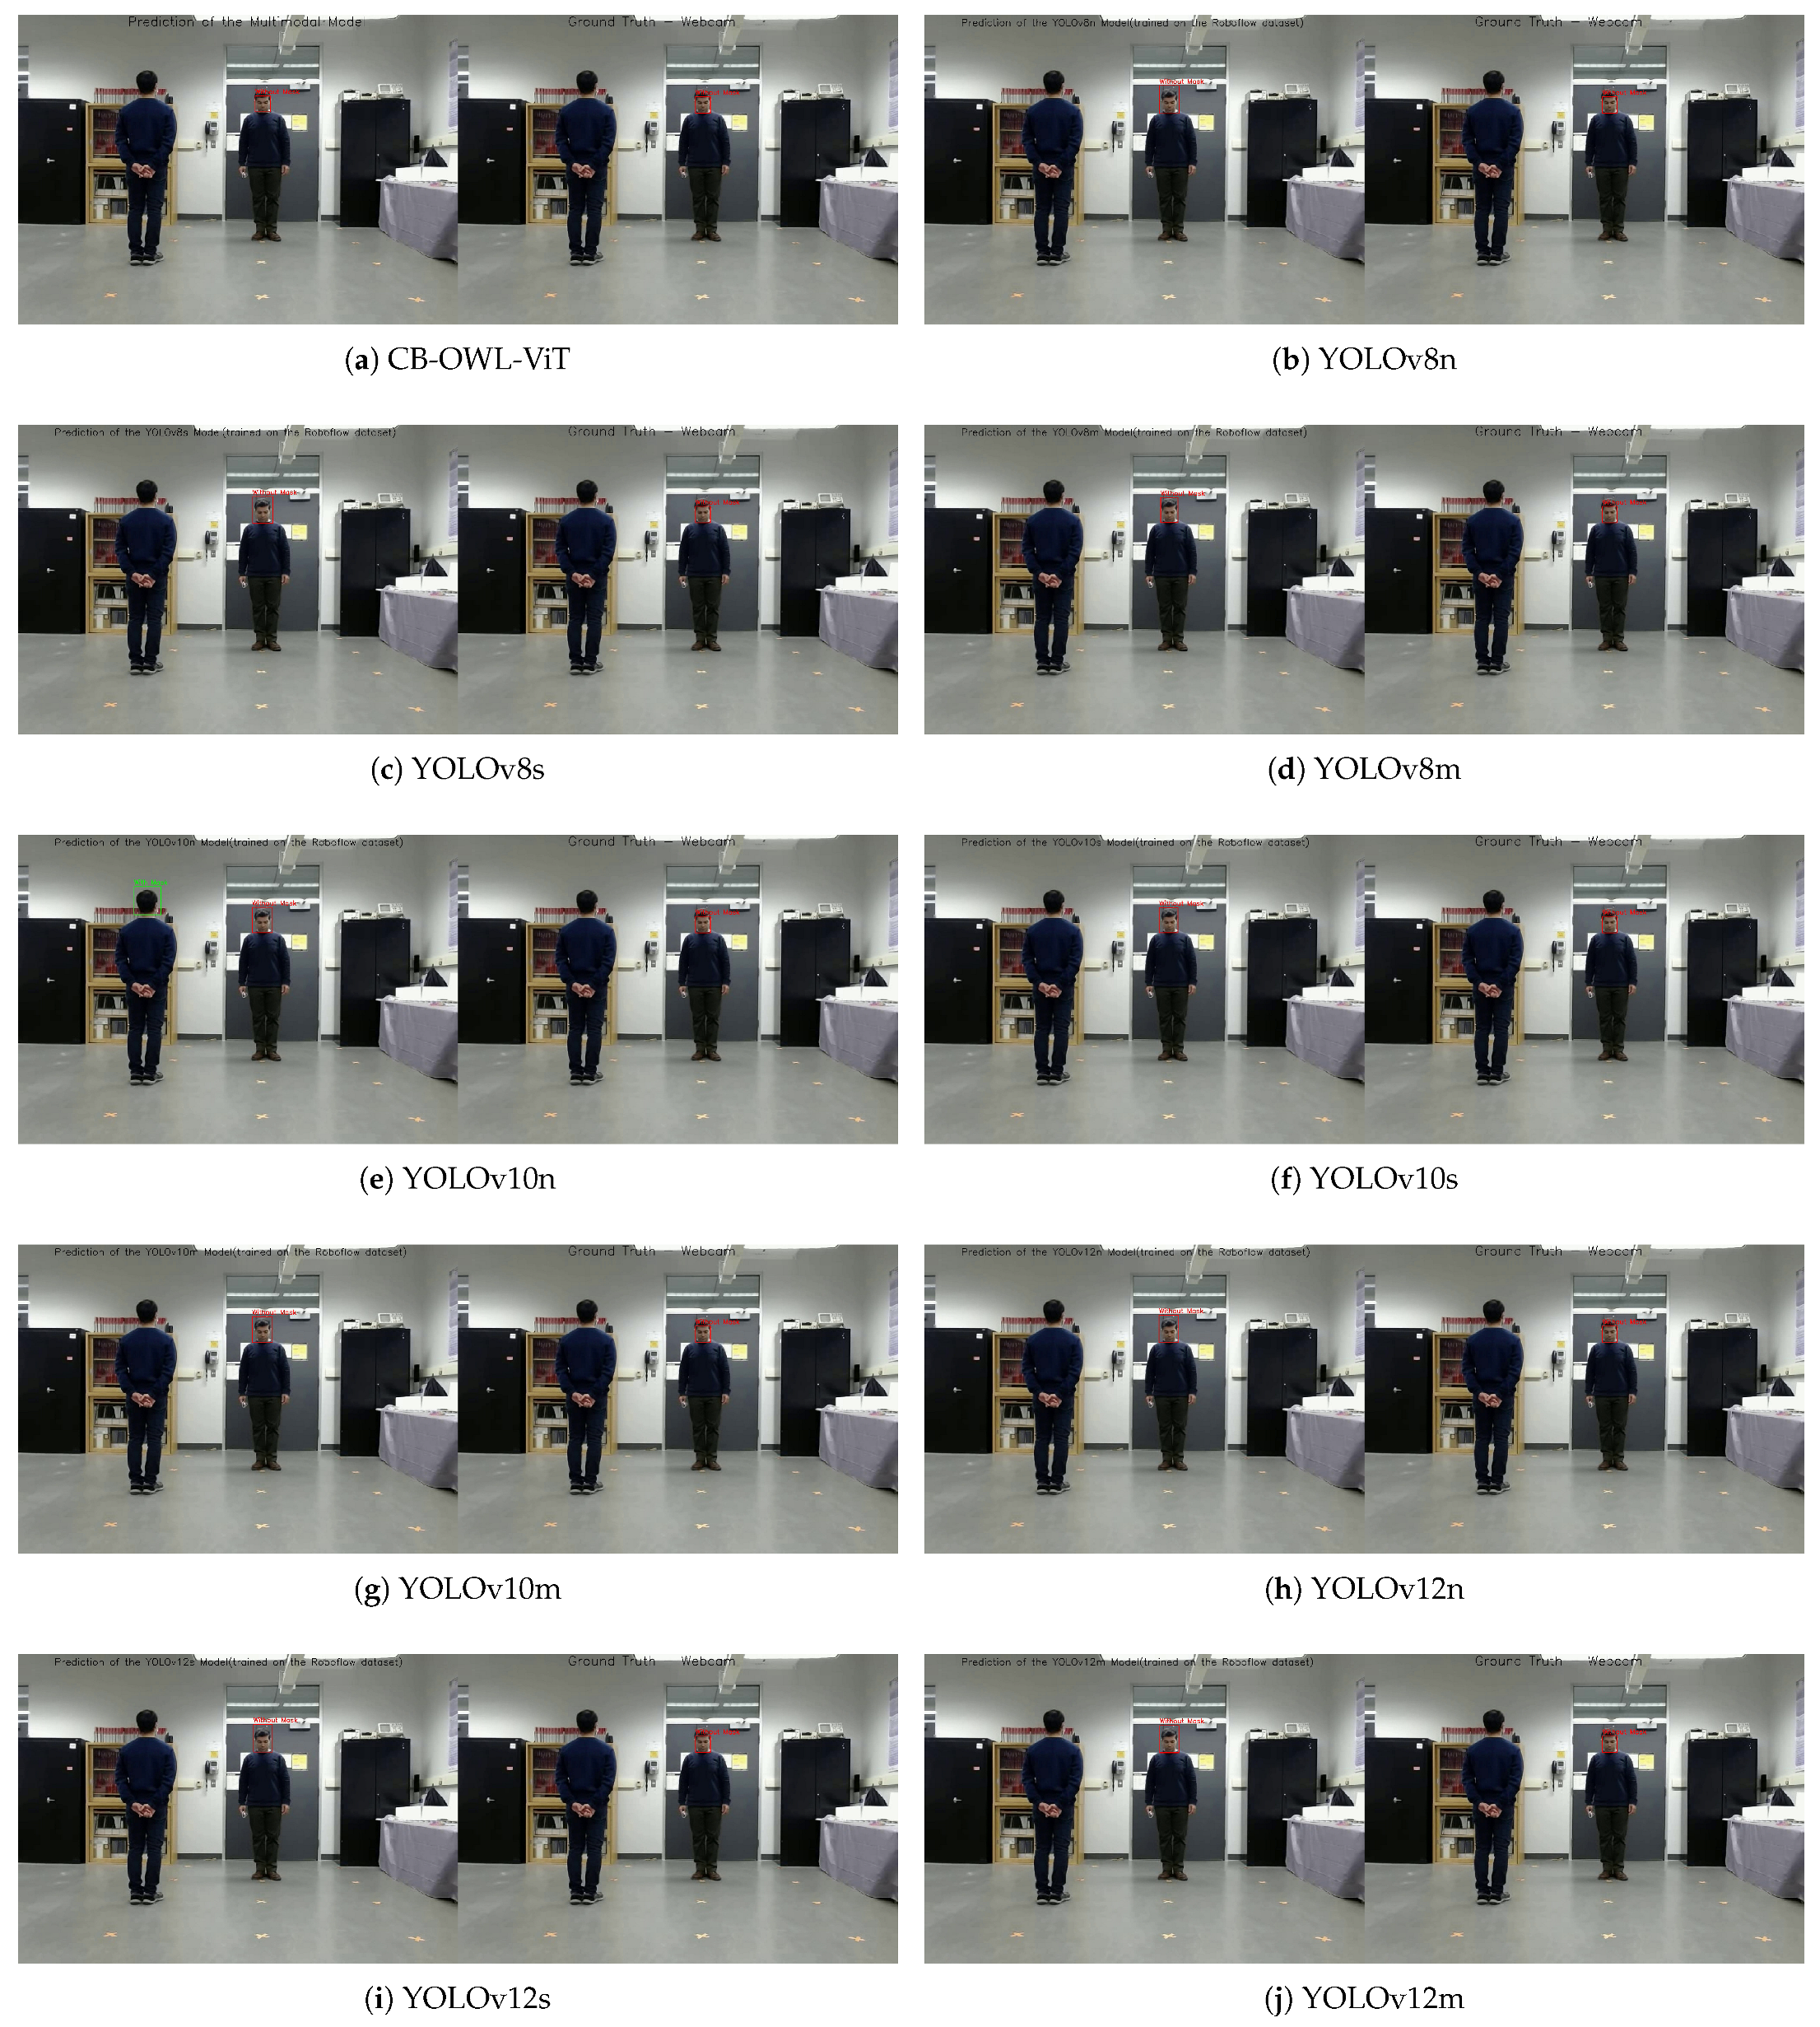
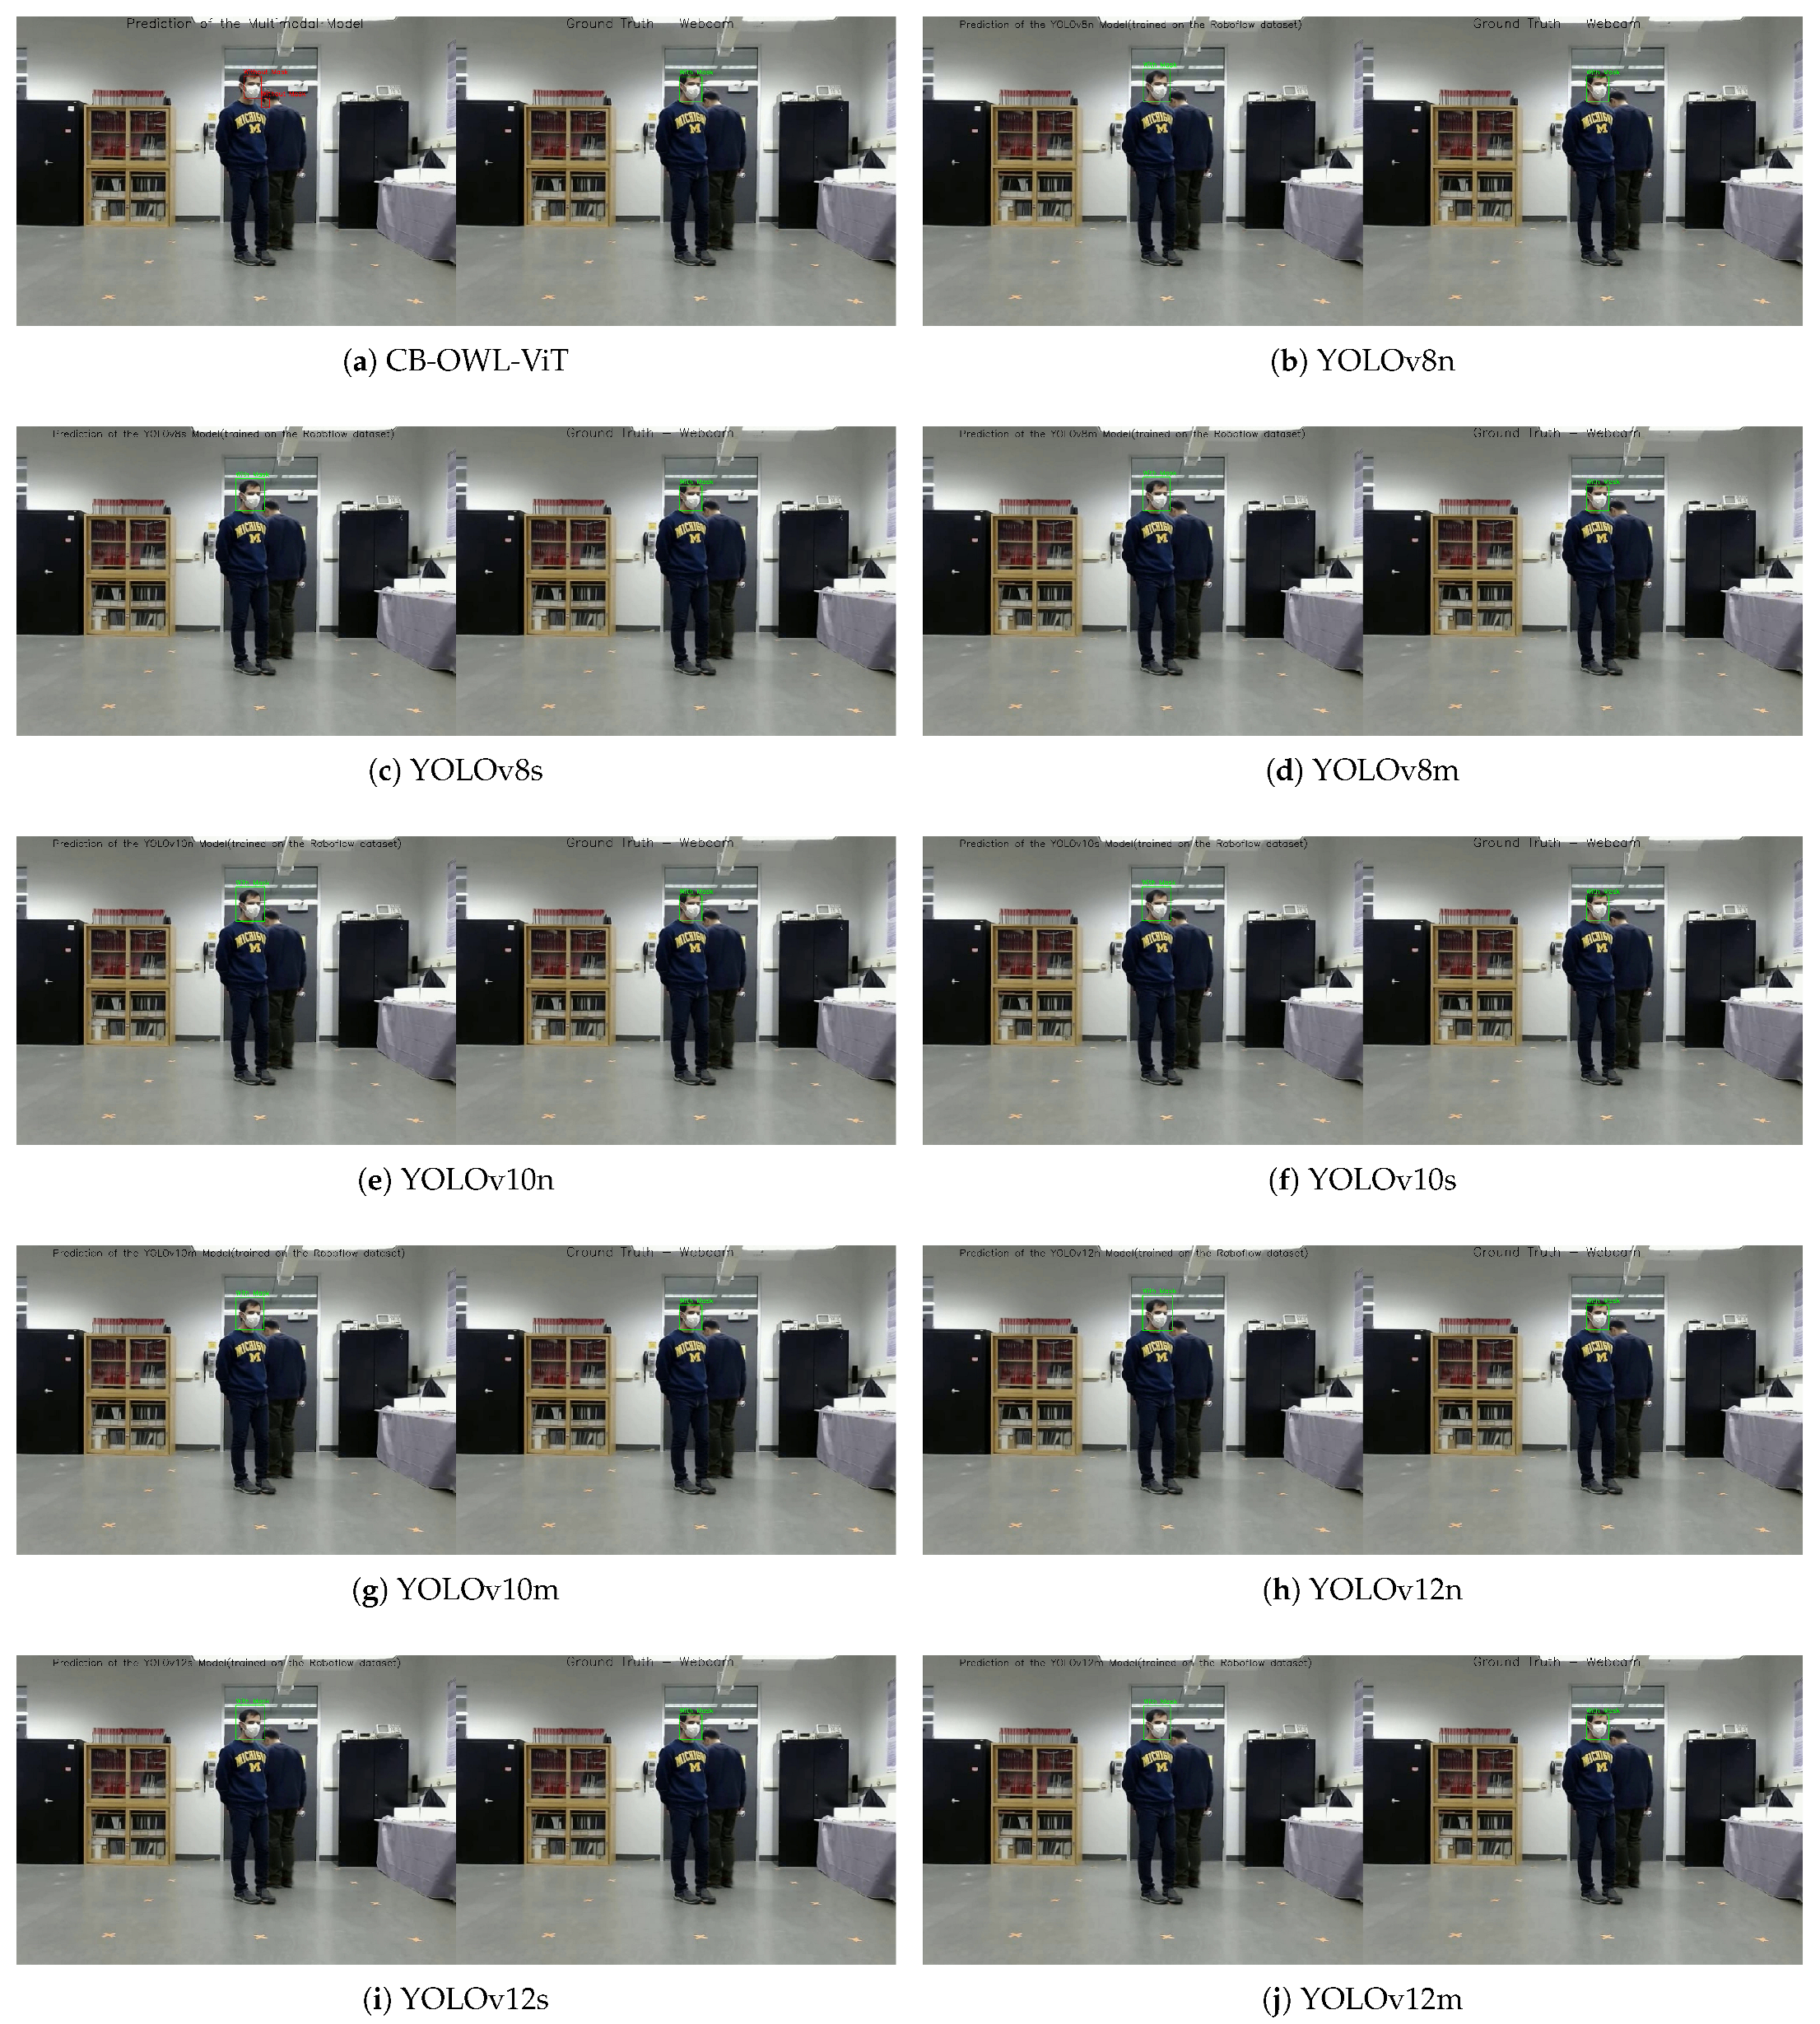
This appendix presents comprehensive visual comparisons of detection results on two datasets (Smartphone and Webcam) through Figure A1, Figure A2, Figure A3, Figure A4. Each subfigure displays a detection output from a model alongside the ground truth for the same input frame. Two frames (10th and 250th) are used to illustrate the detection performance. All models in these figures are trained on the Roboflow dataset.
Figure A1. Comparative detection results on the Smartphone dataset at frame 10.
Mathematics 14 00647 g0a1
Figure A2. Comparative detection results on the Smartphone dataset at frame 250.
Mathematics 14 00647 g0a2
Figure A3. Comparative detection results on the Webcam dataset at frame 10.
Mathematics 14 00647 g0a3
Figure A4. Comparative detection results on the Webcam dataset at frame 250.
Mathematics 14 00647 g0a4

Appendix B. Comparative Social Distance Estimation Results Across Methods

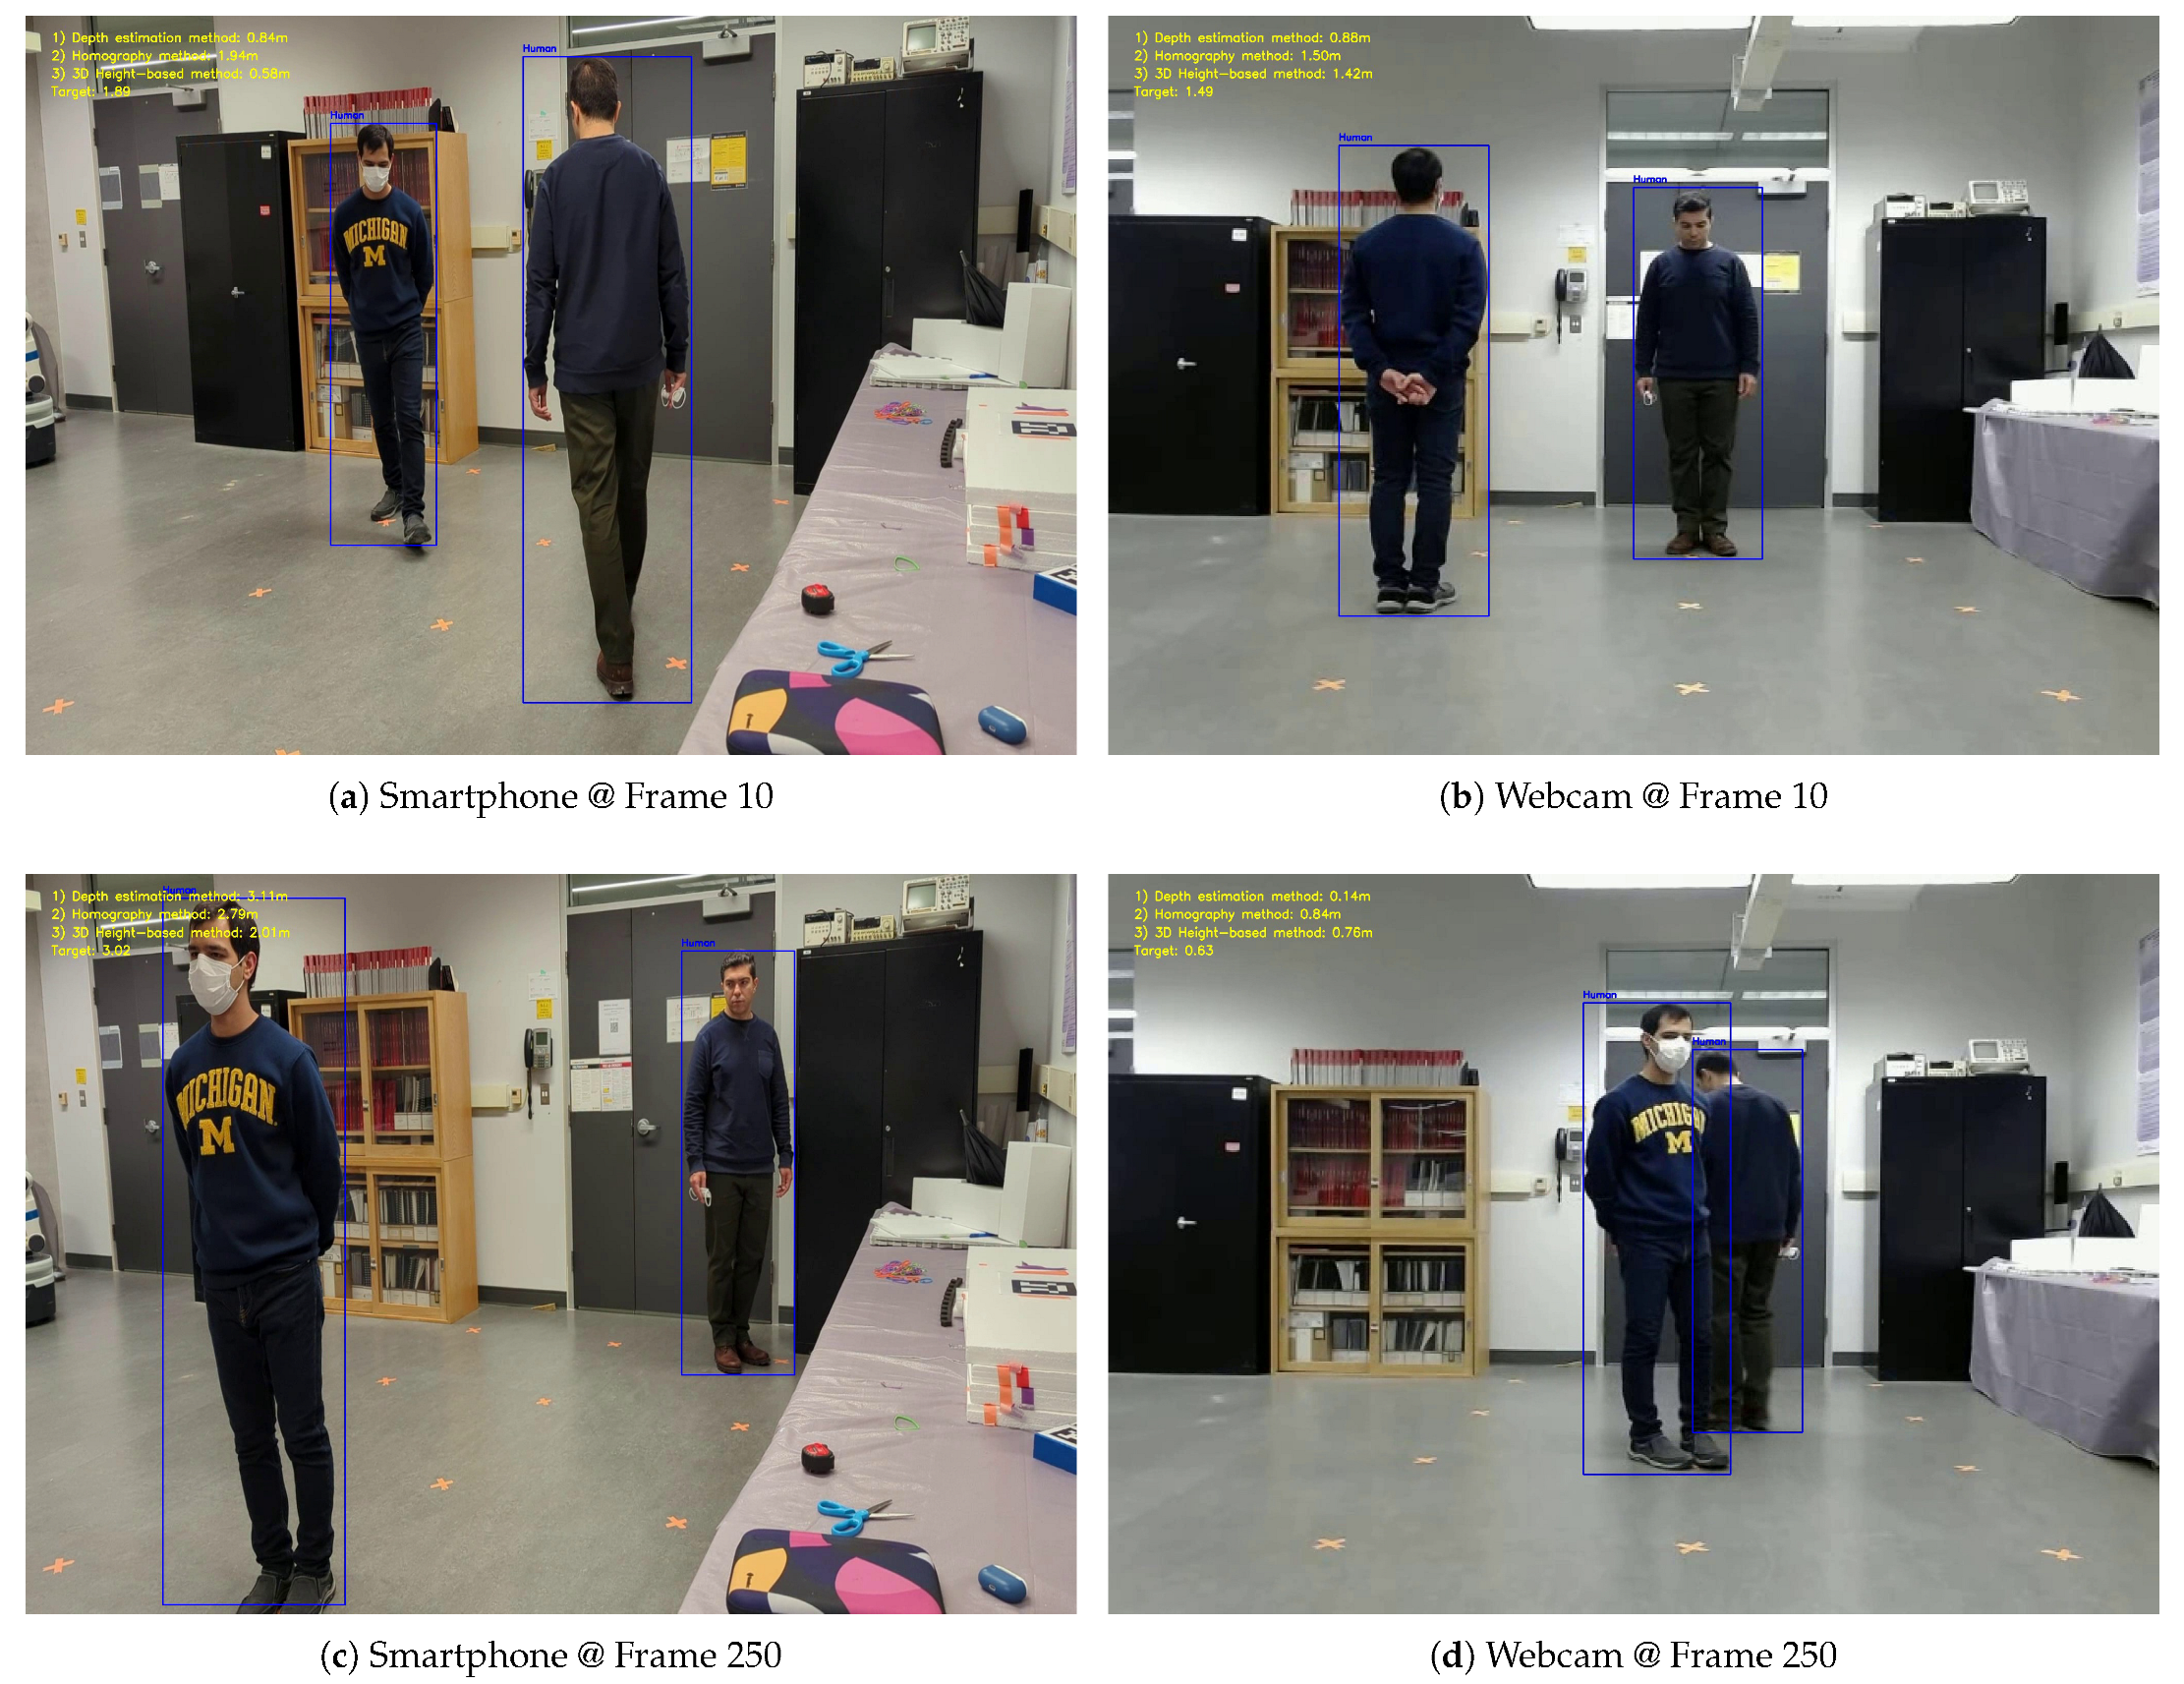
This appendix presents comprehensive visual social distance estimation results on two datasets (Smartphone and Webcam) through Figure A5. The frames are annotated with the distance estimation results for each method, as well as the ground-truth values.
Figure A5. Comparative social distance estimation results on the Smartphone and Webcam datasets at frames 10 and 250 across different methods.
Mathematics 14 00647 g0a5

References

  1. Sadjadi, E.N. Challenges and Opportunities for Education Systems with the Current Movement toward Digitalization at the Time of COVID-19. Mathematics 2023, 11, 259. [Google Scholar] [CrossRef] [Scilit]
  2. Ajagbe, S.A.; Adigun, M.O. Deep learning techniques for detection and prediction of pandemic diseases: A systematic literature review. Multimed. Tools Appl. 2024, 83, 5893–5927. [Google Scholar] [CrossRef] [Scilit]
  3. Sadjadi, E.N. The recovery plans at the time of COVID-19 foster the journey toward smart city development and sustainability: A narrative review. Environ. Dev. Sustain. 2024, 27, 9743–9771. [Google Scholar] [CrossRef] [Scilit]
  4. Fatahi, M.; Alizadeh, M.; Moshiri, B. A Novel Model for Student’s Mental Health Monitoring Based on Hard and Soft Data Fusion. In Proceedings of the 2023 31st International Conference on Electrical Engineering (ICEE), Tehran, Iran, 9–11 May 2023; pp. 723–728. [Google Scholar] [CrossRef] [Scilit]
  5. Kwon, S.; Joshi, A.D.; Lo, C.H.; Drew, D.A.; Nguyen, L.H.; Guo, C.G.; Ma, W.; Mehta, R.S.; Shebl, F.M.; Warner, E.T.; et al. Association of social distancing and face mask use with risk of COVID-19. Nat. Commun. 2021, 12, 3737. [Google Scholar] [CrossRef] [Scilit] [PubMed]
  6. Motaharifar, M.; Norouzzadeh, A.; Abdi, P.; Iranfar, A.; Lotfi, F.; Moshiri, B.; Lashay, A.; Mohammadi, S.F.; Taghirad, H.D. Applications of Haptic Technology, Virtual Reality, and Artificial Intelligence in Medical Training During the COVID-19 Pandemic. Front. Robot. AI 2021, 8, 612949. [Google Scholar] [CrossRef] [Scilit] [PubMed]
  7. Davoodi, M.; Ghaffari, M. Learning-based systems for assessing hazard places of contagious diseases and diagnosing patient possibility. Expert Syst. Appl. 2023, 213, 119043. [Google Scholar] [CrossRef] [Scilit]
  8. Mokeddem, M.L.; Belahcene, M.; Bourennane, S. Real-time social distance monitoring and face mask detection based Social-Scaled-YOLOv4, DeepSORT and DSFD&MobileNetv2 for COVID-19. Multimed. Tools Appl. 2024, 83, 30613–30639. [Google Scholar] [CrossRef] [Scilit]
  9. Fatahi, M.; Sadrian Zadeh, D.; Moshiri, B.; Basir, O. Entropy-based genetic feature engineering and multi-classifier fusion for anomaly detection in vehicle controller area networks. Future Gener. Comput. Syst. 2025, 169, 107779. [Google Scholar] [CrossRef] [Scilit]
  10. Fatahi, M.; Sadrian Zadeh, D.; Ghojogh, B.; Moshiri, B.; Basir, O. An Optimal Cascade Feature-Level Spatiotemporal Fusion Strategy for Anomaly Detection in CAN Bus. arXiv 2025, arXiv:2501.18821. [Google Scholar] [CrossRef] [Scilit]
  11. Mostafa, S.A.; Ravi, S.; Asaad Zebari, D.; Asaad Zebari, N.; Abed Mohammed, M.; Nedoma, J.; Martinek, R.; Deveci, M.; Ding, W. A YOLO-based deep learning model for Real-Time face mask detection via drone surveillance in public spaces. Inf. Sci. 2024, 676, 120865. [Google Scholar] [CrossRef] [Scilit]
  12. Thai, C.; Tran, V.; Bui, M.; Nguyen, D.; Ninh, H.; Tran, H. Real-time masked face classification and head pose estimation for RGB facial image via knowledge distillation. Inf. Sci. 2022, 616, 330–347. [Google Scholar] [CrossRef] [Scilit]
  13. Zeng, D.; Liu, H.; Zhao, F.; Ge, S.; Shen, W.; Zhang, Z. Proposal pyramid networks for fast face detection. Inf. Sci. 2019, 495, 136–149. [Google Scholar] [CrossRef] [Scilit]
  14. Pagano, C.; Granger, E.; Sabourin, R.; Marcialis, G.; Roli, F. Adaptive ensembles for face recognition in changing video surveillance environments. Inf. Sci. 2014, 286, 75–101. [Google Scholar] [CrossRef] [Scilit]
  15. Gupta, N.; Mujumdar, S.; Patel, H.; Masuda, S.; Panwar, N.; Bandyopadhyay, S.; Mehta, S.; Guttula, S.; Afzal, S.; Sharma Mittal, R.; et al. Data Quality for Machine Learning Tasks. In Proceedings of the 27th ACM SIGKDD Conference on Knowledge Discovery & Data Mining, Virtual Event, 14–18 August 2021; pp. 4040–4041. [Google Scholar] [CrossRef] [Scilit]
  16. Minderer, M.; Gritsenko, A.; Stone, A.; Neumann, M.; Weissenborn, D.; Dosovitskiy, A.; Mahendran, A.; Arnab, A.; Dehghani, M.; Shen, Z.; et al. Simple Open-Vocabulary Object Detection. In Computer Vision—ECCV 2022; Series Title: Lecture Notes in Computer Science; Avidan, S., Brostow, G., Cissé, M., Farinella, G.M., Hassner, T., Eds.; Springer Nature: Cham, Switzerland, 2022; Volume 13670, pp. 728–755. [Google Scholar] [CrossRef] [Scilit]
  17. Wang, A.; Chen, H.; Liu, L.; Chen, K.; Lin, Z.; Han, J.; Ding, G. YOLOv10: Real-Time End-to-End Object Detection. arXiv 2024, arXiv:2405.14458v2. [Google Scholar] [CrossRef] [Scilit]
  18. Tian, Y.; Ye, Q.; Doermann, D. YOLOv12: Attention-Centric Real-Time Object Detectors. arXiv 2025, arXiv:2502.12524v1. [Google Scholar] [CrossRef] [Scilit]
  19. Zhao, Y.; Lv, W.; Xu, S.; Wei, J.; Wang, G.; Dang, Q.; Liu, Y.; Chen, J. DETRs Beat YOLOs on Real-time Object Detection. In Proceedings of the 2024 IEEE/CVF Conference on Computer Vision and Pattern Recognition (CVPR), Seattle, WA, USA, 16–22 June 2024; pp. 16965–16974. [Google Scholar] [CrossRef] [Scilit]
  20. Lv, W.; Zhao, Y.; Chang, Q.; Huang, K.; Wang, G.; Liu, Y. RT-DETRv2: Improved Baseline with Bag-of-Freebies for Real-Time Detection Transformer. arXiv 2024, arXiv:2407.17140v1. [Google Scholar] [CrossRef] [Scilit]
  21. Wang, S.; Xia, C.; Lv, F.; Shi, Y. RT-DETRv3: Real-Time End-to-End Object Detection with Hierarchical Dense Positive Supervision. In Proceedings of the 2025 IEEE/CVF Winter Conference on Applications of Computer Vision (WACV), Tucson, AZ, USA, 28 February–4 March 2025; pp. 1628–1636. [Google Scholar] [CrossRef] [Scilit]
  22. Li, J.; Wang, Y.; Wang, C.; Tai, Y.; Qian, J.; Yang, J.; Wang, C.; Li, J.; Huang, F. DSFD: Dual Shot Face Detector. In Proceedings of the 2019 IEEE/CVF Conference on Computer Vision and Pattern Recognition (CVPR), Long Beach, CA, USA, 15–20 June 2019; pp. 5055–5064. [Google Scholar] [CrossRef] [Scilit]
  23. Radford, A.; Kim, J.W.; Hallacy, C.; Ramesh, A.; Goh, G.; Agarwal, S.; Sastry, G.; Askell, A.; Mishkin, P.; Clark, J.; et al. Learning Transferable Visual Models From Natural Language Supervision. In Proceedings of the 38th International Conference on Machine Learning, PMLR, Virtual, 18–24 July 2021; pp. 8748–8763. [Google Scholar]
  24. Jia, C.; Yang, Y.; Xia, Y.; Chen, Y.T.; Parekh, Z.; Pham, H.; Le, Q.; Sung, Y.H.; Li, Z.; Duerig, T. Scaling Up Visual and Vision-Language Representation Learning with Noisy Text Supervision. In Proceedings of the 38th International Conference on Machine Learning, PMLR, Virtual, 18–24 July 2021; Volume 139, pp. 4904–4916. [Google Scholar]
  25. Cheng, T.; Song, L.; Ge, Y.; Liu, W.; Wang, X.; Shan, Y. YOLO-World: Real-Time Open-Vocabulary Object Detection. In Proceedings of the 2024 IEEE/CVF Conference on Computer Vision and Pattern Recognition (CVPR), Seattle, WA, USA, 16–22 June 2024; pp. 16901–16911. [Google Scholar] [CrossRef] [Scilit]
  26. Dosovitskiy, A.; Beyer, L.; Kolesnikov, A.; Weissenborn, D.; Zhai, X.; Unterthiner, T.; Dehghani, M.; Minderer, M.; Heigold, G.; Gelly, S.; et al. An Image is Worth 16 × 16 Words: Transformers for Image Recognition at Scale. arXiv 2020, arXiv:2010.11929v2. [Google Scholar] [CrossRef] [Scilit]
  27. Bao, H.; Dong, L.; Piao, S.; Wei, F. BEiT: BERT Pre-Training of Image Transformers. arXiv 2021, arXiv:2106.08254v2. [Google Scholar] [CrossRef] [Scilit]
  28. Oquab, M.; Darcet, T.; Moutakanni, T.; Vo, H.; Szafraniec, M.; Khalidov, V.; Fernandez, P.; Haziza, D.; Massa, F.; El-Nouby, A.; et al. DINOv2: Learning Robust Visual Features without Supervision. arXiv 2020, arXiv:2304.07193v2. [Google Scholar] [CrossRef] [Scilit]
  29. Rombach, R.; Blattmann, A.; Lorenz, D.; Esser, P.; Ommer, B. High-Resolution Image Synthesis with Latent Diffusion Models. In Proceedings of the 2022 IEEE/CVF Conference on Computer Vision and Pattern Recognition (CVPR), New Orleans, LA, USA, 18–24 June 2022; pp. 10674–10685. [Google Scholar] [CrossRef] [Scilit]
  30. Yang, L.; Kang, B.; Huang, Z.; Xu, X.; Feng, J.; Zhao, H. Depth Anything: Unleashing the Power of Large-Scale Unlabeled Data. In Proceedings of the 2024 IEEE/CVF Conference on Computer Vision and Pattern Recognition (CVPR), Seattle, WA, USA, 16–22 June 2024; pp. 10371–10381. [Google Scholar] [CrossRef] [Scilit]
  31. Yang, L.; Kang, B.; Huang, Z.; Zhao, Z.; Xu, X.; Feng, J.; Zhao, H. Depth Anything V2. arXiv 2024, arXiv:2406.09414v2. [Google Scholar] [CrossRef] [Scilit]
  32. Bochkovskii, A.; Delaunoy, A.; Germain, H.; Santos, M.; Zhou, Y.; Richter, S.R.; Koltun, V. Depth Pro: Sharp Monocular Metric Depth in Less Than a Second. arXiv 2024, arXiv:2410.02073. [Google Scholar] [CrossRef] [Scilit]
  33. Yadav, S. Deep Learning based Safe Social Distancing and Face Mask Detection in Public Areas for COVID-19 Safety Guidelines Adherence. Int. J. Res. Appl. Sci. Eng. Technol. 2020, 8, 1368–1375. [Google Scholar] [CrossRef] [Scilit]
  34. Walia, I.S.; Kumar, D.; Sharma, K.; Hemanth, J.D.; Popescu, D.E. An Integrated Approach for Monitoring Social Distancing and Face Mask Detection Using Stacked ResNet-50 and YOLOv5. Electronics 2021, 10, 2996. [Google Scholar] [CrossRef] [Scilit]
  35. Wang, Z.; Huang, B.; Wang, G.; Yi, P.; Jiang, K. Masked Face Recognition Dataset and Application. IEEE Trans. Biom. Behav. Identity Sci. 2023, 5, 298–304. [Google Scholar] [CrossRef] [Scilit]
  36. Saponara, S.; Elhanashi, A.; Gagliardi, A. Implementing a real-time, AI-based, people detection and social distancing measuring system for Covid-19. J. Real-Time Image Process. 2021, 18, 1937–1947. [Google Scholar] [CrossRef] [Scilit]
  37. Razavi, M.; Alikhani, H.; Janfaza, V.; Sadeghi, B.; Alikhani, E. An Automatic System to Monitor the Physical Distance and Face Mask Wearing of Construction Workers in COVID-19 Pandemic. SN Comput. Sci. 2022, 3, 27. [Google Scholar] [CrossRef] [Scilit]
  38. MVD, A. Face Mask Detection. 2025. Available online: https://www.kaggle.com/datasets/andrewmvd/face-mask-detection (accessed on 9 July 2025).
  39. Meivel, S.; Sindhwani, N.; Anand, R.; Pandey, D.; Alnuaim, A.A.; Altheneyan, A.S.; Jabarulla, M.Y.; Lelisho, M.E. Mask Detection and Social Distance Identification Using Internet of Things and Faster R-CNN Algorithm. Comput. Intell. Neurosci. 2022, 2022, 2103975. [Google Scholar] [CrossRef] [Scilit] [PubMed]
  40. Elhanashi, A.; Saponara, S.; Dini, P.; Zheng, Q.; Morita, D.; Raytchev, B. An integrated and real-time social distancing, mask detection, and facial temperature video measurement system for pandemic monitoring. J. Real-Time Image Process. 2023, 20, 95. [Google Scholar] [CrossRef] [Scilit]
  41. Shao, Y.; Ning, J.; Shao, H.; Zhang, D.; Chu, H.; Ren, Z. Lightweight face mask detection algorithm with attention mechanism. Eng. Appl. Artif. Intell. 2024, 137, 109077. [Google Scholar] [CrossRef] [Scilit]
  42. He, K.; Zhang, X.; Ren, S.; Sun, J. Deep Residual Learning for Image Recognition. In Proceedings of the 2016 IEEE Conference on Computer Vision and Pattern Recognition (CVPR), Las Vegas, NV, USA, 27–30 June 2016; pp. 770–778. [Google Scholar] [CrossRef] [Scilit]
  43. Redmon, J.; Farhadi, A. YOLO9000: Better, Faster, Stronger. In Proceedings of the 2017 IEEE Conference on Computer Vision and Pattern Recognition (CVPR), Honolulu, HI, USA, 21–26 July 2017; pp. 6517–6525. [Google Scholar] [CrossRef] [Scilit]
  44. Bochkovskiy, A.; Wang, C.Y.; Liao, H.Y.M. YOLOv4: Optimal Speed and Accuracy of Object Detection. arXiv 2004, arXiv:2004.10934. [Google Scholar] [CrossRef] [Scilit]
  45. Ren, S.; He, K.; Girshick, R.; Sun, J. Faster R-CNN: Towards Real-Time Object Detection with Region Proposal Networks. IEEE Trans. Pattern Anal. Mach. Intell. 2017, 39, 1137–1149. [Google Scholar] [CrossRef] [Scilit] [PubMed]
  46. Sandler, M.; Howard, A.; Zhu, M.; Zhmoginov, A.; Chen, L.C. MobileNetV2: Inverted Residuals and Linear Bottlenecks. In Proceedings of the 2018 IEEE/CVF Conference on Computer Vision and Pattern Recognition, Salt Lake City, UT, USA, 18–23 June 2018; pp. 4510–4520. [Google Scholar] [CrossRef] [Scilit]
  47. Wojke, N.; Bewley, A.; Paulus, D. Simple online and realtime tracking with a deep association metric. In Proceedings of the 2017 IEEE International Conference on Image Processing (ICIP), Beijing, China, 17–20 September 2017; pp. 3645–3649. [Google Scholar] [CrossRef] [Scilit]
  48. Kuhn, H.W. The Hungarian method for the assignment problem. Nav. Res. Logist. Q. 1955, 2, 83–97. [Google Scholar] [CrossRef] [Scilit]
  49. Yu, H.; Su, J.; Cai, G.; Piao, Y.; Liu, N.; Huang, M. 3DSAC: Size Adaptive Clustering for 3D object detection in point clouds. Int. J. Appl. Earth Obs. Geoinf. 2023, 118, 103231. [Google Scholar] [CrossRef] [Scilit]
  50. Hartley, R.; Zisserman, A. Multiple View Geometry in Computer Vision, 2nd ed.; Cambridge University Press: Cambridge, UK, 2004. [Google Scholar] [CrossRef] [Scilit]
  51. Szeliski, R. Computer Vision: Algorithms and Applications, 2nd ed.; Texts in Computer Science; Springer: Cham, Switzerland, 2022; ISSN 1868-0941, 1868-095X. [Google Scholar] [CrossRef] [Scilit]
  52. Nelson, J. Mask Wearing Dataset. 2022. Available online: https://universe.roboflow.com/joseph-nelson/mask-wearing (accessed on 9 July 2025).
  53. Zhang, Y.; Sun, P.; Jiang, Y.; Yu, D.; Weng, F.; Yuan, Z.; Luo, P.; Liu, W.; Wang, X. ByteTrack: Multi-object Tracking by Associating Every Detection Box. In Computer Vision—ECCV 2022; Series Title: Lecture Notes in Computer Science; Avidan, S., Brostow, G., Cissé, M., Farinella, G.M., Hassner, T., Eds.; Springer Nature: Cham, Switzerland, 2022; Volume 13682, pp. 1–21. [Google Scholar] [CrossRef] [Scilit]
Figure 1. The proposed model pipeline for condition monitoring during a contagious disease outbreak.
Mathematics 14 00647 g001
Figure 2. Query descriptions categorized by mask-related semantics.
Mathematics 14 00647 g002
Figure 3. Schematic of the homography-based distance estimation setup. Each individual’s ground contact point (typically the bottom-center of the bounding box) is projected onto the planar ground π using a homography matrix H. Separate homography matrices H 1 , H 2 are computed for different camera views I 1 , I 2 to map image coordinates x , y to real-world coordinates X , Y . 1 m-by-1 m ground markers are used during the calibration stage to establish the metric scale. After calibration, the system can estimate distances between individuals without additional markers, enabling consistent, metric-aware social distance measurements across different viewpoints.
Mathematics 14 00647 g003
Figure 4. Ground-truth samples from mask-wearing datasets: (a) Kaggle [38]. (b) Roboflow [52].
Mathematics 14 00647 g004
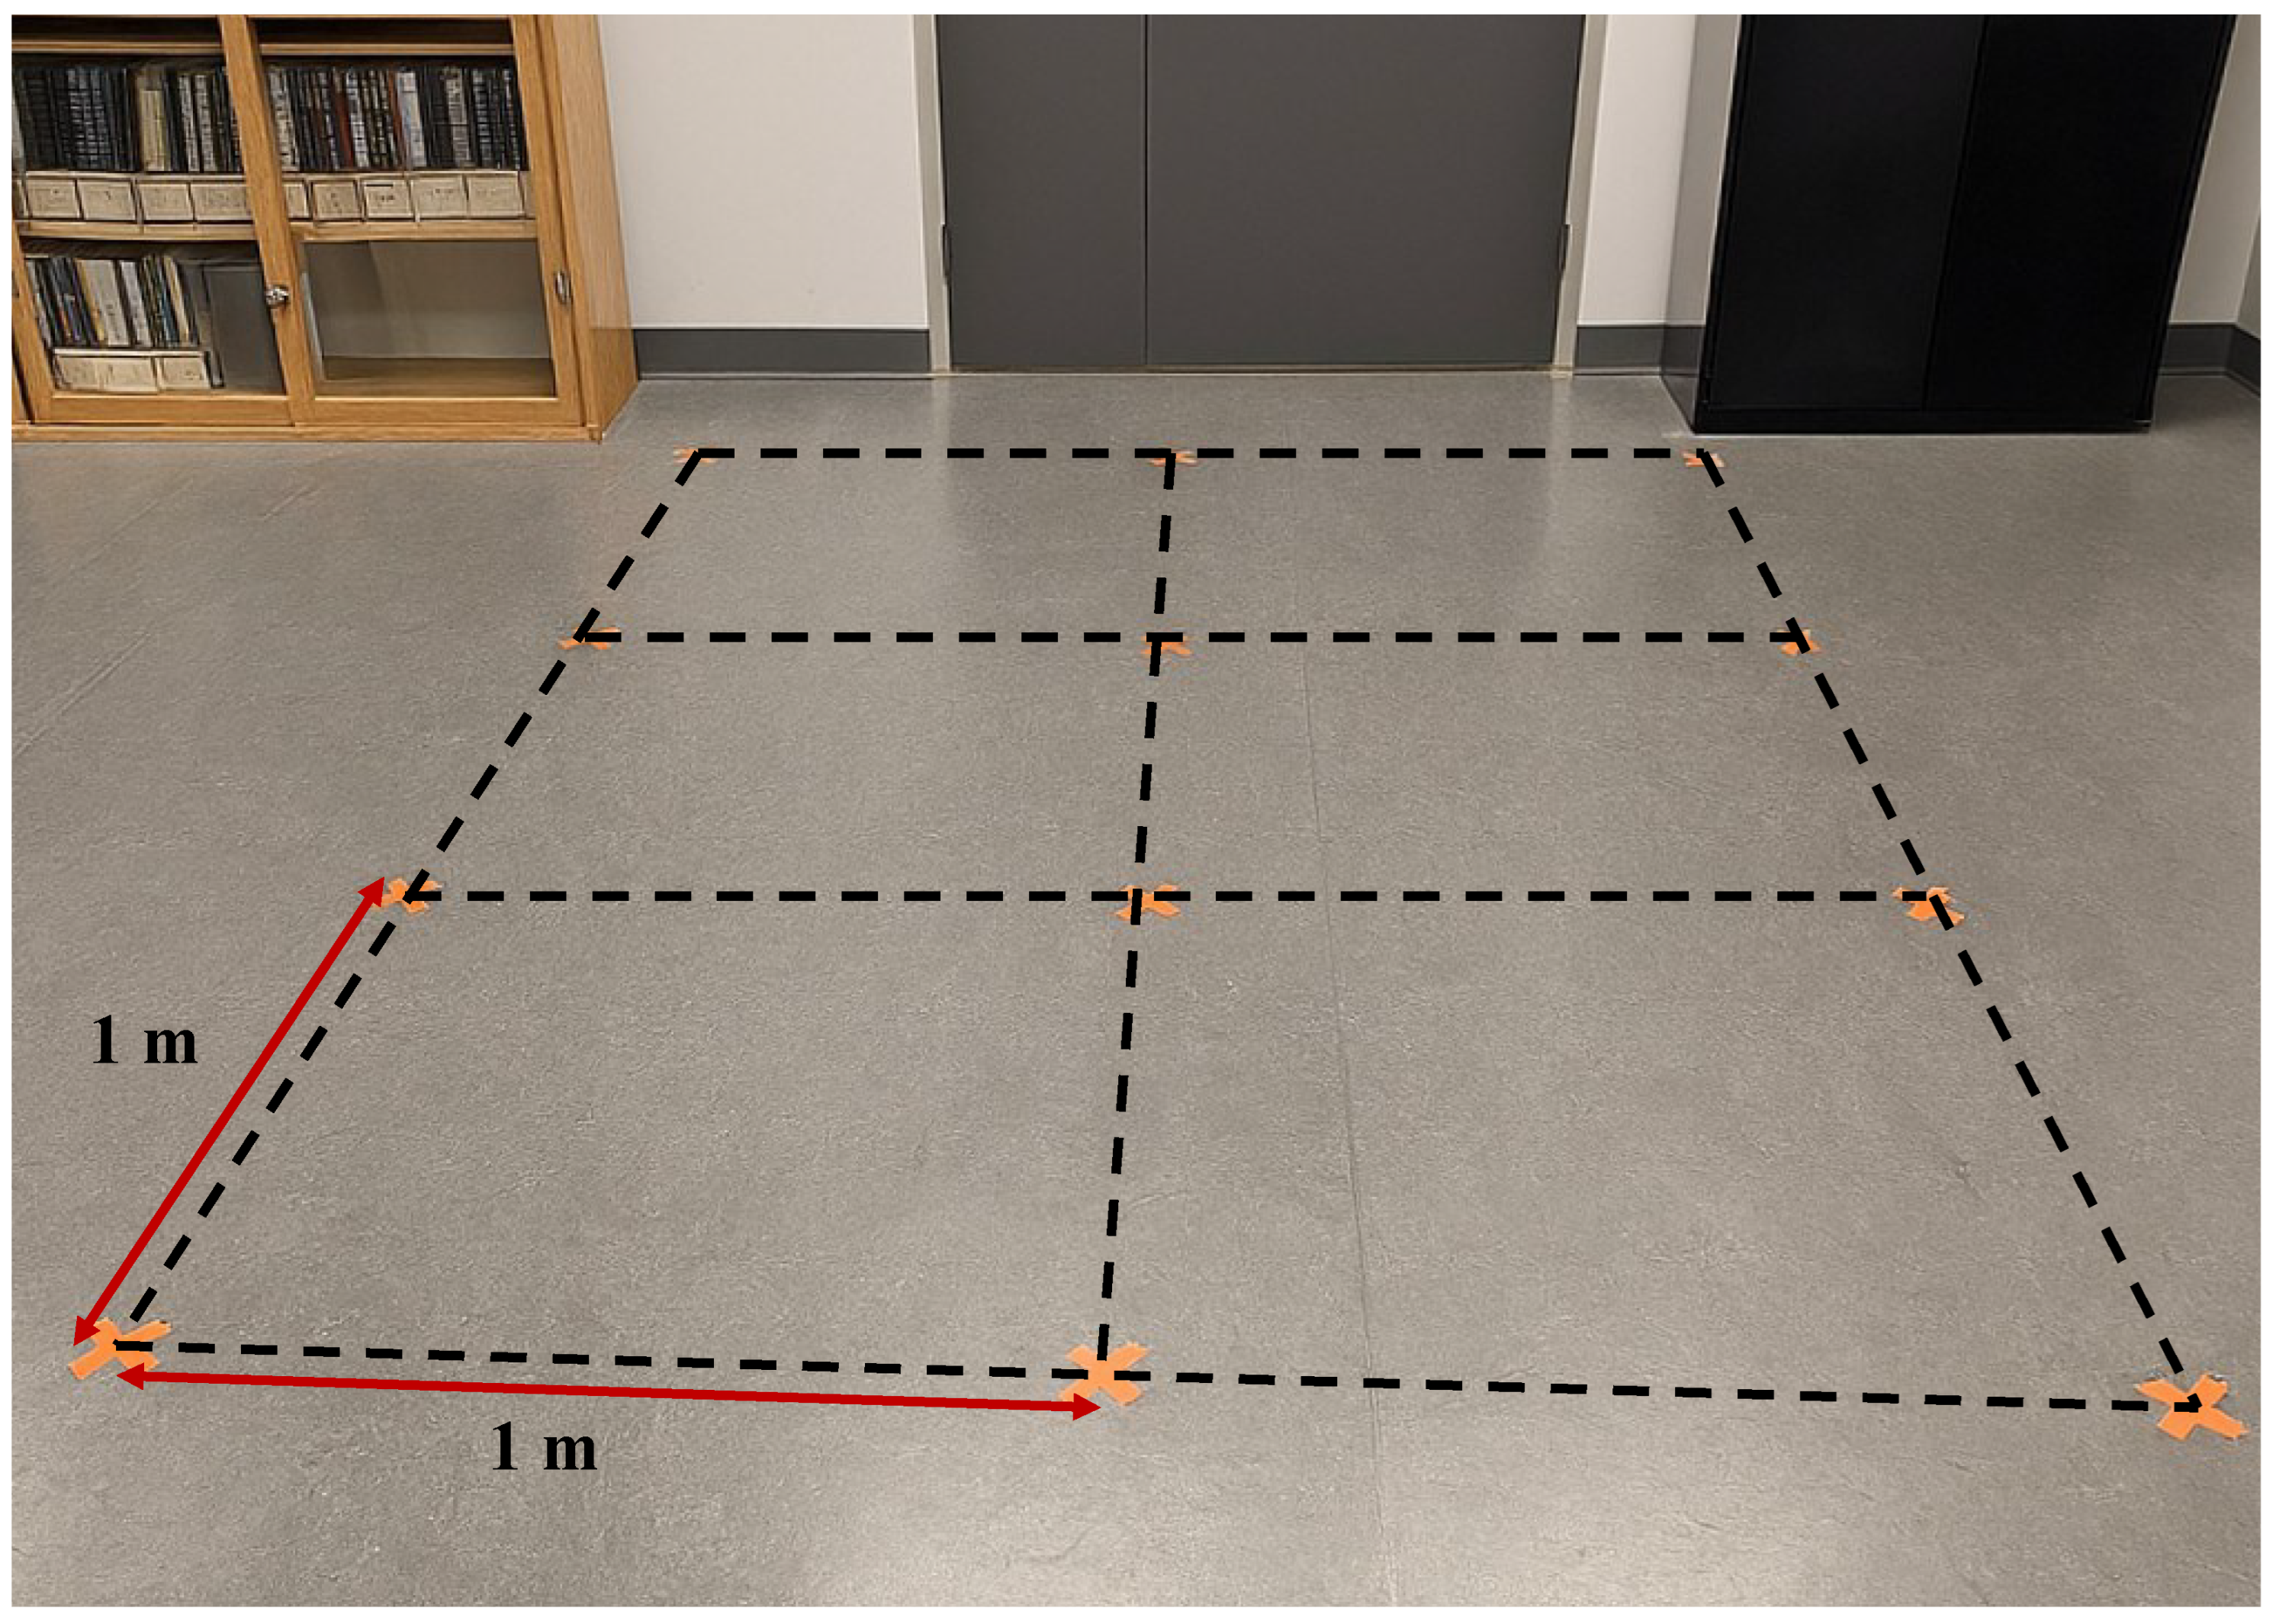
Figure 5. Perspective view of the experimental setup used for data collection in the laboratory. The orange markers on the floor are placed at 1 m intervals, forming a 2 m by 3 m walking grid within which participants were instructed to walk.
Mathematics 14 00647 g005
Figure 6. Sample frames from the collected experimental dataset: (a) Captured by the Google Pixel 7 Smartphone. (b) Captured by the Logitech HD Webcam C615.
Mathematics 14 00647 g006
Figure 7. Comparison of social distance estimation methods for webcam and smartphone data. Metric depth estimation and homography transformation methods are evaluated against the ground truth distances.
Mathematics 14 00647 g007
Table 1. Related work in condition monitoring during contagious disease Outbreaks.
ReferenceYearMask MonitoringDistance MonitoringDataset Availability
[33]2020SSDFixed assumed height (165 cm)Custom (×)
[34]2021ResNet-50 + DSFDStereo cameraRMFD [35] (✓)
[36]2021YOLOv2Stereo cameraCustom (×)
[37]2022Faster R-CNNStereo cameraKaggle [38] (✓)
[39]2022Faster R-CNNStereo cameraCustom (×)
[40]2023YOLOv4Stereo cameraCustom (×)
[8]2024MobileNetV2 + DSFDDeepSORT with Hungarian algorithmRMFD [35] (✓)
[41]2024Custom-Kaggle [38] (✓)
Table 2. Class distribution in training and validation subsets of mask-wearing datasets.
DatasetSubsetInstancesClass LabelObjects
Kaggle [38]Training641W/O Mask (0)462
W/ Mask (1)2255
Validation113W/O Mask (0)96
W/ Mask (1)346
Roboflow [52]Training1300W/O Mask (0)1047
W/ Mask (1)1894
Validation350W/O Mask (0)283
W/ Mask (1)438
Table 3. Class distribution in collected dataset.
DatasetSubsetInstancesClass LabelObjects
SmartphoneTest334W/O Mask (0)196
W/ Mask (1)334
WebcamTest330W/O Mask (0)223
W/ Mask (1)229
Table 4. Evaluation results for CB-OWL-ViT and OWL-ViT across datasets.
DatasetModelClassmAP@PRF1
0.500.20
KaggleCB-OWL-ViT10.32140.53170.880.580.70
00.24140.27920.390.670.49
All0.28140.40540.640.620.59
OWL-ViT10.38070.46930.660.560.61
00.21800.23160.100.910.17
All0.29940.35040.380.730.39
RoboflowCB-OWL-ViT10.07800.51980.830.600.70
00.32180.55700.620.810.71
All0.19990.53840.730.710.70
OWL-ViT10.05800.39760.530.530.53
00.41310.60640.200.980.33
All0.23560.50200.360.750.43
SmartphoneCB-OWL-ViT10.28840.87031.000.870.93
00.50470.78860.790.990.88
All0.39660.82950.890.930.91
OWL-ViT10.58460.64070.940.650.77
00.37750.50680.491.000.65
All0.48110.57370.710.820.71
WebcamCB-OWL-ViT10.54780.67610.970.690.81
00.82710.86050.700.980.82
All0.68750.76830.830.840.81
OWL-ViT10.32810.37160.940.370.53
00.56220.59320.551.000.71
All0.44520.48240.750.680.62
Values shown in bold represent the best (highest) performance across all models and classes for each dataset.
Table 5. Comparison of social distance estimation methods.
DatasetMethodMAEMSERMSE
SmartphoneMetric Depth Estimation0.53000.37990.6163
Homography Transformation0.11160.01890.1376
WebcamMetric Depth Estimation0.24290.10760.3280
Homography Transformation0.13640.04500.2122
Values shown in bold represent the best (lowest) performance across all methods for each dataset.
Table 6. Comparison of SOTA Object Detection Models and CB-OWL-ViT on Kaggle Dataset.
ModelClassmAP@PRF1
0.500.20
YOLOv10m10.89510.91770.900.920.91
00.75140.75140.890.770.83
All0.82320.83460.890.850.87
YOLOv10l10.90420.91340.890.920.91
00.82160.84360.910.850.88
All0.86290.87850.900.890.89
YOLOv12m10.90280.91400.910.920.92
00.78940.78940.910.800.85
All0.84610.85170.910.860.88
YOLOv12l10.89120.89690.910.900.91
00.73610.74600.940.760.84
All0.81360.82150.920.830.87
RT-DETRl10.91530.92980.840.940.89
00.81370.83480.800.850.82
All0.86450.88230.820.900.85
CB-OWL-ViT10.32140.53170.880.580.70
00.24140.27920.390.670.49
All0.28140.40540.640.620.59
Values shown in bold represent the best (highest) performance across all models and classes.
Table 7. Comparison of SOTA Object Detection Models and CB-OWL-ViT on Roboflow Dataset.
ModelClassmAP@PRF1
0.50 0.20
YOLOv10m10.05530.91140.810.930.87
00.30930.68250.910.690.78
All0.18230.79690.860.810.83
YOLOv10l10.05790.90070.840.910.87
00.31540.73830.890.750.81
All0.18660.81950.860.830.84
YOLOv12m10.06560.92670.810.940.87
00.26590.73250.950.730.83
All0.16570.82960.880.840.85
YOLOv12l10.06310.91100.790.940.85
00.24830.68390.970.690.80
All0.15570.79740.880.810.83
RT-DETRl10.06310.91100.790.940.85
00.24830.68390.970.690.80
All0.15570.79740.880.810.83
CB-OWL-ViT10.07800.51980.830.600.70
00.32180.55700.620.810.71
All0.19990.53840.730.710.70
Values shown in bold represent the best (highest) performance across all models and classes.
Table 8. Comparison of SOTA Object Detection Models and CB-OWL-ViT on the smartphone dataset.
ModelClassmAP@PRF1
0.50 0.20
YOLOv10m10.92780.99690.951.000.97
00.54970.83450.950.840.89
All0.73870.91570.950.920.93
YOLOv10l10.91370.99990.991.000.99
00.57700.89280.990.890.94
All0.74540.94640.990.950.97
YOLOv12m10.93391.00000.981.000.99
00.50970.87360.940.880.91
All0.72180.93680.960.940.95
YOLOv12l10.90541.00000.891.000.94
00.53630.79591.000.800.89
All0.72080.89800.940.900.91
RT-DETRl10.92190.99970.921.000.96
00.61690.88210.950.880.92
All0.76940.94090.940.940.94
CB-OWL-ViT10.28840.87031.000.870.93
00.50470.78860.790.990.88
All0.39660.82950.890.930.91
Values shown in bold represent the best (highest) performance across all models and classes.
Table 9. Comparison of SOTA Object Detection Models and CB-OWL-ViT on the webcam dataset.
ModelClassmAP@PRF1
0.50 0.20
YOLOv10m10.50480.99090.970.990.98
00.67200.67200.970.670.80
All0.58840.83140.970.830.89
YOLOv10l10.53710.99100.990.990.99
00.78750.82010.990.820.90
All0.66230.90550.990.910.94
YOLOv12m10.51950.98650.990.990.99
00.72560.79410.980.790.88
All0.62250.89030.980.890.93
YOLOv12l10.55750.99100.970.990.98
00.67520.68460.950.690.80
All0.61640.83780.960.840.89
RT-DETRl10.56190.99520.941.000.97
00.78430.79360.940.790.86
All0.67310.89440.940.900.91
CB-OWL-ViT10.54780.67610.970.690.81
00.82710.86050.700.980.82
All0.68750.76830.830.840.81
Values shown in bold represent the best (highest) performance across all models and classes.
Table 10. Comparison of SOTA Models and CB-OWL-ViT on all datasets.
DatestModelClassmAP@PRF1
0.50 0.20
KaggleResNet50 +
DSFD [34]
10.58390.72160.770.880.82
00.42700.47940.750.620.68
All0.50550.60050.760.750.75
MobileNetV2 +
DSFD [8]
10.55910.68430.740.860.79
00.28850.30130.630.470.54
All0.42380.49280.690.660.67
CB-OWL-ViT10.32140.53170.880.580.70
00.24140.27920.390.670.49
All0.28140.40540.640.620.59
RoboflowResNet50 +
DSFD [34]
10.09850.71700.740.920.82
00.35660.69650.860.780.82
All0.22750.70670.800.850.82
MobileNetV2 +
DSFD [8]
10.09530.69520.720.900.80
00.36050.65550.830.760.80
All0.22790.67540.780.830.80
CB-OWL-ViT10.07800.51980.830.600.70
00.32180.55700.620.810.71
All0.19990.53840.730.710.70
SmartphoneResNet50 +
DSFD [34]
10.95780.96080.931.000.96
00.55100.78610.900.880.89
All0.75440.87350.910.940.93
MobileNetV2 +
DSFD [8]
10.99350.99650.991.001.00
00.63060.90230.910.990.95
All0.81210.94940.951.000.97
CB-OWL-ViT10.28840.87031.000.870.93
00.50470.78860.790.990.88
All0.39660.82950.890.930.91
WebcamResNet50 +
DSFD [34]
10.26300.58140.561.000.72
00.30500.30900.950.310.46
All0.28400.44320.760.650.59
MobileNetV2 +
DSFD [8]
10.45110.88670.950.890.92
00.88090.90280.850.960.90
All0.66600.89470.900.930.91
CB-OWL-ViT10.54780.67610.970.690.81
00.82710.86050.700.980.82
All0.68750.76830.830.840.81
Values shown in bold represent the best (highest) performance across all models and classes for each dataset.
Table 11. Comparison of social distance estimation methods (This is the same Table 5 with a new method added.).
DatasetMethodMAEMSERMSE
SmartphoneMetric Depth Estimation0.53000.37990.6163
Homography Transformation0.11160.01890.1376
Fixed Human Height [33]0.72750.65550.8096
WebcamMetric Depth Estimation-Based0.24290.10760.3280
Homography Transformation0.13640.04500.2122
Fixed Human Height [33]0.92311.31251.1456
Values shown in bold represent the best (lowest) performance across all methods for each dataset.
Table 12. Comparison of models in terms of the number of parameters, model size, and inference time.
ModelNumber of ParametersModel Size (MB)Inference Time (ms/img)
MobileNetV2 + DSFD [8]132,803,175608.45545
YOLOv8n3,011,2385.9425
ResNet50 + DSFD [34]160,424,359932.06768
CB-OWL-ViT153,231,879584.5380
Table 13. Evaluation results for CB-OWL-ViT, OWL-ViT, and YOLO-World across datasets (This is the same Table 4 with results for YOLO-World added.).
DatestModelClassmAP@PRF1
0.50 0.20
KaggleCB-OWL-ViT10.32140.53170.880.580.70
00.24140.27920.390.670.49
All0.28140.40540.640.620.59
OWL-ViT10.38070.46930.660.560.61
00.21800.23160.100.910.17
All0.29940.35040.380.730.39
YOLO-World10.3350.4130.580.490.53
00.1920.2040.090.800.16
All0.2650.3080.340.640.35
RoboflowCB-OWL-ViT10.07800.51980.830.600.70
00.32180.55700.620.810.71
All0.19990.53840.730.710.70
OWL-ViT10.05800.39760.530.530.53
00.41310.60640.200.980.33
All0.23560.50200.360.750.43
YOLO-World10.0510.3500.470.470.47
00.3640.5320.180.860.29
All0.2080.4410.320.660.38
SmartphoneCB-OWL-ViT10.28840.87031.000.870.93
00.50470.78860.790.990.88
All0.39660.82950.890.930.91
OWL-ViT10.58460.64070.940.650.77
00.37750.50680.491.000.65
All0.48110.57370.710.820.71
YOLO-World10.5140.5650.830.570.67
00.3320.4460.430.880.54
All0.4230.5060.630.730.64
WebcamCB-OWL-ViT10.54780.67610.970.690.81
00.82710.86050.700.980.82
All0.68750.76830.830.840.81
OWL-ViT10.32810.37160.940.370.53
00.56220.59320.551.000.71
All0.44520.48240.750.680.62
YOLO-World10.2900.3270.830.330.47
00.4950.5220.480.880.60
All0.3920.4250.650.610.54
Values shown in bold represent the best (highest) performance across all models and classes for each dataset. YOLO-World results are approximately 10–15% lower than OWL-ViT.
Disclaimer/Publisher’s Note: The statements, opinions and data contained in all publications are solely those of the individual author(s) and contributor(s) and not of MDPI and/or the editor(s). MDPI and/or the editor(s) disclaim responsibility for any injury to people or property resulting from any ideas, methods, instructions or products referred to in the content.