Author Contributions
Conceptualization, J.A.; Methodology, J.A.; Software, J.A. and S.D.; Validation, M.M., M.S. and G.D.; Formal analysis, J.A.; Investigation, J.A.; Resources, M.M. and S.D.; Data curation, J.A.; Writing—original draft, J.A.; Writing—review & editing, M.M., S.D., M.S. and G.D.; Visualization, J.A.; Supervision, M.S. and G.D.; Project administration, M.S. and G.D.; Funding acquisition, G.D. All authors have read and agreed to the published version of the manuscript.
Figure 1.
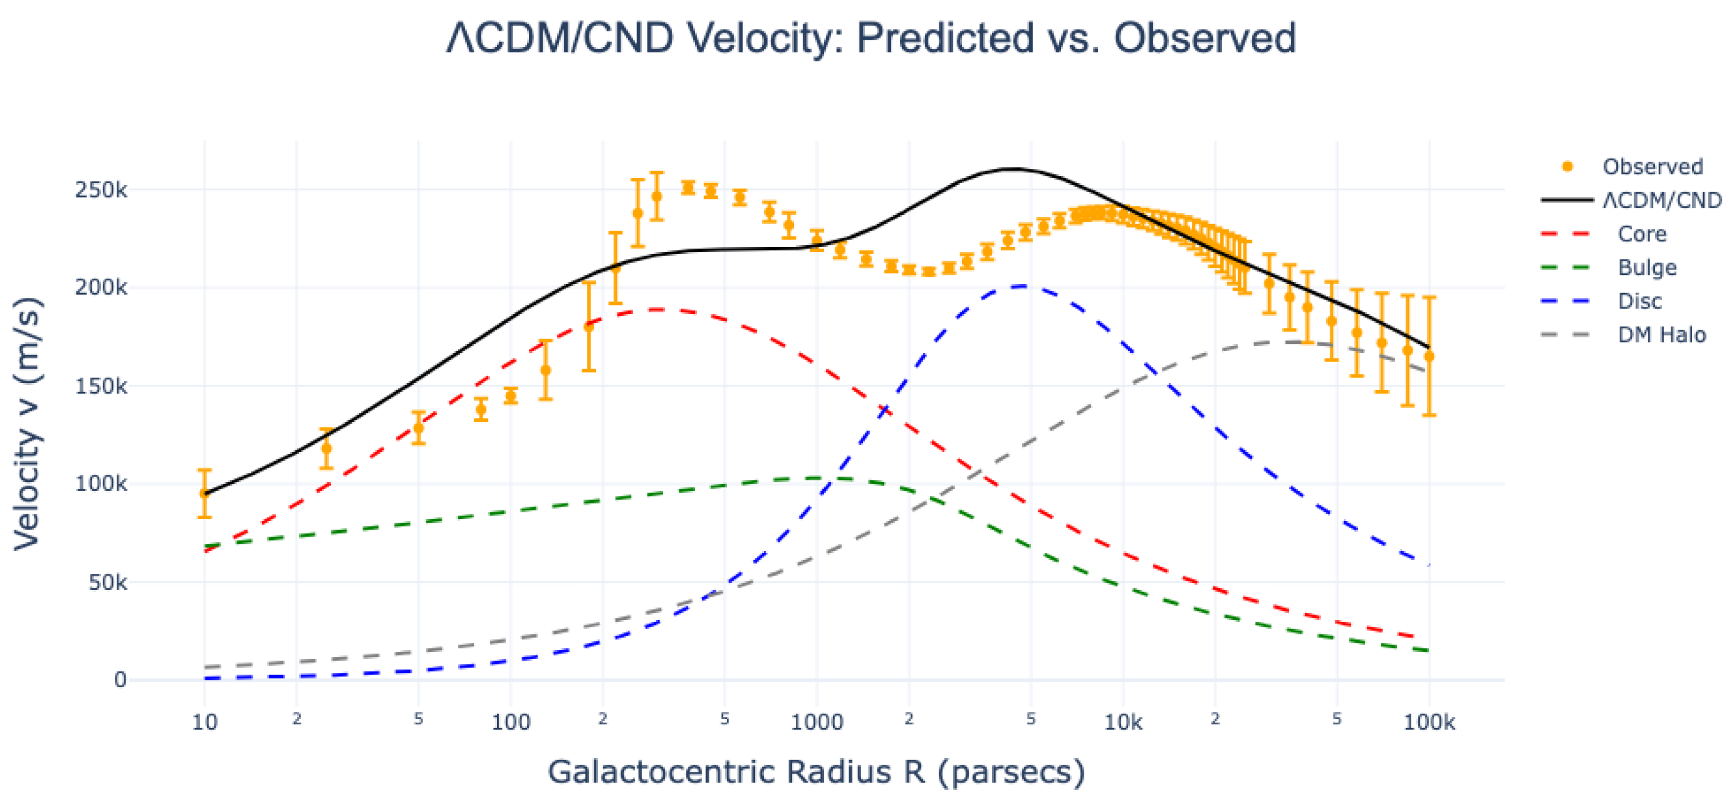
Predictions of the modified MWPotential2014 model consisting in three baryonic components and a dark matter halo compared to a curated set of observed velocity values of the Milky Way.
Figure 1.
Predictions of the modified MWPotential2014 model consisting in three baryonic components and a dark matter halo compared to a curated set of observed velocity values of the Milky Way.
Figure 2.
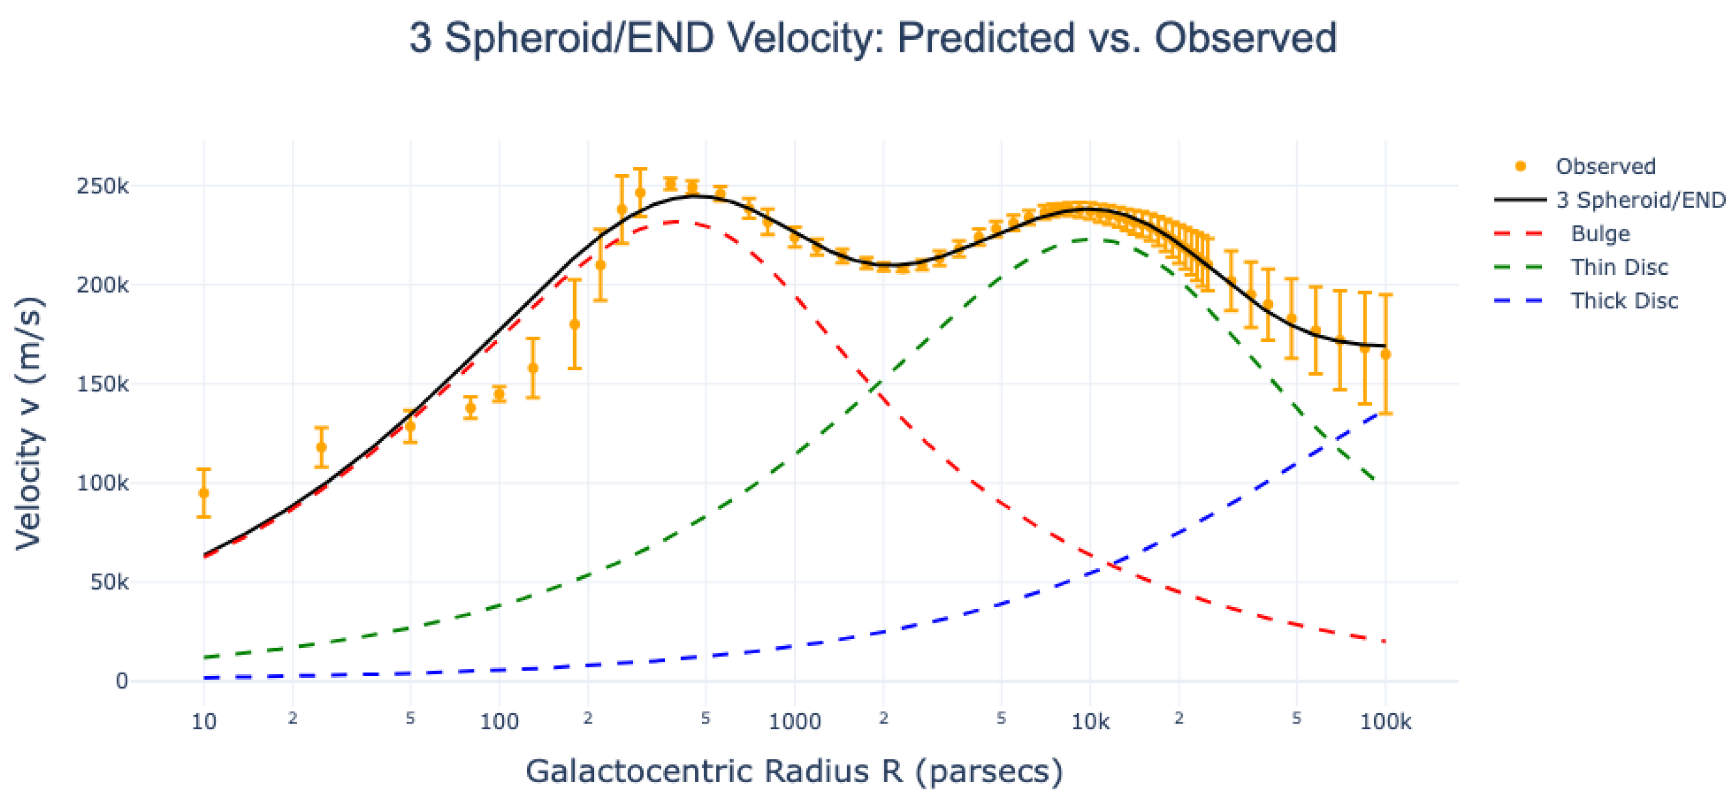
Predictions of the three-spheroid model consisting in three exclusively baryonic components compared to a curated set of observed velocity values of the Milky Way.
Figure 2.
Predictions of the three-spheroid model consisting in three exclusively baryonic components compared to a curated set of observed velocity values of the Milky Way.
Figure 3.
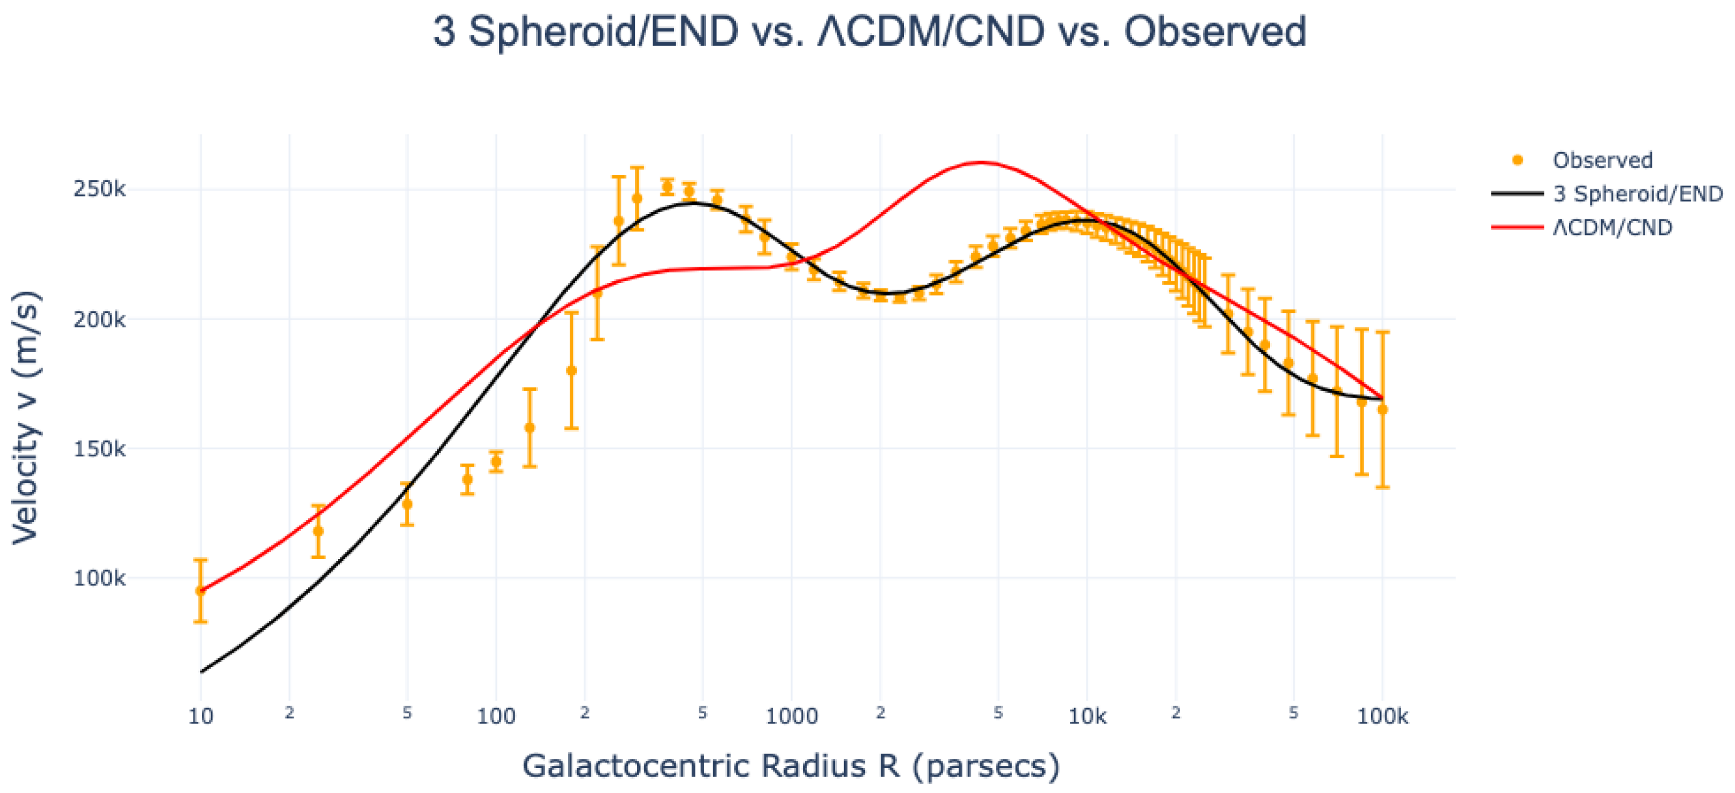
Prediction comparison between the MWPotential2014 and three-spheroid models with their respective frameworks.
Figure 3.
Prediction comparison between the MWPotential2014 and three-spheroid models with their respective frameworks.
Figure 4.
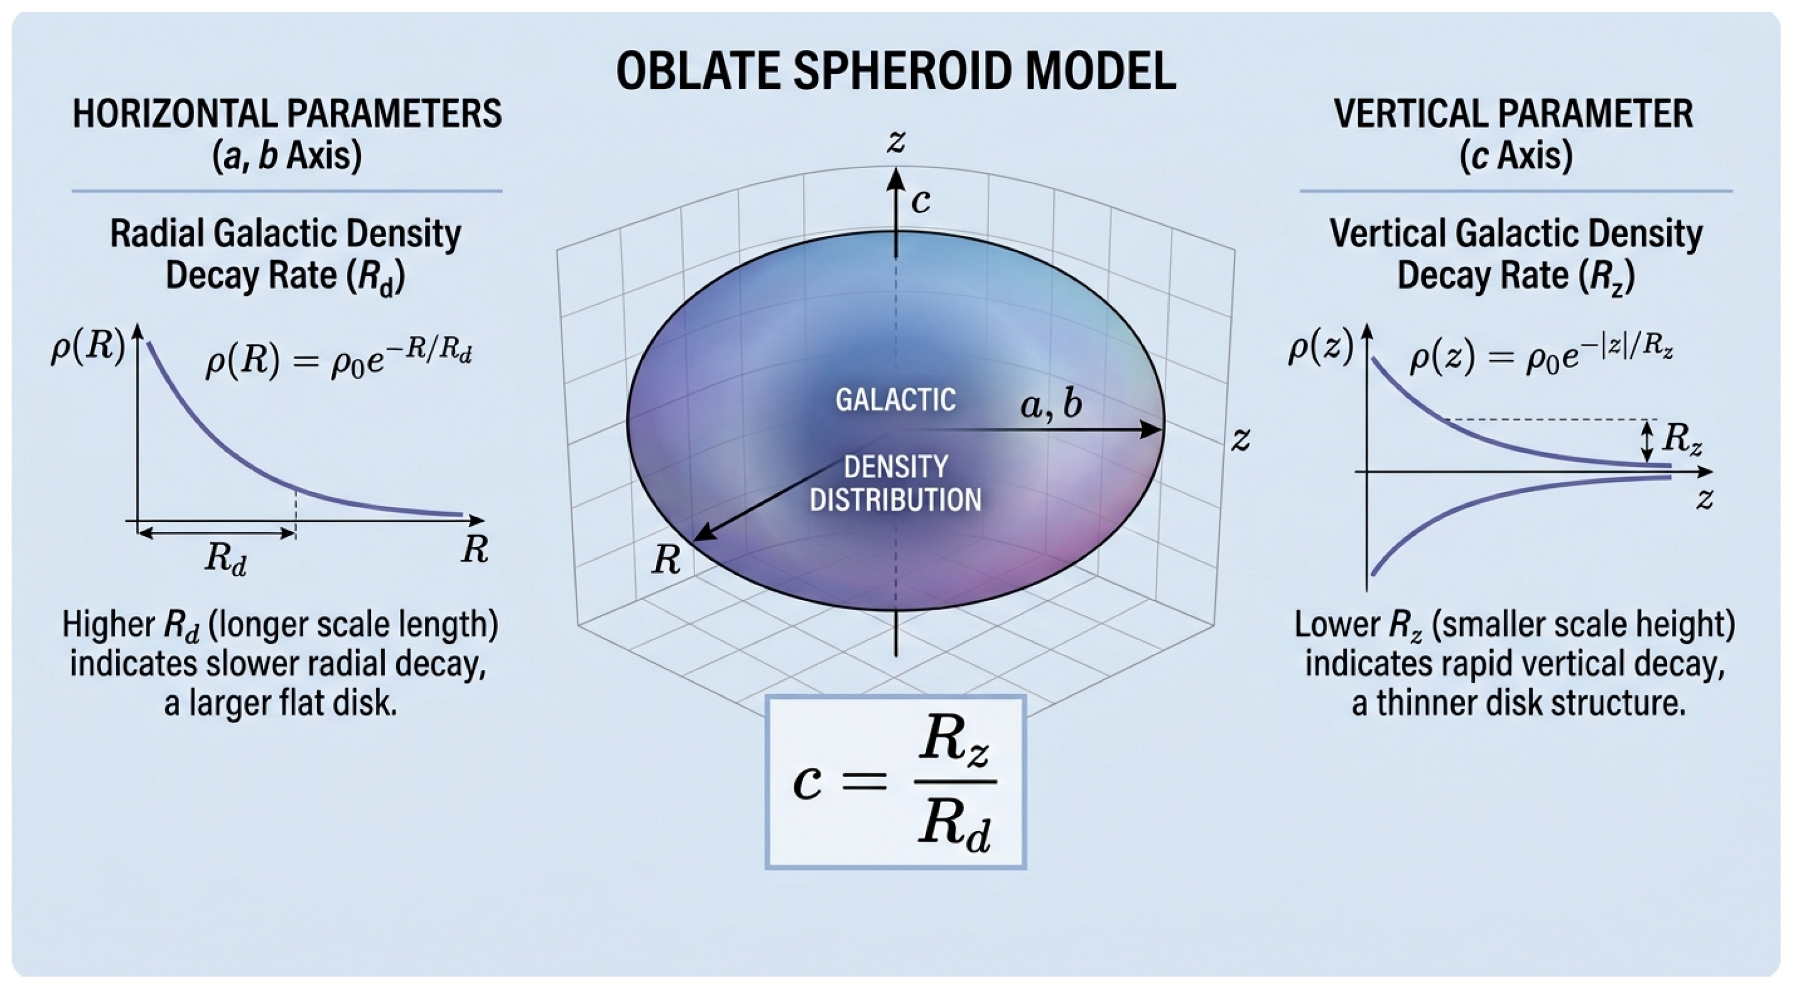
The oblate spheroid shape (c) is determined by the ratio of vertical () to horizontal () density decay rates.
Figure 4.
The oblate spheroid shape (c) is determined by the ratio of vertical () to horizontal () density decay rates.
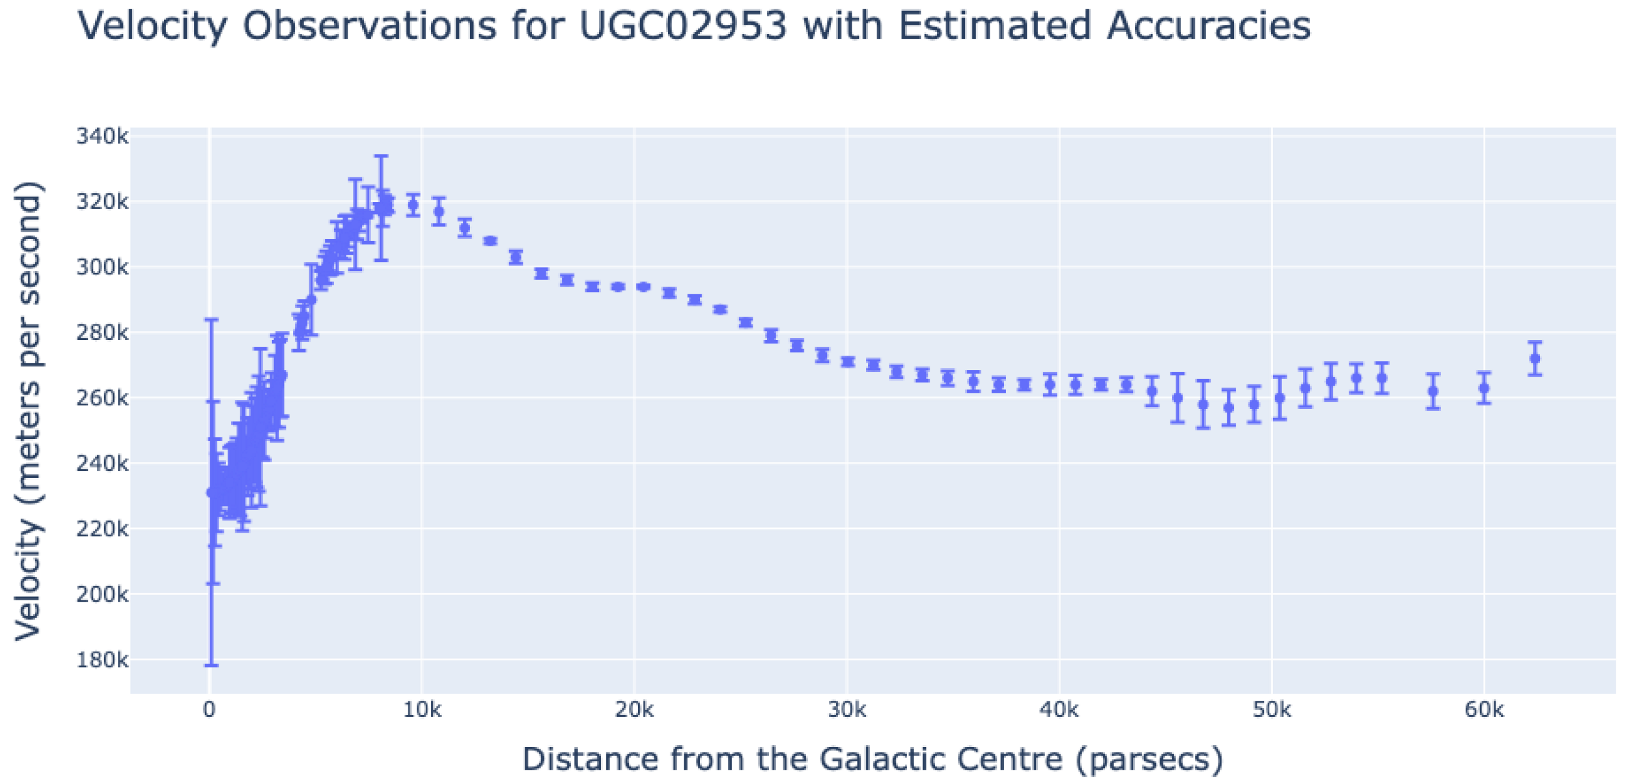
Figure 5.
Observed orbital velocities of galaxy UGC 2935 shown along with their corresponding uncertainties .
Figure 5.
Observed orbital velocities of galaxy UGC 2935 shown along with their corresponding uncertainties .
Figure 6.
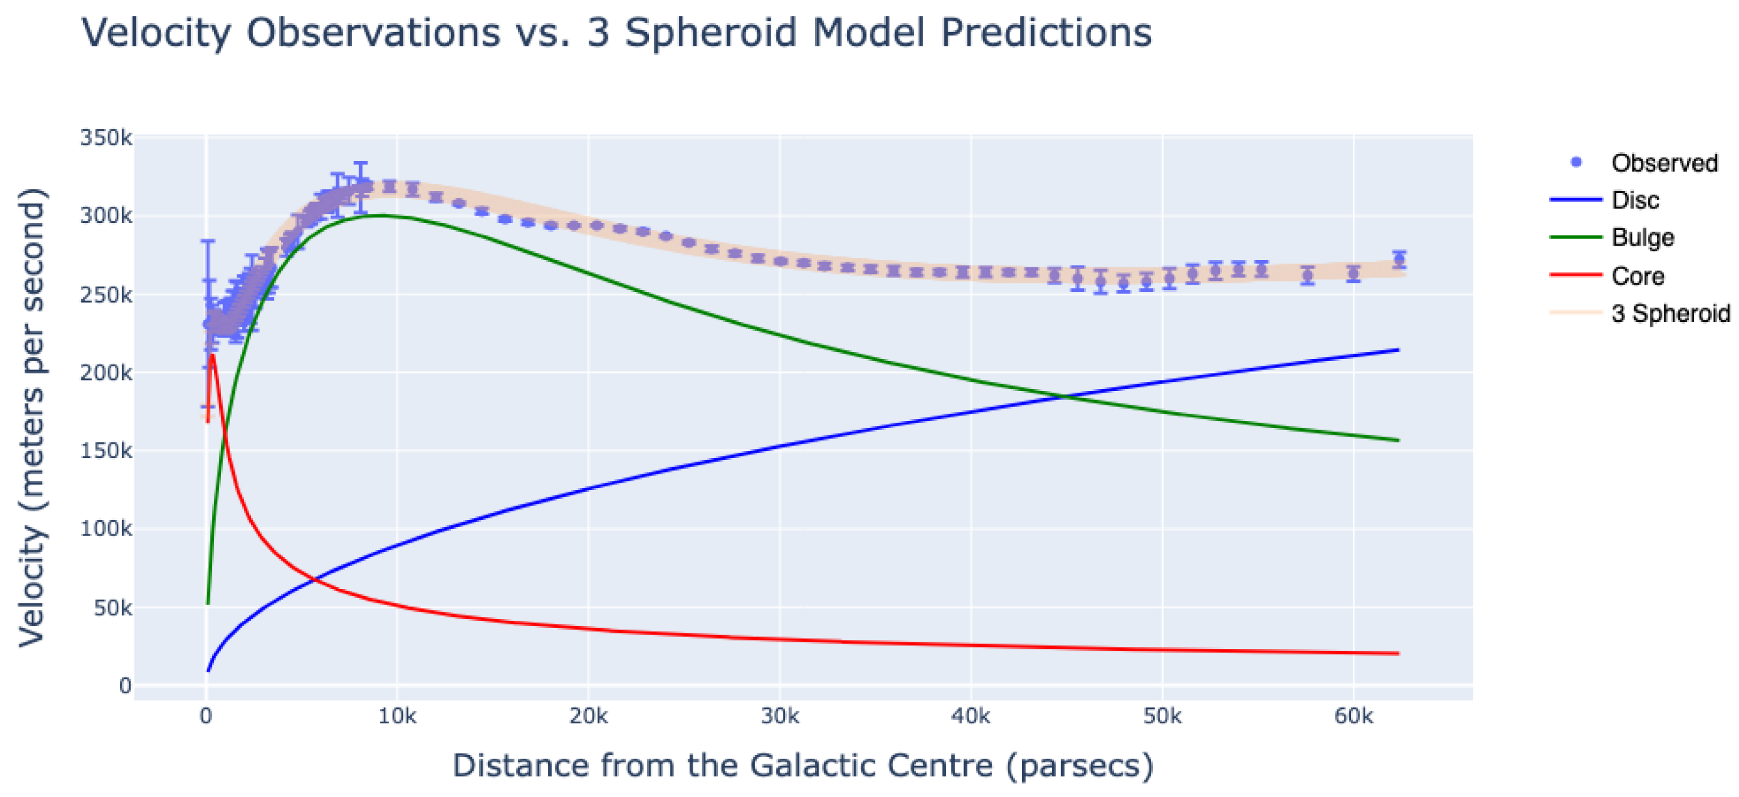
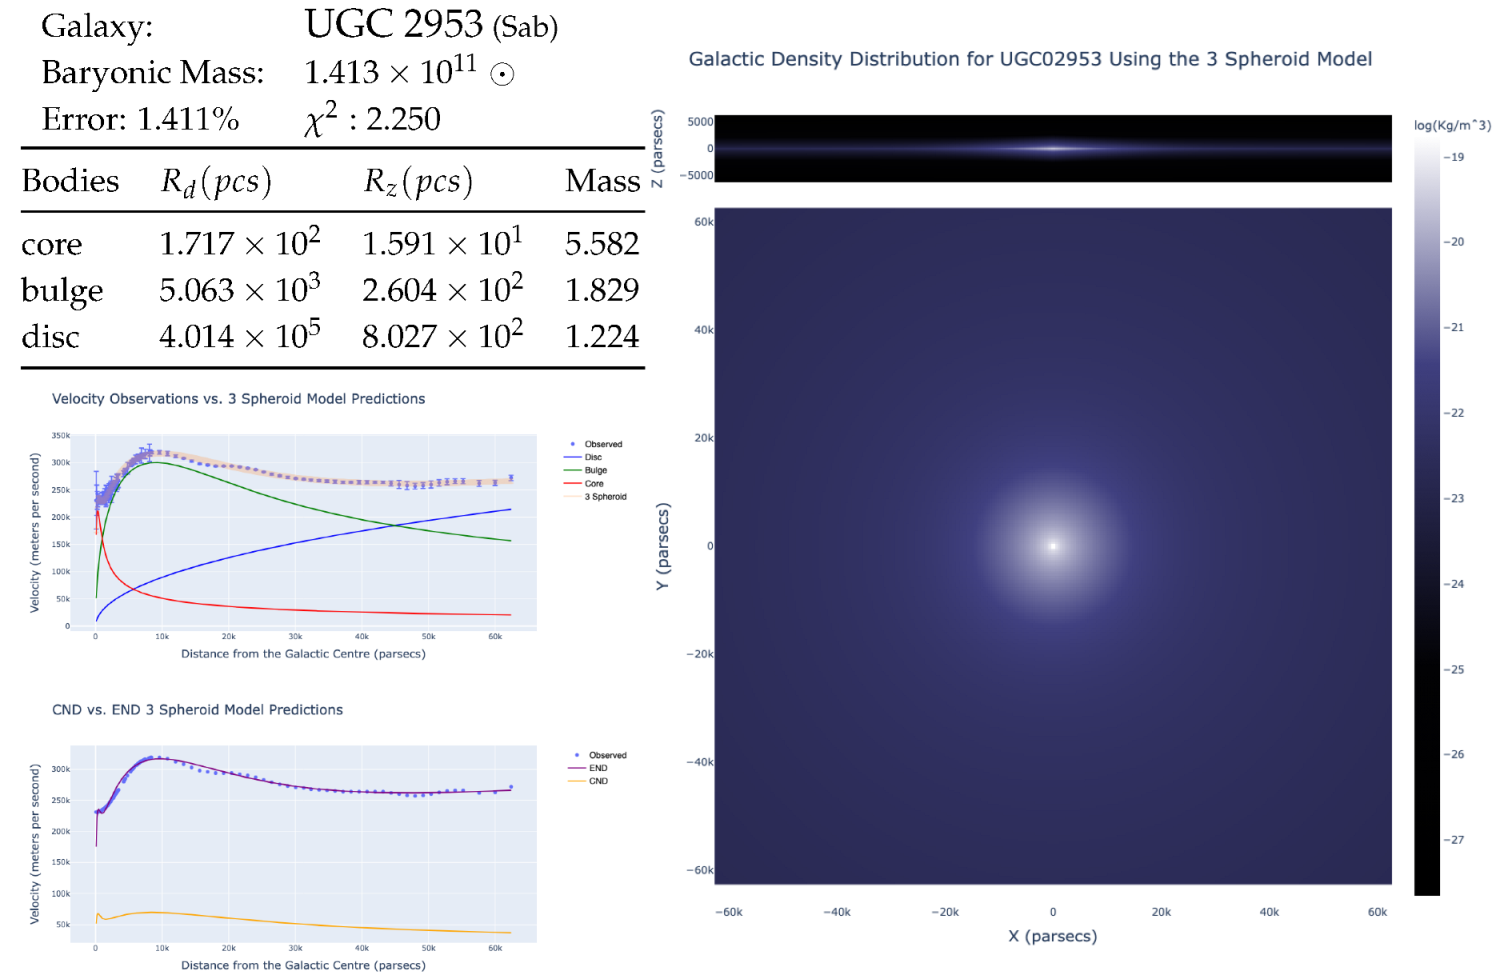
Accurate observed velocity points for galaxy UGC 2953 plotted against the individual contributions of each spheroid and the combined model (orange line). Thickness indicates average error in the prediction. Contributions from each one of the spheroids shown in red, green and blue lines.
Figure 6.
Accurate observed velocity points for galaxy UGC 2953 plotted against the individual contributions of each spheroid and the combined model (orange line). Thickness indicates average error in the prediction. Contributions from each one of the spheroids shown in red, green and blue lines.
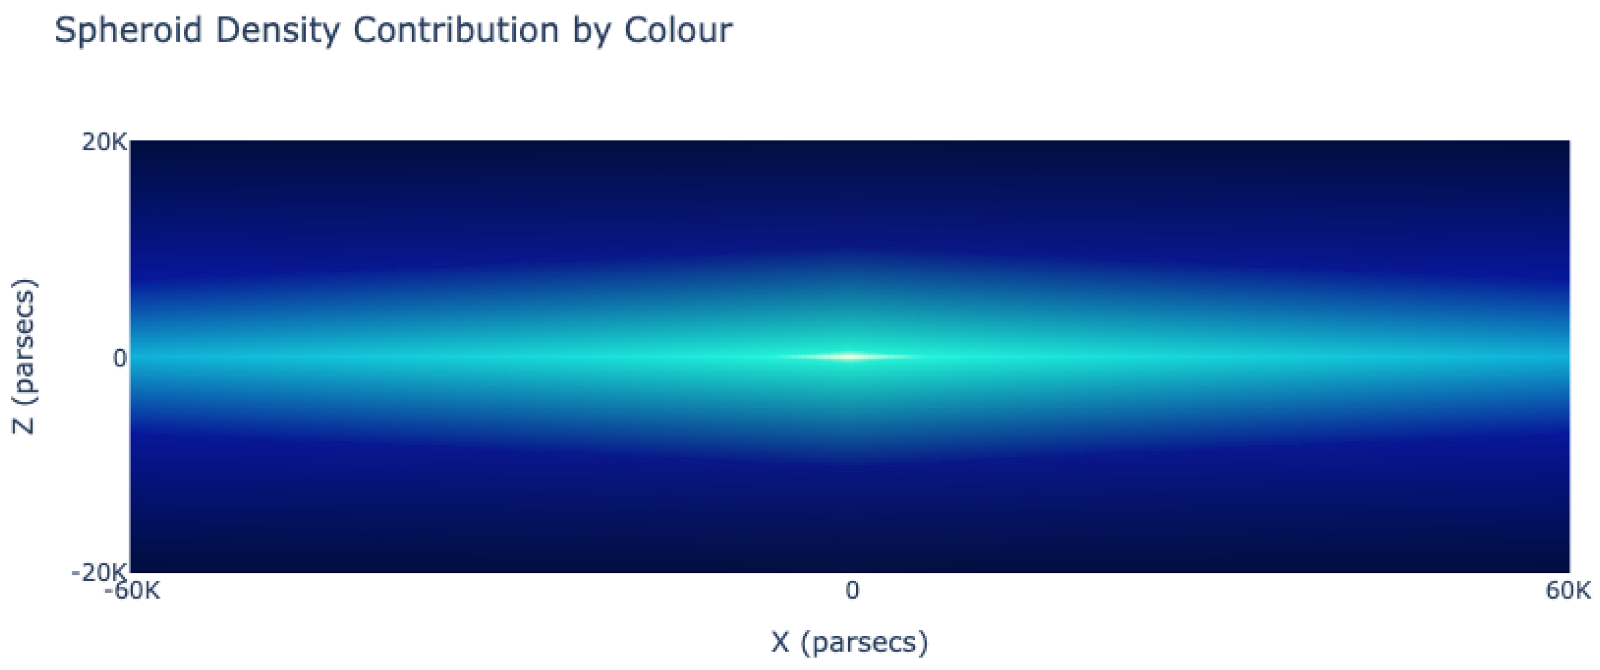
Figure 7.
A representation of the influence of each spheroid in the density distribution of galaxy UGC 2953. Whiter areas reflect the combination of the three-spheroids. Greenish reflect bulge influence. Bluish reflect disc influence.
Figure 7.
A representation of the influence of each spheroid in the density distribution of galaxy UGC 2953. Whiter areas reflect the combination of the three-spheroids. Greenish reflect bulge influence. Bluish reflect disc influence.
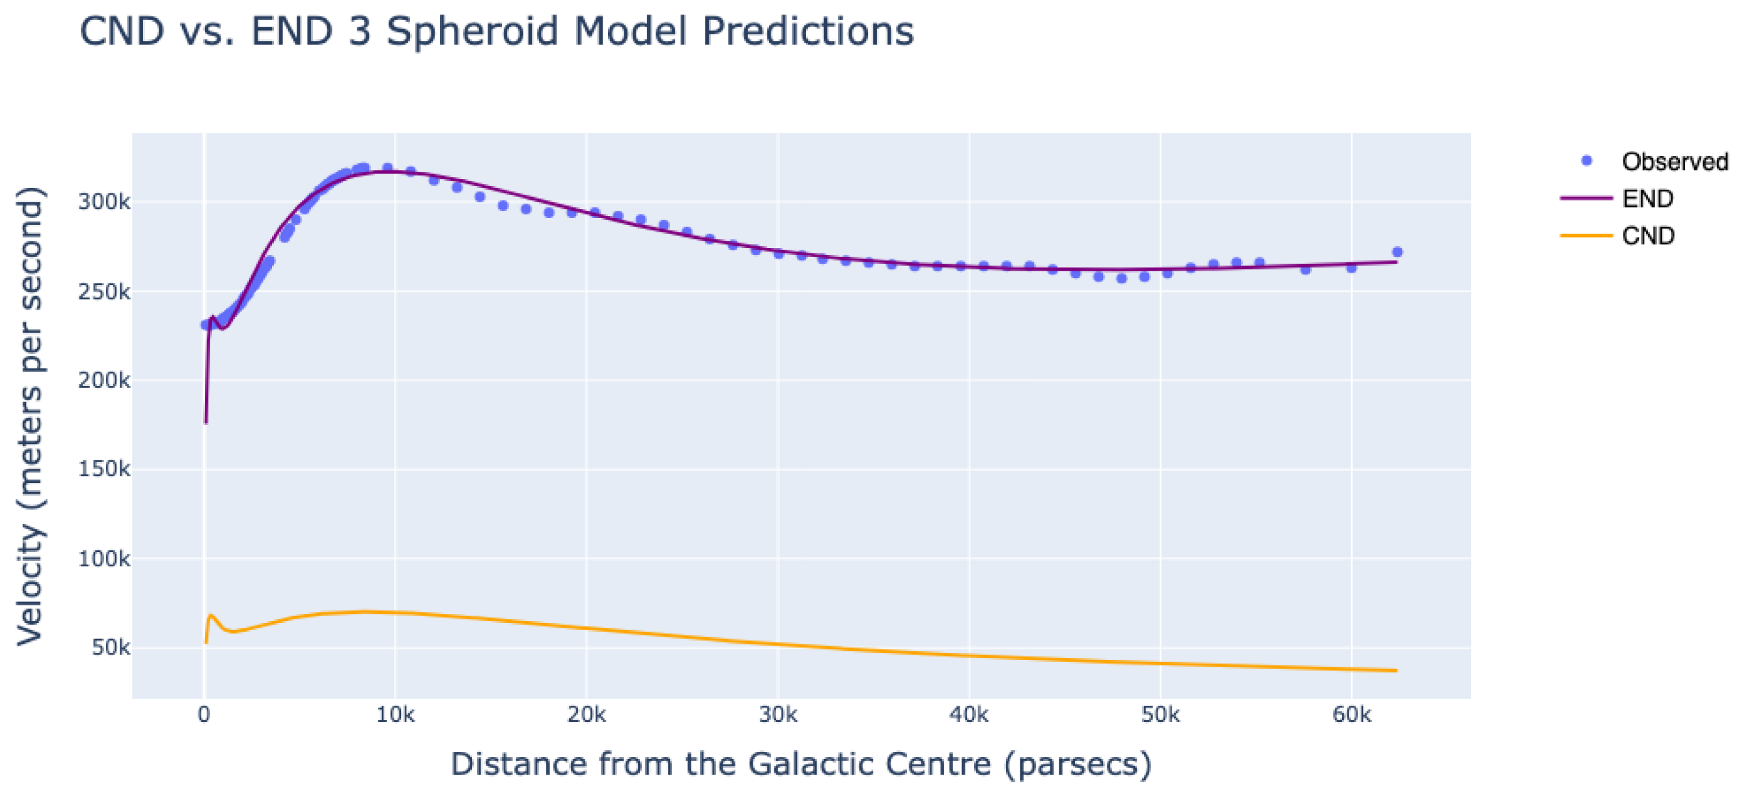
Figure 8.
Rotational velocity prediction comparison between END and CND frameworks for the same three-spheroid model of galaxy UGC 2953. Classic Newtonian predictions only account for about 20% of the observed rotational velocity.
Figure 8.
Rotational velocity prediction comparison between END and CND frameworks for the same three-spheroid model of galaxy UGC 2953. Classic Newtonian predictions only account for about 20% of the observed rotational velocity.
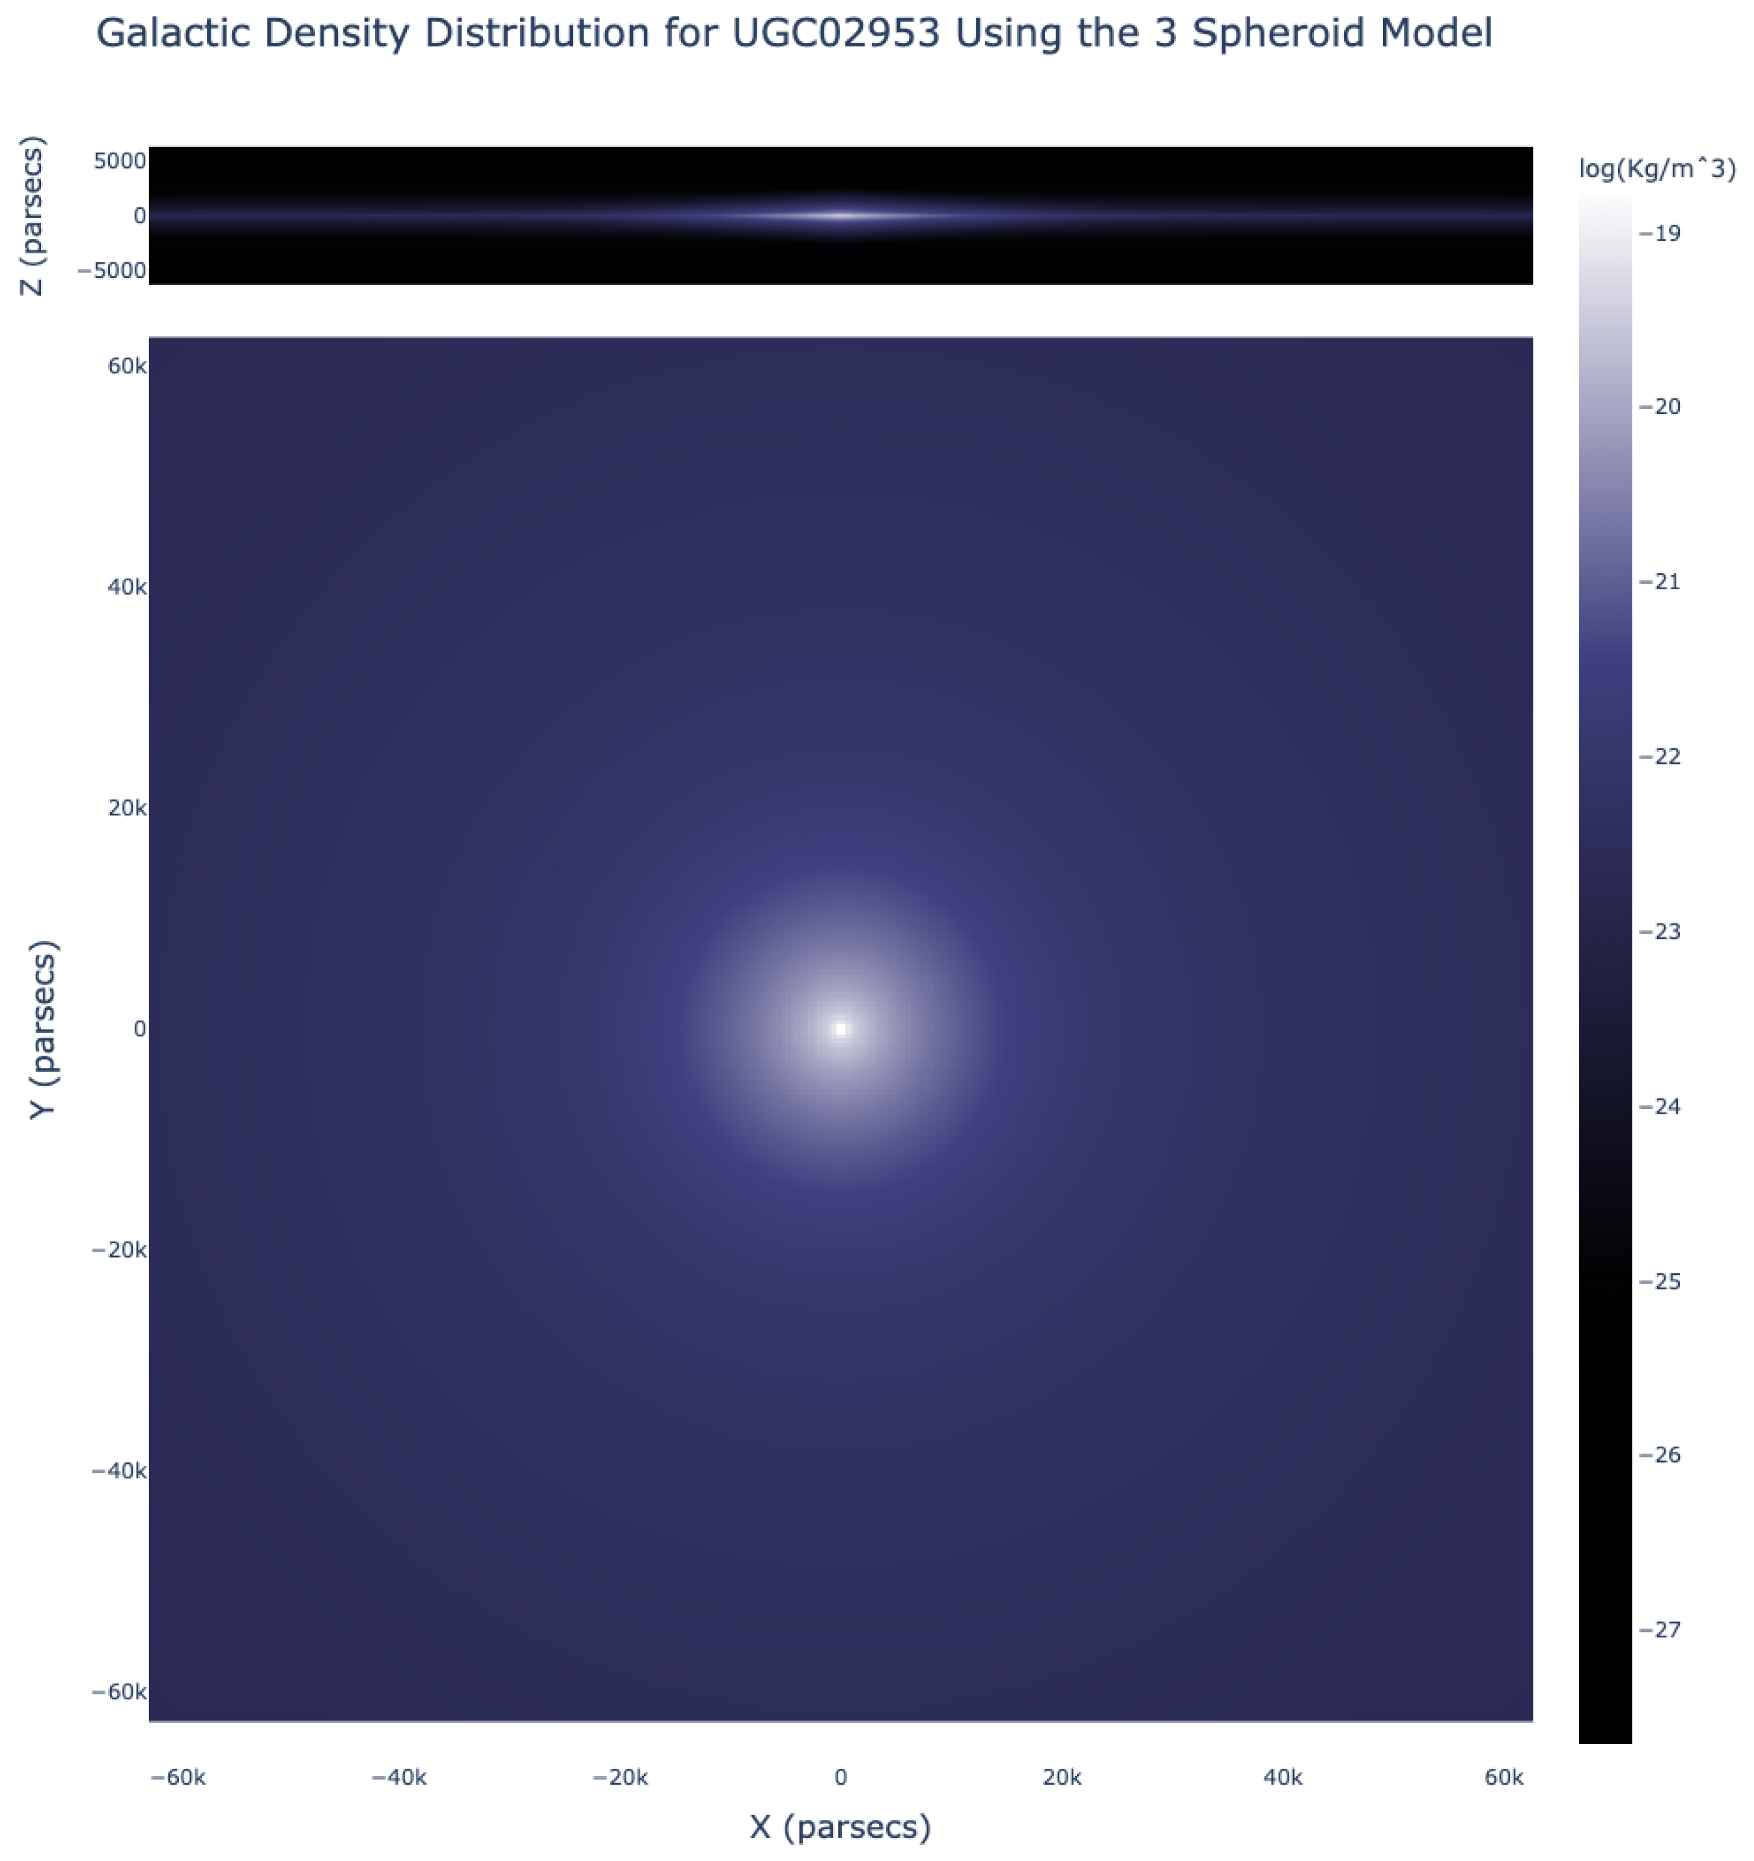
Figure 9.
Three-spheroid model galactic density distribution prediction for UGC 2953. X-Z axis on top. X-Y axis on bottom.
Figure 9.
Three-spheroid model galactic density distribution prediction for UGC 2953. X-Z axis on top. X-Y axis on bottom.
Figure 10.
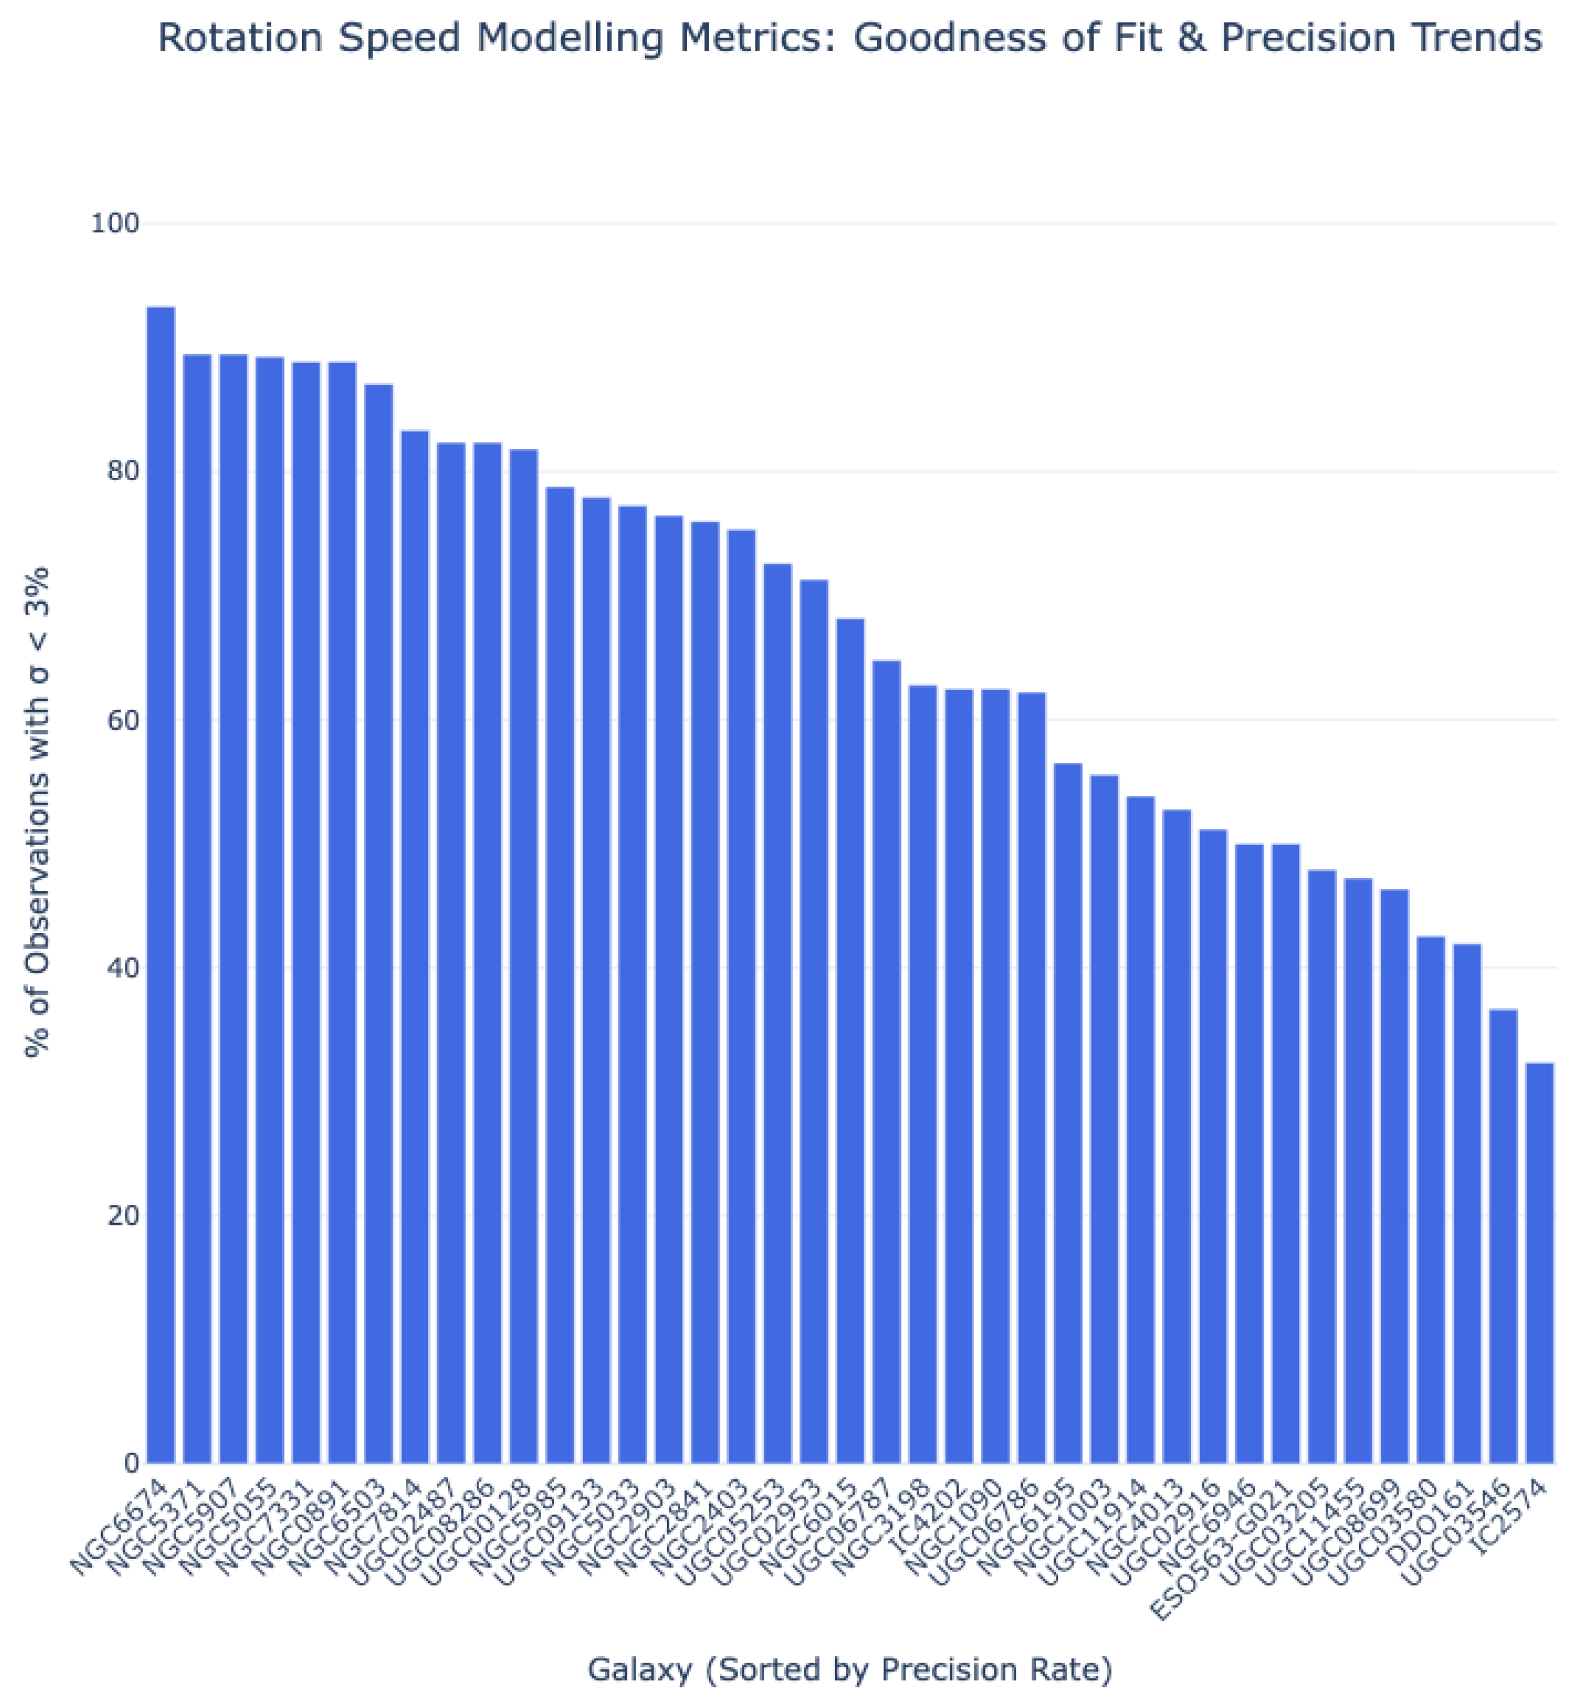
Percentage of accurate data points for the set of galaxies studied.
Figure 10.
Percentage of accurate data points for the set of galaxies studied.
Figure 11.
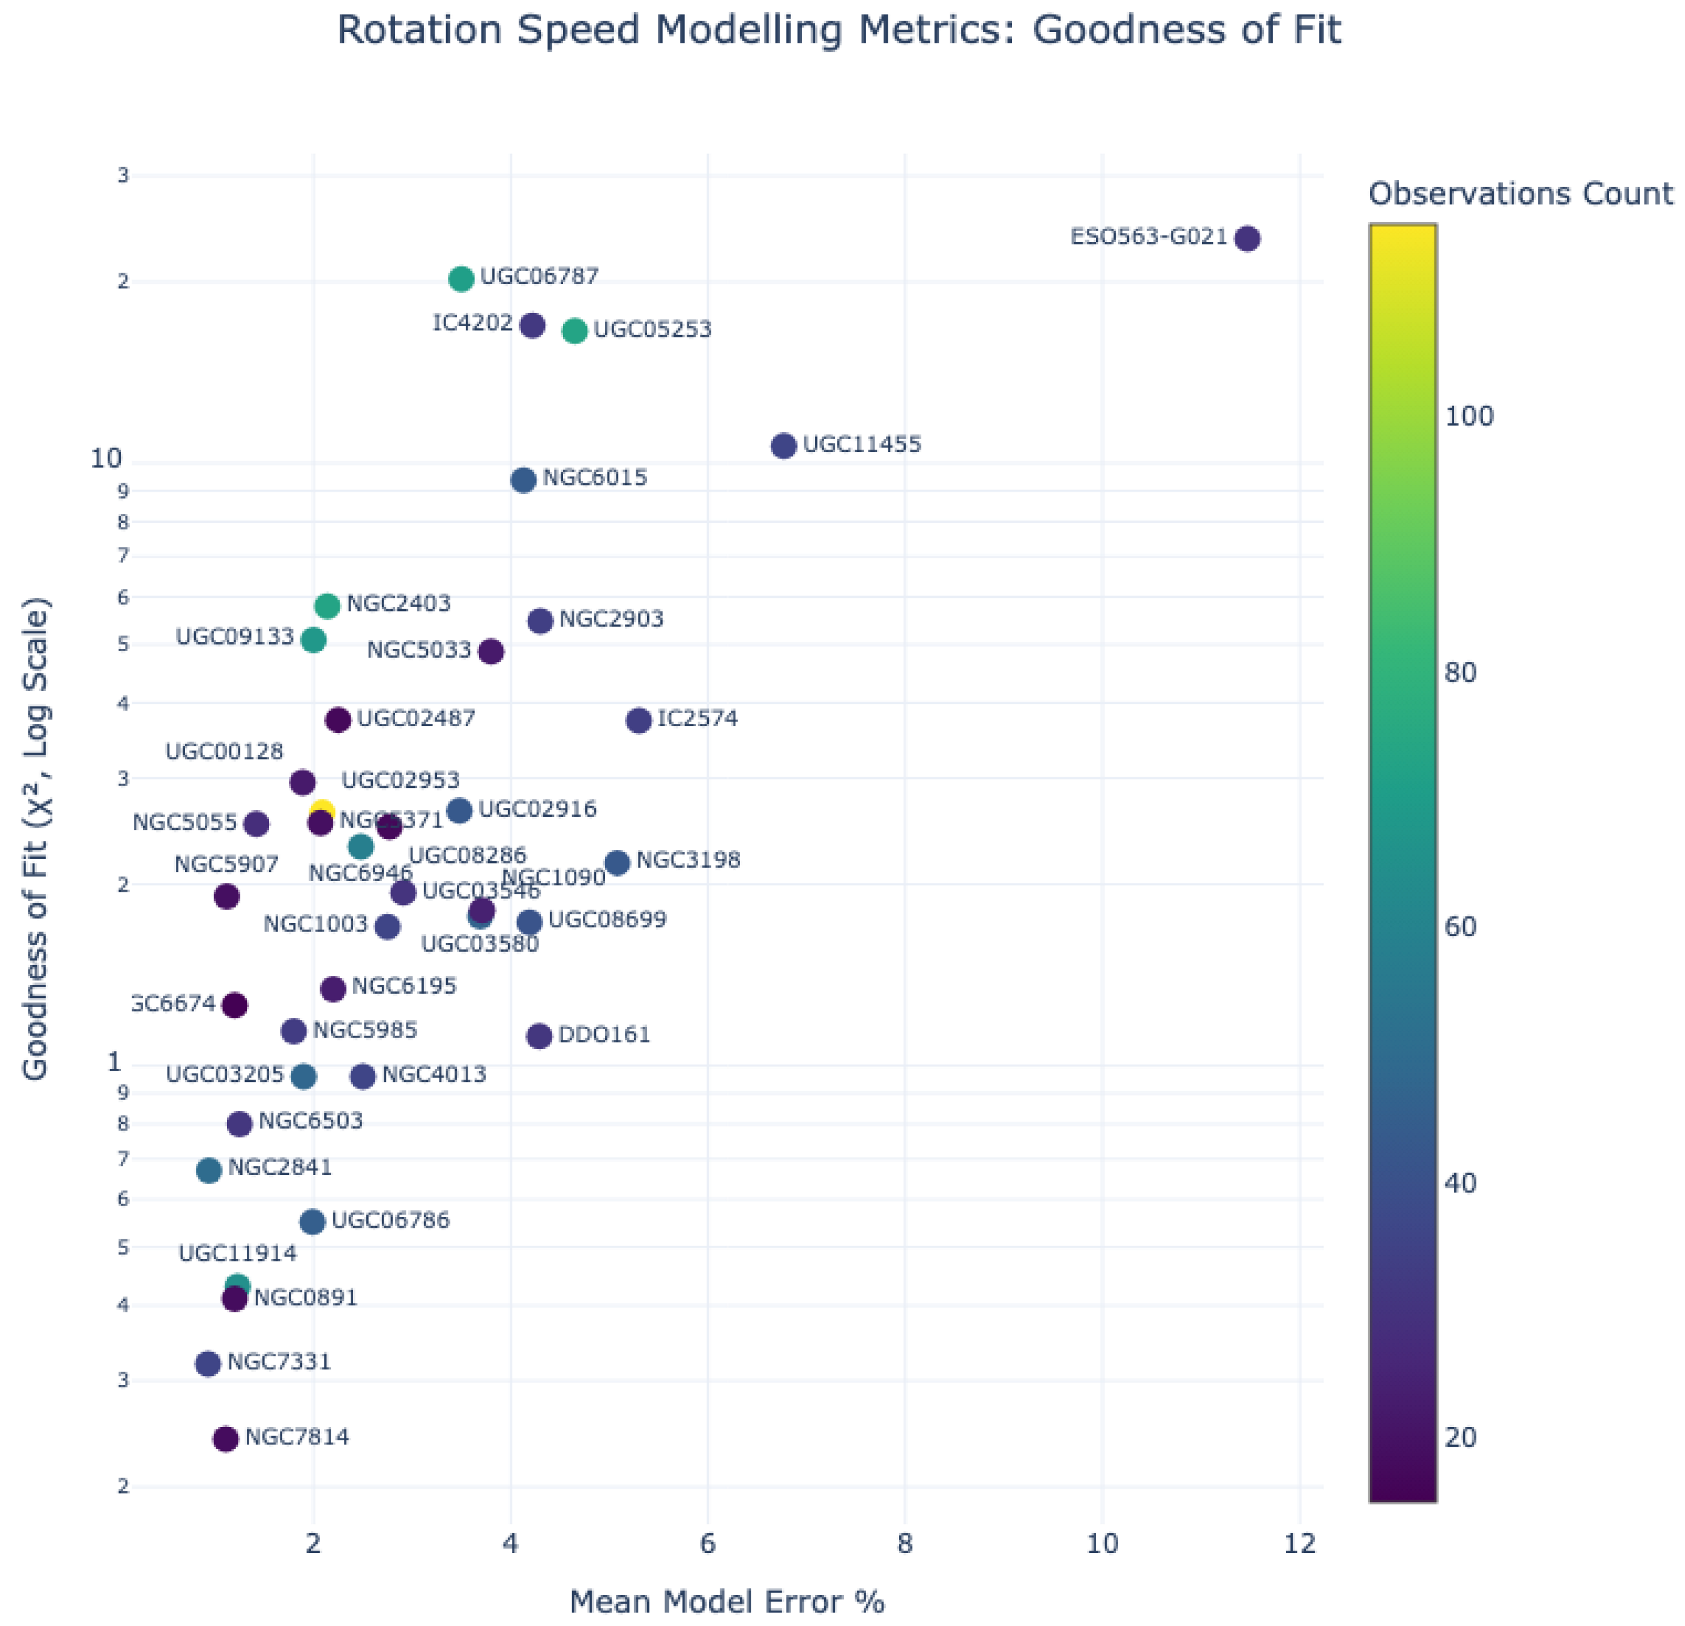
Mean error percentage against . The colour scale represents the amount of data points available for each galaxy. There is no clear correlation between the available datapoints and the goodness of fit.
Figure 11.
Mean error percentage against . The colour scale represents the amount of data points available for each galaxy. There is no clear correlation between the available datapoints and the goodness of fit.
Figure 12.
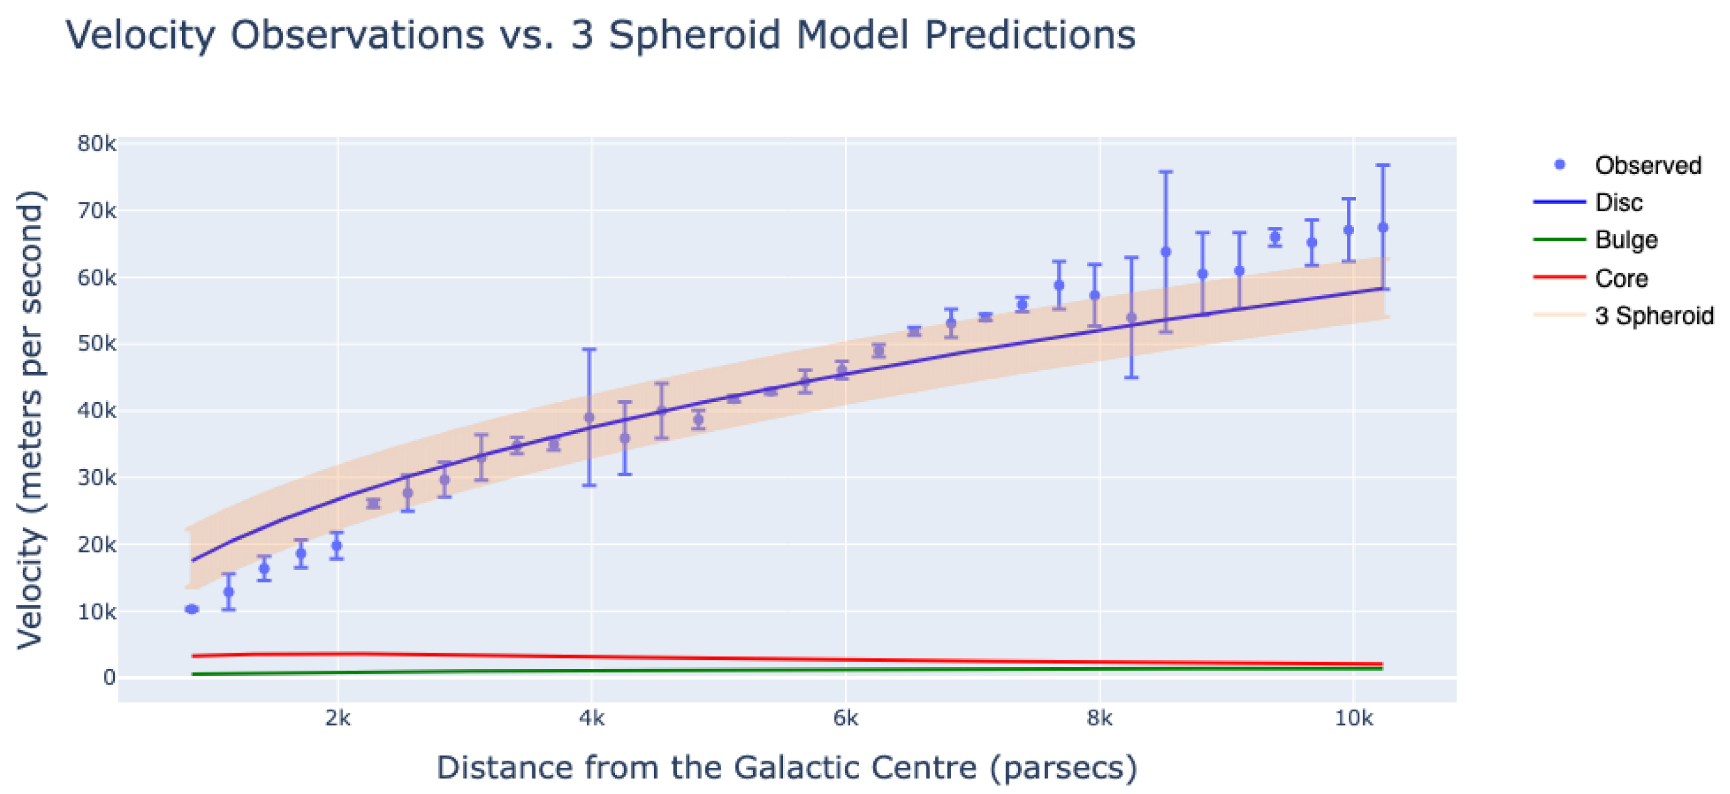
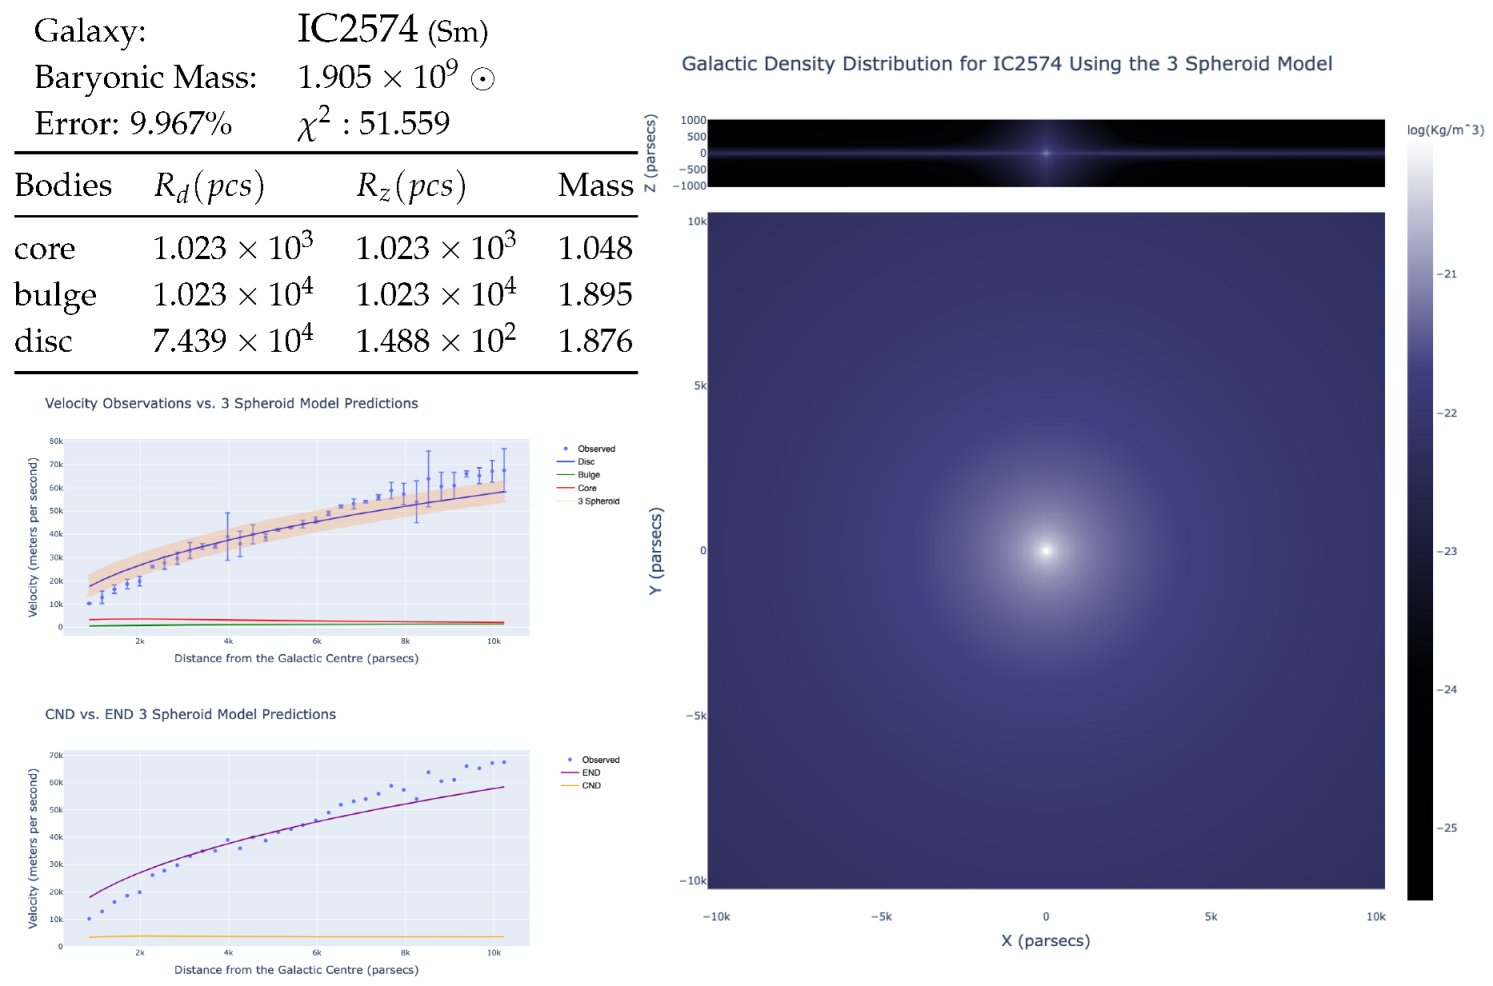
The almost linear distribution of velocity data points in IC 2574 implies a flat density distribution along its disc, causing the exponential decay assumption of the oblate spheroid model to struggle to find a fit.
Figure 12.
The almost linear distribution of velocity data points in IC 2574 implies a flat density distribution along its disc, causing the exponential decay assumption of the oblate spheroid model to struggle to find a fit.
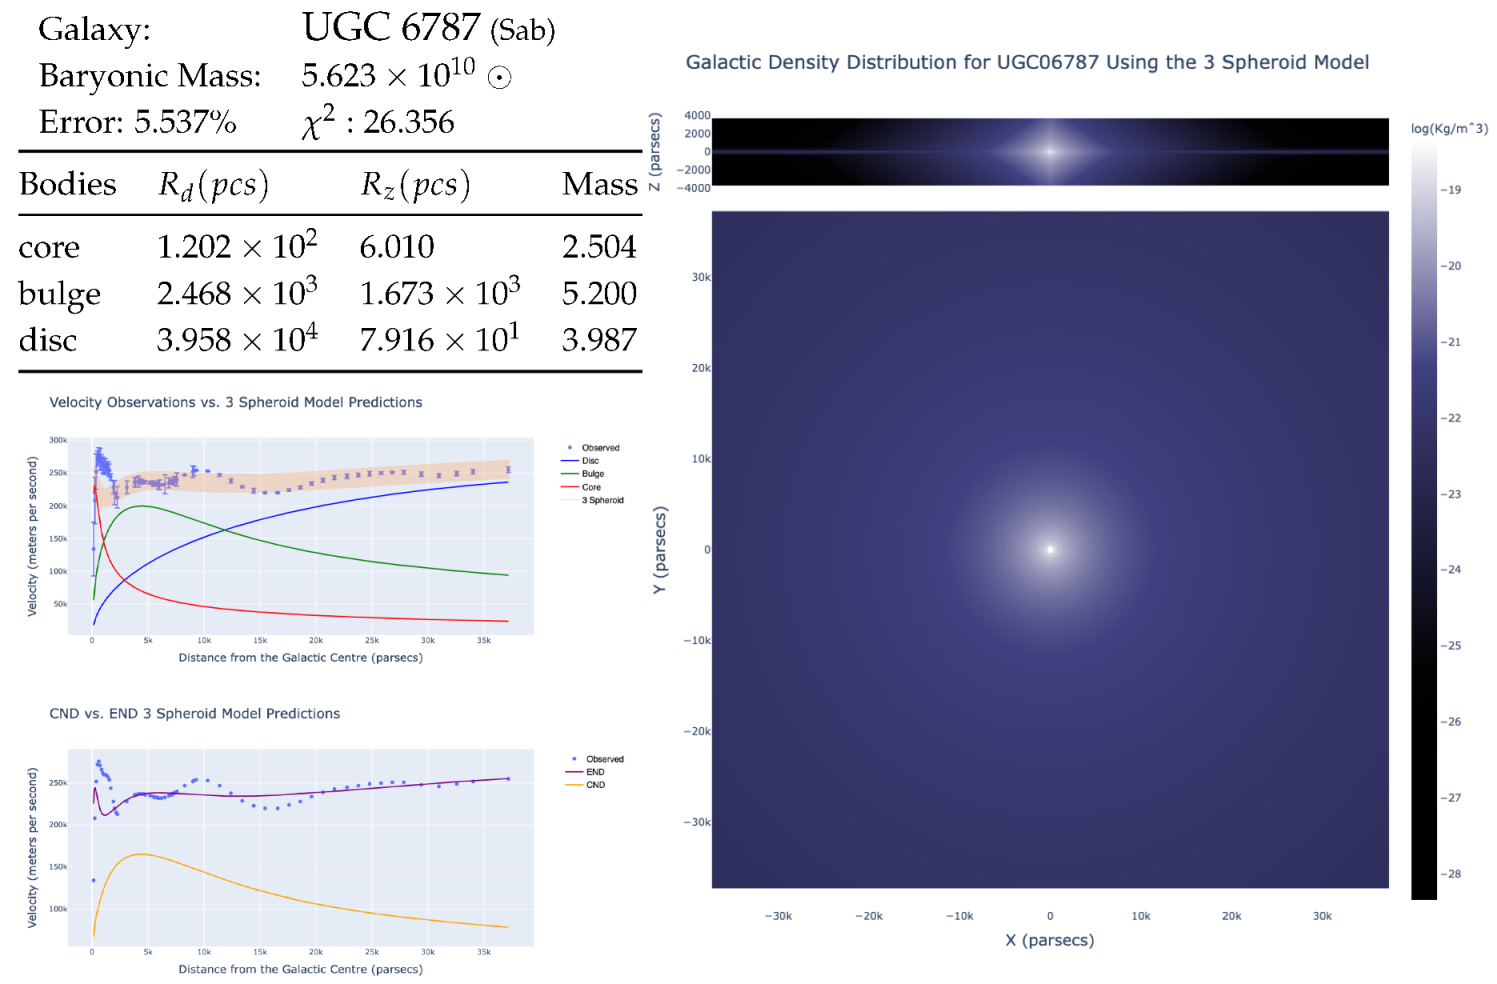
Figure 13.
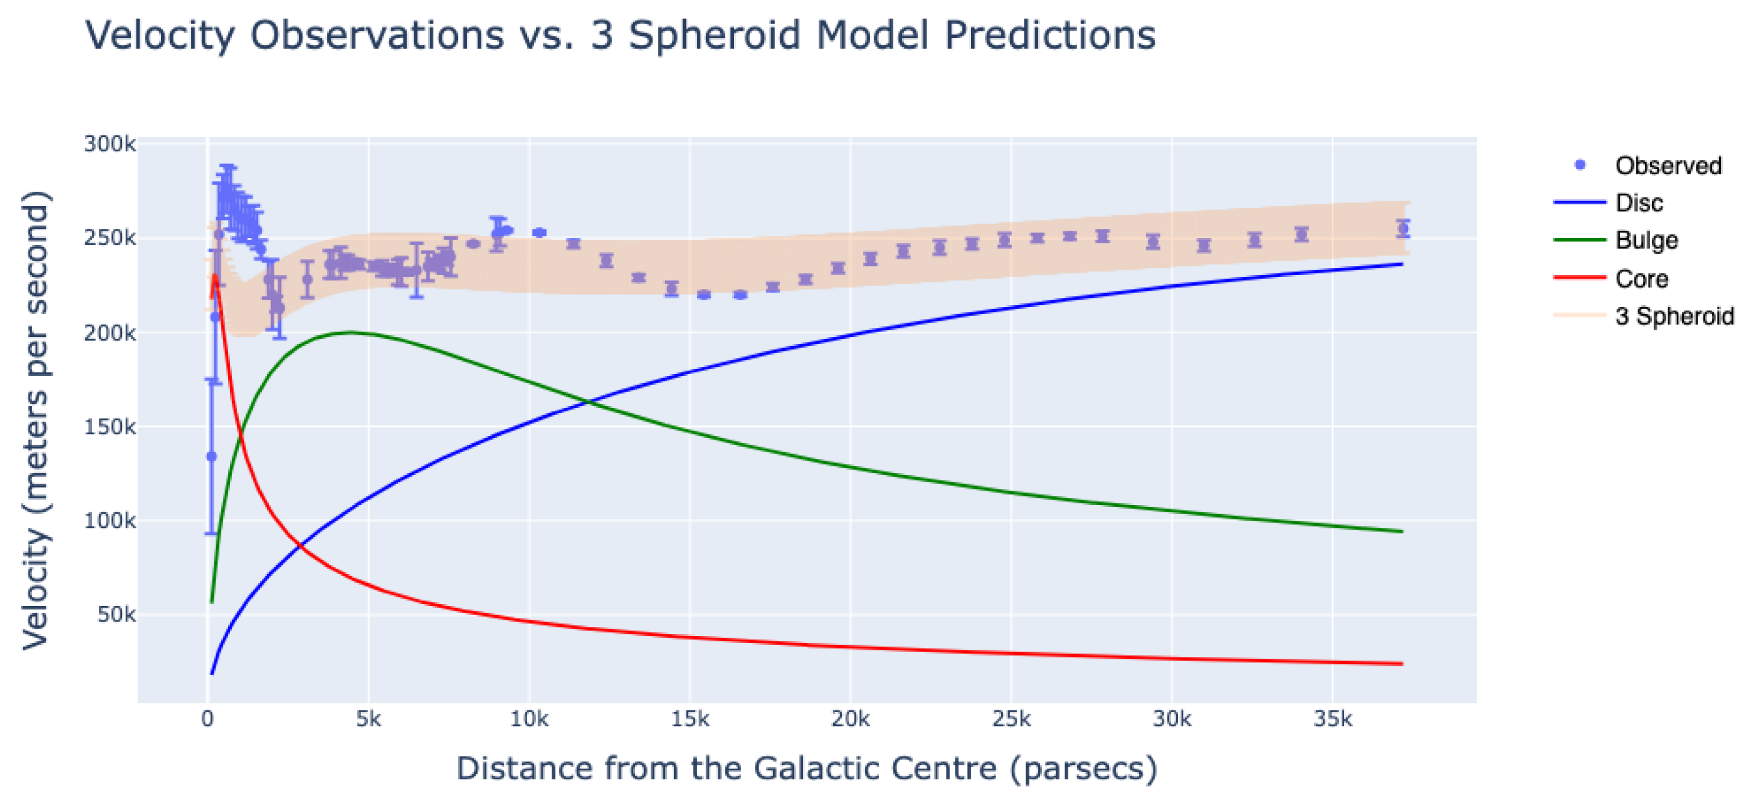
Accurate observed velocity points for galaxy UGC ugc 6787 plotted against the individual contributions of each spheroid and the combined model. The “wavy” rotation velocity curve indicates an influence from the spiral arms that is higher than normal.
Figure 13.
Accurate observed velocity points for galaxy UGC ugc 6787 plotted against the individual contributions of each spheroid and the combined model. The “wavy” rotation velocity curve indicates an influence from the spiral arms that is higher than normal.
Table 1.
Dimensional verification of the Contreras constant. SI units and dimensional breakdown for mass (M), orbital period (T), enclosed volume (V), and the derived constant () in the fundamental relation .
Table 1.
Dimensional verification of the Contreras constant. SI units and dimensional breakdown for mass (M), orbital period (T), enclosed volume (V), and the derived constant () in the fundamental relation .
| Term | Symbol | SI Units | Dimensions |
|---|
| Mass | M | kg | [M] |
| Period squared | T2 | | [T]2 |
| Volume | V | m3 | [L]3 |
| Left-hand side | | kg·s2 | [M][T]2 |
| Right-hand side | | – | [][L]3 |
Table 2.
Parameters for the three-spheroid model of the Milky Way.
Table 2.
Parameters for the three-spheroid model of the Milky Way.
| Component | Mass ⊙ | (pcs) | (pcs) |
|---|
| Bulge | | 224 | 27.2 |
| Thin Disc | | 5690 | 283.9 |
| Thick Disc | | 125 690 | 977.4 |
| Total | | | |
Table 3.
Comparative performance of MWPotential2014 and three-spheroid END models applied to the Milky Way. Metrics include baryonic mass allocation, disc scale geometry, goodness-of-fit (), and alignment with observational constraints (baryonic mass: ; Thin Disc height ).
Table 3.
Comparative performance of MWPotential2014 and three-spheroid END models applied to the Milky Way. Metrics include baryonic mass allocation, disc scale geometry, goodness-of-fit (), and alignment with observational constraints (baryonic mass: ; Thin Disc height ).
| Component/Parameter | MWPotential2014 (Ext) | Three-Spheroid |
|---|
| Framework | CND + Dark Matter Halo | END |
| Free Params—Model | 8 | 9 |
| Free Params—Framework | 2 | 0 |
| Fit Quality () | 37.3 | 2.3 |
| Total Baryonic Mass () | ∼ | |
| Thin Disc Height () | (Fixed) | |
Table 4.
The set of galaxies included in this study. Requirements included more than 10 accurate velocity points. A clear figure for baryonic mass. Total baryonic mass figure consistent with stellar and HI mass figures.
Table 4.
The set of galaxies included in this study. Requirements included more than 10 accurate velocity points. A clear figure for baryonic mass. Total baryonic mass figure consistent with stellar and HI mass figures.
| Galaxy | Values | Accurate | Baryonic Mass |
|---|
| UGC 2953 | 115 | 82 | |
| NGC 2403 | 73 | 55 | |
| UGC 5253 | 73 | 53 | |
| UGC 6787 | 71 | 46 | |
| UGC 9133 | 68 | 53 | |
| UGC 11914 | 65 | 35 | |
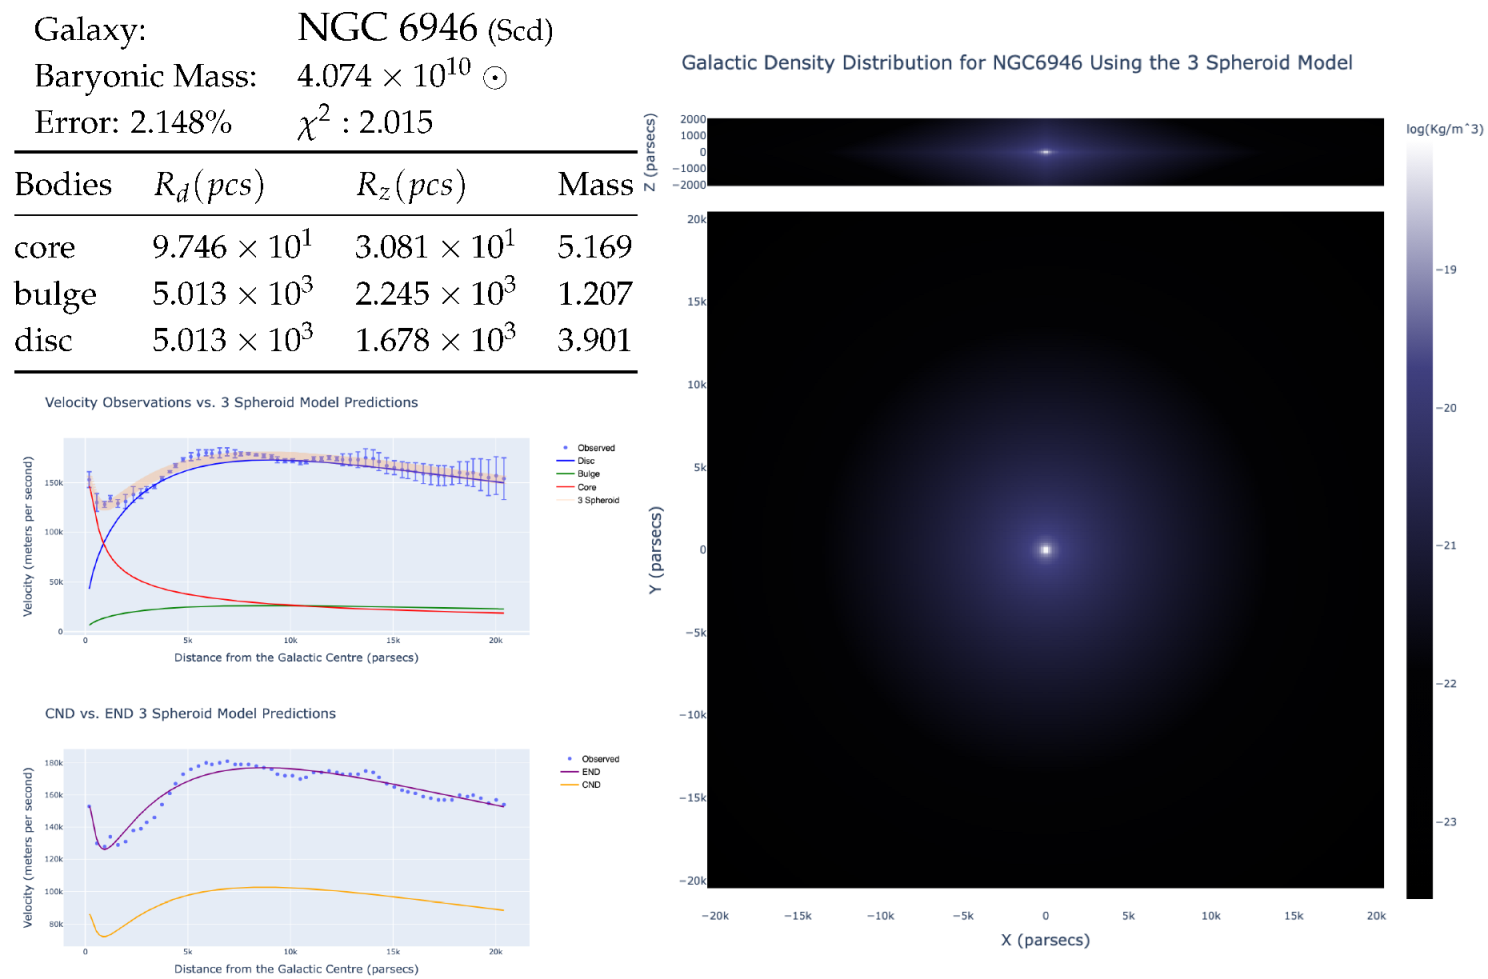
| NGC 6946 | 58 | 29 | |
| NGC 2841 | 50 | 38 | |
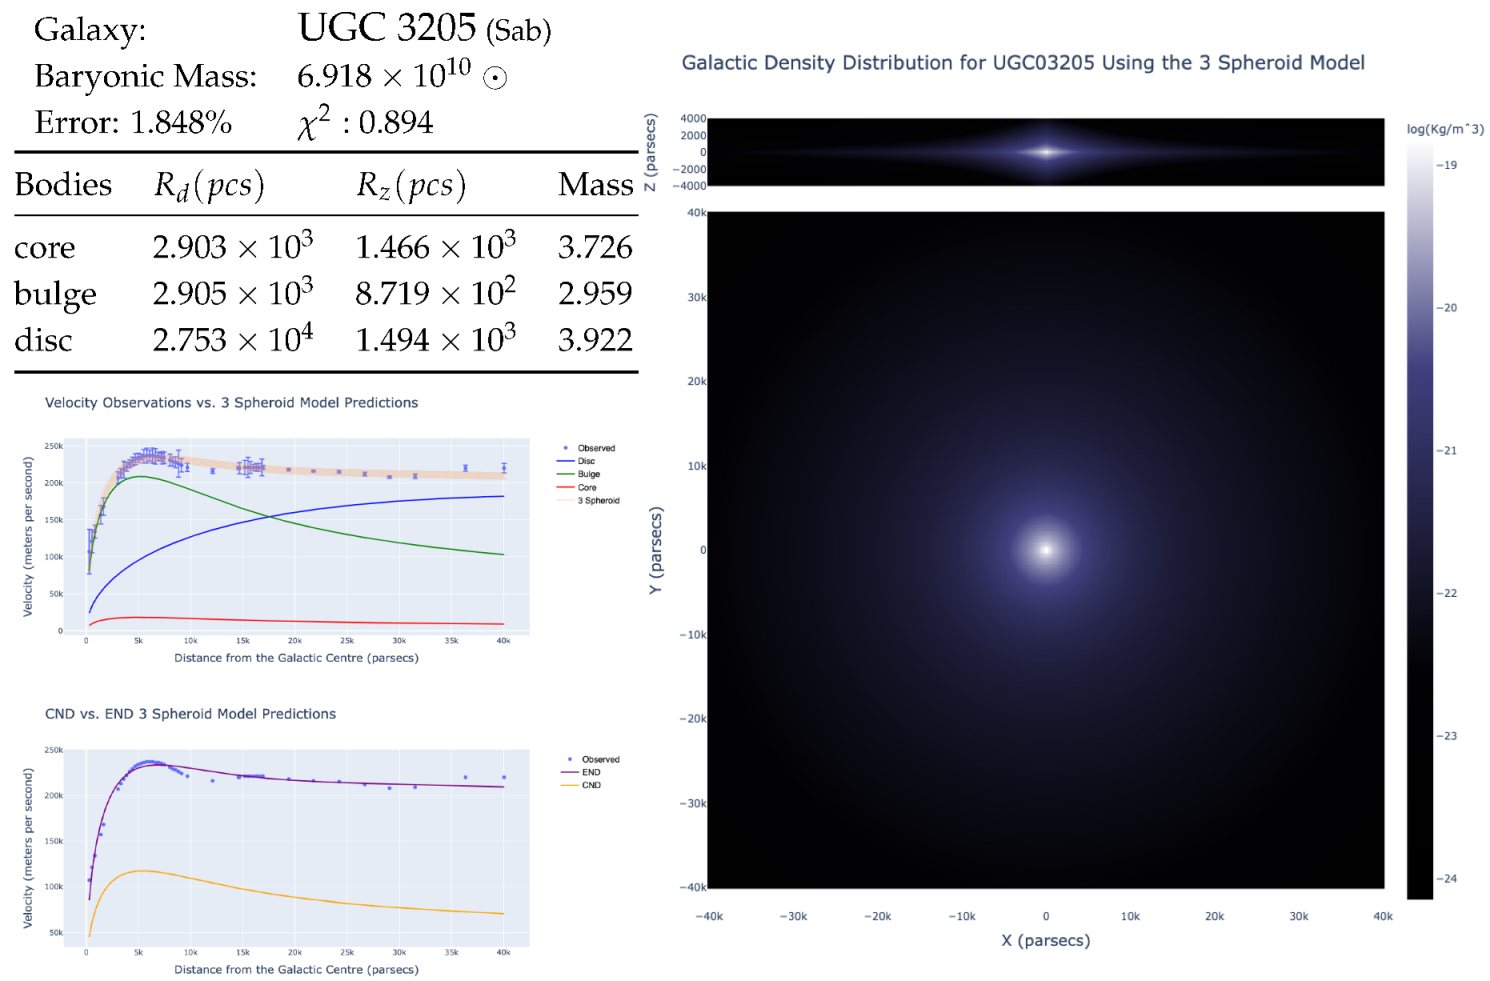
| UGC 3205 | 48 | 23 | |
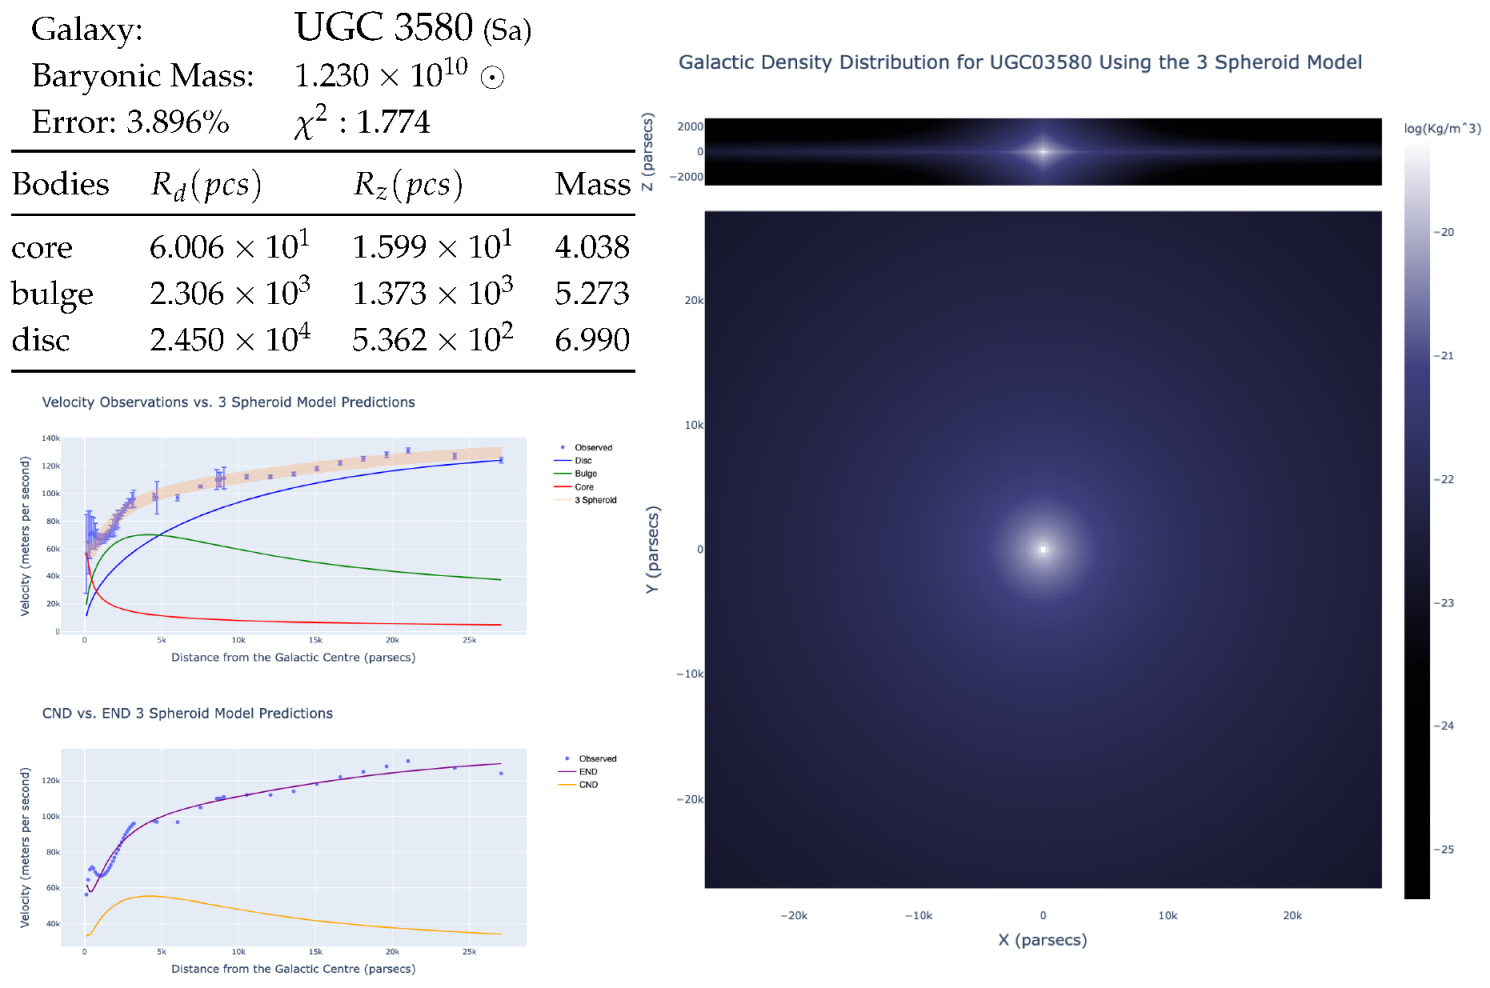
| UGC 3580 | 47 | 20 | |
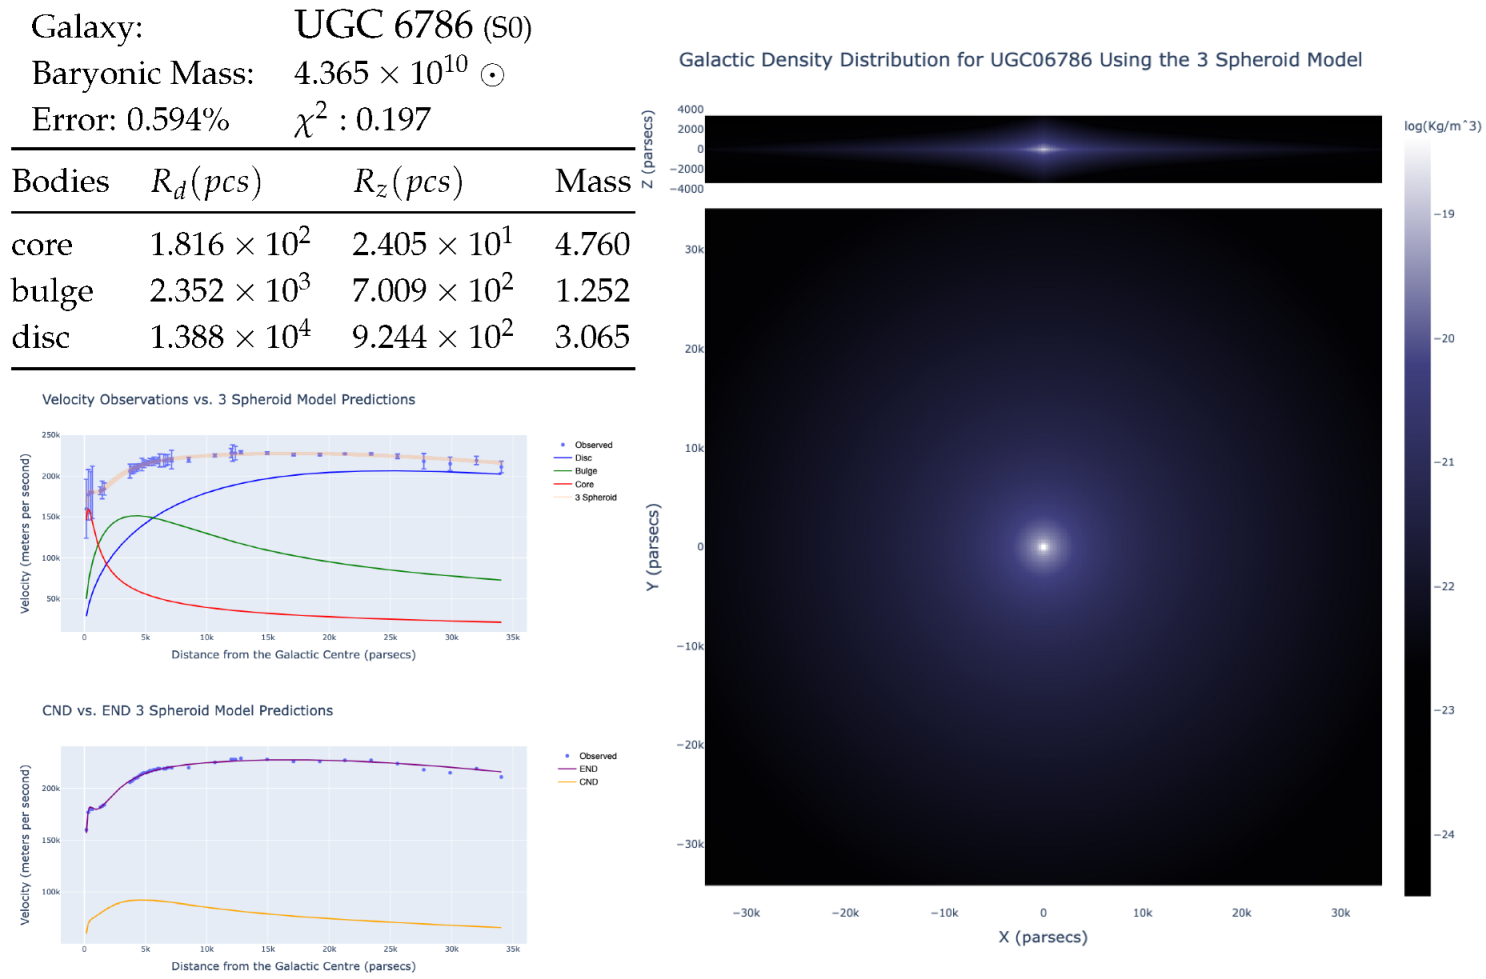
| UGC 6786 | 45 | 28 | |
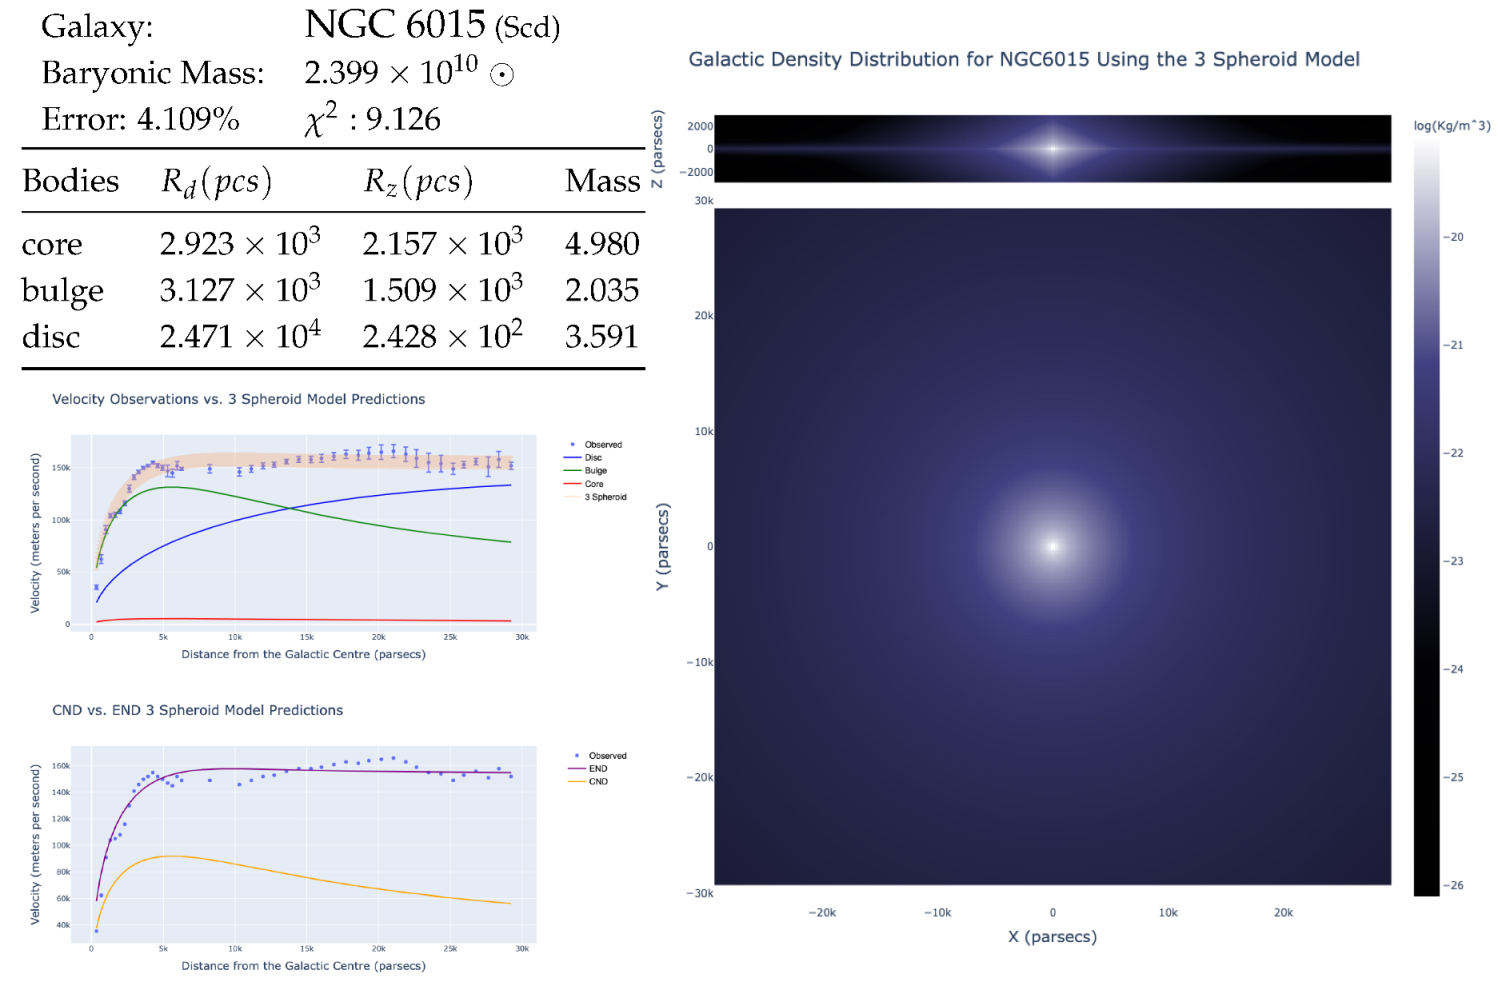
| NGC 6015 | 44 | 30 | |
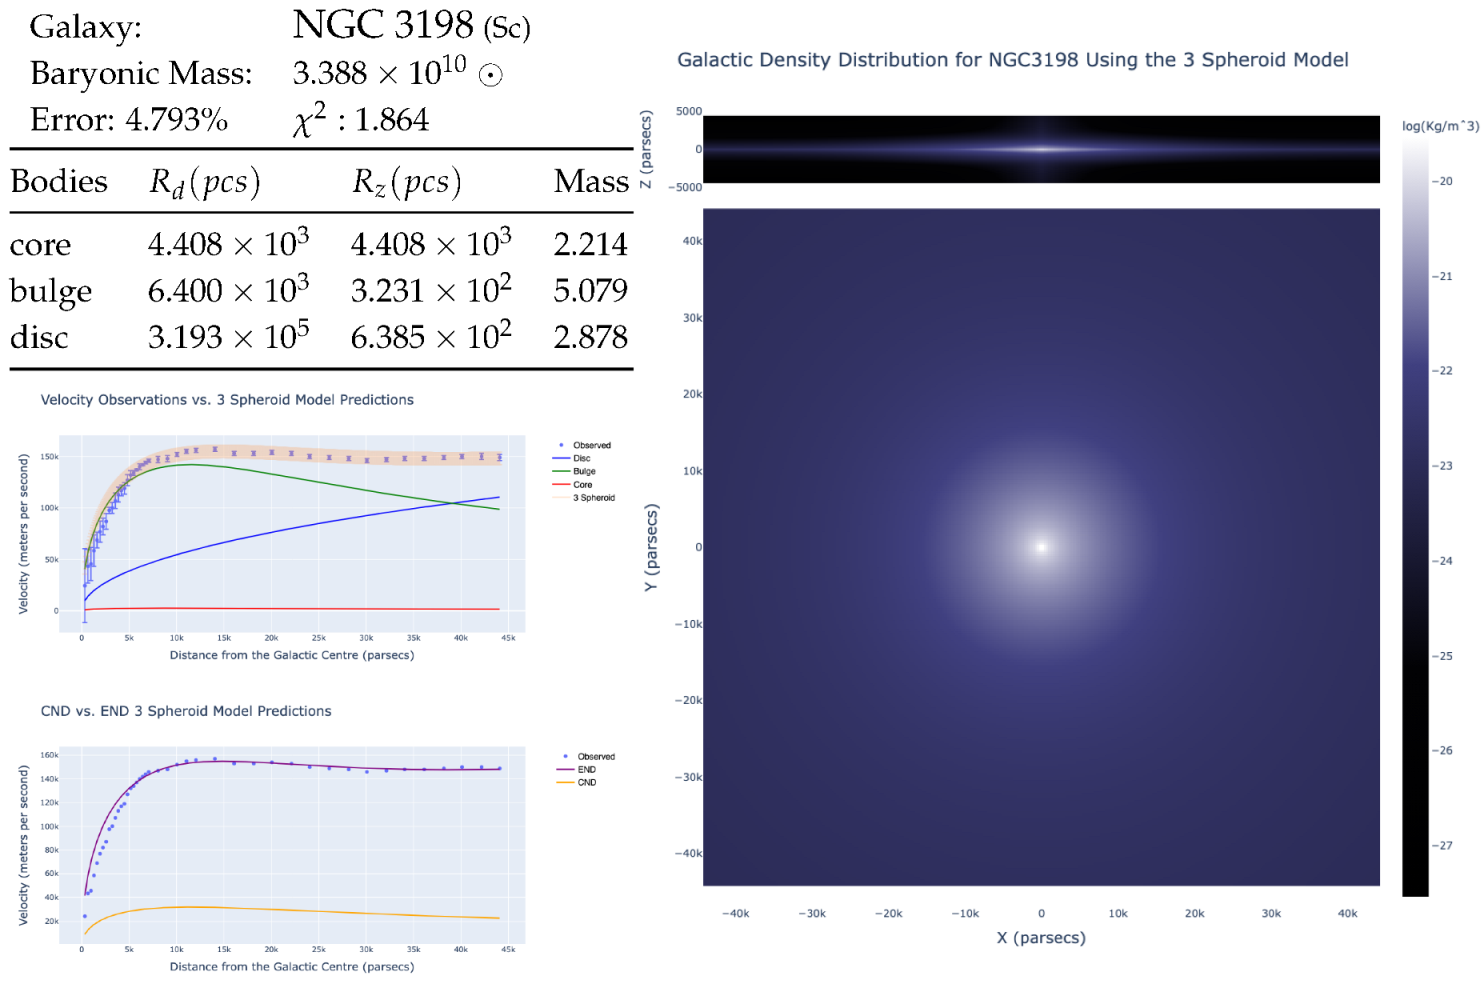
| NGC 3198 | 43 | 27 | |
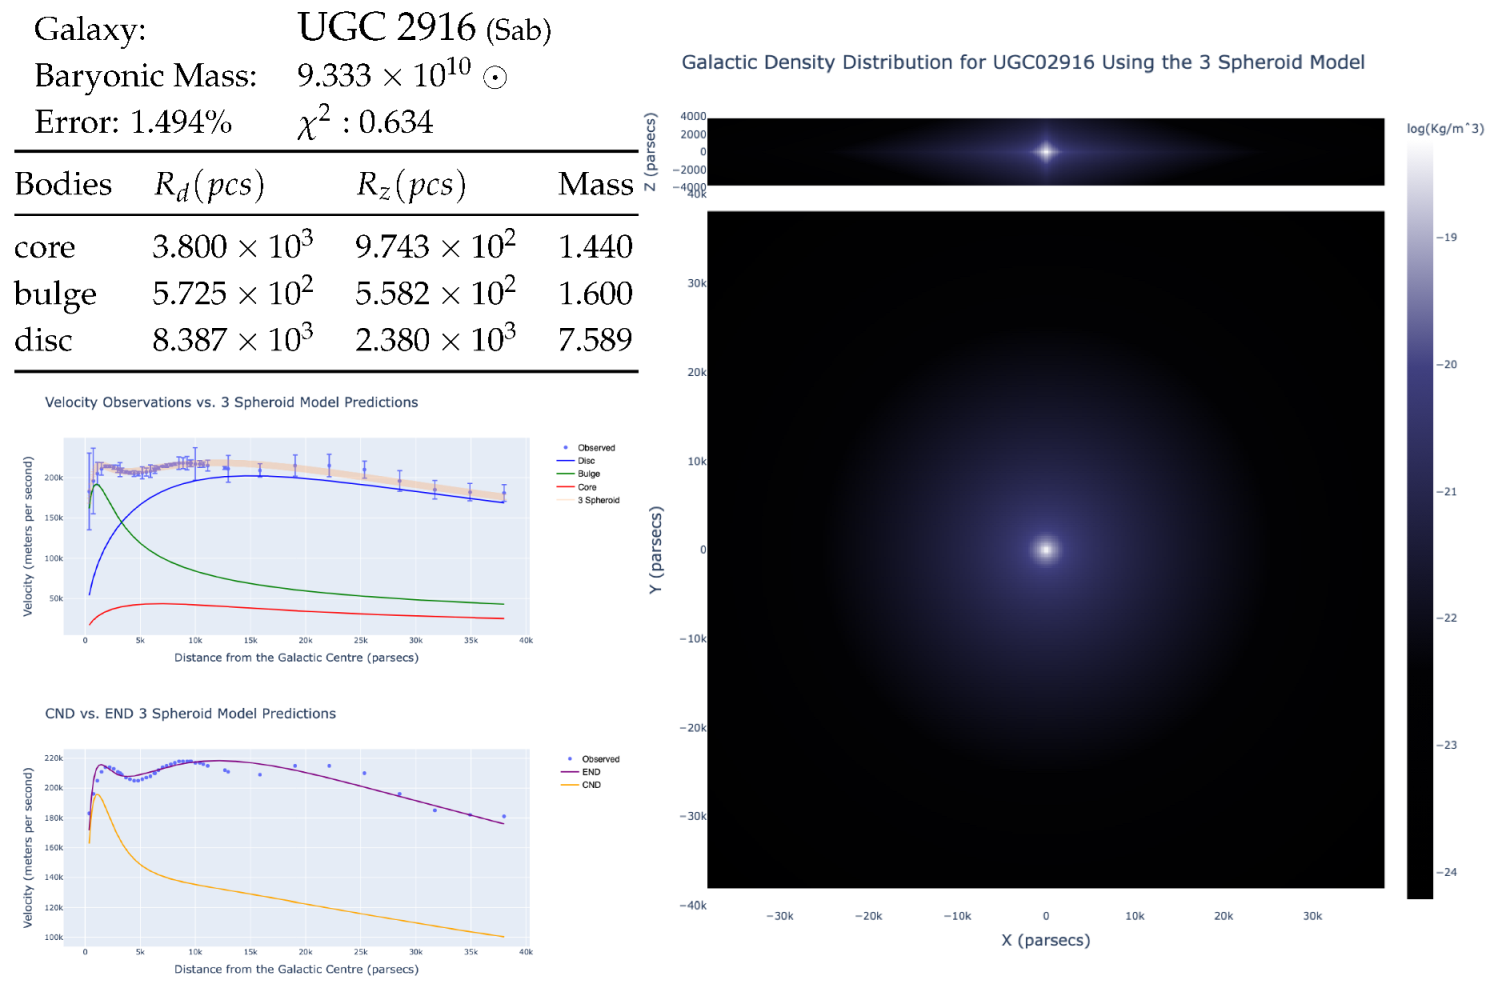
| UGC 2916 | 43 | 22 | |
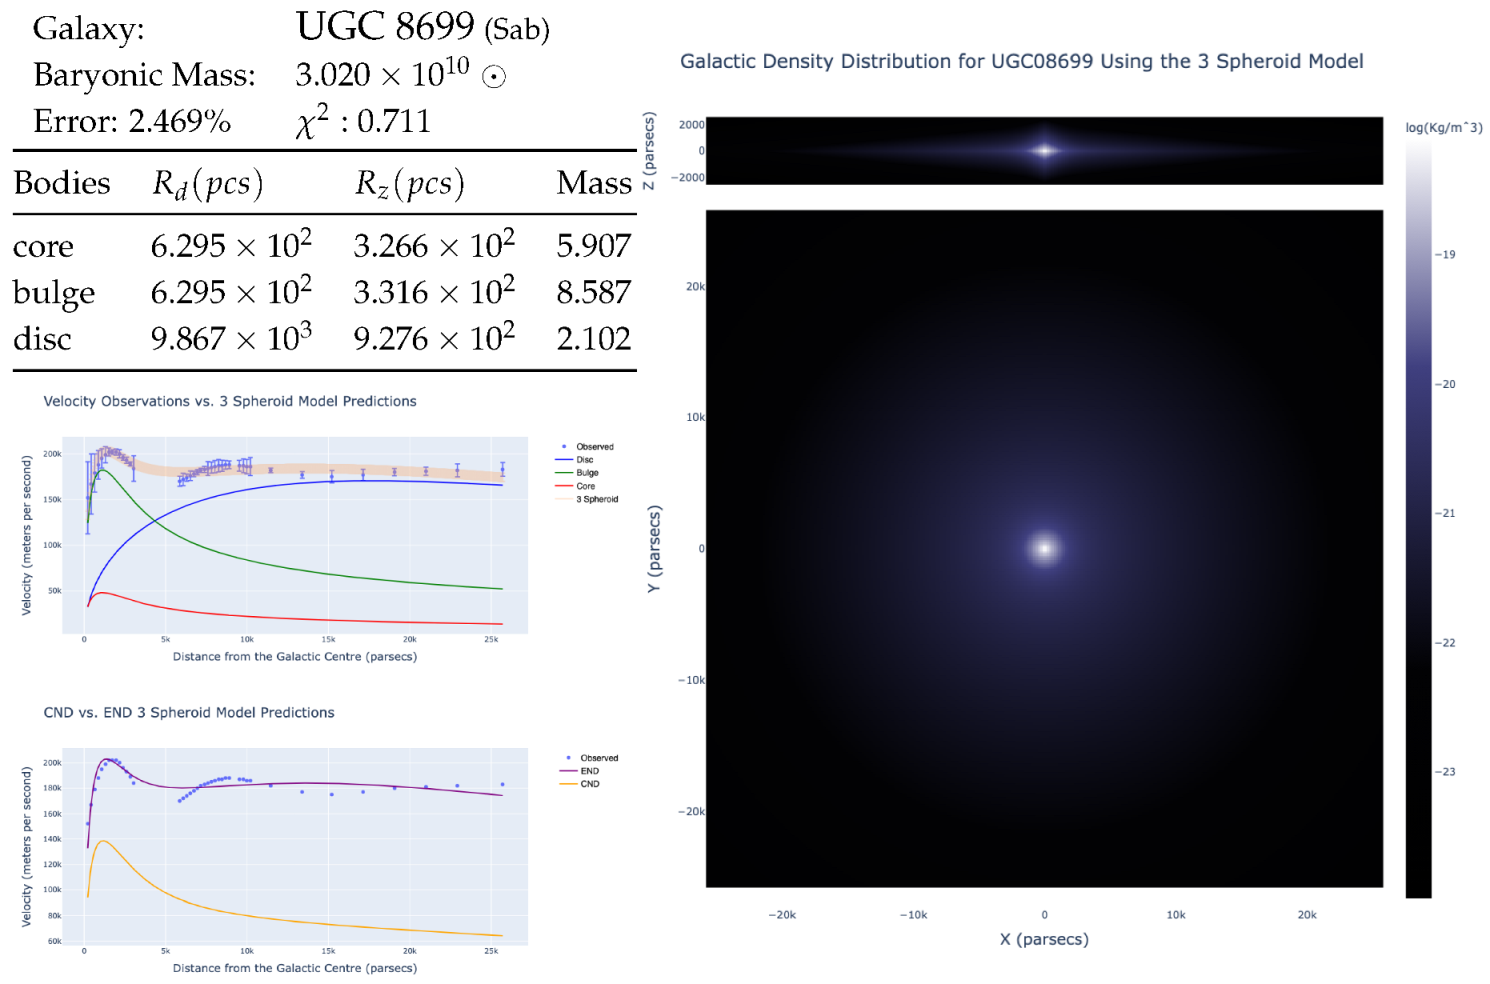
| UGC 8699 | 41 | 19 | |
| NGC 1003 | 36 | 20 | |
| NGC 4013 | 36 | 19 | |
| NGC 7331 | 36 | 32 | |
| UGC 11455 | 36 | 17 | |
| IC 2574 | 34 | 11 | |
| NGC 2903 | 34 | 26 | |
| NGC 5985 | 33 | 26 | |
| IC 4202 | 32 | 20 | |
| DDO 161 | 31 | 13 | |
| NGC 6503 | 31 | 27 | |
| ESO 563-G021 | 30 | 15 | |
| UGC 3546 | 30 | 11 | |
| NGC 5055 | 28 | 25 | |
| NGC 1090 | 24 | 15 | |
| NGC 6195 | 23 | 13 | |
| NGC 5033 | 22 | 17 | |
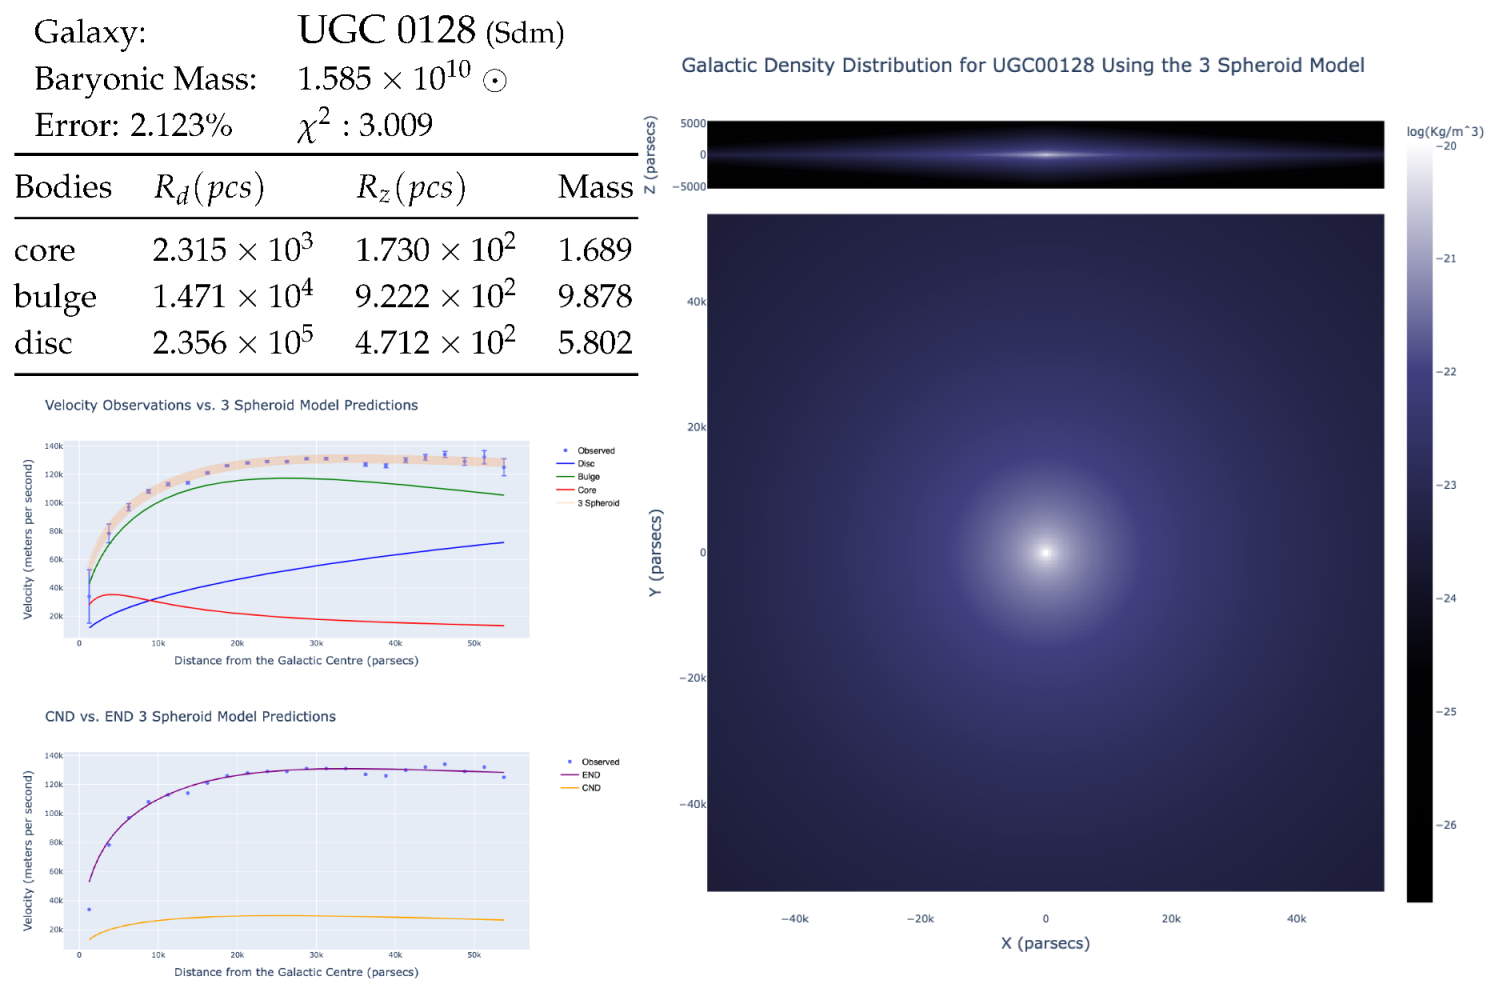
| UGC 128 | 22 | 18 | |
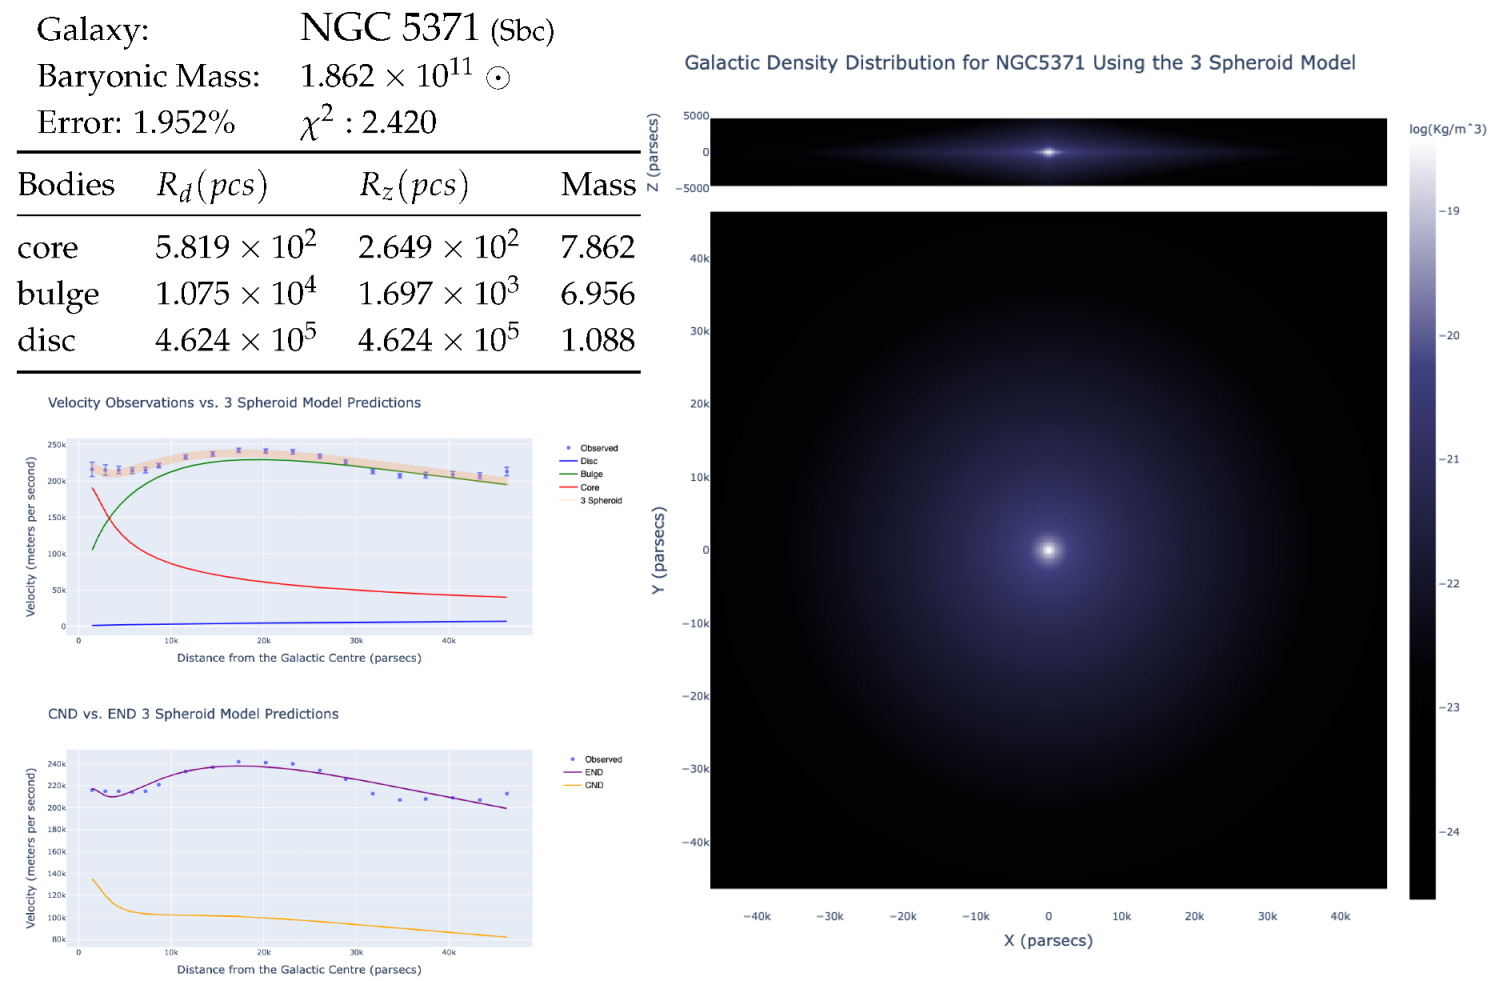
| NGC 5371 | 19 | 17 | |
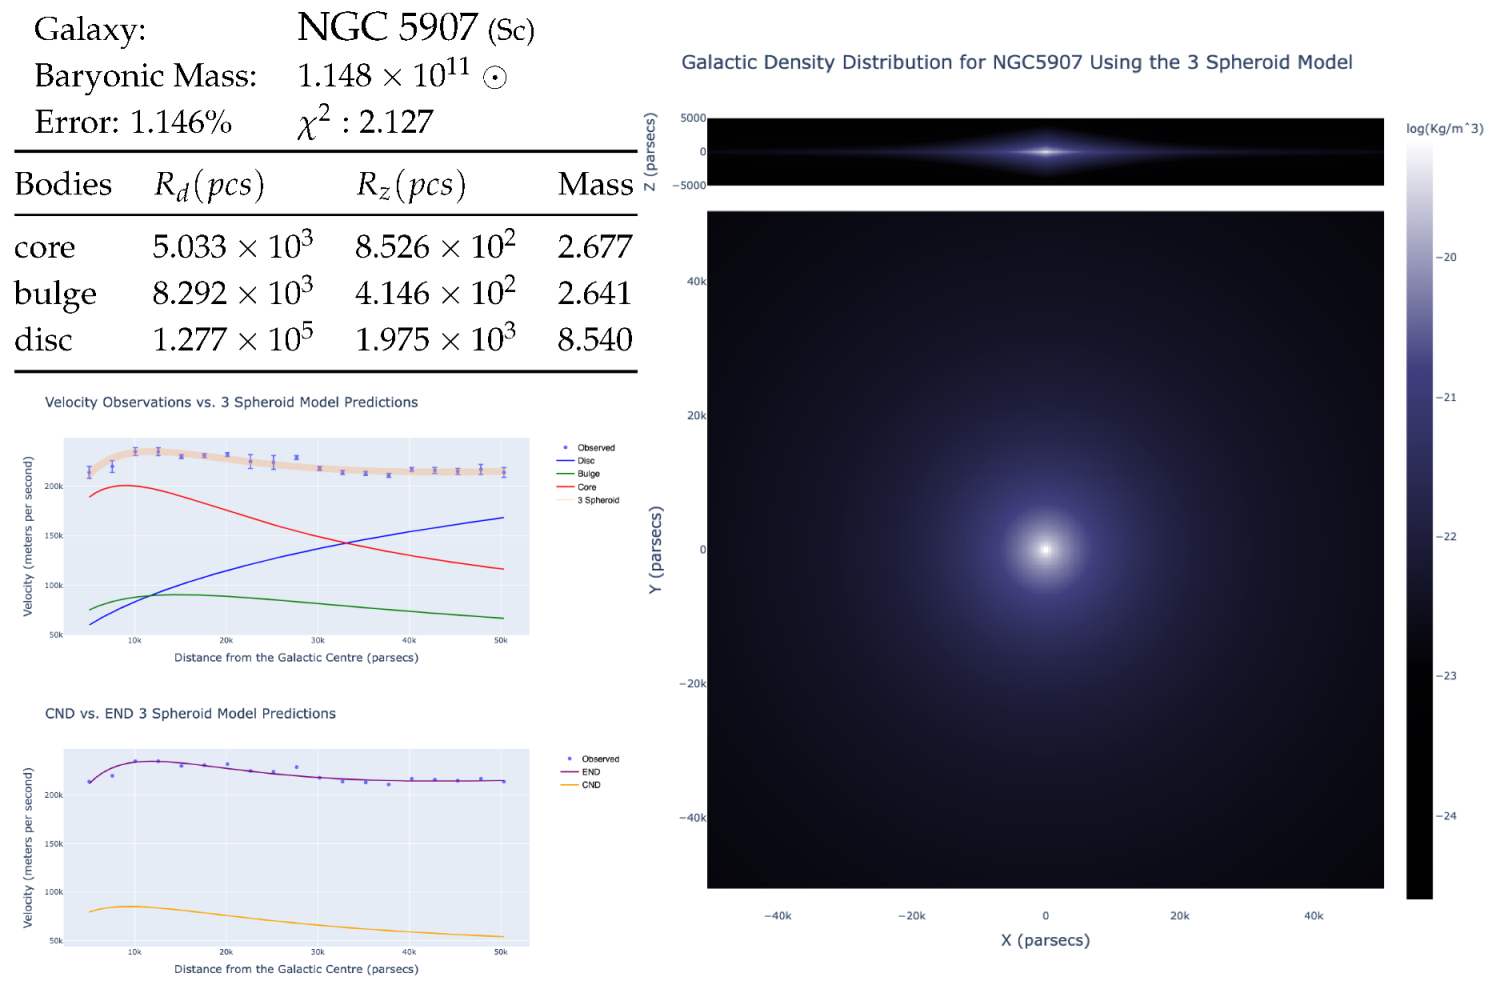
| NGC 5907 | 19 | 17 | |
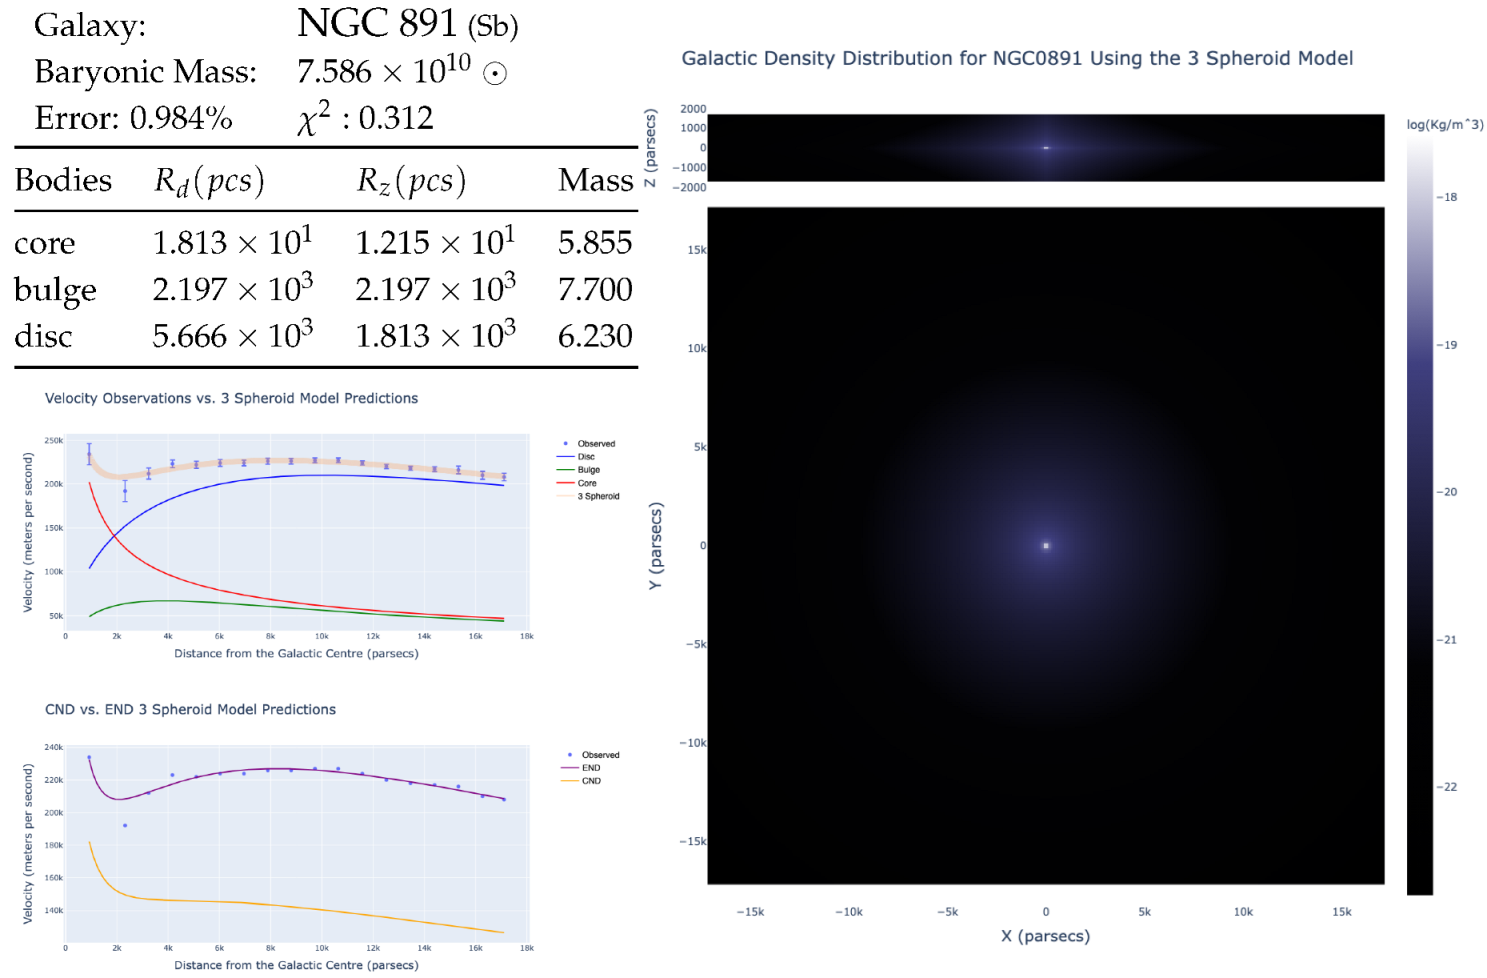
| NGC 891 | 18 | 16 | |
| NGC 7814 | 18 | 15 | |
| UGC 2487 | 17 | 14 | |
| UGC 8286 | 17 | 14 | |
| NGC 6674 | 15 | 14 | |
Table 5.
Best fit values for mass distribution, density decay rates and spheroid proportions as found using the hybrid gradient descent method.
Table 5.
Best fit values for mass distribution, density decay rates and spheroid proportions as found using the hybrid gradient descent method.
| Bodies | | | Mass ⊙ |
|---|
| Core | | | |
| Bulge | | | |
| Disc | | | |
Table 6.
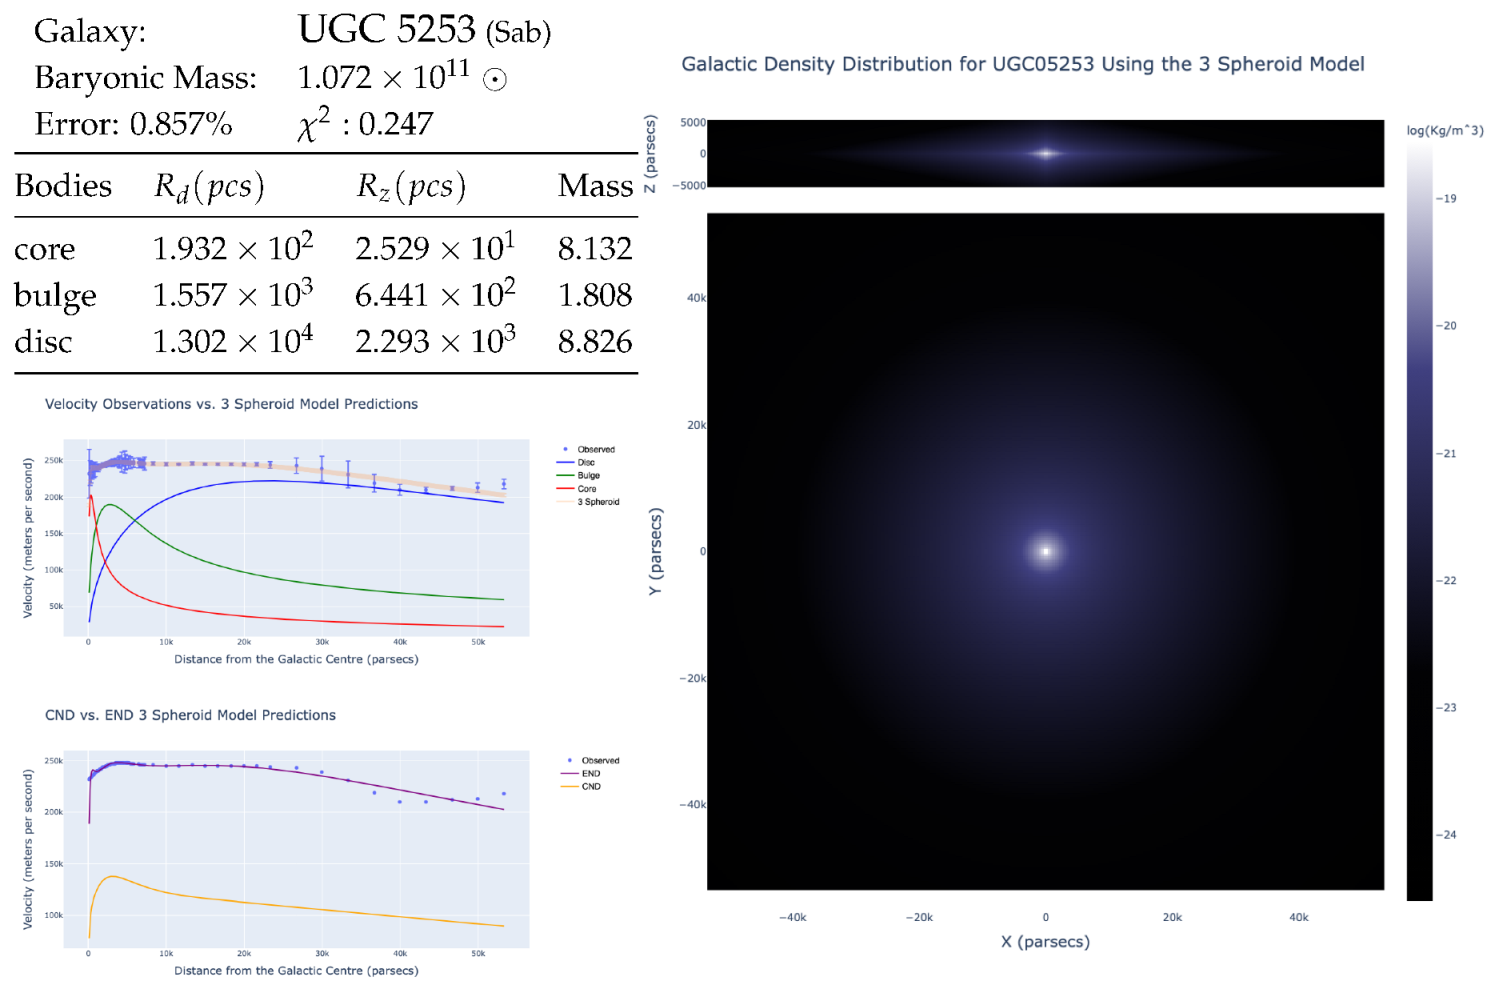
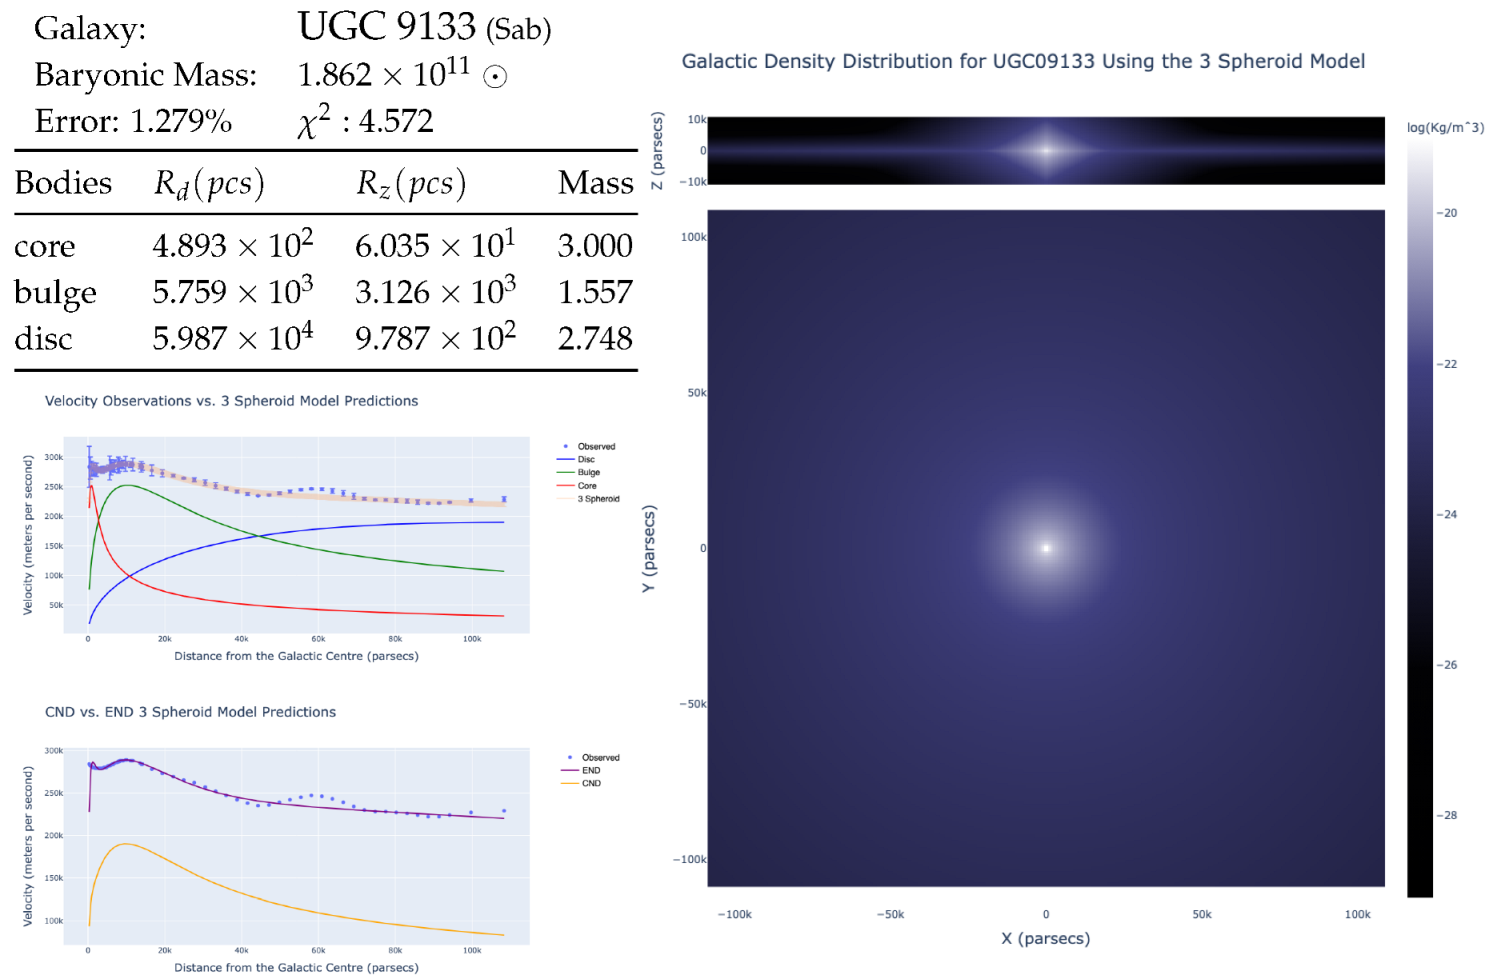
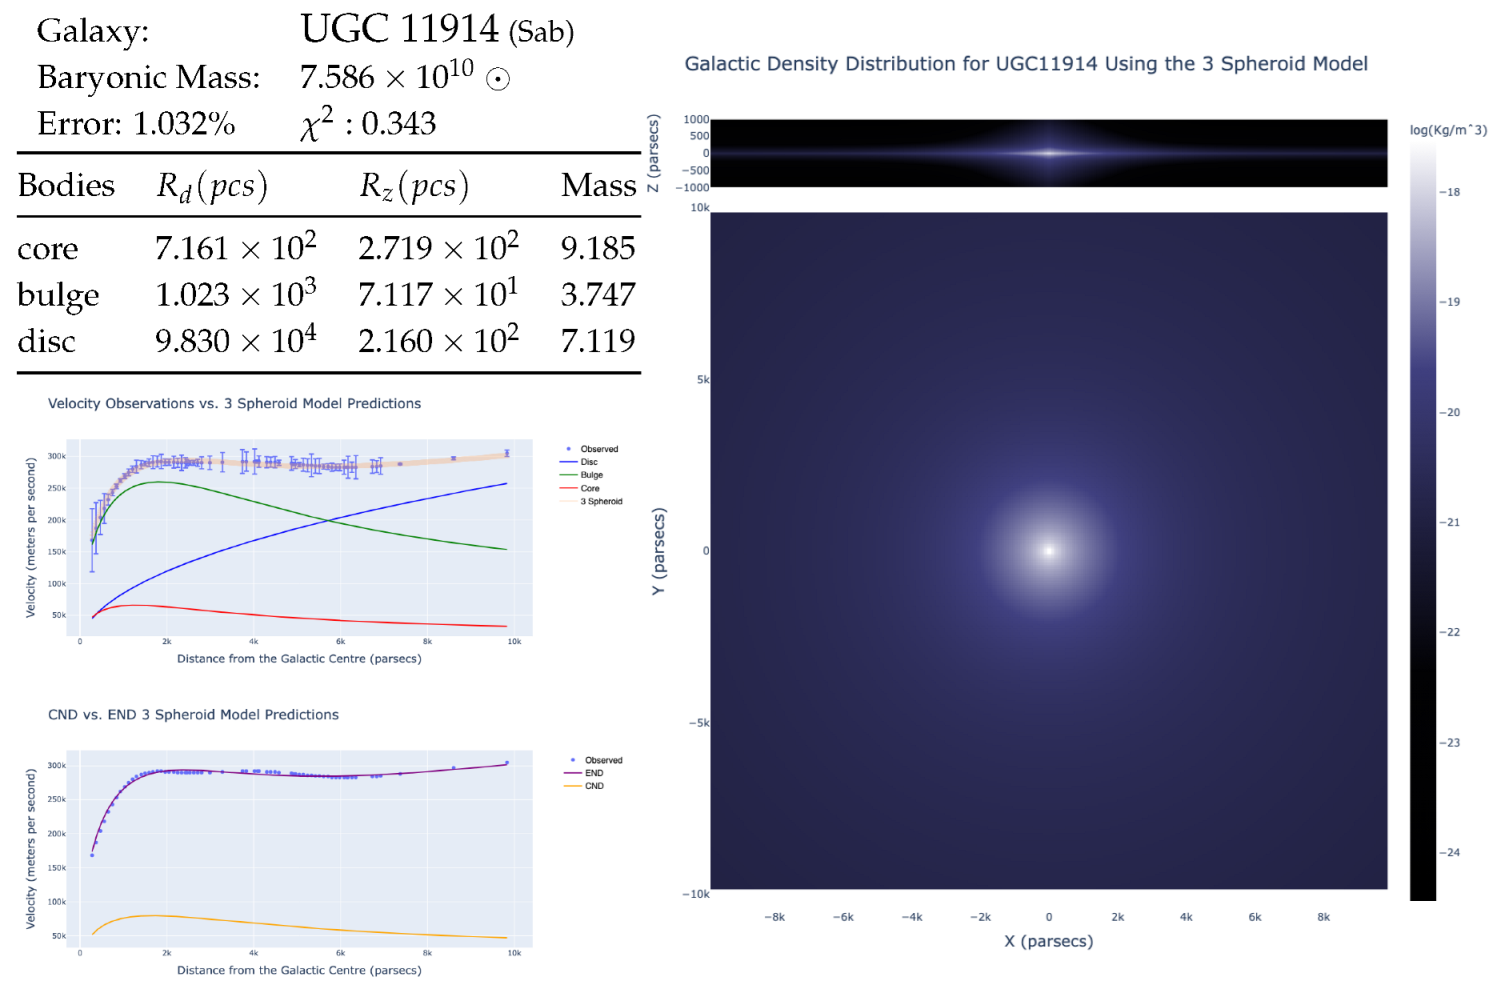
List of the galaxies (object of this study) along with the number of observed datapoints and the resulting values for mean error as a percentage and goodness of fit .
Table 6.
List of the galaxies (object of this study) along with the number of observed datapoints and the resulting values for mean error as a percentage and goodness of fit .
| Galaxy | Observations | | Mean Error % | |
|---|
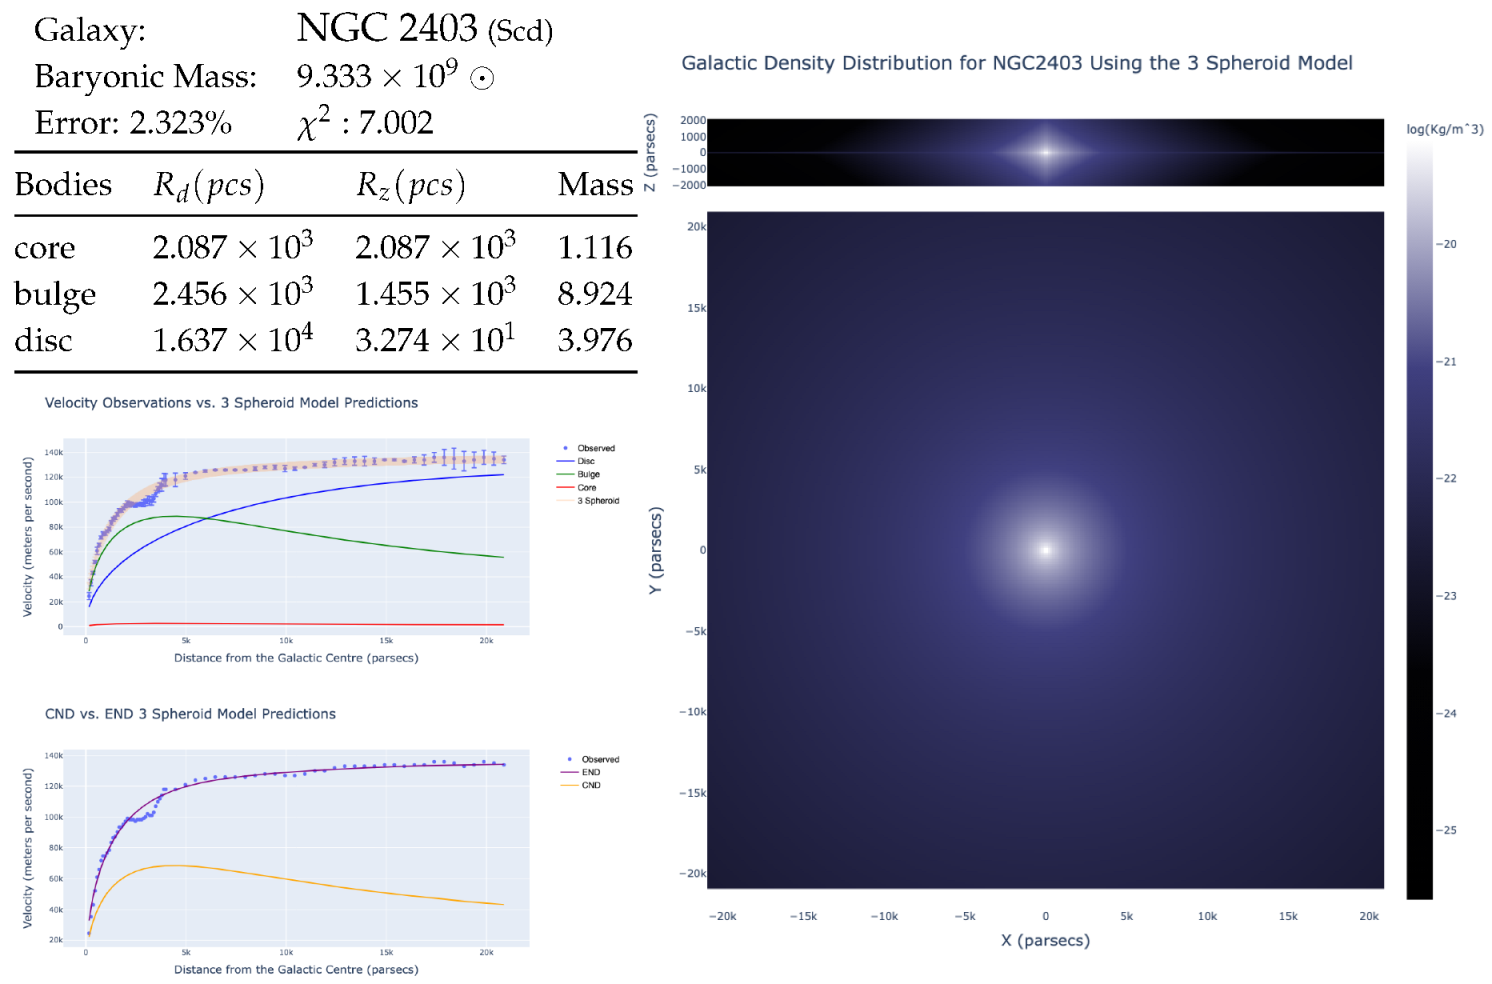
| UGC 2953 | 115 | 82 | 1.41 | 2.25 |
| NGC 2403 | 73 | 55 | 2.32 | 7.00 |
| UGC 5253 | 73 | 53 | 0.86 | 0.25 |
| UGC 6787 | 71 | 46 | 5.54 | 26.36 |
| UGC 9133 | 68 | 53 | 1.28 | 4.57 |
| UGC 11914 | 65 | 35 | 1.03 | 0.34 |
| NGC 6946 | 58 | 29 | 2.15 | 2.02 |
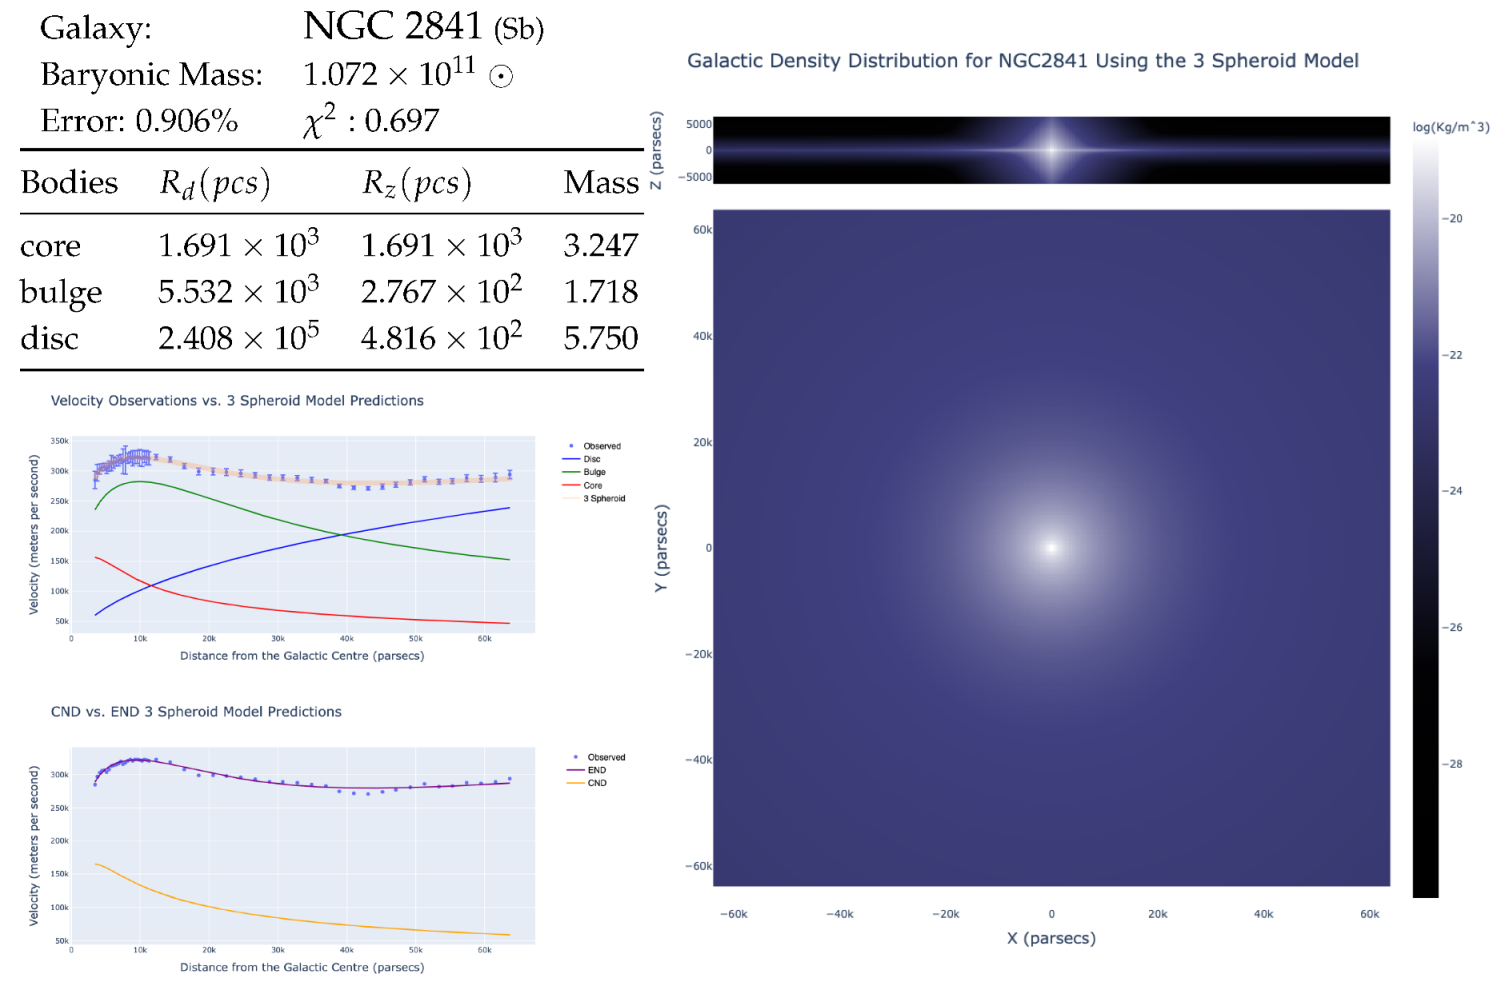
| NGC 2841 | 50 | 38 | 0.91 | 0.70 |
| UGC 3205 | 48 | 23 | 1.85 | 0.89 |
| UGC 3580 | 47 | 20 | 3.9 | 1.77 |
| UGC 6786 | 45 | 28 | 0.59 | 0.20 |
| NGC 6015 | 44 | 30 | 4.11 | 9.13 |
| NGC 3198 | 43 | 27 | 4.79 | 1.86 |
| UGC 2916 | 43 | 22 | 1.49 | 0.63 |
| UGC 8699 | 41 | 19 | 2.47 | 0.71 |
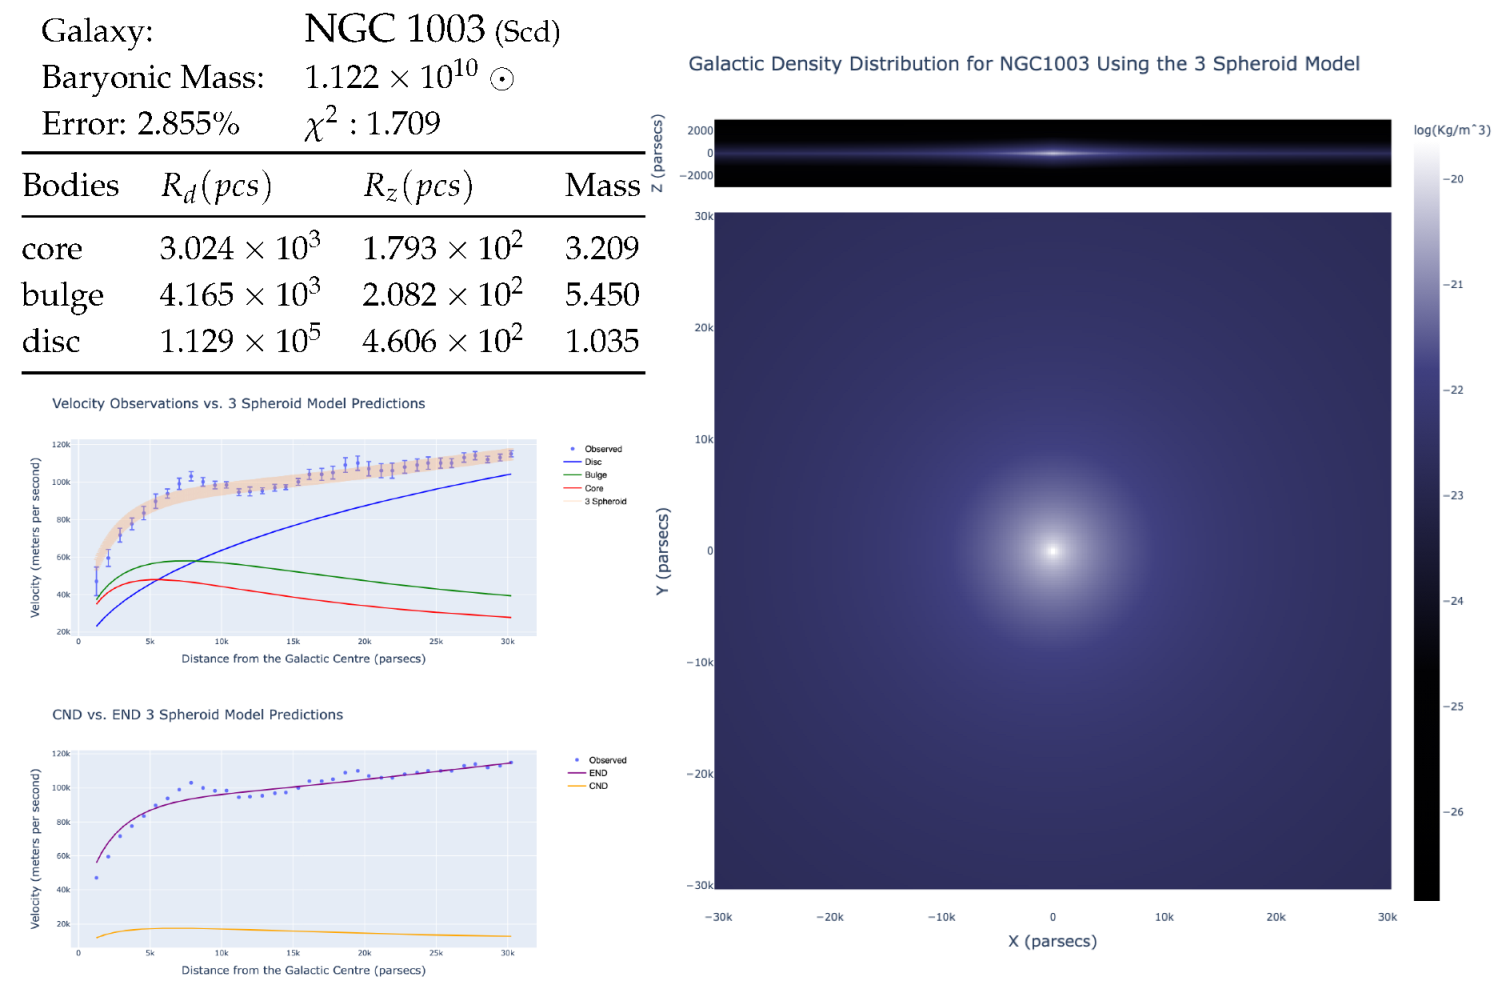
| NGC 1003 | 36 | 20 | 2.85 | 1.71 |
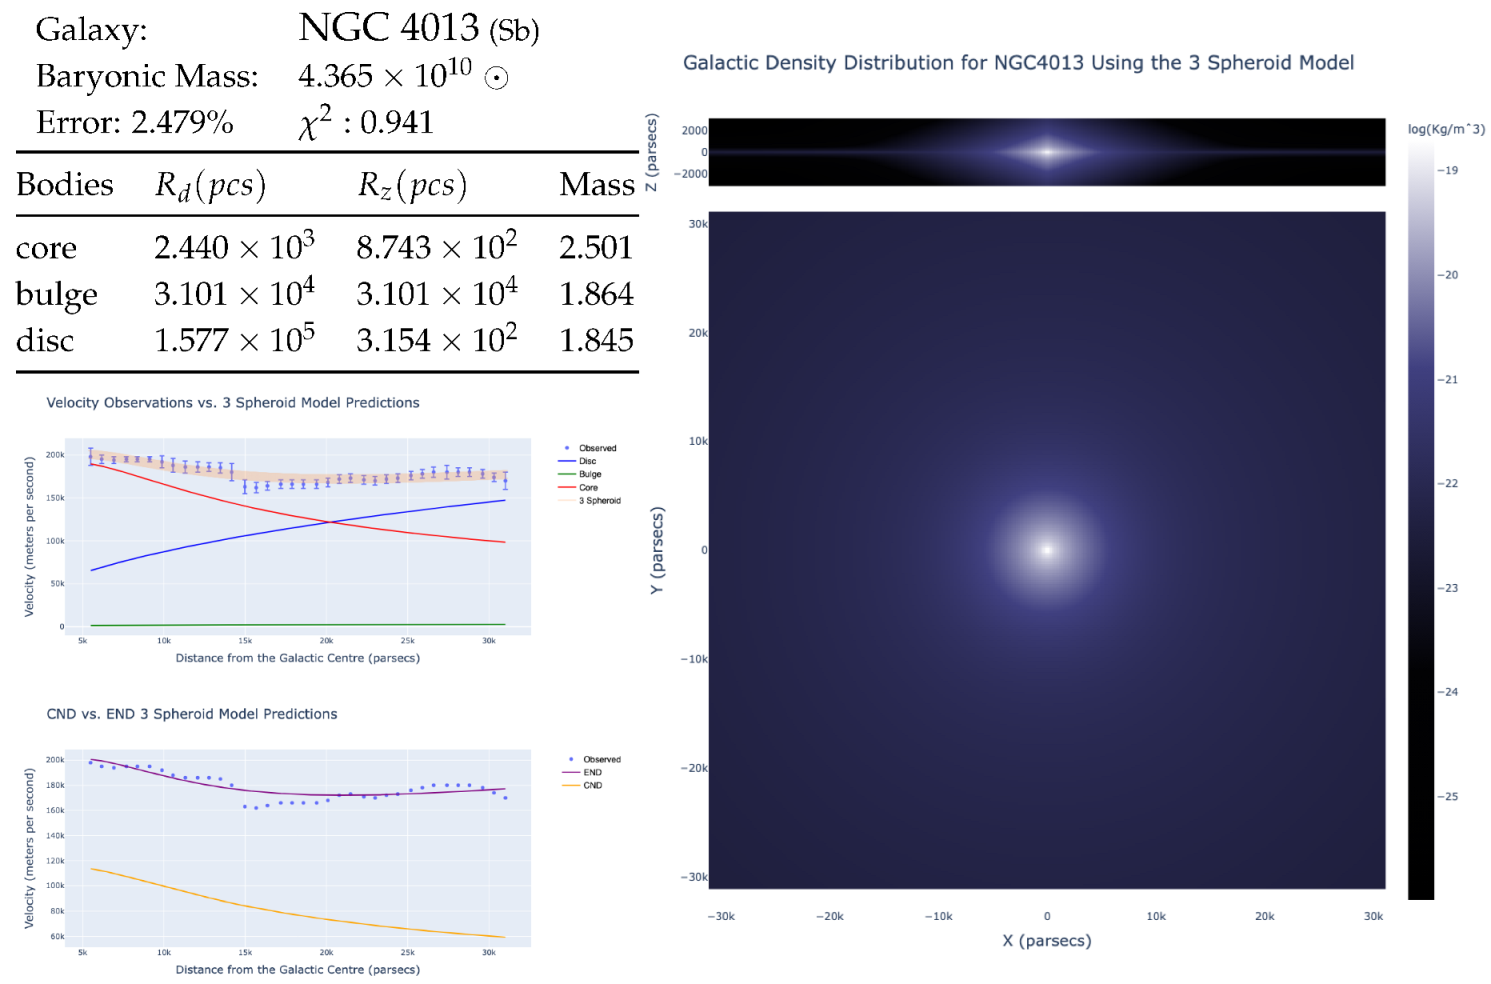
| NGC 4013 | 36 | 19 | 2.48 | 0.94 |
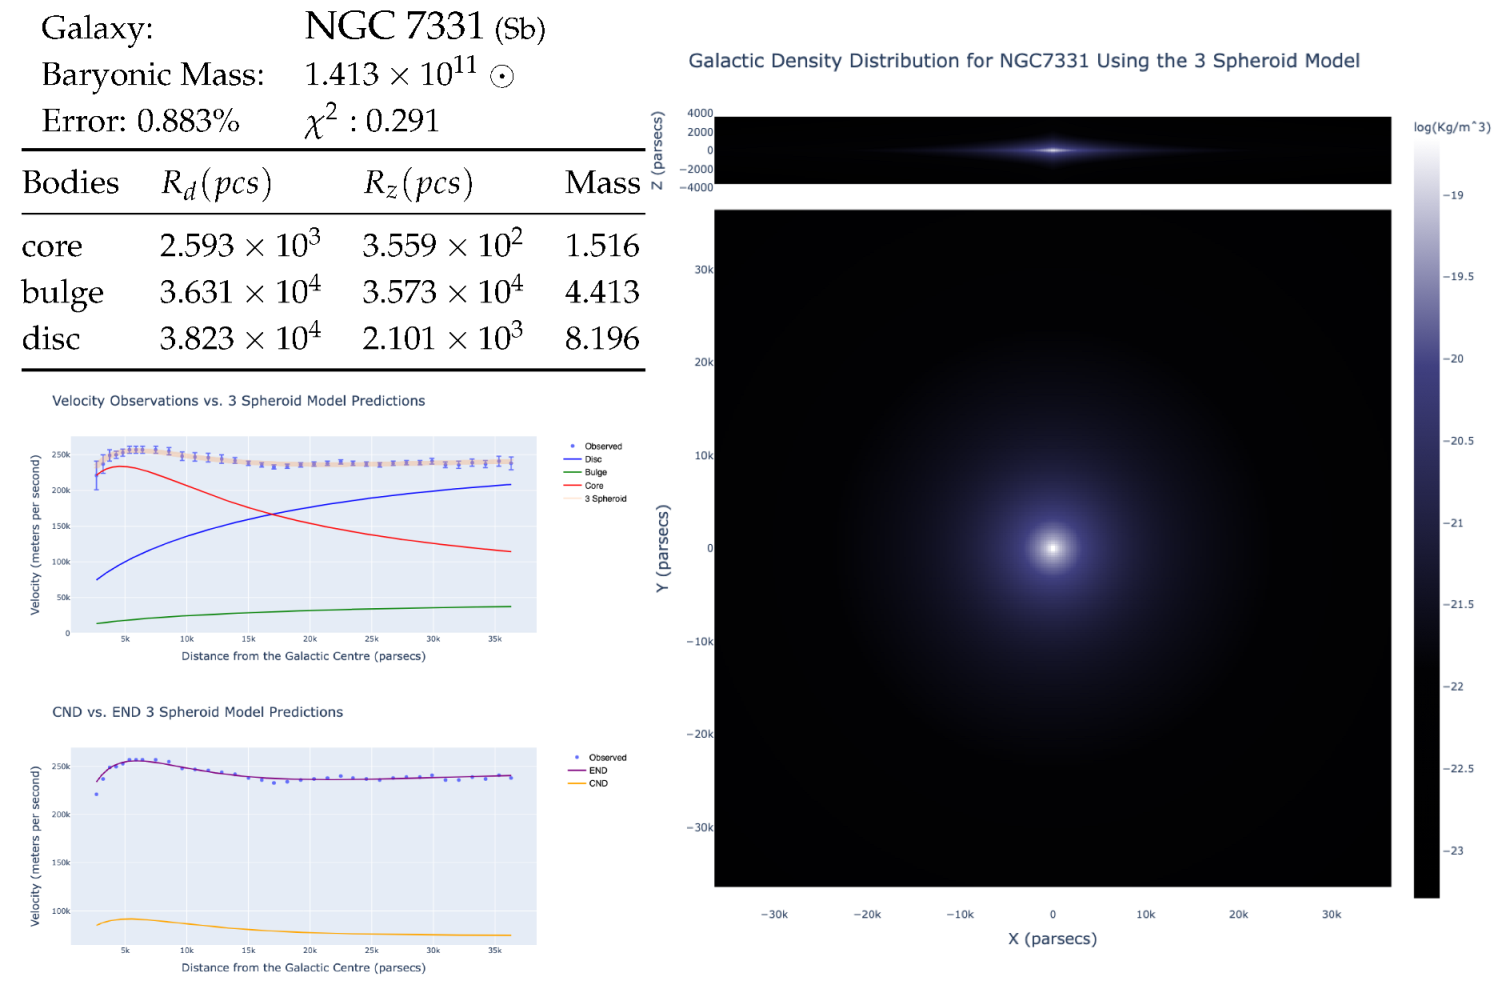
| NGC 7331 | 36 | 32 | 0.88 | 0.29 |
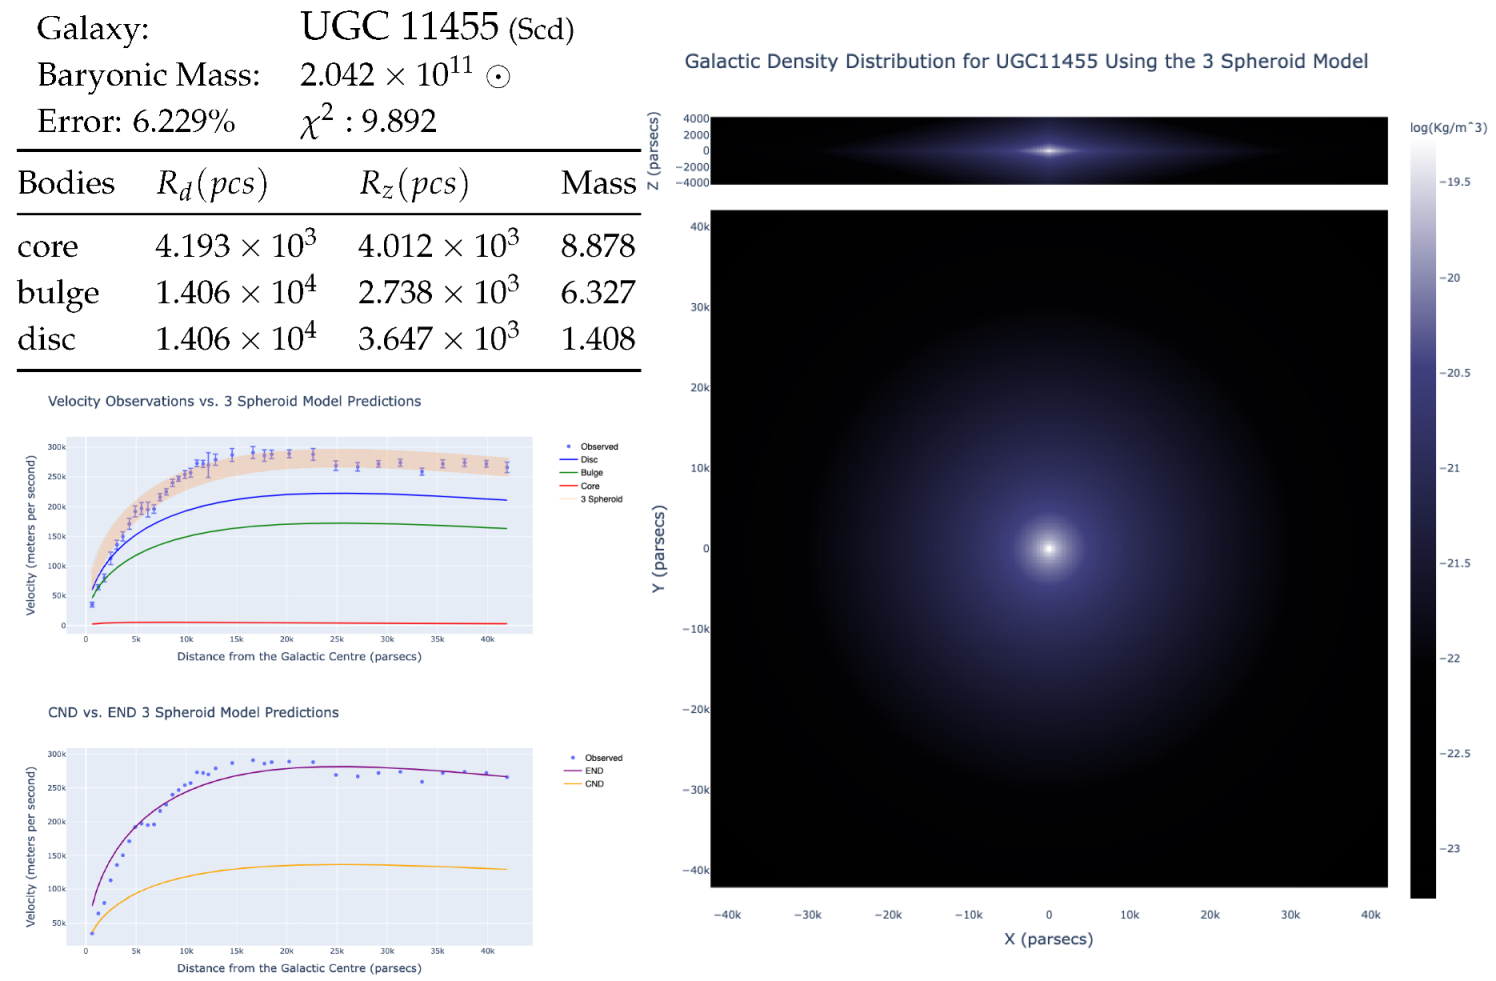
| UGC 11455 | 36 | 17 | 6.23 | 9.89 |
| IC 2574 | 34 | 11 | 9.97 | 51.56 |
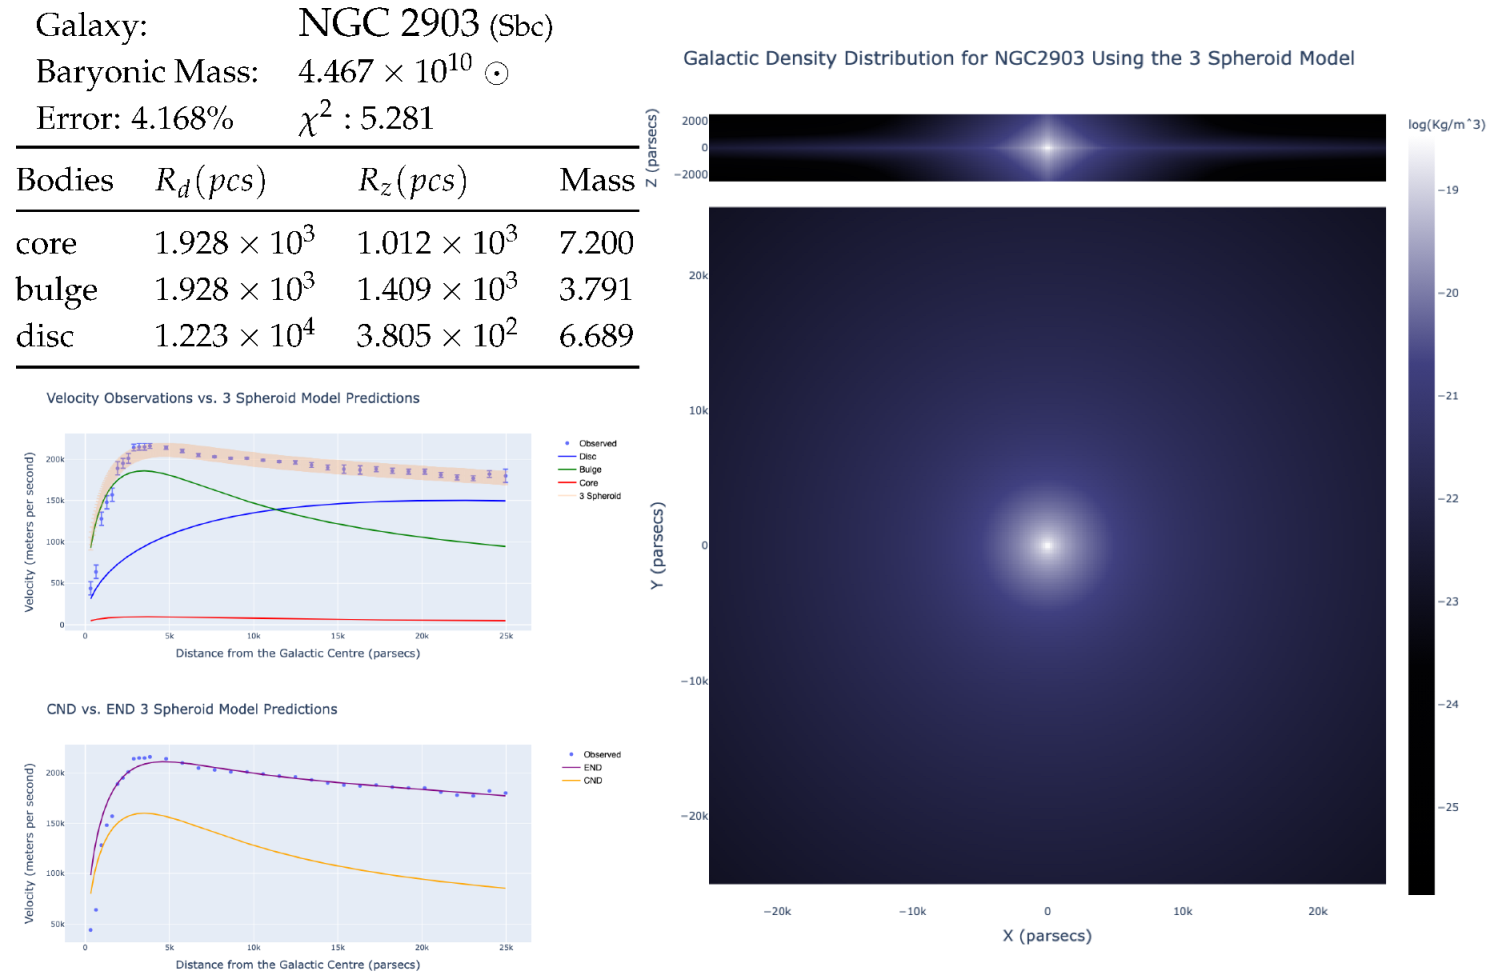
| NGC 2903 | 34 | 26 | 4.17 | 5.28 |
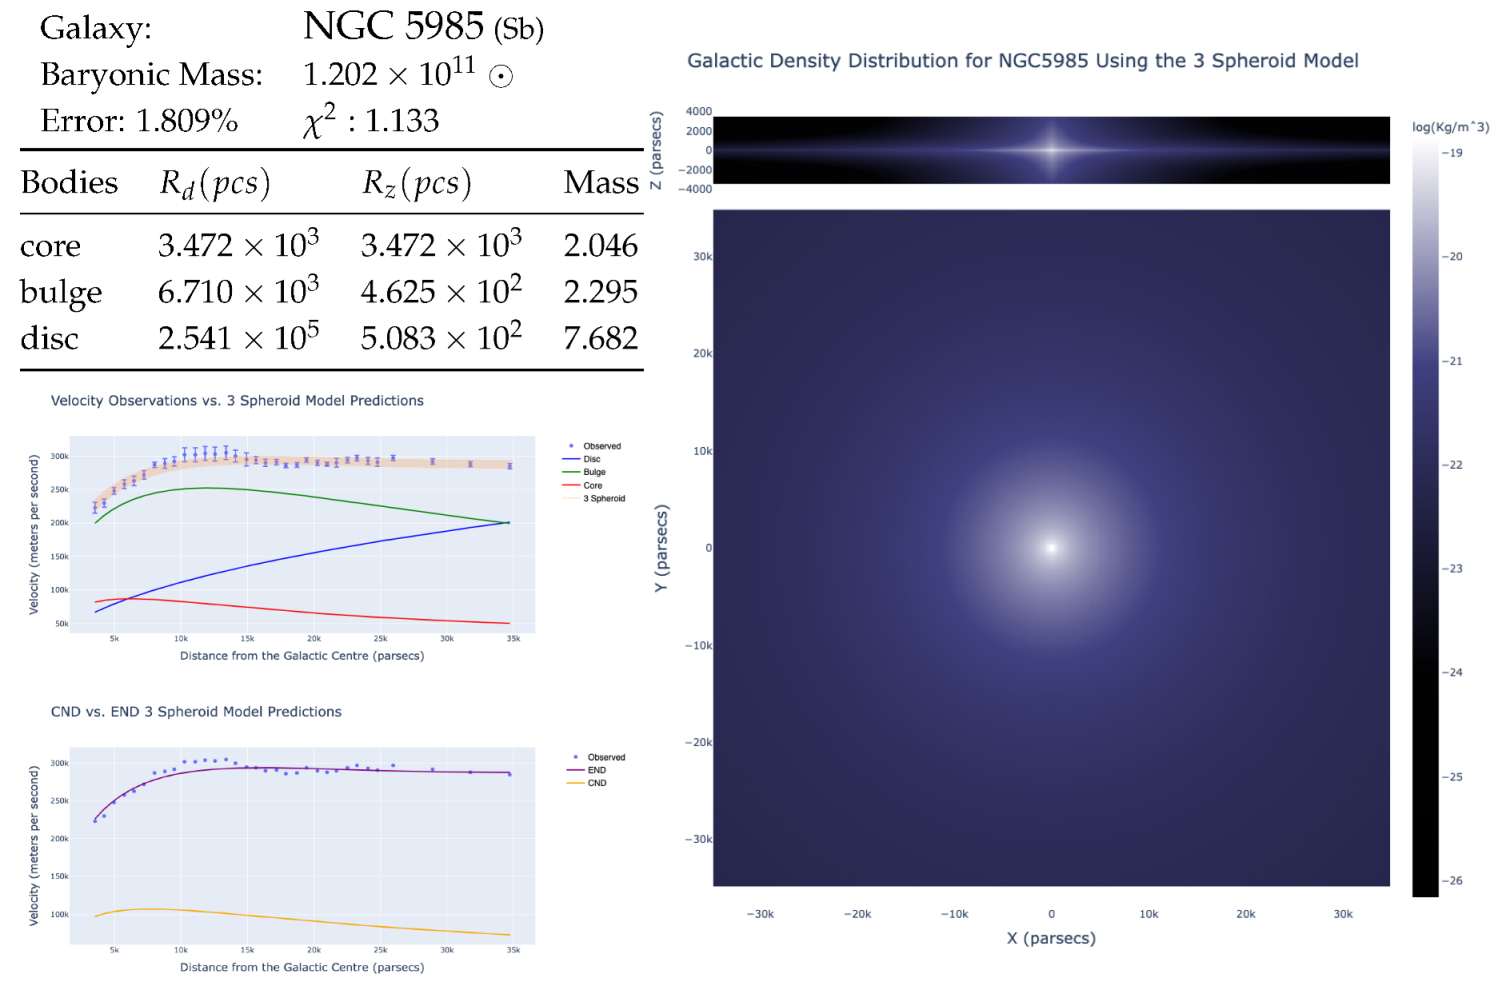
| NGC 5985 | 33 | 26 | 1.81 | 1.13 |
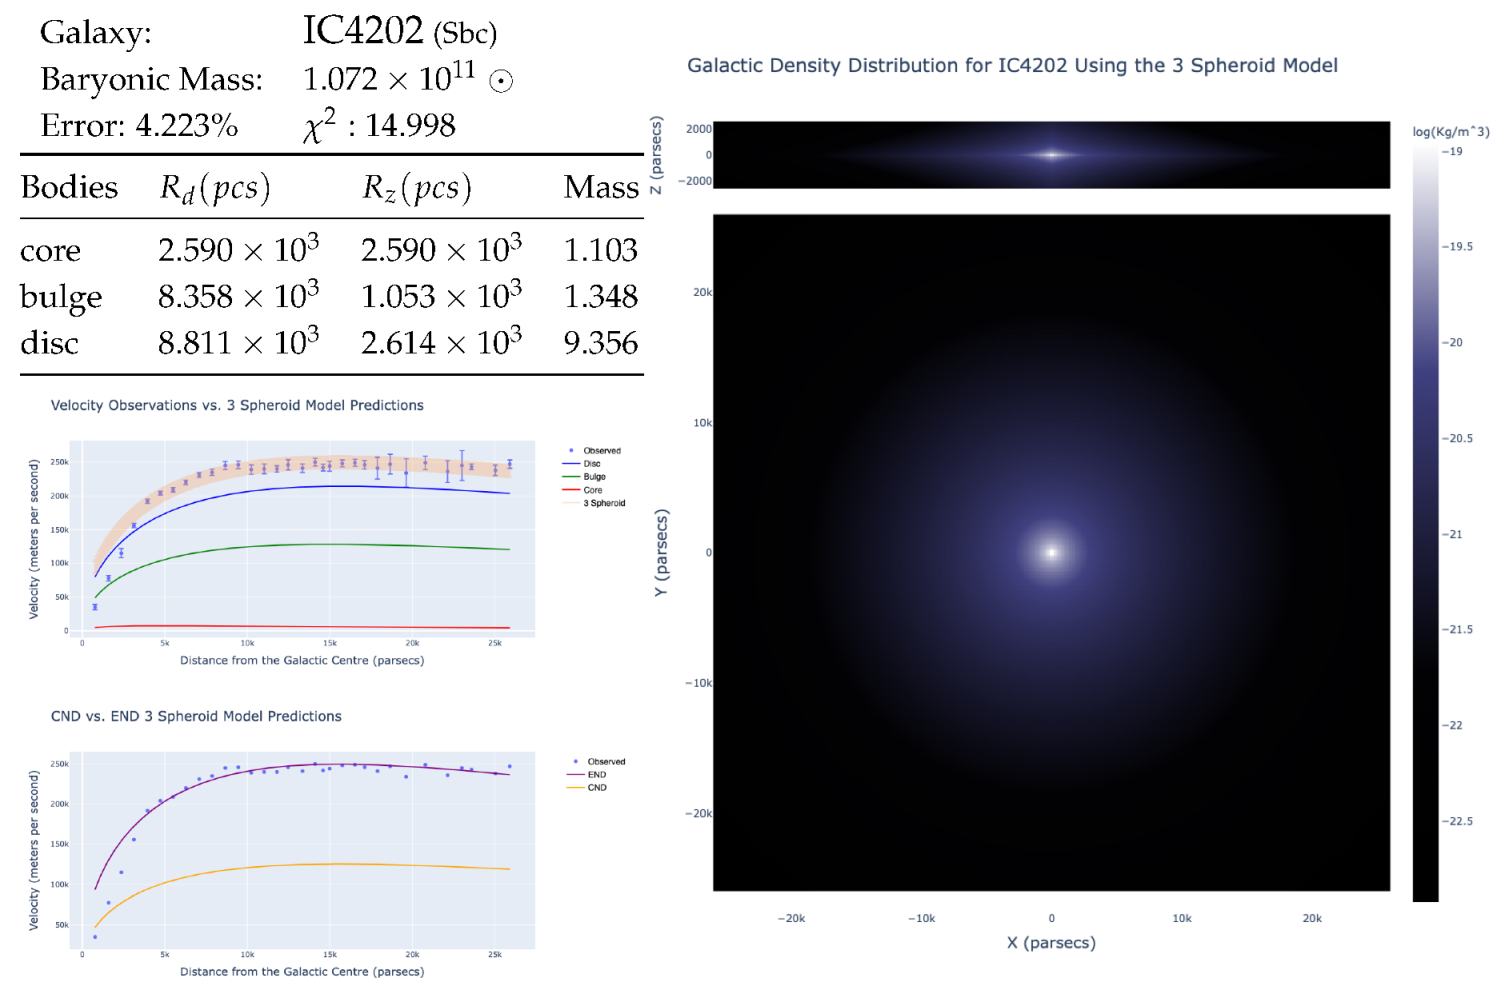
| IC4202 | 32 | 20 | 4.22 | 15.00 |
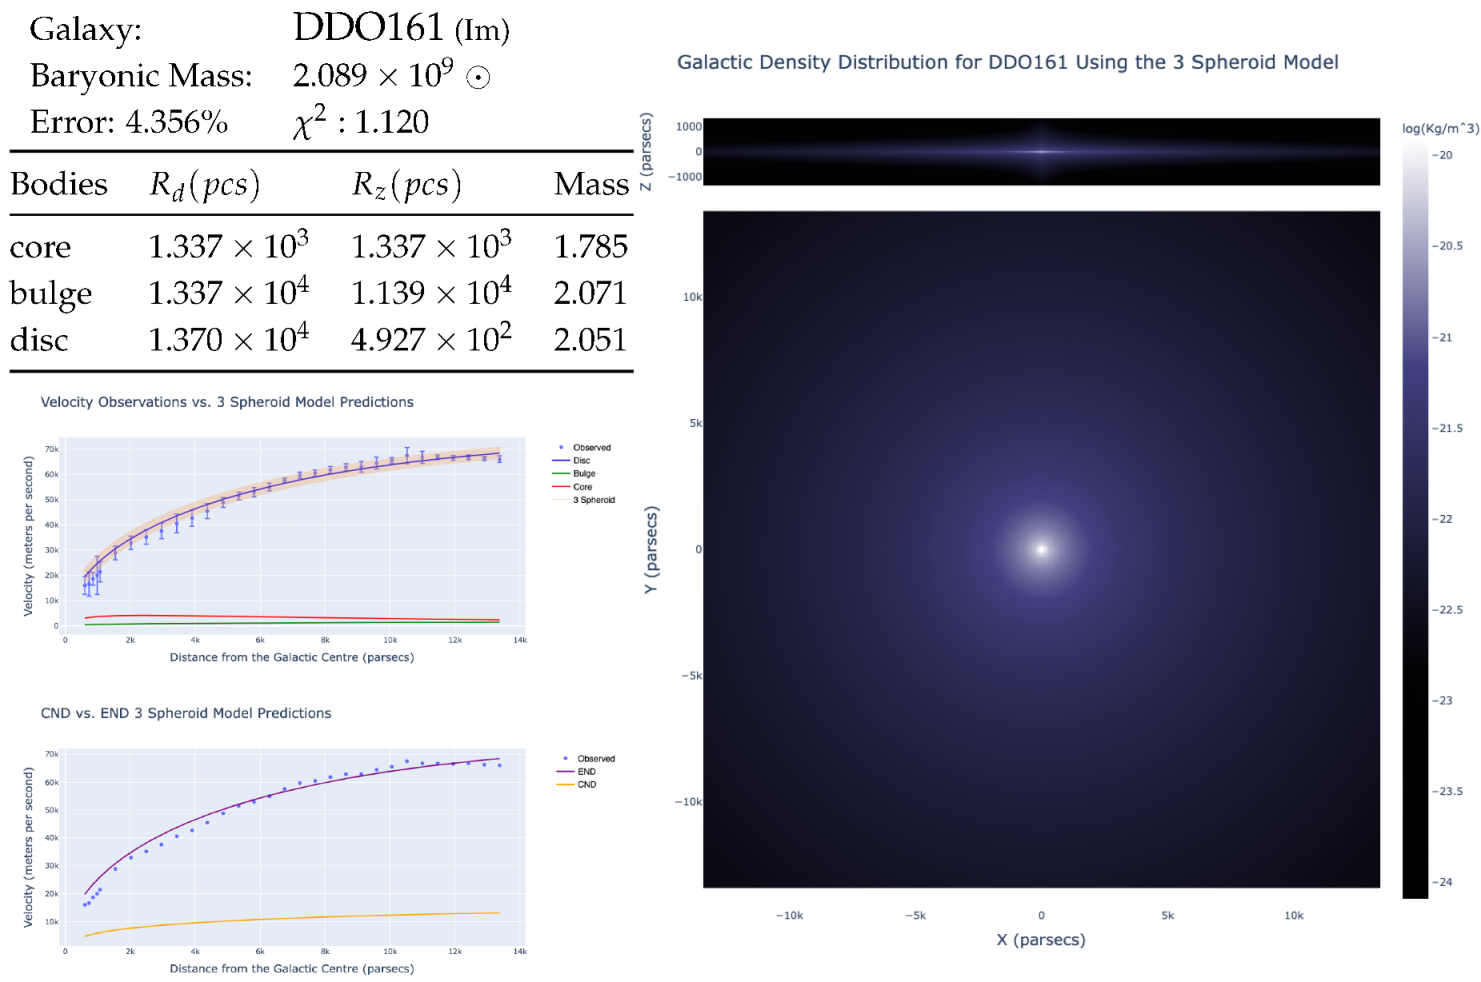
| DDO161 | 31 | 13 | 4.36 | 1.12 |
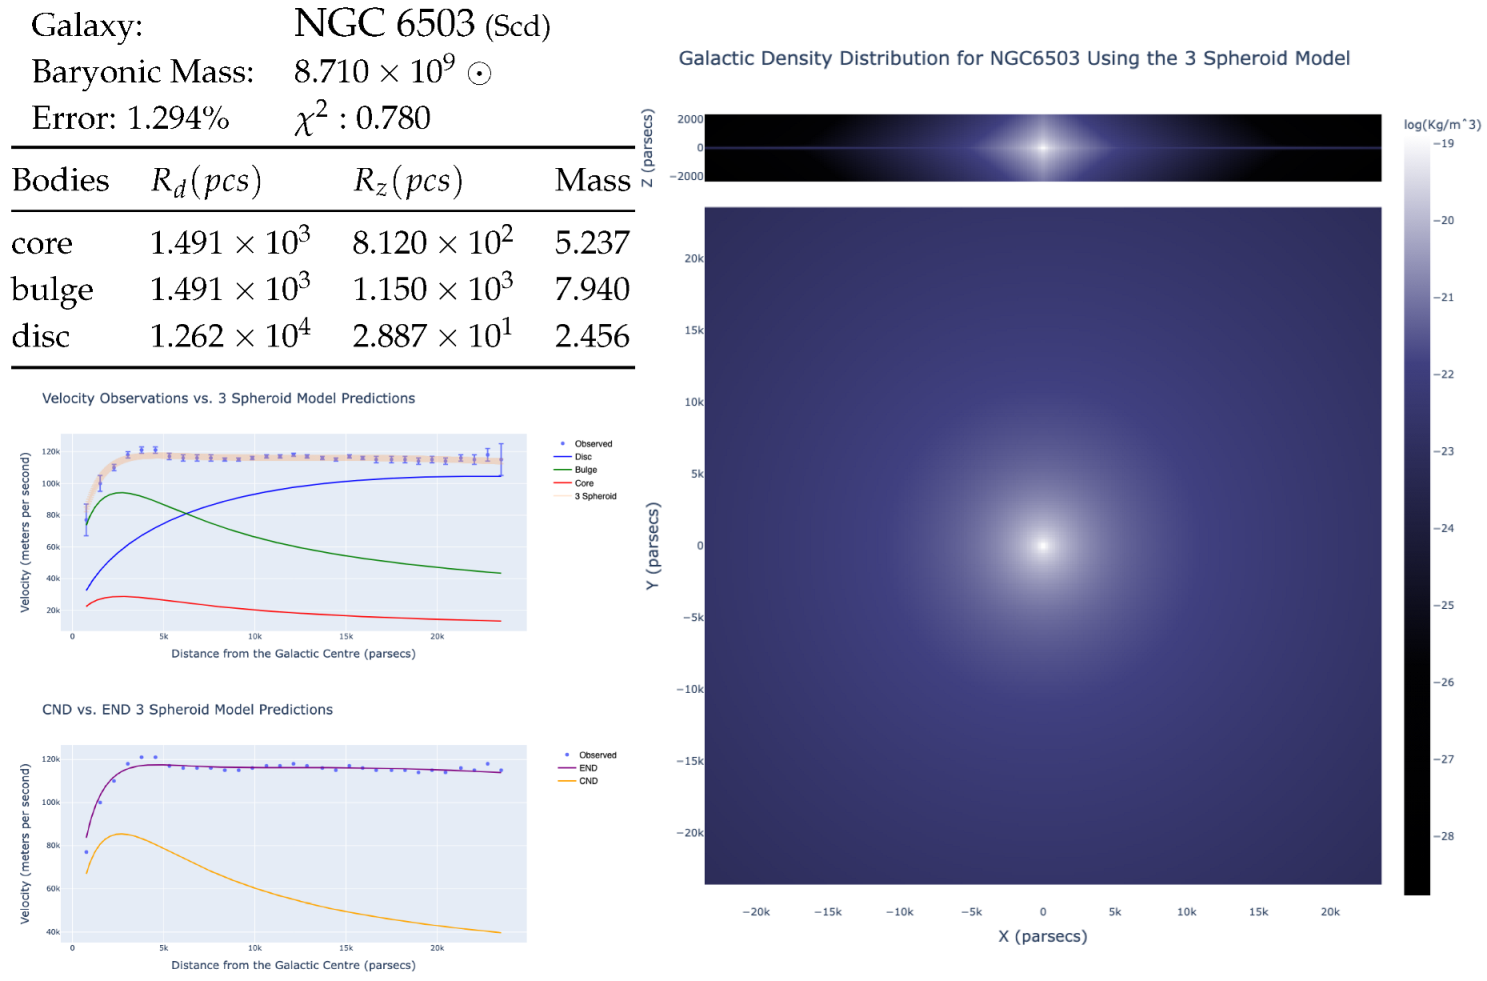
| NGC 6503 | 31 | 27 | 1.29 | 0.78 |
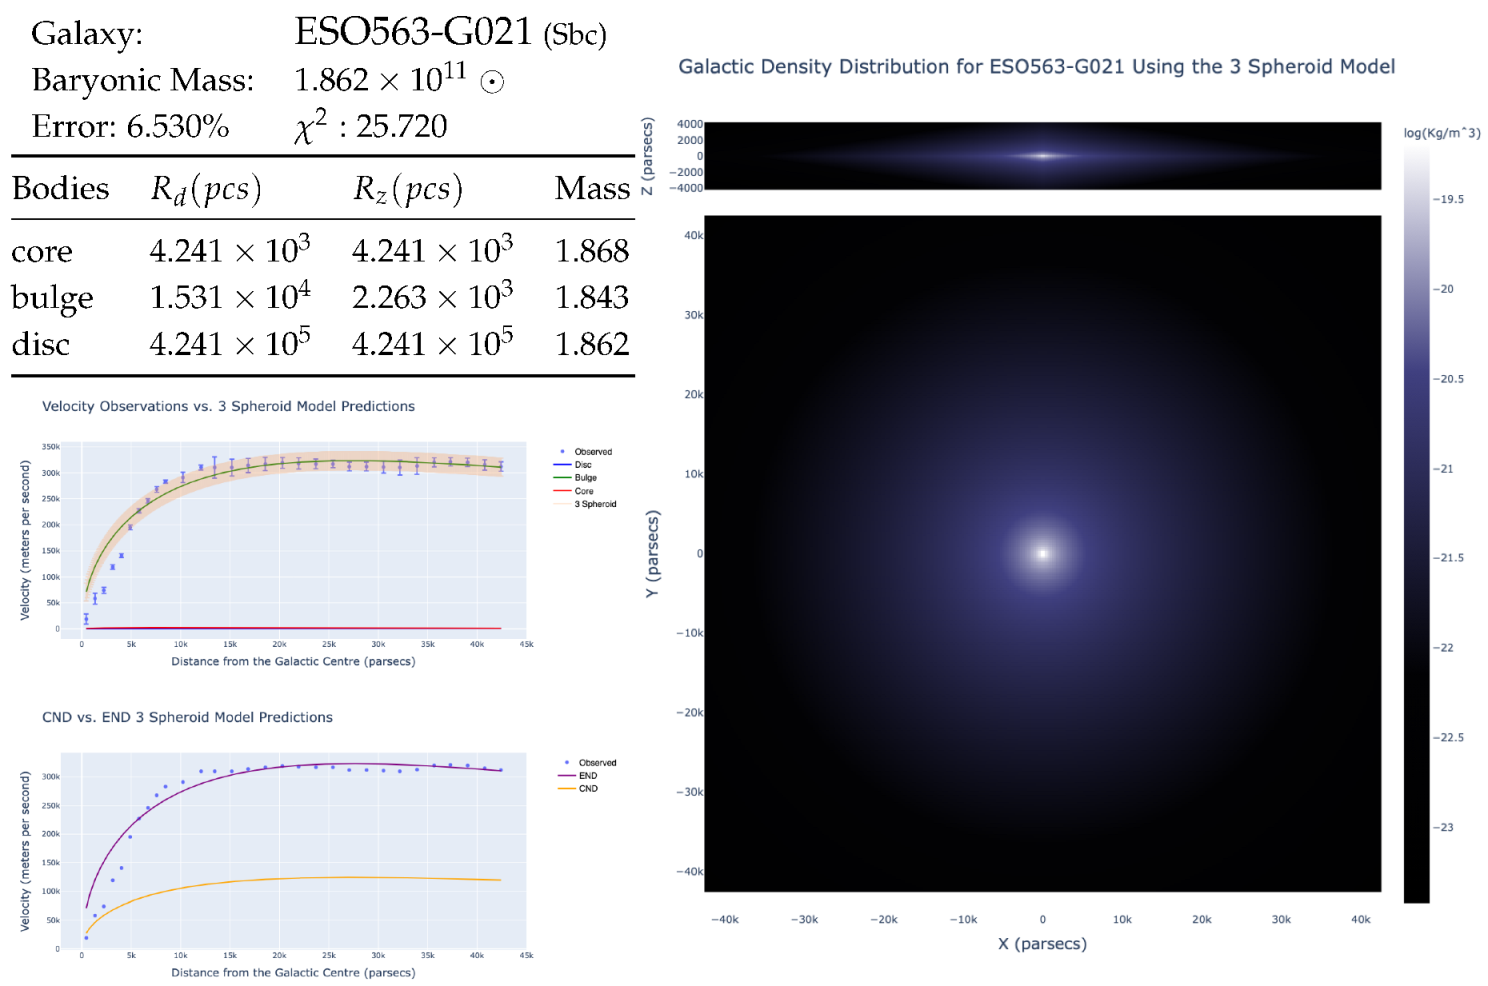
| ES O563-G021 | 30 | 15 | 6.53 | 25.72 |
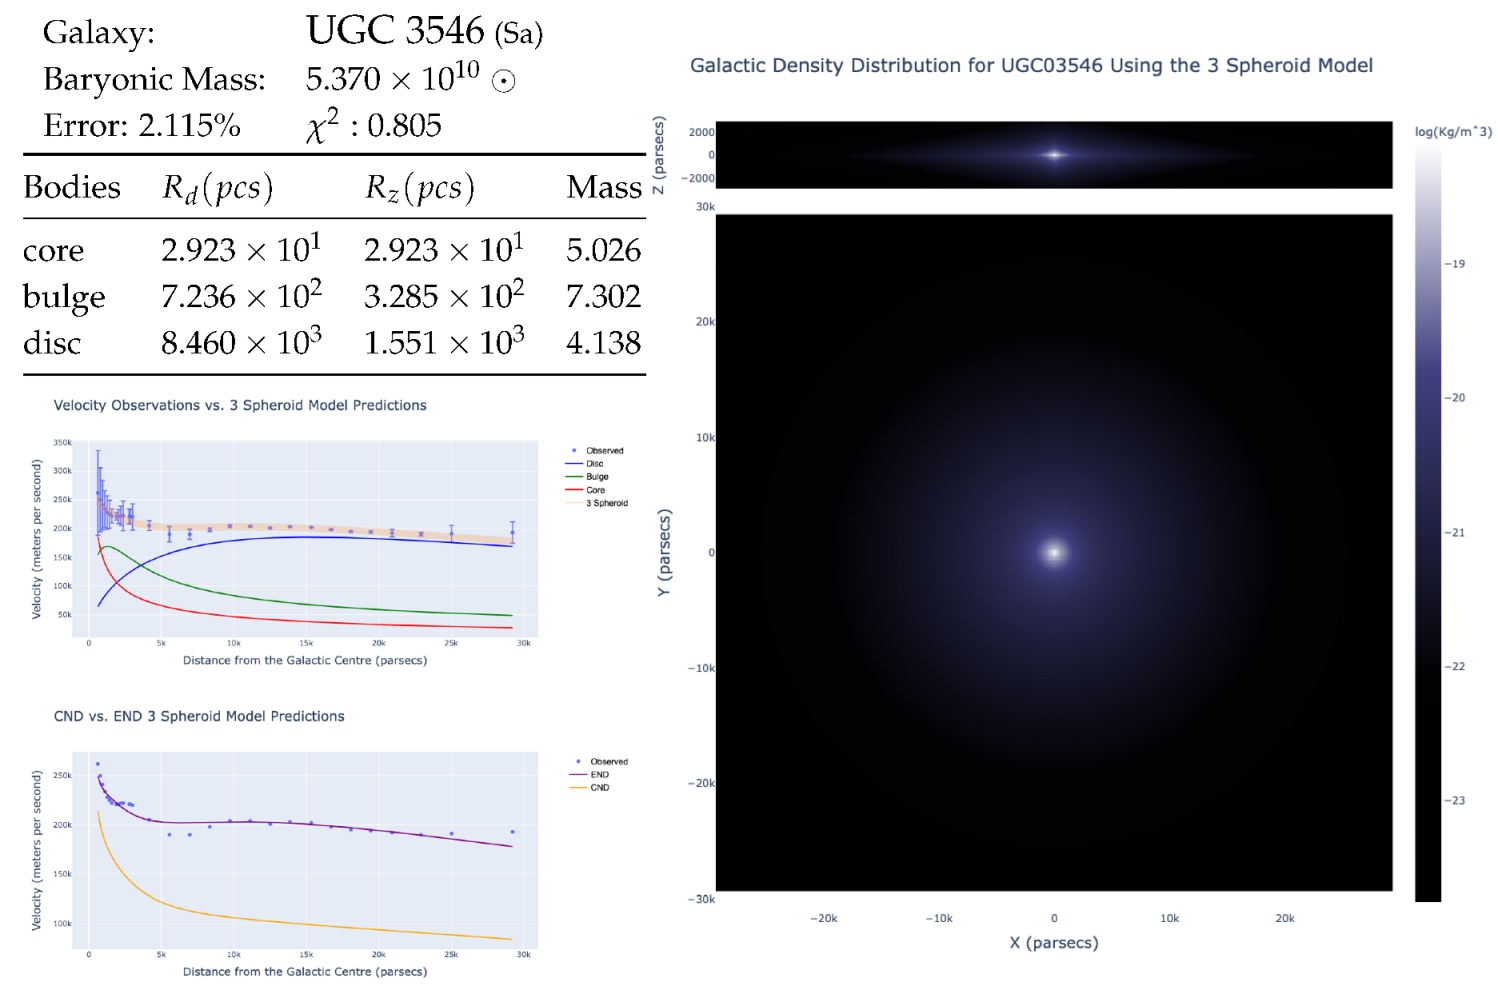
| UGC 3546 | 30 | 11 | 2.12 | 0.81 |
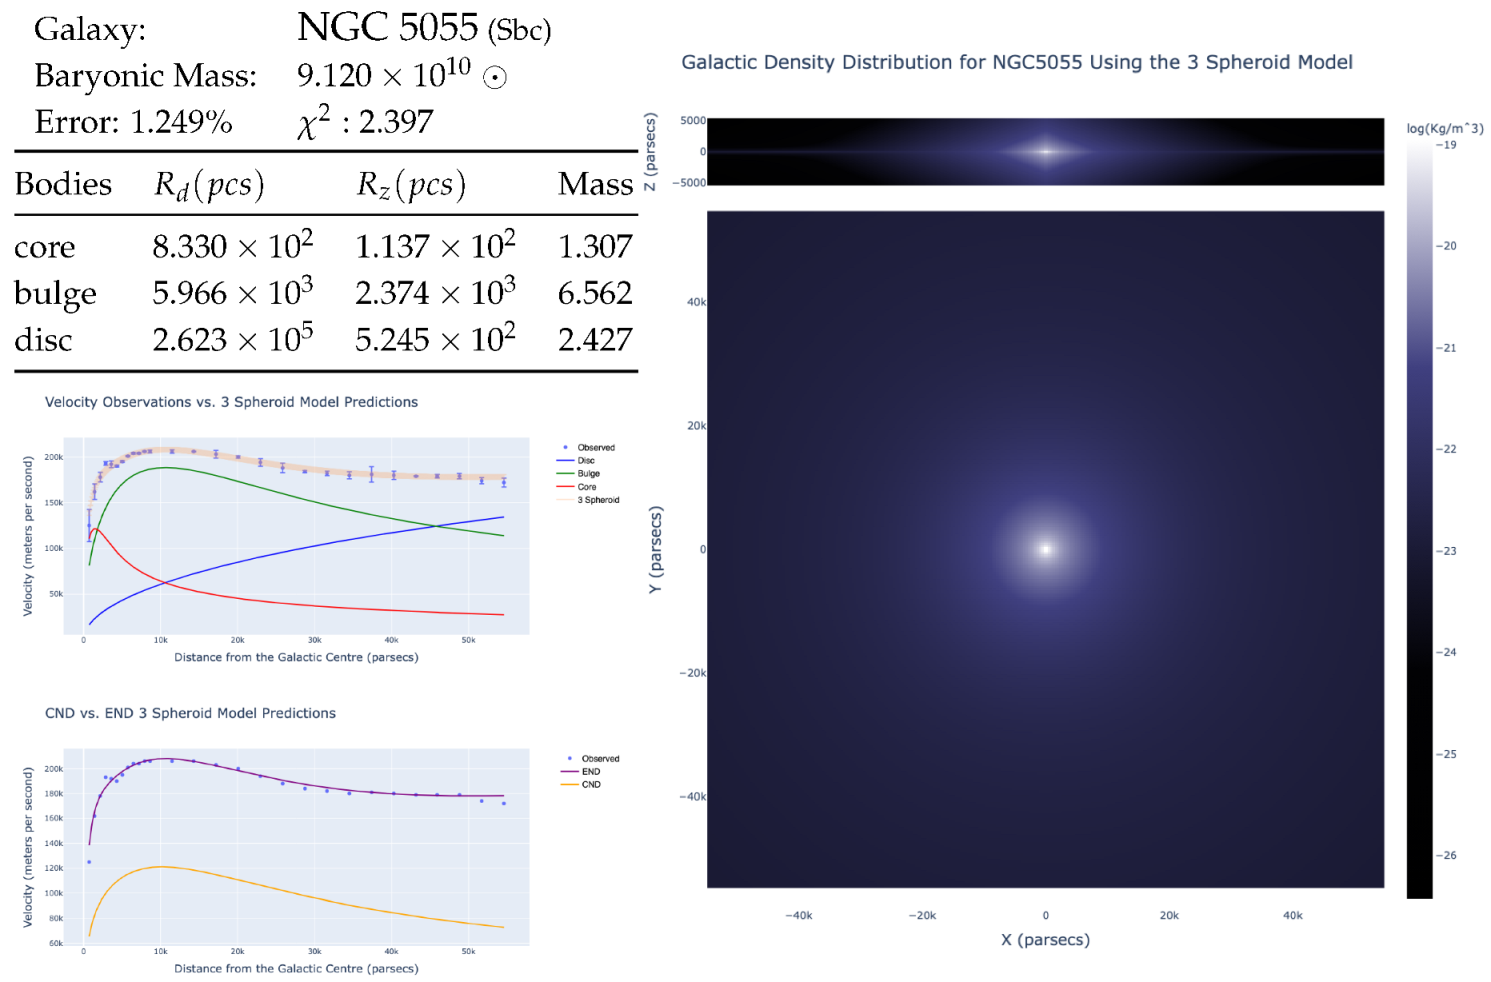
| NGC 5055 | 28 | 25 | 1.25 | 2.40 |
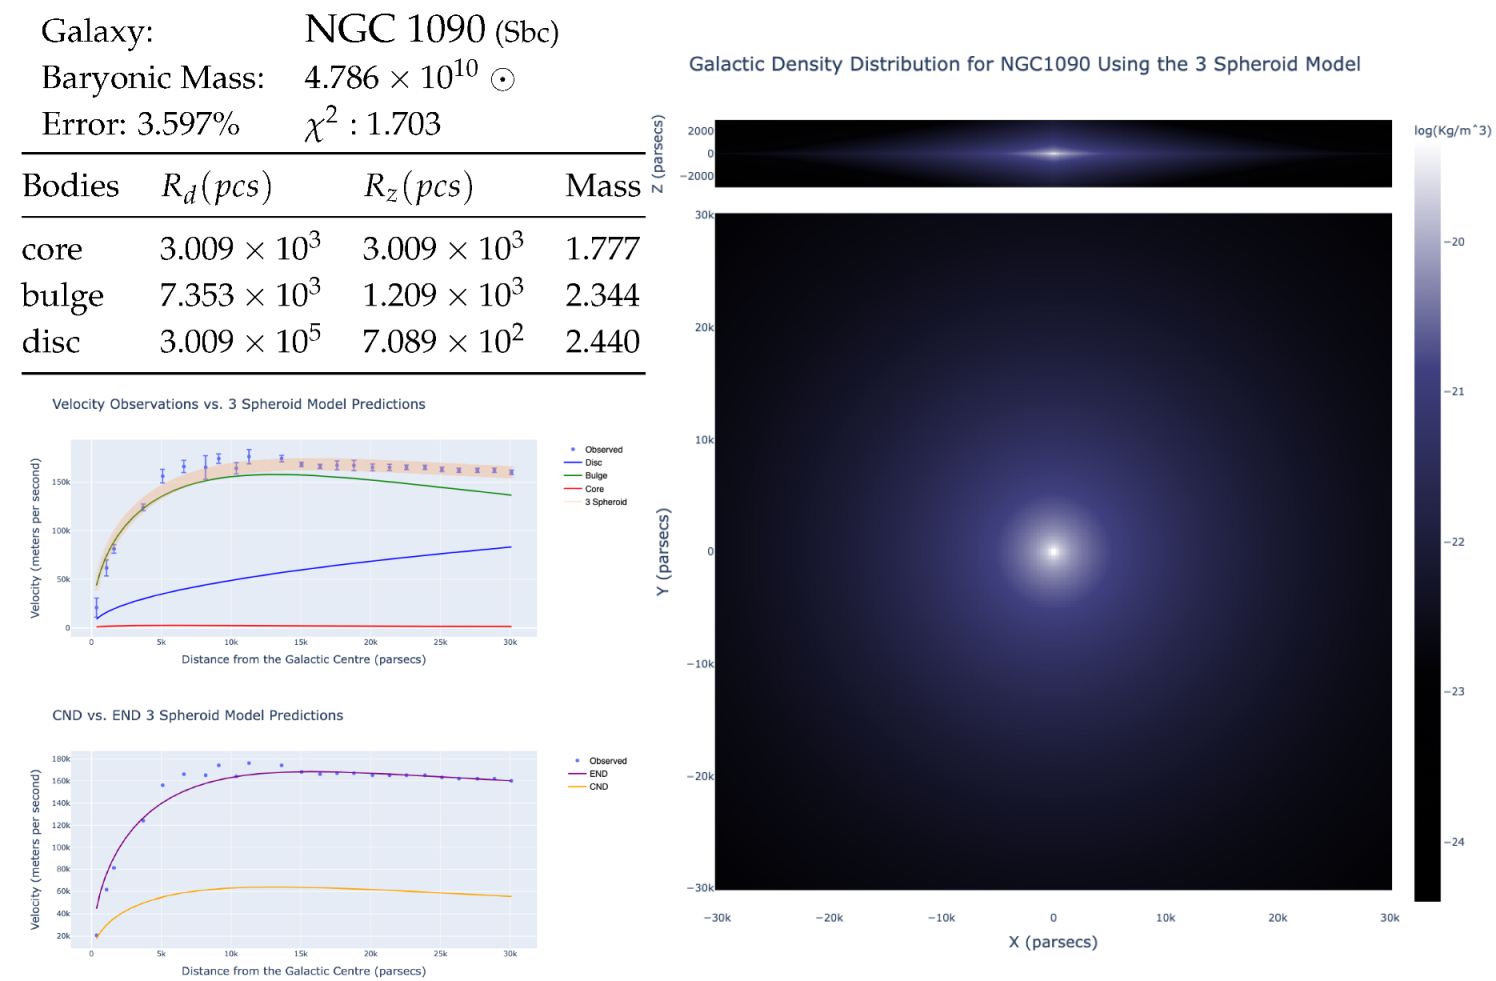
| NGC 1090 | 24 | 15 | 3.6 | 1.70 |
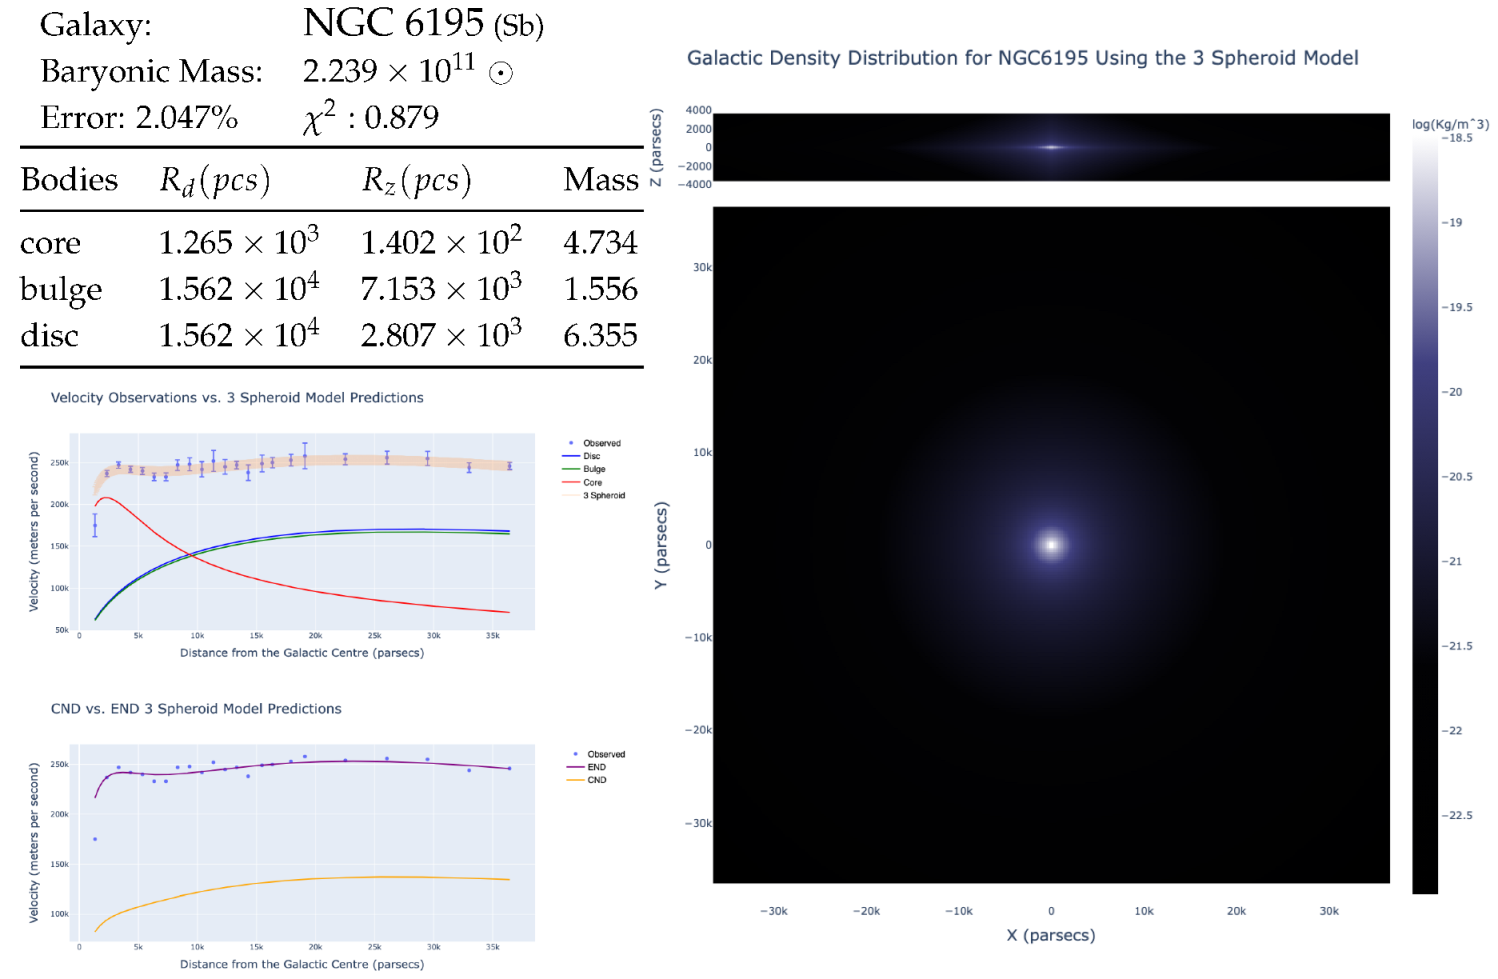
| NGC 6195 | 23 | 13 | 2.05 | 0.88 |
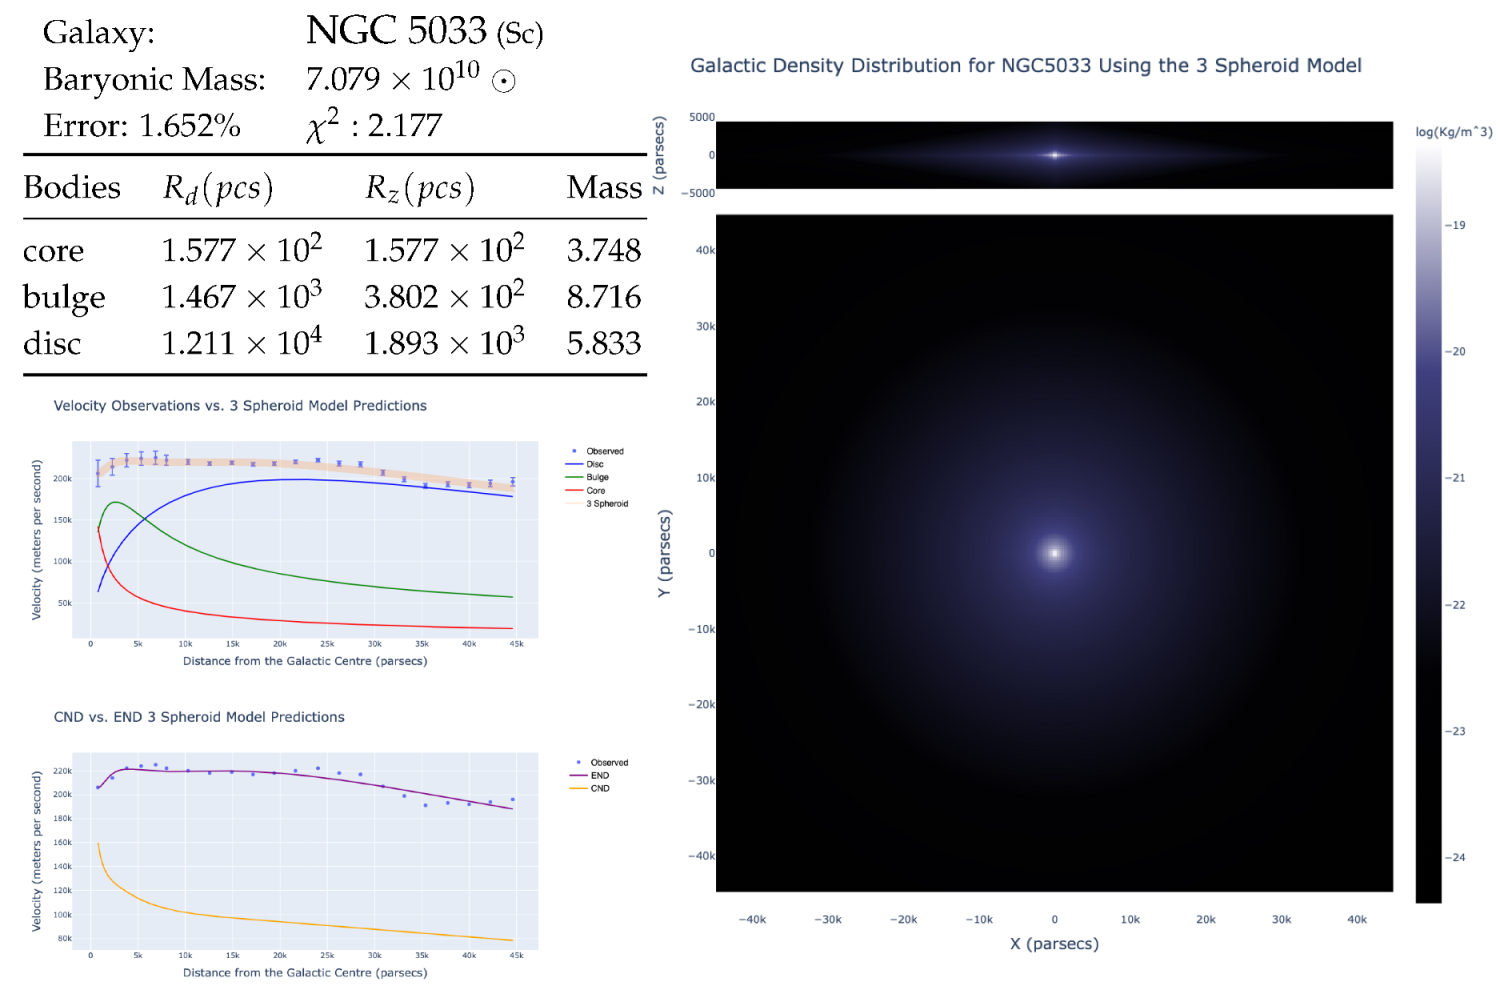
| NGC 5033 | 22 | 17 | 1.65 | 2.18 |
| UGC 128 | 22 | 18 | 2.12 | 3.01 |
| NGC 5371 | 19 | 17 | 1.95 | 2.42 |
| NGC 5907 | 19 | 17 | 1.15 | 2.13 |
| NGC 891 | 18 | 16 | 0.98 | 0.31 |
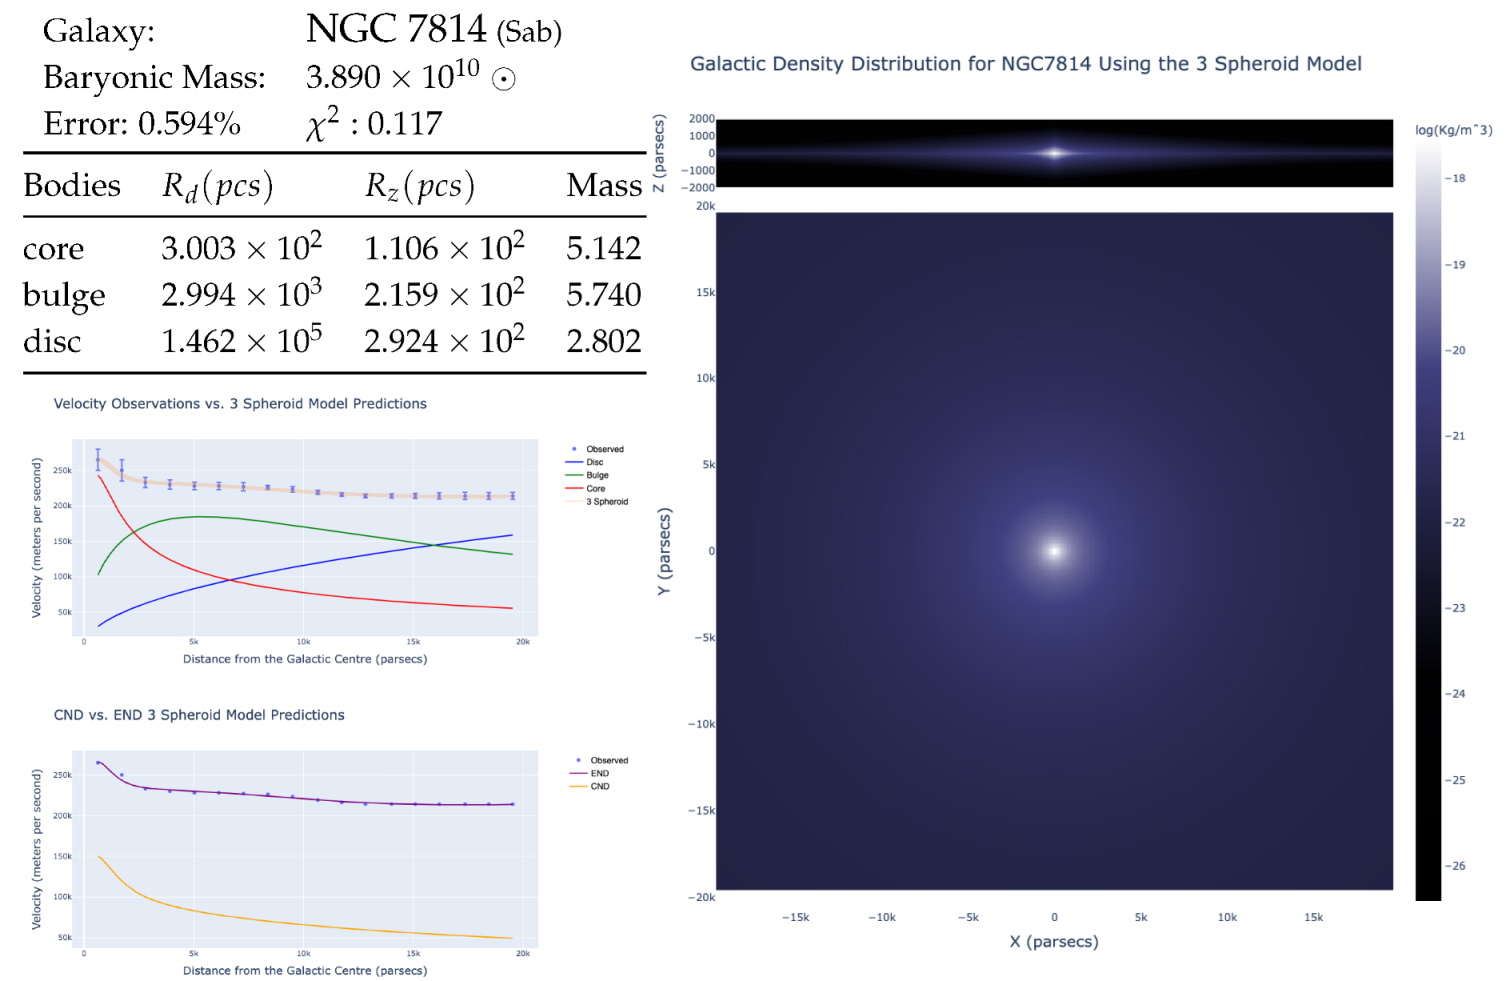
| NGC 7814 | 18 | 15 | 0.59 | 0.12 |
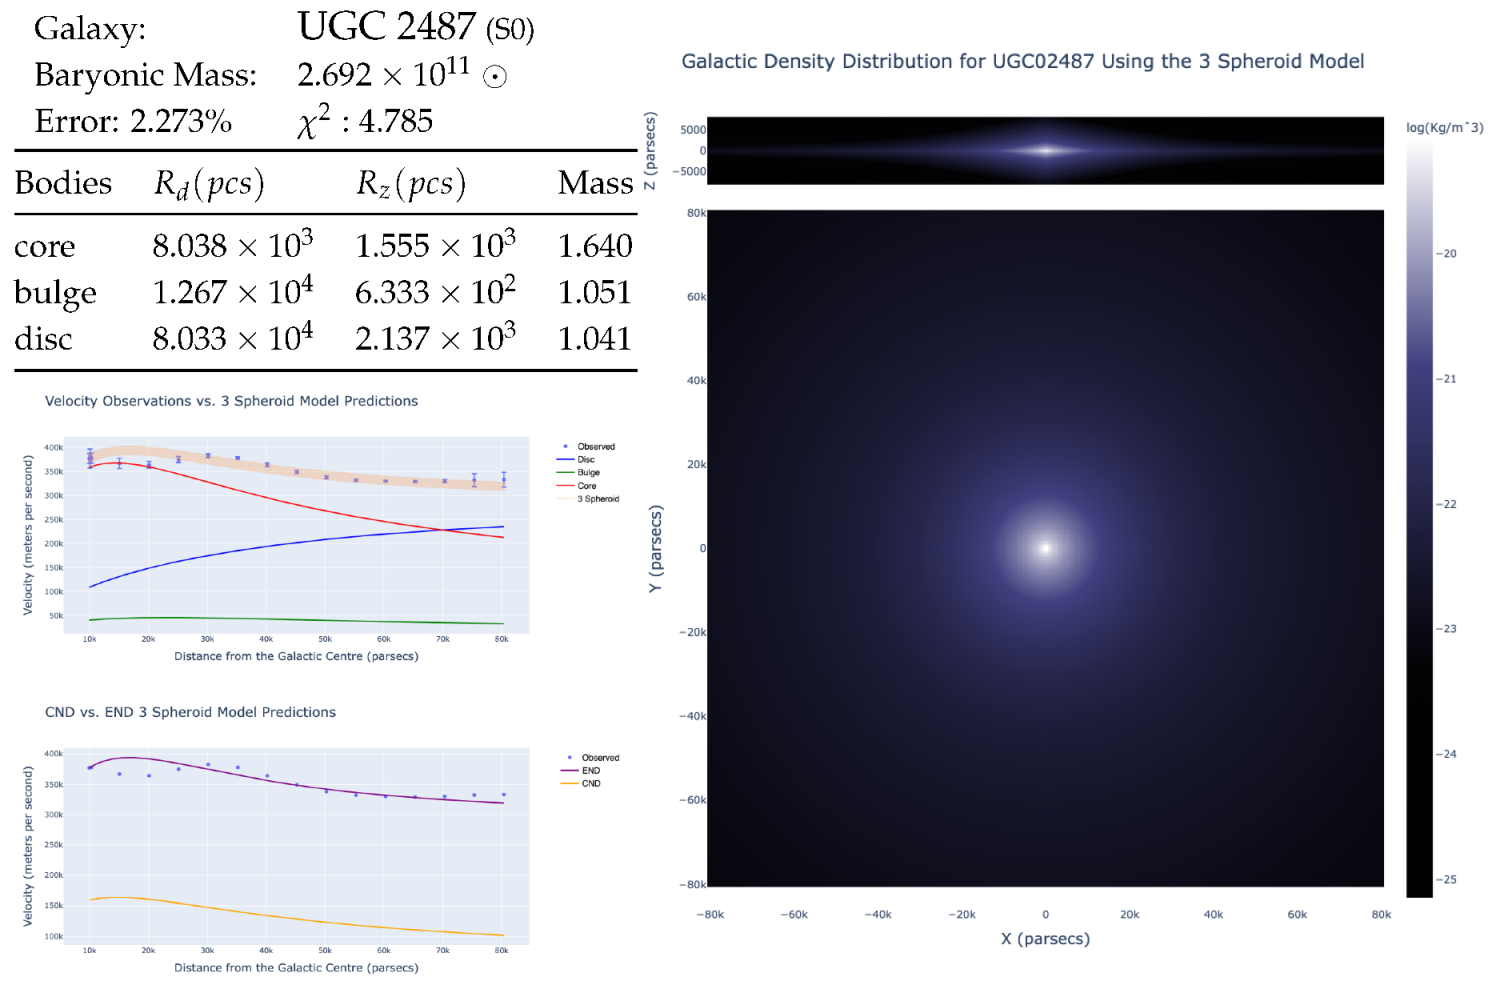
| UGC 2487 | 17 | 14 | 2.27 | 4.78 |
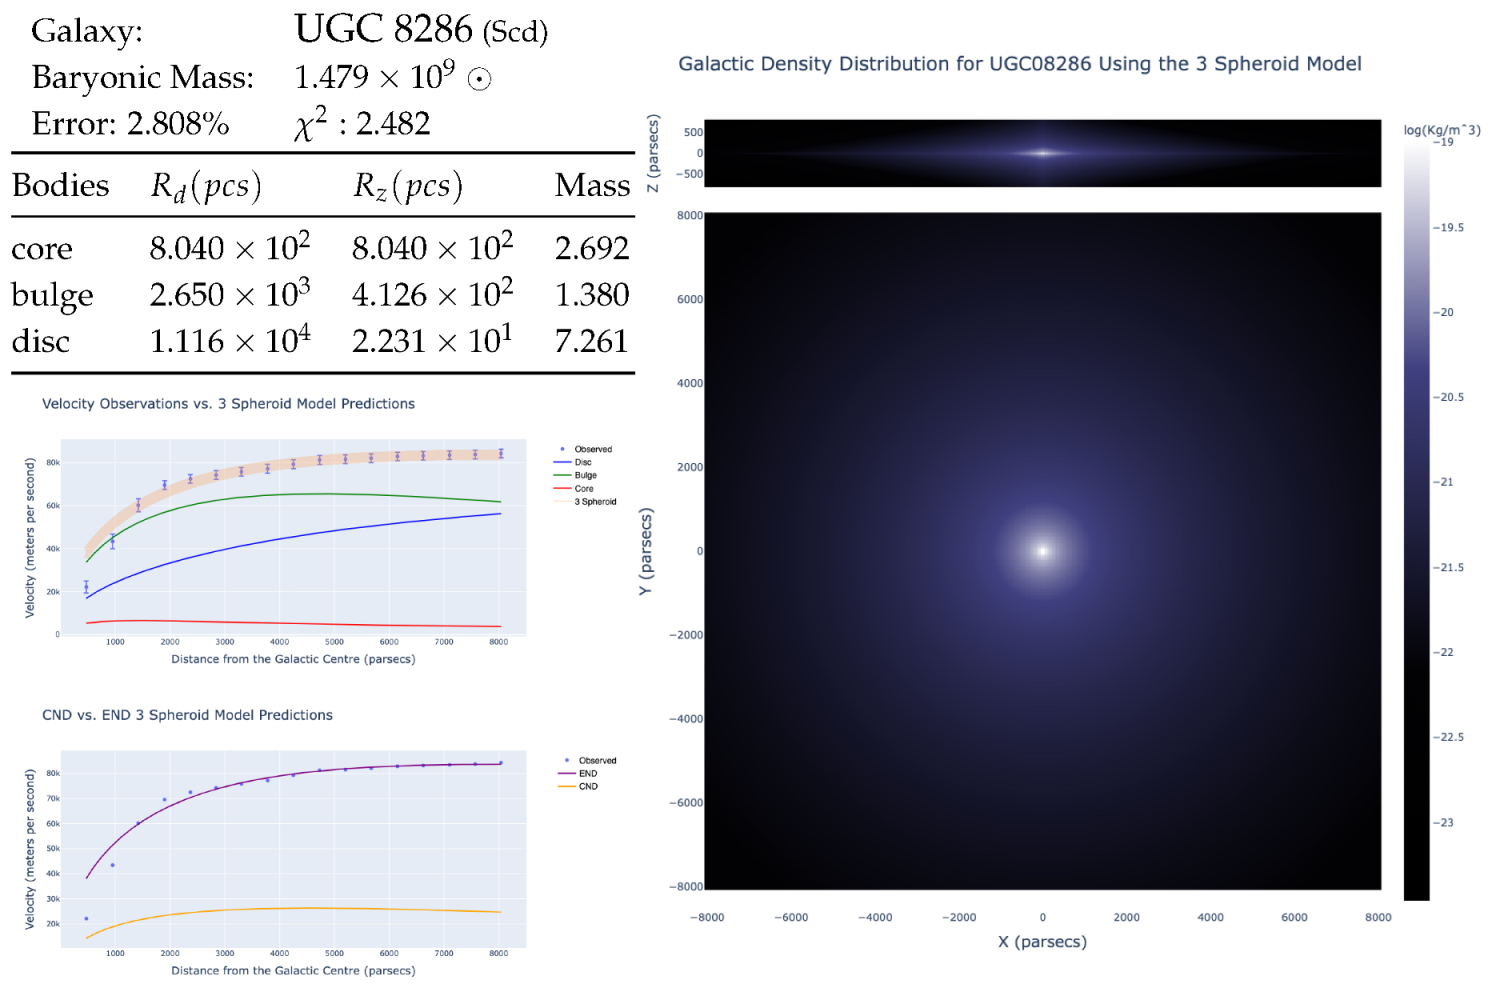
| UGC 8286 | 17 | 14 | 2.81 | 2.48 |
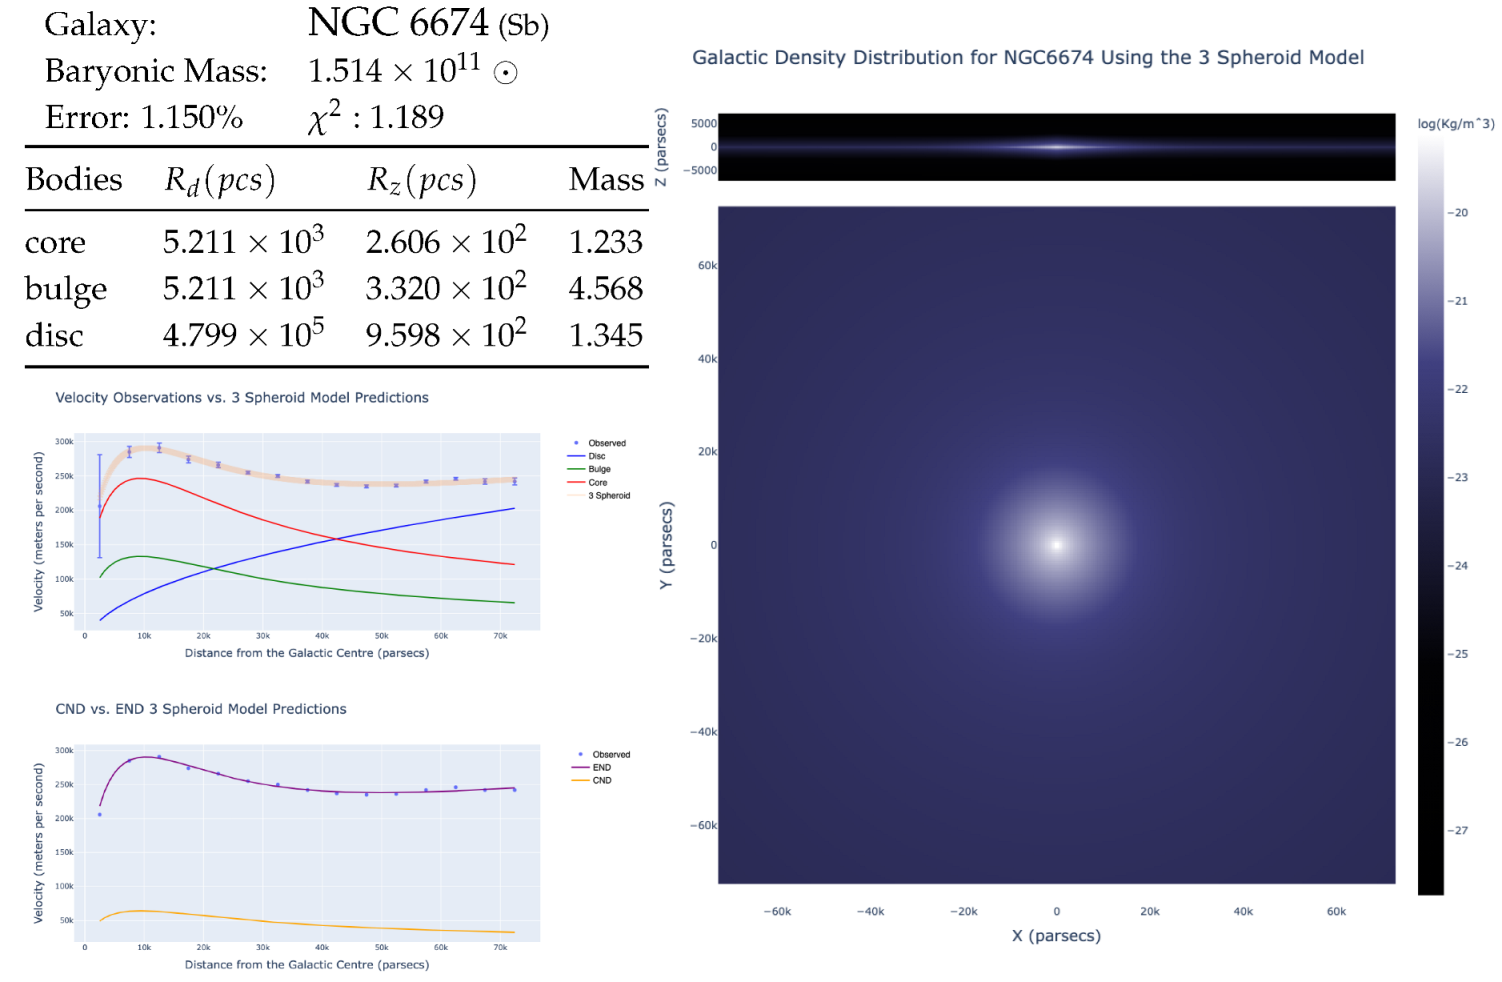
| NGC 6674 | 15 | 14 | 1.15 | 1.19 |