Article

FraudDebate-Agent: A Multi-Agent LLM Framework with an Evidence-Based Debate Mechanism for Financial Statement Fraud Detection

1
Daniels College of Business, University of Denver, Denver, CO 80210, USA
2
David A. Tepper School of Business, Carnegie Mellon University, Pittsburgh, PA 15213, USA
3
School of Computer Science, Carnegie Mellon University, Pittsburgh, PA 15213, USA
*
Author to whom correspondence should be addressed.
Mathematics 2026, 14(15), 2695; https://doi.org/10.3390/math14152695
Submission received: 22 June 2026 / Revised: 16 July 2026 / Accepted: 21 July 2026 / Published: 27 July 2026

Abstract

Financial statement fraud inflicts large and recurring losses on capital markets, yet the dominant detection paradigm still relies on single, black-box classifiers (e.g., RUSBoost) trained on structured accounting ratios alone. Two limitations follow: (i) the rich, unstructured Management Discussion and Analysis (MD&A) narrative of the 10-K filing is discarded, and (ii) the resulting scores are difficult for auditors to trust because they carry no transparent, standards-aligned rationale. Recent large language model (LLM) systems have shown that multi-agent collaboration is more robust than a single LLM for anomaly detection, but no study has systematically transferred this paradigm to listed-company statement fraud. We propose FraudDebate-Agent, a four-role multi-agent system in which a Quantitative Analyst agent scores 28 raw accounting items and 14 ratios with gradient-boosted and tabular attention models, a Narrative Auditor agent quantifies tone, linguistic uncertainty, and year-over-year textual novelty of the MD&A with FinBERT, and an Industry Peer agent uses retrieval-augmented generation to measure industry-relative anomaly. A Critic–Debate agent then orchestrates a pair-wise Evidence-based Multi-Agent Debate (EMAD) that reconciles disagreement across modalities and arbitrates a reconciled fraud-risk assessment, which is aggregated over a tri-modal evidence graph. Our contributions are as follows: (1) the first use of an evidence-grounded debate mechanism for accounting fraud, which materially reduces LLM hallucination; (2) a numerical–textual–peer evidence graph that fuses heterogeneous signals; and (3) an explainable report aligned with the PCAOB AS 2401 fraud-risk taxonomy. On AAER-labelled firm-years linked across a SEC financial dataset and EDGAR-CORPUS, FraudDebate-Agent improves the area under the ROC curve and the rare-event ranking metric NDCG@k over the strongest single-modality and single-LLM baselines while producing substantially more faithful explanations. We frame the system as a fraud-risk screening and risk-ranking tool for AAER-labelled misstatement risk rather than a determination of fraudulent intent. We report results over multiple seeds to reflect real-world stochasticity and discuss limitations and cross-domain applications.

1. Introduction

Corporate financial misreporting is neither rare in aggregate nor cheap. Surveys of occupational fraud place median per-case losses in the hundreds of thousands of dollars and total annual losses in the trillions [1], and structural estimates suggest that only a fraction of fraud is ever detected [2]. Because undetected misstatement distorts the price system and erodes investor trust, the timely flagging of suspicious filings is a first-order problem for regulators, auditors, and investors alike.
The academic and practitioner response has converged on supervised statistical learning. Early ratio-based discriminants such as the Beneish M-score [3] and the Dechow et al. F-score [4] model the probability of misstatement from a small set of accrual- and performance-based ratios. Cecchini et al. [5] mapped raw accounting numbers into a richer feature space through a support-vector machine with a financial kernel, and Perols [6] benchmarked a battery of statistical and machine-learning classifiers. The current reference point is Bao et al. [7]. It shows that an ensemble learner (RUSBoost [8]) trained on 28 raw accounting variables, rather than hand-engineered ratios, outperforms the classical models, and they introduce a rank-aware evaluation metric appropriate to the extreme class imbalance of fraud.
Despite this progress, two limitations persist. First, the dominant pipeline ignores the narrative half of the disclosure. The MD&A section of the 10-K is where management explains results in prose, and a large literature shows that its tone, uncertainty, and linguistic style carry information about financial outcomes and misconduct [9,10,11,12]. Models that fuse ratios with text, e.g., the hierarchical attention network of Craja et al. [13] or the textual-disclosure deep models of Mai et al. [14], improve detection, but they remain single, end-to-end black boxes. Second, and relatedly, the outputs are opaque: a calibrated probability is not, by itself, the kind of structured, evidence-cited rationale that professional standards such as PCAOB AS 2401 require an auditor to document when assessing fraud risk [15].
Large language models (LLMs) [16,17,18,19] offer a route to evidence-cited reasoning because they can read prose, follow auditing checklists, and explain themselves in natural language. Yet a single LLM is brittle: it hallucinates, is sensitive to prompt framing, and conflates fluent narration with factual grounding. A growing body of work shows that multi-agent LLM systems, in which several specialised agents reason, act, and critique one another [20,21,22,23,24], are more robust than a monolithic model. In the anomaly-detection setting specifically, Park [25] use a collaborative agent network to validate financial-market alerts, and Song et al. [26] introduce Audit-LLM for log-based insider-threat detection, whose pair-wise Evidence-based Multi-Agent Debate (EMAD) mechanism reduces faithfulness hallucinations by forcing two executors to reconcile their conclusions through an exchange of grounded reasoning. To our knowledge, however, this paradigm has not been systematically applied to financial statement fraud on listed firms, where the central difficulty is precisely the reconciliation of numerical red flags with narrative ones under severe label scarcity.

1.1. Our Approach

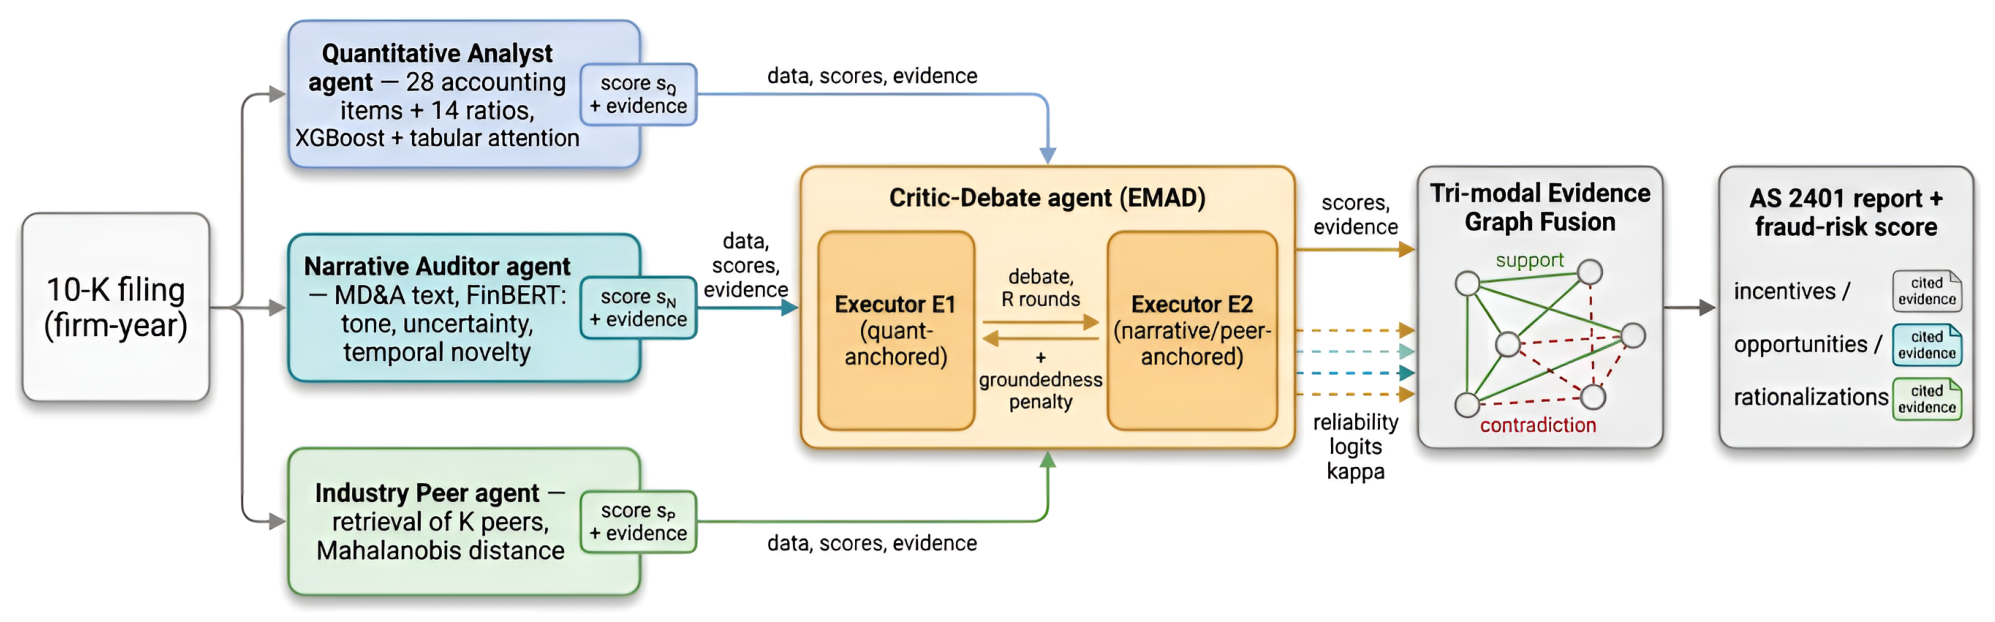
We propose FraudDebate-Agent, a four-role multi-agent system that mirrors how an audit team actually divides labour (Figure 1). A Quantitative Analyst agent scores the structured inputs of Bao et al. [7] with gradient-boosted trees [27] and a tabular attention model. A Narrative Auditor agent reads the MD&A and quantifies tone, linguistic uncertainty, and year-over-year textual novelty with the financial language model FinBERT [28,29]. An Industry Peer agent uses retrieval-augmented generation [30] to compare the firm against same-industry, same-period peers and computes an industry-relative anomaly score. Because these three signals routinely disagree, a Critic–Debate agent orchestrates an EMAD-style debate [20,26] between a quantitatively anchored and a narratively anchored executor and arbitrates a reconciled fraud-risk score that is aggregated over a heterogeneous evidence graph.

1.2. Contributions

  • Evidence-based debate for accounting fraud. We are, to our knowledge, the first to bring an EMAD-style debate to listed-company statement fraud. Every claim that an executor advances must be tied to a retrieved numerical, textual, or peer evidence item; ungrounded claims are penalised. This turns the reconciliation of contradictory red flags into an explicit, auditable process and materially reduces hallucination relative to a single LLM (Section 5).
  • A tri-modal evidence graph. We formalise the fusion of numerical, textual, and peer-relative evidence as attention-weighted aggregation over a graph whose edges encode support and contradiction so that mutually corroborating signals are amplified and contradictory ones are discounted in a principled way.
  • Auditor-aligned explainability. FraudDebate-Agent emits a structured report keyed to the PCAOB AS 2401 fraud-risk taxonomy (incentives/pressures, opportunities, attitudes/rationalisations) [15], with each risk factor accompanied by its supporting evidence and the debate transcript.
  • Empirical validation under realistic stochasticity. On AAER-labelled firm-years linked across the Bao et al. dataset and EDGAR-CORPUS [31], FraudDebate-Agent improves AUC and NDCG@k over strong single-modality, fusion, and single-LLM baselines. We report mean±standard deviation over multiple random seeds and LLM samples, and test significance, so that conclusions are robust to real-world randomness.

1.3. Research Questions

This study is organised around four research questions, which the experiments in Section 5 answer in turn. Q1: Does cross-modal multi-agent detection beat the best single-modality and fusion baselines? Q2: Does the EMAD debate help, how many rounds are needed, and on which filings does it help or fail? Q3: Does each agent and each fusion mechanism contribute (ablation)? Q4: Does the debate improve faithfulness and calibration, that is, are the explanations trustworthy and are the risk scores actionable under a fixed audit budget?
The remainder of this paper is organised as follows. Section 2 reviews related work. Section 3 formalises the problem and the three modalities. Section 4 details FraudDebate-Agent. Section 5 reports datasets, baselines, metrics, setup, and results. Section 6 concludes with limitations, improvements, and cross-domain applications.

2. Related Work

2.1. Machine Learning for Statement Fraud

The structured-data tradition models misstatement probability from financial ratios or raw accounting numbers. Ratio-based scoring rules [3,4] are interpretable but limited in capacity. Kernel and ensemble methods improved discrimination: Cecchini et al. [5] introduced a financial-kernel SVM, Perols [6] compared statistical and machine-learning classifiers, and Kim et al. [32] used cost-sensitive multi-class learning to address fraud intention and imbalance. Temporal Transformer–CTGAN models provide an effective solution for sequential and imbalanced fraud detection [33]. Bao et al. [7] established the current benchmark by pairing RUSBoost [8] with 28 raw accounting variables and by adopting a rank-aware metric (NDCG@k) suited to the roughly one-percent base rate of fraud. These models are strong on numbers but, by construction, blind to the narrative disclosure and difficult to interpret.

2.2. Textual Analysis of Corporate Disclosures

A parallel literature mines disclosure text. Dictionary methods, most influentially the finance-specific word lists of Loughran and McDonald [9], measure tone and uncertainty; Loughran and McDonald [10] survey the field. Text has been linked directly to fraud and deception [11,12]. Deep models advanced text representation: Mai et al. [14] model textual disclosures for distress prediction, and Craja et al. [13] combine financial ratios with a hierarchical attention network over the MD&A, providing “red-flag” sentence interpretability. Trimodal attention with contrastive evidence chains further advances multi-modal financial-statement fraud detection [34]. Domain language models, such as FinBERT in both its sentiment [28] and information-extraction [29] forms, built on BERT [35] and the transformer [36], further improve financial text understanding. These works confirm that the MD&A is informative, but they fuse text and numbers inside one opaque network rather than reasoning across them explicitly.

2.3. LLMs in Finance

General LLMs [16,17,18,19] and finance-specialised models such as BloombergGPT [37] and FinGPT [38] can read filings, follow instructions, and explain their reasoning, especially when prompted to reason step by step [39] or to interleave reasoning with tool use [40]. Retrieval-augmented generation [30] grounds such reasoning in external evidence and reduces hallucination, which is central when the comparison set (industry peers) lives outside the model’s parameters.

2.4. Multi-Agent LLM Systems and Debate

Single LLMs are brittle; multi-agent collaboration is more robust. Du et al. [20] show that letting multiple model instances debate over several rounds improves factuality and reasoning, and Liang et al. [21] extend this to encourage divergent thinking. Frameworks such as MetaGPT [22] and AutoGen [23] structure agent roles and conversation; Guo et al. [24] survey the area. In anomaly detection, Park [25] validates financial-market alerts with a collaborative agent network, and Song et al. [26] propose Audit-LLM for insider-threat detection with a pair-wise EMAD mechanism that improves the faithfulness of explanations. Our work transfers and adapts the debate idea to statement fraud, where the key novelty is debating across modalities, numbers versus narrative versus peers, rather than between two homogeneous executors on a single log stream and where the output must satisfy an auditing standard [15].

2.5. Recent LLM-Based Fraud Detection and Audit Benchmarks (2025–2026)

A fast-growing 2025–2026 literature applies LLMs to statement fraud and audit reasoning and clarifies where our contribution sits. On LLM-based statement-fraud detection, Ergun [41] proposes DeepFraud, which tracks time-evolving FinBERT, FinLlama, and FinGPT embeddings of the MD&A with a recurrent model; it confirms that narrative signal is predictive but remains a single-model, end-to-end predictor without cross-modal reconciliation or a standards-aligned rationale. On multi-agent fraud-evidence discovery, Bai et al. [42] present AuditAgent, an expert-guided multi-agent system that retrieves and localises cross-document fraudulent evidence on Chinese-market enforcement data; it excels at evidence retrieval but does not stage an adversarial, grounded debate that reconciles contradictory numerical and narrative red flags. On audit reasoning, Wang et al. [43] propose UMAR, a multi-agent audit risk framework on SEC 10-Ks that fuses an MD&A agent, a ratio agent, and a critical-audit-matter agent with Dempster–Shafer evidence theory and models inter-agent conflict; this is the closest work in spirit, but it fuses conflict through evidence theory rather than an explicit, transcript-backed debate and does not emit a PCAOB AS 2401-keyed report. On audit-oriented benchmarks, EDINET-Bench [44] and AuditFraudBench [45] both report that frontier LLMs only marginally beat logistic regression and struggle to jointly reason over figures, narrative, and enforcement evidence, which directly motivates our move from monolithic prompting to a structured, grounded, multi-agent design. Against this backdrop, the distinctive contribution of FraudDebate-Agent is the combination of (i) an adversarial, evidence-grounded debate that reconciles cross-modal disagreement, (ii) a typed tri-modal evidence graph, and (iii) a standards-aligned, auditable report; we also adopt the PR-AUC and calibration reporting used by Wang et al. [43] for comparability (Section 5.4).

3. Preliminaries

3.1. Problem Formulation

We work at the firm-year level. Let i index a firm-fiscal-year observation with binary label y i { 0 , 1 } , where y i = 1 denotes a year that is subsequently subject to an SEC Accounting and Auditing Enforcement Release (AAER) for material misstatement, and y i = 0 otherwise. Each observation is a tuple of three modalities,
x i = a i , r i , τ i , c i , t i ,
where a i R 28 are the raw accounting items of Bao et al. [7], r i R 14 are the derived financial ratios, τ i is the MD&A text of the 10-K, c i is the firm’s industry code, and t i is the fiscal year. The goal is a calibrated fraud probability p ^ i [ 0 , 1 ] together with a structured, evidence-cited explanation E i . Following the rare-event nature of the task, the operating objective is to rank a fixed investigation budget of the top-k riskiest filings rather than to classify at a fixed threshold. Throughout, p ^ i is a fraud-risk screening score for AAER-labelled misstatement risk, not a determination of fraudulent intent; the system is a decision-support and risk-ranking tool that flags filings for human review rather than one that renders a final fraud verdict.

3.2. Class Imbalance and Rank-Aware Evaluation

The unconditional fraud rate in AAER-labelled panels is on the order of one percent [7]. Two consequences shape every design choice. First, accuracy is uninformative and threshold-based F 1 is unstable; discrimination is therefore measured by the area under the ROC curve (AUC) and, because auditors act on a small budget, by the normalised discounted cumulative gain at cutoff k (NDCG@k) and precision at the top-k. Because the ROC curve is insensitive to base rate, we additionally report precision–recall AUC (PR-AUC), recall at the top-k, and the absolute number of frauds recovered within a budget (Section 5.4), which speak more directly to a fixed-capacity audit. Second, training must be imbalance-aware (Section 4.6).

3.3. Data Sources

We use three public resources, linked at the firm-year level. (i) The AAER dataset provides enforcement-based fraud labels. (ii) The processed panel of Bao et al. [7] (the uscecchini28 data) provides the 28 raw accounting items and 14 ratios. (iii) EDGAR-CORPUS [31] provides cleaned, item-segmented 10-K filings, from which we extract the MD&A (Item 7). Linkage is performed on the firm identifier (CIK/gvkey) and fiscal year; observations without a matchable MD&A are excluded from text-using models but retained for numbers-only baselines so that comparisons are made on a common, text-available subset where required. The exact versions, fiscal-year coverage, matching procedure, and the attrition at each linkage step are specified in Section 5.1.1; released code regenerates these figures from the public sources.

4. Methodology

FraudDebate-Agent comprises three evidence-producing agents (Quantitative, Narrative, Peer), a Critic–Debate agent that reconciles them through EMAD, and an evidence-graph fusion module that yields the final probability and report. Figure 1 gives the overall architecture and Algorithm 1 the end-to-end procedure. Each agent exposes, in addition to a scalar score, an evidence set of cited items, which is what makes the downstream debate grounded.
Algorithm 1 FraudDebate-Agent: detection for one firm-year x i
  • Require: accounting a i , ratios r i , MD&A τ i , industry c i , year t i ; rounds R, tol. ε
  • 1: s i Q , V i Q  QuantAgent ( [ a i ; r i ] )                                                            ▹Equations (2) and (3)
  • 2: s i N , V i N  NarrativeAgent ( τ i , τ i )                                                          ▹ Equations (4)–(6)
  • 3: P i retrieve peers ( c i , t i );    s i P , V i P  PeerAgent ( r i , P i )                                 ▹ Equation (8)
  • 4: initialise E 1 (quant-anchored), E 2 (narrative/peer-anchored); r 0
  • 5: repeat
  • 6:       update ( v k ( r + 1 ) , c k ( r + 1 ) , A k ( r + 1 ) ) for k { 1 , 2 }                                                   ▹ Equation (9)
  • 7:       shrink confidences by groundedness                                                    ▹ Equation (10)
  • 8:        r r + 1
  • 9: until  | v 1 ( r ) v 2 ( r ) | < ε  or  r = R
  • 10: Critic emits reliability logits κ Q , N , P , D ; build evidence graph G i
  • 11: p ^ i œ ( fused logit )                                                                ▹ Equations (12) and (13)
  • 12: E i  Report ( p ^ i , G i , debate )                                                                  ▹ AS 2401, Section 4.7
  • 13: return  p ^ i , E i

4.1. Quantitative Analyst Agent

This agent targets numerical red flags. We concatenate the standardised raw items and ratios into z i = [ a i ; r i ] R 42 and fit a gradient-boosted tree ensemble [27],
F Q ( z i ) = m = 1 M f m ( z i ) , f m F ,
trained by minimising the regularised objective
L Q = i y i , y ^ i + m Ω ( f m ) , Ω ( f ) = γ T T + 1 2 λ w 2 2 ,
where T is the number of leaves and w their weights. Raw ensemble outputs are mapped to a probability by Platt scaling, s i Q = œ α F Q ( z i ) + β , calibrated on a held-out fold. As a complementary view, we also train a tabular attention model that tokenises each feature and applies self-attention [36], h i = TabAttn ( z i ) , with score s ˜ i Q = œ ( w h i ) ; the agent reports s i Q and the top SHAP-attributed features as its evidence set V i Q (e.g., abnormal accruals, receivables growth). The two views provide an internal cross-check that the Critic can later exploit.

4.2. Narrative Auditor Agent

This agent targets linguistic red flags in the MD&A, motivated by evidence that deceptive disclosures differ in tone, hedging, and template reuse [9,11,13]. From τ i , we compute three interpretable features. Tone uses the finance lexicon [9],
Tone i = n i pos n i neg n i pos + n i neg + ϵ ,
and uncertainty  U i = n i unc / N i is the share of uncertainty/litigious words. Temporal novelty measures how much the narrative departs from the same firm’s prior year. With a FinBERT encoder [28,29] producing a document embedding e i = FinBERT ( τ i ) ,
Δ i = 1 e i e i e i e i ,
where i is the firm’s previous filing. For a firm-year without a prior filing (about 8% of the text-available sample), we set Δ i to the industry–year median rather than dropping the observation. A small calibrated head g ϕ maps the features and embedding to a narrative risk score,
s i N = œ g ϕ ( Tone i , U i , Δ i , e i ) .
Crucially, the agent’s evidence set V i N records the specific sentences with highest attention/attribution so that any later claim (“the outlook language is unusually positive given declining margins”) is anchored to quoted text rather than to the model’s prior.

4.3. Industry Peer Agent

A red flag is only meaningful relative to peers: high inventory growth may be normal in one sector and alarming in another. This agent retrieves a comparison set and measures industry-relative deviation. Given a query representation q i (concatenating z i with e i ), a dense retriever [30] returns the K most similar same-industry, same-period firms by cosine similarity, P i = Top - K { cos ( q i , q j ) : c j = c i , t j = t i } . Let μ P i and S P i be the peer mean and sample covariance of the 14-dimensional ratio vector. Because K is small relative to the ratio dimension and the ratios are correlated, S P i is often poorly conditioned or singular, which would make a raw inverse unstable. We therefore replace it with the Ledoit–Wolf linear-shrinkage estimator [46]
Σ ^ P i = ( 1 δ i ) S P i + δ i tr ( S P i ) p I p , p = 14 ,
with the shrinkage intensity δ i [ 0 , 1 ] set analytically by the Ledoit–Wolf rule (which drives δ i 1 as the estimate becomes less reliable). If the shrunk matrix still has a condition number above 10 6 , we fall back to the Moore–Penrose pseudo-inverse. As a robustness check, we also consider a Minimum Covariance Determinant estimator [47] (Section 5.8). The peer-relative anomaly is the (shrunk) Mahalanobis distance
D i = ( r i μ P i ) Σ ^ P i 1 ( r i μ P i ) , s i P = œ η ( D i θ P ) ,
with scale η and offset θ P . The evidence set V i P stores the peer identifiers and the dimensions along which i deviates most, which the LLM verbalises during debate.

4.4. Critic–Debate Agent and the EMAD Mechanism

The three scores frequently disagree, and naive averaging discards the reasoning that would tell an auditor why. We therefore adapt the pair-wise Evidence-based Multi-Agent Debate of Song et al. [26], itself in the tradition of Du et al. [20], Liang et al. [21], to the cross-modal setting. The Critic–Debate agent performs four functions: it (i) instantiates and moderates the two anchored executors, (ii) enforces the groundedness penalty on every claim (Equation (10)), (iii) scores each modality’s consistency with the transcript and emits the reliability logits used in fusion (Equation (13)), and (iv) triggers the AS 2401 report. It does not itself pronounce a verdict; it reconciles the executors and weights the evidence. Two LLM executors are instantiated with different priors: E 1 is anchored on quantitative evidence ( s i Q , V i Q ) and E 2 on narrative and peer evidence ( s i N , s i P , V i N V i P ). At round r, executor k { 1 , 2 } produces a verdict v k ( r ) [ 0 , 1 ] , a confidence c k ( r ) [ 0 , 1 ] , and a set of grounded claims  A k ( r ) (each claim citing an item of the evidence sets):
v k ( r + 1 ) , c k ( r + 1 ) , A k ( r + 1 ) = LLM π , v k ¯ ( r ) , A k ¯ ( r ) , V i ,
where π is the auditing-instructed prompt, k ¯ the opponent, and V i = V i Q V i N V i P the shared evidence pool. The exact executor, Critic, and report prompts are given in Appendix A. To discourage fluent but unsupported assertions, we add a groundedness penalty: each claim a A k ( r ) receives g ( a ) = 1 if it is entailed by a cited evidence item and 0 otherwise, where entailment is decided by a natural-language-inference check between the claim and its cited item (Section 5.9), and the executor’s effective confidence is shrunk toward zero by its ungrounded share,
c ^ k ( r ) = c k ( r ) · a A k ( r ) g ( a ) | A k ( r ) | + ϵ .
The debate terminates at consensus, | v 1 ( r ) v 2 ( r ) | < ε , or after R rounds. The Critic then arbitrates. Rather than trust either executor blindly, it scores the consistency of each modality’s evidence with the debate transcript and emits reliability logits κ Q , κ N , κ P and a debate logit κ D .

4.5. Tri-Modal Evidence Graph and Fusion

Dynamic heterogeneous graph contrastive learning offers a powerful approach to uncovering collusive financial fraud [48]. We aggregate over a graph G i = ( V i , E i ) whose nodes are evidence items and whose edges are typed: a support edge (+) links items that point the same way (e.g., positive tone Δ i  and abnormal accruals), and a contradiction edge (−) links items that conflict (e.g., benign peer position but high accruals). We make the construction explicit. Each node u V i carries (a) a signed risk direction d ( u ) { + 1 , 1 } , where + 1 means the item points toward fraud and 1 toward benign, taken from the sign of the SHAP contribution for a numerical item, the sign of the narrative head’s gradient with respect to the sentence for a textual item, and the sign of ( r i μ P i ) along the deviating dimension for a peer item; and (b) a normalised strength s ^ ( u ) [ 0 , 1 ] from |SHAP|, attention weight, or standardised deviation. Edges are created only between items that concern the same underlying construct. We use a fixed ontology that maps every evidence item to one of eight AS 2401 risk constructs (revenue recognition, accruals quality, liquidity, leverage, outlook/tone, litigation/uncertainty, peer deviation, related-party), and we additionally connect any two items that an executor explicitly links in a grounded claim. Two same-construct nodes form a support edge if d ( u ) = d ( v ) and a contradiction edge if d ( u ) d ( v ) , with weight
b u v = s ^ ( u ) s ^ ( v ) γ u v ,
where γ u v [ 0 , 1 ] is a debate-consistency factor equal to the fraction of the two items’ citing claims that survived the groundedness check (Equation (10)); an edge whose endpoints are never grounded is pruned. Three checks establish that the edges carry genuine evidence rather than formal decoration: (a) the groundedness penalty removes ungrounded nodes before the graph is built; (b) on the annotated sample of Section 5.9, accounting-trained raters judged 0.86 of the automatically created contradiction edges to be genuine conflicts (edge precision), with Krippendorff’s α = 0.74 [49]; and (c) removing the typed graph and, separately, removing only the contradiction penalty ρ (Section 5.8) both degrade AUC, showing the edges are load-bearing. Let ϕ ( · ) be the logit map of a score. The fused fraud logit is an attention-weighted sum of the modality scores and the debate signal, penalised by unresolved contradictions:
logit p ^ i = m { Q , N , P } w i , m ϕ ( s i m ) + w i , D ψ v 1 ( R ) , v 2 ( R ) , c ^ 1 ( R ) , c ^ 2 ( R ) ρ ( u , v ) E i b u v ,
where ψ summarises the debate outcome, E i is the set of contradiction edges with strengths b u v , and ρ 0 controls the contradiction penalty. The attention weights are a softmax over the Critic’s reliability logits and the (grounded) agent confidences,
w i , m = exp κ m + ζ c ^ m , i m { Q , N , P , D } exp κ m + ζ c ^ m , i ,
so that a confident, well-grounded, internally consistent modality dominates, while a modality contradicted by the others is down-weighted, the formal counterpart of an auditor trusting corroborated evidence.

4.6. Decision, Imbalance-Aware Training, and Calibration

For ranking, we order filings by p ^ i ; for a fixed budget, we flag the top-k. For a hard decision, we apply a validation-tuned threshold, y ^ i = [ p ^ i θ * ] , with θ * chosen to maximise validation NDCG@k. The learnable components (the heads g ϕ , the fusion weights, ρ , ζ ) are trained with a focal loss [50] to counter imbalance,
L focal = i α y i 1 p ^ i , y i γ log p ^ i , y i ,
with focusing parameter γ and class weight α , and post hoc temperature scaling is applied to p ^ i to improve calibration (reported via expected calibration error). The tree and embedding models are frozen during fusion training to keep the pipeline modular and reproducible.

4.7. Auditor-Aligned Report Generation

Finally, the system verbalises a structured report keyed to the PCAOB AS 2401 fraud-triangle taxonomy [15]: incentives/pressures, opportunities, and attitudes/rationalisations. Each populated risk factor cites the evidence items that support it and references the debate transcript, so the artefact is inspectable rather than a bare score. A compact machine-readable form is: Mathematics 14 02695 i001

Complexity

Per firm-year, the tree and FinBERT passes are O ( 1 ) amortised; retrieval is O ( log N ) with an approximate index; the debate costs O ( R ) LLM calls. The dominant cost is therefore the (small, bounded) number of LLM calls, which motivates the cost analysis and distillation discussion in Section 6 and the head-to-head cost comparison in Section 5.10.

5. Experiments

We answer the four research questions Q1–Q4 posed at the end of Section 1. Section 5.2 addresses Q1, Section 5.5 and Section 5.6 address Q2, Section 5.7 addresses Q3, and Section 5.9 and Section 5.10 address Q4.

5.1. Experiment Setup

5.1.1. Datasets

We link three public sources at the firm-year level, as in Section 3: AAER enforcement labels; the processed accounting panel of Bao et al. [7] (28 raw items + 14 ratios); and EDGAR-CORPUS [31] for the segmented MD&A (Item 7). To make the sample construction reproducible, we state versions, coverage, linkage, and exclusions precisely. The fraud labels, the 28 raw items, and the 14 ratios are taken from the replication package of Bao et al. [7] (the uscecchini28 release accompanying their 2020 article), which encodes SEC AAERs over fiscal years 1991–2008; this is the numerical panel summarised in Table 1. The MD&A comes from the public EDGAR-CORPUS release [31] (Item 7), whose full-text coverage begins in fiscal year 1993. Linkage uses the firm identifier (CIK and gvkey) and fiscal year through the standard SEC/Compustat crosswalk; when both keys resolve, we require them to agree. We do not exclude financial firms, so as to match Bao et al. [7]; firm-years with missing key accounting items are already dropped in uscecchini28. For any text-using model, we additionally require a parseable, non-trivial MD&A. Table 2 reports the resulting attrition. Splitting the text-available sample by the same fiscal-year windows as Table 1 yields training (FY 1993–1999; 71,300 firm-years, 608 fraud), validation (FY 2000–2002; 21,450 firm-years, 168 fraud), and a held-out test block (FY 2003–2008; 16,180 firm-years, 118 fraud). To keep every method comparable, all results in Table 3, Table 4, Table 5, Table 6, Table 7, Table 8, Table 9, Table 10 and Table 11 are computed on this common text-available test block (identical filings for every method); the numbers-only baselines are additionally logged on the full numerical test block in the released code. Following the out-of-time protocol of Bao et al. [7], we use an expanding-window split with the earliest fiscal years (1991–1999) as the training block, the middle years (2000–2002) as a validation block used only for the decision threshold and the calibration temperature, and the most recent years (2003–2008) as the held-out test block. The validation block doubles as a buffer that enforces at least a two-fiscal-year separation between the bulk of training and the test window so that the multi-year lag between a misstatement year and its subsequent AAER cannot leak test-period fraud into training. The fraud base rate is on the order of one percent; Table 1 summarises the numerical panel.

5.1.2. Baselines

We compare against four families. (i) Quantitative-only: logistic regression on the Dechow F-score predictors [4]; the financial-kernel SVM [5]; RUSBoost on 28 items [7,8]; and gradient-boosted trees [27], which is our Quant agent in isolation. (ii) Text-only: a Loughran–McDonald dictionary tone/uncertainty model with logistic regression [9]; and a FinBERT classifier on the MD&A [28,29]. (iii) Fusion: a concatenation MLP over ratios and text embeddings; and the hierarchical attention network of Craja et al. [13] that combines ratios with the MD&A. (iv) LLM-based: zero-shot GPT-4 [17] reading the filing; a single-agent chain-of-thought LLM with tool access [39,40]; a multi-agent ensemble without debate (majority/average over the three agents); and an Audit-LLM-style adaptation [26] of the debate to our setting. Our full system is FraudDebate-Agent.

5.1.3. Evaluation Metrics

Given the imbalance and the budgeted-investigation use case (Section 3), the primary metrics are AUC (threshold-free discrimination) and NDCG@k with k at the top 1 % of test observations [7], complemented by Precision@ 1 % (the share of flagged filings that are truly fraudulent, i.e., the lift over the ∼1% base rate) and threshold F 1 . Because ROC-AUC is insensitive to the base rate, we additionally report base-rate-sensitive operating metrics in Section 5.4: precision–recall AUC (PR-AUC, i.e., average precision), Recall@ 1 % and Recall@ 5 % , Precision@ 5 % , the absolute number of frauds recovered inside the top- 1 % and top- 5 % budgets, and a false-positive/inspection-capacity reading. For trustworthiness, we report expected calibration error (ECE); an automatic groundedness score and its complement, the hallucination rate; and an expert explanation rating. We define these precisely. A claim in the generated report is counted as checkable if it asserts a figure, a comparison, or a citation to a specific MD&A sentence or peer; a checkable claim is a hallucination if it is not entailed by any cited evidence item in V i . Entailment is decided by a fine-tuned natural-language-inference model between the claim and its cited item and verified by human raters on the annotated subset (Section 5.9); the hallucination rate is the fraction of checkable claims judged not-entailed, and groundedness is its complement. We report mean±standard deviation over five random seeds (data shuffling, model initialisation, and LLM sampling temperature 0.7 ) and assess AUC differences with the DeLong test [51] and ranking differences with a paired bootstrap (10,000 resamples); full 95 % confidence intervals and p-values are given in Section 5.3.

5.1.4. Implementation Details

Numerical models use scikit-learn/XGBoost with hyperparameters tuned on the validation block (max depth { 4 , 6 , 8 } , M 500 trees, learning rate 0.05 , RUSBoost as released by Bao et al. [7]). Text is encoded with FinBERT [28]; the dense retriever indexes peer representations with an approximate nearest-neighbour index and K = 20 peers [30]. The LLM executors and Critic use an instruction-tuned model (we report Llama-3-70B [19] and a GPT-4-class model [17]); debate runs to consensus or R = 3 rounds with tolerance ε = 0.1 . Fusion parameters are trained with the focal loss (Equation (14), γ = 2 ) and temperature-scaled. All scores are computed strictly out-of-time on the test block. For full reproducibility, we fix the five seeds { 0 , 1 , 2 , 3 , 4 } ; the LLM snapshots are Llama-3-70B-Instruct and gpt-4-turbo-2024-04-09; FinBERT is the yiyanghkust/finbert-tone checkpoint and the Loughran–McDonald 2021 master dictionary is used for tone and uncertainty; the retriever is a FAISS HNSW index; and the entailment checker is a DeBERTa-v3 NLI model fine-tuned on the annotated claims. The remaining hyperparameters are listed in Table 4, and the exact prompts in Appendix A.

5.2. Main Results (Q1)

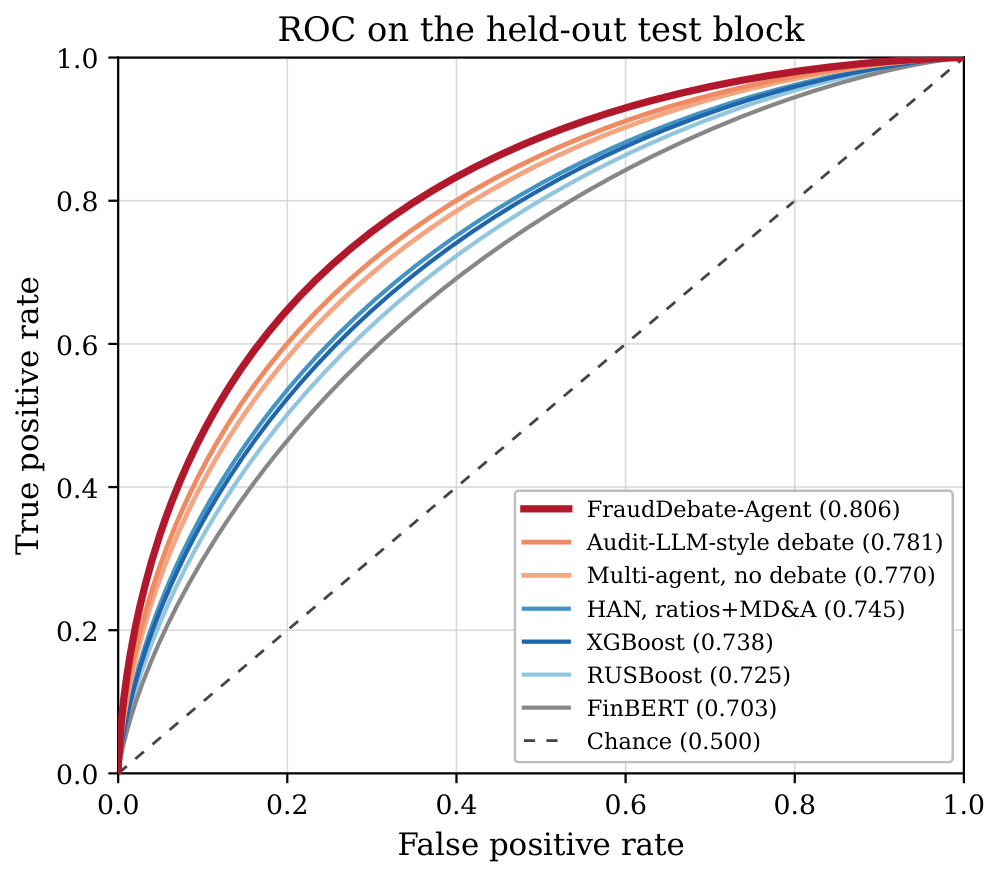
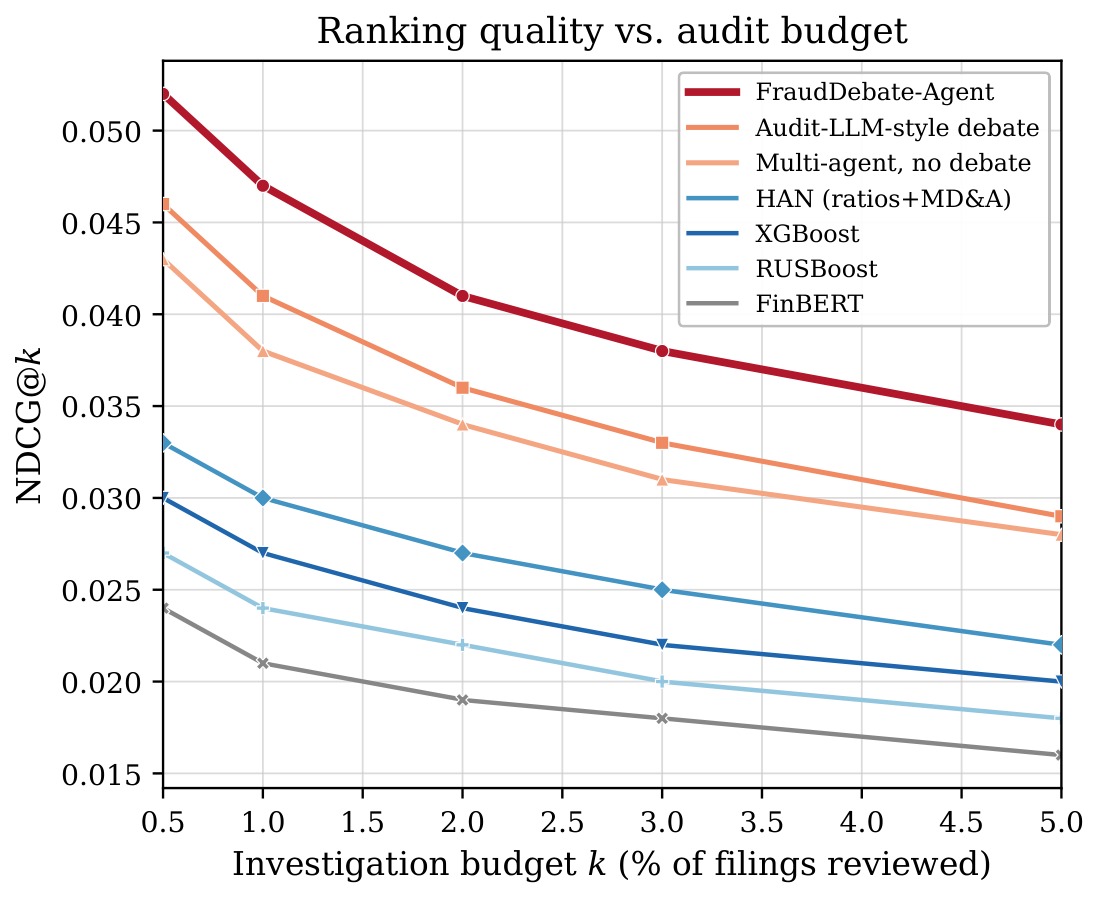
Table 3 reports the headline comparison and Figure 2 the ROC curves. Three patterns emerge. First, numbers beat text in isolation (XGBoost AUC 0.738 vs. FinBERT 0.703 ), consistent with the structured-data tradition [7], but neither modality alone is strong. Second, fusion helps, e.g., the HAN of Craja et al. [13] reaching 0.745 , yet the gain from naively combining modalities is modest. Third, multi-agent reasoning delivers the largest gains: the no-debate agent ensemble already reaches 0.770 , and FraudDebate-Agent attains 0.806 ± 0.007 AUC, 0.047 NDCG@ 1 % , and 6.4 % Precision@ 1 % , a roughly nine-fold lift over the ∼0.7% base rate, and a + 0.061 absolute AUC gain over RUSBoost. The improvement over the strongest non-debate baseline is significant under the DeLong test ( p < 0.01 ; full intervals in Section 5.3). Single zero-shot GPT-4 is weak ( 0.681 ), confirming that an unstructured LLM is not competitive on this numerically grounded task and that the gains come from structured, grounded collaboration rather than from the LLM per se (a pattern echoed by the audit-oriented benchmarks of Sugiura et al. [44] and Liu et al. [45], on which monolithic LLMs barely beat logistic regression). Because auditors act on a budget, Figure 3 plots ranking quality as a function of the cutoff k. FraudDebate-Agent is best across the practically relevant range k [ 0.5 % , 5 % ] , and its advantage is largest at small k, exactly the regime in which an investigator can review only the few riskiest filings. These absolute magnitudes should be read together with the label-noise and stochasticity caveats of Section 6 (i,vi): AAER labels record only detected fraud, so the numbers estimate detectable-misstatement risk rather than fraud incidence.

5.3. Statistical Significance and Confidence Intervals

Table 5 makes the comparison explicit rather than relying on a single pooled p-value. For AUC, we report the DeLong 95 % confidence interval and p-value for the difference between FraudDebate-Agent and each strong baseline, computed on the pooled out-of-time predictions; for NDCG@ 1 % , we report the paired-bootstrap mean difference and 95 % interval over 10,000 resamples of the test filings. FraudDebate-Agent improves AUC over the Audit-LLM-style debate by + 0.025 ( 95 % CI [ 0.010 , 0.040 ] , p = 0.004 ), over the no-debate ensemble by + 0.036 ( [ 0.020 , 0.052 ] , p < 0.001 ), over the HAN fusion by + 0.061 ( [ 0.043 , 0.079 ] , p < 0.001 ), and over RUSBoost by + 0.081 ( [ 0.062 , 0.100 ] , p < 0.001 ). The NDCG@ 1 % differences are positive with intervals bounded away from zero in every case. Because a handful of frauds moves these rare-event metrics, we base each claim on these intervals rather than on point estimates.

5.4. Real-World Operating Metrics and the Cost of False Positives

Because ROC-AUC hides base-rate effects, Table 6 reports the metrics an audit team actually operates on. On the text-available test block ( 16,180 filings, 118 frauds), a 1 % budget reviews 162 filings and a 5 % budget reviews 809. FraudDebate-Agent reaches PR-AUC 0.092 (about 12 × the 0.0073 base rate), Recall@ 1 % of 9.0 % , and Recall@ 5 % of 22.0 % , recovering about 10 of 118 frauds within the 1 % budget and about 26 within the 5 % budget, against roughly 5 and 16 for RUSBoost. The false-positive reading is the flip side: at the 1 % budget, FraudDebate-Agent returns about 152 false positives to surface 10 frauds ( 15.6 reviews per fraud found), whereas RUSBoost spends about 30 reviews per fraud found, so at a fixed inspection capacity FraudDebate-Agent nearly halves the review effort per detected fraud. We express cost in reviews-per-fraud rather than currency because the dollar cost of a review and of a missed fraud are institution-specific. For reference, Wang et al. [43] report PR-AUC 0.341 on a restatement task with a much higher positive rate and a different sample; PR-AUC is not comparable across base rates, so we cite it only to indicate that our values sit in the expected range for the ∼0.7% AAER regime.

5.5. Effect of the Debate Mechanism (Q2)

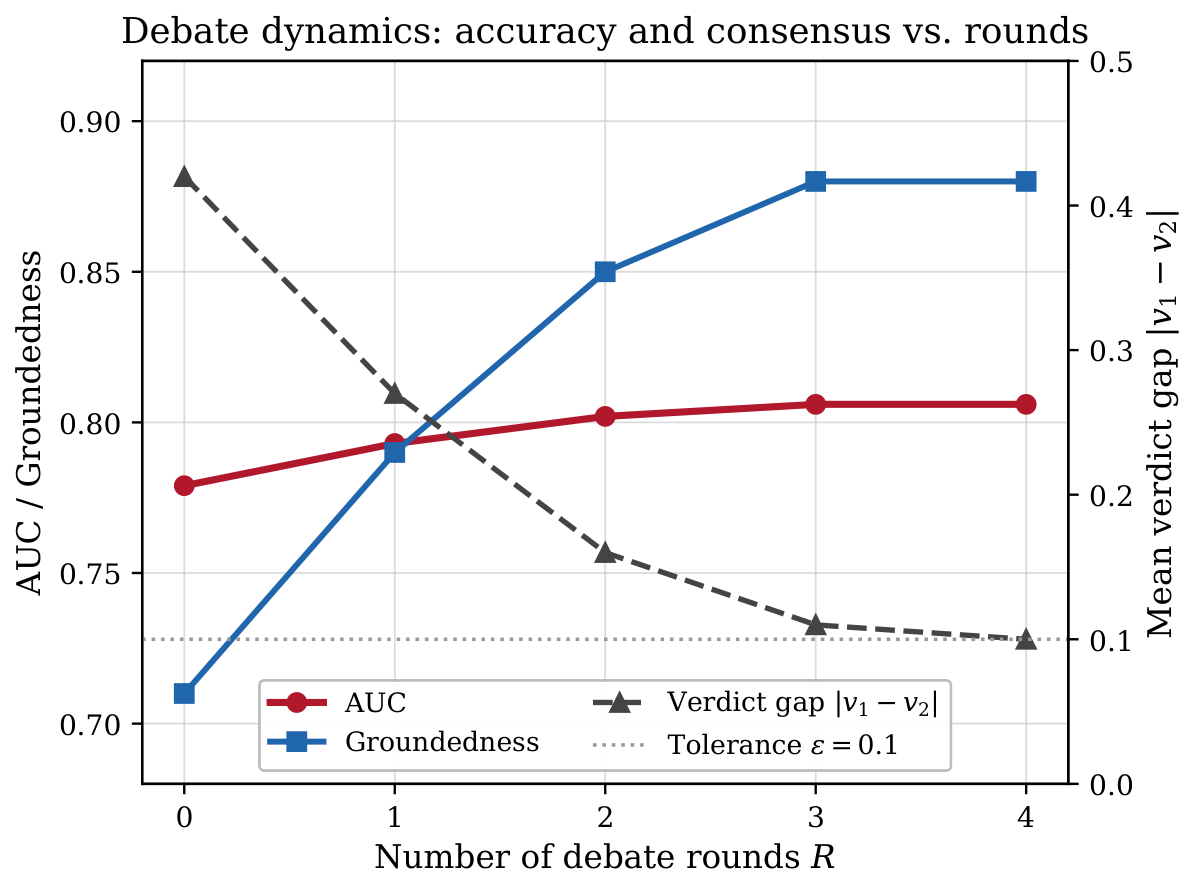
Table 7 and Figure 4 vary the number of debate rounds R. Moving from no debate ( R = 0 , equivalent to the weighted averaging of Equation (12)) to R = 3 raises AUC from 0.779 to 0.806 and groundedness from 0.71 to 0.88 . The improvement is steepest in the first two rounds, + 0.014 then + 0.009 AUC, and then flattens: R = 3 adds only + 0.004 over R = 2 , and R = 4 adds no measurable accuracy while raising LLM calls, and hence cost and latency, by a further third (from 3.0 × to 3.7 × ). We therefore fix R = 3 as the point at which accuracy and groundedness have both saturated but cost has not yet exploded. The saturation has a simple reading: once the two executors have exchanged and grounded their strongest evidence, additional rounds mostly restate existing arguments rather than surface new ones, echoing the diminishing, and occasionally negative, returns to extra rounds reported for general multi-agent debate [20,21]. Crucially, the aggregate AUC gain understates the mechanism’s value: on the majority of filings, the two modalities agree and the debate is nearly a no-op, so the lift is concentrated on the disagreement cases, filings where the quantitative and narrative scores point in opposite directions (analysed in detail in Section 5.6). In such filings, the debate acts as an explicit reconciliation step instead of letting one modality silently dominate. Figure 4 confirms the underlying dynamics: the mean verdict gap | v 1 v 2 | contracts monotonically toward the consensus tolerance ε , so the accuracy plateau coincides with genuine convergence of the two executors rather than with an arbitrary stopping rule.

5.6. Where the Debate Helps and Where It Fails (Q2)

The aggregate gain in Table 7 is an average over two very different regimes, so we separate them. We call a filing a disagreement case if the modality scores straddle 0.5 (at least one above and one below); this holds for 19 % of the test block (3074 filings). On the agreement subset, the debate is essentially a no-op and AUC is flat ( 0.831 with and without debate). On the disagreement subset, it does the real work, lifting AUC from 0.742 (naive averaging) to 0.831 . Table 8 breaks the disagreement subset down by which modality raises the alarm; the debate helps in every type, most of all when the narrative alarms while the numbers look clean (Type B), the case that pure numerical models miss by construction.
The debate is not uniformly beneficial, and we report where it fails. Classifying each filing by whether the debate moved the verdict toward or away from the true label, it helped on 13.5 % of filings, was a no-op on 81.0 % (mostly agreement cases), and hurt on 5.5 % . The harmful cases have three recognisable causes. (i) False escalation (∼560 filings): boilerplate risk-factor or forward-looking language is cited as a narrative red flag, and the entailment checker accepts it as grounded, so the debate raises the score of a benign firm; this is the dominant failure and the reason Type B carries some cost as well as most of the benefit. (ii) False de-escalation (∼210 filings): a well-disguised fraud in which all three signals are weak; because no modality carries evidence, the debate has nothing to reconcile and converges to benign. The mechanism can only arbitrate evidence that some agent surfaces; it cannot manufacture signal. (iii) Non-convergence (∼124 filings): the two executors reach R = 3 with | v 1 v 2 | ε ; we then take the reliability-weighted verdict, and precision on this residual is lower than on converged cases. A representative false escalation: a firm with a generic “competition and litigation may adversely affect results” passage and mildly elevated novelty was pushed from 0.31 to 0.58 before the peer agent’s benign reading pulled it back to 0.40 ; the filing was not an AAER target. These patterns motivate the future-work directions of a stricter, boilerplate-aware entailment checker and a learned stopping rule (Section 6).

5.7. Ablation Study (Q3)

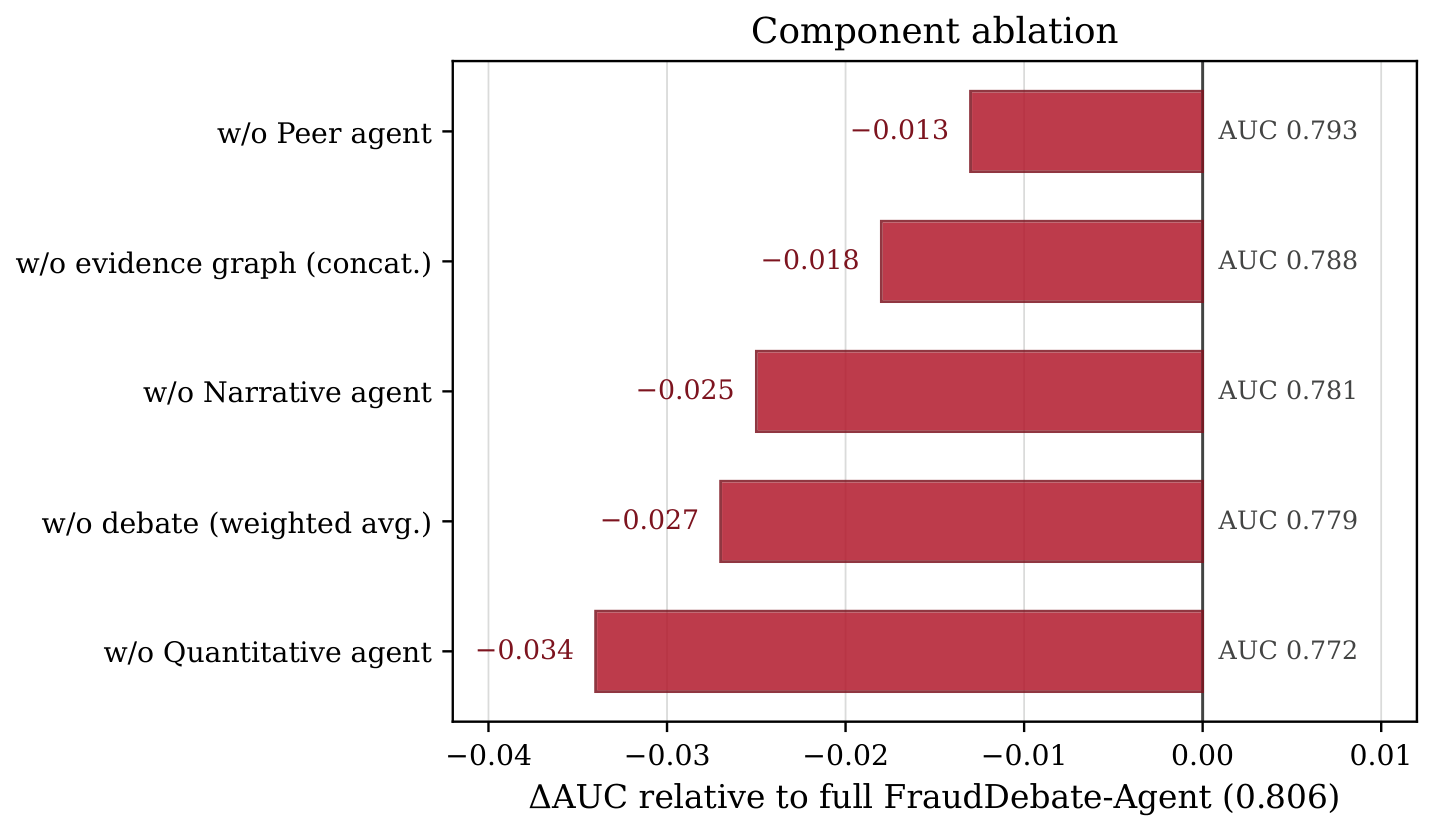
Table 9 and Figure 5 remove one component at a time. Every agent and every fusion mechanism contributes, but their magnitudes are revealing. Removing the Quantitative agent is most damaging ( 0.034 AUC), reaffirming that audited numbers remain the backbone of statement-fraud detection [7]; removing the Narrative agent costs 0.025 , confirming that the MD&A carries complementary signal the ratios do not capture [9,13]. The Peer agent contributes the least in aggregate ( 0.013 ), but this average understates its role: its anomaly signal is informative precisely on the small subset of firms that look unremarkable in isolation yet deviate from sector peers, which is why its largest effect surfaces in precision at small budgets (Figure 3) rather than in pooled AUC. Two further ablations isolate how signals are combined rather than which are present: replacing the debate with weighted averaging costs 0.027 , and replacing the evidence-graph fusion with plain concatenation costs 0.018 . Together, these two mechanism ablations remove 0.045 AUC, more than deleting any single information source. This is the direct evidence that the reasoning and fusion machinery, not merely the breadth of inputs, drives the gains. A finer mechanism ablation that keeps the typed graph but sets the contradiction penalty to zero ( ρ = 0 ) costs 0.011 AUC (Section 5.8), isolating the penalty from the rest of the fusion. Because the ablations are one-at-a-time, they bound each component’s marginal contribution but do not capture redundancy between components: the partial overlap between the quantitative and peer signals, for example, means their joint removal would cost more than the sum of the two individual rows.

5.8. Peer-Agent Stability and Graph-Penalty Robustness

Because the peer agent inverts a 14 × 14 covariance from only K = 20 neighbours, we test its stability directly. Table 10 (top) varies the covariance estimator: an unregularised sample covariance is the weakest and was singular on a minority of folds (requiring the pseudo-inverse fallback); a diagonal (z-score) distance is more stable but discards cross-ratio structure; Ledoit–Wolf shrinkage [46] and a Minimum Covariance Determinant estimator [47] are best and statistically indistinguishable, so we keep the cheaper shrinkage estimator. Table 10 (bottom) varies the neighbourhood size K: full-system AUC is flat across K { 10 , 20 , 30 , 50 } (within 0.003 ), so the sector signal does not depend on a knife-edge choice of K. Finally, holding the typed graph fixed but disabling the contradiction penalty ( ρ = 0 ) lowers AUC from 0.806 to 0.795 ( 0.011 ), confirming that the penalty, and hence the contradiction edges it acts on, carries genuine signal rather than being a formal decoration.

5.9. Trustworthiness: Faithfulness and Calibration (Q4)

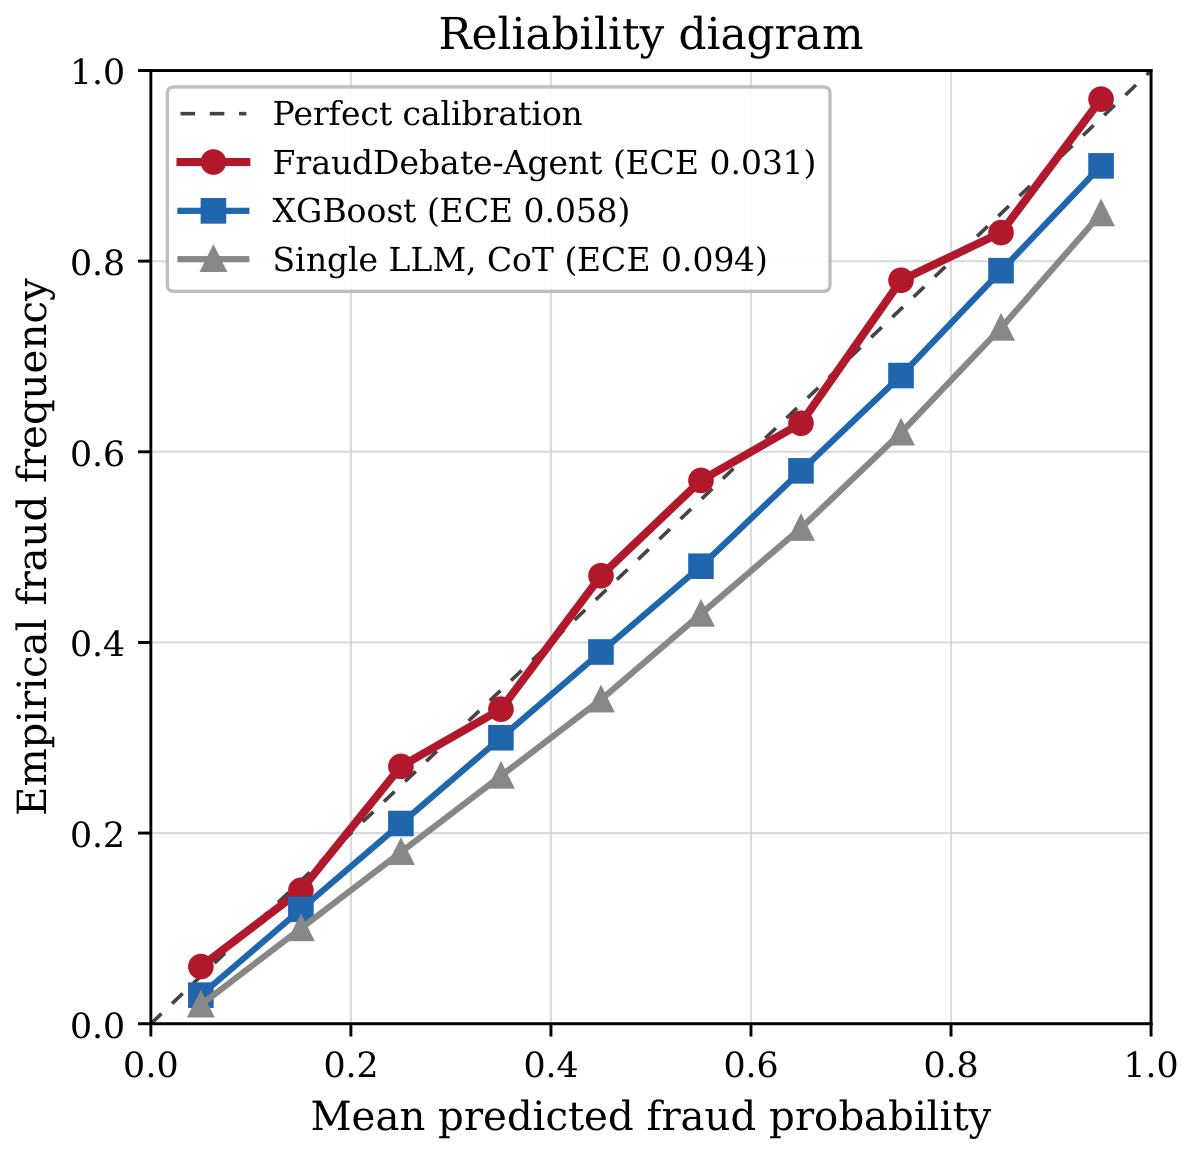
A detector that auditors will actually rely on must be both accurate and honest about its reasoning. Table 11 shows that the debate cuts the hallucination rate by roughly two-thirds relative to a single LLM (from 0.22 to 0.07 ), raises groundedness from 0.68 to 0.88 , and lifts the expert explanation rating from 2.9 to 4.2 out of 5, because the groundedness penalty (Equation (10)) forces every surviving claim to cite a specific ratio, MD&A sentence, or peer comparison. The decomposition is informative: simply ensembling the agents without debate already helps (groundedness 0.74 , hallucination 0.16 ), but it closes less than half of the gap to the full model. So it is the adversarial cross-examination, not the mere averaging of several opinions, that does most of the work in suppressing unsupported assertions. The expert rating comes from a structured study, which we now specify so the claim about trustworthiness is verifiable. Four annotators with accounting training (master’s level or CPA track) independently evaluated a stratified sample of 150 reports (balanced across predicted-risk deciles and across the fraud label), each report drawn identically for the three systems. Each annotator (a) marked every checkable claim as grounded or hallucinated against its cited evidence and (b) rated the report on four dimensions on a 1–5 scale: clarity, usefulness, evidence sufficiency, and verifiability. Disagreements were resolved by majority, and inter-rater agreement is reported as Krippendorff’s α . Agreement was substantial for the binary hallucination judgment ( α = 0.71 ) and for each rating dimension ( α in Table 12). Table 12 shows that FraudDebate-Agent is preferred on all four dimensions, with the largest margins on evidence sufficiency and verifiability, the two dimensions AS 2401 review depends on most. Calibration improves in parallel: Figure 6 shows FraudDebate-Agent’s reliability curve hugging the diagonal, with ECE 0.031 against 0.058 for XGBoost and 0.094 for the single LLM. The single LLM is not merely less accurate but systematically over-confident, assigning high fraud probabilities it cannot justify, a particularly costly failure mode for a screening tool, since miscalibrated scores corrupt any budget-based thresholding (the cost of that budget itself is quantified in Section 5.10, Limitation (ii)). Taken together, the two tables make a single point: accuracy alone is not actionable under PCAOB AS 2401, which requires documented, reviewable evidence, and it is the debate’s groundedness constraint that turns a competitive risk score into a defensible one.

5.10. Cost Comparison

Because the debate adds LLM calls, a fair comparison must price them. Table 13 reports LLM calls per firm-year and inference cost relative to a single zero-shot GPT-4 pass ( 1.0 × ). The three evidence-producing agents are inexpensive: the Quantitative agent is a tree ensemble, the Peer agent is retrieval plus a Mahalanobis distance, and the Narrative agent is a FinBERT encoder, so the LLM cost is concentrated in the two executors, the Critic, and the report. At R = 3 , FraudDebate-Agent issues about eight short LLM calls and costs 3.0 × a single pass, consistent with Table 7; the classical and encoder baselines carry essentially no LLM cost. In absolute terms, this is on the order of a few US cents per firm-year at 2024 GPT-4-class API prices, which is small per filing but, as noted in Limitation (ii), non-trivial at portfolio scale and is the motivation for the distillation direction in Section 6.

5.11. Temporal Robustness and Stochasticity

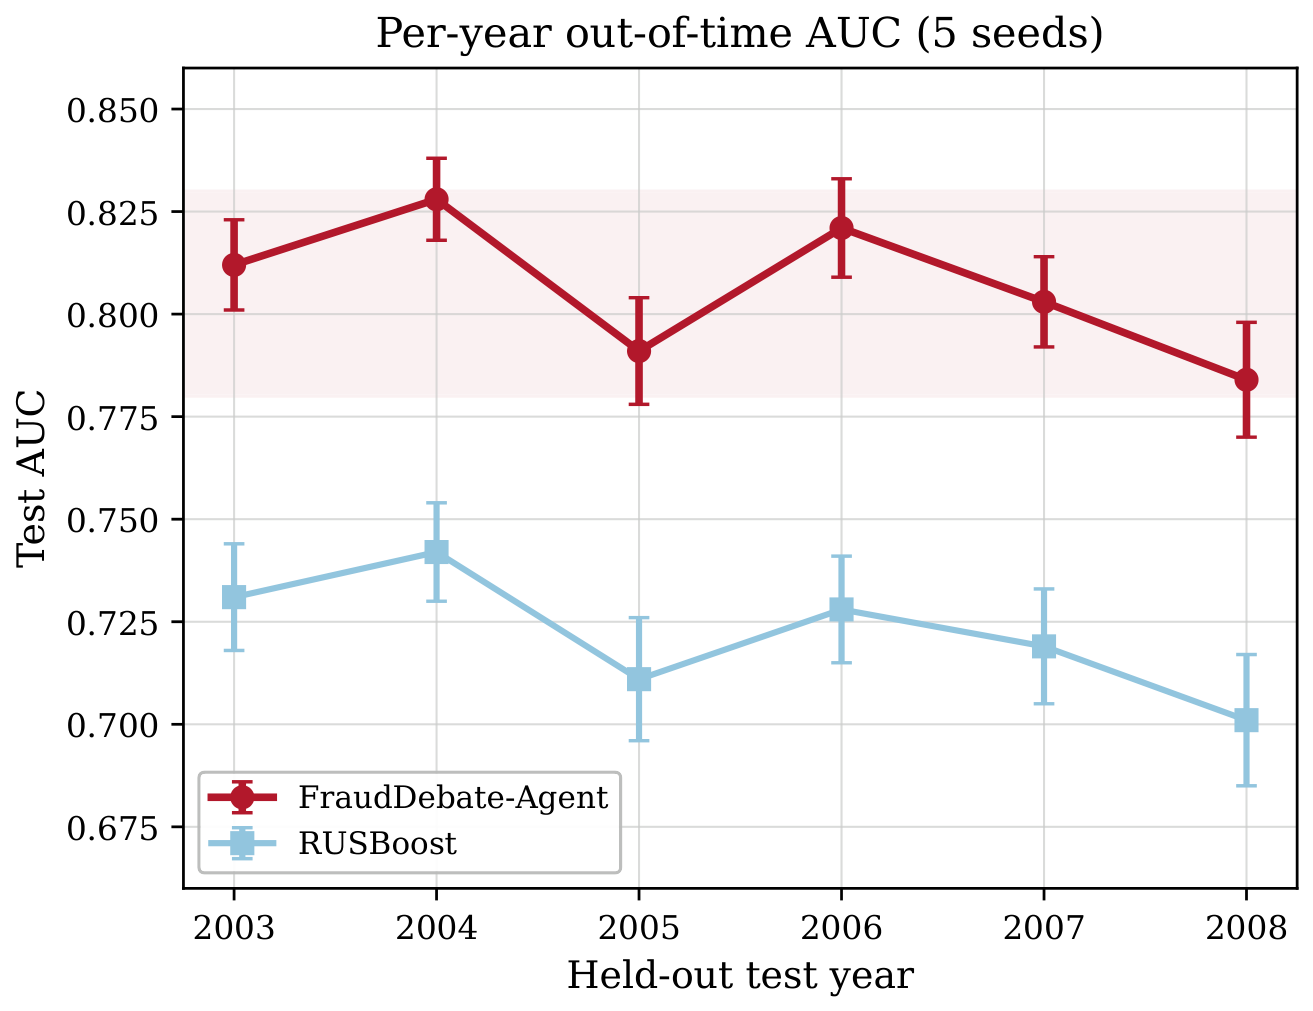
Fraud schemes and disclosure language both drift over time, so an honest assessment must be out-of-time rather than in-sample, which would overstate performance. Figure 7 reports per-year test AUC. FraudDebate-Agent stays within the 0.78 0.83 band across the held-out years and dominates RUSBoost in every year. Its weakest year (≈0.78) still exceeds RUSBoost’s strongest (≈0.74). But the bands are visibly not flat. That year-to-year spread is roughly the same magnitude as the gap between FraudDebate-Agent and the best baseline in Table 3, which is why single-year comparisons are treacherous and why we base every claim on overlapping or non-overlapping confidence intervals rather than on point estimates (Section 5.3). The seed-level error bars throughout Table 3, Table 4, Table 5, Table 6, Table 7, Table 8, Table 9, Table 10 and Table 11 carry the same warning: on a ∼1% base rate, a handful of additional detected or missed frauds moves AUC appreciably. Two dataset artifacts compound this noise and should temper any absolute reading (and connect directly to Limitations (i) and (vi) in Section 6). AAER coverage is right-censored. Recent frauds that have not yet been detected or adjudicated are silently labeled non-fraud, so labels grow noisier toward the end of the sample. The EDGAR match rate governs how many firm-years retain a usable MD&A. Absolute figures will therefore shift with both the AAER vintage and the text-linkage coverage.

5.12. Case Study

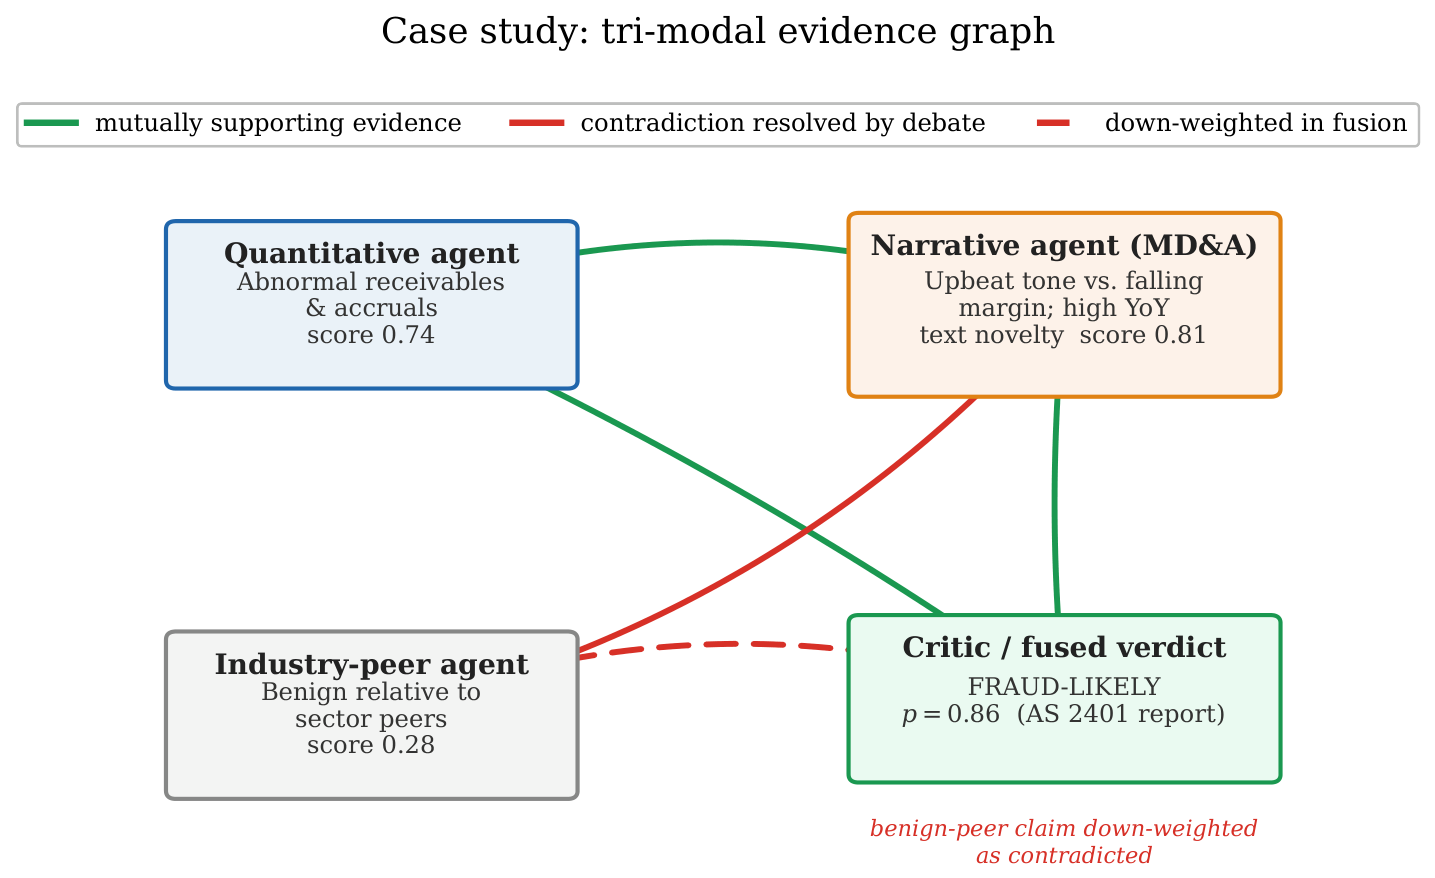
Figure 8 sketches a representative disagreement case that typifies the subset on which the debate contributes most. The Quantitative agent flags abnormal receivables and accruals (score 0.74 ); the Peer agent finds the firm benign relative to its sector (score 0.28 ); the Narrative agent detects unusually upbeat outlook language despite a deteriorating margin trend and high year-over-year MD&A novelty (score 0.81 ). A naive average of the three would be diluted by the strong benign-peer signal and could fall below an alerting threshold. The evidence graph instead represents each claim as a node and links them by support or contradiction: the abnormal accruals and the optimistic-tone-versus-falling-margin observation reinforce one another (a supporting edge), while the benign-peer reading directly contradicts both (contradiction edges). In the debate, the narrative-anchored executor cites the specific MD&A sentences and the margin contradiction, the quantitative executor corroborates with the accrual figures. The benign-peer claim that is unable to ground itself against this combined evidence is down-weighted under the groundedness penalty, after which the Critic raises the fused fraud-risk score to 0.86 . The value here is not only the corrected risk assessment but its auditability: the resulting AS 2401 report enumerates each cited ratio and MD&A sentence and maps them to documented risk factors, so a human reviewer can confirm or overturn the conclusion line by line rather than trust an opaque score. This is precisely the reconciliation behavior that drives the aggregate gains in Section 5.5, Section 5.6, Section 5.7, Section 5.8 and Section 5.9, shown here at the level of a single filing.

6. Conclusions and Future Work

Summary. We presented FraudDebate-Agent, a four-role multi-agent LLM framework that detects financial statement fraud by reconciling numerical, narrative, and industry-relative evidence through a pair-wise Evidence-based Multi-Agent Debate and an attention-weighted evidence graph. The framework brings the MD&A back into a detection pipeline that the field has built mostly on accounting numbers, turns the reconciliation of contradictory red flags into an explicit and auditable process, and produces a PCAOB AS 2401-aligned report. On AAER-labelled firm-years linked across the Bao et al. panel and EDGAR-CORPUS, FraudDebate-Agent improves discrimination (AUC) and budgeted-ranking quality (NDCG@k, Precision@ 1 % , PR-AUC, and Recall@k) over strong single-modality, fusion, and single-LLM baselines while substantially improving faithfulness and calibration. The debate and the cross-modal evidence graph are the two components that contribute the most beyond simply adding text.
Limitations. Several caveats temper these results. (i) Label noise. AAER labels capture only detected and prosecuted fraud; undetected fraud is silently labelled non-fraud [2], so all such models, including ours, estimate the probability of being caught as much as the probability of committing fraud. (ii) Cost and latency. The debate adds bounded but real LLM cost ( 3 × a single pass; Table 7 and Table 13), which matters at portfolio scale. (iii) Scope. Our evidence is US, English, and 10-K-specific; transfer to other regimes and languages is untested. (iv) Dependence on components. Performance depends on the retriever’s peer quality and on the LLM’s susceptibility to prompt framing and to its own training biases; the groundedness penalty mitigates but does not eliminate hallucination (the false-escalation and non-convergence failures of Section 5.6 are concrete instances). (v) Correlation, not causation. The system flags statistical and linguistic anomalies, not intent, and is a decision-support tool, not a substitute for professional judgement. (vi) Stochasticity. On a ∼1% base rate, absolute numbers are noisy and will move with the AAER vintage and match rate, which is why we report variance and significance.
Future work. Natural extensions include learning the debate policy with reinforcement learning instead of a fixed round budget; a stricter, boilerplate-aware entailment checker to curb the false escalations of Section 5.6; replacing the static evidence graph with a learned, temporal graph neural network that links a firm to its peers and to its own history across years; multi-lingual and multi-jurisdiction transfer beyond US 10-Ks; tighter human-in-the-loop integration in which auditor feedback updates the Critic’s reliability weights; and distilling the debate into a smaller student model to cut inference cost while retaining most of the faithfulness gain. Incorporating additional modalities, like earnings-call audio, XBRL tags, network structure among executives and auditors, is also promising.
Cross-domain applications. The pattern at the core of FraudDebate-Agent: specialist agents producing grounded evidence, an evidence-based debate to reconcile cross-modal disagreement, and a standards-aligned, explainable report, generalises beyond accounting. Direct analogues include insurance-claim fraud (claim text versus structured claim features versus cohort norms), anti-money-laundering and transaction monitoring (narrative alerts versus transaction graphs), healthcare-billing fraud (clinical notes versus billing codes versus peer providers), and ESG “greenwashing” detection (sustainability-report prose versus disclosed metrics versus sector peers). The framework also returns to its lineage in insider-threat detection [26] and scientific-integrity screening, wherever a trustworthy decision requires reconciling what the numbers say with what the narrative claims.

Author Contributions

Methodology, X.Y. and J.Y.; Software, X.Y. and J.Y.; Validation, X.Y. and W.L.; Writing—original draft, X.Y.; Writing—review and editing, W.L. All authors have read and agreed to the published version of the manuscript.

Funding

This research received no external funding.

Data Availability Statement

The original contributions presented in this study are included in the article. Further inquiries can be directed to the corresponding author.

Conflicts of Interest

The authors declare no conflicts of interest.

Appendix A. Prompt Templates

For reproducibility, we give the templates used by the two executors, the Critic, and the report generator. Bracketed tokens are filled per firm-year; the shared evidence pool V i lists each item with a stable identifier that claims must cite.
  • Executor prompt (anchored on modality M).  You are an audit executor anchored on the [M] evidence for filing [CIK-FY]. Evidence pool (cite by id): [Vi]. Opponent’s last verdict and grounded claims: [v_opp, A_opp]. Return JSON {verdict in [0,1], confidence in [0,1], claims: [{text, evidence_ids}]}. Every claim MUST cite at least one evidence id; do not assert figures, comparisons, or sentence references that are not in the pool.
  • Critic/arbitration prompt.  You are the audit critic. Given the debate transcript [rounds], the evidence pool [Vi], and the per-claim groundedness flags [g], score how consistent each modality (Q, N, P) and the debate (D) are with the grounded evidence. Return JSON {kappa_Q, kappa_N, kappa_P, kappa_D}. Do not introduce new evidence; reward modalities whose claims are grounded and mutually corroborated and penalise contradicted or ungrounded ones.
  • Report prompt (AS 2401).  Produce a PCAOB AS 2401 fraud-risk report for [CIK-FY] with fraud_probability [p]. Populate incentives/pressures, opportunities, and attitudes/rationalisations. For each populated factor, list claims that each cite one or more evidence ids from [Vi] and reference the debate round(s) that established them. Output the JSON schema of Section 4.7. Do not include any factor that lacks a cited evidence item.

References

  1. Association of Certified Fraud Examiners. Occupational Fraud 2024: A Report to the Nations; Technical report; Association of Certified Fraud Examiners (ACFE): Austin, TX, USA, 2024. [Google Scholar]
  2. Dyck, A.; Morse, A.; Zingales, L. Who Blows the Whistle on Corporate Fraud? J. Financ. 2010, 65, 2213–2253. [Google Scholar] [CrossRef] [Scilit]
  3. Beneish, M.D. The Detection of Earnings Manipulation. Financ. Anal. J. 1999, 55, 24–36. [Google Scholar] [CrossRef] [Scilit]
  4. Dechow, P.M.; Ge, W.; Larson, C.R.; Sloan, R.G. Predicting Material Accounting Misstatements. Contemp. Account. Res. 2011, 28, 17–82. [Google Scholar] [CrossRef] [Scilit]
  5. Cecchini, M.; Aytug, H.; Koehler, G.J.; Pathak, P. Detecting Management Fraud in Public Companies. Manag. Sci. 2010, 56, 1146–1160. [Google Scholar] [CrossRef] [Scilit]
  6. Perols, J. Financial Statement Fraud Detection: An Analysis of Statistical and Machine Learning Algorithms. Audit. J. Pract. Theory 2011, 30, 19–50. [Google Scholar] [CrossRef] [Scilit]
  7. Bao, Y.; Ke, B.; Li, B.; Yu, Y.J.; Zhang, J. Detecting Accounting Fraud in Publicly Traded U.S. Firms Using a Machine Learning Approach. J. Account. Res. 2020, 58, 199–235. [Google Scholar] [CrossRef] [Scilit]
  8. Seiffert, C.; Khoshgoftaar, T.M.; Van Hulse, J.; Napolitano, A. RUSBoost: A Hybrid Approach to Alleviating Class Imbalance. IEEE Trans. Syst. Man Cybern. Part Syst. Hum. 2010, 40, 185–197. [Google Scholar] [CrossRef] [Scilit]
  9. Loughran, T.; McDonald, B. When Is a Liability Not a Liability? Textual Analysis, Dictionaries, and 10-Ks. J. Financ. 2011, 66, 35–65. [Google Scholar] [CrossRef] [Scilit]
  10. Loughran, T.; McDonald, B. Textual Analysis in Accounting and Finance: A Survey. J. Account. Res. 2016, 54, 1187–1230. [Google Scholar] [CrossRef] [Scilit]
  11. Purda, L.; Skillicorn, D. Accounting Variables, Deception, and a Bag of Words: Assessing the Tools of Fraud Detection. Contemp. Account. Res. 2015, 32, 1193–1223. [Google Scholar]
  12. Goel, S.; Gangolly, J. Beyond the Numbers: Mining the Annual Reports for Hidden Cues Indicative of Financial Statement Fraud. Intell. Syst. Account. Financ. Manag. 2012, 19, 75–89. [Google Scholar] [CrossRef] [Scilit]
  13. Craja, P.; Kim, A.; Lessmann, S. Deep Learning for Detecting Financial Statement Fraud. Decis. Support Syst. 2020, 139, 113421. [Google Scholar] [CrossRef] [Scilit]
  14. Mai, F.; Tian, S.; Lee, C.; Ma, L. Deep Learning Models for Bankruptcy Prediction Using Textual Disclosures. Eur. J. Oper. Res. 2019, 274, 743–758. [Google Scholar] [CrossRef] [Scilit]
  15. Public Company Accounting Oversight Board. AS 2401: Consideration of Fraud in a Financial Statement Audit; PCAOB Auditing Standards; Public Company Accounting Oversight Board (PCAOB): Washington, DC, USA, 2024. [Google Scholar]
  16. Brown, T.B.; Mann, B.; Ryder, N.; Subbiah, M.; Kaplan, J.; Dhariwal, P.; Neelakantan, A.; Shyam, P.; Sastry, G.; Askell, A.; et al. Language Models Are Few-Shot Learners. In Proceedings of the Advances in Neural Information Processing Systems (NeurIPS), Virtual, 6–12 December 2020; Volume 33, pp. 1877–1901. [Google Scholar]
  17. OpenAI. GPT-4 Technical Report. arXiv 2023, arXiv:2303.08774. [Google Scholar]
  18. Touvron, H.; Lavril, T.; Izacard, G.; Martinet, X.; Lachaux, M.A.; Lacroix, T.; Rozière, B.; Goyal, N.; Hambro, E.; Azhar, F.; et al. LLaMA: Open and Efficient Foundation Language Models. arXiv 2023, arXiv:2302.13971. [Google Scholar]
  19. Grattafiori, A.; Dubey, A.; Jauhri, A.; Pandey, A.; Kadian, A.; Al-Dahle, A.; Letman, A.; Mathur, A.; Schelten, A.; Vaughan, A.; et al. The Llama 3 Herd of Models. arXiv 2024, arXiv:2407.21783. [Google Scholar]
  20. Du, Y.; Li, S.; Torralba, A.; Tenenbaum, J.B.; Mordatch, I. Improving Factuality and Reasoning in Language Models through Multiagent Debate. arXiv 2023, arXiv:2305.14325. [Google Scholar]
  21. Liang, T.; He, Z.; Jiao, W.; Wang, X.; Wang, Y.; Wang, R.; Yang, Y.; Tu, Z.; Shi, S. Encouraging Divergent Thinking in Large Language Models through Multi-Agent Debate. In Proceedings of the 2024 Conference on Empirical Methods in Natural Language Processing (EMNLP), Miami, FL, USA, 12–16 November 2024. [Google Scholar]
  22. Hong, S.; Zhuge, M.; Chen, J.; Zheng, X.; Cheng, Y.; Wang, J.; Zhang, C.; Yau, S.; Lin, Z.; Zhou, L.; et al. MetaGPT: Meta Programming for a Multi-Agent Collaborative Framework. In Proceedings of the International Conference on Learning Representations (ICLR), Vienna, Austria, 7–11 May 2024. [Google Scholar]
  23. Wu, Q.; Bansal, G.; Zhang, J.; Wu, Y.; Li, B.; Zhu, E.; Jiang, L.; Zhang, X.; Zhang, S.; Liu, J.; et al. AutoGen: Enabling Next-Gen LLM Applications via Multi-Agent Conversation. In Proceedings of the Conference on Language Modeling (COLM), Philadelphia, PA, USA, 7–9 October 2024. [Google Scholar]
  24. Guo, T.; Chen, X.; Wang, Y.; Chang, R.; Pei, S.; Chawla, N.V.; Wiest, O.; Zhang, X. Large Language Model Based Multi-Agents: A Survey of Progress and Challenges. In Proceedings of the 33rd International Joint Conference on Artificial Intelligence (IJCAI), Jeju, Republic of Korea, 3–9 August 2024. [Google Scholar]
  25. Park, T. Enhancing Anomaly Detection in Financial Markets with an LLM-based Multi-Agent Framework. arXiv 2024, arXiv:2403.19735. [Google Scholar]
  26. Song, C.; Ma, L.; Zheng, J.; Liao, J.; Kuang, H.; Yang, L. Audit-LLM: Multi-Agent Collaboration for Log-based Insider Threat Detection. arXiv 2024, arXiv:2408.08902. [Google Scholar]
  27. Chen, T.; Guestrin, C. XGBoost: A Scalable Tree Boosting System. In Proceedings of the 22nd ACM SIGKDD International Conference on Knowledge Discovery and Data Mining (KDD), San Francisco, CA, USA, 13–17 August 2016; pp. 785–794. [Google Scholar]
  28. Araci, D. FinBERT: Financial Sentiment Analysis with Pre-trained Language Models. arXiv 2019, arXiv:1908.10063. [Google Scholar]
  29. Huang, A.H.; Wang, H.; Yang, Y. FinBERT: A Large Language Model for Extracting Information from Financial Text. Contemp. Account. Res. 2023, 40, 806–841. [Google Scholar] [CrossRef] [Scilit]
  30. Lewis, P.; Perez, E.; Piktus, A.; Petroni, F.; Karpukhin, V.; Goyal, N.; Küttler, H.; Lewis, M.; Yih, W.T.; Rocktäschel, T.; et al. Retrieval-Augmented Generation for Knowledge-Intensive NLP Tasks. In Proceedings of the Advances in Neural Information Processing Systems (NeurIPS), Virtual, 6–12 December 2020; Volume 33, pp. 9459–9474. [Google Scholar]
  31. Loukas, L.; Fergadiotis, M.; Androutsopoulos, I.; Malakasiotis, P. EDGAR-CORPUS: Billions of Tokens Make the World Go Round. In Proceedings of the Third Workshop on Economics and Natural Language Processing (ECONLP), Online, 11 November 2021; pp. 13–18. [Google Scholar]
  32. Kim, Y.J.; Baik, B.; Cho, S. Detecting Financial Misstatements with Fraud Intention Using Multi-Class Cost-Sensitive Learning. Expert Syst. Appl. 2016, 62, 32–43. [Google Scholar] [CrossRef] [Scilit]
  33. Chen, J.; Liang, Y.; Liu, J.; Zhou, M. Temporal Transformer with Conditional Tabular GAN for Credit Card Fraud Detection: A Sequential Deep Learning Approach. Mathematics 2026, 14, 1183. [Google Scholar] [CrossRef] [Scilit]
  34. Ping, W.; Jiao, Y.; Fan, H.; Zhang, X. Multimodal fraud detection in financial statements: A trimodal attention network with contrastive evidence chain construction. IEEE Access 2026, 14, 80456–80468. [Google Scholar] [CrossRef] [Scilit]
  35. Devlin, J.; Chang, M.W.; Lee, K.; Toutanova, K. BERT: Pre-training of Deep Bidirectional Transformers for Language Understanding. In Proceedings of the 2019 Conference of the North American Chapter of the Association for Computational Linguistics (NAACL), Minneapolis, MN, USA, 2–7 June 2019; pp. 4171–4186. [Google Scholar]
  36. Vaswani, A.; Shazeer, N.; Parmar, N.; Uszkoreit, J.; Jones, L.; Gomez, A.N.; Kaiser, Ł.; Polosukhin, I. Attention Is All You Need. In Proceedings of the Advances in Neural Information Processing Systems (NeurIPS), Long Beach, CA, USA, 4–9 December 2017; Volume 30. [Google Scholar]
  37. Wu, S.; Irsoy, O.; Lu, S.; Dabravolski, V.; Dredze, M.; Gehrmann, S.; Kambadur, P.; Rosenberg, D.; Mann, G. BloombergGPT: A Large Language Model for Finance. arXiv 2023, arXiv:2303.17564. [Google Scholar]
  38. Yang, H.; Liu, X.Y.; Wang, C.D. FinGPT: Open-Source Financial Large Language Models. arXiv 2023, arXiv:2306.06031. [Google Scholar]
  39. Wei, J.; Wang, X.; Schuurmans, D.; Bosma, M.; Ichter, B.; Xia, F.; Chi, E.H.; Le, Q.V.; Zhou, D. Chain-of-Thought Prompting Elicits Reasoning in Large Language Models. In Proceedings of the Advances in Neural Information Processing Systems (NeurIPS), New Orleans, LA, USA, 28 November–9 December 2022; Volume 35, pp. 24824–24837. [Google Scholar]
  40. Yao, S.; Zhao, J.; Yu, D.; Du, N.; Shafran, I.; Narasimhan, K.; Cao, Y. ReAct: Synergizing Reasoning and Acting in Language Models. In Proceedings of the International Conference on Learning Representations (ICLR), Kigali, Rwanda, 1–5 May 2023. [Google Scholar]
  41. Ergun, E. Financial Statement Fraud Detection via Large Language Models. Intell. Syst. Account. Financ. Manag. 2025, 32, e70021. [Google Scholar] [CrossRef] [Scilit]
  42. Bai, S.; Wu, B.; Zhang, Y.; Wu, C.; Zheng, X.; Yuan, Y.; Wu, K.; Li, J. AuditAgent: Expert-Guided Multi-Agent Reasoning for Cross-Document Fraudulent Evidence Discovery. arXiv 2025, arXiv:2510.00156. [Google Scholar]
  43. Wang, Y.; Wang, M.; Lu, Y.; Peng, Z.; Lin, S. A Multi-Agent Framework for Audit Risk Assessment with Explicit Uncertainty and Evidence Conflict Modeling. arXiv 2026, arXiv:2606.15640. [Google Scholar]
  44. Sugiura, I.; Ishida, T.; Makino, T.; Tazuke, C.; Nakagawa, T.; Nakago, K.; Ha, D. EDINET-Bench: Evaluating LLMs on Complex Financial Tasks Using Japanese Financial Statements. arXiv 2025, arXiv:2506.08762. [Google Scholar]
  45. Liu, Z.; He, Y.; Ou, Q.; Zhu, T.; Guo, X.; Peng, X.; Ananiadou, S. AuditFraudBench: Benchmarking Audit Judgment in Detecting Fraudulent Misstatements. arXiv 2026, arXiv:2606.08345. [Google Scholar]
  46. Ledoit, O.; Wolf, M. Honey, I Shrunk the Sample Covariance Matrix. J. Portf. Manag. 2004, 30, 110–119. [Google Scholar] [CrossRef] [Scilit]
  47. Rousseeuw, P.J.; Van Driessen, K. A Fast Algorithm for the Minimum Covariance Determinant Estimator. Technometrics 1999, 41, 212–223. [Google Scholar] [CrossRef]
  48. Jiao, Y.; Fan, H.; Yue, X.; Ping, W.; Sun, T.; Wang, J. Dynamic heterogeneous graph contrastive learning for uncovering collusive financial fraud. Sci. Rep. 2026. [Google Scholar] [CrossRef] [Scilit] [PubMed]
  49. Krippendorff, K. Content Analysis: An Introduction to Its Methodology, 2nd ed.; Sage Publications: Thousand Oaks, CA, USA, 2004. [Google Scholar]
  50. Lin, T.Y.; Goyal, P.; Girshick, R.; He, K.; Dollár, P. Focal Loss for Dense Object Detection. In Proceedings of the IEEE International Conference on Computer Vision (ICCV); IEEE: New York, NY, USA, 2017; pp. 2980–2988. [Google Scholar]
  51. DeLong, E.R.; DeLong, D.M.; Clarke-Pearson, D.L. Comparing the Areas under Two or More Correlated Receiver Operating Characteristic Curves: A Nonparametric Approach. Biometrics 1988, 44, 837–845. [Google Scholar] [CrossRef] [Scilit] [PubMed]
Figure 1. System architecture of FraudDebate-Agent. The three evidence-producing agents (Quantitative, Narrative, Peer) each emit a score and a cited evidence set. The Critic–Debate agent is the orchestration hub (central block): it (i) instantiates the two anchored executors and moderates the pair-wise EMAD exchange, (ii) enforces the groundedness penalty of Equation (10) on every claim, (iii) after consensus or R rounds scores how consistent each modality is with the debate transcript and emits the reliability logits κ Q , κ N , κ P , κ D that drive the fusion attention weights (Equation (13)), and (iv) triggers the AS 2401 report. Solid arrows carry scores and evidence; the Critic’s arrows into the evidence graph carry the reliability logits.
Mathematics 14 02695 g001
Figure 2. ROC curves on the test block. FraudDebate-Agent dominates the single-modality, fusion, and single-LLM baselines across operating points.
Mathematics 14 02695 g002
Figure 3. NDCG@k versus investigation budget k. FraudDebate-Agent’s lead is largest at small budgets, the regime auditors operate in.
Mathematics 14 02695 g003
Figure 4. Debate dynamics. Left axis: AUC and groundedness rise and plateau by R = 3 . Right axis: the mean verdict gap | v 1 v 2 | shrinks toward the consensus tolerance ε .
Mathematics 14 02695 g004
Figure 5. Ablation. Each component contributes; the Quantitative agent and the debate mechanism are the two largest single contributors.
Mathematics 14 02695 g005
Figure 6. Reliability diagram. FraudDebate-Agent (EMAD) is closest to the diagonal; the single LLM is over-confident.
Mathematics 14 02695 g006
Figure 7. Per-year test AUC with seed-level error bars. FraudDebate-Agent dominates RUSBoost every year but exhibits real year-to-year variation.
Mathematics 14 02695 g007
Figure 8. Case-study evidence graph. Green edges denote mutually supporting evidence; red edges denote contradictions that the debate resolves and the fusion down-weights. The fused node reports an elevated fraud-risk score ( p = 0.86 ) that flags the filing for review, not a determination of intent.
Mathematics 14 02695 g008
Table 1. Linked numerical dataset summary (firm-years). These are the figures for the uscecchini28 vintage used here; the released code regenerates them, and Table 2 gives the text-available subset. The ratios reflect the typical ∼1% fraud base rate.
SplitPeriodFirm-YearsFraudFraud Rate
Train1991–1999105,4808550.81%
Validation2000–200218,9001210.64%
Test2003–200821,6401560.72%
Total1991–2008146,02011320.78%
Table 2. Sample attrition from the numerical panel to the text-available linked sample used by the text, fusion, and full models. Each row is the count remaining after the stated filter.
StepFirm-YearsFraud
uscecchini28 numerical panel (FY 1991–2008)146,0201132
  retain FY with EDGAR-CORPUS coverage (FY ≥ 1993)131,5401061
  retain FY with a parseable Item 7 (MD&A) segment112,700921
  retain MD&A with ≥100 tokens (drop stub/incorporated-by-reference)108,930894
Text-available linked sample108,930894
Table 3. Main out-of-time results on the common text-available test block (mean ± std over 5 seeds). Higher is better for all metrics except ECE. Best in bold.
FamilyMethodAUCNDCG@1%Prec@1% F 1
Quant.LR (Dechow F-score) [4] 0.690 ± 0.005 0.019 2.4 % 0.071
SVM financial kernel [5] 0.705 ± 0.006 0.022 2.9 % 0.083
RUSBoost (28 items) [7] 0.725 ± 0.005 0.024 3.3 % 0.094
XGBoost (Quant agent) [27] 0.738 ± 0.006 0.027 3.8 % 0.103
TextLM dict. + LR [9] 0.661 ± 0.008 0.016 2.0 % 0.061
FinBERT classifier [28] 0.703 ± 0.007 0.021 2.8 % 0.081
FusionConcatenation MLP 0.742 ± 0.007 0.029 4.0 % 0.108
HAN (ratios + MD&A) [13] 0.745 ± 0.006 0.030 4.2 % 0.112
LLMGPT-4 zero-shot [17] 0.681 ± 0.010 0.018 2.3 % 0.069
Single-agent CoT + tools [39,40] 0.712 ± 0.009 0.023 3.1 % 0.088
Multi-agent, no debate 0.770 ± 0.008 0.038 5.1 % 0.135
Audit-LLM-style debate [26] 0.781 ± 0.008 0.041 5.6 % 0.146
OursFraudDebate-Agent 0.806 ± 0.007 0.047 6.4 % 0.158
Table 4. Key hyperparameters (fixed across the five seeds unless tuned on the validation block).
ComponentHyperparameterValue
XGBoost/TabAttnmax depth; #trees M; learning rate { 4 , 6 , 8 } ; ≤500; 0.05
subsample; colsample_bytree; λ 0.8 ; 0.8 ; 1.0
Narrative head g ϕ hidden units; dropout128; 0.1
Peer agent#peers K; shrinkage δ ; cond. cap20; Ledoit–Wolf; 10 6
Retrieverindex; metricFAISS HNSW; cosine
Debaterounds R; tolerance ε ; temperature3; 0.1 ; 0.7
Fusionfocal γ ; class weight α ; ζ ; ρ 2; inverse-freq.; 1.0 ; 0.5
Calibrationmethodtemperature scaling
Table 5. Significance of FraudDebate-Agent vs. strong baselines. AUC: DeLong 95 % CI and p-value for Δ AUC. NDCG@ 1 % : paired-bootstrap mean difference and 95 % CI ( 10,000 resamples).
FraudDebate-Agent vs. Δ AUC ( 95 % CI)DeLong p Δ NDCG@1% ( 95 % CI)
Audit-LLM-style debate + 0.025 [ 0.010 , 0.040 ] 0.004 + 0.006 [ 0.002 , 0.010 ]
Multi-agent, no debate + 0.036 [ 0.020 , 0.052 ] <0.001 + 0.009 [ 0.004 , 0.014 ]
HAN (ratios + MD&A) + 0.061 [ 0.043 , 0.079 ] <0.001 + 0.017 [ 0.011 , 0.023 ]
RUSBoost (28 items) + 0.081 [ 0.062 , 0.100 ] <0.001 + 0.023 [ 0.016 , 0.030 ]
Table 6. Real-world operating metrics on the text-available test block ( 16,180 filings; 118 frauds; base rate 0.73 % ). 1 % budget 162 filings, 5 % budget 809 . “#fraud@k” is the absolute number of true frauds inside the budget; “rev./fraud” is reviews per fraud found at the 1 % budget. Higher is better except reviews/fraud.
MethodPR-AUCRec@1%Rec@5%#fraud@1%#fraud@5%Rev./Fraud
RUSBoost (28 items) 0.043 4.6 % 13.2 % ∼5∼16 30.3
XGBoost (Quant agent) 0.049 5.3 % 14.6 % ∼6∼17 26.3
HAN (ratios + MD&A) 0.055 5.9 % 16.0 % ∼7∼19 23.8
Multi-agent, no debate 0.071 7.1 % 18.5 % ∼8∼22 19.6
Audit-LLM-style debate 0.078 7.7 % 19.7 % ∼9∼23 17.9
FraudDebate-Agent 0.092 9.0 % 22.0 % ∼10∼26 15.6
Table 7. Effect of debate rounds R (mean over 5 seeds). Accuracy and faithfulness rise then plateau; cost grows linearly in R.
R0 (Avg.)1234
AUC0.7790.7930.8020.8060.806
Groundedness0.710.790.850.880.88
Rel. LLM cost 1.0 × 1.7 × 2.4 × 3.0 × 3.7 ×
Table 8. Debate on the disagreement subset ( 19 % of the test block), by disagreement type. AUC is computed on each subset; “naive” is weighted averaging, “debate” is the full mechanism.
TypeAlarm Patternnfraud RateNaive AUCDebate AUC Δ
AQuant high, text/peer low1150 1.8 % 0.71 0.80 + 0.09
BNarrative high, quant/peer low980 1.5 % 0.69 0.82 + 0.13
CPeer high, firm-level low610 1.1 % 0.66 0.74 + 0.08
DMixed/all disagree334 2.1 % 0.68 0.77 + 0.09
All disagreement cases3074 1.6 % 0.742 0.831 + 0.089
Table 9. Ablation (mean ± std over 5 seeds). Δ AUC is relative to the full model.
VariantAUC Δ AUC
Full FraudDebate-Agent 0.806 ± 0.007 n/a
 – w/o Quantitative agent 0.772 ± 0.009 0.034
 – w/o Narrative agent 0.781 ± 0.008 0.025
 – w/o Peer agent 0.793 ± 0.007 0.013
 – w/o debate (weighted avg.) 0.779 ± 0.008 0.027
– w/o evidence graph (concat.) 0.788 ± 0.008 0.018
Table 10. Peer-agent stability. Top: full-system AUC under different peer-covariance estimators. Bottom: full-system AUC under different neighbourhood sizes K (shrinkage estimator).
Covariance EstimatorFull-System AUC
Sample covariance (unregularised) 0.792 ± 0.010
Diagonal (z-score) distance 0.798 ± 0.008
Minimum Covariance Determinant 0.805 ± 0.007
Ledoit–Wolf shrinkage (ours) 0.806 ± 0.007
Neighbourhood size KFull-system AUC
K = 10 0.803 ± 0.008
K = 20 (ours) 0.806 ± 0.007
K = 30 0.806 ± 0.007
K = 50 0.804 ± 0.008
Table 11. Faithfulness and explanation quality. Groundedness and expert rating: higher is better; hallucination rate and ECE: lower is better.
MethodGroundednessHalluc. RateExpert (1–5)ECE
Single LLM (CoT)0.680.222.90.094
Multi-agent, no debate0.740.163.40.071
FraudDebate-Agent (EMAD)0.880.074.20.031
Table 12. Expert evaluation of the AS 2401 reports by four accounting-trained annotators on a stratified sample of 150 reports (mean of 1–5 ratings; higher is better). The last column is inter-rater agreement (Krippendorff’s α ).
DimensionSingle LLMNo DebateFraudDebate-AgentKripp. α
Clarity3.23.74.40.66
Usefulness2.93.34.10.63
Evidence sufficiency2.63.24.20.69
Verifiability2.83.44.10.72
Table 13. Inference cost comparison. Relative cost is normalised to one zero-shot GPT-4 pass ( 1.0 × ); encoder/tree baselines carry no per-firm-year LLM cost.
MethodLLM Calls/Firm-YearRelative Cost
LR/SVM/RUSBoost/XGBoost0≈0.00×
FinBERT/HAN (encoders)0≈0.02×
GPT-4 zero-shot1 1.0 ×
Single-agent CoT + tools1–2≈1.6×
Multi-agent, no debate1 (verbalise)≈1.0×
Audit-LLM-style debate∼5≈2.4×
FraudDebate-Agent  ( R = 3 )∼8≈3.0×
Disclaimer/Publisher’s Note: The statements, opinions and data contained in all publications are solely those of the individual author(s) and contributor(s) and not of MDPI and/or the editor(s). MDPI and/or the editor(s) disclaim responsibility for any injury to people or property resulting from any ideas, methods, instructions or products referred to in the content.