1. Introduction
Urban infrastructure systems, including roads, bridges, drainage networks, water systems, public utilities, public safety assets, and information and communication technology (ICT) infrastructure, are essential to the operation of modern cities. The increasing adoption of smart city platforms has accelerated the production of textual reports from citizens, inspection teams, maintenance units, emergency platforms, and digital service channels [
1,
2,
3,
4,
5]. These textual reports may contain early indicators of infrastructure-related risks, including road damage, bridge cracks, flooding, exposed cables, gas leaks, power outages, communication failures, unsafe public infrastructure, and environmental hazards. Timely classification of such reports is important for maintenance prioritization, operational routing, and urban resilience planning [
6,
7,
8].
Despite the increasing availability of urban text data, the automatic classification of infrastructure risk reports is still a challenging natural language processing (NLP) task. First, reports are often brief and informal, particularly when they are submitted by citizens via mobile applications or service platforms. Second, users may describe identical incidents using varied wording, local expressions, or incomplete information. Third, risk categories frequently overlap semantically. For example, a traffic sensor failure may pertain to both transportation and ICT infrastructure; a flood near an underpass may involve environmental, drainage, and transportation systems; and a broken light pole may constitute a utility issue, a public safety hazard, or a routine maintenance request, depending on the context. Fourth, severity assessment is especially complex because it depends not only on the reported incident but also on impact factors such as the affected population, asset criticality, emergency access, proximity to sensitive locations, and the duration of service disruption.
Traditional text classification methods, such as TF-IDF, Logistic Regression, Support Vector Machines, Random Forests, and related classifiers, remain valuable due to their transparency and computational efficiency [
9,
10,
11,
12,
13]. However, these lexical models are sensitive to vocabulary variation and often fail to capture deeper semantic similarities. Deep learning and transformer-based models, including convolutional neural networks (CNNs), recurrent models, attention mechanisms, BERT, RoBERTa, and sentence embedding models, have substantially advanced text representation learning [
14,
15,
16,
17,
18,
19,
20,
21]. In spite of these advances, transformer-based classifiers typically process each report in isolation and do not directly incorporate similar historical cases, infrastructure domain relationships or interpretable evidence.
Retrieval-augmented approaches offer a promising solution by combining a model’s internal representation of input text with relevant external evidence [
22,
23,
24,
25,
26]. In operational urban contexts, historical reports retrieved from archives can serve as contextual evidence to inform classification decisions. Concurrently, retrieval-augmented feature representation can model relationships among reports, infrastructure assets, locations, risk keywords, categories, and severity labels. Graph neural networks and graph-based text representations have demonstrated that incorporating relational structure can enhance classification performance when data entities are interconnected [
27,
28,
29,
30,
31,
32]. Explainable artificial intelligence (AI) methods, such as LIME, SHAP, example-based explanations, and visual analytics, are also essential for decision-support systems, as users require transparency regarding the rationale behind assigned risk categories or priorities [
33,
34,
35,
36,
37,
38].
Recent NLP studies have shown that external knowledge, retrieval mechanisms, structured text representation, and explainability can improve text classification and decision-support tasks. For example, external knowledge has been used to improve critical error detection in machine translation [
39], while retrieval-enhanced non-parametric approaches have been proposed for efficient text classification in resource-limited environments [
40]. Graph-based text representation has also been investigated for improved classification [
41]. These studies motivate the integration of retrieval, representation learning, and explainability in the present work.
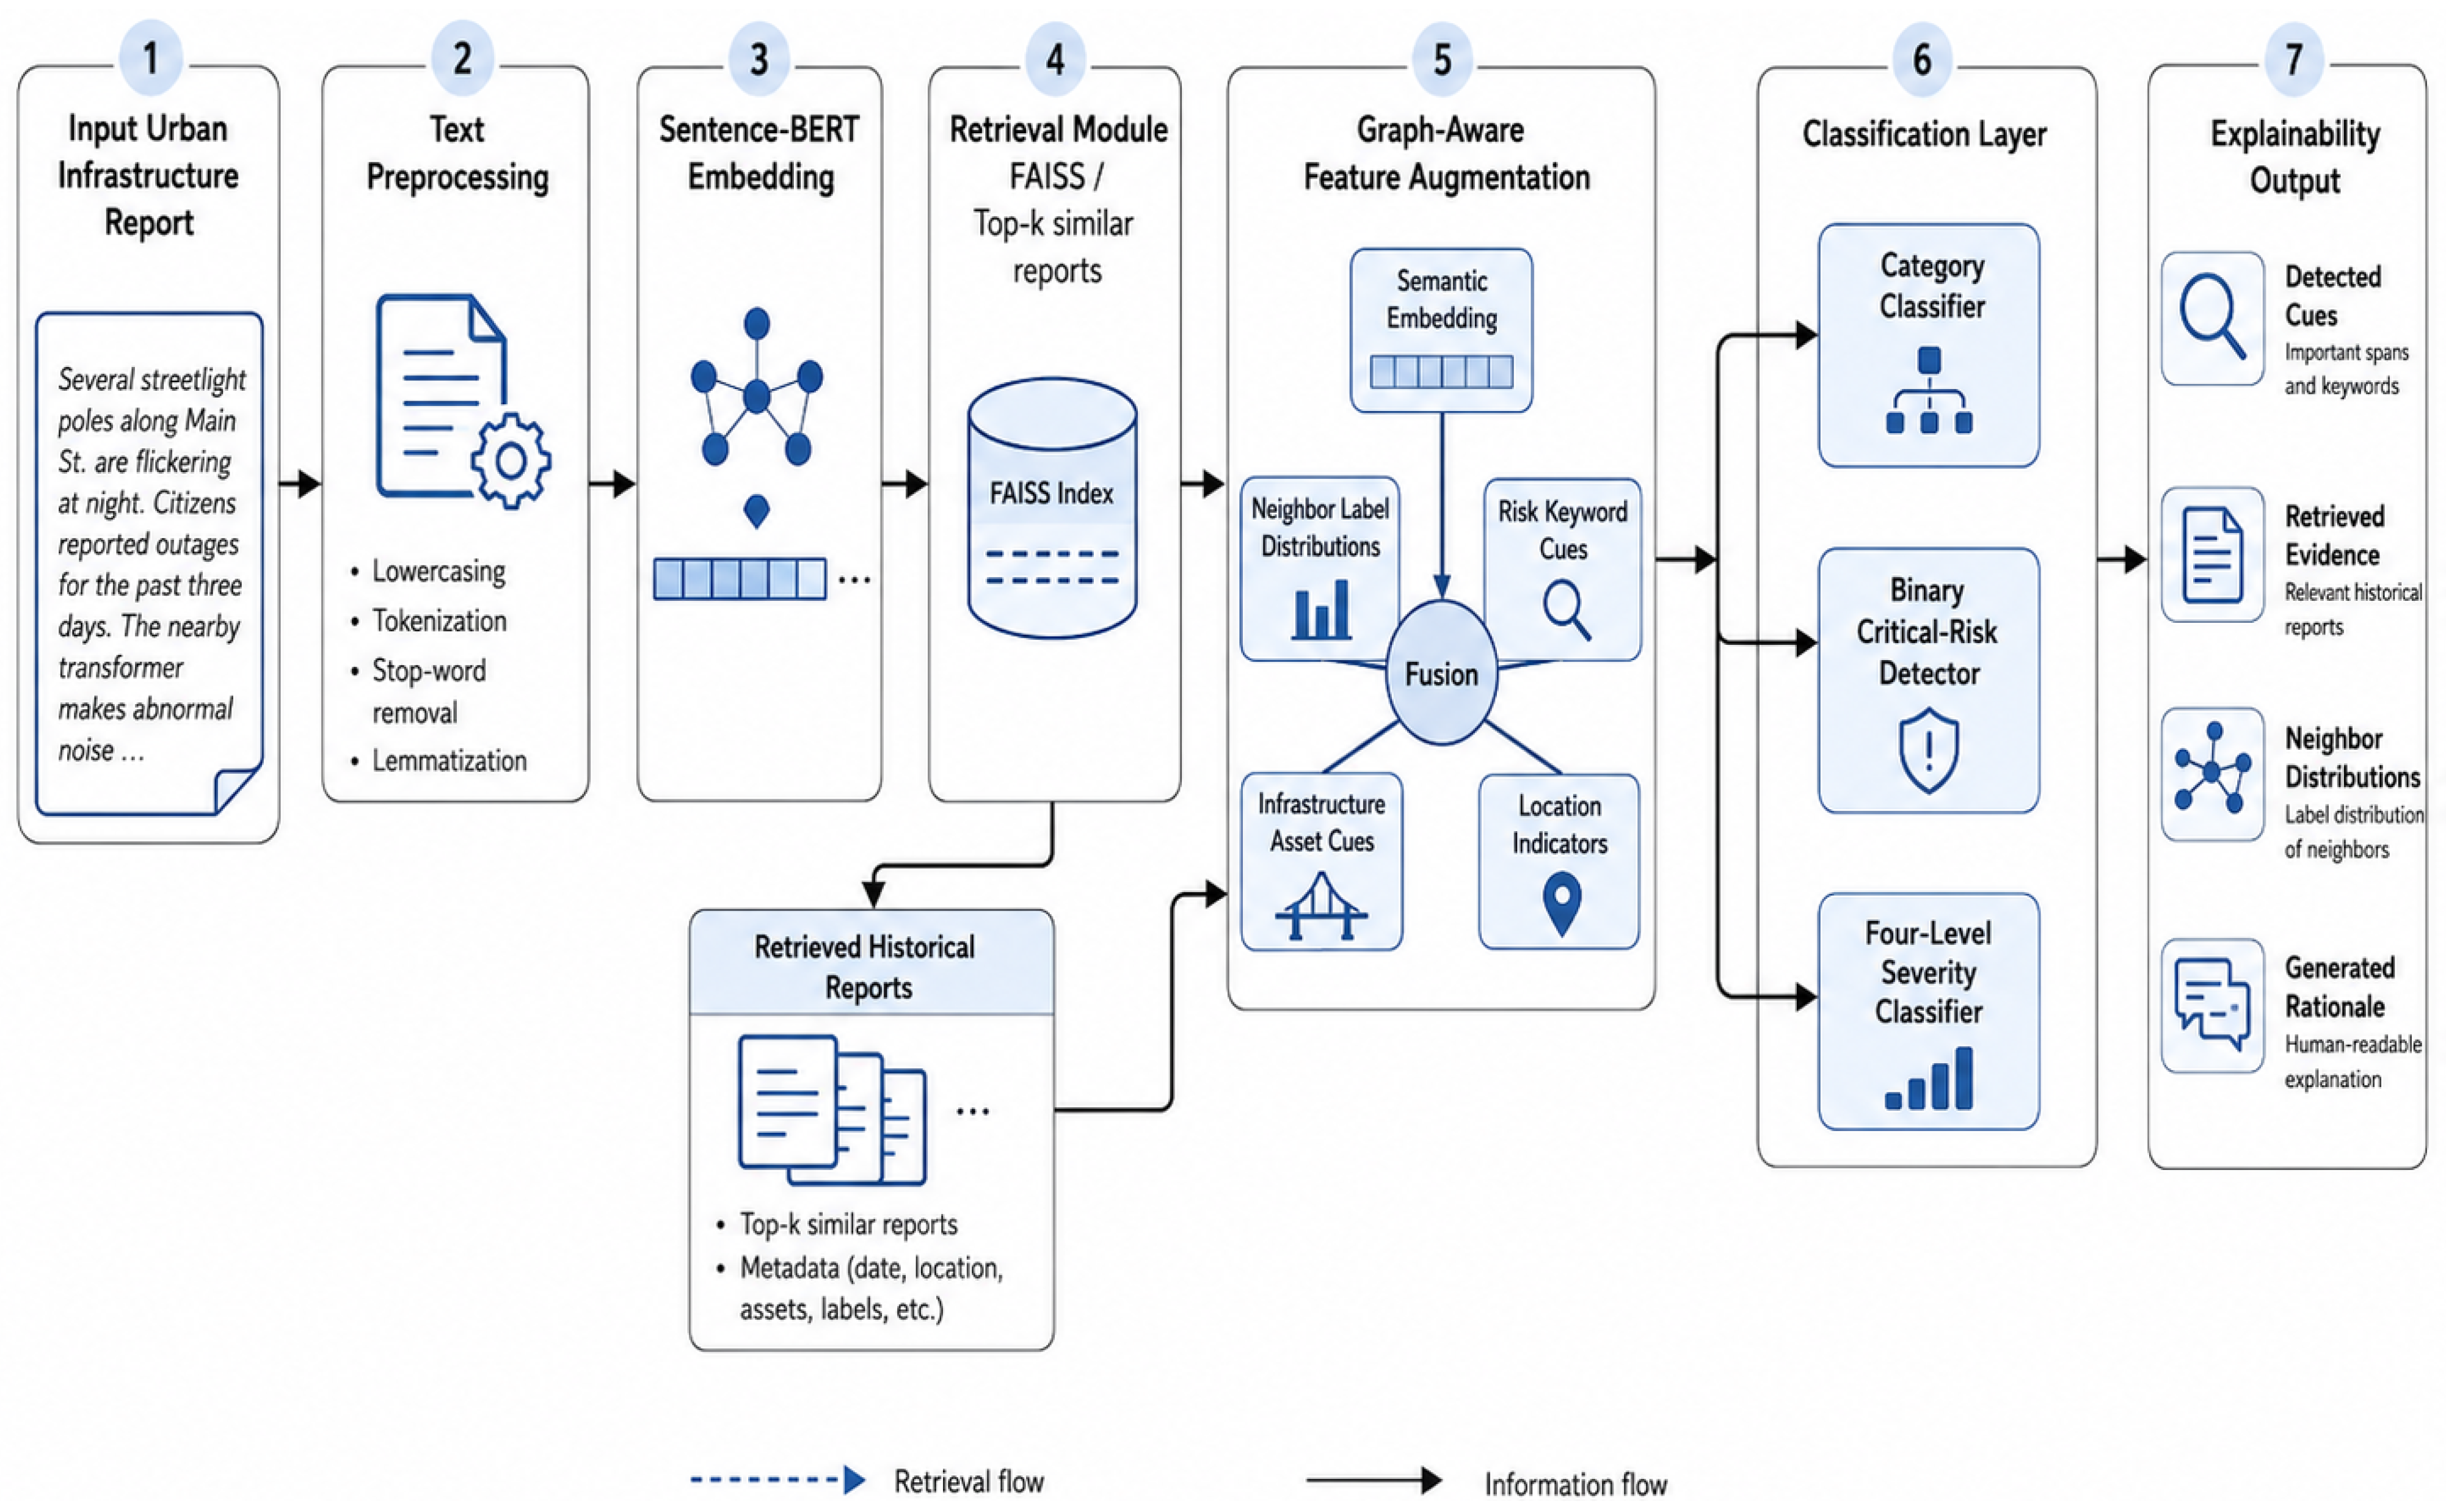
To confront these challenges, this study presents RAFE-XAI, which stands for Retrieval-Augmented Feature Engineering and Explainable AI. Unlike Retrieval-Augmented Generation systems, RAFE-XAI does not generate text from retrieved documents. Instead, it uses retrieved reports to construct classification-oriented features, including neighbor category distributions, neighbor severity distributions, and evidence for explanation. The proposed framework unites Sentence-BERT embeddings, semantic retrieval via FAISS, retrieved neighbor label distributions, risk keyword indicators, infrastructure asset cues, location features, and evidence-based explainability. Furthermore, UIR-Text, a semi-synthetic urban infrastructure risk dataset, is designed to reflect common smart city reporting scenarios. This dataset contains six infrastructure risk categories and four severity levels using scenario-level group splitting to prevent information leakage between the training and test sets.
The main contributions of this study are as follows:
We propose RAFE-XAI, a retrieval-augmented feature engineering and explainable NLP framework for classifying urban infrastructure risk reports.
We introduce UIR-Text, a semi-synthetic benchmark dataset with six urban infrastructure risk categories, four severity levels, and scenario-level no-leakage splitting.
We design retrieval-augmented feature representations that combine sentence embeddings, retrieved-neighbor label distributions, risk keyword indicators, infrastructure asset cues, and location indicators.
We evaluate three decision tasks: risk category classification, binary critical-risk detection, and four-level severity classification.
We provide an explainability analysis based on detected textual cues, retrieved evidence, retrieval-neighborhood distributions, and template-based rationales.
The remainder of this paper is organized as follows.
Section 2 reviews the relevant literature.
Section 3 defines the problem.
Section 4 describes the UIR-Text dataset and risk taxonomy.
Section 5 presents the RAFE-XAI methodology.
Section 6 reports the experimental setup.
Section 7 presents and discusses the results.
Section 8 provides the ablation study, component contribution analysis, and explainability analysis.
Section 9 discusses ethical considerations.
Section 10 presents limitations and future work.
Section 11 concludes the study.
2. Related Work
2.1. Natural Language Processing for Text Classification
Text classification is a foundational task in natural language processing (NLP) with applications including sentiment analysis, topic classification, document routing, fake news detection, spam filtering, and decision-support systems [
14,
17,
19,
42]. Early approaches represented documents using sparse lexical features such as bag-of-words, term frequency-inverse document frequency (TF-IDF), and n-gram counts, which were then processed by classifiers such as Logistic Regression, Support Vector Machines (SVM), Naive Bayes, Random Forest, or gradient boosting [
9,
10,
11,
12]. While these methods are efficient and interpretable, they are constrained by vocabulary mismatch and limited semantic generalization.
Deep learning approaches have shifted text classification from sparse lexical features to distributed representations. Convolutional Neural Networks (CNNs) capture local n-gram patterns [
14], while recurrent models such as Long Short-Term Memory (LSTM) and Gated Recurrent Unit (GRU) networks capture sequential dependencies [
15,
16]. Hierarchical attention networks further improve document-level classification by modeling attention at both the word and sentence levels [
17]. Transformer models introduce self-attention mechanisms, enabling enhanced contextual modeling [
18]. Bidirectional Encoder Representations from Transformers (BERT) employs bidirectional pretraining to generate contextual representations that improve performance on many NLP benchmarks [
19], and RoBERTa refines pretraining procedures for more robust representations [
20]. Sentence-BERT adapts transformer encoders for efficient sentence-level similarity and retrieval [
21], which is particularly valuable for nearest-neighbor classification and semantic search.
2.2. Retrieval-Augmented NLP and Evidence-Based Classification
Retrieval-augmented NLP integrates parametric models with external evidence retrieved from corpora or knowledge bases. Retrieval-Augmented Generation (RAG) introduced a framework in which a sequence-to-sequence model leverages retrieved documents to address knowledge-intensive tasks [
22]. REALM and Dense Passage Retrieval further demonstrate that dense retrieval supports open-domain question answering and knowledge access [
23,
24]. While retrieval augmentation is frequently associated with generation tasks, it also benefits classification by providing contextual evidence and enhancing interpretability.
Classical retrieval methods such as BM25 continue to serve as strong lexical baselines [
25], whereas dense vector search libraries like FAISS facilitate scalable similarity search using embedding vectors [
26]. For resource-constrained classification, Lv and Ding’s EGTJ method incorporates an Elasticsearch retrieval stage to reduce candidate comparison costs and enable efficient non-parametric classification [
40]. In this study, retrieval functions not only as a classifier but also as a source of retrieval-neighborhood evidence. Retrieved reports supply category and severity distributions, which are incorporated as retrieval-augmented features and explanation components. Although the acronym RAG is commonly associated with Retrieval-Augmented Generation, the present study does not perform retrieval-conditioned text generation. Instead, retrieval is used for classification-oriented feature engineering. Retrieved reports provide neighbor label distributions and evidence for explanation, but the predicted outputs are produced by supervised classifiers rather than by a generative language model. For this reason, the revised framework is named RAFE-XAI, emphasizing retrieval-augmented feature engineering an explainable classification.
2.3. External Knowledge and Contextual Enrichment
External knowledge enhances NLP classification, particularly when individual inputs are brief or ambiguous. Such knowledge may take the form of retrieved examples, domain definitions, prompts, knowledge graph relations, commercial system outputs, or metadata. Eo and Park’s external knowledge-guided tuning method for critical error detection in machine translation exemplifies this approach: their model integrates demonstration examples and commercial machine translation outputs to improve binary critical error detection [
39]. These findings support the conclusion that structured external evidence can enhance task-specific classification.
In urban infrastructure risk classification, textual reports often lack sufficient context. For example, a citizen report may reference a road, camera, or drain without specifying whether the incident pertains to transportation, information and communication technology (ICT), environmental, or utility domains. To address this, RAFE-XAI enriches inputs with similar historical reports and structured domain cues. This approach enables the classifier to leverage both semantic content and external contextual evidence.
2.4. Retrieval-Augmented Feature-Based Text Representation
Graph-based representations are particularly effective when data exhibit relational structure. Graph Convolutional Networks (GCNs) learn node representations by propagating information across graph edges [
27]. Graph Attention Networks (GATs) assign attention weights to neighboring nodes [
28]. GraphSAGE enables inductive representation learning [
29], while relational GCNs are designed to model multi-relational graphs [
30]. Text-GCN constructs a heterogeneous word-document graph and applies graph convolution for text classification [
31]. Surveys of graph neural networks highlight their capacity to model non-Euclidean relational data [
32,
43].
Structured and graph-based text representations have been explored as a way to capture relationships between documents, terms, and semantic units. For example, Text-GCN constructs a heterogeneous word-document graph for text classification [
31], while TTG-Text investigates graph-based text representation for improved classification [
41]. These studies motivate the use of structured contextual signals in text classification. In the present work, however, RAFE-XAI does not construct an explicit graph; instead, it uses retrieval-neighbor label distributions and domain indicators as feature-engineering components.
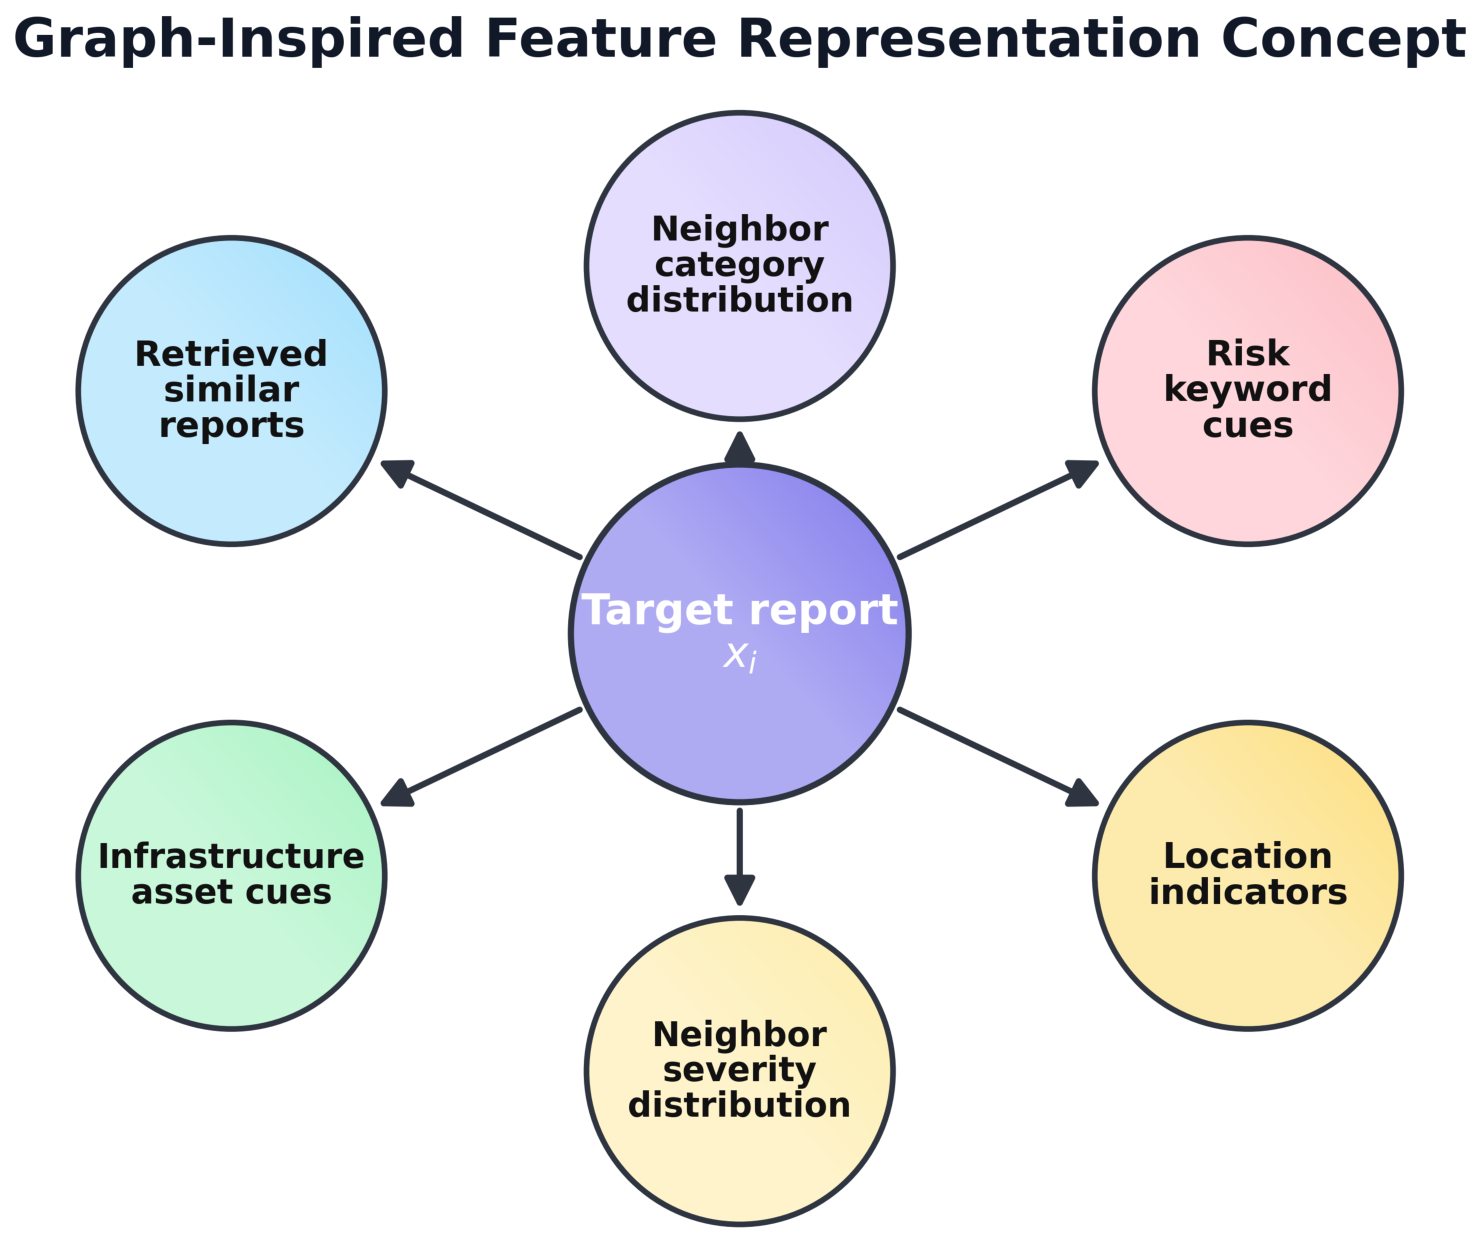
Urban infrastructure reports inherently exhibit relational characteristics. A report may be associated with assets such as roads, pipes, bridges, sensors, cables, and public facilities; locations including schools, hospitals, mosques, intersections, and residential districts; risk triggers such as cracks, leakage, outages, flooding, exposed cables, and fire hazards; and classification labels such as Transportation, Utility, Public Safety, Environmental, Information and Communication Technology (ICT), and Non-Critical. Modeling these relationships enables the capture of domain structure beyond isolated text embeddings.
2.5. Explainable AI for Decision Support
Explainable artificial intelligence (AI) is critical when machine learning informs operational decisions, especially in safety-related domains. Local Interpretable Model-agnostic Explanations (LIME) elucidates individual predictions by constructing interpretable local models [
33]. SHapley Additive exPlanations (SHAP) provides unified additive feature attribution based on Shapley values [
34]. Comprehensive surveys on explainability emphasize that explanations should be faithful, interpretable, and beneficial to users [
35,
36,
37]. In practical decision-making contexts, explanations facilitate trust, auditing, error diagnosis, and human oversight.
These studies underscore the importance of explainability as a complement to predictive accuracy, particularly in decision-support settings where users need to understand the basis of model predictions. RAFE-XAI delivers evidence-based explanations through detected textual indicators, retrieved similar reports, neighbor label distributions, and template-based rationales. This capability makes the model well suited for smart city decision-support scenarios where human operators must understand the rationale behind report categorization or prioritization.
2.6. NLP for Smart Cities and Urban Infrastructure Risk
Smart city research has consistently emphasized data-driven urban management, sensing, and analytics [
1,
2,
4,
6]. Internet of Things (IoT) systems generate sensor streams for smart cities [
3], while social media, hotline data, and public service platforms offer textual signals regarding urban conditions [
5,
7]. NLP supports event detection, complaint routing, public-service analytics, and infrastructure monitoring. Nevertheless, much of the existing literature concentrates on general complaint classification or event detection, rather than on explainable classification of infrastructure risk categories and severity.
This study addresses this gap by integrating retrieval, retrieval-augmented feature representation, and explainability within an integrated framework for urban infrastructure risk reports. In contrast to models that classify reports based solely on isolated text embeddings, RAFE-XAI clearly incorporates retrieved historical evidence, infrastructure domain cues, retrieved-neighbor features and explanation outputs.
4. UIR-Text Dataset Design and Risk Taxonomy
4.1. Dataset Overview
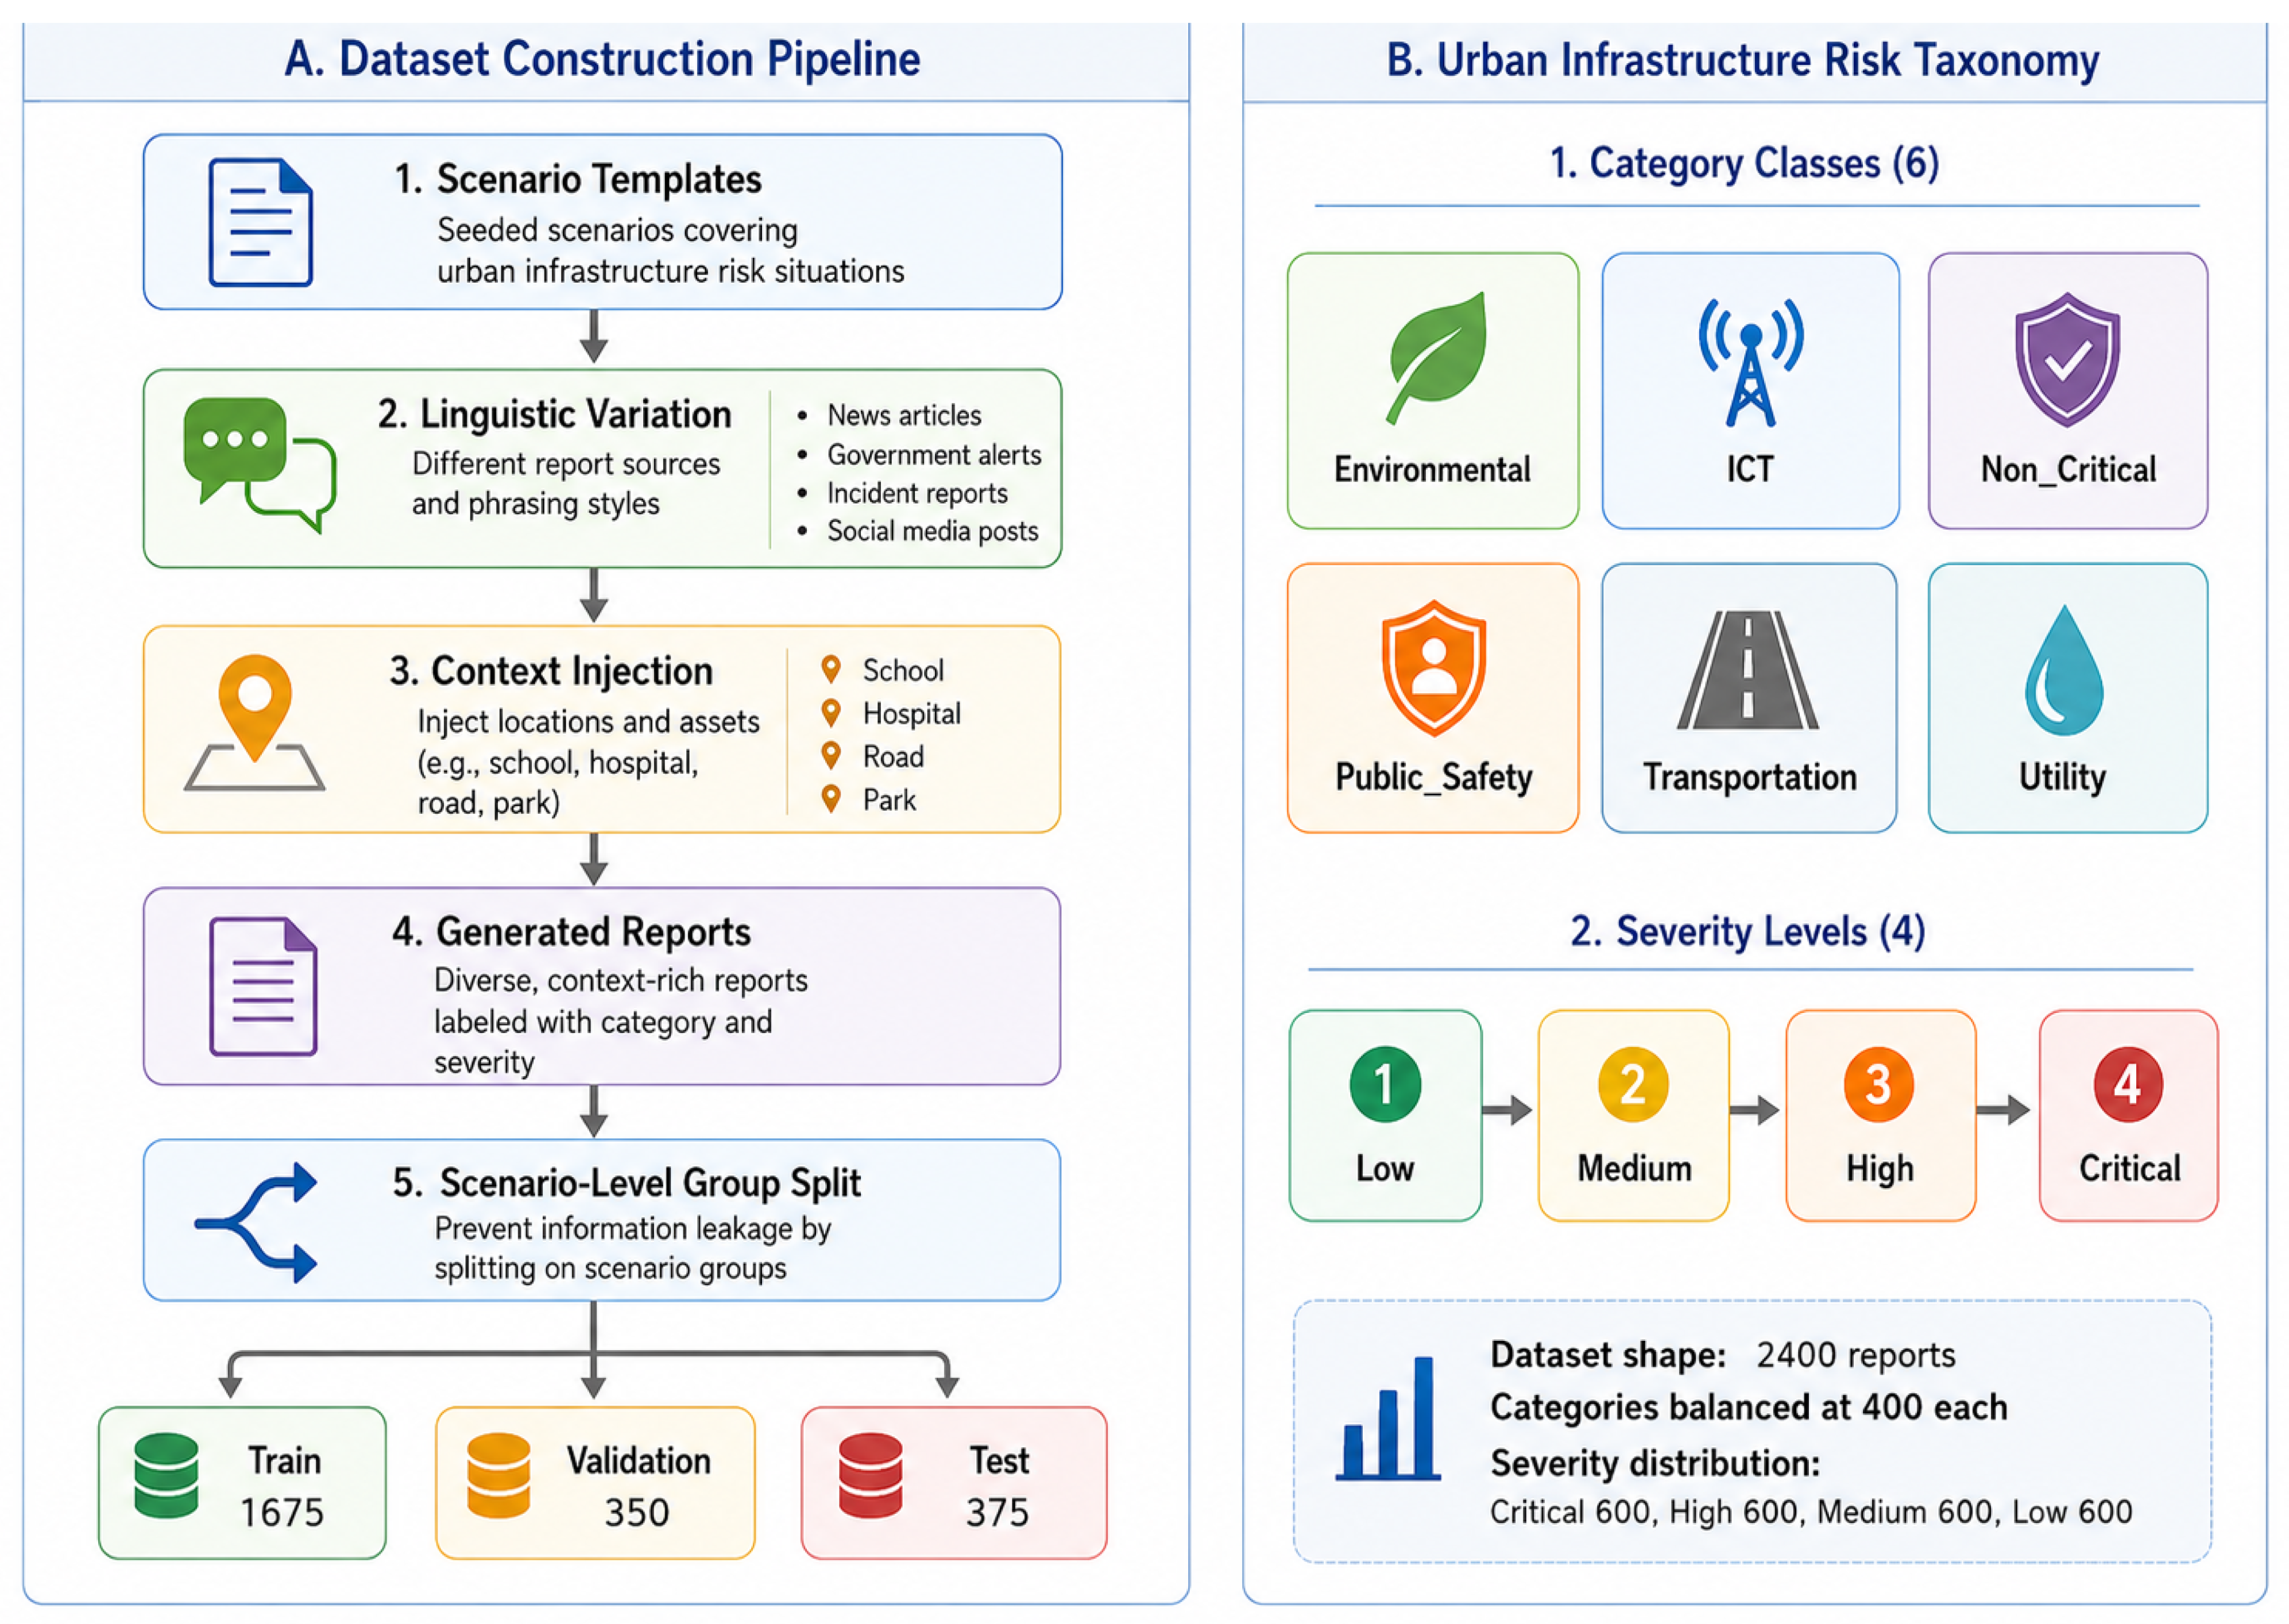
UIR-Text is a semi-synthetic dataset designed to simulate urban infrastructure risk reports. The dataset was constructed to reflect common reporting sources, including citizen reports, inspection notes, maintenance logs, emergency platform entries, and smart city service tickets. Each record includes a report identifier, text, category label, severity label, and scenario identifier. The scenario identifier is used to perform group-based splitting and reduce information leakage.
The dataset contains 2400 reports, with 400 reports for each of six categories and 600 reports for each of four severity levels. A scenario-level split produces 1675 training reports, 350 validation reports, and 375 test reports. The design intentionally avoids the same underlying scenario appearing in more than one split.
Table 1 summarizes the main statistics of the UIR-Text dataset, including the number of reports in each split, the number of categories, the number of severity levels, and the scenario-leakage status.
Figure 1 summarizes the structure of the UIR-Text dataset, including the number of reports, risk categories, severity levels, scenario identifiers, and predefined train/validation/test split. To support reproducibility, the UIR-Text dataset is publicly released together with the predefined train, validation, and test splits, scenario identifiers, category labels, severity labels, dictionary files, and experimental code. The dataset and code are available on Zenodo at DOI:
https://doi.org/10.5281/zenodo.21306134. Providing the fixed scenario-level splits is important because the benchmark is designed to avoid direct scenario leakage between training and testing. The public release enables independent replication of the reported results and supports future comparison with alternative classifiers, transformer baselines, and robustness settings.
4.2. Dataset Realism, Dictionary Overlap, and Generation Bias Considerations
UIR-Text was developed as a controlled, semi-synthetic benchmark to facilitate the study of urban infrastructure risk classification under scenario-level splitting. The dataset incorporates representative reporting sources, such as citizen reports, inspection notes, service logs, emergency platform entries, and smart city service tickets. Nevertheless, due to its semi-synthetic nature, UIR-Text may not fully capture the linguistic, operational, and contextual complexities inherent in actual municipal reporting systems.
A specific validity threat concerns the relationship between the dataset generation process and the dictionary-based features used in RAFE-XAI. The scenario templates used to generate UIR-Text include infrastructure-related vocabulary such as risk triggers, assets, and location expressions. The feature-augmentation stage also uses manually defined dictionaries for risk keywords, infrastructure assets, and location indicators. Therefore, there is partial vocabulary overlap between the generation templates and the dictionary-based feature extractors. This overlap is intentional in the sense that the dictionaries were designed to represent the same urban infrastructure domain; however, it may inflate benchmark performance because models can exploit repeated vocabulary patterns introduced during dataset construction.
Multiple potential sources of generation bias must be considered when interpreting the results. First, semi-synthetic reports may exhibit more uniform language features compared to authentic citizen-generated reports, which frequently include spelling variations, dialectal expressions, abbreviations, incomplete descriptions, and mixed-language content. Second, the balanced category and severity distributions in UIR-Text facilitate controlled model comparisons but may not accurately represent distributions in real municipal systems, where routine, low-severity reports typically predominate over critical incidents. Third, the scenario-template construction process may introduce repeated associations among specific keywords, assets, locations, categories, and severity labels. Fourth, because the same domain vocabulary informs both dataset construction and dictionary-based feature extraction, dictionary indicators should be interpreted as benchmark-specific diagnostic cues rather than as evidence of robust generalization to real-world data.
Consequently, the experimental results should be regarded as benchmark-level evidence specific to UIR-Text, rather than as confirmation of deployment-ready performance on actual municipal reports. External validation using real infrastructure work orders, 311-style service requests, emergency service logs, or smart city incident reports is necessary to evaluate generalizability in real-world environments.
4.3. Risk Category Taxonomy
The category taxonomy includes six classes: Environmental, ICT, Non-Critical, Public Safety, Transportation, and Utility. Environmental reports include flooding, landslides, soil erosion, tree damage, and pollution. ICT reports include sensor, camera, fiber, monitoring, and communication failures. Non-Critical reports include routine maintenance, scheduling inquiries, and administrative service requests. Public Safety reports include exposed cables, falling signs, leaning poles, unsafe barriers, and fire hazards. Transportation reports include road cracks, bridge defects, lane obstructions, traffic-signal issues, and surface damage. Utility reports include water leakage, power outages, sewage overflow, drainage failure, and gas smell.
4.4. Severity Taxonomy
The severity taxonomy includes Low, Medium, High, and Critical. Low reports describe minor defects or routine issues with minimal safety or service impact. Medium reports describe localized service disruption or moderate inconvenience. High reports describe major service disruption, safety risk, or infrastructure damage. Critical reports describe immediate danger, emergency access disruption, major failure, or risk to critical assets. For operational decision support, the severity labels are also converted into a binary critical-risk variable, where High and Critical are treated as priority cases.
7. Results and Discussion
7.1. Overall Results
Table 2 summarizes the experimental results on UIR-Text. After adding the fine-tuned transformer baseline, fine-tuned DistilBERT achieves the strongest predictive performance across all three tasks. For binary critical-risk detection, DistilBERT achieves Accuracy 0.9120, Macro-F1 0.9120, Weighted-F1 0.9118, and MCC 0.8382. For category classification, DistilBERT achieves Accuracy 0.8667, Macro-F1 0.8278, Weighted-F1 0.8711, and MCC 0.8415. For four-level severity classification, DistilBERT also obtains the highest result, with Accuracy 0.3467, Macro-F1 0.3379, Weighted-F1 0.3284, and MCC 0.2026.
Among the explainable feature-engineering models, RAFE-XAI RF remains the strongest model for category classification, achieving Accuracy 0.8400, Macro-F1 0.8043, Weighted-F1 0.8444, and MCC 0.8062. RAFE-XAI RF is also the strongest explainable feature-engineering model for four-level severity classification, with Macro-F1 0.2676. These results indicate that end-to-end transformer fine-tuning provides the highest predictive accuracy, whereas RAFE-XAI offers a more interpretable retrieval-augmented feature representation that exposes retrieved evidence, neighbor label distributions, and domain cues.
Bootstrap confidence intervals indicate that the reported improvements should be interpreted with caution. In category classification, RAFE-XAI RF achieves the highest point estimate; however, its confidence intervals overlap with those of RAFE-XAI LR and Sentence-BERT + LR. Consequently, the observed improvement represents a positive trend in UIR-Text rather than definitive statistical superiority. The performance gap between retrieval-augmentedfeature models and lexical baselines remains more pronounced. In binary critical-risk detection, Sentence-BERT + LR demonstrates the strongest performance, but its confidence interval overlaps with that of TF-IDF + LR, suggesting that both direct semantic and lexical cues contribute to binary prioritization. For four-level severity classification, all confidence intervals correspond to low Macro-F1 and MCC values, indicating that fine-grained severity prediction remains weak under the current text-only setting.
Table 2 summarizes the experimental results on UIR-Text.
To further assess the reliability of the reported results,
Table 3 presents bootstrap 95% confidence intervals for selected models on the UIR-Text test set.
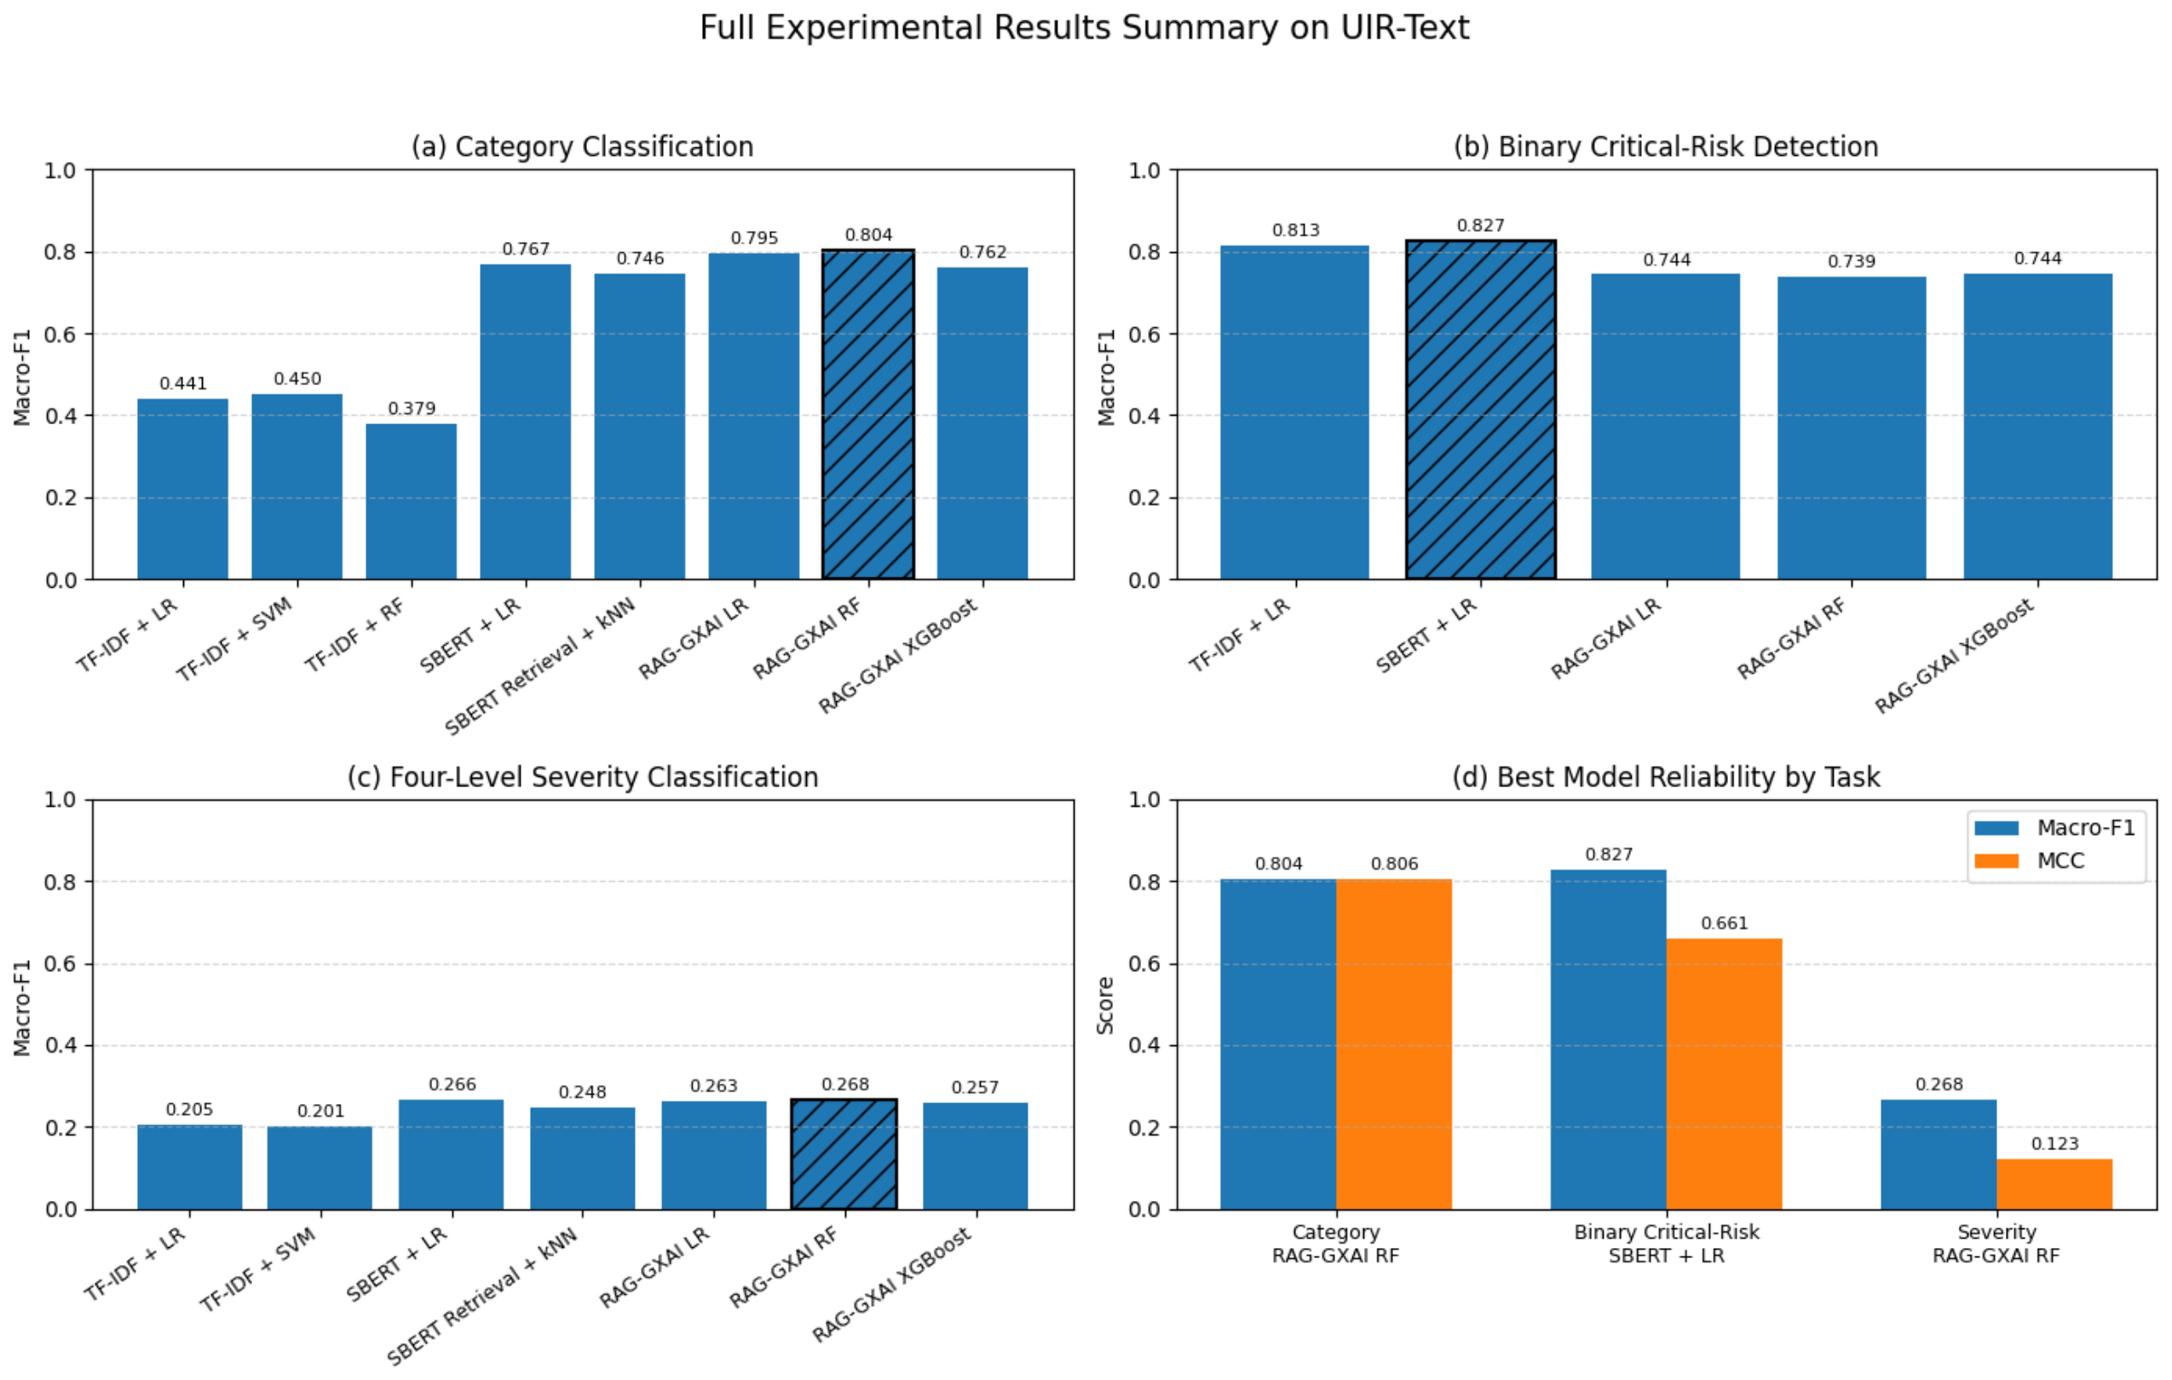
Figure 4 provides a visual summary of the main experimental findings across the three prediction tasks. The figure highlights that retrieval-augmented features augmentation is most effective for category classification, direct semantic embedding is strongest for binary critical-risk detection, and four-level severity classification remains the most challenging task.
7.2. Risk Category Classification
Fine-tuned DistilBERT achieves the strongest category classification performance, with Macro-F1 0.8278 and MCC 0.8415. Among the explainable feature-engineering models, RAFE-XAI RF achieves the strongest category result, with Accuracy 0.8400, Macro-F1 0.8043, Weighted-F1 0.8444, and MCC 0.8062. Compared with Sentence-BERT + LR, RAFE-XAI RF improves Macro-F1 from 0.7669 to 0.8043, indicating that retrieved-neighbor label distributions and domain cues improve feature-based classification. However, the stronger DistilBERT result shows that task-specific transformer fine-tuning can better adapt contextual representations to the UIR-Text benchmark.
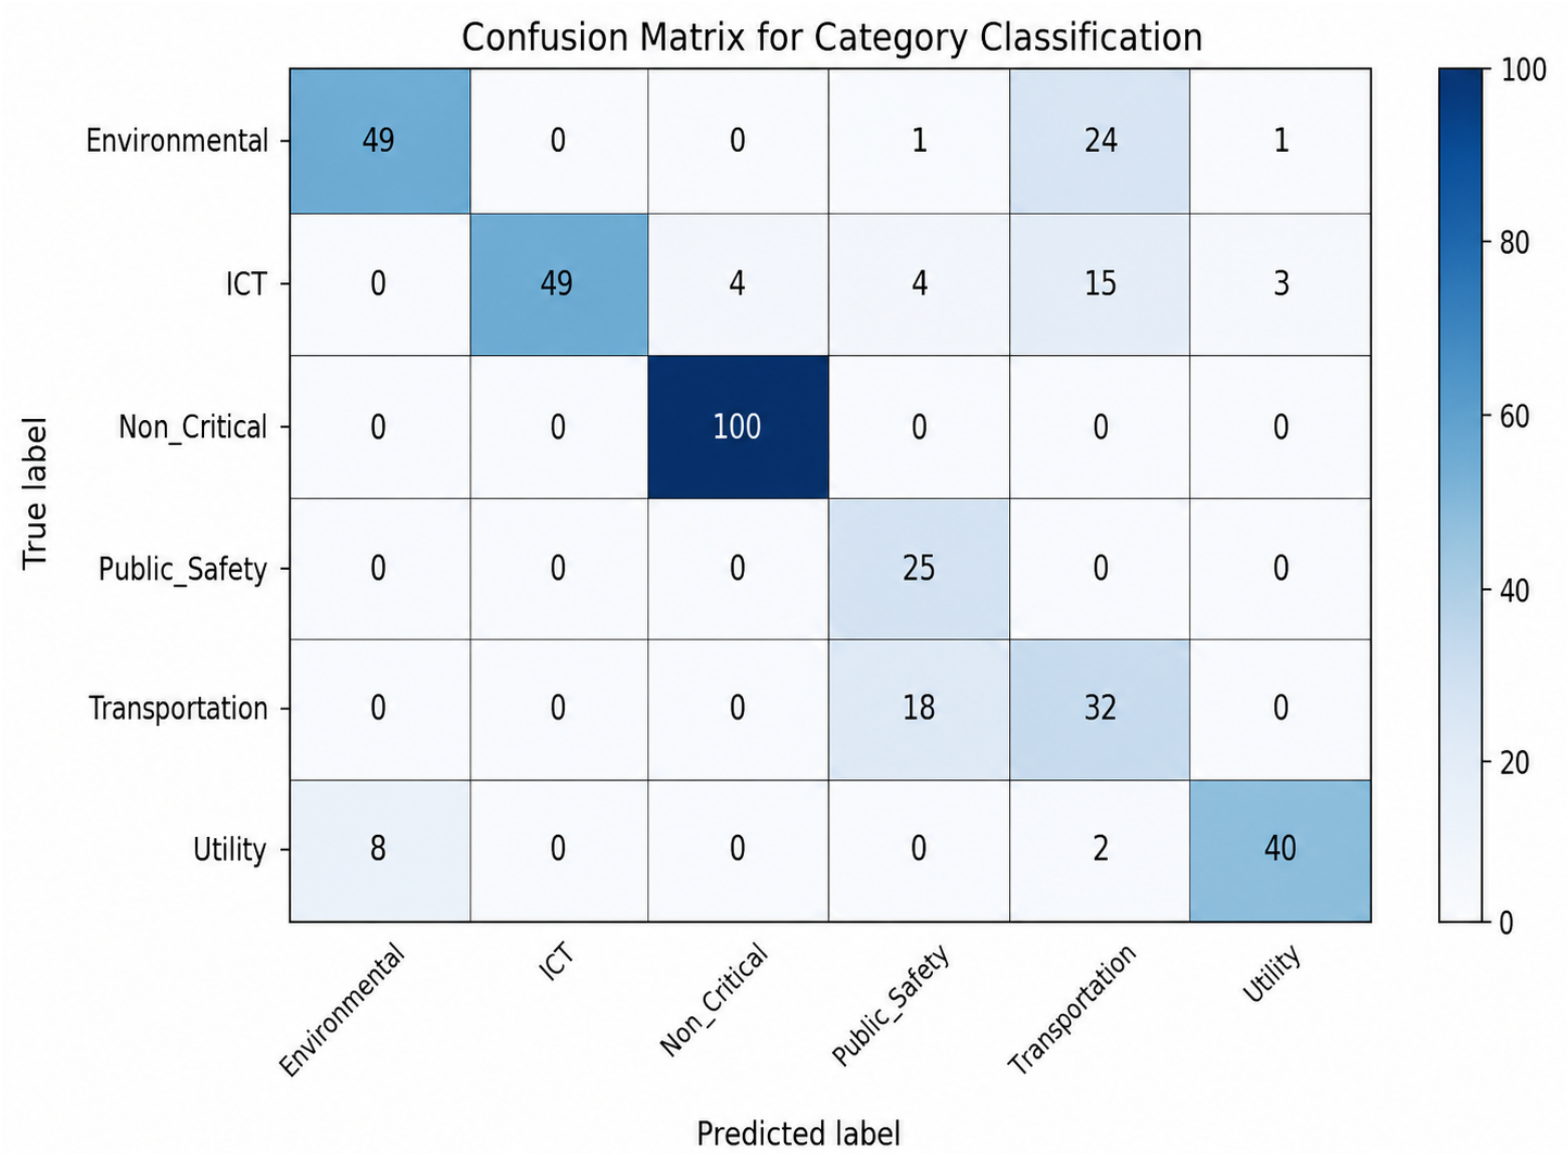
The category confusion matrix in
Figure 5 reveals that Non-Critical reports are classified very accurately. Some confusion occurs between Environmental and Transportation reports, especially when environmental incidents involve roads, flooding, or drainage around transportation assets. ICT reports are sometimes confused with Transportation when sensors or cameras are embedded in road infrastructure. This supports the need for models that distinguish affected assets from underlying risk categories.
7.3. Binary Critical-Risk Detection and Task-Specific Ablation
The binary critical-risk detection task shows a different performance pattern from the infrastructure category classification task. As reported in
Table 2, the full RAFE-XAI variants do not provide the best performance for binary critical-risk prediction. Sentence-BERT with Logistic Regression achieves a strong Macro-F1 of 0.8267 and MCC of 0.6607, while the full RAFE-XAI variants achieve lower Macro-F1 scores of 0.7435, 0.7386, and 0.7490 for Logistic Regression, Random Forest, and XGBoost, respectively. This indicates that retrieval-augmented feature engineering is not uniformly beneficial across all prediction tasks.
To better understand this behavior, a task-specific fine-grained ablation study was conducted for binary critical-risk detection. The ablation isolates the effects of retrieved-neighbor category distributions, retrieved-neighbor severity distributions, keyword indicators, asset indicators, location indicators, combined dictionary indicators, and the full RAFE-XAI representation. The results are reported in
Table 4.
The ablation results provide a clearer explanation for the weaker binary critical-risk performance of the full RAFE-XAI variants. Sentence-BERT only with Logistic Regression achieves a strong Macro-F1 of 0.8267. Adding the retrieved-neighbor category distributions yields a similar result, with Macro-F1 of 0.8238. However, adding retrieved-neighbor severity distributions substantially reduces Macro-F1 to 0.7572, and combining neighbor category and severity distributions also remains weak, with Macro-F1 at 0.7597. This suggests that retrieved reports may share similar infrastructure topics while differing in urgency level, which can introduce noisy severity evidence for binary priority detection.
The dictionary-based indicators show mixed behavior. Location indicators improve the binary result slightly over Sentence-BERT only, achieving the best Macro-F1 of 0.8347 and MCC of 0.6751. In contrast, keyword indicators, asset indicators, and the combined keyword–asset–location block reduce performance. This suggests that isolated contextual cues may help in some cases, but combining all dictionary-based indicators can introduce redundant or task-irrelevant signals for binary critical-risk prediction.
Overall, these findings indicate that the full retrieval-augmented feature representation is better suited to infrastructure category classification than to binary critical-risk detection. Binary priority detection appears to depend mainly on direct severity-indicative textual cues and selected lightweight contextual indicators, rather than on the full combination of retrieved-neighbor distributions and domain dictionaries. Therefore, the revised framework treats binary critical-risk detection as a separate decision task, for which Sentence-BERT with selected lightweight indicators, or Sentence-BERT alone, is more appropriate than the full RAFE-XAI representation.
7.4. Four-Level Severity Classification
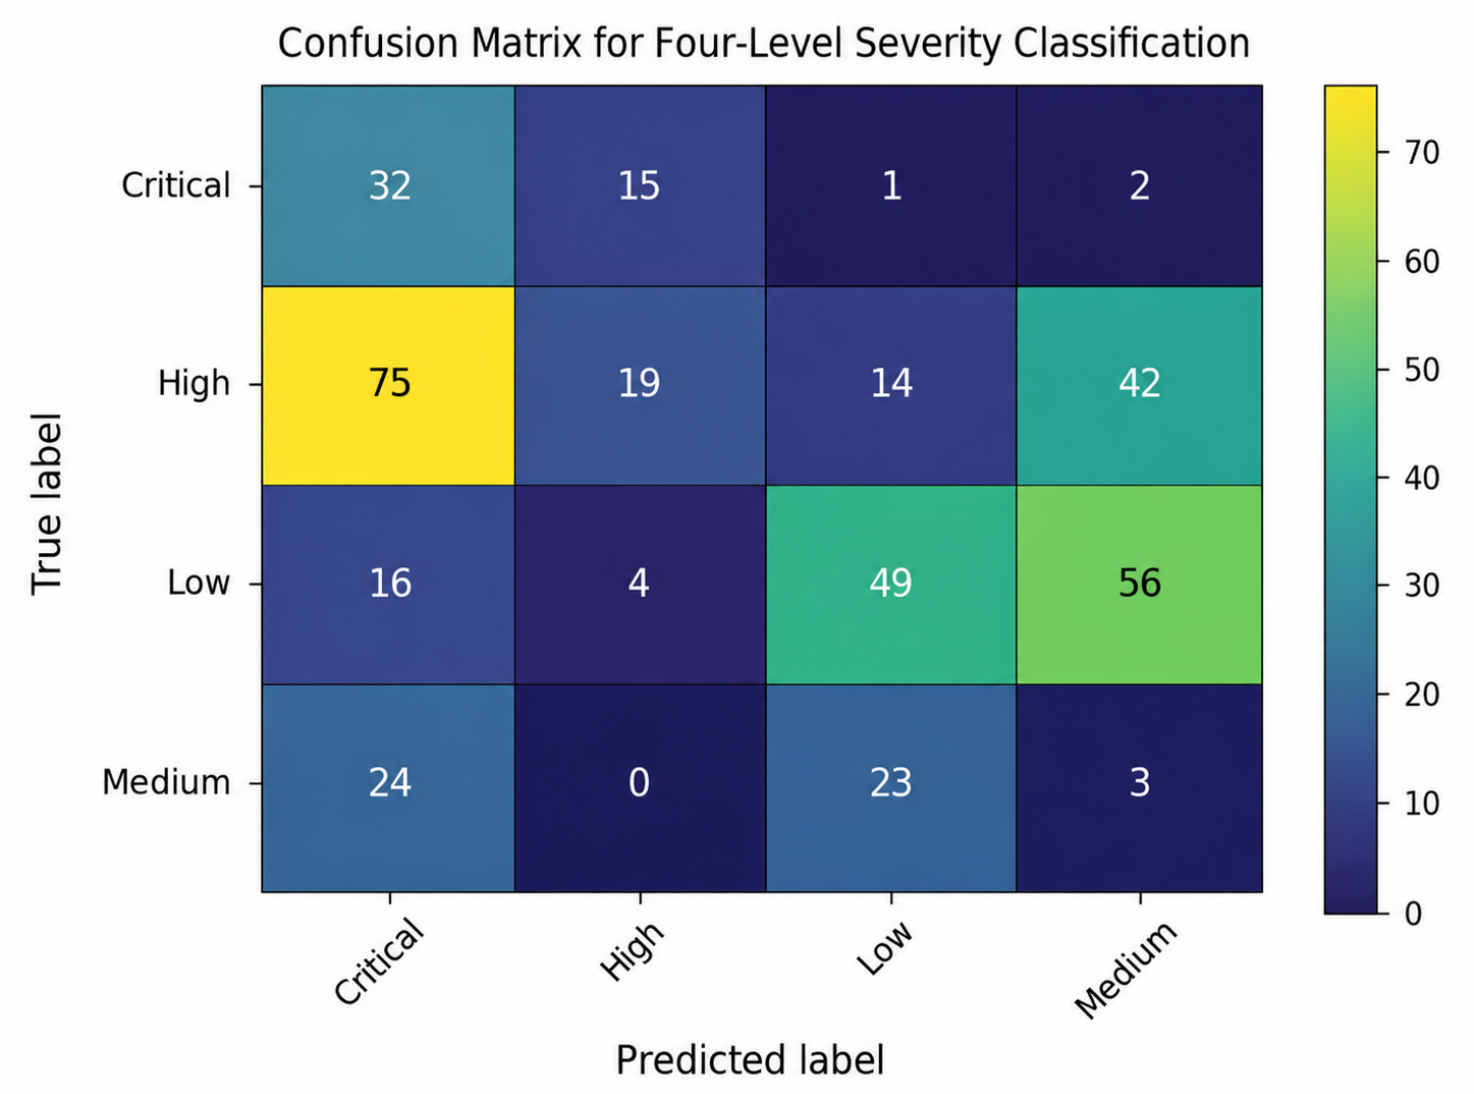
Four-level severity classification is the most difficult task. Fine-tuned DistilBERT achieves the strongest severity result, with Accuracy 0.3467, Macro-F1 0.3379, Weighted-F1 0.3284, and MCC 0.2026. Among the explainable feature-engineering models, RAFE-XAI RF achieves the best severity result, with Macro-F1 0.2676. Although DistilBERT improves severity prediction, the absolute Macro-F1 remains low, confirming that fine-grained severity classification is weakly separable from text-only evidence. The confusion matrix in
Figure 6 shows substantial confusion among High, Medium, and Critical labels. This demonstrates that severity requires richer impact-aware variables, such as asset criticality, affected population, disruption duration, emergency access, and proximity to critical facilities.
7.5. Noisy-Text Robustness
The noisy-text robustness experiment evaluates category classification performance when only the held-out test reports are corrupted, while the training data remain clean. This setting simulates practical reporting noise in citizen reports, inspection notes, service tickets, and informal smart city inputs. Three controlled noise operations are applied to the test reports using a fixed random seed: random token deletion with probability 0.10, adjacent-character swaps inside words with probability 0.10, and punctuation deletion with probability 0.30. These operations simulate missing words, spelling errors, typographical mistakes, and informal punctuation.
Table 5 reports the noisy-text robustness results. TF-IDF + LR performs weakest, with Macro-F1 0.4379, confirming that lexical matching is sensitive to spelling variation, token deletion, and punctuation loss. In contrast, Sentence-BERT-based models are substantially more robust because dense semantic embeddings preserve sentence-level meaning under moderate textual corruption.
Sentence-BERT + LR achieves the highest Accuracy, Weighted-F1, and MCC, with Accuracy 0.7813, Weighted-F1 0.7822, and MCC 0.7360. RAFE-XAI RF achieves the highest Macro-F1, with 0.7351, indicating that retrieval-augmented feature engineering remains competitive under noisy input conditions. Sentence-BERT Retrieval + kNN also performs strongly, with Macro-F1 0.7320. These results show that semantic representation and retrieval-based evidence are more robust than sparse lexical features in noisy smart city reporting scenarios.
Among the RAFE-XAI variants, Random Forest is the most robust, followed by Logistic Regression and XGBoost. The results suggest that retrieval-neighbor distributions and domain cues can support robustness, but they do not fully eliminate the effect of corrupted text. This is expected because dictionary-based keyword, asset, and location indicators may be affected by spelling errors or token deletion. Overall, the noisy-text experiment indicates that RAFE-XAI provides a robust explainable feature-engineering alternative, while dense semantic representations remain central for handling noisy urban infrastructure reports.
7.6. Low-Resource Results and Severity Instability Analysis
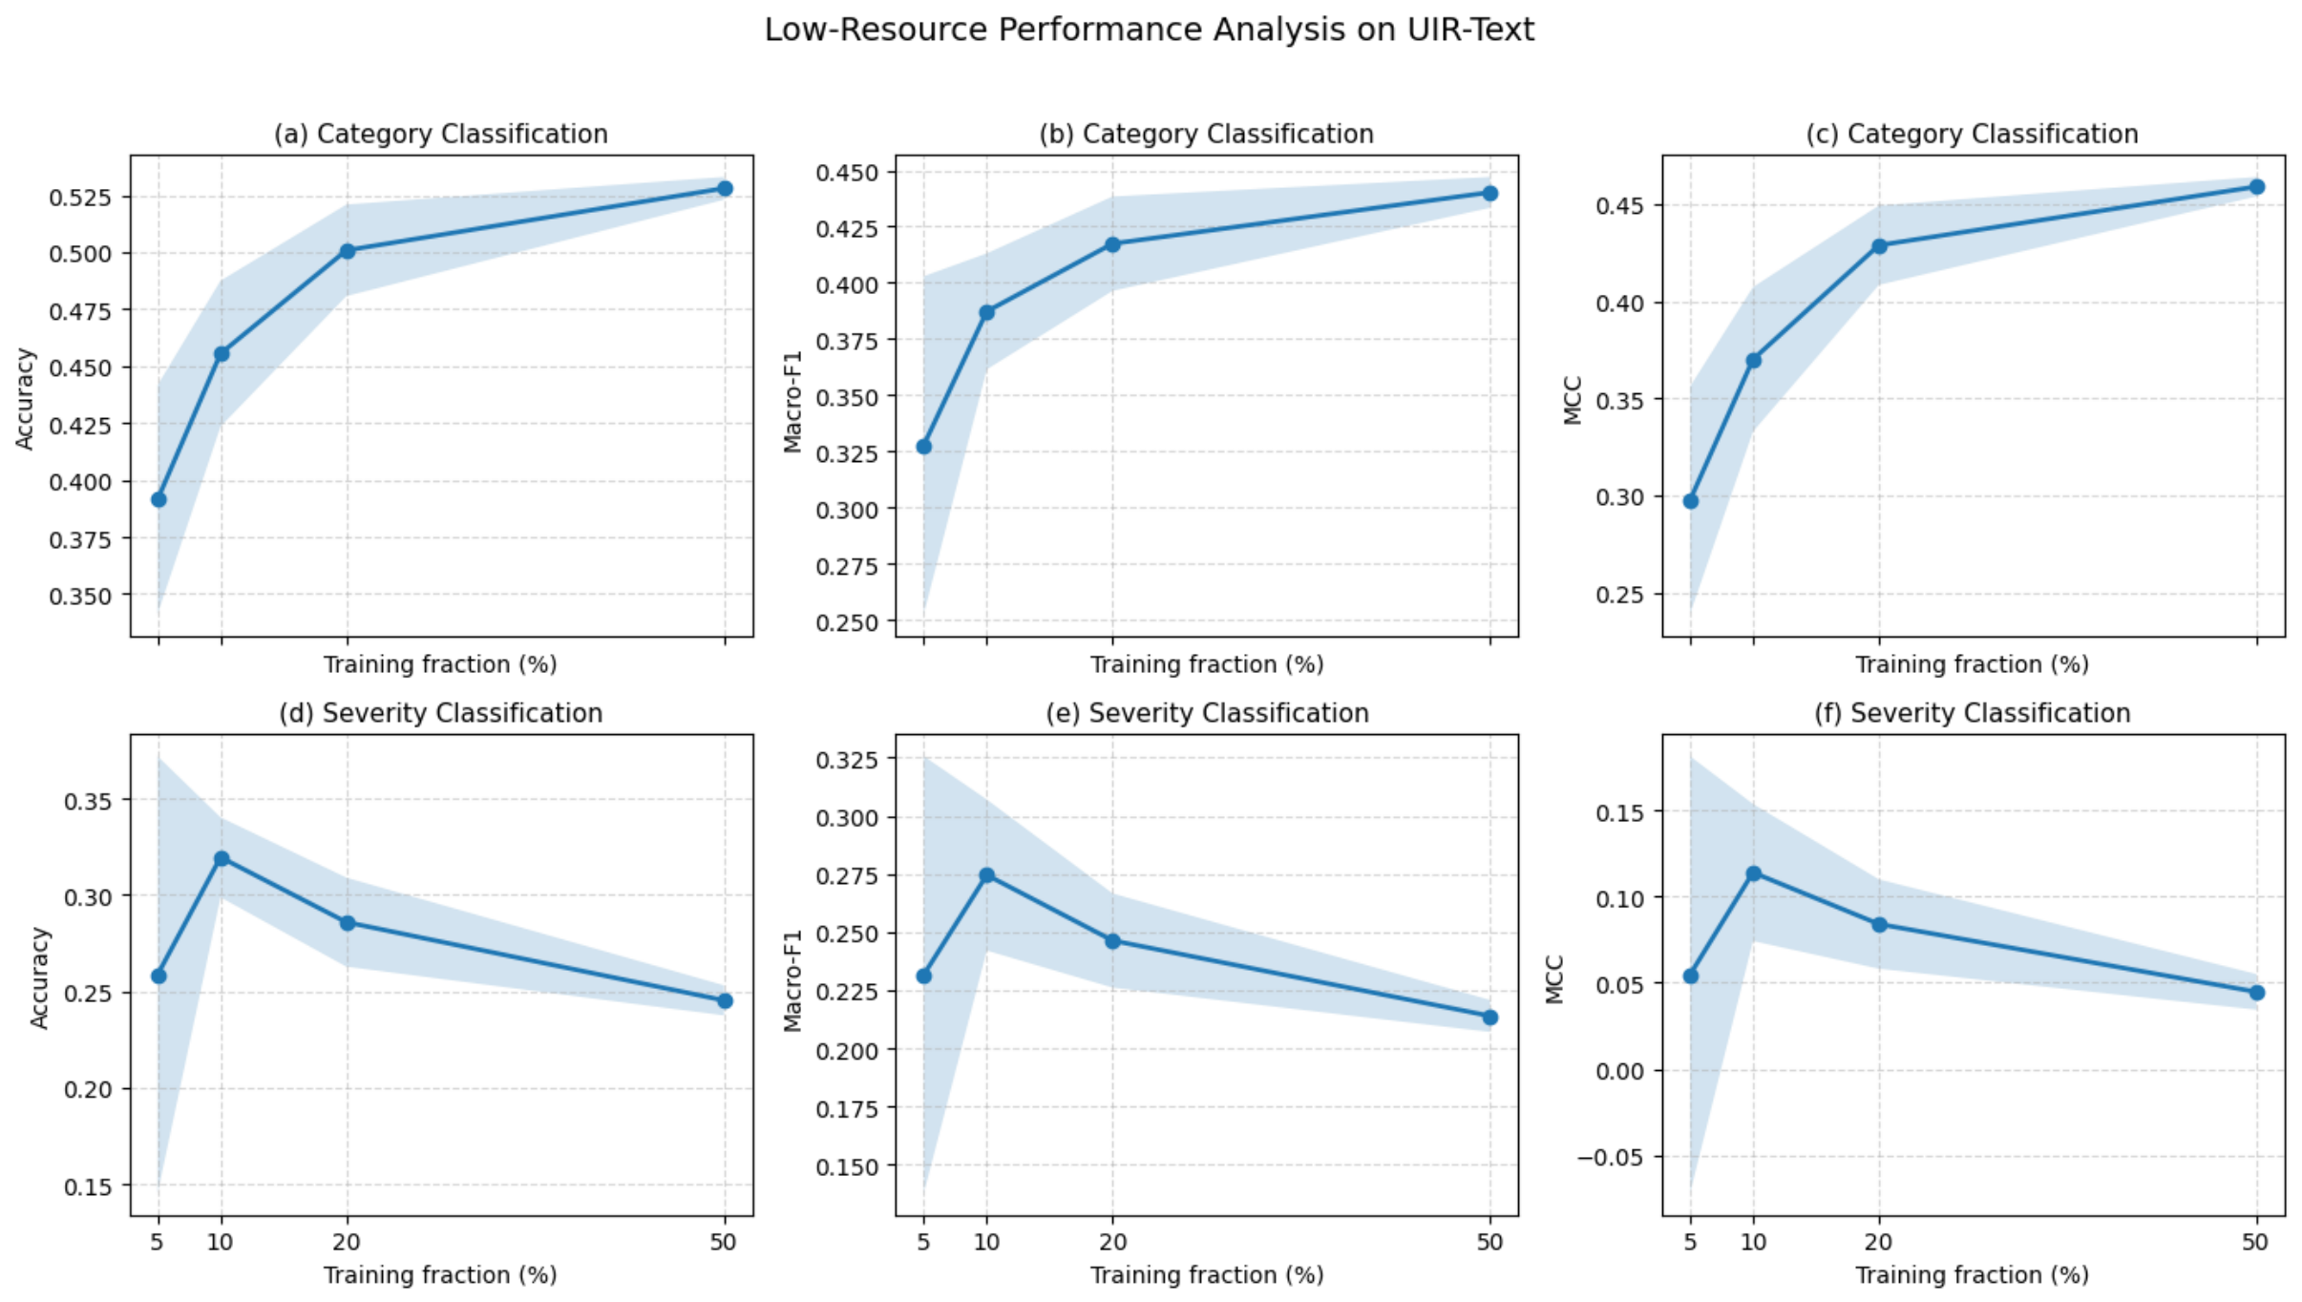
Figure 7 presents a six-panel low-resource analysis using Accuracy, Macro-F1, and MCC for both category and four-level severity classification. For category classification, all three metrics improve consistently as the training fraction increases, with Macro-F1 rising from 0.3278 at 5% training data to 0.4402 at 50%. MCC also increases from 0.2976 to 0.4589, indicating improved classification reliability as more labeled reports become available.
In contrast, four-level severity classification shows an unstable pattern. Severity Macro-F1 reaches its highest value at the 10% setting and then decreases as the training fraction increases from 10% to 50%. This behavior suggests that severity prediction is not simply a low-data problem. Instead, the severity labels are weakly separable using text-only features. Unlike category labels, which are often associated with explicit infrastructure terms such as road, bridge, sensor, cable, drain, outage, or flood, severity labels depend on impact-related factors that are not fully represented in the report text.
The decrease in severity Macro-F1 as more training scenarios are added can be explained by the scenario-level split and the nature of the severity labels. As the training fraction increases, the model is exposed to a wider range of scenario templates and linguistic variants. However, these additional samples may introduce heterogeneous wording for Medium, High, and Critical cases without adding the impact variables required to distinguish them reliably. Consequently, the classifier may learn broader but less discriminative severity boundaries, especially when similar textual descriptions correspond to different severity levels across scenarios.
This interpretation is consistent with the severity confusion matrix in
Figure 6, which shows substantial confusion among Medium, High, and Critical reports. These classes frequently share similar risk vocabulary, such as flooding, outage, leakage, cable exposure, or structural damage, but differ in operational impact. For example, a power outage, road crack, or drainage overflow may be labeled Medium, High, or Critical depending on affected population, service disruption duration, proximity to sensitive facilities, emergency access, and asset criticality. Such variables are not explicitly encoded in the current text-only benchmark.
Therefore, the low-resource experiment indicates that category classification benefits from additional labeled text, whereas severity classification requires richer impact-aware features. Future work should incorporate structured operational variables, such as affected population, asset criticality, disruption duration, service dependency, emergency access, and distance to critical facilities, to improve fine-grained severity estimation.
8. Ablation Study and Component Contribution Analysis
To address the individual contribution of each retrieval-augmented feature group, a fine-grained component ablation was conducted for the category classification task. The ablation was performed using Random Forest as the fixed classifier because the full RAFE-XAI representation with Random Forest achieved the strongest category classification performance in the main experiment. This design isolates the effect of each feature group while avoiding variation caused by changing the classifier.
The ablation includes two complementary settings. First, individual feature groups are added to the Sentence-BERT representation to assess whether each component improves the semantic baseline. Second, leave-one-component-out experiments are performed by removing one feature group at a time from the full RAFE-XAI representation. The evaluated components include retrieved-neighbor category distributions, retrieved-neighbor severity distributions, risk keyword indicators, infrastructure asset indicators, and location indicators. The results are presented in
Table 6.
The ablation results show that the full RAFE-XAI representation achieves the best category classification performance, with Accuracy 0.8400, Macro-F1 0.8043, Weighted-F1 0.8444, and MCC 0.8062. Compared with Sentence-BERT only with Random Forest, which obtains Macro-F1 0.7465, the full representation improves Macro-F1 by 0.0578. This confirms that the performance gain is not caused by the classifier alone, but by the combined retrieval-augmented feature representation.
The leave-one-component-out results provide clearer evidence of the contribution of each feature group. Removing the retrieved-neighbor category distribution causes the largest decrease in Macro-F1, from 0.8043 to 0.7602. This indicates that the category distribution of semantically similar reports is one of the most important components for infrastructure category classification. Removing asset indicators also causes a large decrease in Macro-F1, from 0.8043 to 0.7636, showing that infrastructure asset cues provide strong domain-specific evidence. Removing location indicators produces a smaller but still noticeable decrease, from 0.8043 to 0.7964. Removing retrieved-neighbor severity distributions results in a modest decrease, from 0.8043 to 0.7988. In contrast, removing keyword indicators has almost no effect, with Macro-F1 changing only from 0.8043 to 0.8039.
The single-component addition results show that individual feature groups alone are not sufficient to reproduce the full model performance. For example, adding neighbor category distributions to Sentence-BERT improves Macro-F1 slightly from 0.7465 to 0.7523, and adding asset indicators improves Macro-F1 to 0.7510. However, no individual feature group approaches the full RAFE-XAI result. This suggests that the main benefit of RAFE-XAI arises from the interaction among semantic embeddings, retrieved-neighbor category evidence, infrastructure asset cues, location indicators, and auxiliary severity information.
Overall, the component ablation indicates that RAFE-XAI improves category classification primarily through the combined use of semantic representations, retrieved-neighbor category distributions, and infrastructure asset indicators. The keyword indicators contribute little in this setting, while severity and location features provide secondary supporting information. These findings clarify the role of each component and show that the full retrieval-augmented feature representation is most effective for infrastructure category classification.
8.1. Retrieval-Size Sensitivity Analysis
Table 7 reports the sensitivity of RAFE-XAI RF to the retrieval size
k for category classification. The analysis was conducted using a self-neighbor-excluded training retrieval protocol to avoid each training instance retrieving itself when constructing neighbor label-distribution features. The results show that performance improves from
to
, with Macro-F1 increasing from 0.7393 to 0.7683. Performance then decreases slightly for
and
, suggesting that retrieving too many neighbors may introduce less relevant reports and weaken the discriminative value of the neighbor label distributions.
The best result is obtained at , with Accuracy 0.8080, Macro-F1 0.7683, Weighted-F1 0.8126, and MCC 0.7689. This supports the use of as a balanced retrieval size. Smaller values such as may be too narrow and sensitive to individual nearest neighbors, whereas larger values such as or may dilute the local neighborhood signal by including semantically weaker evidence.
8.2. Feature Importance
The The native XGBoost importance analysis shows that retrieved-neighbor category distributions are among the most important category features. Neighbor category signals for Utility, Non-Critical, ICT, Public Safety, Environmental, and Transportation appear at the top of the importance list. Domain features such as exposed cable, fire, flooding, water-system cues, road assets, and ICT-system cues are also important. For severity, retrieved-neighbor severity features are important, but the resulting performance is weak, suggesting that neighbor severity signals are noisy.
8.3. Explainability Case Analysis
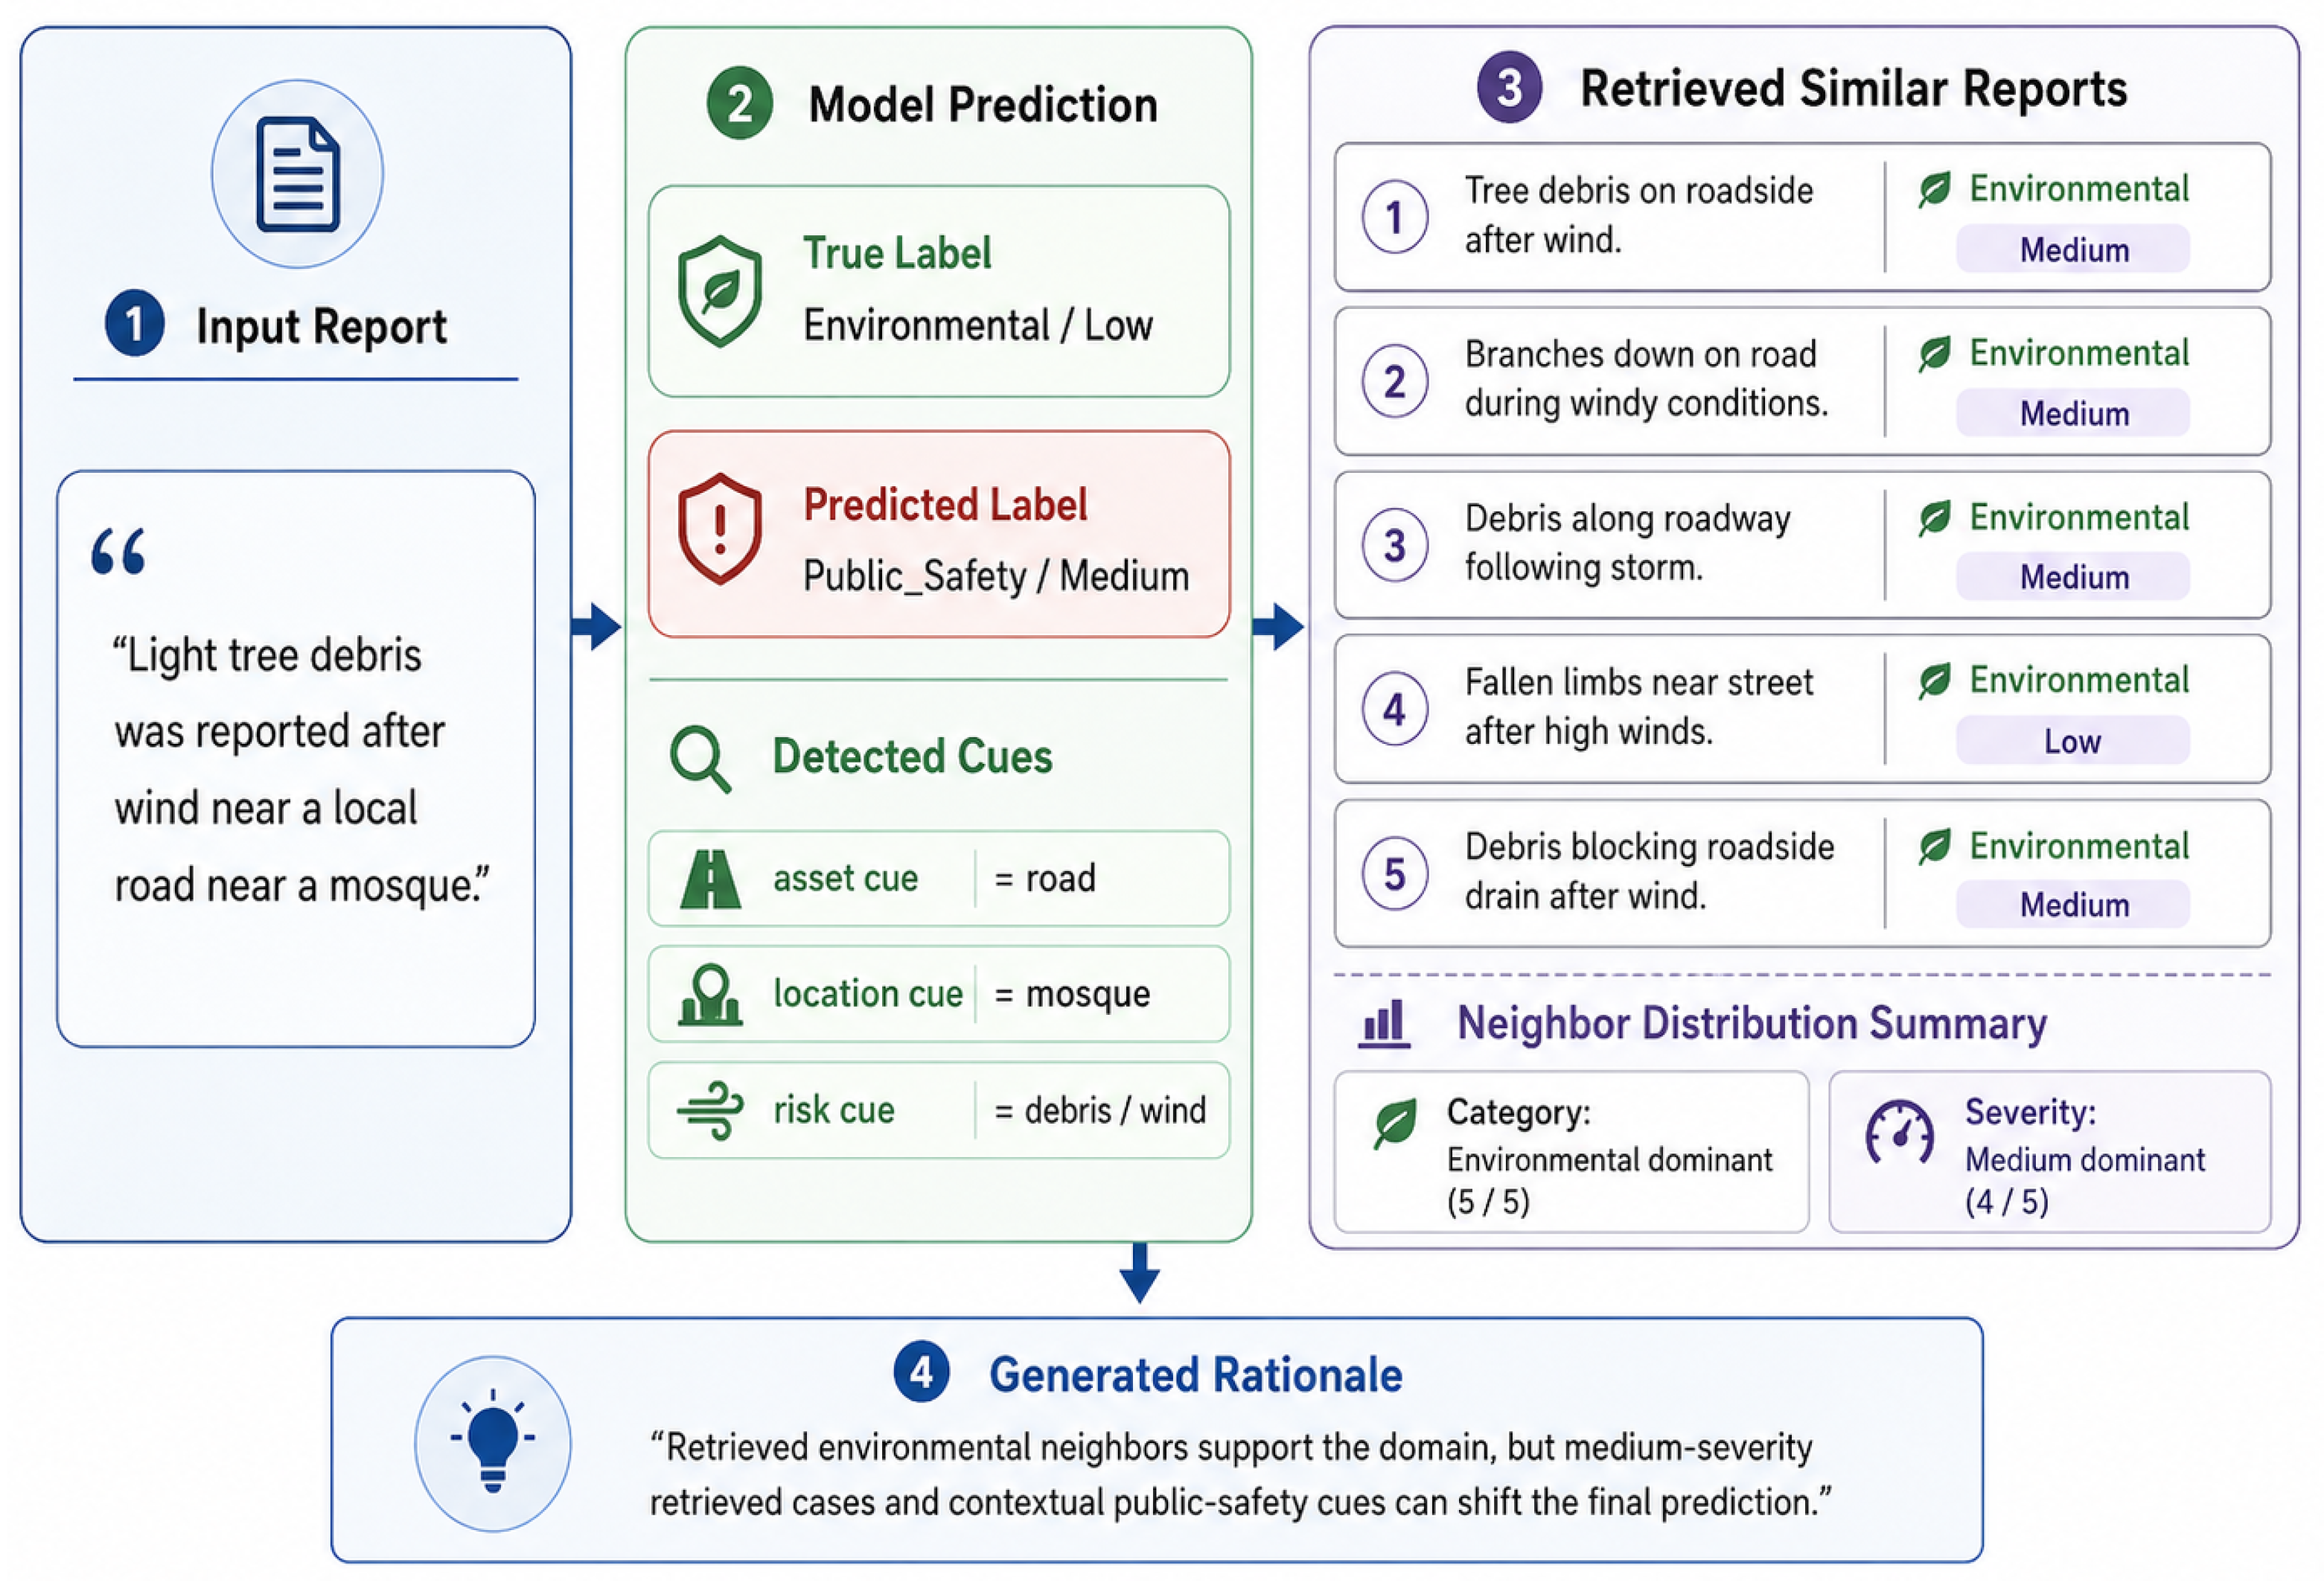
Figure 8 shows an example of evidence-based explanation. The report describes light tree debris after wind near a local road. The true label is Environmental/Low, but the model predicts Public Safety/Medium. The retrieved neighbors are mostly Environmental, but their severity labels are mostly Medium. The explanation reveals why the category and severity decisions may diverge: retrieval supports the environmental domain, whereas severity-related neighbor distributions and public safety cues can shift predictions.
The explainability analysis highlights two strengths. First, RAFE-XAI provides evidence rather than only labels. Second, explanations reveal model limitations, such as overly broad keyword extraction or noisy severity transfer from neighbors. This diagnostic function is valuable for improving future versions of the dataset and model.
8.4. SHAP-Based Feature Group Attribution
To avoid relying on native XGBoost split-count or gain-based feature importance, which can be biased in high-dimensional concatenated feature spaces, we conducted a SHAP-based feature group attribution analysis for RAFE-XAI XGBoost on category classification. SHAP values were computed on the held-out test set and then aggregated into the main RAFE-XAI feature groups: Sentence-BERT embeddings, retrieved-neighbor category distributions, retrieved-neighbor severity distributions, risk keyword indicators, infrastructure asset indicators, and location indicators.
Table 8 reports the resulting group-level attribution scores. The retrieved-neighbor category distribution has the largest normalized importance, accounting for 0.8557 of the total SHAP attribution. Sentence-BERT embeddings contribute 0.1406, while infrastructure asset indicators and risk keyword indicators contribute smaller values of 0.0022 and 0.0015, respectively. Retrieved-neighbor severity distributions and location indicators receive negligible attribution in this XGBoost category model.
These results indicate that, for category classification, XGBoost relies primarily on the category distribution of semantically retrieved reports. This finding is consistent with the component ablation results, where removing the retrieved-neighbor category distribution caused a substantial decrease in Macro-F1. The SHAP analysis therefore provides a more reliable interpretation than native The native XGBoost importance and supports the conclusion that retrieval-neighbor category evidence is the most influential feature group for the RAFE-XAI XGBoost category classifier.
10. Limitations and Future Work
This study has several limitations. First, UIR-Text is a single semi-synthetic benchmark. Although scenario-level splitting mitigates direct scenario leakage, the dataset may still exhibit generation-related regularities due to scenario templates, controlled linguistic variation, balanced class distributions, and predefined relationships among keywords, infrastructure assets, locations, categories, and severity labels. In addition, the manually defined risk keyword, asset, and location dictionaries partially overlap with the domain vocabulary used during scenario-template generation. This overlap may inflate the apparent usefulness of dictionary-based indicators because the model may exploit repeated benchmark-specific vocabulary patterns rather than real-world linguistic variation. Therefore, the results should be regarded as benchmark-level evidence specific to UIR-Text rather than confirmation of deployment-ready performance.
Second, RAFE-XAI implements retrieval-augmented feature engineering rather than an explicit relational learning architecture. Future work may investigate explicit graph-based or relational neural models, but such models are outside the scope of the current study. Third, four-level severity classification remains weak because severity depends on impact-aware variables that are not explicitly represented in the current text-only benchmark. Future datasets should include affected population, service disruption duration, asset criticality, emergency access, and proximity to critical facilities. Fourth, the explanation module is deterministic and template-based. Future work should evaluate explanation faithfulness using complementary methods such as SHAP, counterfactual explanations, and influence-based analysis. Future work should also extend the framework to Arabic and multilingual urban reports, which is especially relevant for smart city deployment in Saudi Arabia and other Arabic-speaking contexts. Arabic text classification remains challenging in low-resource settings, and recent transformer-based Arabic NLP studies provide useful foundations [
46].
11. Conclusions
This paper proposed RAFE-XAI, a retrieval-augmented and explainable NLP framework with retrieval-augmented feature engineering for urban infrastructure risk classification. The framework combines Sentence-BERT embeddings, FAISS retrieval, retrieved-neighbor label distributions, domain-specific risk indicators, infrastructure asset cues, location indicators, and evidence-based explainability. We also introduced UIR-Text, a semi-synthetic benchmark dataset for urban infrastructure risk reports, featuring scenario-level no-leakage splitting.
The experimental results show that fine-tuned DistilBERT achieves the strongest predictive performance across the three evaluated tasks. It obtains Macro-F1 scores of 0.8278 for category classification, 0.9120 for binary critical-risk detection, and 0.3379 for four-level severity classification. Among the explainable feature-engineering models, RAFE-XAI RF achieves the strongest category classification result, with Macro-F1 0.8043 and MCC 0.8062. These findings indicate that fine-tuned transformers provide the highest predictive accuracy on UIR-Text, while RAFE-XAI provides a transparent retrieval-augmented feature-engineering alternative that exposes retrieved evidence, neighbor label distributions, and domain cues.
Overall, the findings suggest the potential of a hybrid smart city decision-support pipeline in which RAFE-XAI identifies the infrastructure domain and a semantic critical-risk detector supports prioritization. However, external validation on real municipal infrastructure reports is required before making broader claims about operational generalizability.