1. Introduction
With the rapid development of cloud computing [
1], the Internet of Things (IoT) [
2], artificial intelligence [
3], mobile communication [
4], and big data technologies [
5], massive computational tasks are continuously generated in modern network environments. Various intelligent applications, such as smart healthcare, intelligent transportation, industrial automation, online social platforms, and scientific data analysis, require increasingly high computing efficiency, storage capacity, and service quality. However, traditional local computing paradigms are often insufficient for processing large-scale and computation-intensive tasks due to their limited computing and storage resources. As a result, cloud computing has become an effective paradigm for providing scalable, flexible, and on-demand computing services. By employing virtualization technology and distributed resource management mechanisms, cloud computing platforms can dynamically allocate computing resources according to user requirements, thereby improving computational efficiency and reducing operational costs [
6,
7].
Among the key issues in cloud computing systems, cloud task scheduling is one of the most critical and challenging optimization problems. Its main purpose is to assign heterogeneous tasks to appropriate virtual machines or computing resources while optimizing multiple objectives, such as execution time, energy consumption, transmission cost, load balancing, and resource utilization. Nevertheless, due to the dynamic, nonlinear, and highly complex characteristics of cloud environments, cloud task scheduling is generally regarded as an NP-hard problem [
8]. As the number of tasks and virtual machines increases, the search space expands rapidly, making it difficult for traditional deterministic methods to obtain high-quality scheduling solutions within an acceptable computational time. Therefore, developing efficient and robust optimization algorithms for cloud task scheduling remains an important research topic.
Metaheuristic optimization algorithms have attracted extensive attention due to their strong global search capability, flexible problem adaptability, and limited dependence on mathematical properties of optimization problems. However, existing metaheuristic algorithms still face several common challenges, including insufficient population diversity, premature convergence, poor adaptability in high-dimensional search spaces, and difficulty in maintaining a proper balance between exploration and exploitation [
9,
10]. According to the No Free Lunch theorem, no single optimization algorithm can perform best for all optimization problems. Therefore, improving existing algorithms and designing more effective search mechanisms are still necessary for complex global optimization and practical engineering problems.
The Golden Sine Algorithm (GoldSA) is a metaheuristic optimization algorithm inspired by the golden ratio and the periodic characteristics of the sine function [
11]. Owing to its simple structure, few control parameters, and easy implementation, GoldSA has been applied to various optimization problems. However, the original GoldSA still has several limitations when dealing with high-dimensional and complex multimodal problems. First, the random initialization mechanism may lead to insufficient population diversity and uneven solution distribution. Second, the sine-guided position update mechanism mainly depends on the current best individual, which may cause population aggregation and increase the risk of premature convergence. Third, the original GoldSA lacks an adaptive mechanism to dynamically coordinate exploration and exploitation according to the population state. These limitations may reduce its optimization accuracy and robustness in complex search spaces.
To address the above limitations, this paper proposes a Multi-strategy Improved Golden Sine Optimization Algorithm (MIGoldSA) for global optimization and cloud task scheduling problems. It should be noted that the proposed method is not intended to introduce a completely new optimization paradigm, but to refine the search behavior of the original GoldSA through three targeted modifications. These modifications are designed from different aspects of the optimization process, including population initialization, elite-guided evolution, and adaptive search resource allocation.
First, an adaptive chaotic opposition initialization strategy is incorporated into GoldSA. This strategy combines the ergodicity of chaotic mapping with the search-space expansion capability of opposition-based learning. Since both chaotic initialization and opposition-based learning have been widely used in metaheuristic optimization, the contribution of this strategy lies mainly in their adaptive integration into the initialization stage of GoldSA. Its purpose is to improve the distribution quality of the initial population and provide more diverse candidate solutions before the iterative search begins.
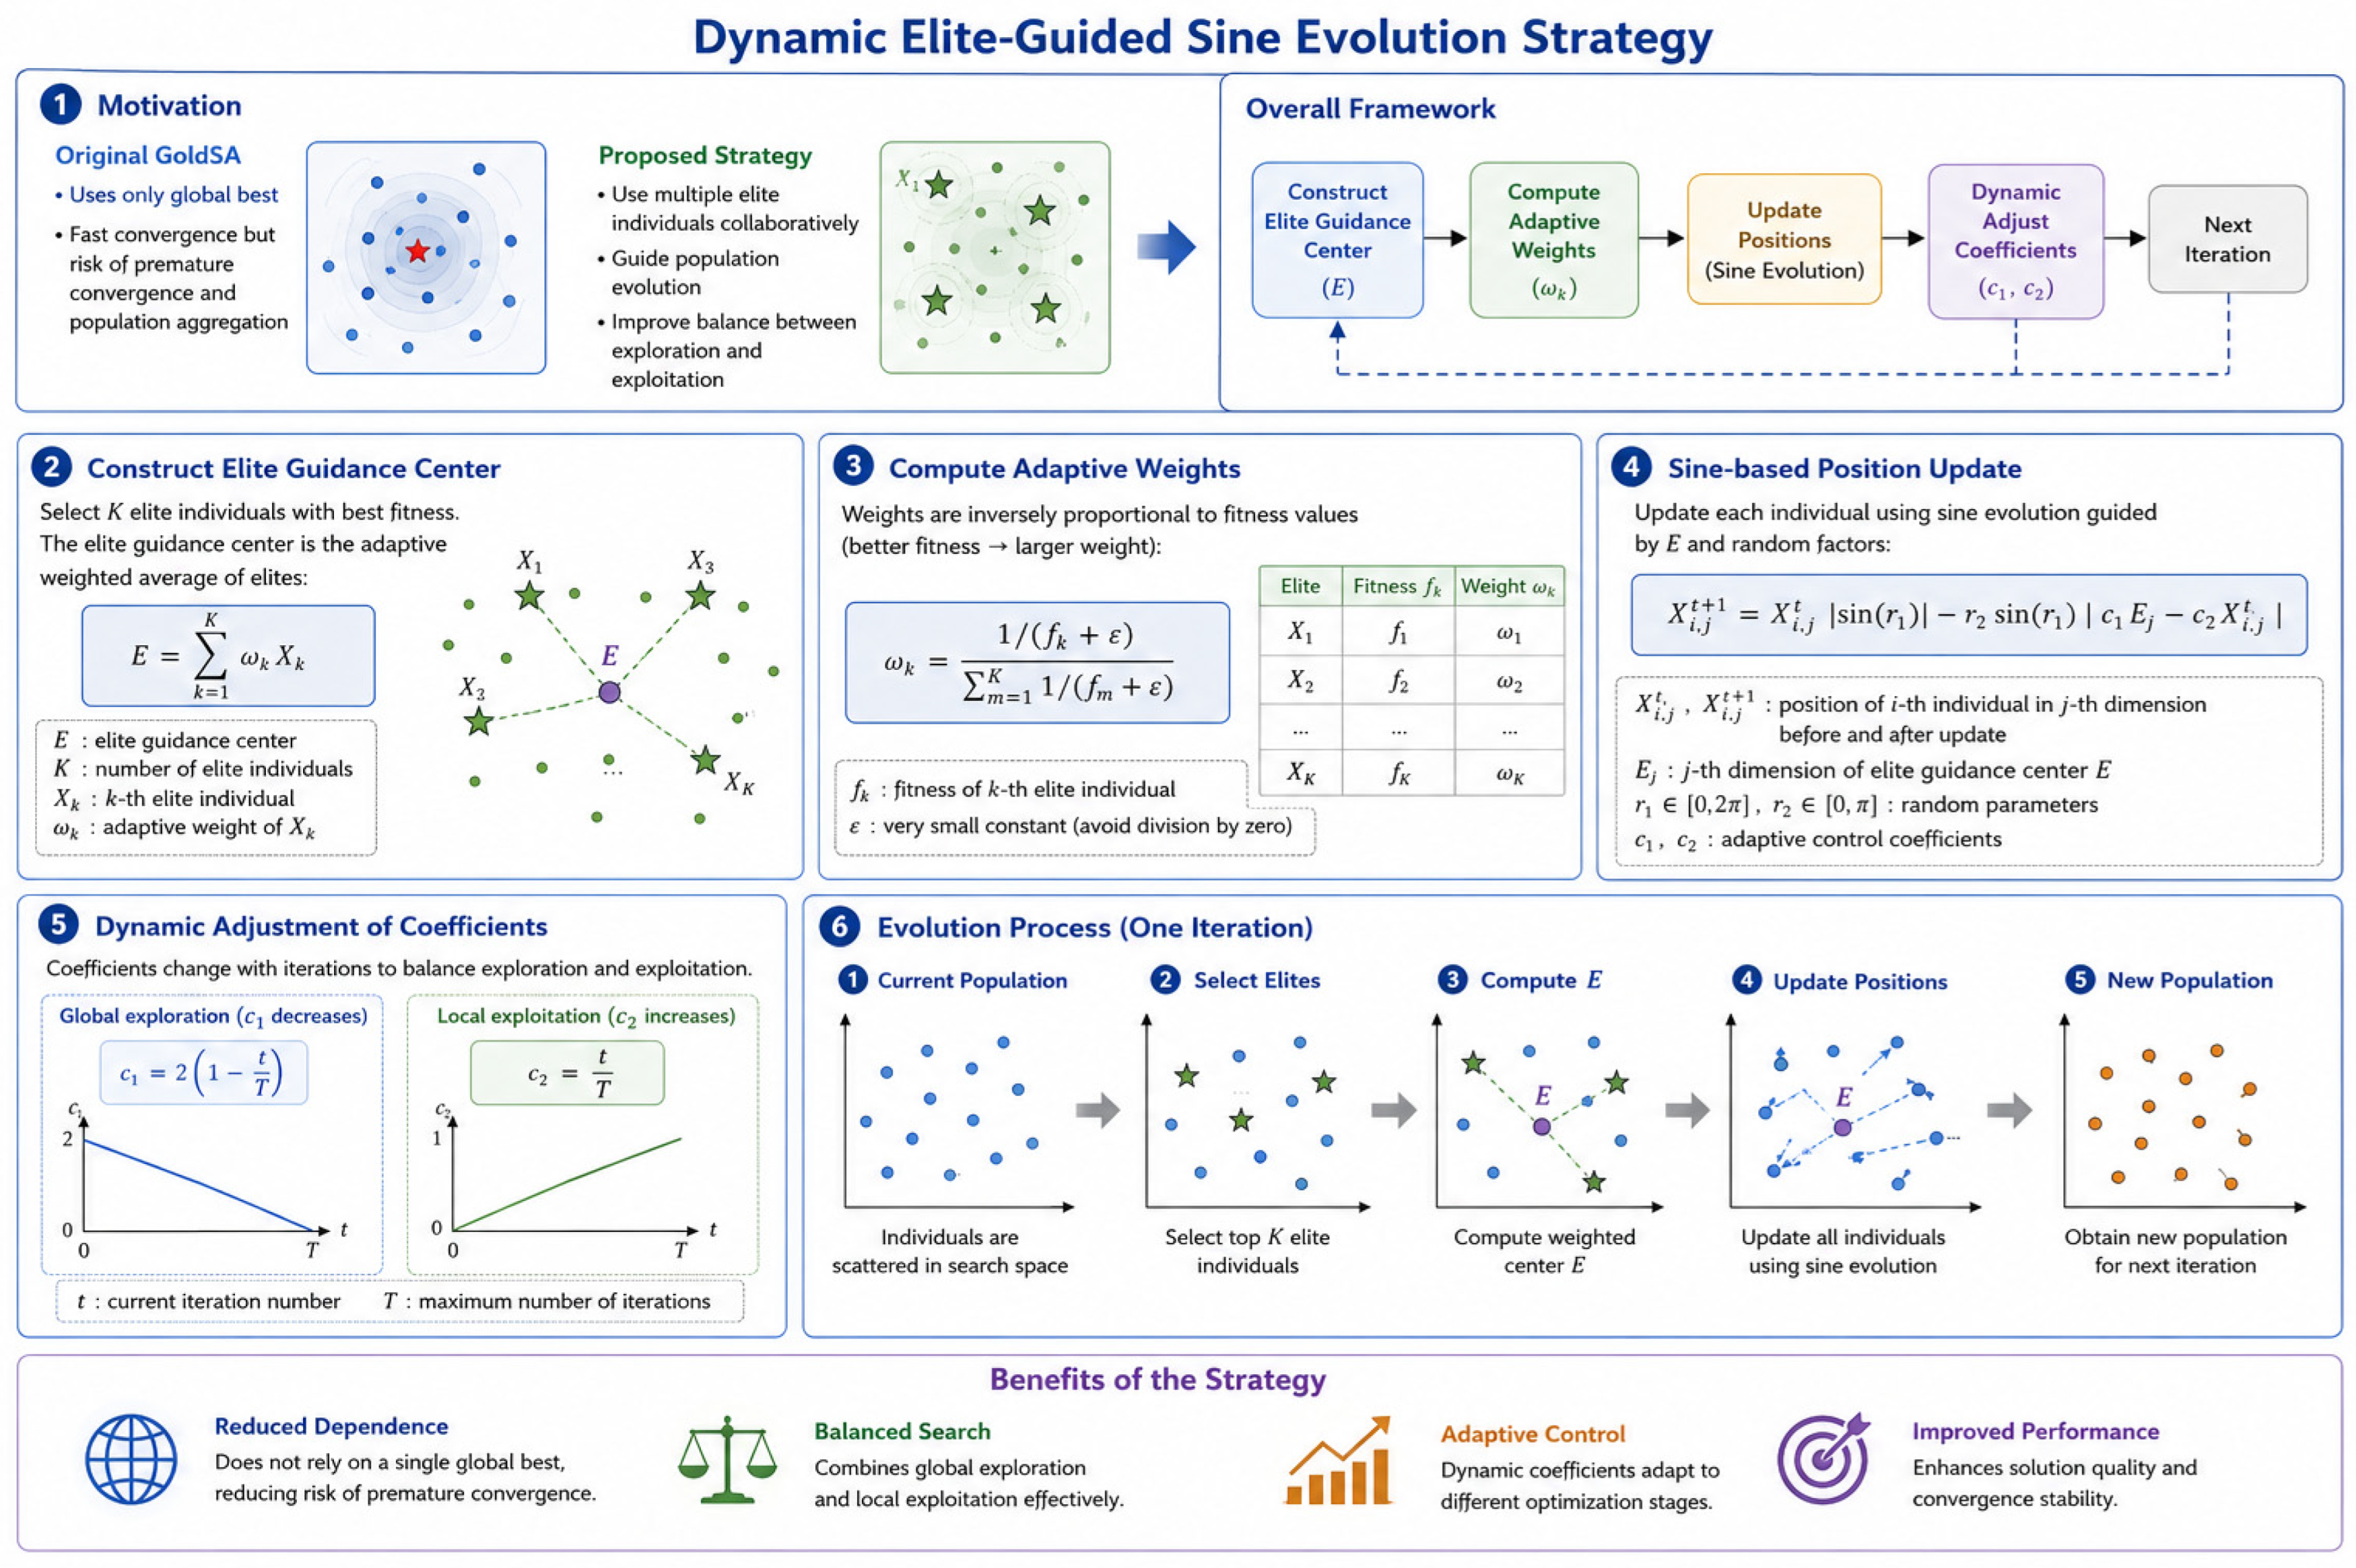
Second, a dynamic elite-guided sine evolution strategy is designed to modify the original sine-based position updating mechanism of GoldSA. Different from the original GoldSA, which mainly relies on the current best solution as the search target, this strategy constructs a weighted elite guidance center using multiple high-quality individuals. In addition, two time-varying coefficients are introduced to adjust the influence of elite guidance and individual historical positions during different search stages. Therefore, this strategy represents a mechanism-level modification of the GoldSA updating rule, aiming to reduce the dependence on a single best individual and improve the coordination between exploration and exploitation.
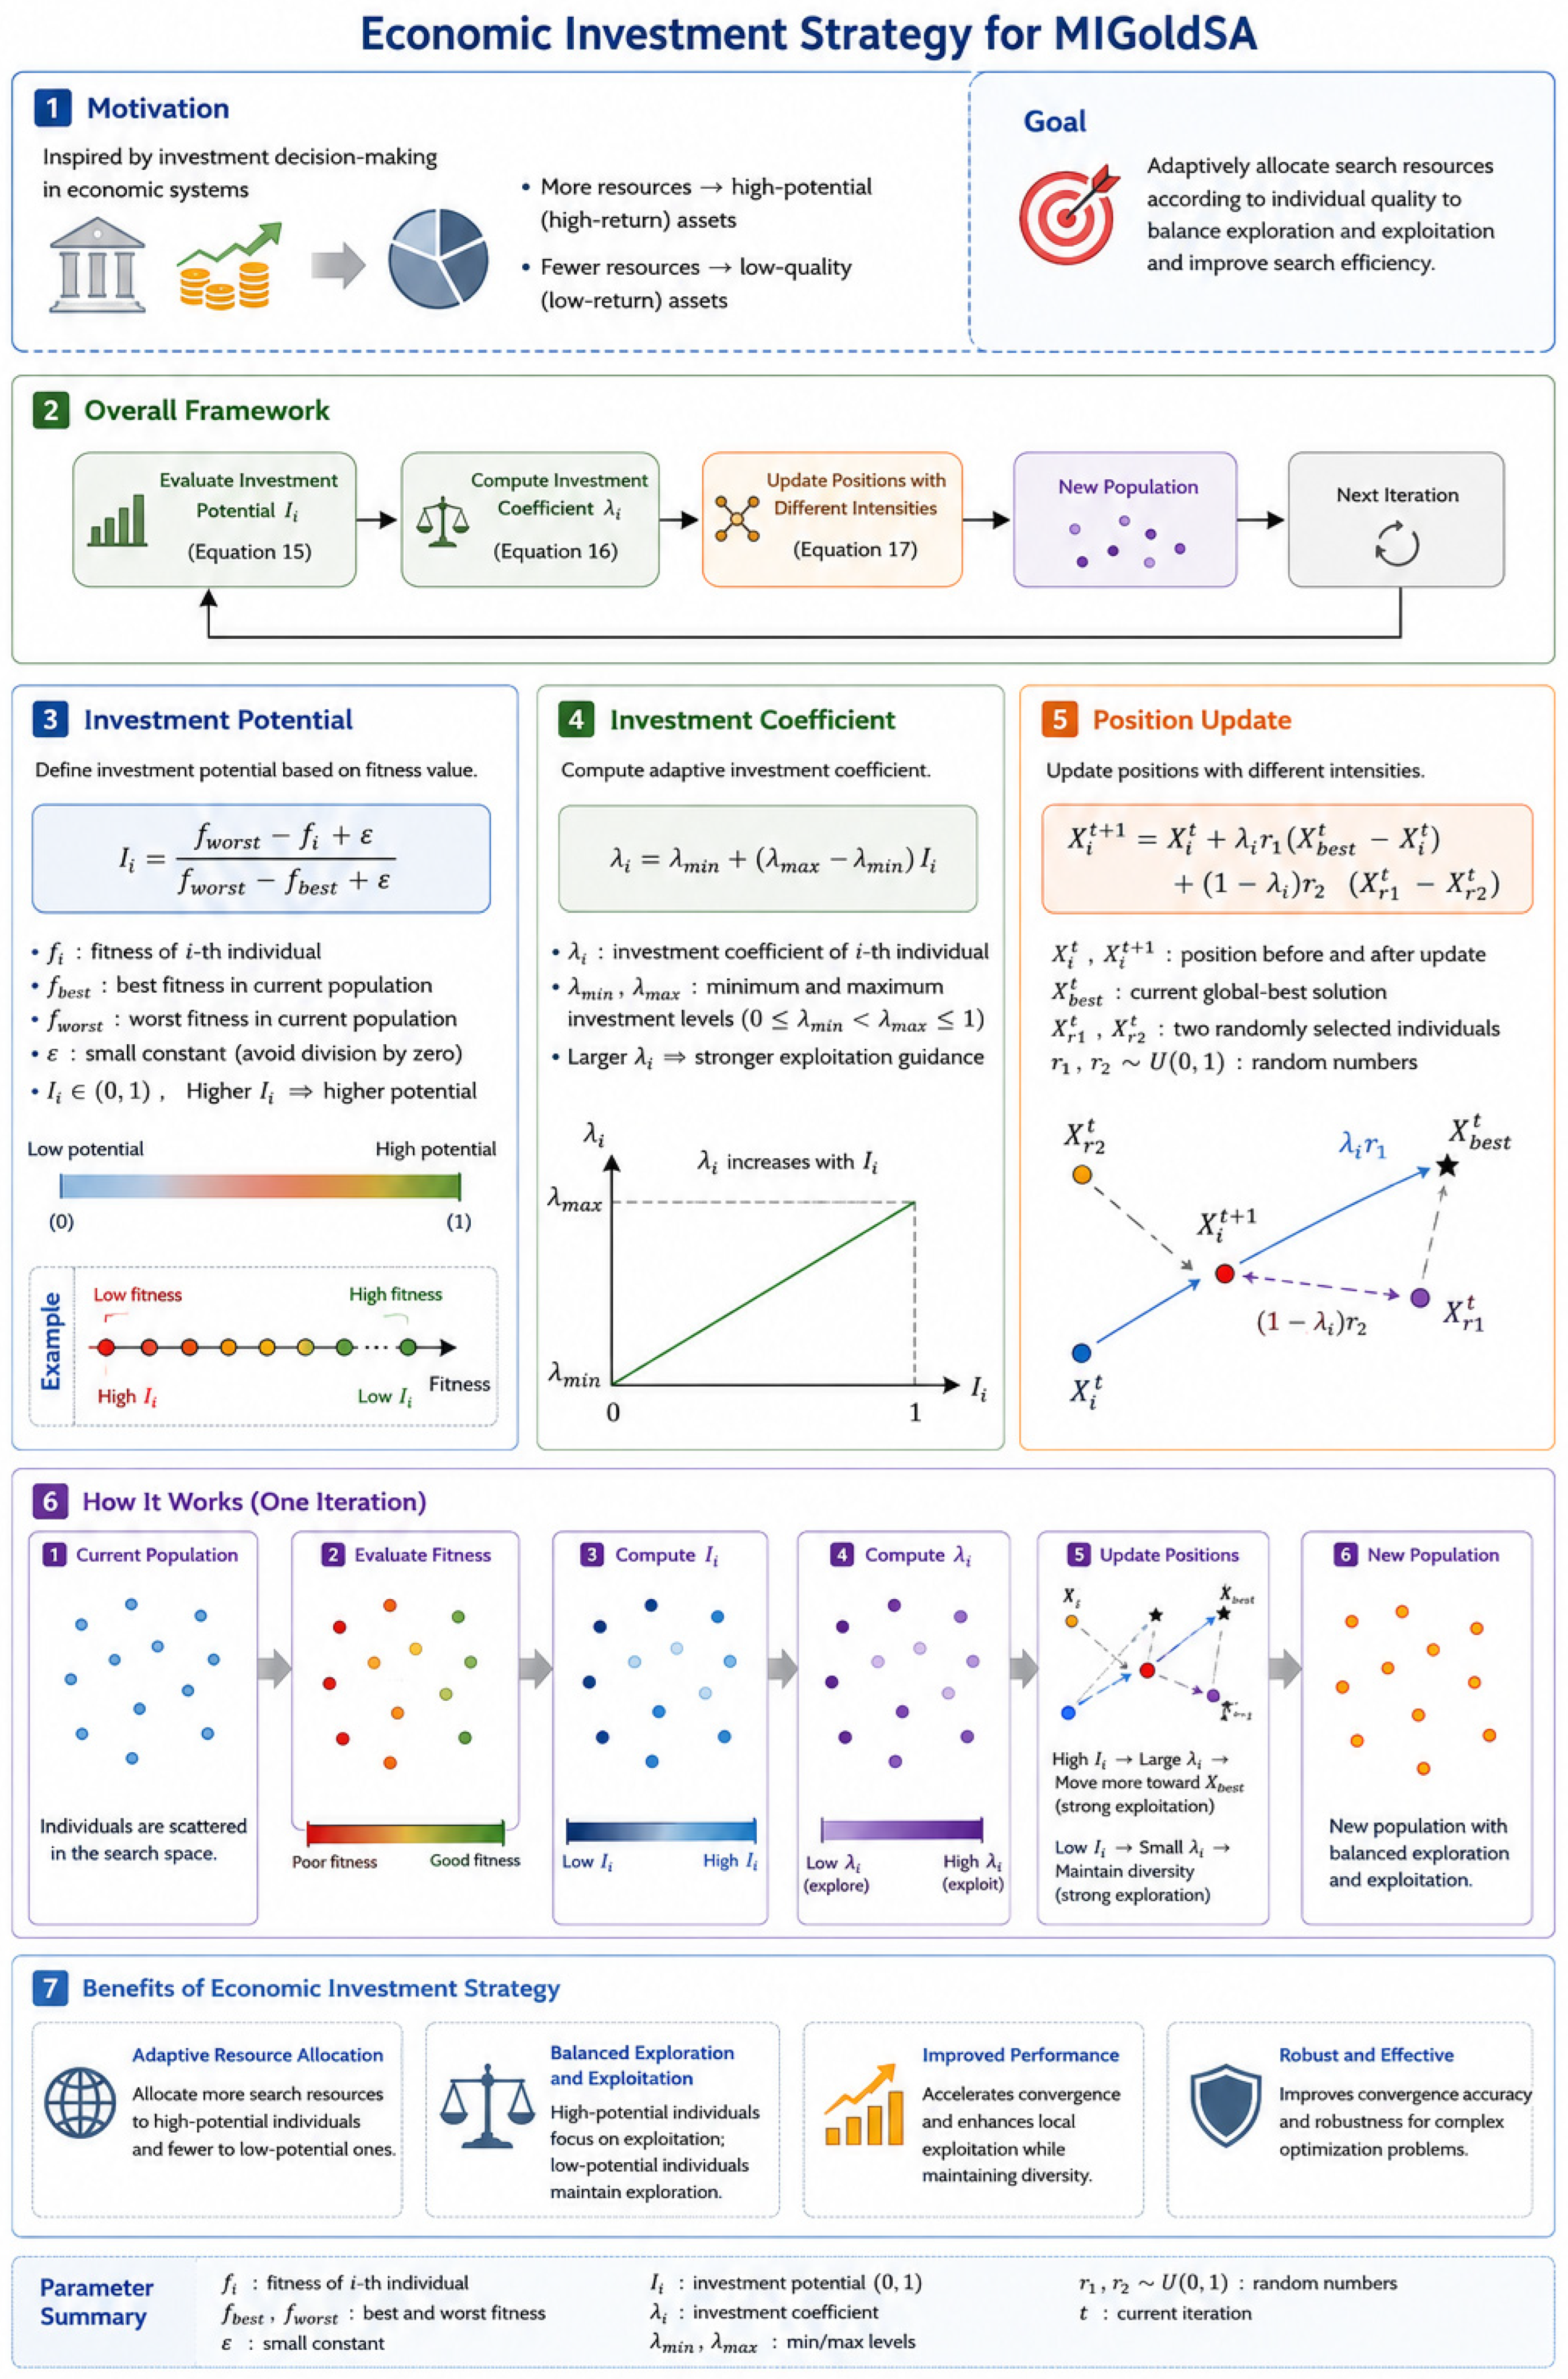
Third, an Economic Investment Strategy is introduced as an adaptive search intensity allocation mechanism. Inspired by the idea that resources are allocated according to potential returns in economic systems, this strategy evaluates the relative optimization potential of each individual based on its fitness value. Individuals with higher potential are assigned stronger exploitation guidance toward the current best solution, whereas individuals with lower potential are encouraged to perform more exploration-oriented updates through differential information from randomly selected individuals. The innovation of this strategy lies in introducing a fitness-dependent allocation rule into the GoldSA search process, rather than proposing an independent economic optimization model. In this way, the strategy provides a simple and adaptive mechanism for balancing local refinement and population diversity maintenance.
Overall, the proposed MIGoldSA is a multi-strategy enhanced version of GoldSA. The adaptive chaotic opposition initialization strategy mainly serves as a combinatorial improvement for population initialization, while the dynamic elite-guided sine evolution strategy and the Economic Investment Strategy further modify the search updating process of GoldSA. Through these complementary modifications, MIGoldSA aims to improve the population diversity, convergence stability, and search adaptability of the original GoldSA in complex optimization problems, without substantially increasing the algorithmic complexity.
The main contributions of this paper are summarized as follows:
A multi-strategy improved version of the Golden Sine Algorithm, named MIGoldSA, is proposed for global optimization and cloud task scheduling problems. The proposed algorithm improves the original GoldSA from the aspects of population initialization, elite-guided evolution, and adaptive search intensity allocation.
An adaptive chaotic opposition initialization strategy is integrated into GoldSA. This strategy combines chaotic mapping and opposition-based learning to improve the initial population distribution and enhance early-stage search diversity.
A dynamic elite-guided sine evolution strategy is developed by replacing the single best-solution guidance in the original GoldSA with a weighted multi-elite guidance center. This mechanism modifies the original sine-based updating rule and helps reduce excessive dependence on a single best individual.
An Economic Investment Strategy is introduced to adaptively adjust the search intensity of different individuals according to their relative fitness quality. This strategy provides a fitness-dependent mechanism for coordinating exploitation-oriented and exploration-oriented updates.
The effectiveness of MIGoldSA is evaluated on the IEEE CEC2017 and CEC2022 benchmark suites and further verified on cloud task scheduling problems. The experimental results show that the proposed modifications can improve the optimization performance of GoldSA on most tested problems.
The remainder of this paper is organized as follows.
Section 2 reviews the related works on cloud task scheduling, metaheuristic optimization algorithms, and GoldSA-based methods.
Section 3 introduces the original Golden Sine Algorithm.
Section 4 presents the proposed MIGoldSA algorithm and its three improvement strategies.
Section 5 reports the experimental results on the IEEE CEC2017 and CEC2022 benchmark suites.
Section 6 applies MIGoldSA to cloud task scheduling problems and analyzes the corresponding experimental results. Finally,
Section 7 concludes this paper and discusses future research directions.
2. Related Work
2.1. Cloud Task Scheduling Optimization
Cloud task scheduling has received considerable attention in recent years because it directly affects the execution efficiency, resource utilization, load balance, and service quality of cloud computing systems. Traditional optimization methods, such as linear programming [
12], dynamic programming [
13], and heuristic rule-based scheduling algorithms [
14], can obtain satisfactory solutions for small-scale or simplified scheduling problems. However, these methods usually have limited scalability and adaptability when dealing with large-scale, nonlinear, heterogeneous, and dynamically changing cloud environments. To overcome these limitations, metaheuristic optimization algorithms have been widely introduced into cloud task scheduling problems. For example, Faten A. Saif et al. proposed a Multi-Objective Gray Wolf Optimizer (MGWO) to minimize latency and energy consumption under Quality of Service (QoS) requirements. The simulation results demonstrated that MGWO could effectively reduce latency and energy consumption compared with existing methods [
15]. Neetu Sharma et al. developed an improved Ant Colony Optimization algorithm based on a neural network mechanism to optimize task allocation and resource organization. The results showed that the proposed LBACO algorithm achieved better scheduling performance and faster optimization speed [
16]. Cui et al. constructed a multi-objective cloud task scheduling model by considering execution time, execution cost, and virtual machine load balancing, and proposed a scheduling algorithm based on evolutionary multifactor optimization. Their results indicated that knowledge transfer among subpopulations could accelerate convergence and improve the optimization performance of multiple objectives [
17].
Although these studies have improved cloud task scheduling performance from different perspectives, the scheduling problem remains challenging due to the high dimensionality, complex constraints, and strong coupling among scheduling objectives. Therefore, more robust and adaptive optimization algorithms are still required to obtain high-quality scheduling solutions under different task scales.
2.2. Metaheuristic Optimization Algorithms
Metaheuristic algorithms have been widely used in global optimization and engineering applications because they do not require strict mathematical assumptions and can effectively search complex solution spaces. In recent years, many improved metaheuristic algorithms have been proposed to enhance convergence accuracy, population diversity, and robustness. For instance, Qin et al. proposed an Enhanced Red-Tailed Hawk algorithm based on a multi-elite strategy and chaotic mapping for cloud task scheduling. The proposed ERTH algorithm showed faster convergence speed and higher stability in minimizing task completion time and system load cost [
18]. Liu et al. proposed an improved Ant Colony Optimization variant, named IHMACO, for global path planning problems. By incorporating several new mechanisms, IHMACO achieved superior performance compared with multiple existing path planning methods [
19]. Shen et al. introduced a population evolution strategy into the Whale Optimization Algorithm and proposed MEWOA for solving the CEC2019 benchmark functions and engineering design problems. The experimental results demonstrated its strong competitiveness and solution accuracy [
20].
Despite their successful applications, many metaheuristic algorithms still suffer from common drawbacks, such as insufficient population diversity, premature convergence, and imbalance between exploration and exploitation. These problems become more serious when solving high-dimensional, multimodal, hybrid, and composition optimization problems. Therefore, designing effective improvement strategies to maintain population diversity, strengthen elite guidance, and adaptively regulate search behaviors is essential for improving optimization performance.
2.3. GoldSA and Its Improved Variants
The Golden Sine Algorithm (GoldSA), proposed by Tanyildizi et al. [
11], is a mathematical metaheuristic algorithm inspired by the golden ratio and the periodic oscillation of the sine function. By combining sine-based position updating with the golden section mechanism, GoldSA can guide search agents toward promising regions and gradually narrow the search interval. Due to its simple structure, few parameters, and easy implementation, GoldSA has been used as an effective optimization component in several hybrid and improved algorithms.
For example, Liu et al. proposed a hybrid optimization algorithm combining the Arithmetic Optimization Algorithm and GoldSA. The population was divided into two subgroups and optimized using different search mechanisms. The experimental results on industrial engineering design problems demonstrated that the hybrid algorithm achieved better optimization accuracy and convergence speed than the original AOA, GoldSA, and other comparison algorithms [
21]. Li et al. introduced the Runge–Kutta method and the Golden Sine strategy into the Arithmetic Optimization Algorithm to improve its convergence speed and global search capability. The results showed significant improvements in convergence speed, convergence accuracy, and stability compared with the standard AOA [
22].
These studies indicate that the GoldSA mechanism has good potential for improving optimization performance. However, the original GoldSA still has some limitations, including insufficient diversity in the initialization stage, strong dependence on the current best solution, and lack of adaptive search regulation. Therefore, this paper further improves GoldSA by introducing an adaptive chaotic opposition initialization strategy, a dynamic elite-guided sine evolution strategy, and an Economic Investment Strategy. Compared with existing GoldSA-related methods, the proposed MIGoldSA focuses not only on improving convergence accuracy but also on strengthening population diversity maintenance and adaptive exploration–exploitation coordination, making it more suitable for complex global optimization and cloud task scheduling problems.
3. Golden Sine Algorithm (GoldSA)
Golden Sine Algorithm (GoldSA) is a population-based metaheuristic optimization algorithm inspired by mathematical mechanisms. Different from traditional swarm intelligence algorithms inspired by biological behaviors or physical phenomena, GoldSA is developed based on the periodic characteristics of the sine function and the search mechanism of the golden section theory. By combining the oscillatory search behavior of the sine function with the interval contraction capability of the golden section method, GoldSA can effectively balance global exploration and local exploitation during the optimization process. Owing to its simple structure, few control parameters, and fast convergence characteristics, GoldSA has attracted increasing attention in solving continuous optimization problems.
3.1. Basic Principle of GoldSA
The inspiration of GoldSA mainly originates from the periodic variation property of the sine function. As a classical trigonometric function, the sine function exhibits periodic oscillation behavior within the interval . Such oscillatory characteristics are highly similar to the dynamic search behavior of metaheuristic algorithms in the solution space. Therefore, GoldSA utilizes the sine function to guide search agents to move periodically around the target solution, thereby enhancing the diversity of population search trajectories and improving the ability to escape local optima.
Meanwhile, in order to further improve the search efficiency, GoldSA introduces the golden section mechanism into the optimization process. The golden section method is a classical mathematical optimization technique that gradually narrows the search interval according to the golden ratio, enabling the search process to focus more efficiently on promising regions. By integrating the sine oscillation mechanism and the golden section strategy, GoldSA achieves dynamic adjustment of the search range during iterations, which significantly enhances convergence performance and solution accuracy.
3.2. Population Initialization
Similar to most population-based optimization algorithms, GoldSA first randomly initializes the population within the feasible search space. Suppose the population size is
and the problem dimension is
. The position of the
-th search agent in the
-th dimension is represented by
. The initialization process can be expressed as follows:
where
is a uniformly distributed random number within
;
and
denote the upper and lower bounds of the
-th dimension, respectively;
represents the position value of the
-th individual in the
-th dimension.
This initialization strategy enables the search agents to be evenly distributed throughout the search space, thereby improving the population diversity during the early optimization stage and enhancing the global exploration capability of the algorithm.
3.3. Position Updating Mechanism
The core component of GoldSA is the position updating strategy based on the sine function and golden section coefficients. During each iteration, the search agents dynamically update their positions around the current target solution according to the following equation:
where
denotes the current position of the search agent;
represents the position of the current best solution in the
-th dimension;
is a random parameter controlling the periodic variation in the sine function;
is a random step-size adjustment parameter;
and
are the golden section coefficients.
In this mechanism, the periodic oscillation property of the sine function enables the search agents to perform nonlinear movements within the search space. When the value of is large, the search step becomes relatively large, which enhances global exploration. Conversely, when is small, the movement amplitude decreases, and the algorithm tends to focus on local exploitation. Meanwhile, the target solution provides directional guidance for the population, allowing the search agents to gradually converge toward promising regions.
Therefore, the position updating mechanism of GoldSA establishes a dynamic balance between exploration and exploitation by integrating periodic oscillatory search behavior with elite-guided search.
3.4. Golden Section Search Mechanism
The golden section mechanism is one of the most important components of GoldSA, and its primary objective is to gradually shrink the search interval to improve optimization efficiency. The golden ratio can be defined as follows:
Assume that the current search interval is
. Then, two golden section points can be calculated as:
where
and
denote the lower and upper boundaries of the search interval, respectively;
is the golden ratio coefficient;
and
are the two golden section search points. In GoldSA, the initial values are generally set as:
During the iterative process, the search interval is dynamically adjusted according to the fitness relationship between the current individual and the target solution. Specifically, if the newly generated solution is better than the current target solution, the corresponding interval boundary is updated to further narrow the search region. Consequently, the search process gradually focuses on more promising areas, thereby accelerating convergence and improving solution precision.
The incorporation of the golden section mechanism allows GoldSA to avoid excessive random exploration and enhances the local exploitation capability of the algorithm.
3.5. Optimization Procedure of GoldSA
The overall optimization process of GoldSA can be summarized as follows:
Randomly initialize the population within the feasible search space;
Evaluate the fitness values of all search agents;
Determine the current global best solution as the target solution;
Update the positions of search agents using the sine-based updating equation and golden section coefficients;
Recalculate the fitness values and update the global best solution;
Repeat the iterative process until the termination criterion is satisfied;
Output the final global optimal solution.
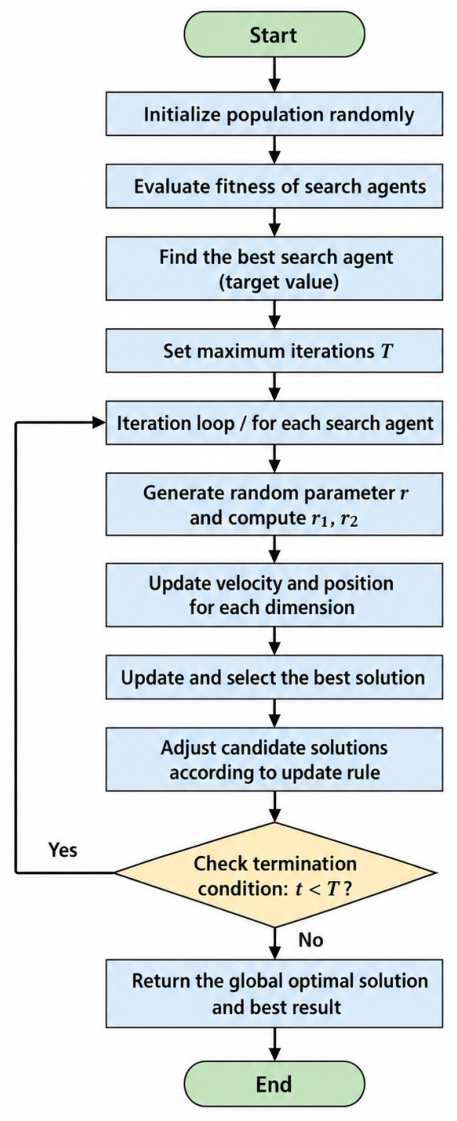
Through the collaborative interaction between the sine oscillation mechanism and the golden section search strategy, GoldSA exhibits relatively strong optimization capability in solving continuous optimization problems. The GoldSA execution flowchart is shown in
Figure 1.
3.6. Advantages and Limitations of GoldSA
Compared with conventional metaheuristic algorithms, GoldSA possesses several advantages, including simple structure, fewer control parameters, fast convergence speed, and easy implementation. Furthermore, the sine-based oscillatory search mechanism improves population diversity, while the golden section strategy enhances local exploitation efficiency.
However, the original GoldSA still suffers from several shortcomings when dealing with complex and high-dimensional optimization problems. First, since the population is initialized by a purely random mechanism and the search process gradually contracts around promising regions, the population diversity may decrease rapidly in the later optimization stage, which increases the risk of premature convergence [
9,
10]. Second, according to the position updating mechanism of GoldSA, the search direction is mainly guided by the current target solution, which may make the algorithm prone to being trapped in local optima when solving complex multimodal problems [
11,
21]. Third, although the sine-based search mechanism and golden section strategy contribute to exploration and exploitation, the original GoldSA lacks an adaptive mechanism to dynamically adjust the search behavior according to the population state, which may lead to an insufficient balance between global exploration and local exploitation in high-dimensional optimization tasks [
22]. Therefore, further improvement strategies are necessary to enhance the global optimization performance, population diversity maintenance ability, and local exploitation capability of GoldSA.
4. Proposed MIGoldSA
To overcome the shortcomings of the original Golden Sine Algorithm (GoldSA), such as insufficient population diversity, weak balance between exploration and exploitation, and susceptibility to premature convergence in complex multimodal optimization problems, this paper proposes a Multi-Strategy Improved Golden Sine Algorithm (MIGoldSA). Specifically, three novel enhancement strategies are introduced, including an adaptive chaotic opposition initialization strategy, a dynamic elite-guided sine evolution strategy, and an Economic Investment Strategy. The proposed strategies collaboratively improve the global exploration capability, local exploitation efficiency, and adaptive resource allocation ability of the original GoldSA, thereby significantly enhancing its optimization performance in high-dimensional and complex search spaces. In particular, the Economic Investment Strategy dynamically allocates search efforts according to the optimization potential of individuals, enabling high-quality individuals to receive stronger exploitation guidance while maintaining sufficient population diversity through exploration-oriented updates for inferior individuals.
4.1. Adaptive Chaotic Opposition Initialization Strategy
In the original GoldSA, the initial population is generated purely by uniform random distribution. Although such a mechanism is simple and easy to implement, it often suffers from uneven population distribution and insufficient diversity, especially in high-dimensional optimization problems. Consequently, the algorithm may fail to adequately explore promising regions during the early search stage.
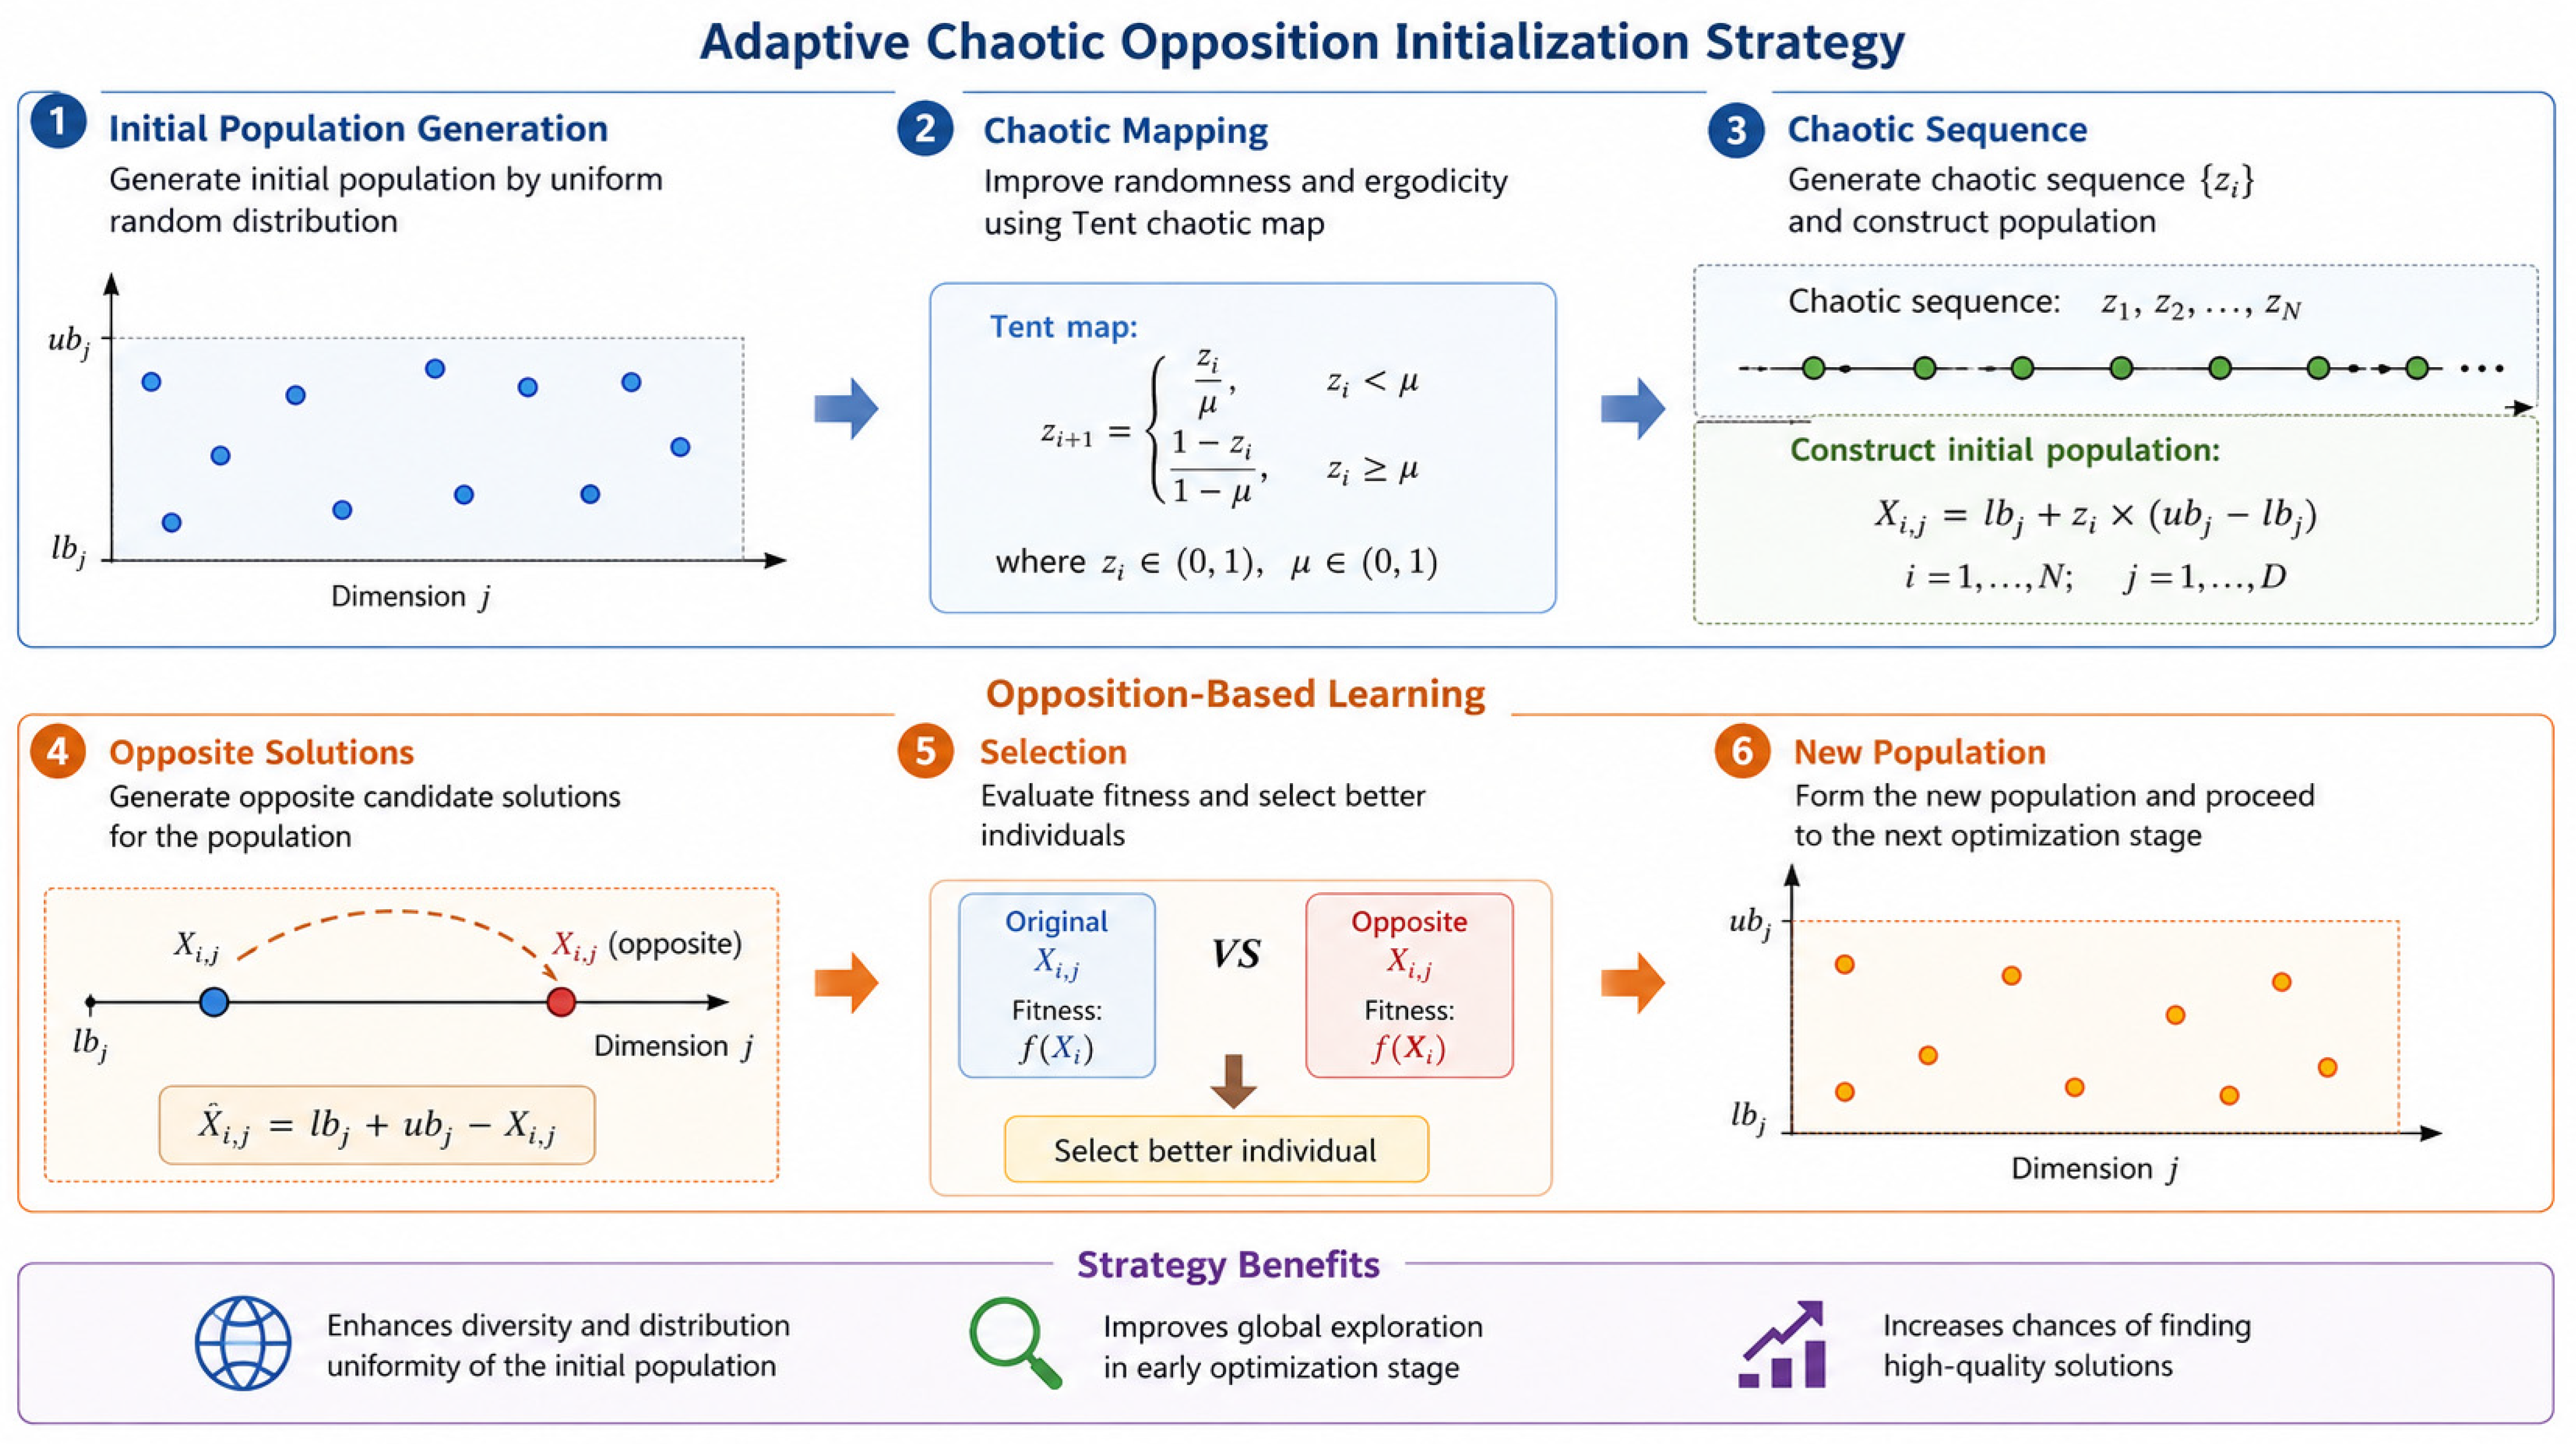
To address this issue, an adaptive chaotic opposition initialization strategy is proposed. First, chaotic mapping is introduced to improve the randomness and ergodicity of the initial population. Then, opposition-based learning is employed to further expand the search coverage of the population [
23].
The chaotic sequence is generated using the Tent chaotic map as follows:
where
denotes the chaotic variable of the
-th iteration;
is the control parameter of the Tent map. Using the generated chaotic sequence, the initial population can be constructed as:
where
represents the position of the
-th individual in the
-th dimension;
and
denote the lower and upper bounds of the
-th dimension, respectively.
Subsequently, opposition-based learning is employed to generate opposite candidate solutions:
where
denotes the opposite solution of
. Finally, the better individuals are selected from the combined population according to fitness values to construct the initial population of MIGoldSA.
By combining chaotic mapping and opposition-based learning, the proposed strategy significantly enhances the diversity and distribution uniformity of the initial population, thereby improving the global exploration capability of the algorithm during the early optimization stage.
Figure 2 illustrates a schematic diagram of this strategy.
4.2. Dynamic Elite-Guided Sine Evolution Strategy
In the original GoldSA, the position updating process excessively relies on the current global best solution. Although this mechanism accelerates convergence, it also increases the risk of premature convergence and population aggregation around local optima.
To alleviate this issue, a dynamic elite-guided sine evolution strategy is proposed. Instead of using only the global best individual, multiple elite individuals are utilized collaboratively to guide the population evolution process.
First, the elite guidance center is constructed as:
where
denotes the elite guidance center;
is the number of elite individuals;
represents the
-th elite individual;
denotes the adaptive weight of the
-th elite individual. The adaptive weights are calculated according to fitness values:
where
denotes the fitness value of the
-th elite individual;
is a very small constant used to avoid division by zero. Then, the original GoldSA position updating equation is modified as:
where
and
denote the positions before and after updating, respectively;
represents the
-th dimension of the elite guidance center;
and
are random parameters;
and
are adaptive control coefficients. The adaptive coefficients are dynamically adjusted as:
where
denotes the current iteration number;
denotes the maximum number of iterations.
At the early optimization stage, larger values encourage global exploration around elite regions. As iterations proceed, larger values gradually enhance local exploitation capability.
Therefore, the proposed strategy effectively improves the balance between exploration and exploitation while reducing the dependence on a single best solution.
Figure 3 illustrates a schematic diagram of this strategy.
4.3. Economic Investment Strategy
To further enhance the search efficiency of MIGoldSA and improve its ability to allocate search resources adaptively, an Economic Investment Strategy is introduced. The main idea of this strategy is inspired by the investment decision-making process in economic systems. In real investment activities, more resources are usually allocated to assets with higher potential returns, while fewer resources are assigned to low-quality or high-risk assets. Similarly, in the optimization process, individuals with better fitness values can be regarded as high-return search assets, while inferior individuals are considered low-return assets. Therefore, different update intensities are assigned to individuals according to their fitness quality, so that the algorithm can adaptively balance exploration and exploitation.
First, the investment potential of the
-th individual is defined according to its fitness value:
where
denotes the investment potential of the
-th individual,
represents the fitness value of the
-th individual,
and
are the best and worst fitness values in the current population, respectively, and
is a small constant used to avoid division by zero. For minimization problems, a larger
indicates that the individual has better optimization potential and should receive stronger exploitation guidance. Then, the investment coefficient is calculated as follows:
where
is the adaptive investment coefficient of the
-th individual, and
and
denote the minimum and maximum investment levels, respectively.
Based on the investment coefficient, the position of each individual is updated by:
where
represents the position of the
-th individual at iteration
,
denotes the current global best solution,
and
are two randomly selected individuals from the population, and
and
are random numbers in
.
In this update mechanism, individuals with higher investment potential are guided more strongly by the current best solution, thereby accelerating convergence and strengthening local exploitation. Conversely, individuals with lower investment potential rely more on the difference between randomly selected individuals, which helps maintain population diversity and enhances global exploration. Therefore, the proposed Economic Investment Strategy enables MIGoldSA to dynamically allocate search resources according to individual quality, improving both convergence accuracy and robustness in complex optimization problems.
Figure 4 illustrates a schematic diagram of this strategy.
4.4. Computational Complexity Analysis of MIGoldSA
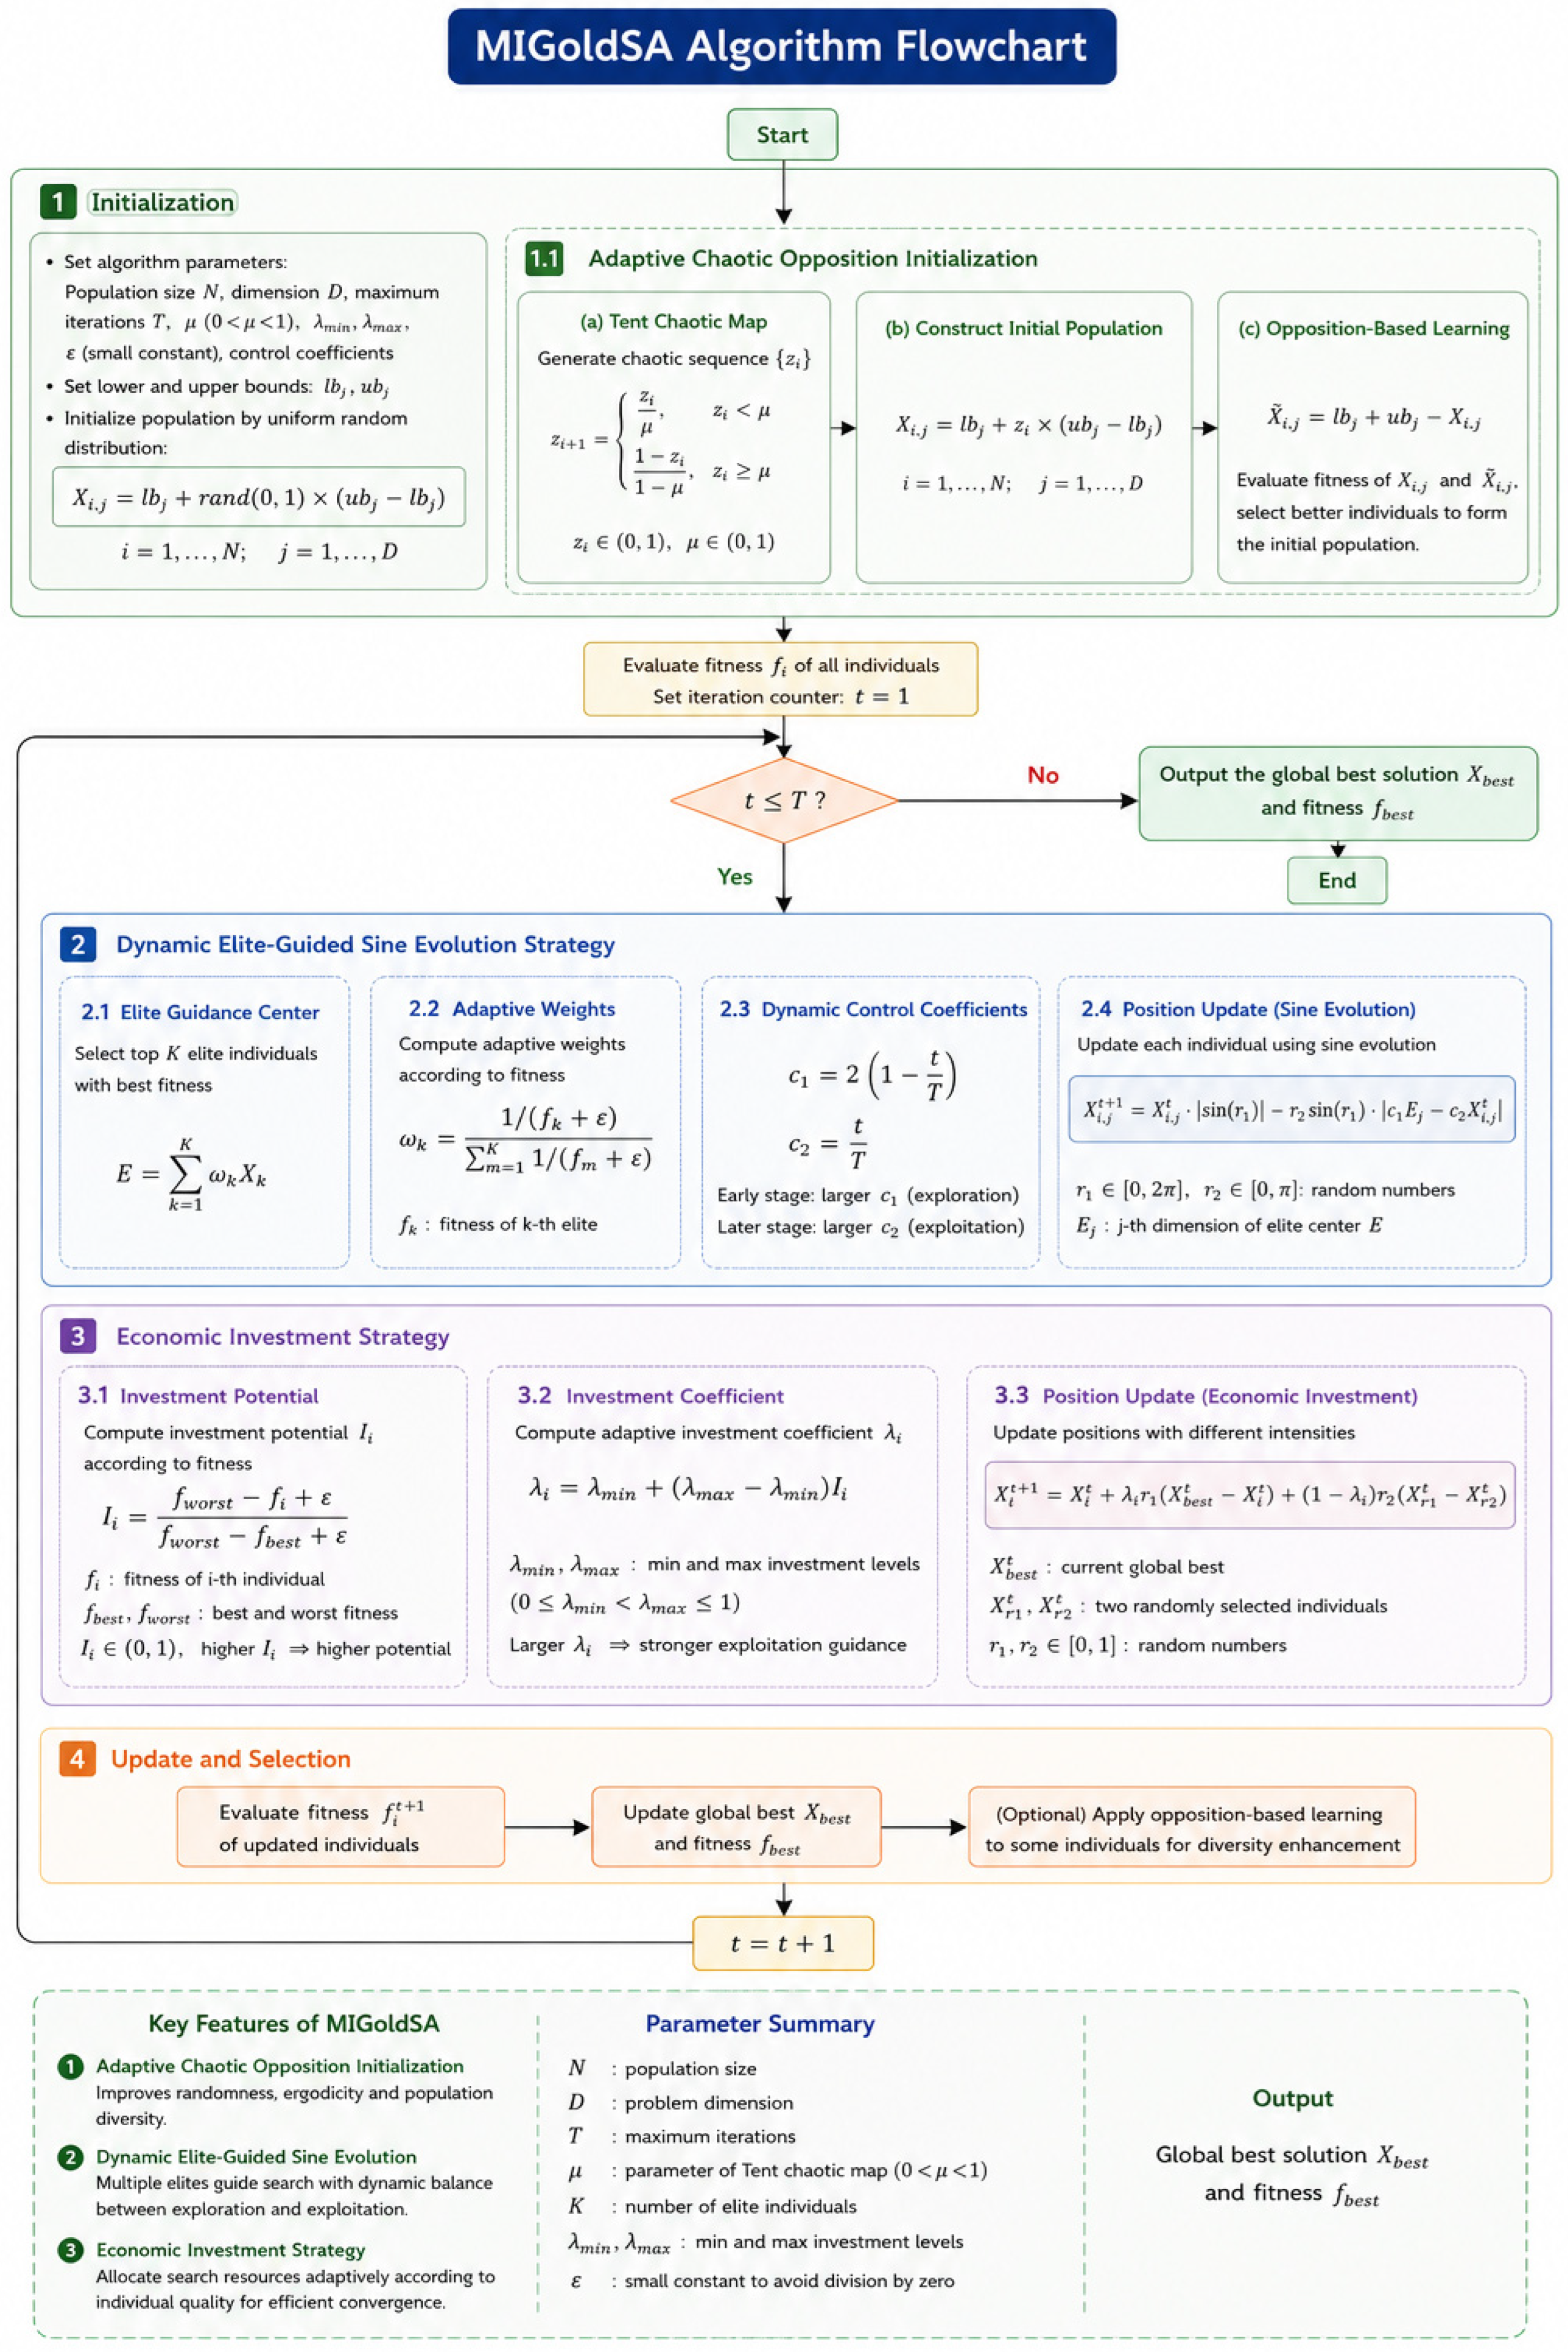
Assume that the population size is , the problem dimension is , and the maximum iteration number is . In MIGoldSA, the adaptive chaotic opposition initialization strategy introduces additional opposition-based solution generation operations, whose computational complexity is . The dynamic elite-guided sine evolution strategy mainly involves elite individual weighting, sine-guided position updating, and adaptive search operations, and its computational complexity also remains . Furthermore, the proposed Economic Investment Strategy dynamically calculates the investment potential and adaptive investment coefficient for each individual according to its fitness quality, followed by investment-guided position updates. The computational cost of these operations is likewise .
Therefore, the overall computational complexity of MIGoldSA can still be expressed as
. which is consistent with the original GoldSA in terms of complexity order. Consequently, the proposed improvement strategies do not significantly increase the computational burden of the algorithm while substantially enhancing its global exploration capability, local exploitation efficiency, and optimization accuracy in complex search spaces.
Figure 5 illustrates the flowchart of the MIGoldSA. The global convergence analysis of MIGoldSA proposed in this paper is presented in
Appendix A.
5. Global Optimization Experiment Analysis
This section aims to comprehensively evaluate the optimization performance of the proposed MIGoldSA through extensive experiments conducted on the IEEE CEC2017 and IEEE CEC2022 benchmark test suites. First, a brief introduction to the characteristics of the benchmark functions is provided, followed by detailed descriptions of the comparison algorithms and their parameter settings. Subsequently, MIGoldSA is compared with nine advanced state-of-the-art optimization algorithms to verify its effectiveness and competitiveness in solving complex optimization problems. Finally, statistical analyses are carried out to further validate the superiority and robustness of the proposed MIGoldSA.
To ensure the fairness and consistency of the experimental results, the population size of all comparison algorithms was uniformly set to 50, while the maximum number of iterations was fixed at 1000. Moreover, each algorithm was independently executed 30 times to reduce the influence of randomness on the experimental results. All experiments were implemented in MATLAB 2023a and conducted on a computer equipped with an Intel Core i7-10700F CPU operating at 2.90 GHz and 8 GB RAM.
5.1. Benchmark Test Functions
To comprehensively evaluate the optimization capability of the proposed MIGoldSA algorithm, the IEEE CEC2017 [
24] and IEEE CEC2022 [
25] benchmark test suites are employed in this study. These benchmark suites are widely recognized as standard evaluation platforms for metaheuristic optimization algorithms and have been extensively used to assess the convergence accuracy, robustness, exploration capability, and exploitation performance of various swarm intelligence and evolutionary optimization methods.
The IEEE CEC2017 benchmark suite consists of a diverse set of complex optimization problems, including unimodal functions, multimodal functions, hybrid functions, and composition functions. Among them, unimodal functions are mainly used to evaluate the convergence speed and local exploitation capability of optimization algorithms, while multimodal functions contain numerous local optima and are therefore suitable for testing the global exploration ability and local optimum avoidance capability of algorithms. Furthermore, hybrid and composition functions combine multiple search characteristics and complex landscape structures, significantly increasing optimization difficulty and providing a more challenging evaluation environment for metaheuristic algorithms. Consequently, the CEC2017 benchmark suite has become one of the most commonly used benchmark platforms for evaluating the overall performance of optimization algorithms.
Compared with CEC2017, the IEEE CEC2022 benchmark suite introduces more complicated landscape characteristics and stronger variable interactions, making the optimization problems more challenging. The CEC2022 benchmark functions contain highly nonlinear, nonseparable, rotated, and hybrid search landscapes, which can better simulate practical complex optimization scenarios. In particular, the benchmark suite places greater emphasis on evaluating the balance between global exploration and local exploitation, as well as the population diversity maintenance capability of optimization algorithms in high-dimensional search spaces. Therefore, CEC2022 is considered a more rigorous benchmark suite for testing the robustness and adaptability of advanced metaheuristic algorithms.
Since the CEC2017 and CEC2022 benchmark suites contain a wide variety of optimization problems with different characteristics and difficulty levels, they can comprehensively reflect the optimization performance of metaheuristic algorithms under different search environments. Therefore, in this paper, these two benchmark suites are selected to systematically evaluate the performance of the proposed MIGoldSA algorithm in terms of convergence accuracy, convergence behavior, robustness, and global optimization capability.
5.2. Competitor Algorithms and Parameters Setting
In this section, the proposed MIGoldSA algorithm is compared with nine advanced optimization algorithms to comprehensively evaluate its optimization performance, convergence capability, and robustness in solving complex optimization problems. To conduct a comprehensive comparison, we selected algorithms based on group behavior, including Velocity pausing particle swarm optimization (VPPSO), Self-Learning Particle Swarm Optimizer (SLPSO), Artificial Lemming Algorithm (ALA), Traffic jam optimizer (TJO), Gekko Japonicus Algorithm (GJA), Newton Downhill Optimizer (NDO), Zebra Optimization Algorithm (ZOA), Stochastic social learning optimization (SSLO), and Golden Sine Algorithm (GoldSA).
Table 1 summarizes the parameter settings of these algorithms for easier reading.
5.3. Performance Evaluation on the CEC2017 Benchmark Functions
In this section, the optimization performance of MIGoldSA is evaluated on the 30-dimensional and 50-dimensional CEC2017 benchmark functions and compared with nine advanced state-of-the-art optimization algorithms. The corresponding experimental results are presented in
Table 2 and
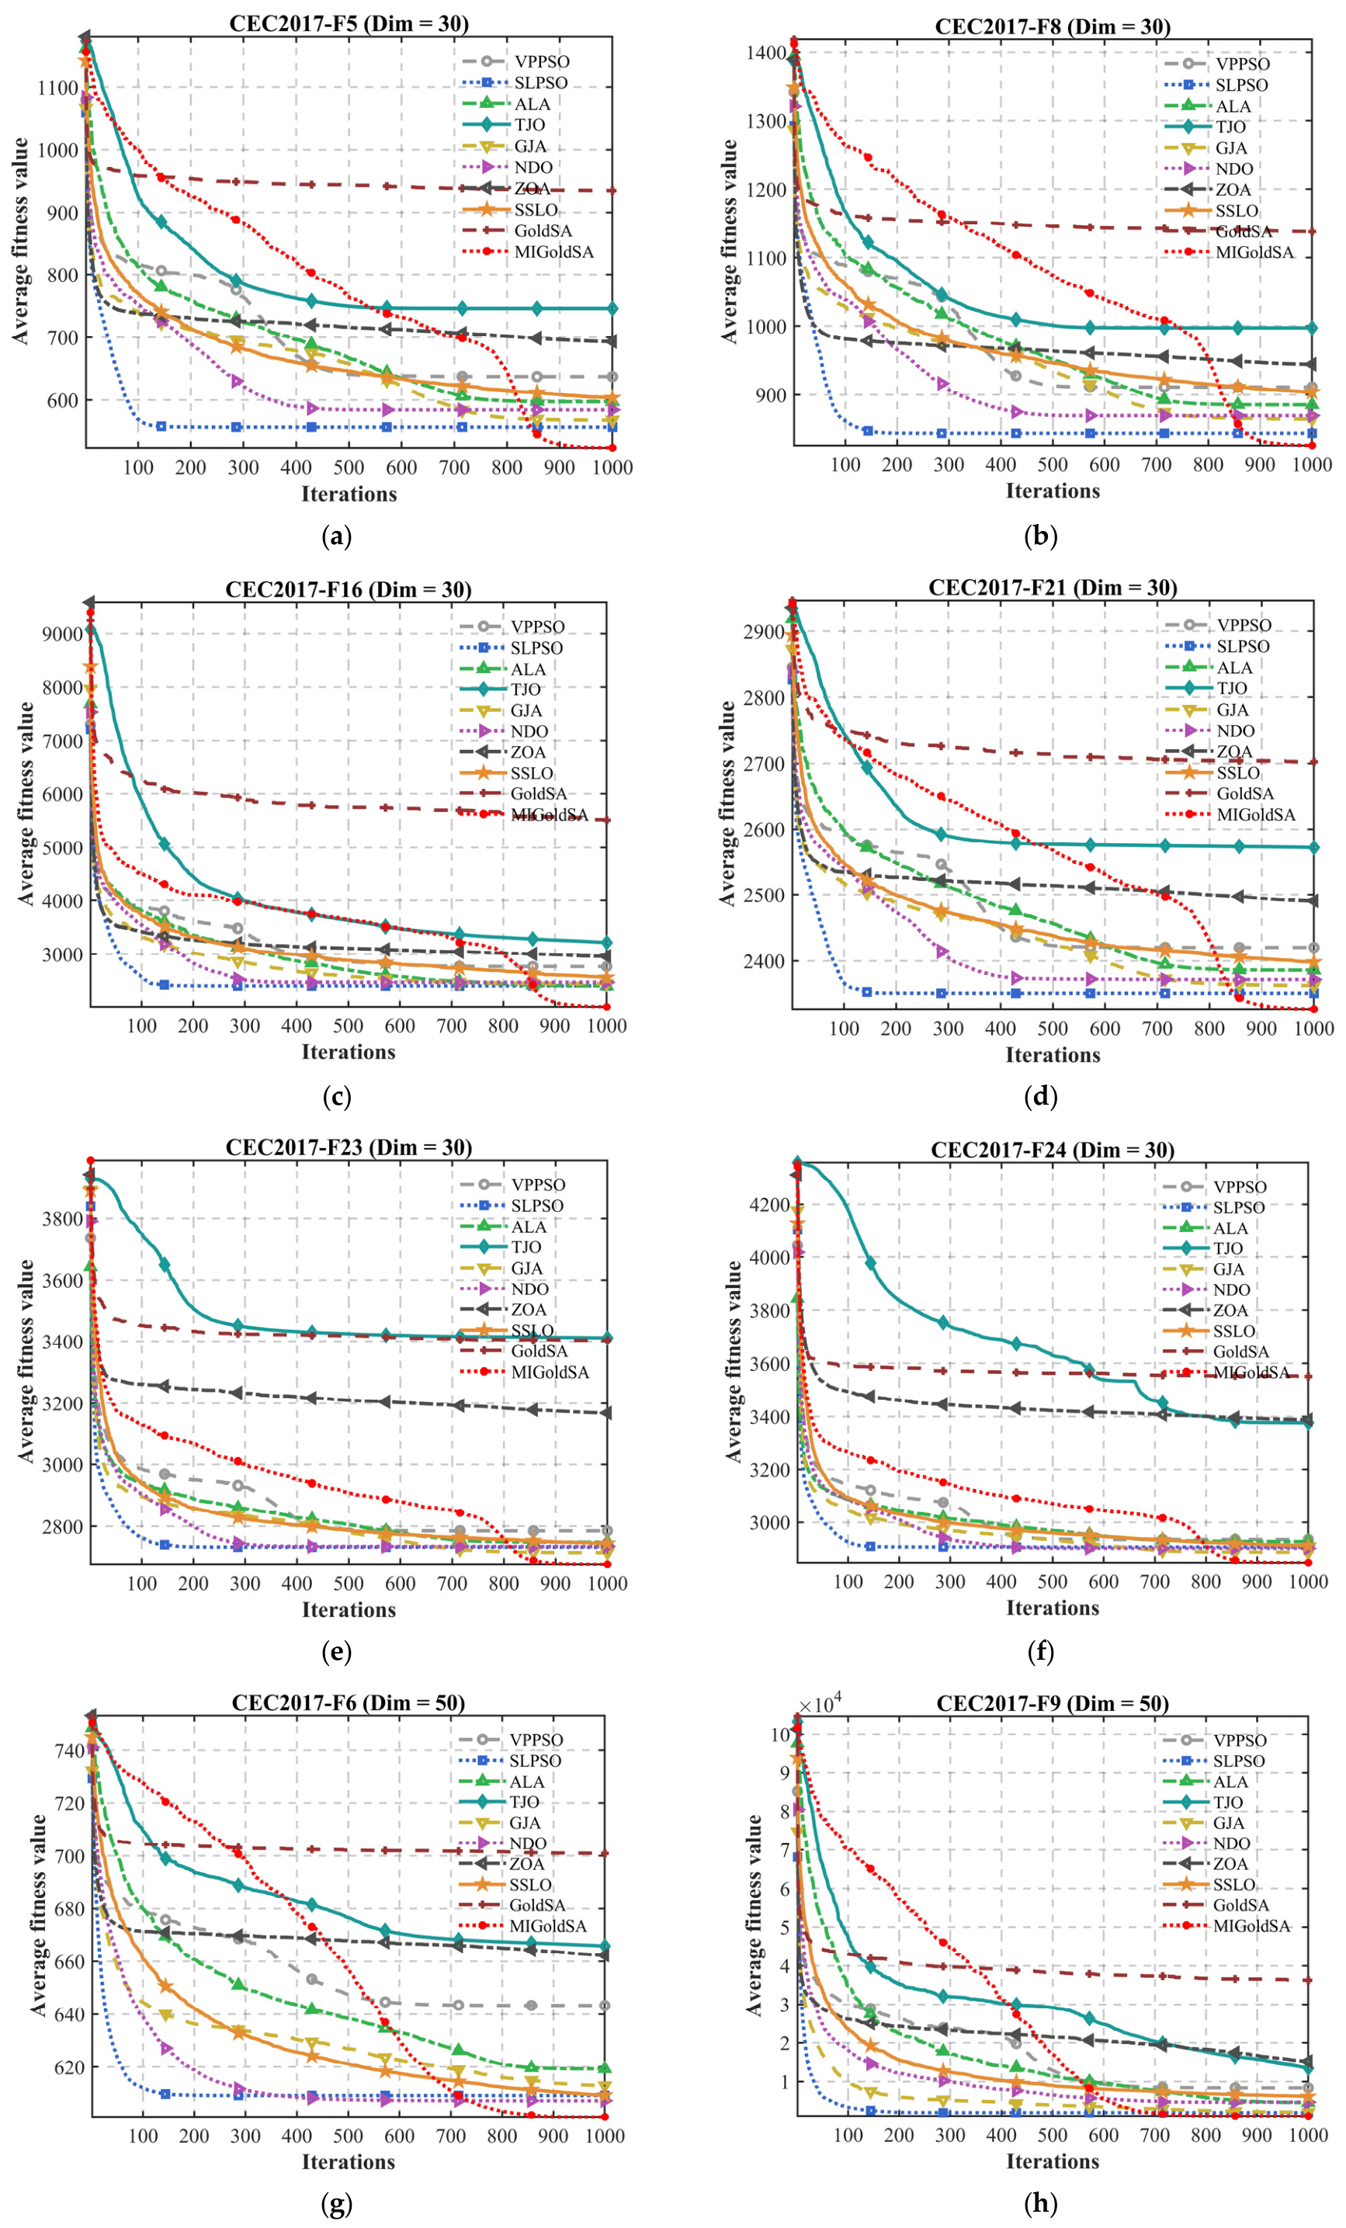
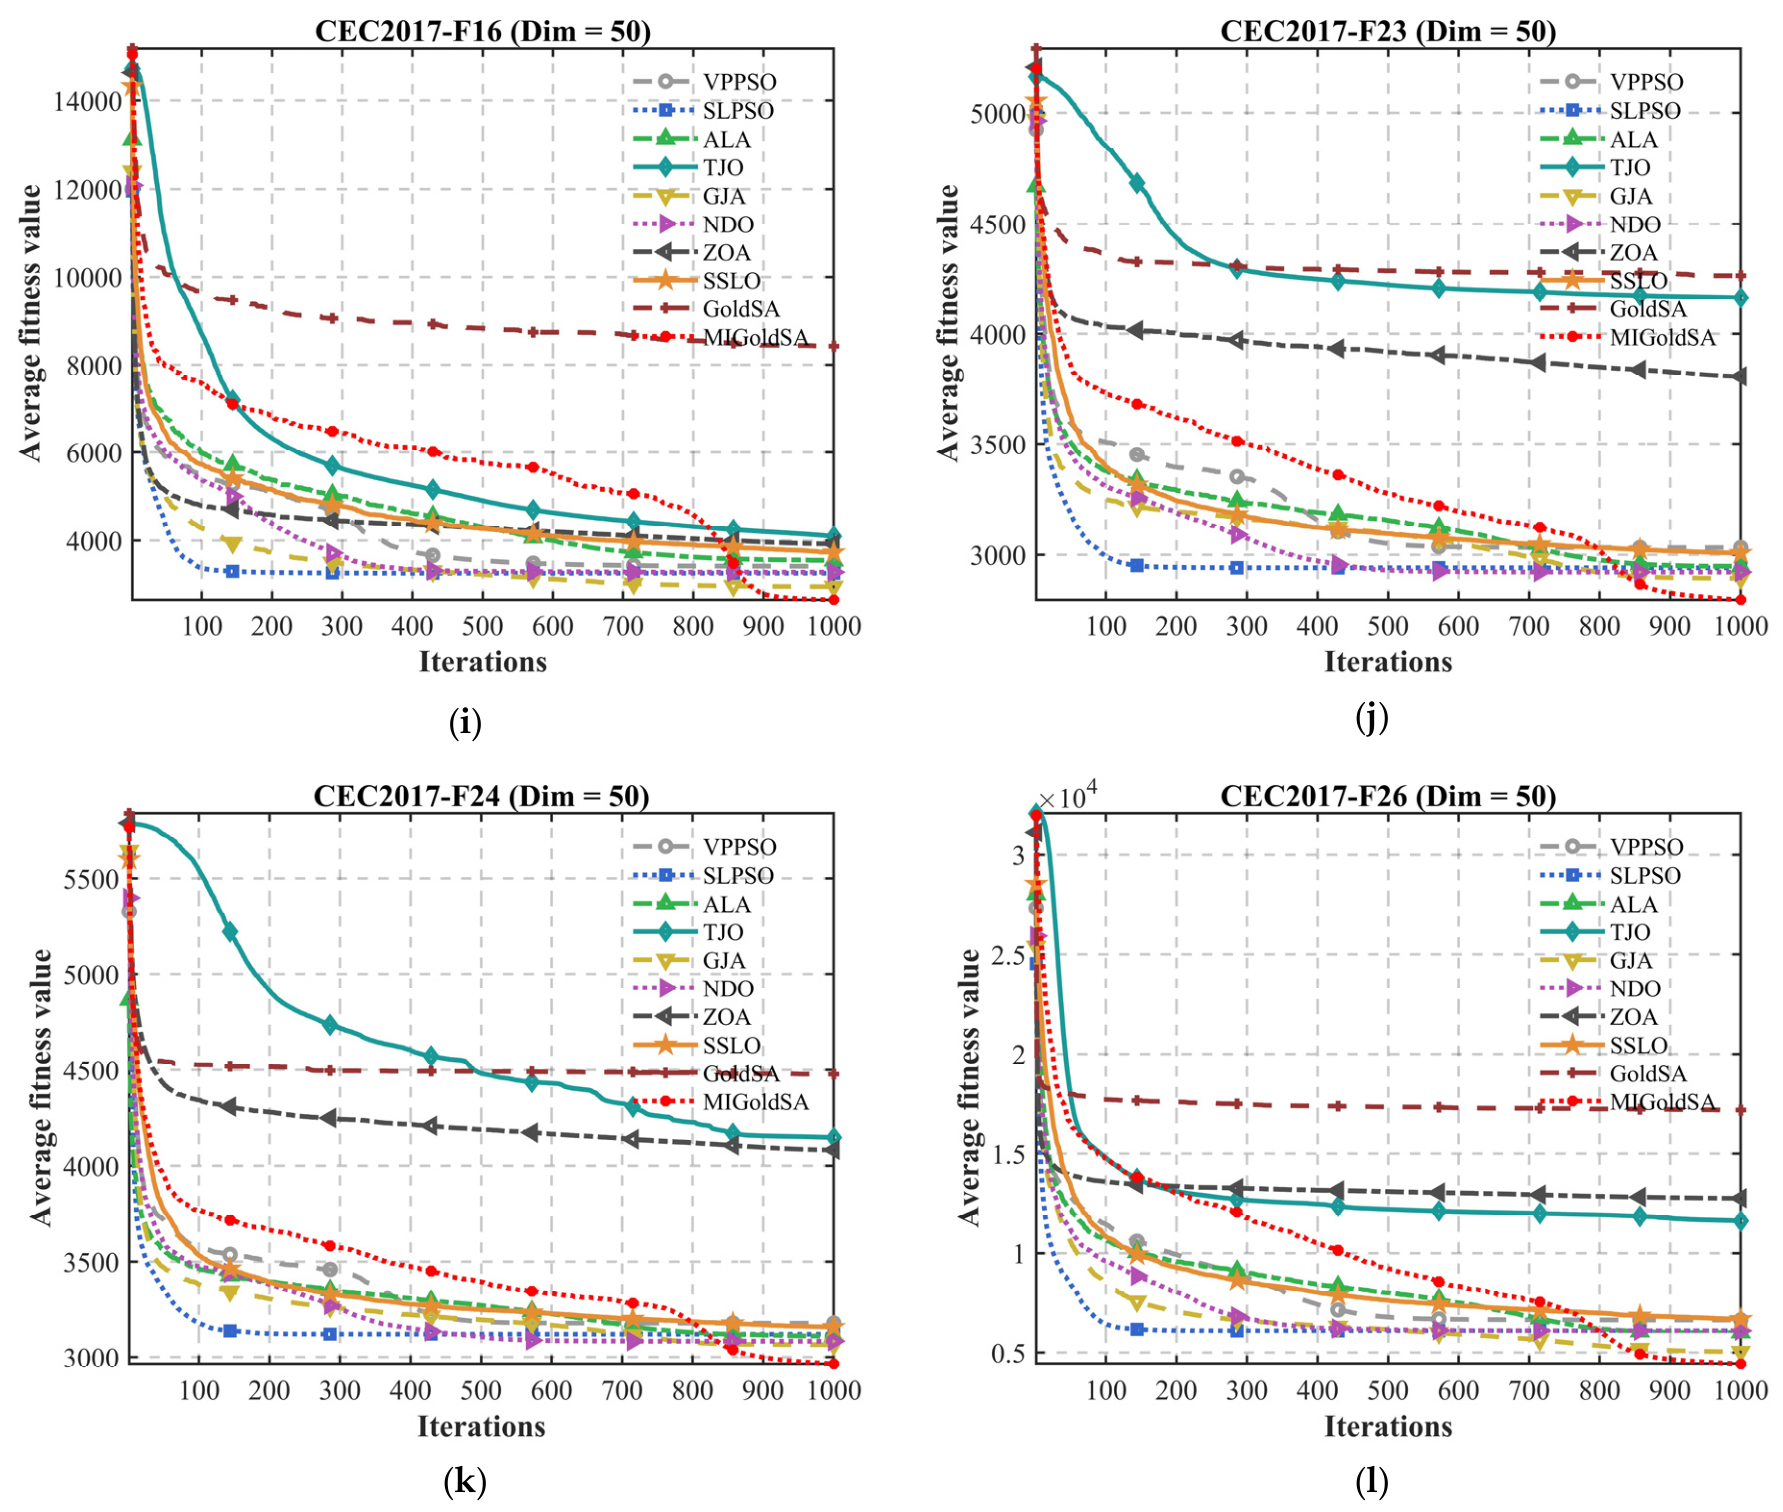
Table 3, where “Mean” and “Std” denote the average value and standard deviation obtained from 30 independent runs, respectively. To more intuitively demonstrate the convergence behavior of different algorithms during the optimization process, the convergence curves of the ten algorithms are illustrated in
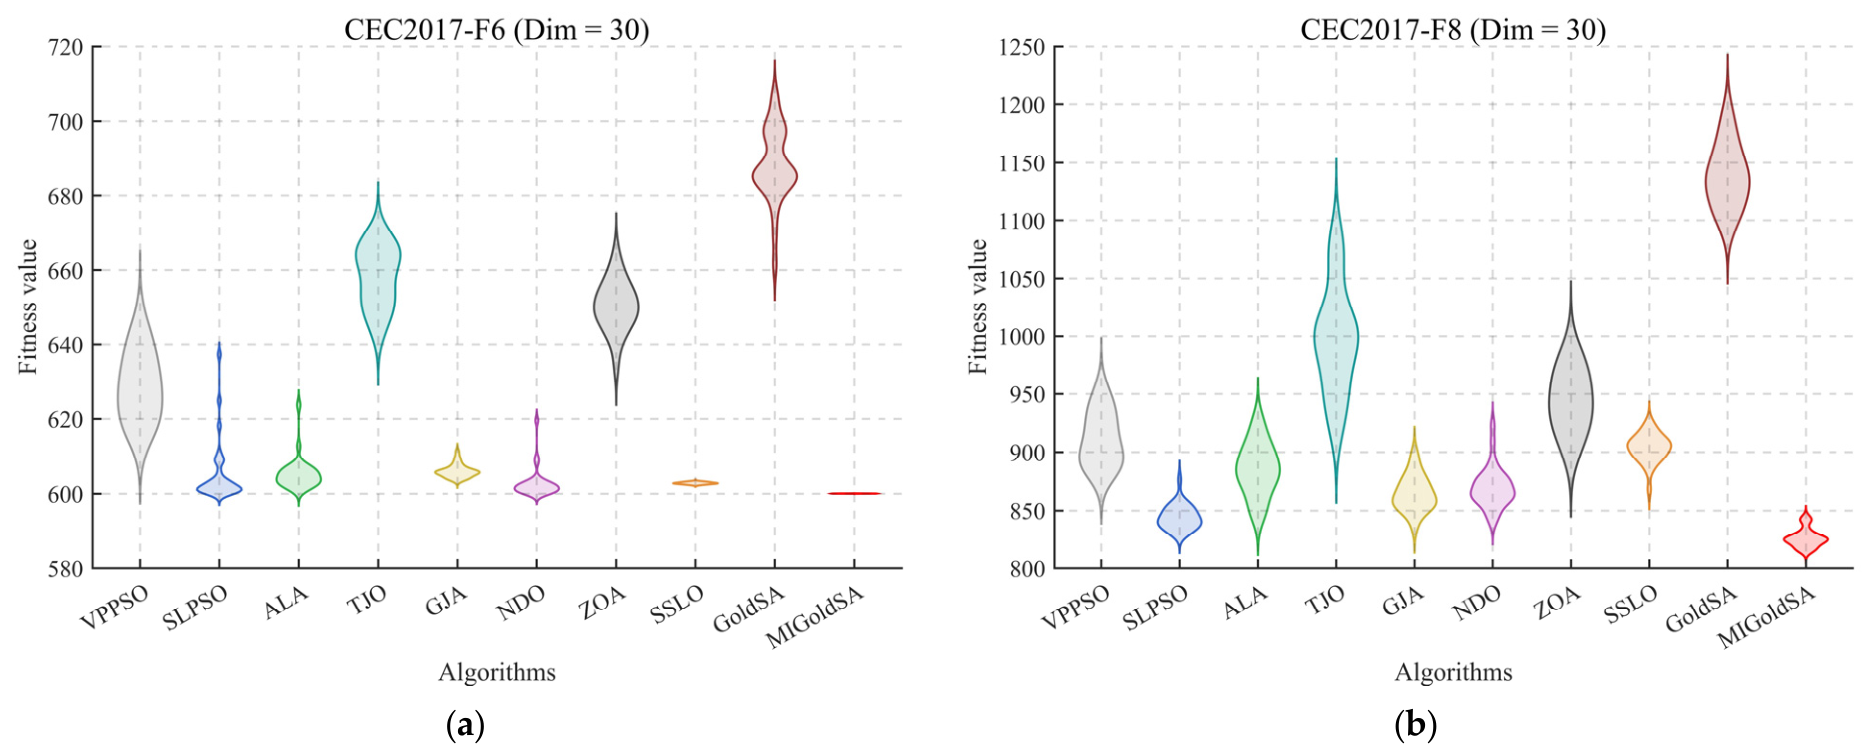
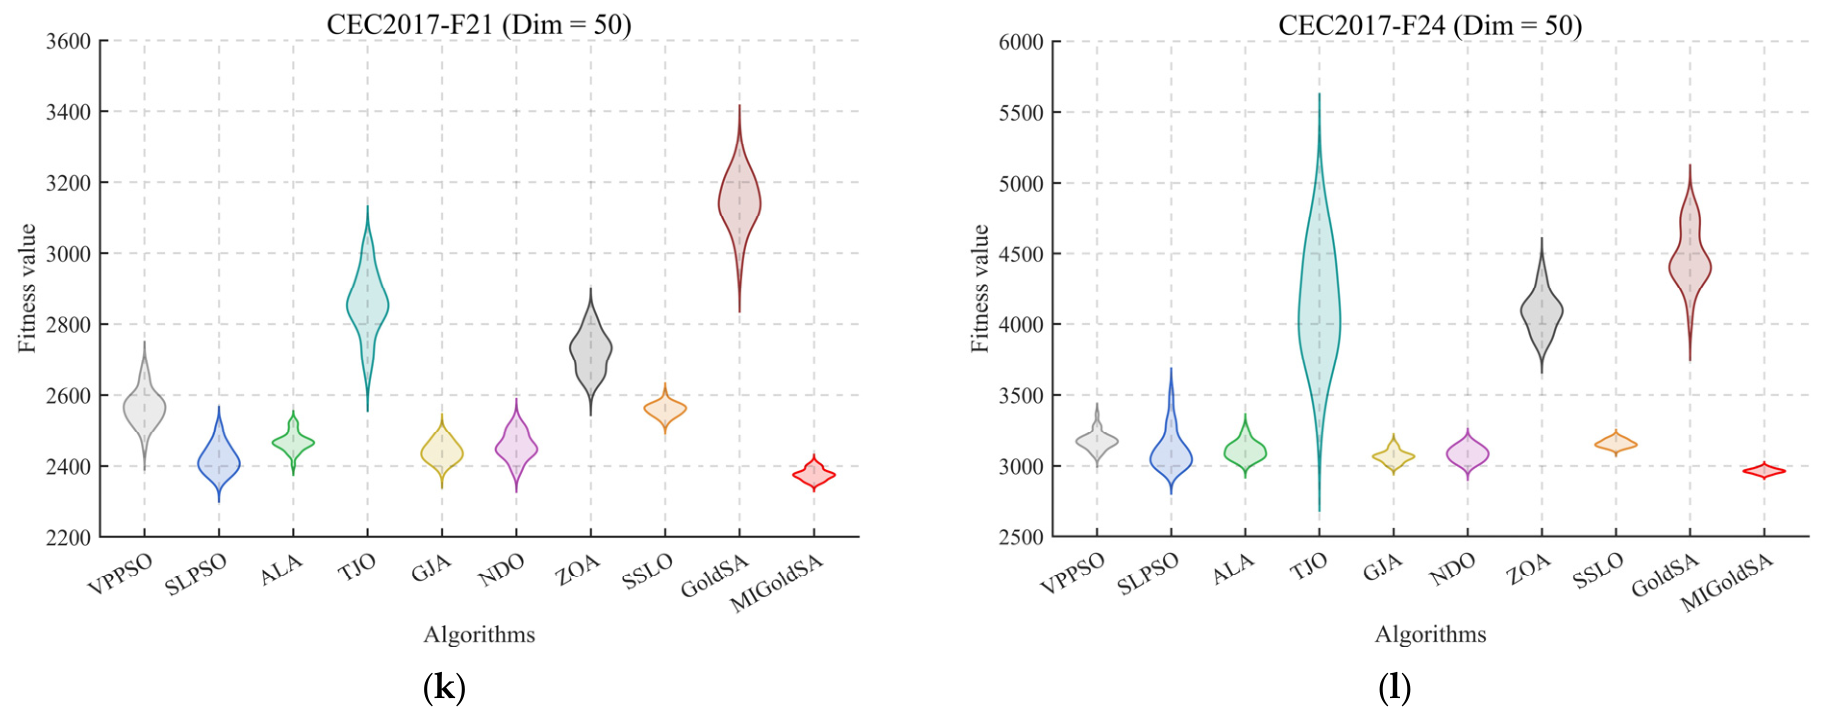
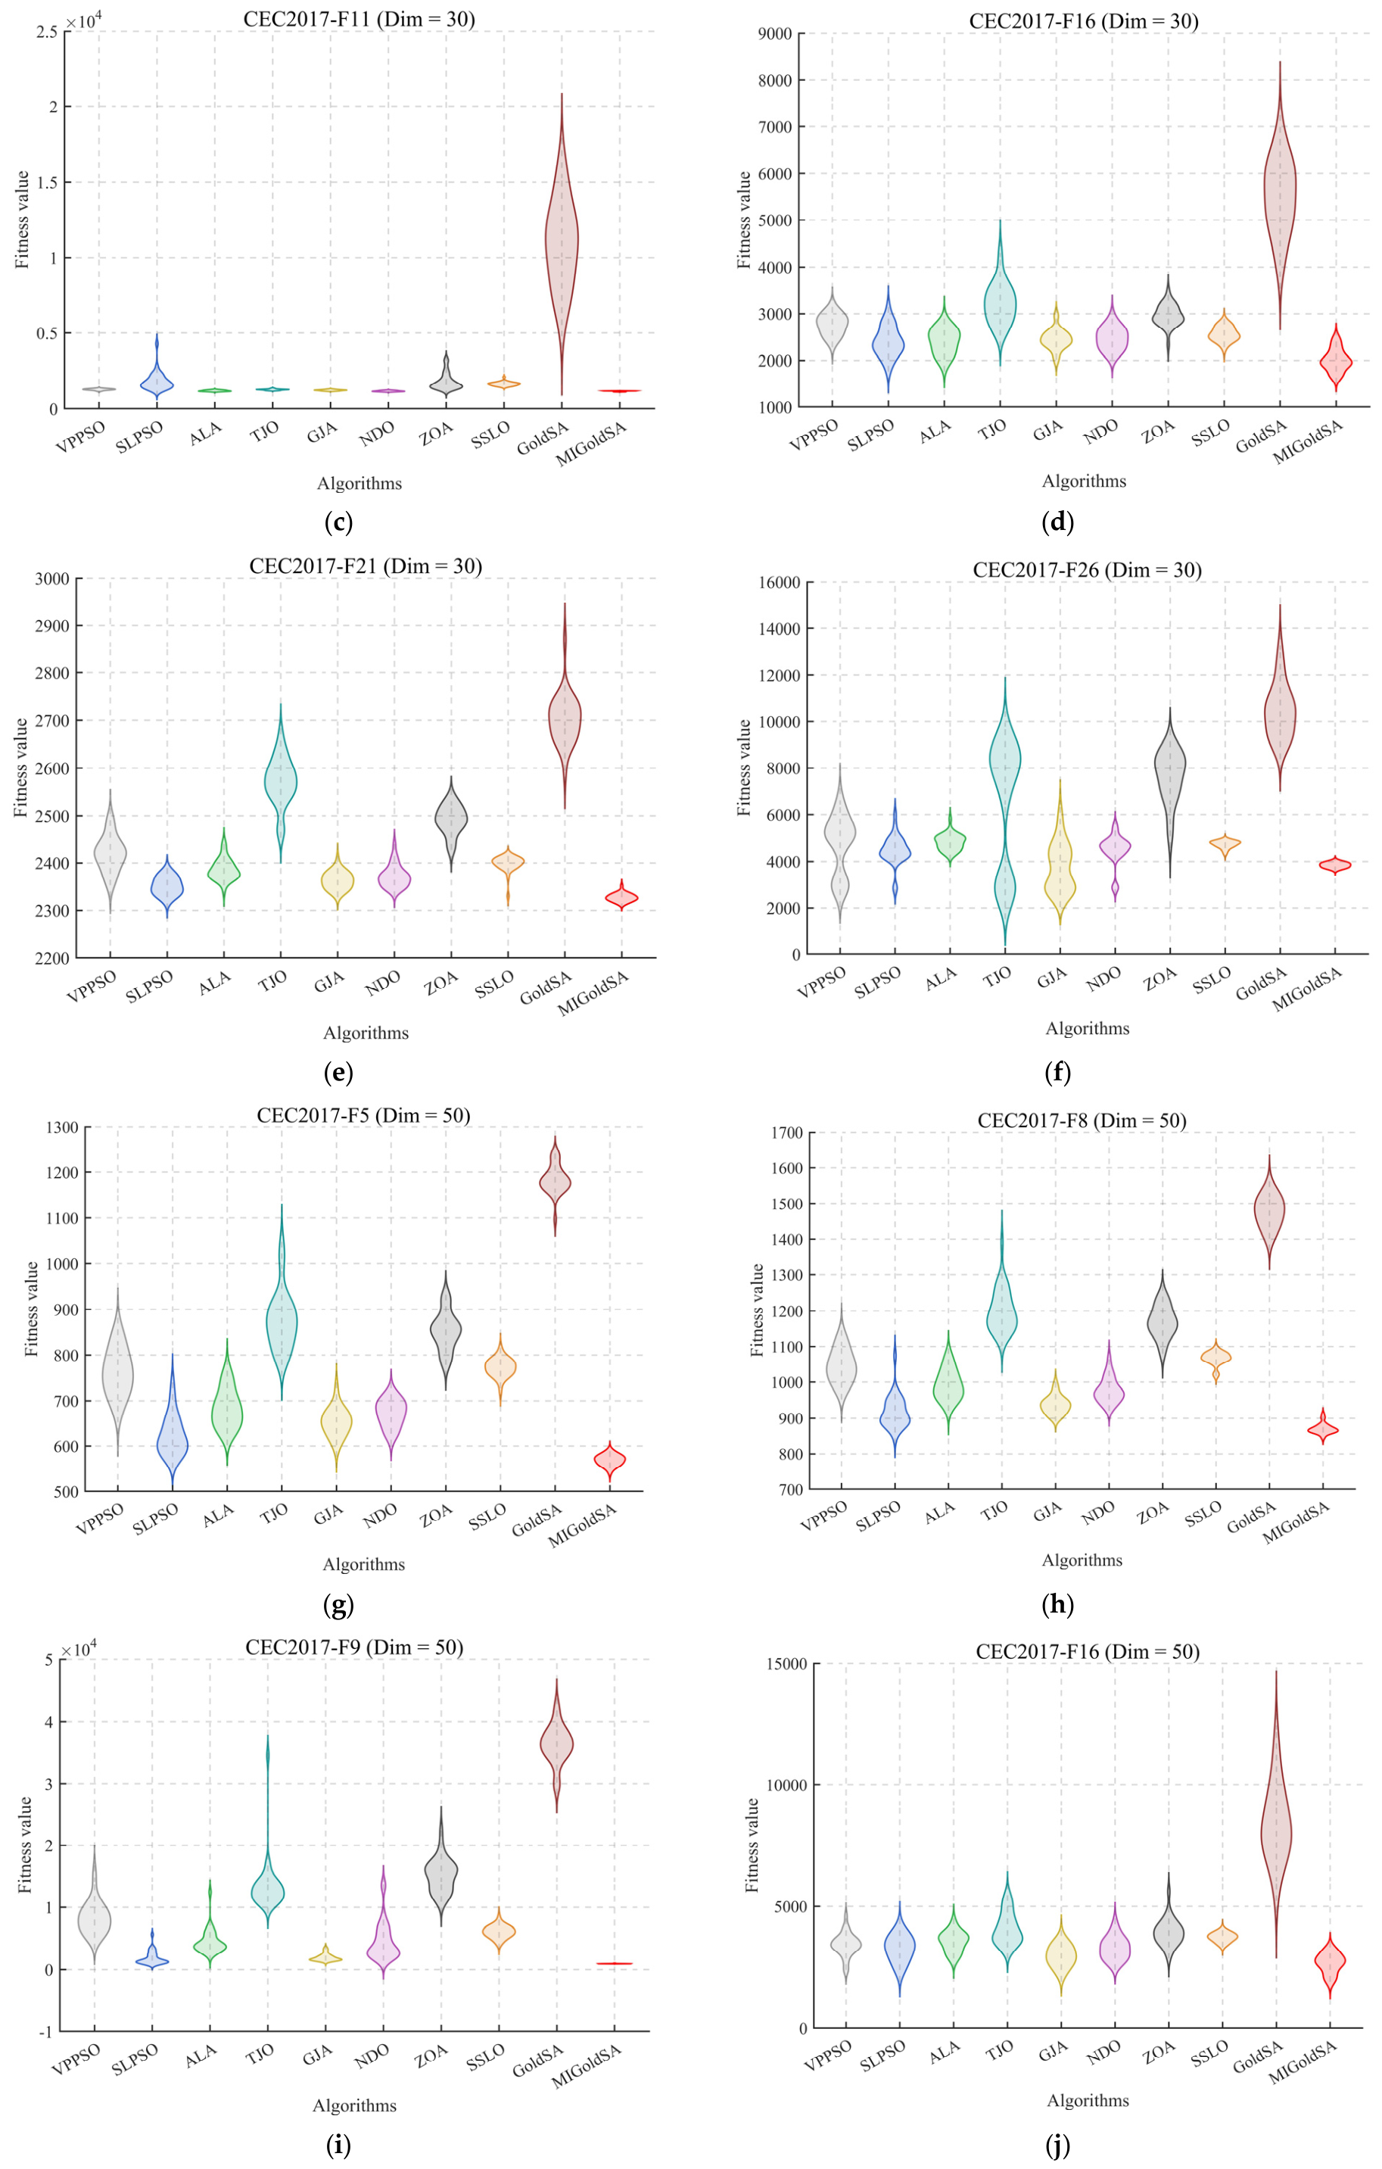
Figure 6. In addition, to further analyze the robustness and stability of the algorithms over multiple independent runs, the boxplot distributions of the experimental results obtained from 30 runs are provided in
Figure 7.
Figure 6 shows that MIGoldSA generally exhibits faster convergence and better final optimization accuracy on the CEC2017 benchmark functions. Compared with the other algorithms, MIGoldSA can continuously reduce the objective value during the iterative process and obtain lower convergence curves on most tested functions. This indicates that the proposed strategies effectively improve the search efficiency of GoldSA and enhance its ability to escape local optima. In particular, MIGoldSA maintains stable convergence trends in both 30-dimensional and 50-dimensional cases, demonstrating good robustness when dealing with higher-dimensional optimization problems. Overall, the convergence results verify that MIGoldSA achieves a better balance between global exploration and local exploitation.
Table 2 and
Table 3 present the performance comparison results of different algorithms on the CEC2017 benchmark functions under 30-dimensional and 50-dimensional settings, respectively. It can be observed that MIGoldSA achieves highly competitive optimization performance on most benchmark functions, especially on complex multimodal, hybrid, and composition functions. Compared with the other algorithms, MIGoldSA generally obtains lower mean values and smaller standard deviations on many test functions, indicating that the proposed algorithm possesses better convergence accuracy, stronger robustness, and more stable optimization capability. In particular, on several difficult functions such as F12–F19 and F23–F30, MIGoldSA demonstrates superior search performance and effectively avoids premature convergence. Furthermore, when the problem dimension increases from 30 to 50, the optimization difficulty of the benchmark functions becomes significantly higher. Nevertheless, MIGoldSA still maintains relatively stable optimization performance and exhibits strong adaptability in high-dimensional search spaces. In contrast, some comparison algorithms experience obvious performance degradation, larger fluctuations, or premature stagnation as the dimensionality increases. This demonstrates that the proposed adaptive chaotic opposition initialization strategy, dynamic elite-guided sine evolution strategy, and Economic Investment Strategy effectively enhance population diversity, strengthen the balance between exploration and exploitation, and improve the global optimization capability of the original GoldSA. Overall, the experimental results further verify the effectiveness, robustness, and superiority of MIGoldSA in solving complex high-dimensional optimization problems.
Figure 7 presents the boxplot analysis results of different algorithms on the CEC2017 benchmark functions. It can be observed that MIGoldSA generally exhibits narrower box ranges and fewer outliers on most benchmark functions compared with the other algorithms. This indicates that the proposed algorithm possesses better stability and stronger robustness during repeated independent runs. In addition, the median values of MIGoldSA are lower than those of most comparison algorithms, further demonstrating its superior optimization accuracy and convergence capability.
Moreover, the distribution of MIGoldSA results is more concentrated, especially on complex multimodal and hybrid functions, indicating that the proposed strategies effectively maintain population diversity and reduce the influence of random fluctuations during the optimization process. In contrast, several comparison algorithms exhibit wider box distributions and larger fluctuations, suggesting weaker stability and a higher risk of falling into local optima. Overall, the boxplot analysis further verifies that MIGoldSA achieves a better balance between exploration and exploitation and demonstrates excellent reliability and robustness in solving complex optimization problems.
5.4. Performance Evaluation on the CEC2022 Benchmark Functions
In this section, the optimization performance of MIGoldSA is evaluated on the 10-dimensional and 20-dimensional CEC2022 benchmark functions and compared with nine advanced state-of-the-art optimization algorithms. The corresponding experimental results are presented in
Table 4 and
Table 5, where “mean” and “std” denote the average value and standard deviation obtained from 30 independent runs, respectively. To more intuitively demonstrate the convergence behavior of different algorithms during the optimization process, the convergence curves of the ten algorithms are illustrated in
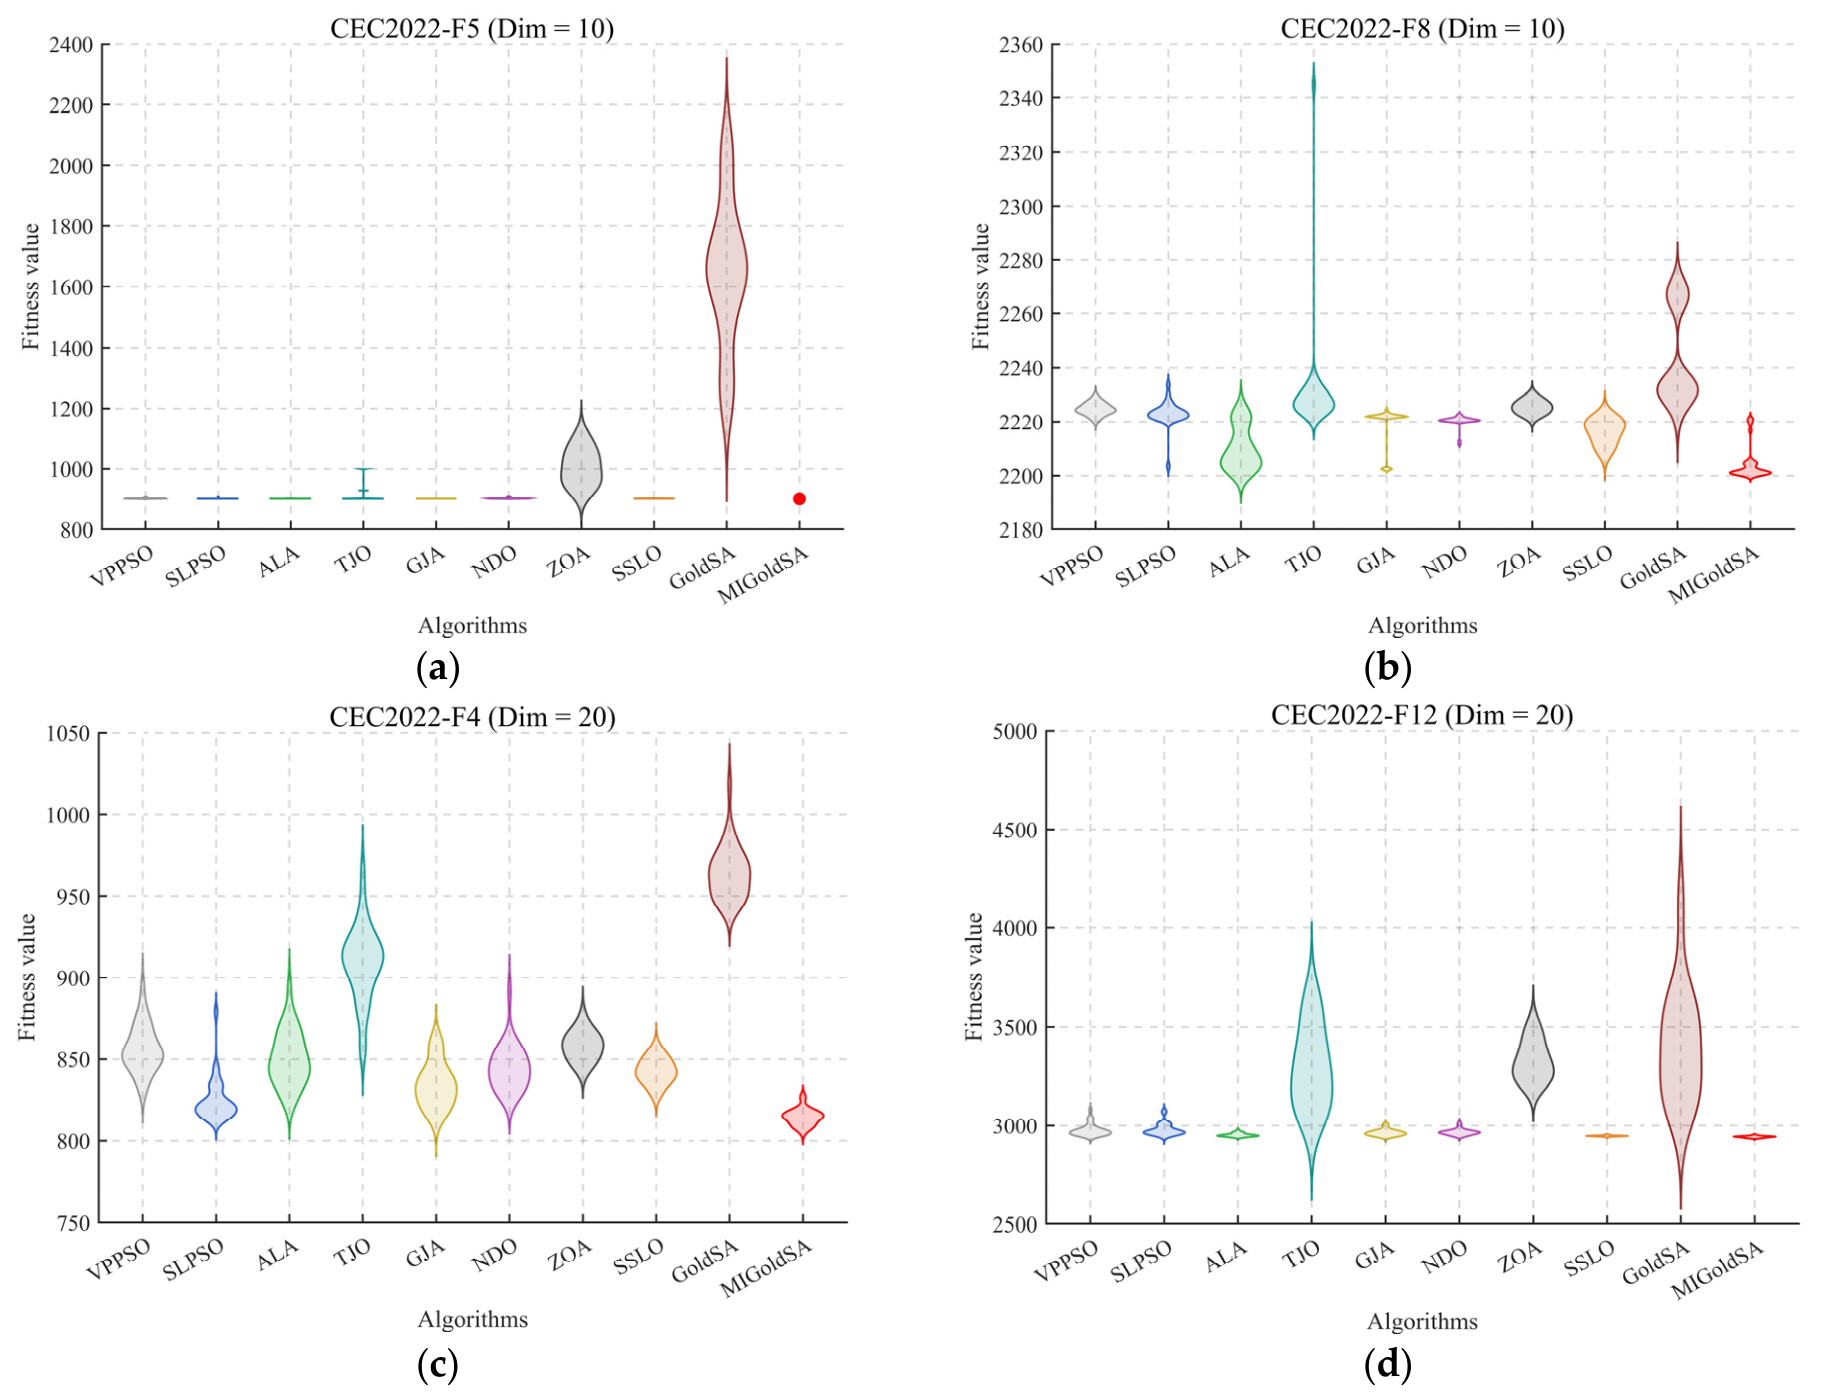
Figure 8. In addition, to further analyze the robustness and stability of the algorithms over multiple independent runs, the boxplot distributions of the experimental results obtained from 30 runs are provided in
Figure 9.
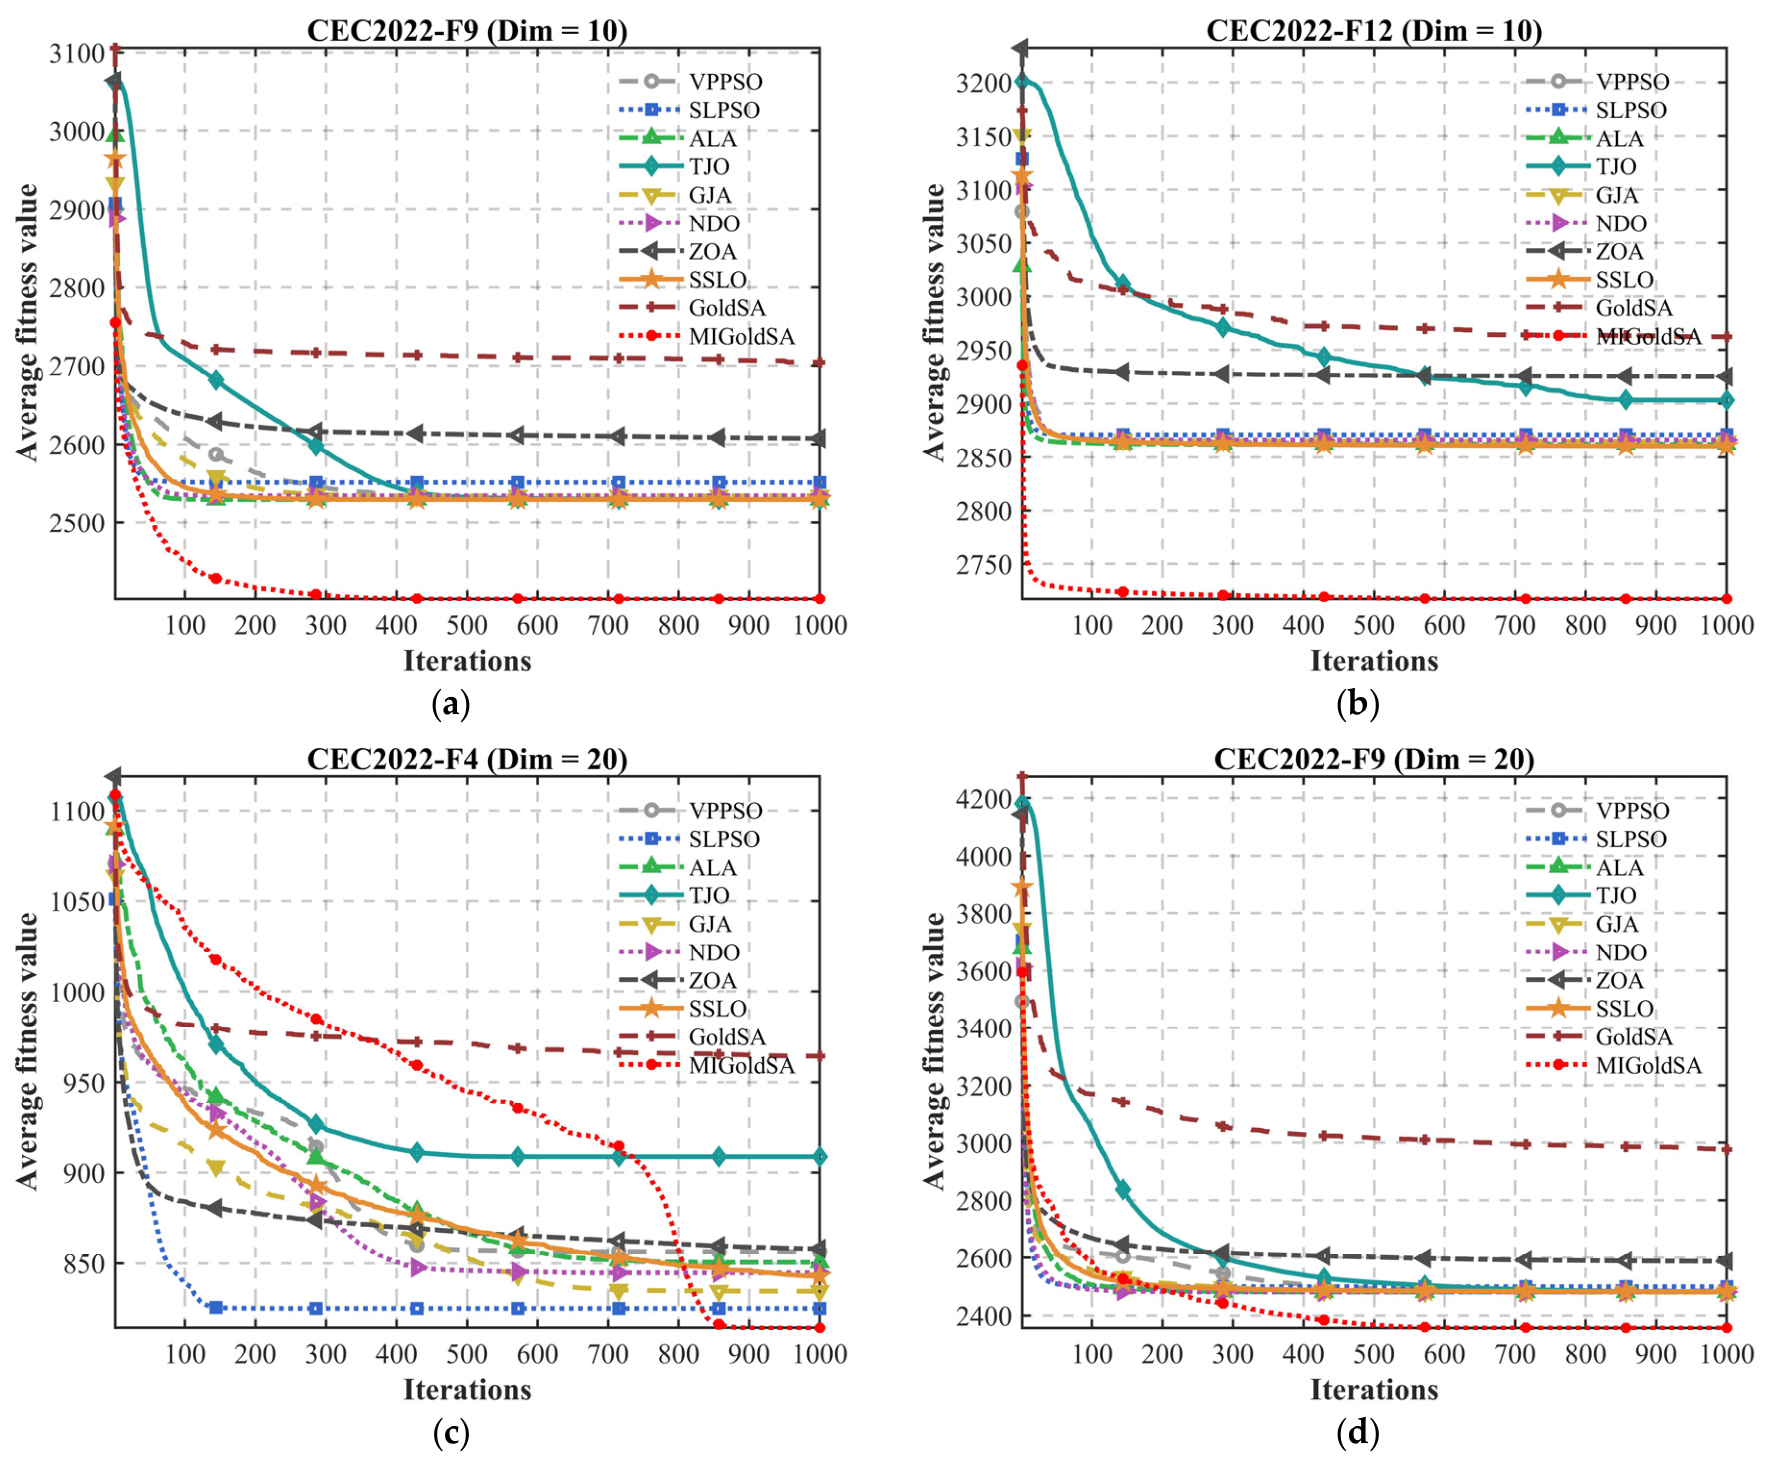
Figure 8 illustrates the convergence behavior of different algorithms on the CEC2022 benchmark functions. It can be observed that MIGoldSA demonstrates faster convergence speed and better optimization accuracy on most benchmark functions compared with the other algorithms. During the early optimization stage, MIGoldSA can rapidly reduce the objective values, indicating that the proposed initialization and exploration strategies effectively improve the global search capability of the algorithm. Meanwhile, in the later optimization stage, MIGoldSA still maintains continuous convergence trends and achieves lower final fitness values, demonstrating strong local exploitation capability and high convergence precision. In addition, MIGoldSA exhibits relatively stable convergence performance on complex multimodal and composition functions in the CEC2022 test suite. Compared with several comparison algorithms that suffer from premature convergence or stagnation during iterations, MIGoldSA can effectively avoid falling into local optima and maintain superior search capability throughout the optimization process. This indicates that the proposed adaptive chaotic opposition initialization strategy, dynamic elite-guided sine evolution strategy, and Economic Investment Strategy collaboratively enhance the balance between exploration and exploitation. Overall, the convergence results on the CEC2022 benchmark functions further verify the effectiveness, robustness, and optimization superiority of the proposed MIGoldSA algorithm in solving complex high-dimensional optimization problems.
Table 4 and
Table 5 present the performance comparison results of different algorithms on the CEC2022 benchmark functions under 10-dimensional and 20-dimensional settings, respectively. It can be observed that MIGoldSA achieves highly competitive optimization results on most benchmark functions and generally obtains lower mean values and smaller standard deviations compared with the other algorithms. These results indicate that the proposed algorithm possesses strong optimization capability, good convergence accuracy, and stable search performance on the CEC2022 benchmark suite. In particular, on several complex multimodal and hybrid functions, MIGoldSA demonstrates superior ability to avoid local optima and maintain stable convergence behavior during repeated independent runs. Furthermore, when the problem dimension increases from 10 to 20, the optimization difficulty of the benchmark functions becomes more challenging. Nevertheless, MIGoldSA still maintains relatively stable optimization performance and exhibits strong adaptability in higher-dimensional search spaces. Compared with several comparison algorithms that experience obvious performance degradation or larger fluctuations as dimensionality increases, MIGoldSA continues to achieve competitive optimization results on most benchmark functions. This demonstrates that the proposed adaptive chaotic opposition initialization strategy, dynamic elite-guided sine evolution strategy, and Economic Investment Strategy effectively enhance population diversity, strengthen the balance between exploration and exploitation, and improve the robustness of the original GoldSA. Overall, the experimental results on the CEC2022 benchmark functions further verify the effectiveness and superiority of MIGoldSA in solving complex high-dimensional optimization problems.
Figure 9 presents the boxplot analysis results of different algorithms on the CEC2022 benchmark functions. It can be observed that MIGoldSA generally achieves narrower box distributions and lower median values on most benchmark functions compared with the other algorithms. This indicates that the proposed algorithm possesses stronger stability, higher optimization accuracy, and better robustness during repeated independent runs. In particular, the relatively concentrated distribution of MIGoldSA demonstrates that the algorithm can consistently obtain high-quality solutions with smaller performance fluctuations. Furthermore, compared with several comparison algorithms that exhibit wider box ranges and more outliers, MIGoldSA maintains more stable optimization behavior on complex multimodal and composition functions. This suggests that the proposed strategies effectively improve population diversity and reduce the probability of premature convergence during the optimization process. As the complexity of the CEC2022 benchmark functions increases, MIGoldSA still maintains good search consistency and convergence reliability, further verifying its superior capability in balancing global exploration and local exploitation. Overall, the boxplot analysis on the CEC2022 benchmark functions further confirms the effectiveness and robustness of the proposed MIGoldSA algorithm in solving complex optimization problems.
5.5. Statistical Analysis
To further investigate whether the performance differences among the compared algorithms are statistically significant, a comprehensive statistical analysis of MIGoldSA is conducted in this section. Specifically, two widely used nonparametric statistical methods, namely the Wilcoxon Signed-Rank Test and the Friedman Mean Rank Test, are employed to evaluate the superiority and robustness of the proposed algorithm. The detailed analyses are presented as follows:
5.5.1. Wilcoxon Signed Rank Test
The Wilcoxon Signed-Rank Test is a widely used nonparametric statistical method for evaluating the performance differences between optimization algorithms. Compared with traditional parametric statistical tests, the Wilcoxon Signed-Rank Test does not require the experimental data to satisfy normal distribution assumptions, making it particularly suitable for analyzing the stochastic results generated by metaheuristic algorithms. Due to the randomness and uncertainty inherent in heuristic optimization processes, this test has been extensively adopted in the literature to determine whether the performance differences among optimization algorithms are statistically significant. Therefore, in this subsection, the Wilcoxon Signed-Rank Test is employed to statistically evaluate the optimization performance of MIGoldSA and further verify the effectiveness and superiority of the proposed algorithm [
34]. The experimental results are shown below.
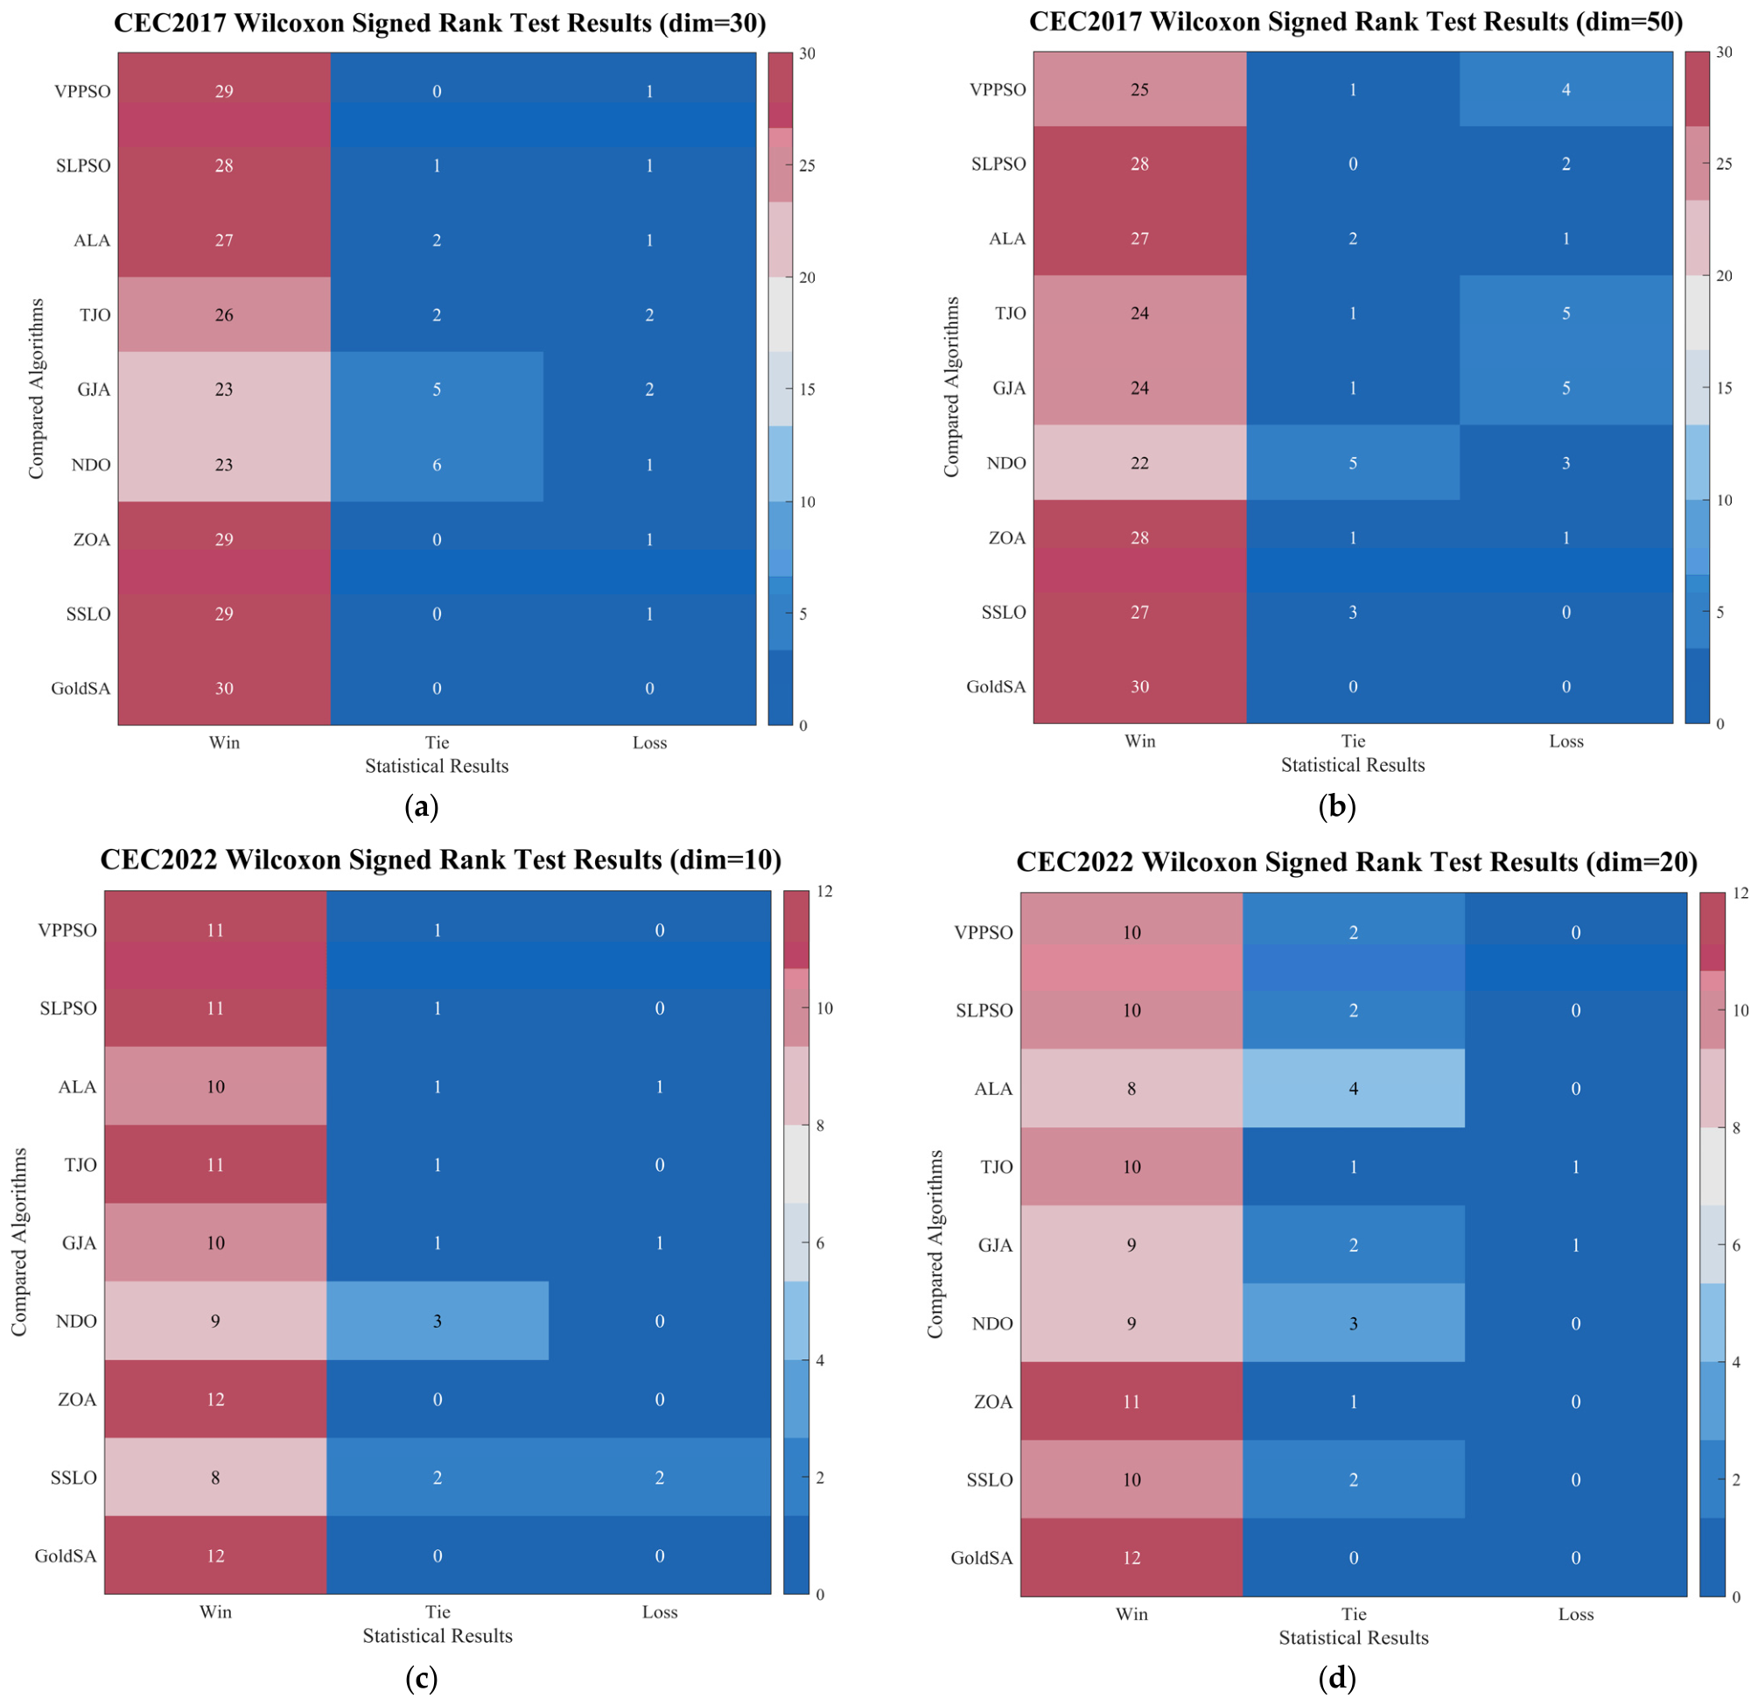
Figure 10 presents the Wilcoxon Signed-Rank Test results of MIGoldSA compared with the other state-of-the-art algorithms on the benchmark functions. It can be observed that MIGoldSA achieves a larger number of wins against most comparison algorithms on both the CEC2017 and CEC2022 benchmark suites. This indicates that the optimization performance improvements achieved by MIGoldSA are statistically significant rather than being caused by random fluctuations. In particular, MIGoldSA demonstrates clear advantages over several traditional and recently proposed optimization algorithms on complex multimodal and hybrid benchmark functions. Furthermore, the relatively small numbers of losses and ties further verify the robustness and effectiveness of the proposed algorithm. The statistical results demonstrate that the proposed adaptive chaotic opposition initialization strategy, dynamic elite-guided sine evolution strategy, and Economic Investment Strategy effectively improve the search capability and convergence stability of the original GoldSA. Overall, the Wilcoxon Signed-Rank Test results confirm that MIGoldSA possesses superior optimization performance and strong statistical reliability in solving complex optimization problems.
5.5.2. Friedman Mean Rank Test
The Friedman Mean Rank Test is a widely used nonparametric statistical analysis method for evaluating the overall performance differences among multiple optimization algorithms across multiple benchmark problems. Unlike traditional parametric statistical methods, the Friedman Mean Rank Test does not require the experimental results to satisfy normal distribution assumptions, making it particularly suitable for analyzing the stochastic optimization results produced by metaheuristic algorithms. By calculating the average ranking of each algorithm on different benchmark functions, the Friedman Mean Rank Test can comprehensively reflect the relative optimization performance and robustness of competing algorithms. Due to its effectiveness and reliability in statistical performance evaluation, this test has been extensively adopted in the field of swarm intelligence and evolutionary optimization. Therefore, in this subsection, the Friedman Mean Rank Test is employed to further evaluate the optimization performance of the proposed MIGoldSA algorithm and verify its superiority compared with other state-of-the-art optimization algorithms [
35]. The experimental results are shown below.
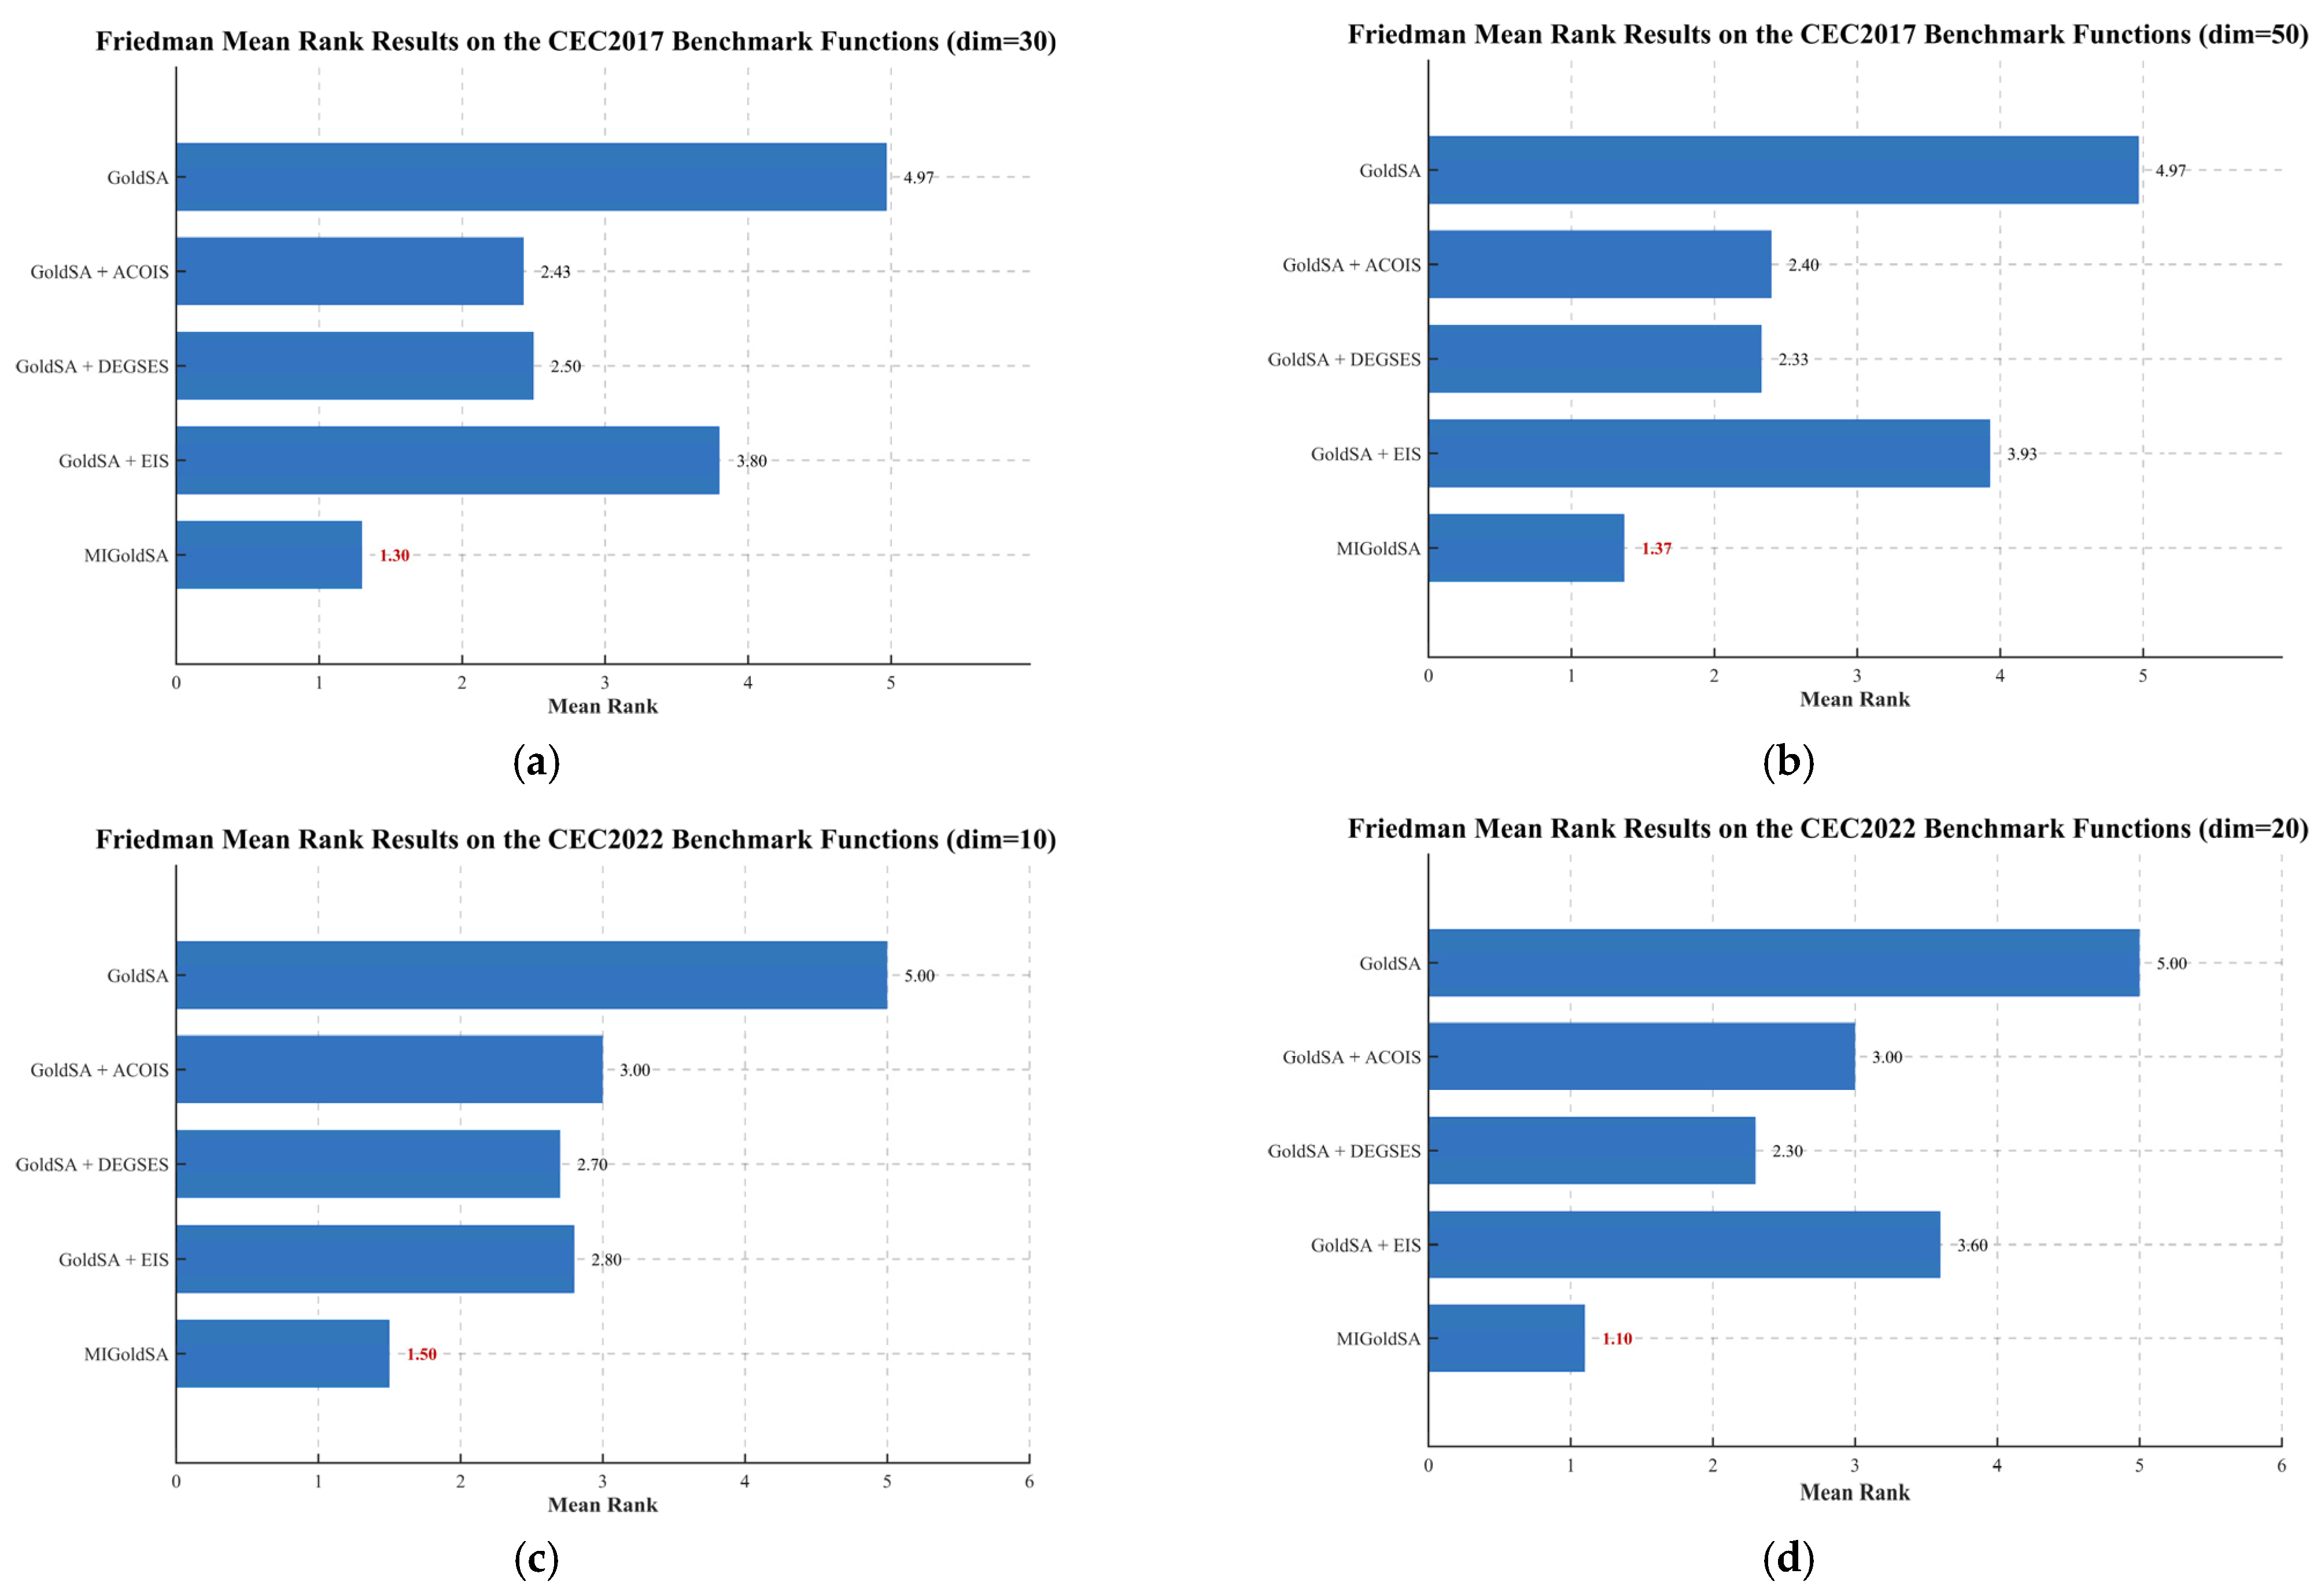
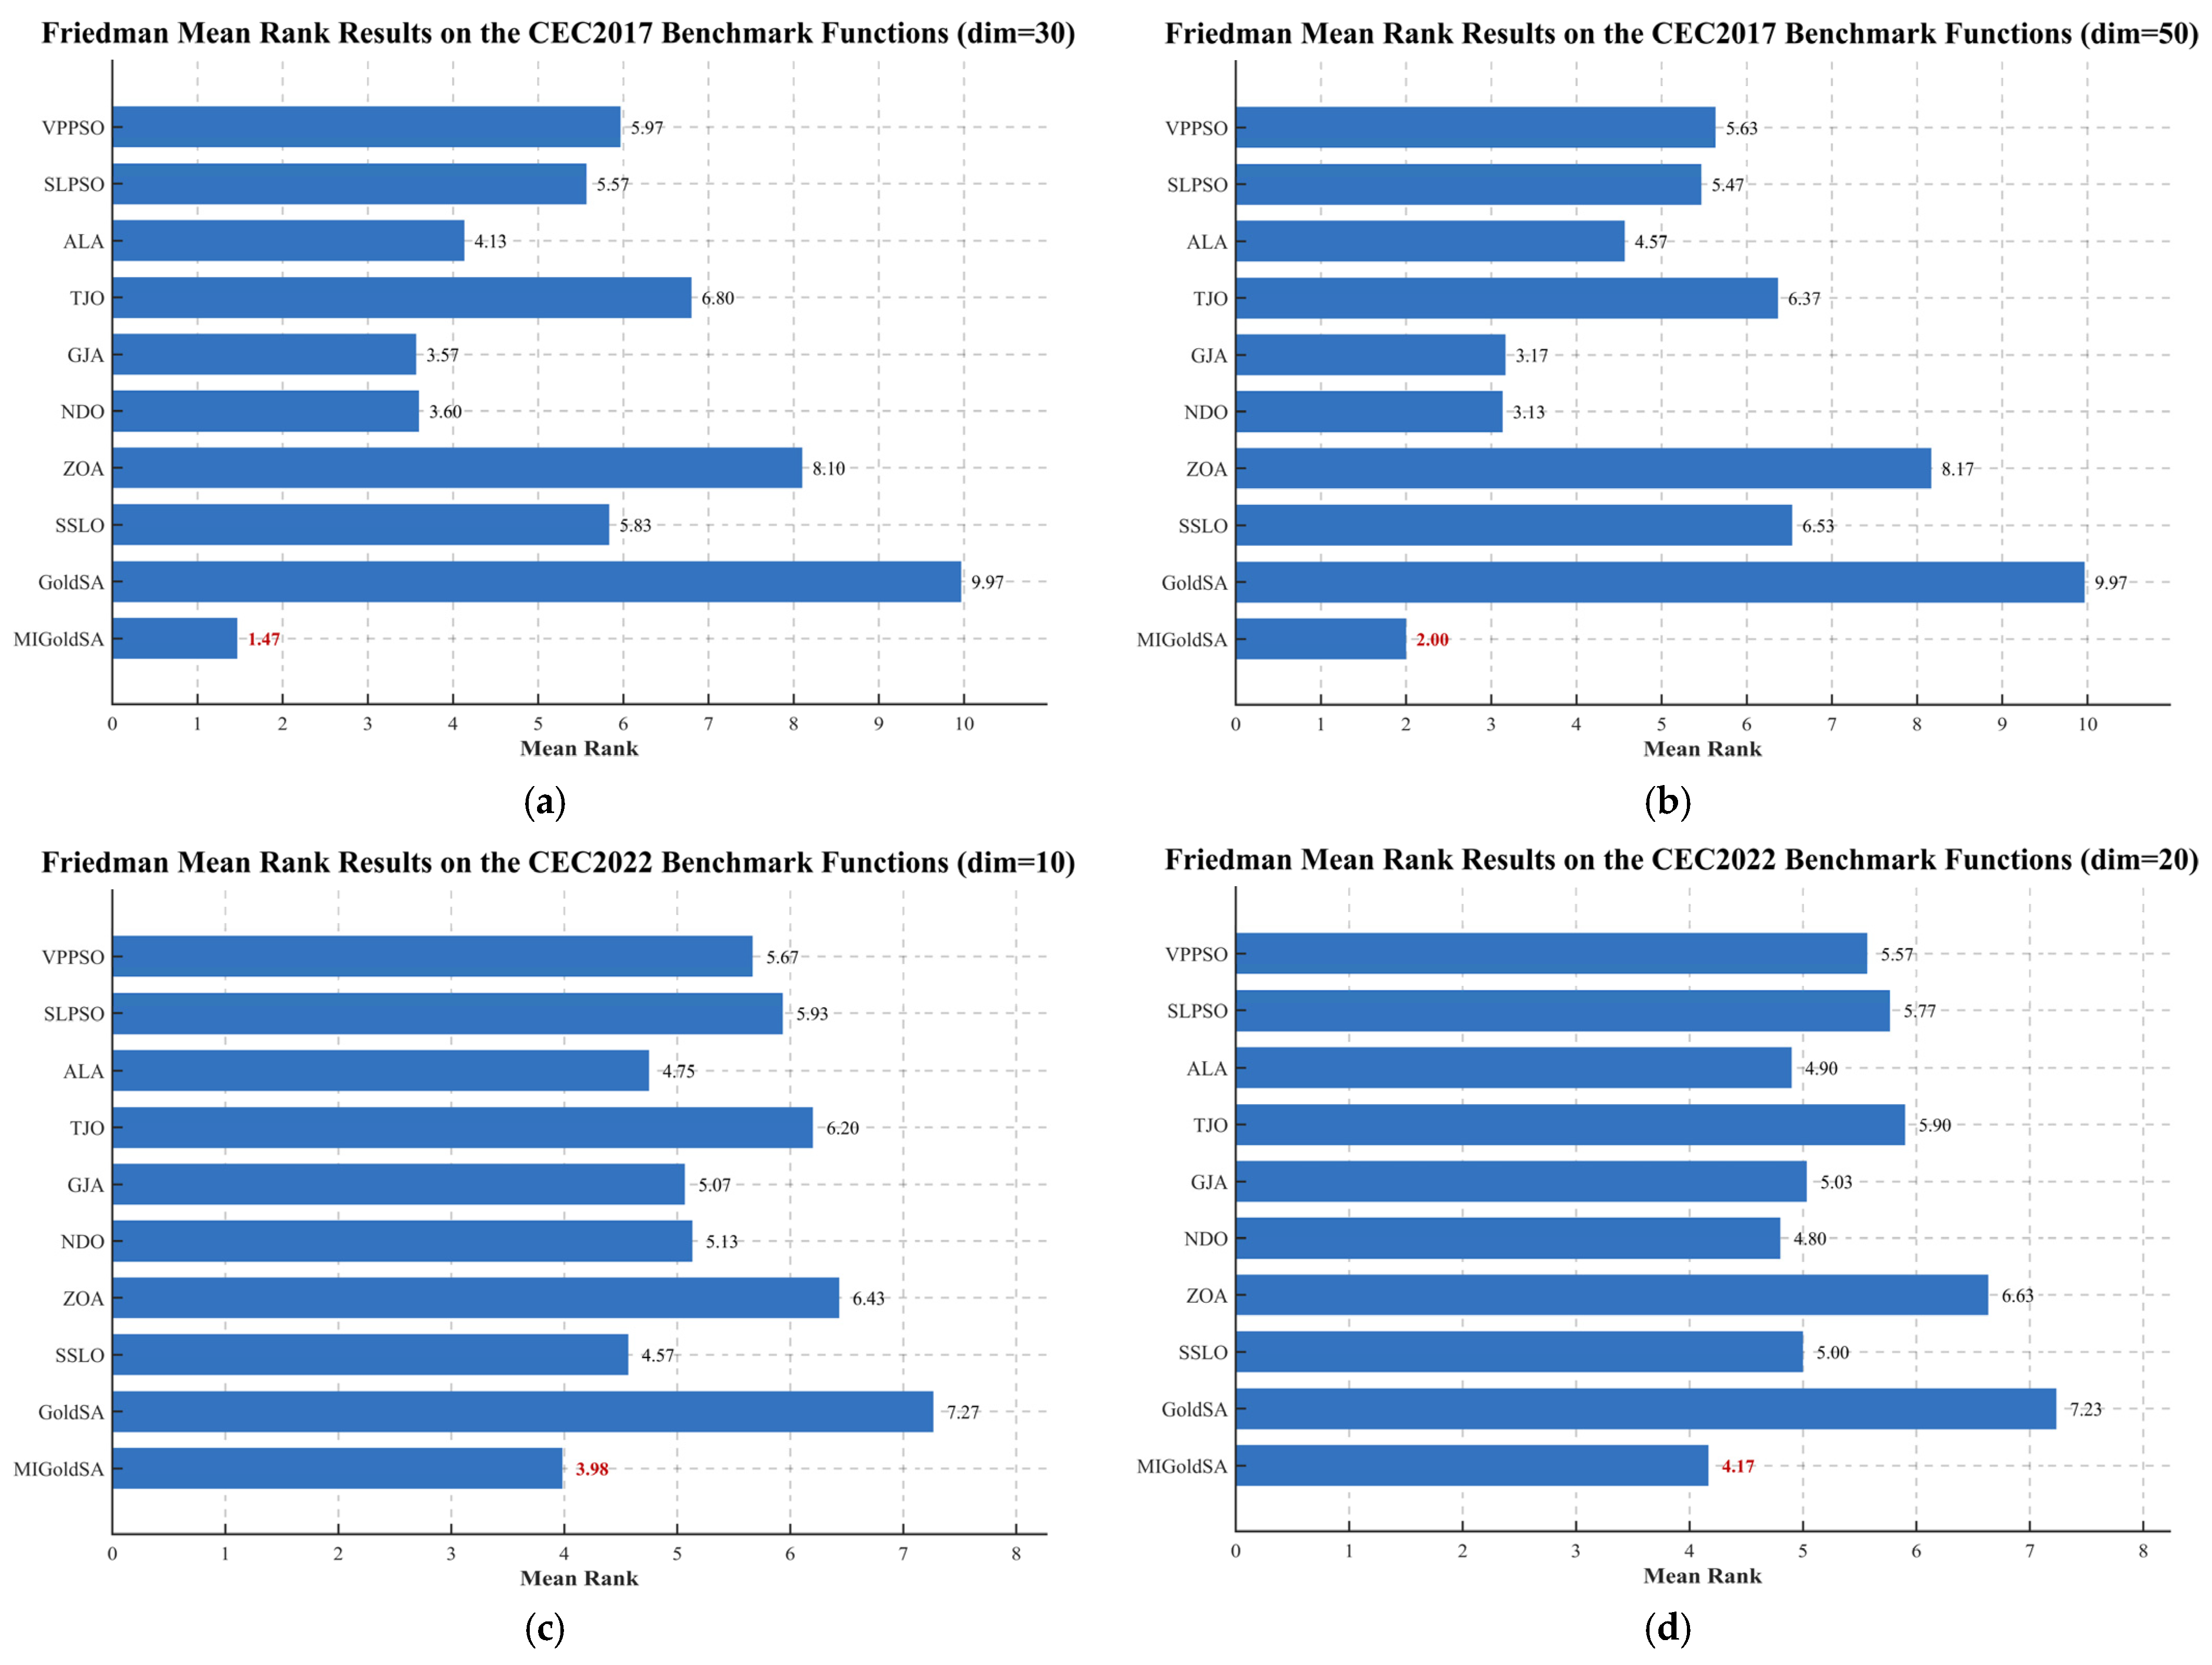
Figure 11 presents the Friedman Mean Rank Test results of different algorithms on the CEC2017 and CEC2022 benchmark functions. It can be observed that MIGoldSA achieves the best or highly competitive average ranking among all comparison algorithms, indicating that the proposed algorithm demonstrates superior overall optimization performance across different benchmark functions and dimensional settings. Compared with the other algorithms, MIGoldSA maintains more stable ranking performance on both simple and complex optimization problems, which further verifies its strong robustness and adaptability in various search environments.
In addition, the Friedman ranking results demonstrate that MIGoldSA achieves a better balance between global exploration and local exploitation throughout the optimization process. Benefiting from the adaptive chaotic opposition initialization strategy, dynamic elite-guided sine evolution strategy, and Economic Investment Strategy, the proposed algorithm can effectively improve population diversity, accelerate convergence speed, and reduce the probability of premature convergence. Overall, the Friedman Mean Rank Test results further confirm the effectiveness, stability, and superiority of MIGoldSA in solving complex high-dimensional optimization problems.
5.6. Ablation Experiment Study
Ablation experiments are essential for evaluating the effectiveness and contribution of each improvement strategy in an enhanced metaheuristic algorithm. Although the overall performance of an improved algorithm can be verified through comparisons with other algorithms, it is still necessary to further investigate whether each proposed mechanism plays a positive role in improving optimization accuracy, convergence speed, population diversity, and robustness. By removing or independently combining different strategies, the contribution of each component to the final optimization performance can be clearly analyzed, thereby demonstrating that the performance improvement is not obtained by chance but results from the coordinated effect of the proposed mechanisms. Therefore, in this subsection, ablation experiments are conducted on the proposed MIGoldSA to verify the effectiveness of its key improvement strategies and to further analyze their individual and combined impacts on algorithm performance. The experimental results are shown below.
Figure 12 presents the Friedman mean rank results of the ablation experiments on the CEC2017 and CEC2022 benchmark functions. It can be observed that all single-strategy variants achieve lower mean ranks than the original GoldSA, indicating that each proposed strategy has a positive contribution to the improvement of optimization performance. On the CEC2017 benchmark functions, the original GoldSA obtains the worst mean rank of 4.97 under both 30-dimensional and 50-dimensional settings. After introducing the adaptive chaotic opposition initialization strategy, dynamic elite-guided sine evolution strategy, and Economic Investment Strategy separately, the mean ranks are reduced to 2.43, 2.50, and 3.80 for Dim = 30, and 2.40, 2.33, and 3.93 for Dim = 50, respectively. These results show that ACOIS and DEGSES provide more evident improvements on CEC2017, while EIS also contributes to performance enhancement compared with the original GoldSA. For the CEC2022 benchmark functions, the mean rank of GoldSA is 5.00 in both Dim = 10 and Dim = 20 cases, whereas the single-strategy variants obtain better ranks. In particular, DEGSES achieves the best performance among the single-strategy variants, with mean ranks of 2.70 and 2.30 under Dim = 10 and Dim = 20, respectively, suggesting that the dynamic multi-elite guidance mechanism is especially helpful for improving the search behavior on more complex benchmark functions. More importantly, the complete MIGoldSA consistently achieves the best mean rank in all four experimental settings, with values of 1.30, 1.37, 1.50, and 1.10, respectively. Compared with the original GoldSA, the mean rank of MIGoldSA is reduced by approximately 73.84%, 72.43%, 70.00%, and 78.00%, respectively. These results demonstrate that the performance improvement of MIGoldSA is not only obtained from a single strategy, but also from the complementary cooperation among the three strategies. Therefore, the ablation experiment results verify the effectiveness of ACOIS, DEGSES, and EIS, and further confirm that their integration can enhance the overall optimization capability and robustness of the original GoldSA.
6. MIGoldSA for Cloud Task Scheduling
To further verify the effectiveness and practical applicability of the proposed MIGoldSA algorithm, this section applies MIGoldSA to the cloud computing task scheduling problem. Cloud task scheduling is a typical large-scale combinatorial optimization problem, whose objective is to reasonably allocate computational tasks to different virtual machines in order to optimize overall system performance. In practical cloud computing environments, task scheduling usually involves multiple conflicting optimization objectives, such as execution time, load balancing, and execution cost. Therefore, a multi-objective cloud task scheduling model is constructed in this section, and MIGoldSA is employed to solve the corresponding optimization problem [
17,
18,
36,
37]. The detailed modeling process is described as follows.
6.1. Cloud Computing Task Scheduling Model
Cloud computing task scheduling is one of the core technologies in cloud resource management systems. Its fundamental purpose is to efficiently allocate large-scale computational tasks to available virtual machine resources according to specific optimization objectives, thereby improving resource utilization, reducing execution overhead, and enhancing system service quality. In cloud computing environments, efficient task scheduling can effectively alleviate resource congestion, improve system throughput, and optimize the overall operational efficiency of cloud platforms.
Assume that the cloud computing environment contains
virtual machines and
computational tasks. The virtual machine set and task set can be respectively defined as:
where
represents the set of virtual machine resource nodes;
denotes the set of cloud computing tasks;
and
denote the numbers of virtual machines and tasks, respectively.
In the cloud task scheduling problem, each task needs to be assigned to one virtual machine for execution. The scheduling relationship between tasks and virtual machines can be represented by the following allocation matrix:
where
. The resource attributes of each virtual machine mainly include computational capability, storage capacity, and communication bandwidth. Therefore, the resource characteristics of the
-th virtual machine can be expressed as:
where
denotes the computational processing capability of the
-th virtual machine;
represents the storage resource capacity;
denotes the communication bandwidth resource.
Similarly, the resource requirements of the
-th task can be represented as:
where
denotes the computational requirement of task
;
represents the storage requirement;
denotes the bandwidth requirement.
6.2. Objective Function Design
In practical cloud computing environments, cloud task scheduling generally involves multiple optimization objectives. To comprehensively evaluate scheduling performance, this paper considers three important optimization objectives, including execution time cost, load balancing cost, and execution price cost.
6.2.1. Time Cost
Execution time is one of the most important indicators in cloud computing task scheduling, which directly affects system response speed and user Quality of Service (QoS). Lower execution time indicates that tasks can be completed more efficiently, thereby improving overall system throughput and computational efficiency. Therefore, the time cost model can be defined as:
where
represents the computational demand of task
;
denotes the computational capability of virtual machine
.
6.2.2. Load Balancing Cost
Load balancing is another critical factor in cloud task scheduling. Reasonable load distribution can effectively avoid excessive concentration of tasks on specific resource nodes, thereby preventing system congestion and performance degradation.
The load balancing cost can be expressed as:
where
denotes the storage requirement of task
;
represents the storage capacity of virtual machine
.
A smaller load cost indicates better resource allocation balance and higher resource utilization efficiency.
6.2.3. Price Cost
In cloud computing systems, execution cost is also an important optimization objective. Lower scheduling cost can reduce operational expenses while improving economic efficiency and service competitiveness.
The price cost model can be formulated as:
where
denotes the bandwidth requirement of task
;
represents the communication bandwidth of virtual machine
.
denotes the unit execution price coefficient.
6.3. Objective Function Normalization
Since the values of different objective functions vary significantly in magnitude, normalization processing is required before constructing the comprehensive fitness function. The normalized execution time objective can be expressed as:
The normalized load balancing objective can be represented as:
Similarly, the normalized execution cost objective is defined as:
6.4. Comprehensive Fitness Function
To comprehensively optimize the cloud task scheduling problem, the above three objectives are integrated into a unified weighted fitness function:
where
and
represent the weighting coefficients of execution time, load balancing, and execution cost, respectively;
.
In this paper, to ensure a balanced optimization among different objectives, the three weighting coefficients are uniformly set as:
Therefore, minimizing the objective function corresponds to obtaining the optimal cloud task scheduling scheme.
6.5. Analysis of Experimental Results
In this section, the performance of the proposed MIGoldSA algorithm is comprehensively evaluated through a series of cloud task scheduling simulation experiments and compared with nine state-of-the-art optimization algorithms. To objectively assess the scheduling effectiveness of different algorithms, three important evaluation metrics are considered, including time cost, load cost, and price cost. Specifically, the time cost reflects the overall task execution efficiency of the cloud system, the load cost measures the balance degree of resource allocation among virtual machines, and the price cost represents the economic expenditure during task processing. By integrating these three components, the comprehensive scheduling cost is finally obtained and used as the primary indicator for evaluating the overall optimization performance of the algorithms. The detailed experimental results and corresponding analyses are presented as follows:
6.5.1. Experimental Analysis on Small-Scale Cloud Task Scheduling
In this section, a comprehensive evaluation of the proposed algorithm is conducted on small-scale cloud task scheduling problems. Specifically, the convergence behavior of different algorithms is analyzed, and the corresponding scheduling costs under dynamically varying task numbers are compared in detail. Through these experiments, the effectiveness and robustness of MIGoldSA in handling small-scale scheduling scenarios can be thoroughly verified. The detailed experimental results and analyses are presented as follows:
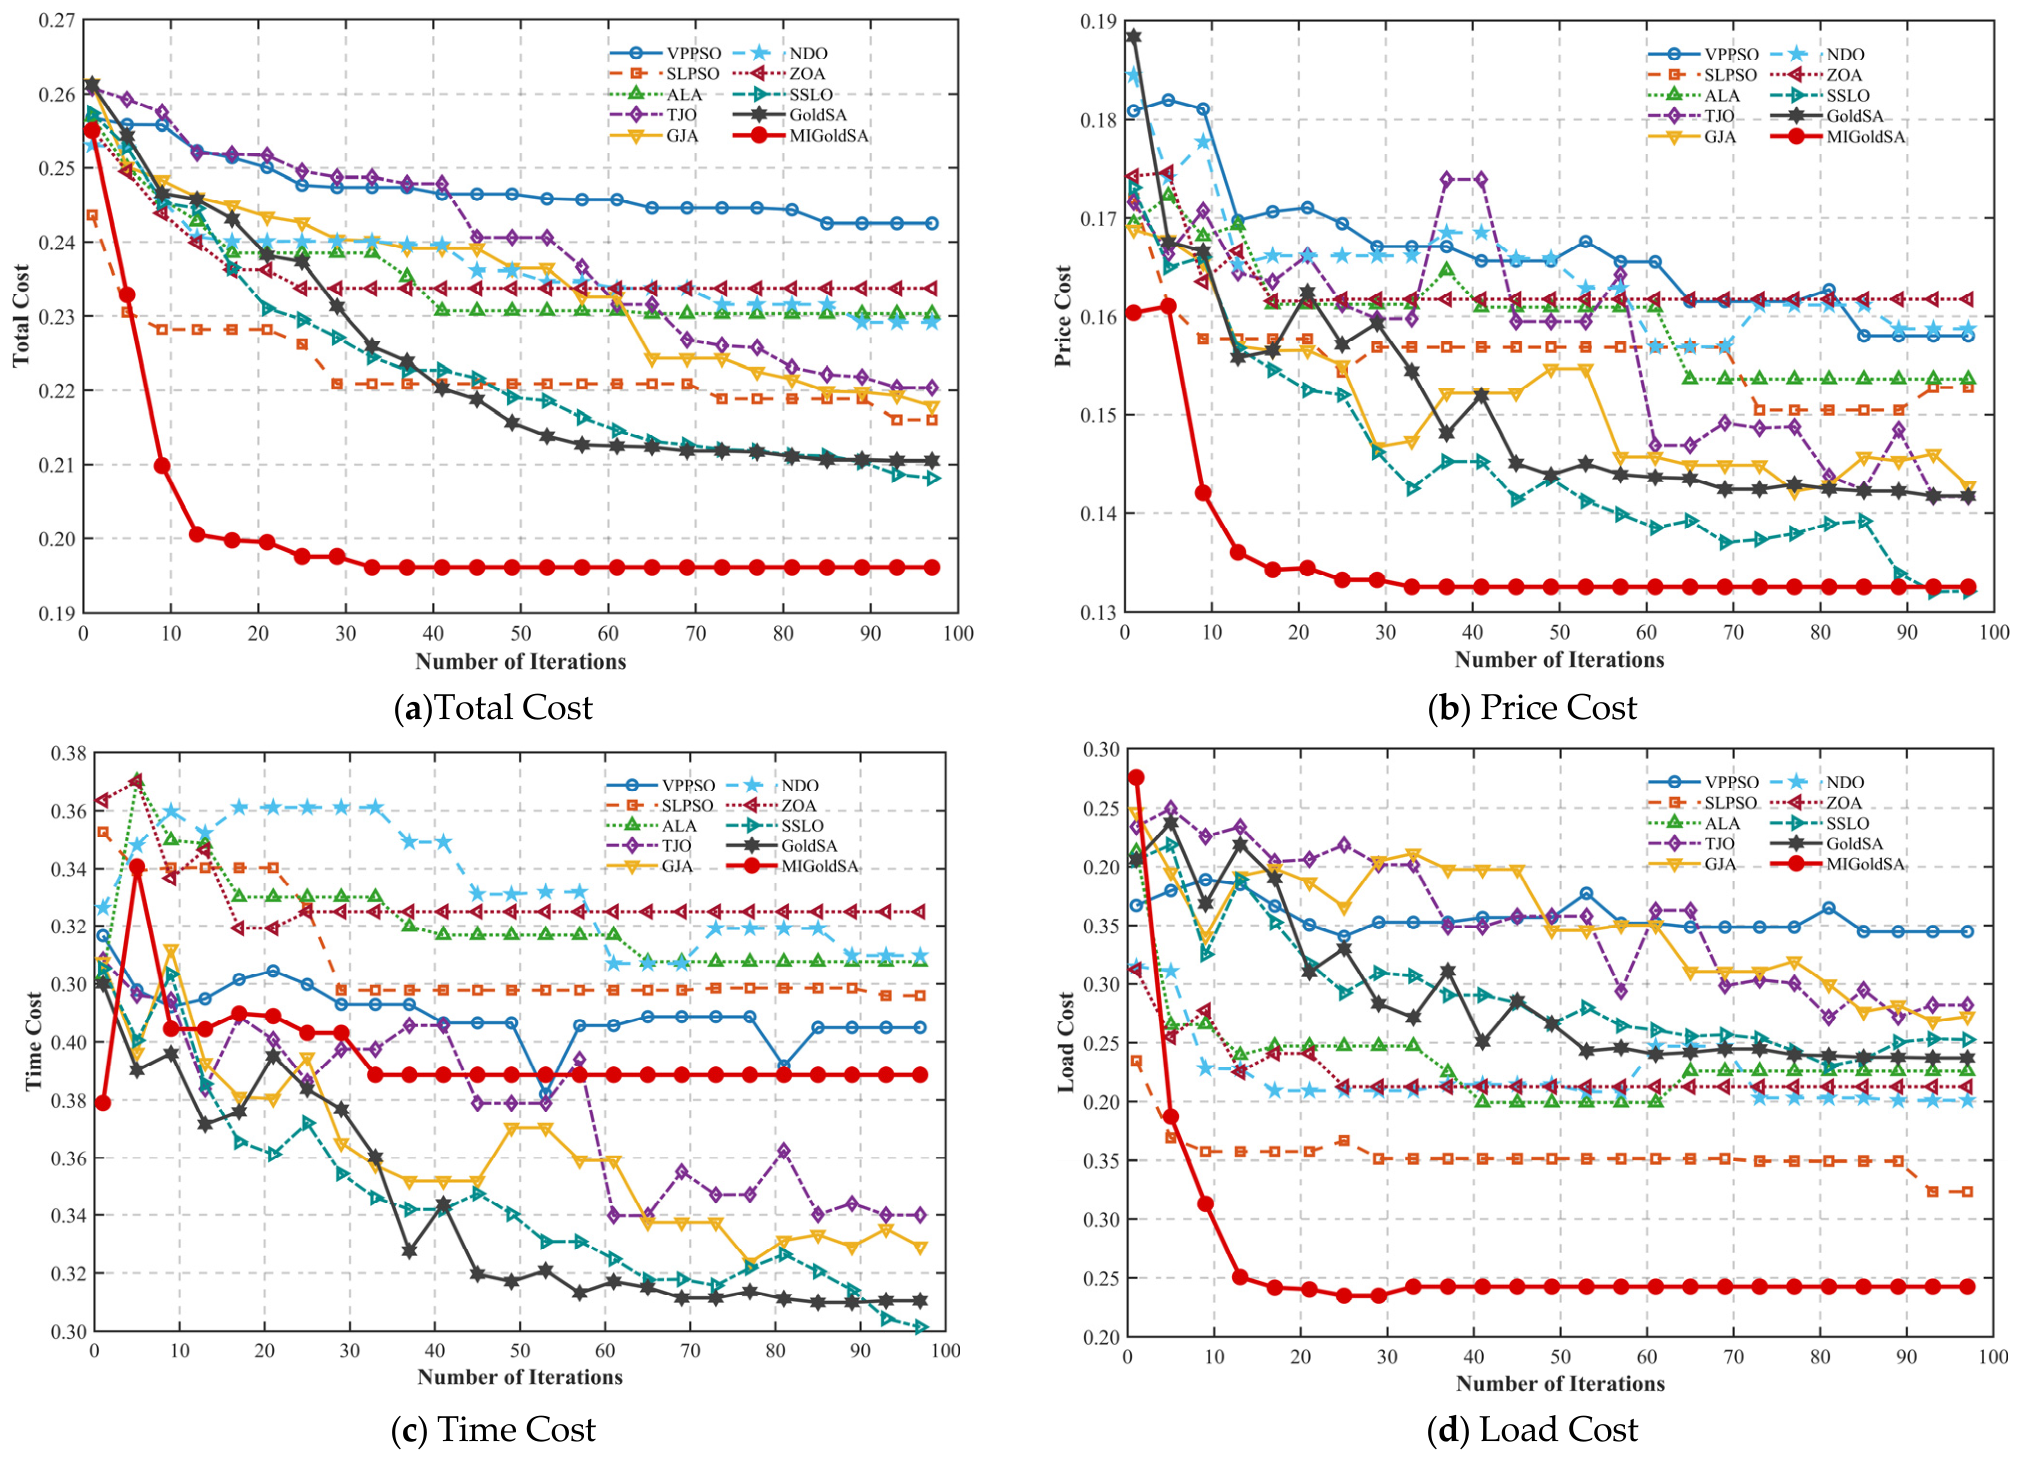
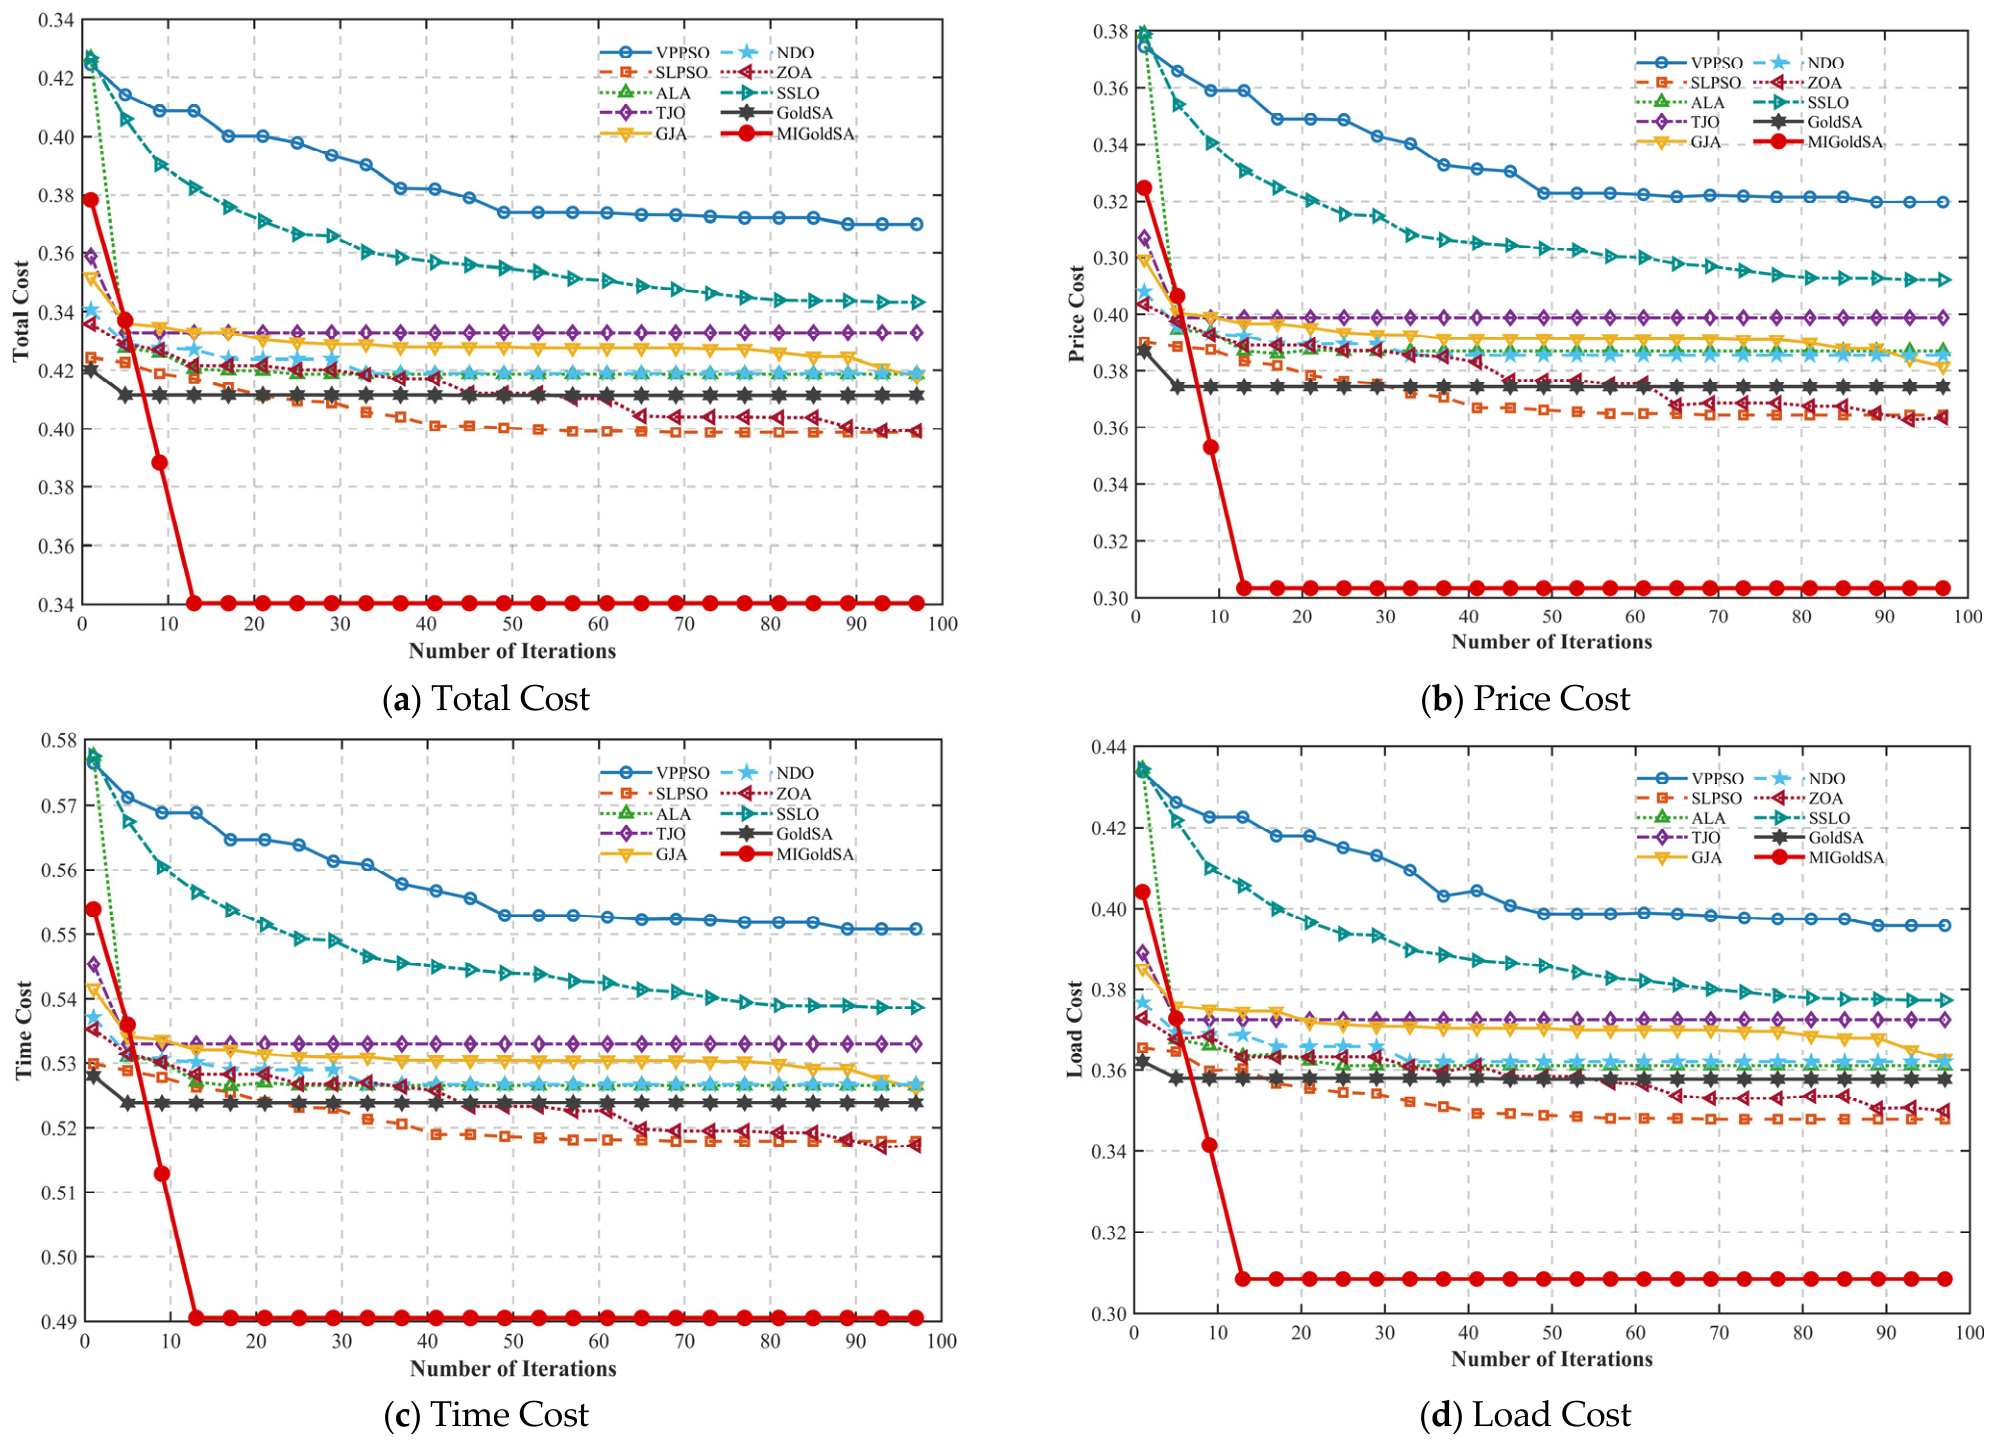
Convergence Behavior Analysis: In this section, the convergence behavior of different algorithms is comprehensively analyzed. To ensure the fairness and consistency of the experiments, the number of tasks was fixed at 100, while the maximum number of iterations was uniformly set to 100 for all comparison algorithms. Under the same experimental conditions, the convergence performance of the proposed MIGoldSA was compared with that of the other nine state-of-the-art optimization algorithms. By analyzing the convergence curves, the optimization efficiency, convergence speed, and search stability of different algorithms can be effectively evaluated. The corresponding experimental results are illustrated in
Figure 13.
Figure 13 illustrates the convergence curves of different algorithms on small-scale cloud task scheduling problems. It can be observed that MIGoldSA demonstrates faster convergence speed and lower scheduling cost compared with the other algorithms throughout the iterative process. In the early optimization stage, MIGoldSA can rapidly reduce the objective value, indicating that the proposed strategies effectively enhance the global exploration capability and improve the search efficiency of the algorithm. Meanwhile, during the later optimization stage, MIGoldSA continues to maintain stable convergence behavior and achieves lower final scheduling costs, demonstrating strong local exploitation capability and high convergence accuracy. Furthermore, compared with several comparison algorithms that exhibit premature convergence or stagnation during iterations, MIGoldSA maintains better optimization stability and stronger search capability. This indicates that the adaptive chaotic opposition initialization strategy, dynamic elite-guided sine evolution strategy, and Economic Investment Strategy collaboratively improve population diversity and strengthen the balance between exploration and exploitation. Overall, the convergence results further verify that MIGoldSA possesses excellent optimization capability and robustness in solving small-scale cloud task scheduling problems.
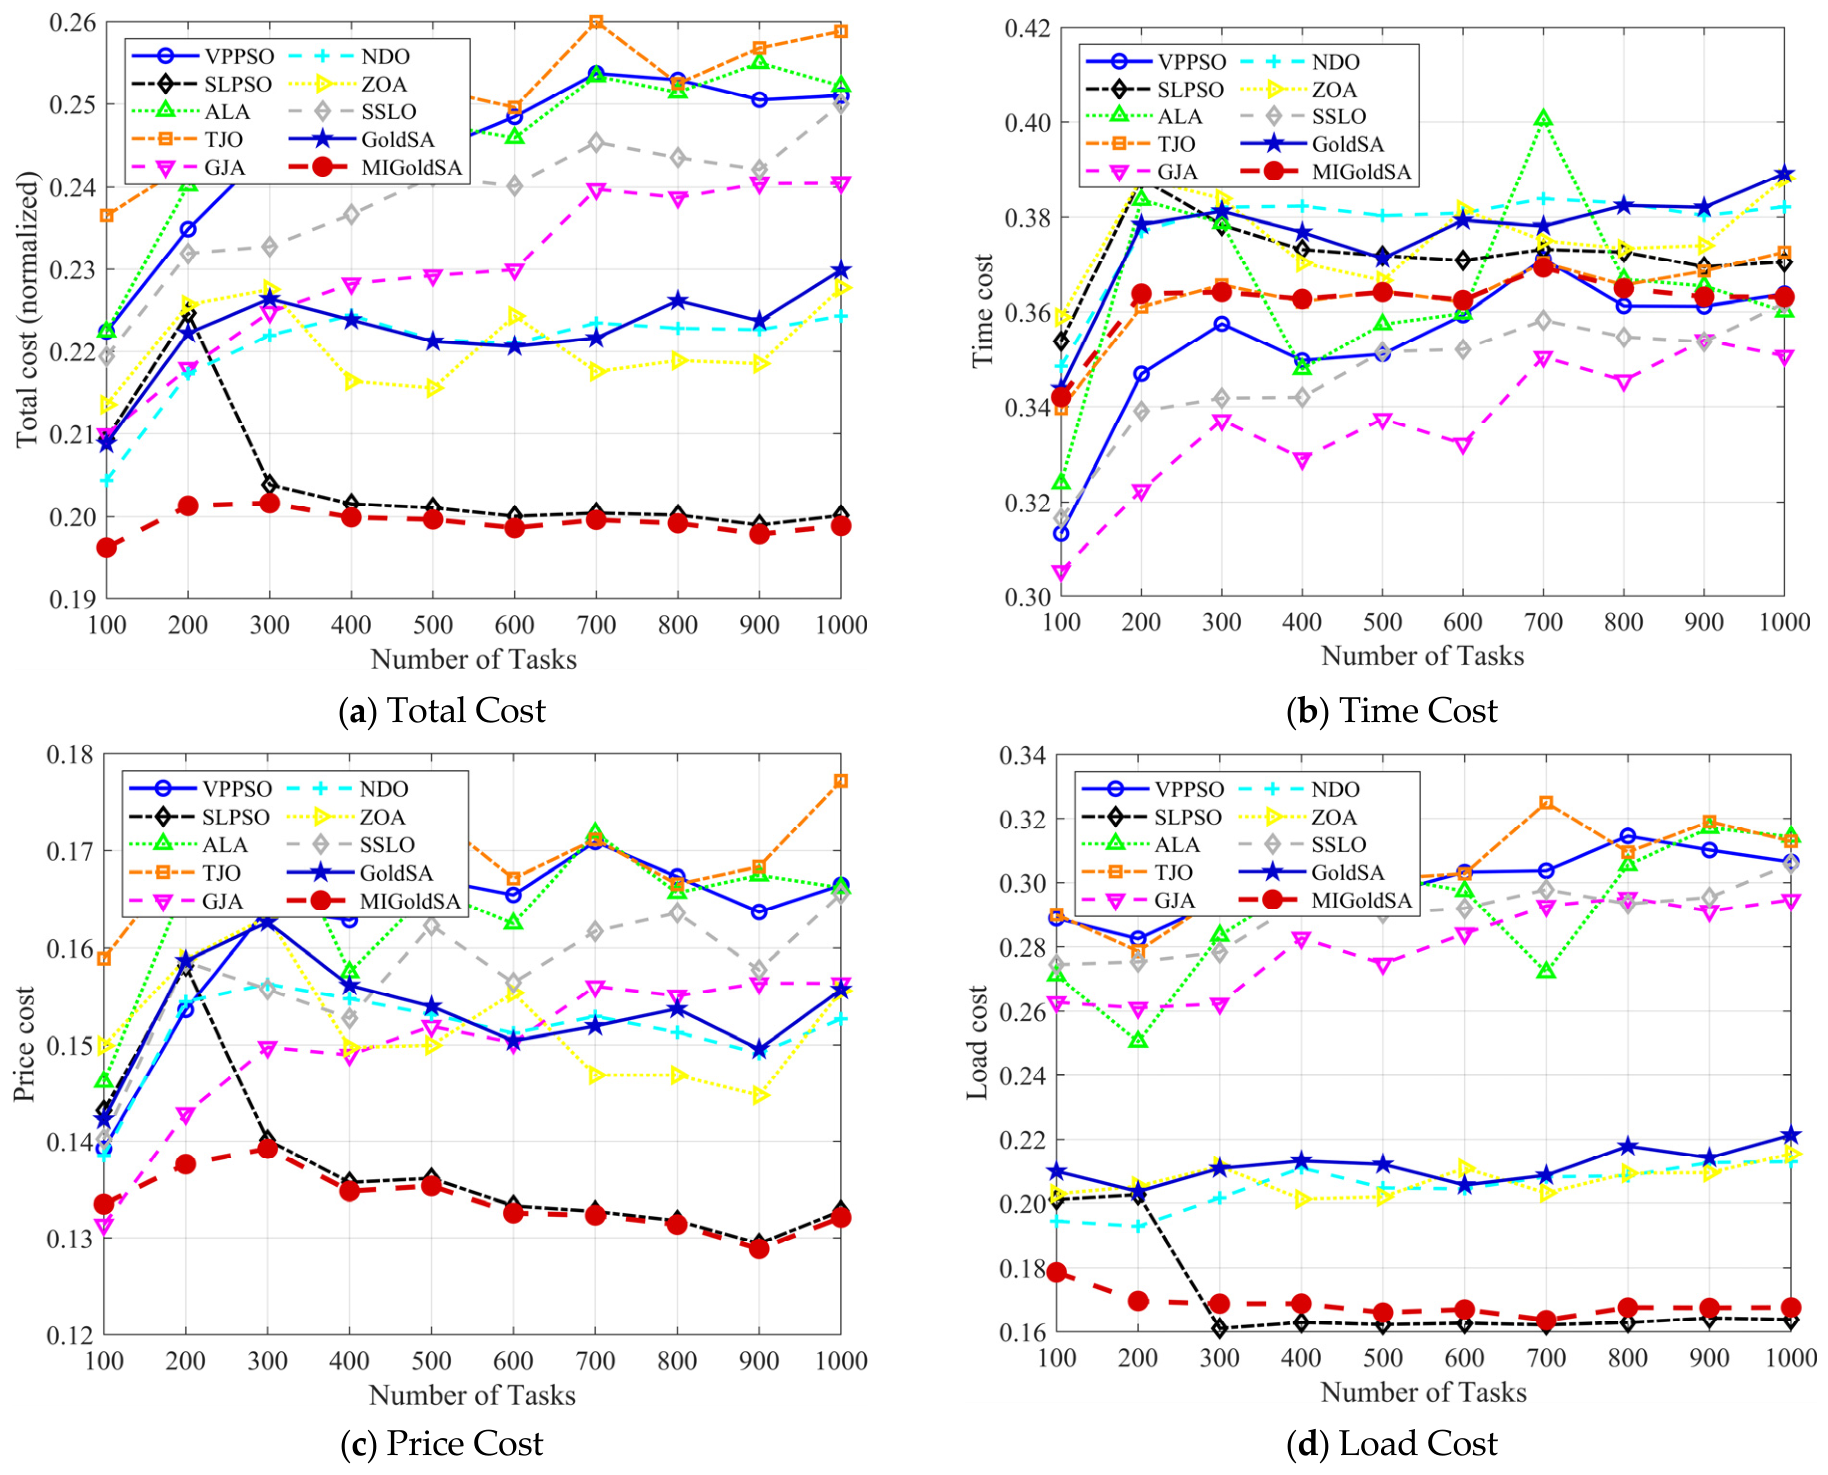
Cost Comparison Under Varying Dynamic Task Loads: In this section, extensive experiments were conducted under dynamically varying task loads to further evaluate the scheduling performance of different algorithms. Specifically, the number of cloud computing tasks was gradually increased from 100 to 1000 in order to analyze the scalability and robustness of each algorithm under different scheduling scenarios.
Figure 14 presents the variation trends of four important evaluation metrics for all comparison algorithms as the task load continuously increases. Through these experiments, the effectiveness and adaptability of MIGoldSA in handling dynamic cloud task scheduling problems can be comprehensively assessed.
Figure 14 presents the performance comparison results of different algorithms under varying small-scale task loads. It can be observed that as the number of cloud computing tasks gradually increases, the scheduling costs of all algorithms show an upward trend due to the increasing complexity of the scheduling problem. However, compared with the other algorithms, MIGoldSA consistently maintains lower comprehensive scheduling costs under different task loads, demonstrating superior optimization capability and stronger adaptability in dynamic cloud scheduling environments. Furthermore, MIGoldSA exhibits more stable performance trends in terms of time cost, load cost, and price cost as the task scale increases. Compared with several comparison algorithms that experience obvious performance degradation or larger fluctuations under heavier task loads, MIGoldSA can effectively maintain better scheduling efficiency and resource allocation balance. This indicates that the proposed adaptive chaotic opposition initialization strategy, dynamic elite-guided sine evolution strategy, and Economic Investment Strategy effectively improve the global search capability and convergence stability of the algorithm. Overall, the experimental results further verify that MIGoldSA possesses excellent robustness, scalability, and optimization performance in handling dynamic small-scale cloud task scheduling problems.
6.5.2. Experimental Analysis on Large-Scale Cloud Task Scheduling
In this section, we conduct a comprehensive evaluation of the proposed algorithm in the context of large-scale cloud task scheduling. Specifically, we analyze the convergence characteristics of various algorithms and provide a detailed comparison of their respective scheduling costs under scenarios involving dynamically changing task loads. Through these experiments, we aim to fully validate the effectiveness and robustness of MIGoldSA when handling scheduling scenarios of varying scales. The detailed experimental results and analysis are presented below:
Analysis of Convergence Characteristics: In this section, we perform a comprehensive analysis of the convergence characteristics of the various algorithms under consideration. To ensure experimental fairness and consistency, we fixed the number of tasks at 1000 and uniformly set the maximum number of iterations for all comparative algorithms to 100. Under these identical experimental conditions, we compared the convergence performance of the proposed MIGoldSA algorithm against nine other state-of-the-art optimization algorithms. By analyzing the convergence curves, we are able to effectively assess the optimization efficiency, convergence speed, and search stability of the different algorithms. The corresponding experimental results are illustrated in
Figure 15.
Figure 15 illustrates the convergence curves of different algorithms on large-scale cloud task scheduling problems. It can be observed that as the scale of cloud tasks increases, the optimization difficulty of the scheduling problem becomes significantly higher. Nevertheless, MIGoldSA still maintains faster convergence speed and lower scheduling costs compared with the other algorithms throughout the iterative process. In the early optimization stage, MIGoldSA can effectively explore promising search regions and rapidly reduce the objective value, indicating that the proposed strategies significantly enhance the global exploration capability of the algorithm in large-scale search spaces. Moreover, during the later optimization stage, MIGoldSA continues to exhibit stable convergence behavior and achieves lower final scheduling costs, demonstrating strong local exploitation capability and good convergence precision. In contrast, several comparison algorithms show obvious stagnation phenomena or premature convergence under large-scale task scheduling scenarios, resulting in poorer optimization performance. This further demonstrates that the adaptive chaotic opposition initialization strategy, dynamic elite-guided sine evolution strategy, and Economic Investment Strategy effectively improve population diversity and strengthen the balance between exploration and exploitation. Overall, the convergence results verify that MIGoldSA possesses excellent scalability, robustness, and optimization capability in solving complex large-scale cloud task scheduling problems.
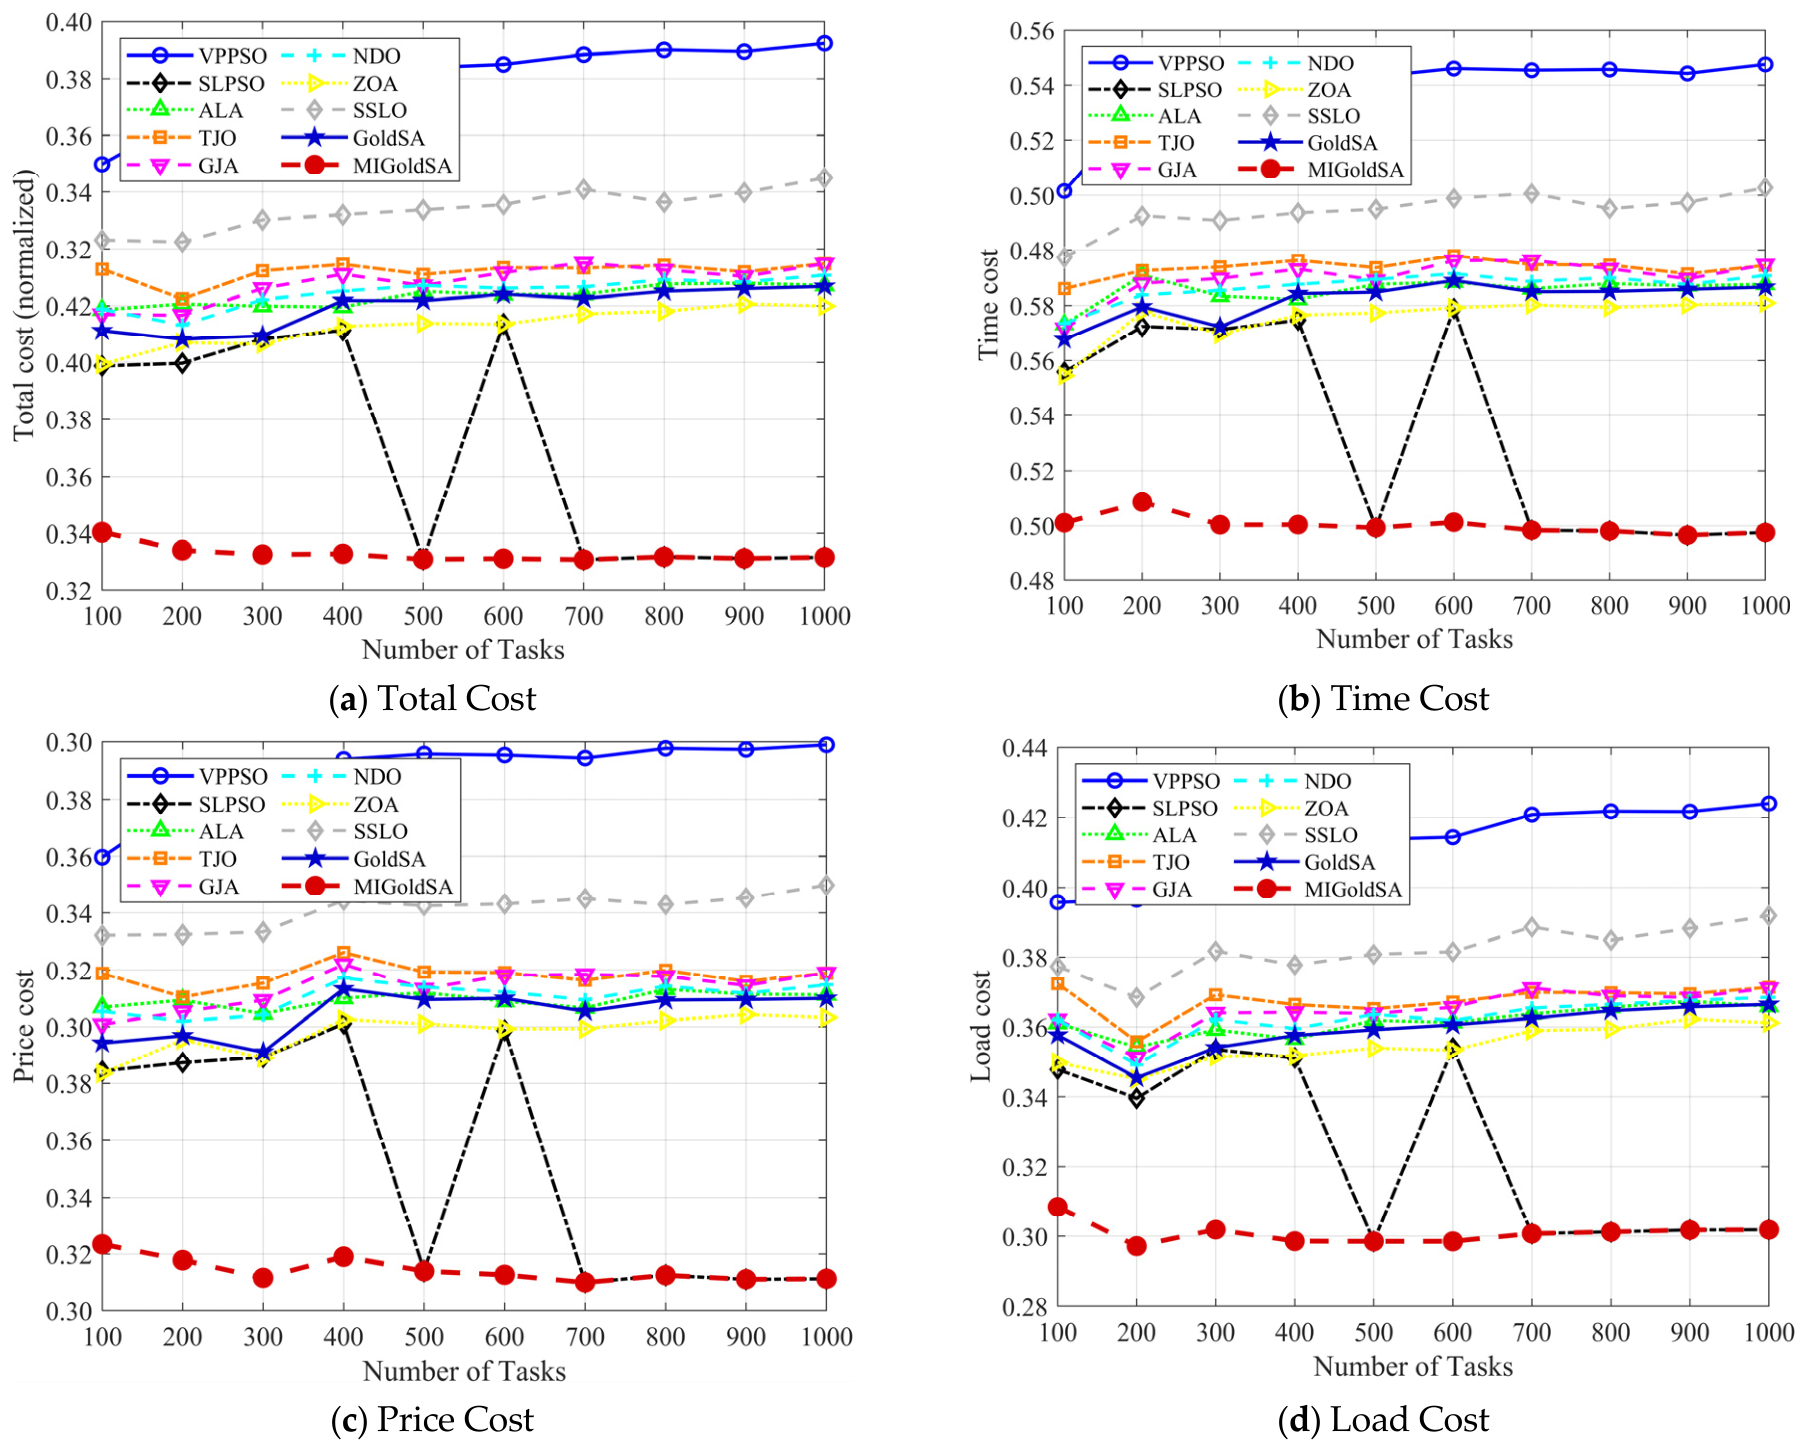
Cost Comparison under Varying Dynamic Task Loads: In this section, we conducted extensive experiments under dynamically changing task loads to further evaluate the scheduling performance of various algorithms. Specifically, we progressively increased the number of cloud computing tasks from 1000 to 10,000 to analyze the scalability and robustness of each algorithm across different scheduling scenarios.
Figure 16 illustrates the trends observed across four key evaluation metrics for all compared algorithms as the task load continuously increased. Through these experiments, we are able to comprehensively assess the effectiveness and adaptability of MIGoldSA in addressing dynamic cloud task scheduling problems.
Figure 16 presents the performance comparison results of different algorithms under varying large-scale task loads. It can be observed that as the number of cloud computing tasks continuously increases, the scheduling complexity and computational burden of all algorithms become significantly higher. Consequently, the comprehensive scheduling costs of different algorithms gradually increase with the growth of task loads. However, compared with the other algorithms, MIGoldSA consistently maintains lower scheduling costs and exhibits superior optimization performance under different large-scale scheduling scenarios. Furthermore, MIGoldSA demonstrates more stable variation trends in terms of time cost, load cost, and price cost as the task scale increases. In contrast, several comparison algorithms experience obvious performance degradation, unstable fluctuations, or reduced scheduling efficiency under heavy task loads. Benefiting from the adaptive chaotic opposition initialization strategy, dynamic elite-guided sine evolution strategy, and Economic Investment Strategy, MIGoldSA can effectively improve population diversity, strengthen global exploration capability, and maintain strong local exploitation performance in complex large-scale search spaces. Overall, the experimental results further verify that MIGoldSA possesses excellent scalability, robustness, and optimization capability in handling dynamic large-scale cloud task scheduling problems.
7. Conclusions
In this paper, a Multi-strategy Improved Golden Sine Optimization Algorithm, named MIGoldSA, is proposed for global optimization and cloud task scheduling problems. The proposed method is developed as an enhanced version of the original GoldSA rather than a completely new optimization paradigm. Three targeted strategies are incorporated into the original GoldSA framework. The adaptive chaotic opposition initialization strategy improves the diversity and distribution quality of the initial population. The dynamic elite-guided sine evolution strategy replaces the single best-solution guidance with a weighted multi-elite guidance mechanism, thereby reducing excessive dependence on one individual. The Economic Investment Strategy adaptively allocates search intensity according to individual optimization potential, enabling the algorithm to coordinate exploitation-oriented and exploration-oriented updates more effectively.
To evaluate the optimization performance of MIGoldSA, comprehensive experiments were conducted on the IEEE CEC2017 and CEC2022 benchmark test suites. The experimental results show that MIGoldSA achieves the best or tied-best mean fitness values on 60 out of 84 benchmark cases, accounting for 71.43% of all test cases. This indicates that the proposed modifications can effectively improve the solution accuracy of the original GoldSA on most benchmark functions. In addition, the Wilcoxon signed-rank test further confirms the statistical reliability of MIGoldSA. Among 756 pairwise comparisons with the competing algorithms, MIGoldSA obtains 662 wins, 57 ties, and 37 losses, corresponding to an overall win rate of 87.57% and a non-inferiority rate of 95.11%. The Friedman mean-rank results also show that MIGoldSA obtains the best overall ranks under the four benchmark settings, with mean ranks of 1.47, 2.00, 3.98, and 4.17. Compared with the original GoldSA, these ranks are reduced by 85.26%, 79.94%, 45.25%, and 42.32%, respectively. These quantitative statistical results verify the effectiveness, stability, and robustness of MIGoldSA in solving complex global optimization problems.
Furthermore, MIGoldSA was applied to cloud task scheduling problems under both small-scale and large-scale task scenarios. The scheduling experiments considered time cost, load cost, price cost, and comprehensive scheduling cost as evaluation metrics. The results show that MIGoldSA can obtain a better overall cost trade-off than most comparison algorithms. In small-scale scheduling scenarios, MIGoldSA maintains the normalized comprehensive scheduling cost at approximately 0.20 and reduces it by about 9–14% compared with the original GoldSA. In large-scale scheduling scenarios, MIGoldSA maintains the normalized comprehensive scheduling cost at approximately 0.33–0.34, corresponding to an approximate reduction of 18–21% compared with the original GoldSA. In terms of individual scheduling metrics, MIGoldSA reduces the normalized load cost by about 18–25% and the normalized price cost by about 10–18%. For time cost, MIGoldSA shows competitive performance in small-scale scenarios and achieves an approximate reduction of 8–12% in large-scale scenarios compared with the original GoldSA. These results indicate that MIGoldSA has good scalability and cost-efficiency in cloud task scheduling applications, especially when the task scale increases.
Although MIGoldSA achieves promising results, there are still several limitations that should be further studied. First, the current improvement strategies are mainly evaluated on continuous benchmark functions and simulated cloud task scheduling scenarios, and their performance in more complex real-world dynamic cloud environments requires further validation. Second, although the proposed strategies do not change the overall computational complexity order of GoldSA, they still introduce additional operations, such as opposition-based initialization, elite weight calculation, and investment coefficient updating. Therefore, future work will further investigate lightweight implementations of MIGoldSA and extend it to multi-objective scheduling, real-time cloud-edge collaborative scheduling, and other practical engineering optimization problems.