Article

EPECT: An Eigenvalue-Guided Positional Encoding Classification Transformer for Cross-Subject EEG-fNIRS Decoding

by
Chayut Bunterngchit
1,
Laith H. Baniata
2,* and
Sangwoo Kang
2,*
1
Division of Industrial and Logistics Engineering Technology, Faculty of Engineering and Technology, King Mongkut’s University of Technology North Bangkok, Rayong Campus, Rayong 21120, Thailand
2
Department of Computing, Gachon University, Seongnam 13120, Republic of Korea
*
Authors to whom correspondence should be addressed.
Mathematics 2026, 14(13), 2416; https://doi.org/10.3390/math14132416
Submission received: 18 May 2026 / Revised: 1 July 2026 / Accepted: 2 July 2026 / Published: 6 July 2026

Abstract

Decoding mental states from non-invasive neural recordings is central to brain-computer interface research. Multimodal acquisition that combines electroencephalography (EEG) and functional near-infrared spectroscopy (fNIRS) couples the high temporal resolution of EEG with the spatial specificity of fNIRS, compensating for the individual limitations of each modality. While such hybrid systems achieve strong intra-subject performance, cross-subject generalization remains constrained by inter-individual variability in neural responses. This study introduces the Eigenvalue-Guided Positional Encoding Classification Transformer (EPECT), an architecture that integrates eigenvalue-aware multi-head self-attention with sinusoidal positional encoding to capture both the spectral structure of the learned feature representations and the temporal ordering of multimodal sequences. Stacked one-dimensional convolutions extract local patterns prior to transformer encoding, and global average pooling aggregates the final representation for classification. EPECT was evaluated on two publicly available EEG-fNIRS datasets covering motor imagery (MI), n-back, discrimination/selection response (DSR), and word generation (WG) paradigms under a cross-subject protocol. The model achieved classification accuracies of 97.3%, 96.3%, 98.1%, and 97.9% on the MI, n-back, DSR, and WG tasks, respectively. Ablation studies quantified the contribution of each architectural component, and integrated gradients analysis revealed structured modality-specific attribution patterns aligned with task-relevant cortical regions. Additional experiments with synthetic cortical perturbations demonstrate the sensitivity of EPECT to subtle activity changes, indicating potential utility for tracking neurorehabilitation outcomes in future clinical applications.

1. Introduction

Stroke is among the leading causes of long-term disability worldwide and frequently produces cognitive and motor deficits that compromise daily functioning [1]. Recovery from these deficits depends on repeated engagement and objective assessment of specific neural circuits, which has driven sustained interest in non-invasive measurement of brain activity during rehabilitation. Brain-computer interface (BCI) systems address this need by translating recorded neural signals into computer-readable representations, enabling fine-grained characterization of cognitive and motor states across a broad range of mental tasks [2,3,4].
Among the available recording modalities, electroencephalography (EEG) remains the most widely adopted technique for BCI research. EEG captures cortical electrical activity at high temporal resolution and is suitable for analyzing brain rhythms associated with cognitive load, motor planning, and attention control. However, EEG signals are non-linear and non-stationary, are contaminated by muscle and ocular artifacts, and provide limited spatial resolution due to volume conduction effects [5,6]. These properties constrain the interpretability of EEG measurements obtained in isolation and motivate the use of complementary modalities.
Functional near-infrared spectroscopy (fNIRS) addresses several of these constraints by measuring localized hemodynamic responses through cortical absorption of near-infrared light. fNIRS provides simultaneous estimates of oxygenated hemoglobin, deoxygenated hemoglobin, and total hemoglobin, offering richer spatial information about functional connectivity than EEG alone [7,8,9]. The compactness of fNIRS instrumentation also supports portable and ecologically valid experimentation that is difficult to achieve with magnetic resonance imaging [10]. The principal drawbacks of fNIRS are limited cortical depth penetration and the slow temporal dynamics of neurovascular coupling [11].
These complementary strengths and weaknesses have led to growing adoption of hybrid EEG-fNIRS acquisition, in which electrophysiological and hemodynamic information are recorded jointly and fused at the signal, feature, or decision level [3,12,13,14]. The resulting multimodal representations enable a more complete spatio-temporal description of cortical activity and improve the reliability of cognitive and motor task analysis. Within this paradigm, several deep learning architectures have been proposed for intra-subject decoding, including convolutional neural networks (CNNs) [15,16,17], recurrent neural networks (RNNs) [18,19], and hybrid CNN-RNN designs [4,20]. Reported intra-subject accuracies are typically high because the model can exploit subject-specific spectral and spatial signatures.
Cross-subject classification, in contrast, remains substantially more difficult. Variability in scalp geometry, electrode placement, hemodynamic response amplitude, and individual neural strategies introduces systematic distribution shifts between subjects, which degrade the generalization performance of models trained on pooled data [20,21,22,23,24]. Ensemble approaches that combine multiple base classifiers have been proposed to mitigate this gap [25], but obtaining stable and generalizable decision boundaries from limited multi-subject samples remains an open problem. Without a model that explicitly captures the spectral and temporal structure shared across subjects, the translation of EEG-fNIRS decoding to clinical neurorehabilitation will continue to be constrained.
This study introduces the Eigenvalue-Guided Positional Encoding Classification Transformer (EPECT) to address the cross-subject decoding problem for cognitive and motor imagery (MI) tasks recorded with multimodal EEG-fNIRS. EPECT operates on extracted spectral and temporal features and projects them through an eigenvalue-aware multi-head self-attention mechanism, in which eigen-decomposition of the query, key, and value covariance matrices is used to expose the spectral structure of the learned representations and emphasize directions of high informational content. Sinusoidal positional encoding is injected into the input representation to preserve temporal ordering, allowing the model to track minor variations in the temporal dynamics of the multimodal sequence. Stacked one-dimensional convolutions placed before the transformer encoder capture local spatio-temporal patterns, after which the encoder applies multi-head self-attention with position-wise feed-forward layers to model long-range dependencies. The principal contributions of this work are summarized as follows:
  • An eigenvalue-guided transformer architecture is proposed that combines spectral decomposition of attention covariance matrices with sinusoidal positional encoding for cross-subject classification of cognitive and MI tasks from multimodal EEG-fNIRS signals.
  • Consistent cross-subject performance is demonstrated across four task paradigms (MI, n-back, discrimination/selection response (DSR), and word generation (WG)) on two publicly available datasets, supported by ablation studies that quantify the contribution of each architectural component and by additional validation on two independent EEG-fNIRS datasets.
  • The sensitivity of the model to subtle cortical activity changes is established through targeted perturbation experiments on healthy-subject recordings, providing initial evidence for potential downstream use in monitoring neurorehabilitation outcomes in future clinical studies.
  • Additional modality-specific and baseline experiments are conducted to quantify the individual contribution of EEG and fNIRS inputs and to compare EPECT against simpler CNN and LSTM architectures under the same LOSO protocol.
The remainder of this article is organized as follows. Section 2 reviews recent deep learning approaches for EEG-fNIRS classification under intra-subject and cross-subject protocols. Section 3 describes the EPECT architecture, preprocessing pipeline, feature extraction, and training procedure. Section 4 presents the experimental results, statistical analyses, latent space examination, and interpretability findings. Section 5 concludes the article and outlines directions for future research.

2. Related Work

Recent work on multimodal EEG-fNIRS decoding falls into three strands: convolutional or recurrent models that treat the two modalities as parallel spatio-temporal tensors, attention-based fusion that models neurovascular coupling, and transformer or ensemble methods aimed at cross-subject generalization. The strands are summarized below, and the corresponding studies, together with their evaluation protocol and reported accuracy, are collected in Table 1. The protocol matters, because intra-subject and cross-subject results are not directly comparable.
The first strand builds on CNNs and recurrent networks, including tensor-based recurrent-convolutional decoding [20], hybrid feature-fusion models for clinical staging [21], multi-bandwidth CNNs [26], and recurrence-plot CNN-LSTM designs [27]. These models perform well under intra-subject or random-split evaluation but seldom establish cross-subject generalization.
The second strand adds attention to exploit the coupling between electrophysiological and hemodynamic signals, including fNIRS-guided attention on EEG features [28], multitask spatio-temporal fusion [22], channel-selected hand-engineered features with a support vector machine [29], and bidirectional cross-modal transformers for affective decoding [30]. Explicit cross-modal modeling improves fusion quality over simple concatenation.
The third strand targets cross-subject decoding under stricter evaluation. Source-level correlation analysis [23], the widely used benchmarks [31], hybrid recurrent-convolutional fusion [4], and stacked ensemble learning on non-linear features [25] all report markedly lower accuracy than intra-subject studies, which reflects the difficulty of the setting. Closest to the present work, selective channel representation with spectrogram imaging [32] and the simplified multimodal transformer network (SMTN) [33] apply feature-level fusion to the same datasets. EPECT extends this strand by adding eigenvalue-guided self-attention and sinusoidal positional encoding within a single convolution-transformer hierarchy, so that the spectral structure of the learned representation, and not only its spatio-temporal structure, is modeled.
Table 1. Summary of recent EEG-fNIRS classification approaches, organized by evaluation protocol and reported task accuracy. Reported accuracies are taken from the original publications.
ModelTasksEvaluationAccuracy (%)
SVM [29]Motor executionIntra-subject91.02
Shallow ERP/TF baselines [31]DSR and WGIntra-subject86.8 and 80.7
Source-level correlation analysis [23]Action observationIntra-subject72.7
Recurrent-CNN [20]MI and MARandom split90.91
Hybrid deep learning [21]AD (4-class)Intra-subject79.3
Multi-bandwidth optimized CNN [26]MIIntra-subject99.85
Recurrence-plot CNN-LSTM [27]n-backIntra-subject88.41
FGANet [28]MI and MAIntra-subject91.96 and 78.59
M2NN [22]MICross-subject62.26
CNN-LSTM-GRU [4]MI vs. MA and n-back vs. DSR vs. WGCross-subject79.31 and 96
Non-linear features + stacking ensemble [25]MI vs. MAIntra-subject95.83
Bidirectional cross-modal transformer [30]Emotion (3-class)Cross-subject76.15
Selective channels + spectrogram CNN [32]n-back, WG, DSR, and MIIntra-subject91.7–95.1
SMTN [33]MI, n-back, DSR and WGCross-subject96.3–98.1
Across the works reviewed, three limitations recur. First, models that achieve very high accuracy almost exclusively report intra-subject or random-split evaluations, while studies that adopt rigorous cross-subject protocols obtain markedly lower performance. Second, most architectures depend on large training corpora or extensive task-specific augmentation, which are difficult to satisfy in clinical EEG-fNIRS studies where multi-subject samples remain limited. Third, the architectures that improve fusion quality do so without explicitly characterizing the spectral structure of the learned representations, leaving a primary source of cross-subject variability under-modeled. The EPECT architecture addresses these gaps by combining feature-level multimodal fusion with eigenvalue-guided self-attention and sinusoidal positional encoding, yielding a compact transformer design that targets cross-subject generalization without requiring large training cohorts.

3. Methodology

The proposed pipeline consists of four stages: signal preprocessing, feature extraction, multimodal fusion, and classification through the EPECT architecture. The overall data flow is summarized in Algorithm 1. EEG and fNIRS recordings are first filtered to remove out-of-band noise, segmented into overlapping windows, and converted into channel-wise spectral and temporal feature vectors. The two modality-specific feature streams are then concatenated and normalized to form a unified multimodal representation. This representation is passed to the EPECT model, which combines stacked one-dimensional convolutions with a transformer encoder that uses an eigenvalue-guided multi-head self-attention mechanism. Cross-subject generalization is assessed under a leave-one-subject-out (LOSO) protocol, in which all trials from one participant are reserved for testing while the remaining participants are used for training and validation.
Algorithm 1 End-to-End EEG-fNIRS Classification Pipeline with EPECT
Require: Multimodal recordings { X EEG ( s ) , X fNIRS ( s ) , y ( s ) } s = 1 S from S participants
Ensure: Trained EPECT parameters Θ , test predictions y ^
  1:
Apply a fourth-order Butterworth bandpass filter (1–45 Hz) to each EEG channel
  2:
Apply a finite impulse response (FIR) bandpass filter (0.001–0.2 Hz) to each fNIRS channel
  3:
Segment both modalities into overlapping windows of T w seconds with T o seconds overlap
  4:
for each participant s = 1 , , S  do
  5:
      for each EEG channel do
  6:
            Compute band-limited power spectral density (PSD) over θ , α , β bands
  7:
            Compute peak-to-peak amplitude, variance, Hjorth activity, and zero-crossing rate
  8:
            Compute power ratios α / θ and θ / β
  9:
      end for
10:
      for each fNIRS channel do
11:
            Compute median, standard deviation, root-mean-square, and variance
12:
            Compute Hjorth activity, peak-to-peak amplitude, area under the curve (AUC)
13:
            Compute spectral centroid and spectral roll-off
14:
      end for
15:
      Concatenate per-channel feature vectors into modality-specific frame representations
16:
end for
17:
Fuse modalities by concatenating EEG and fNIRS feature vectors along the channel axis
18:
Apply z-score normalization to the fused multimodal features
19:
Split data under LOSO: hold out subject s for testing, use remaining S 1 subjects for training and validation
20:
Train EPECT with the Adam optimizer and categorical cross-entropy loss
21:
Select the best-performing checkpoint on the validation split
22:
Evaluate the selected model on the held-out test subject and compute accuracy, precision, recall, and F1-score
23:
return Θ , y ^

3.1. EPECT Architecture

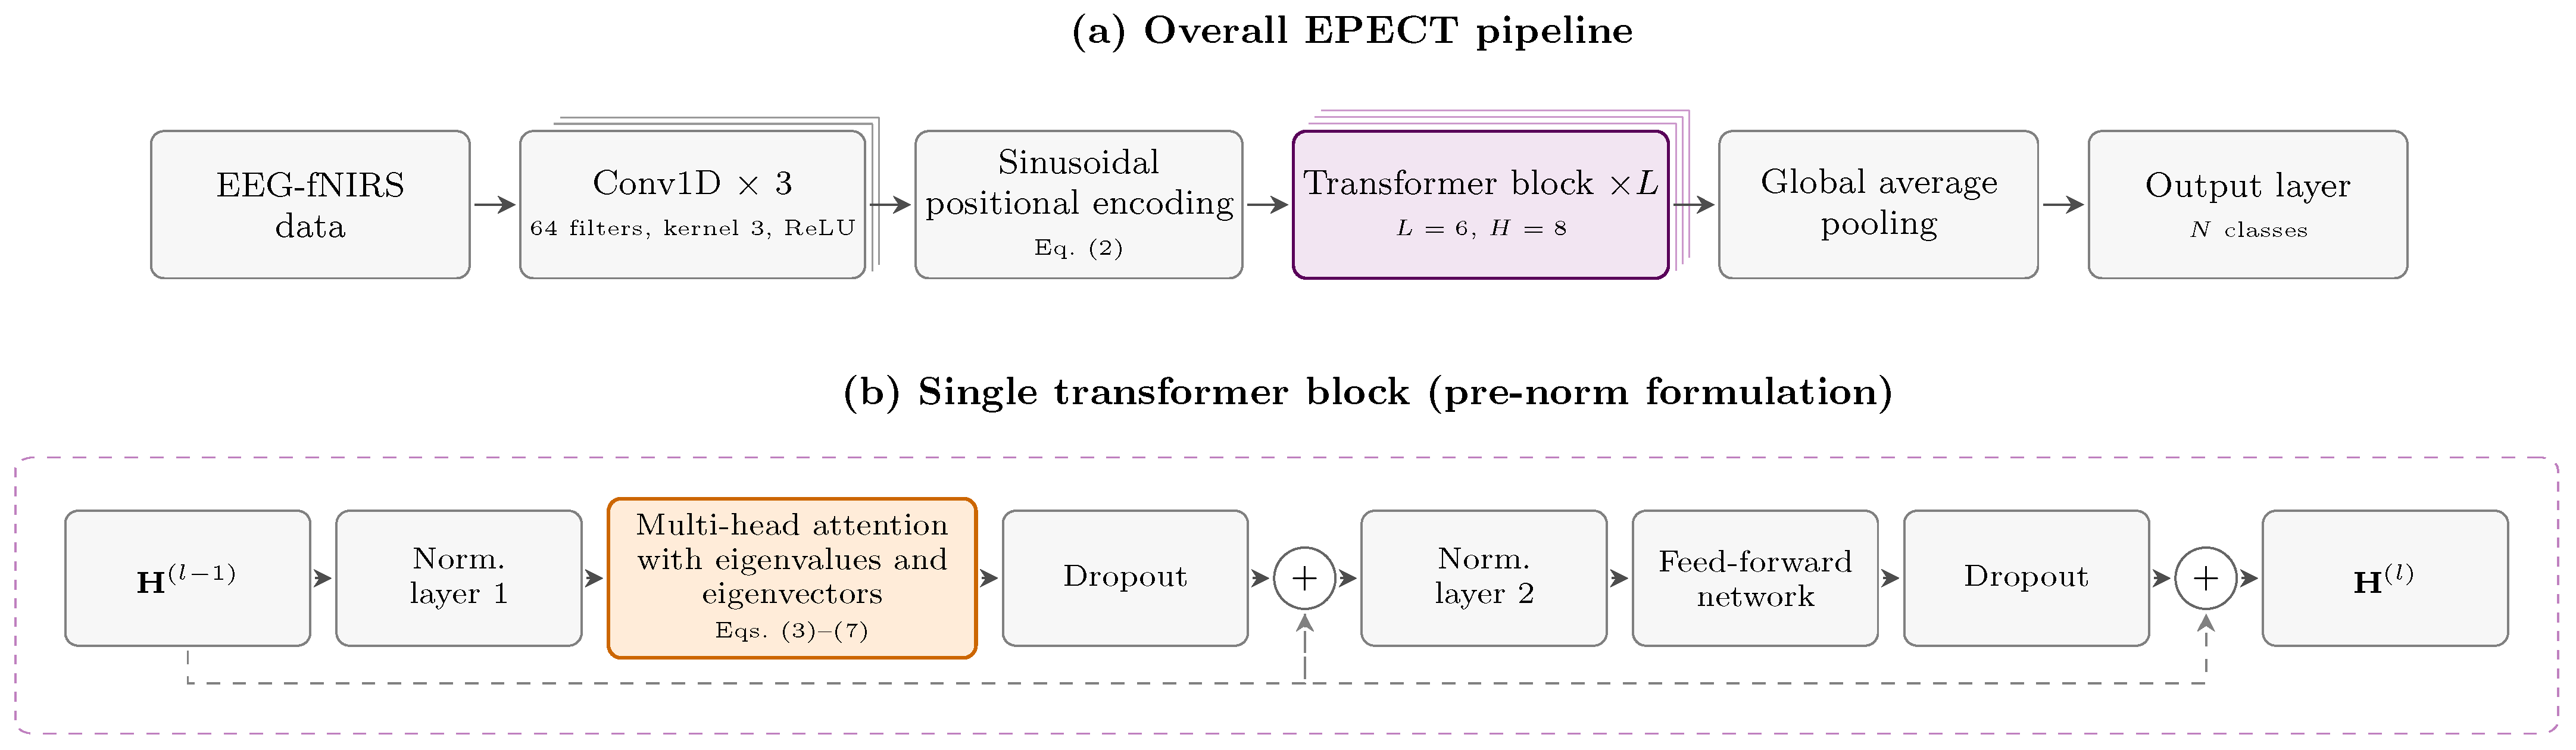
The proposed EPECT is constructed as a convolution–transformer hierarchy that operates on the fused multimodal feature sequence. Local spatio-temporal patterns are first captured by stacked one-dimensional convolutions, after which a transformer encoder composed of eigenvalue-guided multi-head self-attention blocks models long-range dependencies between feature positions. The motivation for the eigenvalue-guided design is that the dominant eigendirections of the projected query, key, and value covariance matrices carry most of the energy of the learned representation, and emphasizing these directions provides a principled way to suppress subject-specific noise while preserving task-relevant structure. The overall architecture is illustrated in Figure 1.

3.1.1. Convolutional Feature Extraction

Let X R T × d denote the fused EEG-fNIRS feature sequence, where T is the number of temporal frames and d is the feature dimension. EPECT first applies three stacked one-dimensional convolutional layers to extract local temporal and cross-feature patterns before transformer encoding
X ( l ) = σ C o n v 1 D X ( l 1 ) ; W ( l ) , b ( l ) ,
where W ( l ) and b ( l ) are the learnable weights and biases of the l-th convolutional layer, and σ ( · ) denotes the ReLU activation. The final convolutional representation X ( 3 ) R T × C is passed to the positional encoding and transformer encoder stages. This convolutional front-end provides a compact local representation while reducing the burden on the attention layers to learn short-range structure directly from the input features.

3.1.2. Sinusoidal Positional Encoding

To preserve the temporal ordering of the input sequence within the otherwise permutation-equivariant attention mechanism, sinusoidal positional encoding P R T × C is added to the convolutional output before the first transformer block
P t , 2 i = sin t 10000 2 i / C , P t , 2 i + 1 = cos t 10000 2 i / C ,
for time index t { 1 , , T } and dimension index i { 0 , , C / 2 1 } . The input to the first transformer block is then H ( 0 ) = X ( 3 ) + P .

3.1.3. Eigenvalue-Guided Multi-Head Self-Attention

The core of EPECT is an eigenvalue-guided variant of multi-head self-attention. For each attention head h { 1 , , H } , the input representation H R T × C is linearly projected into query, key, and value spaces
Q h = H W h Q , K h = H W h K , V h = H W h V ,
where W h Q , W h K , W h V R C × d h and d h = C / H . The dimensional consistency H · d h = C is enforced by construction.
Spectral structure is then embedded into each head through eigendecomposition of the Gram matrices of the projected representations
C Q = Q h Q h = E Q Λ Q E Q , C K = K h K h = E K Λ K E K , C V = V h V h = E V Λ V E V ,
The eigendecomposition in Equation (4) provides a spectral description of the geometry of each projected representation. The eigenvectors define orthogonal directions of variation in the query, key, and value spaces, while the corresponding eigenvalues quantify the representational energy along those directions. In cross-subject EEG-fNIRS decoding, high-energy eigendirections are expected to encode task-relevant structure that is more consistently expressed across subjects, whereas low-energy directions are more likely to capture noise, subject-specific fluctuations, or unstable recording artifacts. Therefore, amplifying the dominant eigendirections of Q h and K h increases the contribution of stable shared components when computing attention scores. Conversely, regularizing the value projection reduces the influence of weak or unstable components during feature aggregation. From this perspective, eigenvalue-guided attention can be interpreted as a spectral reweighting mechanism embedded within self-attention, encouraging the model to attend to dominant cross-subject representational structure rather than overfitting to subject-specific variability.
The Λ Q , Λ K , Λ V R d h × d h are diagonal matrices of non-negative eigenvalues and E Q , E K , E V R d h × d h are the corresponding orthonormal eigenvector matrices. Because C Q , C K , and C V are symmetric positive semi-definite, the decompositions are guaranteed to exist and yield real-valued eigenpairs.
The spectrally reweighted projections are then obtained by amplifying the dominant query and key directions and regularizing the value directions
Q ˜ h = Q h E Q Λ Q α , K ˜ h = K h E K Λ K α , V ˜ h = V h E V ( Λ V + ϵ I ) β ,
where α , β R + are hyperparameters controlling the strength of eigenvalue amplification on the query and key sides and the strength of regularization on the value side. The small constant ϵ > 0 avoids numerical instability when eigenvalues approach zero, and the matrix power Λ p is applied element-wise on the diagonal.
The attention map for head h is computed using the trace of Λ K as a data-dependent scaling factor, which adapts the temperature of the softmax to the energy of the key representation
A h = softmax Q ˜ h K ˜ h tr ( Λ K ) + ϵ , O h = A h V ˜ h ,
Compared with standard scaled dot-product attention, which treats all projected feature directions according to the learned linear projections alone, the proposed formulation explicitly incorporates the second-order covariance structure of each attention head. This additional spectral constraint is particularly relevant for cross-subject classification, where stable directions in the learned representation are more desirable than directions that maximize within-subject discrimination only.
The tr ( Λ K ) equals the squared Frobenius norm of K h . The outputs of the H heads are concatenated along the feature axis and linearly projected back to dimension C
O = [ O 1 ; O 2 ; ; O H ] W O ,
where W O R C × C is the output projection matrix.

3.1.4. Transformer Block

Each EPECT transformer block follows a pre-norm formulation, which is known to stabilize the training of deep transformers, and combines the eigenvalue-guided attention with a position-wise feed-forward network (FFN). Given the input H ( l 1 ) to the l-th block, the block output H ( l ) is obtained as
U ( l ) = H ( l 1 ) + Dropout MHSA eig ( LN ( H ( l 1 ) ) ) ,
H ( l ) = U ( l ) + Dropout FFN ( LN ( U ( l ) ) ) ,
where LN ( · ) denotes layer normalization, MHSA eig ( · ) denotes the eigenvalue-guided multi-head self-attention defined by Equations (3)–(7), and FFN ( u ) = ReLU ( u W 1 + b 1 ) W 2 + b 2 with W 1 R C × d f f and W 2 R d f f × C . The block is stacked L times.

3.1.5. Classification Head

After L transformer blocks, the temporal axis of H ( L ) R T × C is collapsed by global average pooling (GAP)
z = 1 T t = 1 T H t , : ( L ) .
The pooled representation is then mapped to class posteriors through a softmax classifier
y ^ = softmax ( W c z + b c ) ,
where W c R N c × C , b c R N c , and N c is the number of task classes. Training minimizes the categorical cross-entropy
L C E = 1 N i = 1 N c = 1 N c y i , c log y ^ i , c ,
where N is the number of training samples and y i , c is the one-hot ground-truth label. The full training procedure is detailed in Algorithm 2.
Algorithm 2 Training Procedure for the EPECT Architecture
Require: Multimodal dataset D = { ( X i , y i ) } i = 1 N , number of transformer blocks L, number
       of heads H, model width C, FFN width d f f , learning rate η , eigen-coefficients α , β ,
       dropout rate p, number of epochs E
Ensure: Trained EPECT parameters Θ
  1:
Initialize convolutional, projection, attention, FFN, and classifier weights
  2:
Construct sinusoidal positional encoding P as in Equation (2)
  3:
for  e = 1 , , E  do
  4:
      for each mini-batch B D  do
  5:
            Apply three stacked Conv1D layers to obtain X ( 3 )
  6:
            Inject positional encoding: H ( 0 ) X ( 3 ) + P
  7:
            for  l = 1 , , L  do
  8:
                  for  h = 1 , , H  do
  9:
                        Compute Q h , K h , V h via Equation (3)
10:
                        Compute Gram matrices and eigendecompositions via Equation (4)
11:
                        Compute spectrally reweighted Q ˜ h , K ˜ h , V ˜ h via Equation (5)
12:
                        Compute A h , O h via Equation (6)
13:
                  end for
14:
                  Concatenate head outputs and project via Equation (7)
15:
                  Update H ( l ) via the pre-norm block in Equations (8) and (9)
16:
            end for
17:
            Apply global average pooling via Equation (10)
18:
            Compute predictions via Equation (11) and loss via Equation (12)
19:
            Update Θ using the Adam optimizer with learning rate η
20:
      end for
21:
end for
22:
return Θ

3.2. Computational Complexity and Runtime Analysis

Because EPECT performs eigendecomposition inside each attention head, its computational overhead is higher than that of a standard transformer. For a transformer layer with H attention heads, sequence length T, model width C, and per-head dimension d h = C / H , standard multi-head self-attention requires O ( H T 2 d h ) operations for attention-score computation, in addition to the linear projections. EPECT retains this attention computation and introduces eigendecomposition of the query, key, and value Gram matrices. Since each Gram matrix has size d h × d h , the additional eigendecomposition cost is approximately O ( 3 H d h 3 ) per transformer layer.
In the present implementation, this overhead remains manageable because EPECT operates on compact feature-level sequences rather than raw high-frequency EEG and fNIRS time series. Thus, d h is relatively small, and the eigendecomposition is applied to low-dimensional per-head covariance matrices. To quantify the practical cost, Table 2 compares the standard transformer and EPECT using the same input representation, batch size, hardware, and training protocol. Under the same experimental setting, EPECT increased the training time per epoch from 18.4 s to 22.1 s and increased the inference time per batch from 7.8 ms to 9.3 ms. This corresponds to an approximate runtime overhead of 1.20×. Although EPECT is computationally more expensive than the standard transformer, the additional cost remains acceptable for offline cross-subject EEG-fNIRS decoding and is offset by the observed improvement in classification accuracy.

3.3. Data Preprocessing

Raw EEG and fNIRS recordings contain frequency components and physiological artifacts that are unrelated to the cognitive and motor processes of interest, and modality-specific filtering is therefore applied prior to feature extraction. Each EEG channel is passed through a fourth-order Butterworth bandpass filter with cutoff frequencies of 1 Hz and 45 Hz. This passband retains the δ , θ , α , β , and lower γ rhythms that carry most of the cognitive and motor information while attenuating slow baseline drift, electromyographic interference, and 50/60 Hz powerline noise. Each fNIRS channel is filtered with a finite impulse response (FIR) bandpass filter spanning 0.001–0.2 Hz, which preserves the slow hemodynamic response while removing cardiac, respiratory, and Mayer wave components.
Filtered signals are segmented into overlapping windows of length T w = 2.5 s with a 1 s overlap, producing a hop length of 1.5 s. The 2.5 s window length was selected as a compromise between temporal resolution and feature stability. Very short windows may preserve rapid temporal variations but can produce unstable estimates of spectral power, Hjorth parameters, entropy, and other channel-wise features. In contrast, excessively long windows may smooth task-related transients and reduce the number of training samples available under LOSO evaluation. A 2.5 s window provides sufficient temporal support to estimate EEG spectral and temporal descriptors while still preserving the short-duration dynamics associated with cognitive and motor imagery tasks. The 1 s overlap was used to reduce boundary effects between adjacent windows and preserve temporal continuity across the segmented trials. This overlap also increases the effective number of training samples without changing the held-out subject in the LOSO protocol, thereby improving the stability of cross-subject model training while avoiding leakage between training and test subjects.

3.4. Feature Extraction

To complement the EPECT architecture and reduce the dimensionality of the multimodal input before transformer processing, channel-wise spectral and temporal features are computed from every preprocessed window. The feature set, summarized in Table 3, was selected to capture the complementary information carried by the two modalities: spectral power across canonical EEG frequency bands and short-term oscillatory dynamics for EEG, and slow hemodynamic structure together with spectral envelope characteristics for fNIRS.
The use of handcrafted EEG and fNIRS features was motivated by the limited number of subjects available in public hybrid EEG-fNIRS datasets and by the strict LOSO evaluation setting. Fully end-to-end learning from raw multimodal signals can require substantially larger subject pools to avoid overfitting to subject-specific temporal and sensor-level patterns. In contrast, physiologically motivated features such as band-limited power, Hjorth parameters, spectral entropy, variance, and hemodynamic summary statistics provide compact and interpretable descriptors of neural activity. This feature-level representation reduces input dimensionality and improves training stability while preserving information known to be relevant for cognitive and motor decoding. Nevertheless, handcrafted feature extraction may also restrict the model from discovering novel task-specific representations directly from raw signals. Therefore, EPECT is best interpreted as a feature-level multimodal transformer rather than a fully end-to-end raw-signal decoder. Future work will investigate hybrid and end-to-end variants when larger multi-site EEG-fNIRS datasets become available.
For each window, the channel-wise feature vectors are concatenated within each modality to obtain modality-specific representations, which are then concatenated along the channel axis to form a unified multimodal feature tensor. All features are subsequently standardized using z-score normalization. To prevent information leakage across folds, the normalization statistics (per-feature mean and standard deviation) are estimated on the training partition of the current LOSO fold and applied unchanged to the validation and test partitions. The resulting scale-invariant representation is provided as input to the EPECT architecture defined in Section 3.1.

3.5. Datasets

Two publicly available multimodal EEG-fNIRS datasets released by the TU Berlin are used to evaluate EPECT under a cross-subject protocol. Both datasets are widely adopted as benchmarks in the hybrid EEG-fNIRS classification literature.
The first dataset [31] provides cognitive task recordings from 26 healthy right-handed participants. Each participant performed three cognitive paradigms: the n-back working-memory task at 0-back, 2-back, and 3-back load levels; the WG task; and the DSR task. EEG signals were acquired using a 30-channel BrainAmp DC amplifier (Brain Products GmbH, Gilching, Germany) sampled at 1000 Hz and decimated to 200 Hz for analysis. fNIRS signals were acquired using a NIRScout system configured to deliver 36 source-detector channels at each of two wavelengths (760 nm and 850 nm), yielding 72 effective fNIRS channels sampled at approximately 10 Hz.
The second dataset [34] provides MI recordings from 29 healthy right-handed participants. Each participant performed kinesthetic MI of left- and right-hand grasping movements across five sessions of 20 trials per class. EEG data were recorded from 30 active electrodes placed according to the 10-5 international system, using a BrainAmp EEG amplifier at a sampling rate of 1000 Hz. fNIRS data were collected at 12.5 Hz using a NIRScout system, covering 36 channels positioned over frontal, motor, and visual areas.
For each LOSO fold, all trials from one participant are reserved as the test partition. The remaining S 1 participants are used for model development, with 90% of their trials assigned to training and 10% assigned to validation. The validation samples are selected only from the non-test subjects, and no trial from the held-out test subject is used during training, validation, normalization-statistic estimation, early stopping, or checkpoint selection. To avoid class imbalance in the validation partition, the 90/10 split is performed in a stratified manner with respect to the task labels. Thus, the validation set is used only to monitor convergence and select the best checkpoint, while the LOSO test subject remains completely unseen until final evaluation.

3.6. Implementation Details and Hyperparameter Settings

For reproducibility, the complete set of model and training hyperparameters is summarized in Table 4. Unless otherwise stated, the same hyperparameter configuration was used for all four task paradigms and all LOSO folds. The convolutional front-end consisted of three one-dimensional convolutional layers with model width C = 128 , kernel size K = 3 , ReLU activation, and dropout regularization. The transformer encoder contained L = 6 eigenvalue-guided attention blocks, each with H = 8 attention heads and a feed-forward dimension of d f f = 256 . The eigenvalue amplification and value regularization coefficients were fixed at α = 0.5 and β = 0.5 , respectively, and numerical stability was ensured using ϵ = 10 6 .
Models were trained using the Adam optimizer with an initial learning rate of 1 × 10 3 and categorical cross-entropy loss. The mini-batch size was set to 32. Training was run for a maximum of 50 epochs, with early stopping based on validation loss. Specifically, training was stopped when the validation loss did not improve for 10 consecutive epochs, and the checkpoint with the lowest validation loss was retained for testing on the held-out subject. Dropout with probability 0.30 was applied in the transformer block and classification head. These settings were kept fixed across the EEG-only, fNIRS-only, EEG-fNIRS, ablation, and baseline experiments to ensure a fair comparison.

4. Results and Discussion

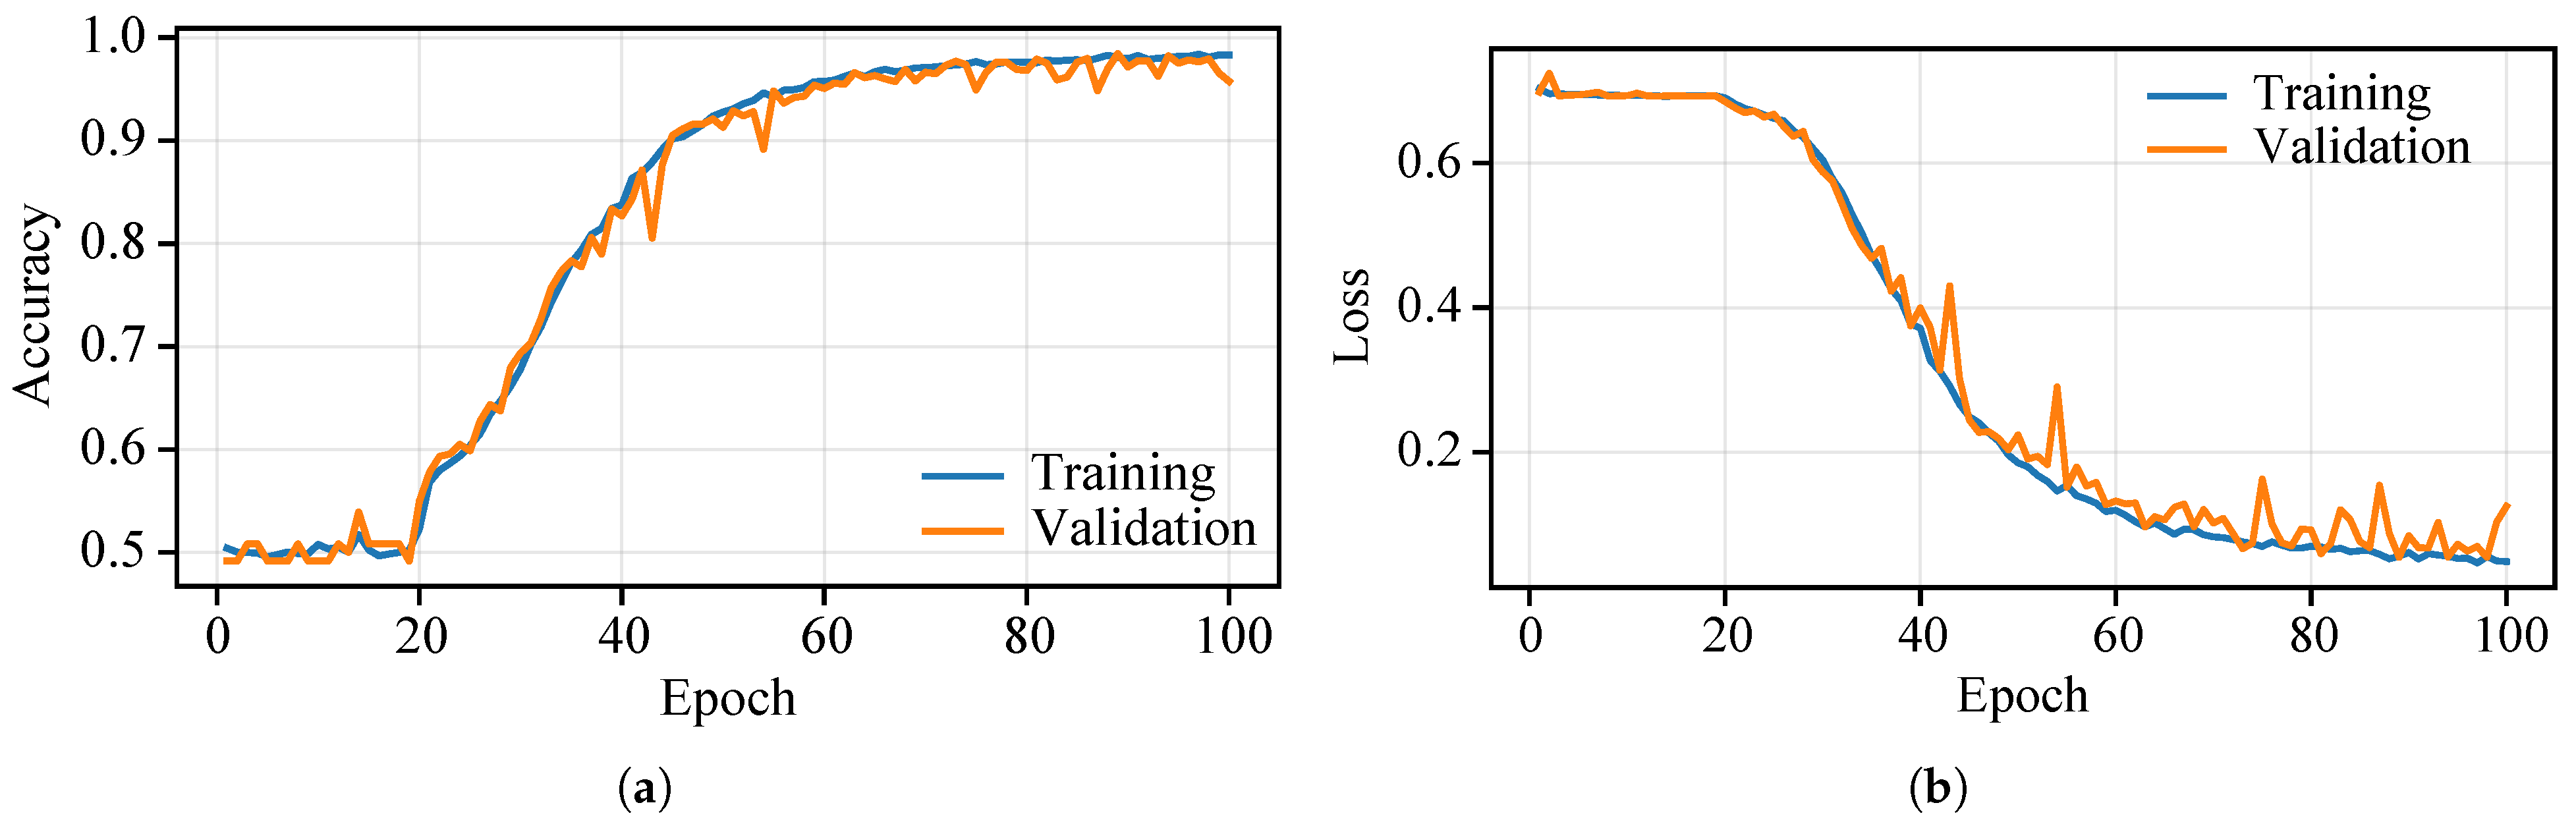
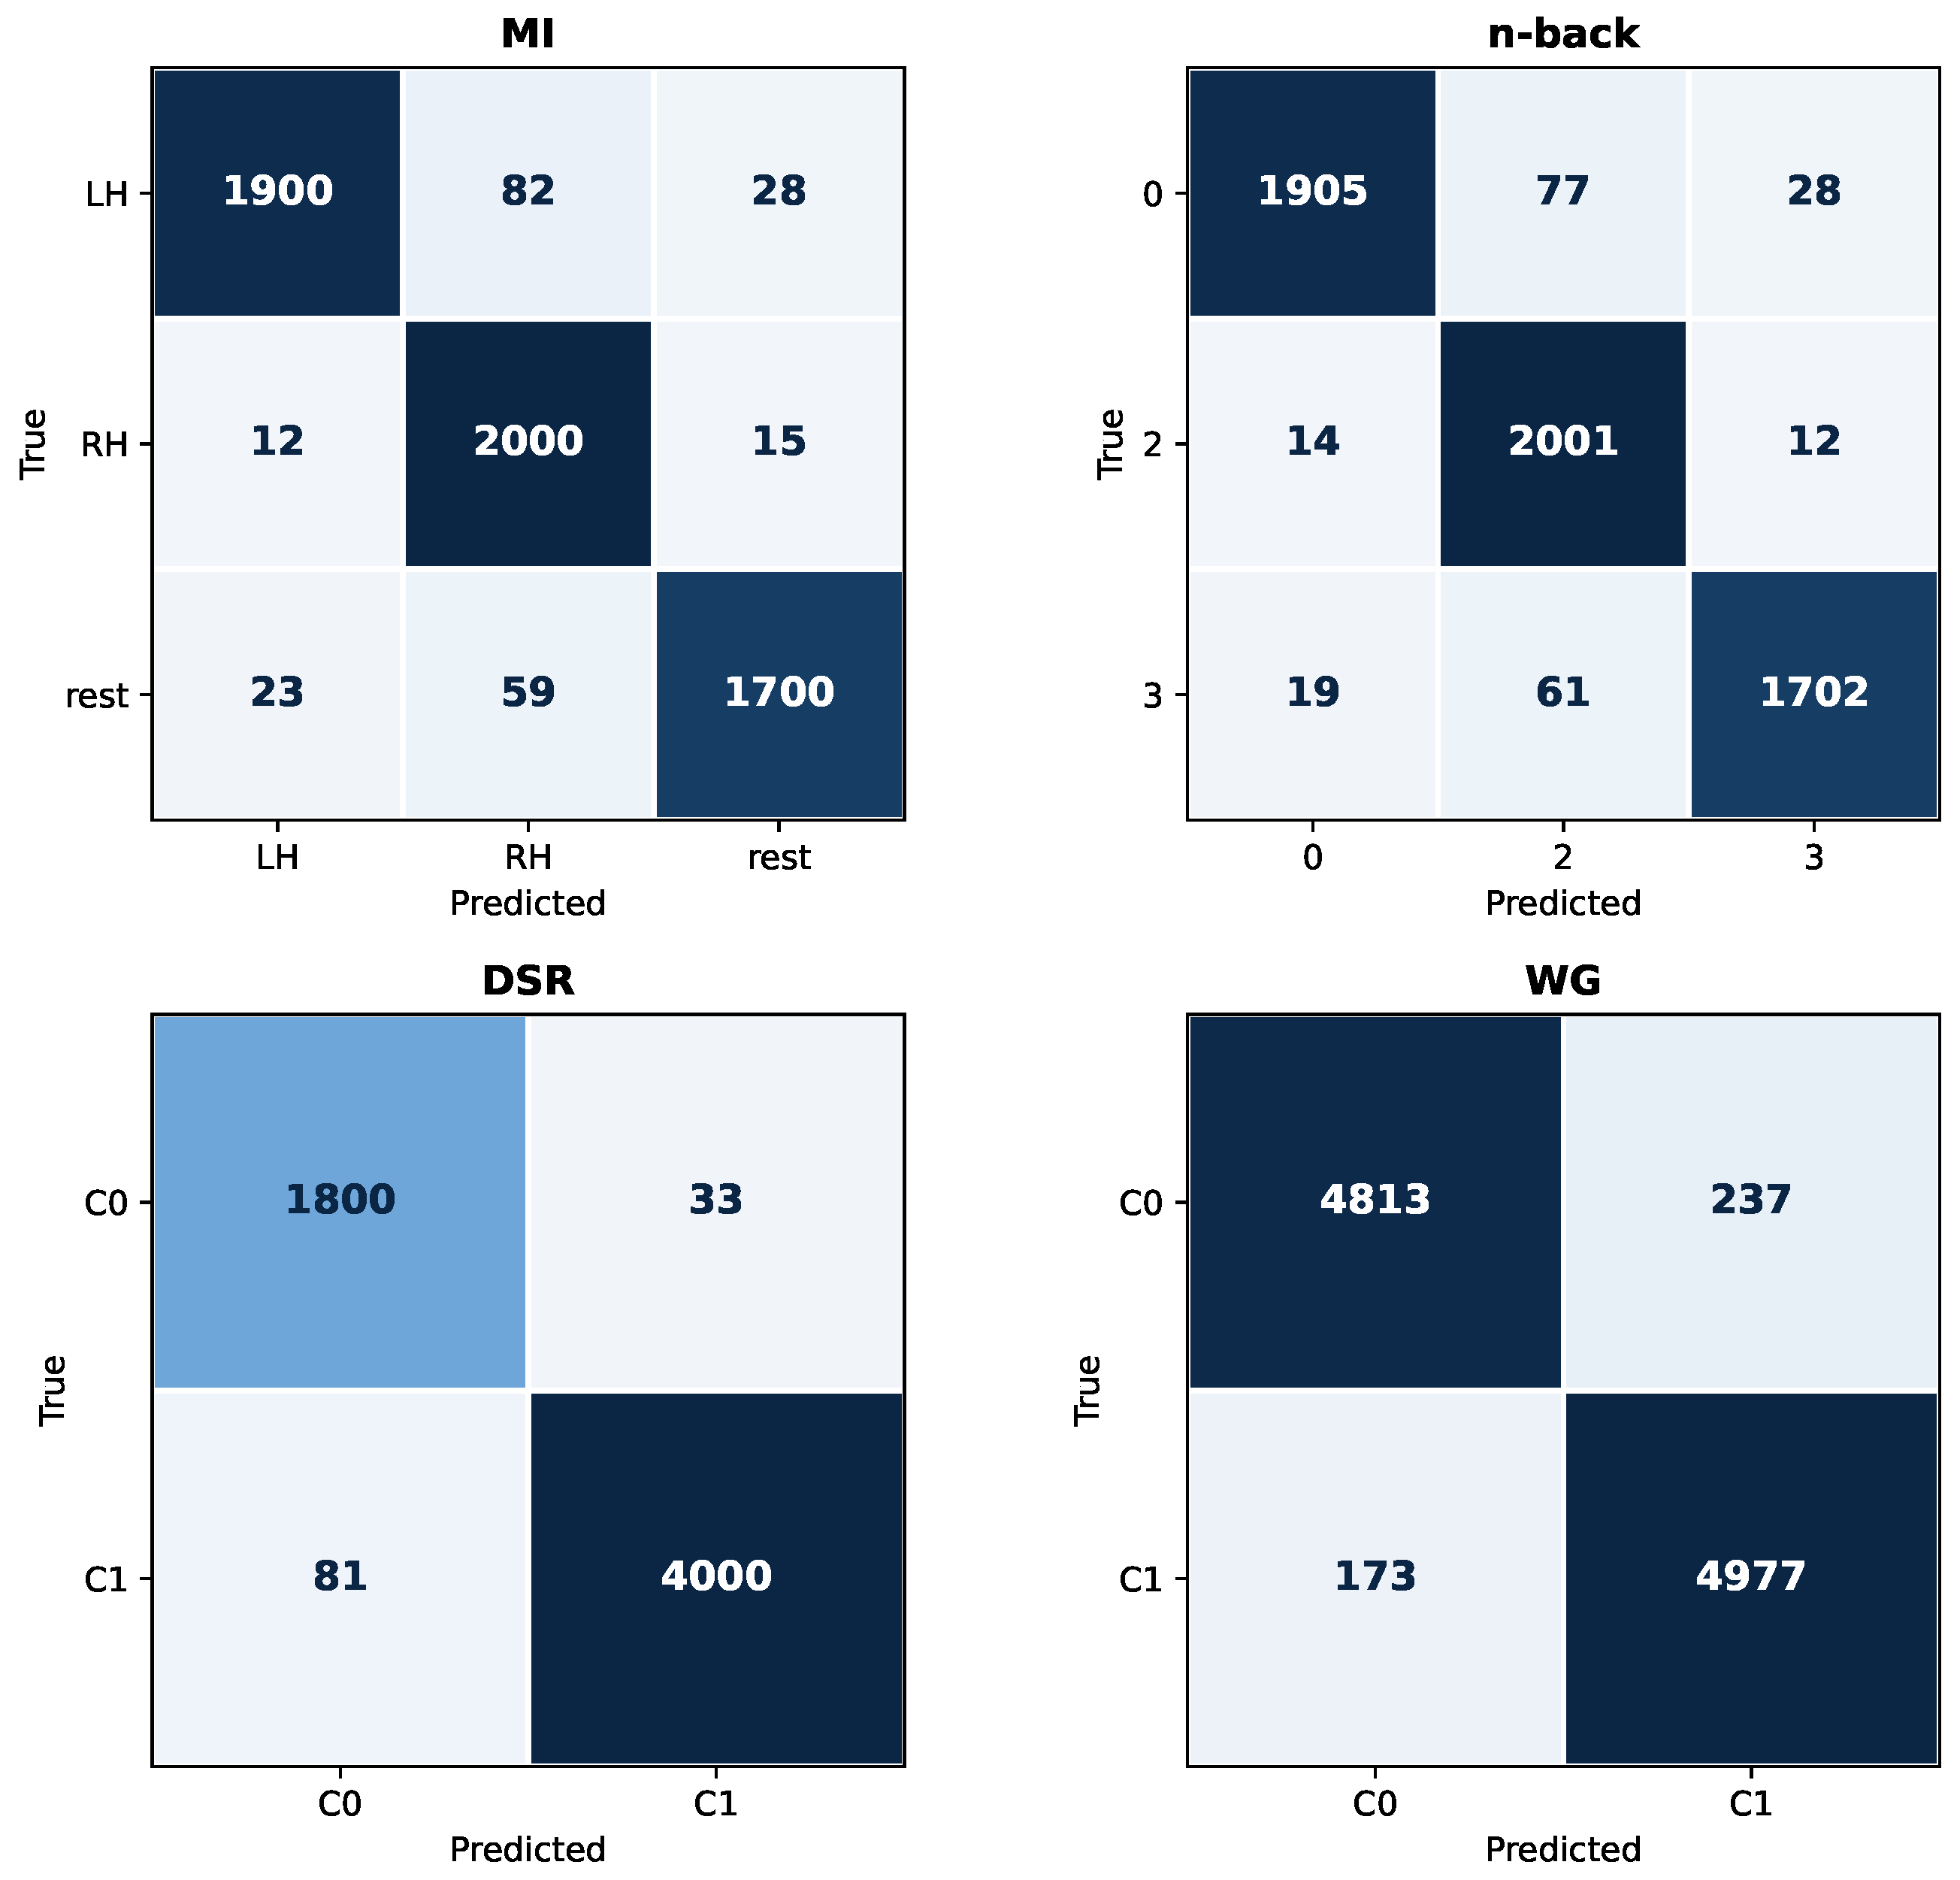
EPECT was evaluated on four paradigms from the two benchmark EEG-fNIRS datasets: MI, n-back, DSR, and WG. All experiments followed the LOSO protocol described in Section 3.5. Figure 2 summarizes the training dynamics, Figure 3 reports the confusion matrices, and Table 5 provides the quantitative results.
The four task paradigms span motor and cognitive domains of varying complexity, and EPECT delivers consistently strong cross-subject performance on all of them. The lowest test accuracy is 96.3% on the three-class n-back task, which is the most demanding paradigm because it requires the model to discriminate three working-memory load levels using overlapping cortical resources, while the highest is 98.1% on the two-class DSR task, where the larger sample count (8892 trials) allows the transformer to learn a stable cross-subject decision boundary. The training-to-validation accuracy gap stays within 3.9 percentage points (pp) in every paradigm, and the training and validation loss curves in Figure 2 decline smoothly and remain in close proximity throughout optimization, indicating that the eigenvalue-guided attention and pre-norm formulation jointly stabilize training without overfitting. The confusion matrices in Figure 3 show that misclassifications are spread across non-diagonal cells rather than concentrated between a single class pair, suggesting that no single class systematically dominates the prediction landscape.

4.1. Modality Contribution Analysis

To address the relative contribution of EEG and fNIRS to the overall cross-subject performance, EPECT was additionally evaluated under three input configurations: EEG-only, fNIRS-only, and combined EEG-fNIRS. In the EEG-only setting, all fNIRS-derived features were removed before normalization and model training. In the fNIRS-only setting, all EEG-derived features were removed. In the combined setting, the full multimodal feature representation described in Section 3.4 was used. All three configurations used the same LOSO protocol, training/validation split strategy, preprocessing pipeline, model hyperparameters, and early stopping criteria, so that performance differences reflect the contribution of the input modality rather than changes in the evaluation protocol.
The results are summarized in Table 6. EEG alone provides strong discriminative performance across all four paradigms, confirming that electrophysiological activity carries substantial task-relevant temporal and spectral information. fNIRS alone yields lower accuracy, especially on tasks requiring rapid temporal discrimination, which is consistent with the slower hemodynamic response captured by fNIRS. However, the combined EEG-fNIRS configuration consistently achieves the highest accuracy, indicating that fNIRS contributes complementary spatial and hemodynamic information that improves cross-subject generalization when fused with EEG features. These findings support the use of hybrid EEG-fNIRS acquisition and demonstrate that the performance gains of EPECT are not solely attributable to one modality.

4.2. Comparison with Simpler Deep Learning Baselines

To further verify that the performance improvement is due to the proposed EPECT design rather than the feature set alone, two simpler deep learning baselines were implemented and evaluated under the same LOSO protocol: a CNN baseline and an LSTM baseline. The CNN baseline used the same fused EEG-fNIRS feature representation but replaced the transformer encoder with stacked one-dimensional convolutional layers followed by global average pooling and a softmax classifier. The LSTM baseline used the same input features but replaced the transformer encoder with a recurrent sequence model followed by a dense classification head. Both baselines used the same preprocessing, feature extraction, normalization, training/validation/test split, batch size, optimizer, early stopping criterion, and checkpoint-selection rule as EPECT.
The results in Table 7 show that both CNN and LSTM baselines achieve reasonable cross-subject performance, confirming that the extracted EEG-fNIRS features are informative. However, EPECT consistently outperforms both simpler baselines across all four task paradigms. The improvement over the CNN baseline indicates that local convolutional processing alone is insufficient to fully capture long-range dependencies in the multimodal feature sequence. The improvement over the LSTM baseline suggests that the eigenvalue-guided self-attention mechanism provides a more effective representation of cross-subject spectral and temporal structure than recurrent sequence modeling. These results further support the effectiveness of the proposed convolution–transformer hierarchy and the eigenvalue-guided attention module.

4.3. Comprehensive Comparison with Competing Methods

To provide a systematic comparison with competing approaches, EPECT was evaluated against representative classical machine learning, recurrent, convolutional, and transformer-based models using the same datasets, preprocessing pipeline, feature extraction procedure, LOSO protocol, training/validation/test partitions, and checkpoint-selection rule. The compared methods include a support vector machine (SVM), a random forest (RF), a CNN baseline, an LSTM baseline, a CNN–LSTM model, a standard transformer without eigenvalue-guided attention, and the proposed EPECT architecture. For the neural baselines, the same fused EEG-fNIRS feature representation was used as input. For the classical baselines, the window-level feature vectors were flattened before classification. This design ensures that the comparison reflects architectural differences rather than differences in preprocessing, feature construction, or evaluation protocol.
The consolidated results are reported in Table 8. Classical machine learning models provide reasonable performance but are limited in their ability to model long-range temporal dependencies in the multimodal feature sequence. CNN-based models improve performance by extracting local spatio-temporal patterns, while LSTM-based models further benefit from explicit sequence modeling. The standard transformer achieves stronger performance than the CNN and LSTM baselines, confirming the suitability of attention-based architectures for EEG-fNIRS decoding. However, EPECT consistently achieves the highest accuracy across all four task paradigms. The improvement over the standard transformer demonstrates that the gain is not simply due to using a transformer backbone, but is specifically associated with the proposed eigenvalue-guided attention mechanism and its ability to emphasize dominant spectral directions in the learned representation. These results establish the comparative advantage of EPECT over both simpler baselines and stronger competing architectures under identical experimental conditions.
The ordering in Table 8 makes the contribution of each design choice explicit. Averaged over the four paradigms, accuracy climbs from 70.8% for the SVM and 73.2% for the random forest, through 78.7% (CNN), 80.2% (LSTM), and 83.9% (CNN–LSTM), to 89.9% for the standard transformer, and reaches 97.4% for EPECT. The 7.5 pp margin over the standard transformer is the key figure, because that baseline shares every component with EPECT except the eigenvalue-guided attention. The improvement is therefore attributable to the proposed mechanism rather than to the use of a transformer backbone.
To determine whether the observed performance gains are statistically meaningful, paired significance testing was performed across LOSO folds. For each task, the per-fold accuracy of EPECT was paired with the corresponding per-fold accuracy of each baseline model evaluated on the same held-out subject. Paired tests were then applied to compare EPECT against the strongest competing baselines. In addition, mean accuracy, standard deviation, and 95% confidence intervals were computed across folds. This fold-wise paired design controls for differences in subject difficulty and ensures that statistical comparisons reflect model differences rather than variation in the held-out subject partitions.

4.4. Ablation Studies

Three ablated variants of EPECT were trained and evaluated under the same LOSO protocol as the full model in order to quantify the individual contribution of each architectural component:
  • w/o Positional Encoding: the sinusoidal positional encoding in Equation (2) is removed, so that the transformer encoder receives only the convolutional output.
  • w/o Convolutional Front-End: the three stacked one-dimensional convolutional layers in Equation (1) are removed, and the fused multimodal feature sequence is fed directly to the transformer.
  • w/o Eigenvalue-Guided Attention: the eigenvalue-guided multi-head self-attention defined by Equations (3)–(7) is replaced with a standard scaled dot-product multi-head self-attention.
The cross-subject test accuracies of each variant on the four task paradigms are reported in Table 9.
The eigenvalue-guided multi-head self-attention contributes the largest portion of EPECT’s performance: removing it produces an 8.0 pp drop in average accuracy across the four paradigms, which exceeds the impact of either of the other two ablations. This is the strongest empirical evidence that the eigenvalue-guided component, rather than a generic transformer backbone, is responsible for the cross-subject generalization reported in this section. The convolutional front-end accounts for a further 6.0 pp, confirming that local spatio-temporal feature extraction prior to attention remains beneficial for the relatively short sequences produced by the multimodal feature pipeline. Removing the sinusoidal positional encoding yields the smallest absolute drop (3.0 pp), but the drop is consistent across all four tasks and confirms that the transformer benefits from explicit temporal ordering even when it is fed feature-level rather than raw-signal sequences.

4.5. Generalization to Additional Datasets

To assess whether EPECT generalizes beyond the two primary benchmarks, the trained model was further evaluated on two independent publicly available EEG-fNIRS datasets that differ in subject pool, task paradigm, and acquisition setup. Dataset characteristics and obtained accuracies are summarized in Table 10.
The first additional dataset [35] consists of EEG-fNIRS recordings from 15 healthy right-handed male participants performing motor execution tasks across five blocks of 20 trials. The original protocol involves four limb movements (right arm, left arm, right hand, and left hand); the present evaluation uses the right-hand versus left-hand contrast (binary classification) to align with the binary structure of the primary MI benchmark. Recordings comprise 21 EEG channels and 34 fNIRS channels, both substantially smaller montages than those used in the primary benchmarks. The second additional dataset [36] comprises EEG-fNIRS data acquired from 12 participants performing MA tasks under a two-class protocol, with 22 EEG channels and a sparser 9-channel fNIRS montage.
On these two datasets, EPECT attains LOSO test accuracies of 99.1% (motor execution, right hand vs. left hand) and 98.3% (MA), which are consistent with the accuracies reported on the primary benchmarks despite the differences in montage density and participant pool. The fact that performance remains high even when the fNIRS montage is reduced to nine channels suggests that EPECT does not depend on a specific high-density acquisition setup, and supports the broader applicability of the model to existing EEG-fNIRS datasets with heterogeneous instrumentation. Combined with the ablation results in Section 4.4 and the within-benchmark cross-subject results in Section 4, these experiments indicate that the eigenvalue-guided transformer design captures multimodal structure that is shared across recording configurations rather than being tied to a single setup.

4.6. Topographical Analysis and Sensitivity to Synthetic Perturbations

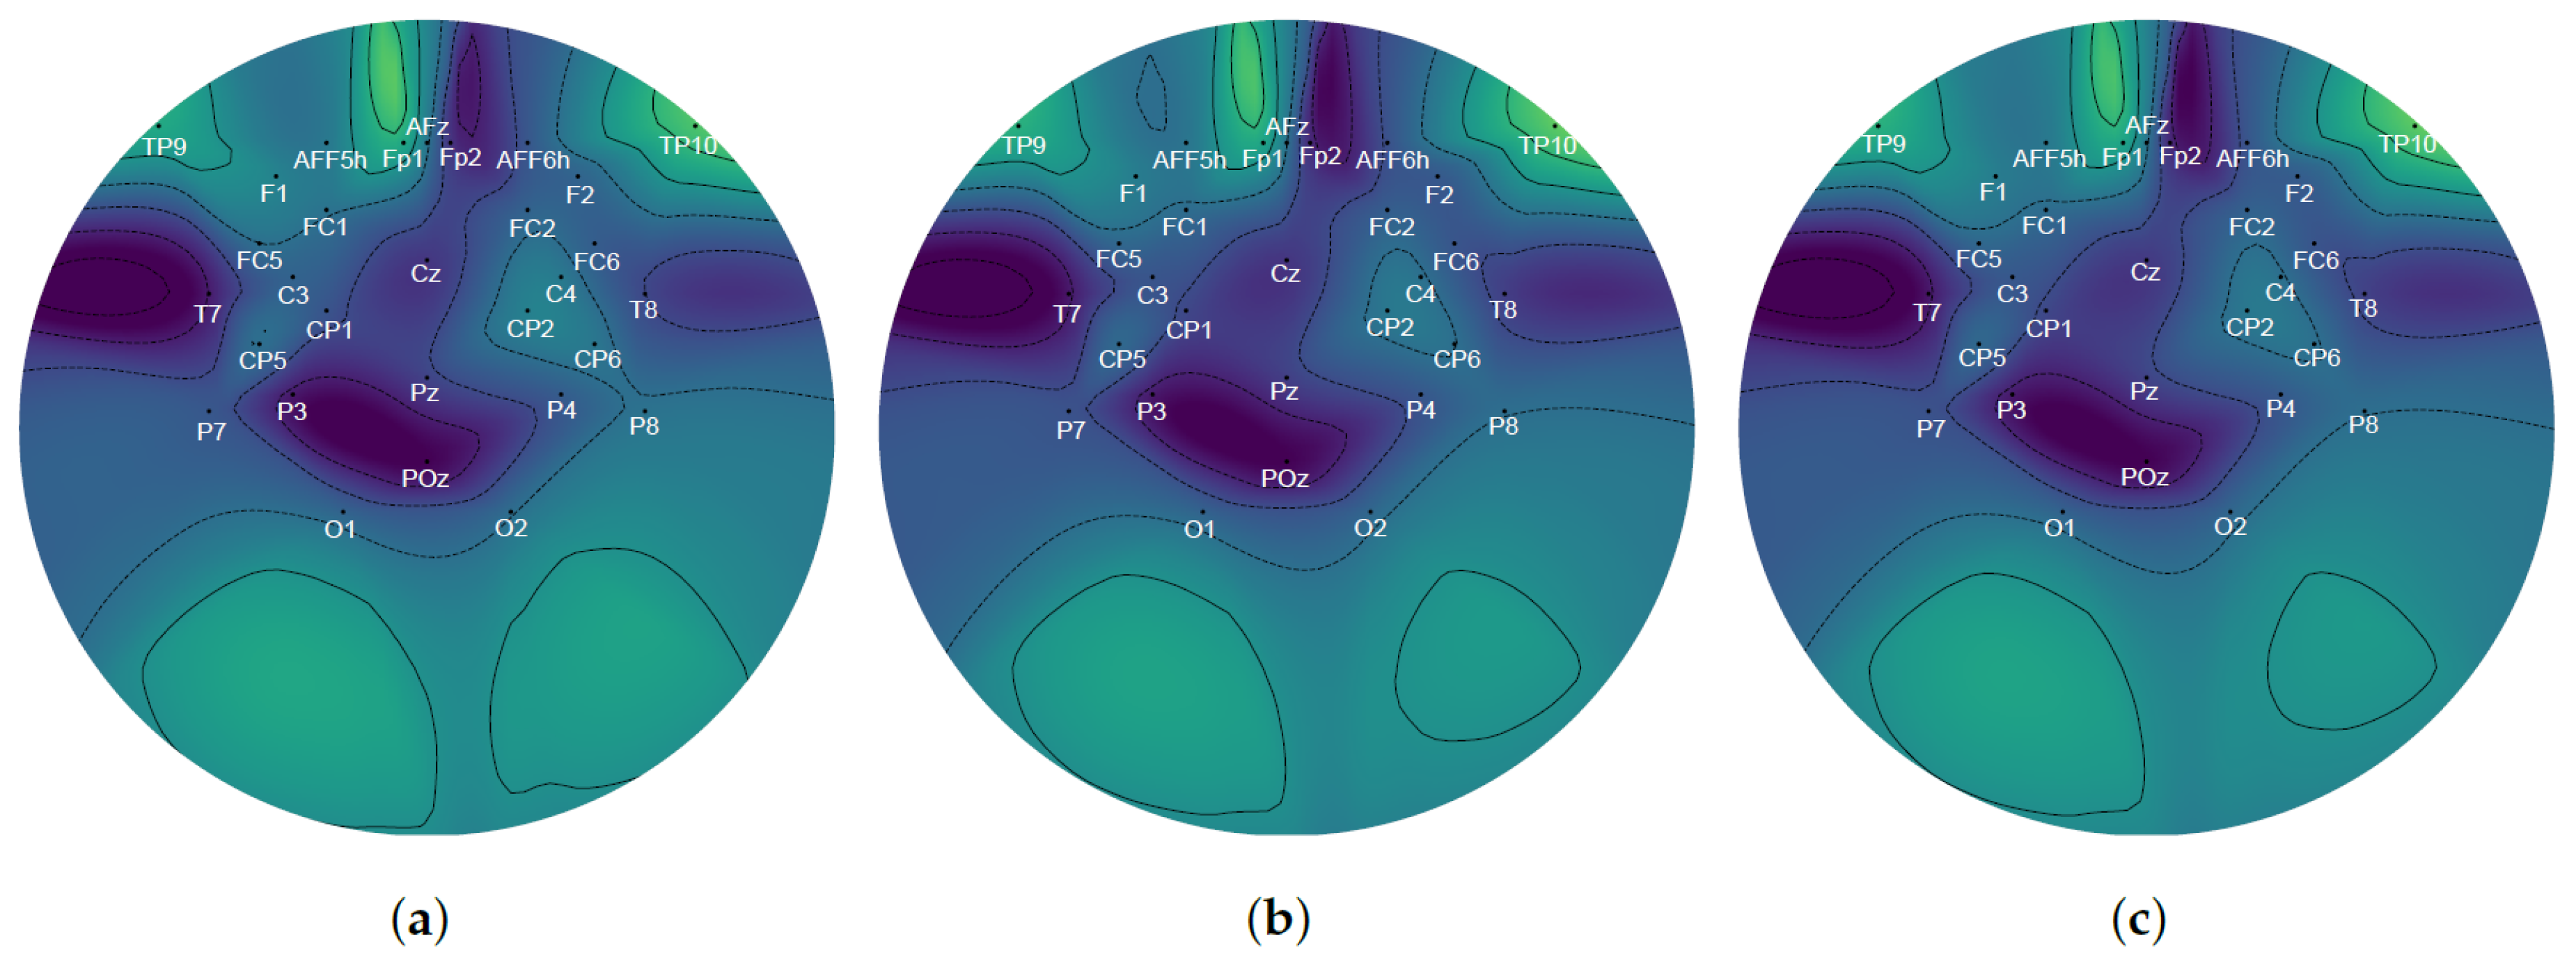
To characterize the spatial information that EPECT relies on, scalp topographies were computed from the EEG channels of representative subject VP001 in the DSR paradigm and rendered in standard 10/10 montage coordinates. The discrimination-class and selection-class maps, shown in Figure 4a,b, differ most over the centroparietal and occipital regions, with amplitude changes at electrodes CP2, CP4, and O2 that are consistent with the role of these regions in visuospatial attention and stimulus-response selection. These cross-class differences are the kind of subject-specific structure that the eigenvalue-guided self-attention is designed to emphasize.
To test whether the model retains sensitivity to small, localized changes, a controlled perturbation was applied to the discrimination-class topography: ten randomly chosen channels received a fixed-amplitude spike of magnitude 10, followed by additive Gaussian noise with standard deviation σ = 1 across all channels. The perturbed map is shown in Figure 4c.
The perturbation produces a change that is statistically detectable yet spatially localized. The Wilcoxon signed-rank test on the paired channel amplitudes gives W = 92 ( p = 0.00298 ), while the Pearson correlation between the original and perturbed maps remains very high ( r = 0.999 ), so the global scalp organization is preserved even though a small set of channels shifts systematically. This experiment is a controlled sensitivity check rather than a clinical validation: it shows that EPECT responds to subtle localized amplitude changes, but it does not establish that the model can track real neurological recovery. Validation on longitudinal patient data, such as stroke rehabilitation cohorts with repeated EEG-fNIRS recordings, remains necessary before any clinical claim about rehabilitation monitoring.

4.7. Statistical Analysis of Modality Variability

To assess the relative contribution of the two modalities to cross-subject variability, an analysis of variance (ANOVA) was performed on the preprocessed EEG and fNIRS feature representations along three independent axes: cross-subject variability for each task label, temporal variability across time frames, and label-wise differences between the two task classes. Results are summarized in Table 11.
The EEG feature representation shows highly significant variability along all three axes. Cross-subject variability is substantial for both task labels ( F = 172.83 , p < 10 4 for label 0; F = 81.51 , p < 10 4 for label 1), confirming the well-documented sensitivity of EEG to individual differences in cortical activity. Temporal variability across frames is also significant ( F = 12.06 , p = 2.85 × 10 34 ), consistent with the non-stationary nature of EEG and with the brief task-related transients exploited by the model. The label-wise contrast yields F = 71.12 ( p = 3.36 × 10 17 ), indicating that EEG carries strong task-discriminative information at the feature level. By contrast, fNIRS shows no significant variability along any axis (F between 0.85 and 0.95 with p > 0.35 in every cell of Table 11), suggesting that the canonical spectral and temporal features extracted in Section 3.4 do not by themselves capture the slow hemodynamic signatures that distinguish individuals or tasks. This asymmetry has two practical implications. First, the high classification accuracy reported in Table 5 demonstrates that the model leverages information beyond what is captured by univariate feature-level ANOVA, including the cross-modality interactions modeled by the eigenvalue-guided attention. Second, more elaborate fNIRS-specific feature design or modality-specific preprocessing may further increase the contribution of fNIRS, an avenue identified in Section 5 as future work.

4.8. Latent Space Representation Analysis

To complement the quantitative metrics reported in Table 5 and to characterize the geometry of the representations learned by EPECT, the latent feature space of the trained model was visualized using t-distributed stochastic neighbor embedding (t-SNE). Feature vectors were extracted from the penultimate layer of the network (the global average-pooled representation z in Equation (10)) for every trial in the DSR test partition, and projected into two dimensions using a perplexity of 30 and 1000 optimization iterations. The DSR task was selected for this analysis because it offers the largest sample count among the binary paradigms and therefore yields the most statistically reliable embedding.
Although the cross-subject accuracies obtained by EPECT are higher than those reported in several previous EEG-fNIRS LOSO studies, several methodological factors help explain this performance. First, the model is evaluated on feature-level multimodal representations rather than directly on raw signals, which reduces input dimensionality and suppresses high-frequency noise before transformer learning. Second, z-score normalization is performed within each LOSO fold using only the training partition, preventing information leakage from the held-out subject. Third, the convolutional front-end, positional encoding, and eigenvalue-guided attention jointly encourage the model to capture local temporal structure, sequence ordering, and dominant spectral directions that are more stable across subjects. To further verify that the reported improvement is not merely due to the feature set or evaluation protocol, additional controlled comparisons with classical machine learning, CNN, LSTM, CNN–LSTM, and standard transformer baselines are reported in Section 4.3. These comparisons are conducted using the same datasets, preprocessing pipeline, LOSO splits, and checkpoint-selection rule.
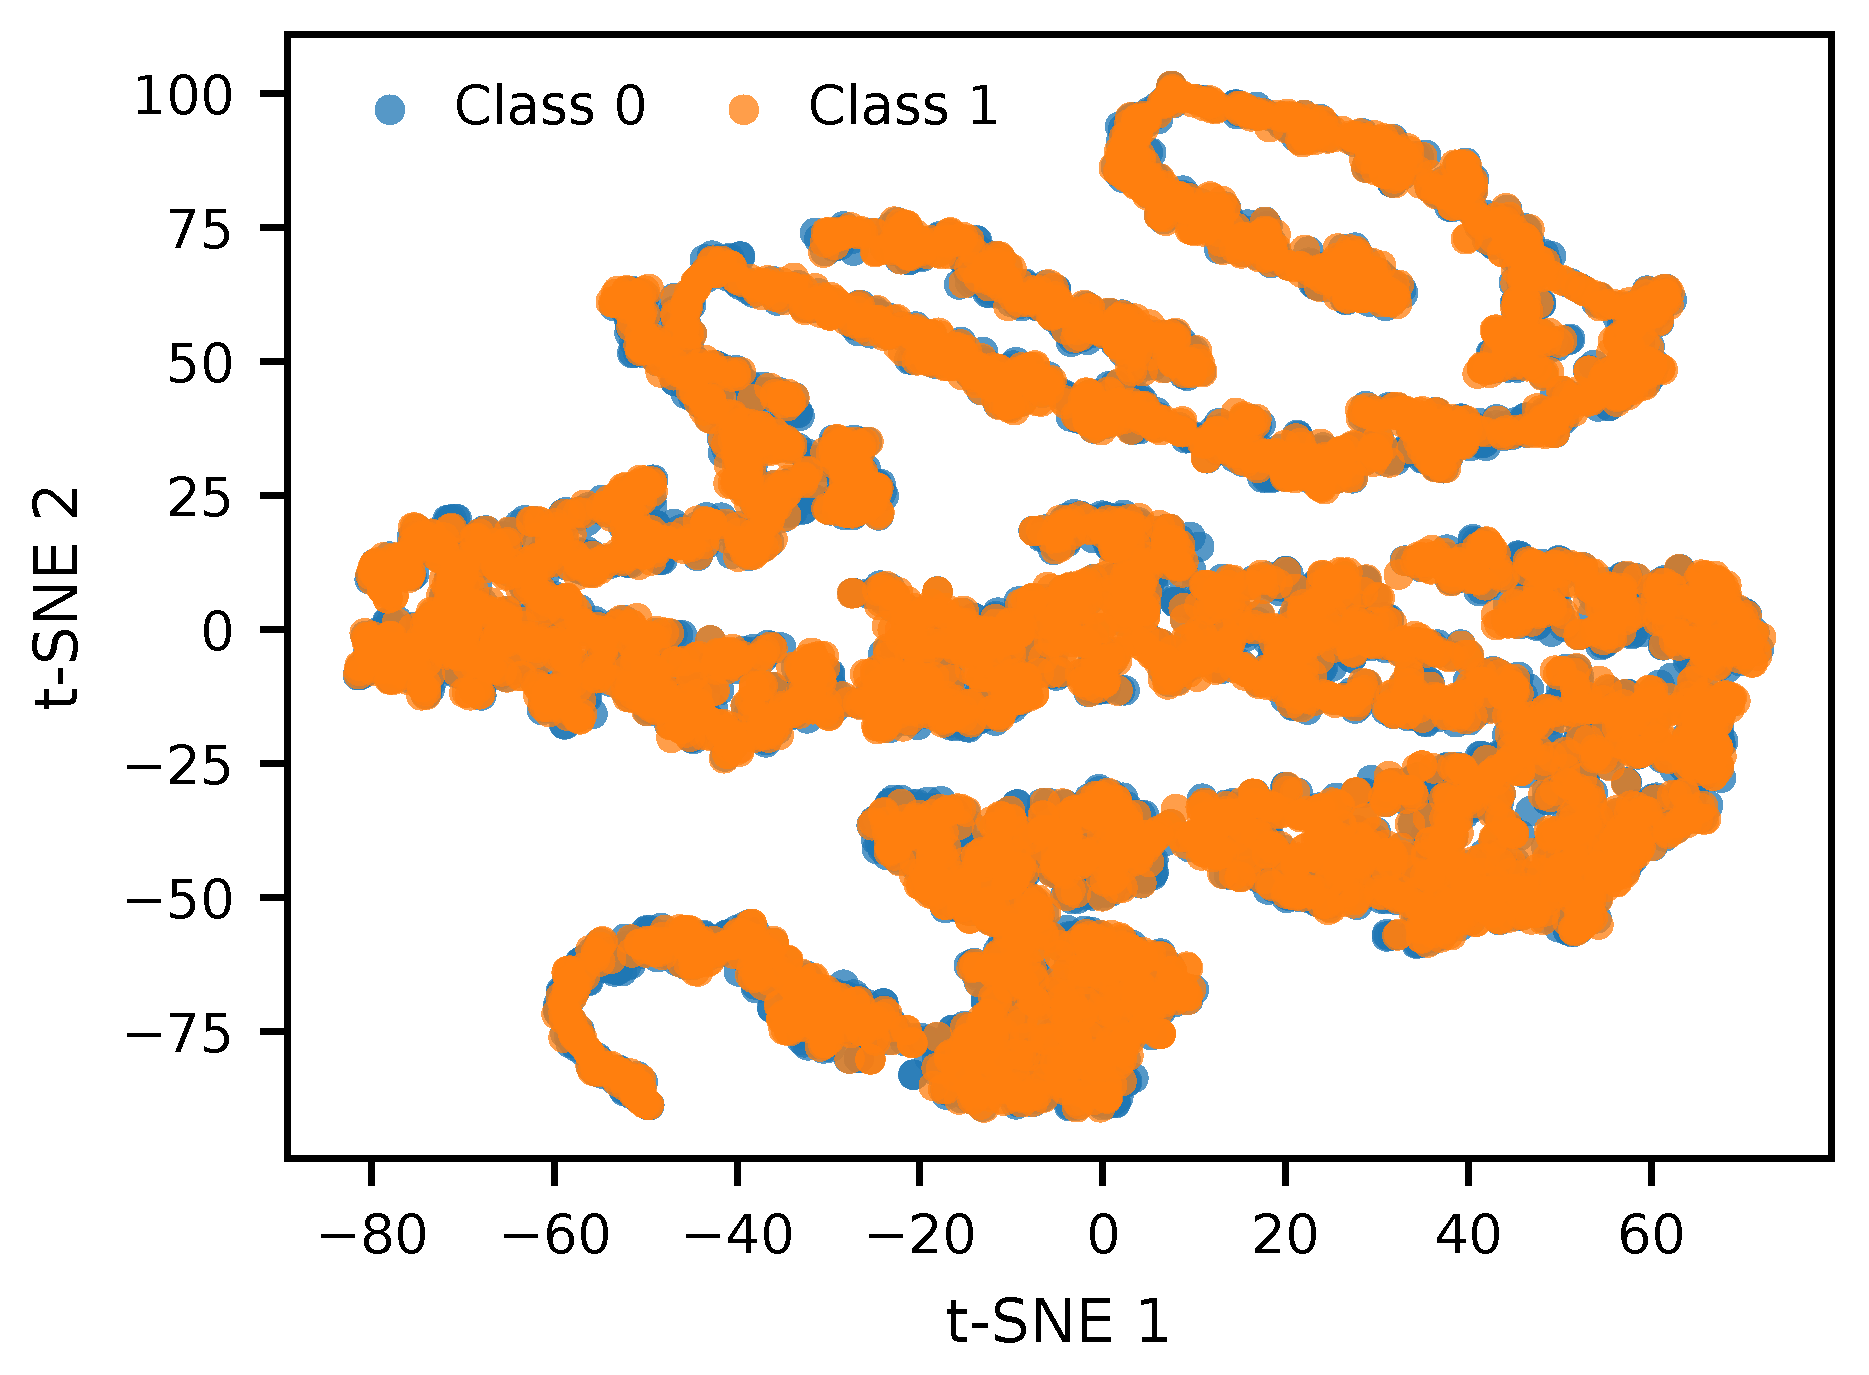
Figure 5 shows the resulting projection. The two classes occupy distinguishable regions of the embedded space and form coherent clusters, with a small amount of inter-class proximity that is expected in cognitive paradigms involving overlapping neural correlates. The clustering structure provides qualitative evidence that the eigenvalue-guided self-attention layers, together with the convolutional front-end, succeed in integrating EEG and fNIRS information into a compact representation in which class identity is geometrically encoded. This observation aligns with the high cross-subject classification accuracies reported in Table 5.

4.9. Modality-Specific Interpretability

To enhance the transparency of EPECT and identify the input regions that most influence its predictions, the Integrated Gradients (IG) attribution method was applied. IG quantifies the contribution of each input feature by accumulating the gradient of the model output with respect to the input along a straight-line path from a reference baseline to the actual input, and is well suited to neurophysiological models because it produces dense, signed attribution maps over the joint time-feature plane. All IG analyses below are computed on the DSR task using zero-valued baselines and 50 integration steps.
These attribution patterns align with known task-specific cortical mechanisms. For the DSR task, elevated EEG attribution over centroparietal and occipital channels fits their roles in sensorimotor integration, decision-related processing, and visual stimulus encoding, consistent with visuospatial attention and stimulus-response selection. For MI decoding, stronger relevance over sensorimotor channels matches motor planning and imagery-related modulation of sensorimotor rhythms, and for the n-back task, frontal and frontoparietal attribution reflects cognitive control and working-memory load. In the fNIRS maps, frontal and motor-related attribution may index hemodynamic correlates of executive control and motor planning. Given the limited spatial resolution of fNIRS, these should be read as neurophysiologically plausible patterns rather than exact source localization.
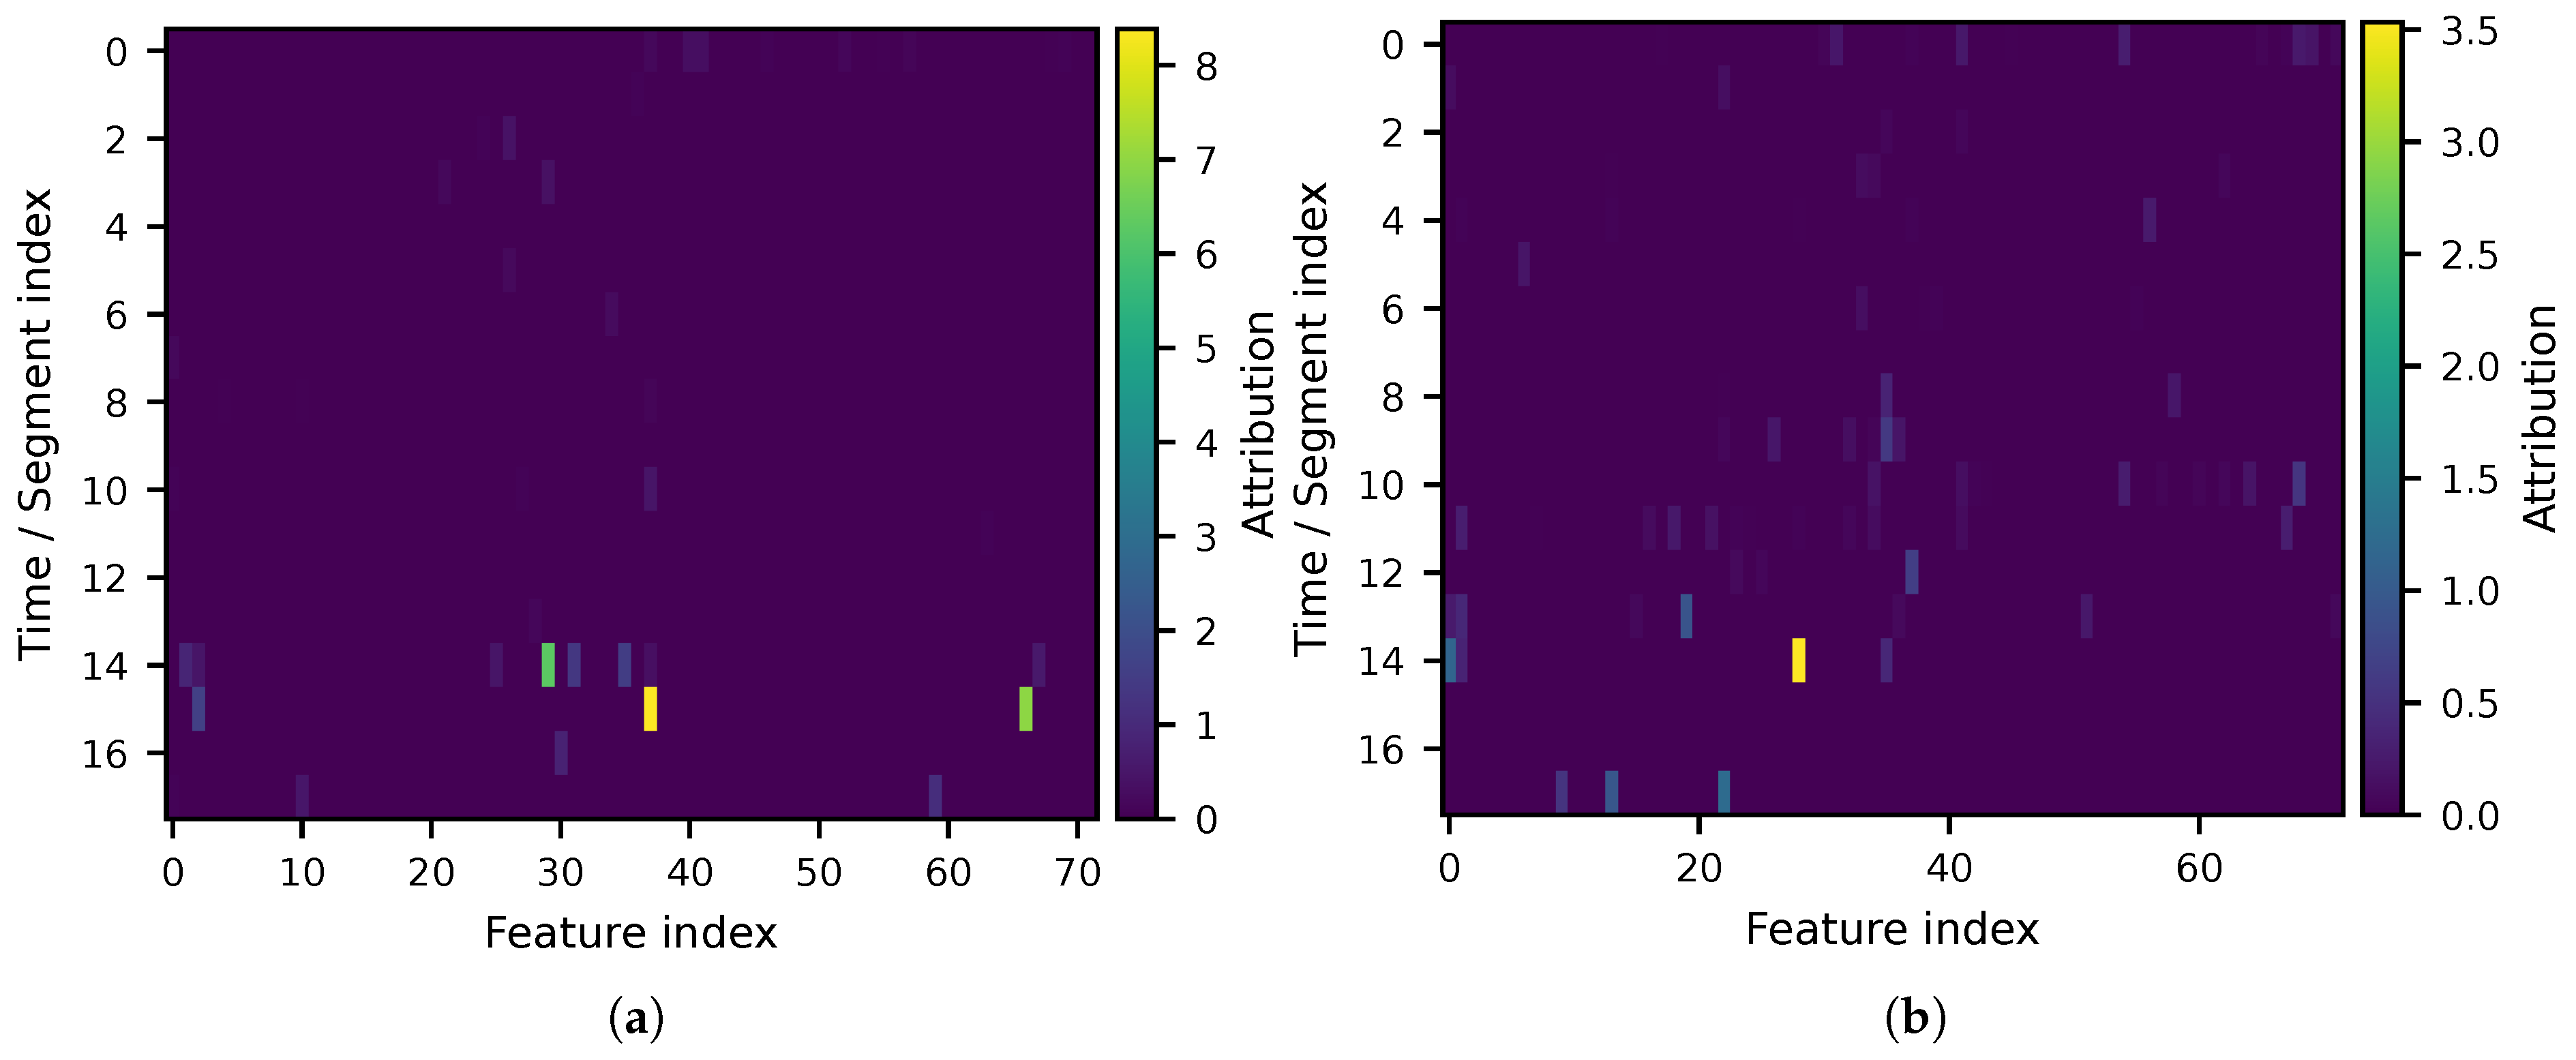
Class-wise mean IG maps for fNIRS, shown in Figure 6, were obtained by averaging the absolute IG values across all correctly classified test samples of each class. Both maps exhibit a sparse yet structured attribution pattern, with attribution concentrated at specific feature indices and time segments rather than spread diffusely across the input plane. This sparsity is consistent with the expected behavior of a well-trained neurophysiological decoder, in which only a small subset of cortical regions and temporal windows is task-relevant. The discrimination and selection classes recruit partially overlapping but distinct subsets of fNIRS features, providing a modality-level corroboration of the topographical differences reported in Section 4.6.
Taken together with the latent-space analysis in Section 4.8, these attribution maps indicate that EPECT bases its predictions on structured, modality-specific neurophysiological patterns rather than on diffuse activation across the input plane, which supports its use in interpretable neuroimaging applications.

5. Conclusions

This study introduced EPECT, an eigenvalue-guided positional encoding transformer for cross-subject classification of cognitive and motor tasks from multimodal EEG-fNIRS signals. The architecture couples a stacked one-dimensional convolutional front-end with a pre-norm transformer encoder whose multi-head self-attention reweights queries, keys, and values along the dominant eigendirections of their Gram matrices, allowing the model to amplify the most informative spectral components of the learned representation while suppressing subject-specific noise. Under the LOSO protocol on two public EEG-fNIRS benchmarks, EPECT attained test accuracies of 97.3%, 96.3%, 98.1%, and 97.9% on the MI, n-back, DSR, and WG tasks, respectively, and the ablation study identified the eigenvalue-guided attention as the largest individual contributor to performance (8.0 pp on average), followed by the convolutional front-end (6.0 pp) and the sinusoidal positional encoding (3.0 pp). Comparable accuracies of 99.1% and 98.3% on two independent EEG-fNIRS datasets with reduced channel counts confirmed that the architecture generalizes across heterogeneous instrumentation, while the Integrated Gradients analyses indicated that predictions are driven by structured, modality-specific neurophysiological patterns rather than diffuse activation across the input plane.
Additional modality contribution experiments showed that EEG-only and fNIRS-only inputs each provide useful but incomplete task information, while the combined EEG-fNIRS configuration produced the highest average accuracy, confirming the complementary value of multimodal fusion. Comparisons with CNN and LSTM baselines under the same LOSO protocol further demonstrated that EPECT’s performance gains arise from the proposed eigenvalue-guided convolution–transformer design rather than from the feature representation alone.
Future work will proceed in three directions. First, the amplification coefficients α and β will be made adaptive and learned per fold rather than fixed across folds. Second, the per-batch eigendecomposition will be accelerated through low-rank or randomized approximations, which is a prerequisite for real-time decoding in deployed brain-computer interface systems. Third, the architecture will be evaluated under longitudinal protocols, in which intra-subject distribution shifts arise over weeks or months of repeated acquisitions.

Author Contributions

Conceptualization, C.B. and L.H.B.; methodology, C.B.; software, C.B.; validation, L.H.B.; formal analysis, S.K.; investigation, L.H.B. and S.K.; resources, C.B.; data curation, C.B.; writing—original draft preparation, C.B. and L.H.B.; writing—review and editing, C.B. and L.H.B.; visualization, C.B.; supervision, S.K.; project administration, L.H.B.; funding acquisition, S.K. All authors have read and agreed to the published version of the manuscript.

Funding

This work was supported by the National Research Foundation of Korea (NRF) grant funded by the Government of Korea (MSIT) (No. 2022R1A2C1005316) and in part by the Gachon university research fund of 2025 (GCU-202503060001).

Data Availability Statement

The datasets used in this research are open-sourced datasets. The code is available at https://github.com/yiamcb/EPECT (accessed on 1 May 2026).

Conflicts of Interest

The authors declare no conflicts of interest.

References

  1. Vatinno, A.A.; Simpson, A.; Ramakrishnan, V.; Bonilha, H.S.; Bonilha, L.; Seo, N.J. The Prognostic Utility of Electroencephalography in Stroke Recovery: A Systematic Review and Meta-Analysis. Neurorehabilit. Neural Repair 2022, 36, 255–268. [Google Scholar] [CrossRef] [Scilit] [PubMed]
  2. Bunterngchit, C.; Wang, J.; Su, J.; Wang, Y.; Liu, S.; Hou, Z.G. Temporal attention fusion network with custom loss function for EEG-fNIRS classification. J. Neural Eng. 2024, 21, 066016. [Google Scholar] [CrossRef] [Scilit] [PubMed]
  3. Liu, Z.; Shore, J.; Wang, M.; Yuan, F.; Buss, A.; Zhao, X. A systematic review on hybrid EEG/fNIRS in brain-computer interface. Biomed. Signal Process. Control 2021, 68, 102595. [Google Scholar] [CrossRef] [Scilit]
  4. Rabbani, M.H.R.; Islam, S.M.R. Deep learning networks based decision fusion model of EEG and fNIRS for classification of cognitive tasks. Cogn. Neurodyn. 2023, 18, 1489–1506. [Google Scholar] [CrossRef] [Scilit] [PubMed]
  5. Chuang, C.H.; Chang, K.Y.; Huang, C.S.; Bessas, A.M. Augmenting brain-computer interfaces with ART: An artifact removal transformer for reconstructing multichannel EEG signals. NeuroImage 2025, 310, 121123. [Google Scholar] [CrossRef] [Scilit] [PubMed]
  6. Ding, Y.; Udompanyawit, C.; Zhang, Y.; He, B. EEG-based brain-computer interface enables real-time robotic hand control at individual finger level. Nat. Commun. 2025, 16, 5401. [Google Scholar] [CrossRef] [Scilit] [PubMed]
  7. Gao, Y.; Jia, B.; Houston, M.; Zhang, Y. Hybrid EEG-fNIRS Brain Computer Interface Based on Common Spatial Pattern by Using EEG-Informed General Linear Model. IEEE Trans. Instrum. Meas. 2023, 72, 4006110. [Google Scholar] [CrossRef] [Scilit]
  8. Baghaeifar, E.; Shamekhi, S.; Shalchizadeh, F. An fNIRS-BCI study: Effective channels selection in imagining right and left hand movements via brain functional connectivity. Biomed. Signal Process. Control 2025, 109, 107915. [Google Scholar] [CrossRef] [Scilit]
  9. Dale, R.; O’sullivan, T.D.; Howard, S.; Orihuela-Espina, F.; Dehghani, H. System Derived Spatial-Temporal CNN for High-Density fNIRS BCI. IEEE Open J. Eng. Med. Biol. 2023, 4, 85–95. [Google Scholar] [CrossRef] [Scilit] [PubMed]
  10. Guo, M.; Feng, L.; Chen, X.; Li, M.; Xu, G. A novel strategy for differentiating motor imagination brain-computer interface tasks by fusing EEG and functional near-infrared spectroscopy signals. Biomed. Signal Process. Control 2024, 95, 106448. [Google Scholar] [CrossRef] [Scilit]
  11. Shi, X.; Wang, H.; Li, B.; Qin, Y.; Peng, C.; Lu, Y. Fusion Analysis of EEG-fNIRS Multimodal Brain Signals: A Multitask Classification Algorithm Incorporating Spatial-Temporal Convolution and Dual Attention Mechanisms. IEEE Trans. Instrum. Meas. 2025, 74, 2506312. [Google Scholar] [CrossRef] [Scilit]
  12. Bunterngchit, C.; Wang, J.; Su, J.; Wang, Y.; Liu, S.; Hou, Z.G. AMFN: Autoencoder-led Multimodal Fusion Network for EEG-fNIRS Classification. Procedia Comput. Sci. 2024, 250, 8–14. [Google Scholar] [CrossRef] [Scilit]
  13. Qin, Y.; Li, B.; Wang, W.; Shi, X.; Peng, C.; Wang, X.; Wang, H. ECA-FusionNet: A hybrid EEG-fNIRS signals network for MI classification. J. Neural Eng. 2025, 22, 016030. [Google Scholar] [CrossRef] [Scilit] [PubMed]
  14. Wang, H.; Yuan, Z.; Zhang, H.; Wan, F.; Li, Y.; Xu, T. Hybrid EEG-fNIRS decoding with dynamic graph convolutional-capsule networks for motor imagery/execution. Biomed. Signal Process. Control 2025, 104, 107570. [Google Scholar] [CrossRef] [Scilit]
  15. Arif, A.; Wang, Y.; Yin, R.; Zhang, X.; Helmy, A. EF-Net: Mental State Recognition by Analyzing Multimodal EEG-fNIRS via CNN. Sensors 2024, 24, 1889. [Google Scholar] [CrossRef] [Scilit] [PubMed]
  16. Shelishiyah, R.; Thiyam, D.B.; Margaret, M.J.; Banu, N.M.M. A hybrid CNN model for classification of motor tasks obtained from hybrid BCI system. Sci. Rep. 2025, 15, 1360. [Google Scholar] [CrossRef] [Scilit] [PubMed]
  17. Bunterngchit, C.; Wang, J.; Chearanai, T.; Hou, Z.G. Enhanced EEG-fNIRS Classification through Concatenated Convolutional Neural Network with Band Analysis. In 2023 IEEE International Conference on Robotics and Biomimetics (ROBIO); IEEE: Piscataway, NJ, USA, 2023; pp. 1–6. [Google Scholar] [CrossRef] [Scilit]
  18. Ramirez, M.; Khalil, M.A.; Can, J.; George, K. Classification of “Like” and “Dislike” Decisions From EEG and fNIRS Signals Using a LSTM Based Deep Learning Network. In 2022 IEEE World AI IoT Congress (AIIoT); IEEE: Piscataway, NJ, USA, 2022; pp. 252–255. [Google Scholar] [CrossRef] [Scilit]
  19. Sirpal, P.; Kassab, A.; Pouliot, P.; Nguyen, D.K. fNIRS improves seizure detection in multimodal EEG-fNIRS recordings. J. Biomed. Opt. 2019, 24, 051408. [Google Scholar] [CrossRef] [Scilit] [PubMed]
  20. Ghonchi, H.; Fateh, M.; Abolghasemi, V.; Ferdowsi, S.; Rezvani, M. Deep recurrent–convolutional neural network for classification of simultaneous EEG–fNIRS signals. IET Signal Process. 2020, 14, 142–153. [Google Scholar] [CrossRef] [Scilit]
  21. Cicalese, P.A.; Li, R.; Ahmadi, M.B.; Wang, C.; Francis, J.T.; Selvaraj, S.; Schulz, P.E.; Zhang, Y. An EEG-fNIRS hybridization technique in the four-class classification of alzheimer’s disease. J. Neurosci. Methods 2020, 336, 108618. [Google Scholar] [CrossRef] [Scilit] [PubMed]
  22. He, Q.; Feng, L.; Jiang, G.; Xie, P. Multimodal Multitask Neural Network for Motor Imagery Classification with EEG and fNIRS Signals. IEEE Sens. J. 2022, 22, 20695–20706. [Google Scholar] [CrossRef] [Scilit]
  23. Ge, S.; Wang, P.; Liu, H.; Lin, P.; Gao, J.; Wang, R.; Iramina, K.; Zhang, Q.; Zheng, W. Neural Activity and Decoding of Action Observation Using Combined EEG and fNIRS Measurement. Front. Hum. Neurosci. 2019, 13, 357. [Google Scholar] [CrossRef] [Scilit] [PubMed]
  24. Li, Y.; Wang, Y.; Lei, B.; Wang, S. SCDM: Unified Representation Learning for EEG-to-fNIRS Cross-Modal Generation in MI-BCIs. IEEE Trans. Med. Imaging 2025, 44, 2384–2394. [Google Scholar] [CrossRef] [Scilit] [PubMed]
  25. Maher, A.; Mian Qaisar, S.; Salankar, N.; Jiang, F.; Tadeusiewicz, R.; Pławiak, P.; Abd El-Latif, A.A.; Hammad, M. Hybrid EEG-fNIRS brain-computer interface based on the non-linear features extraction and stacking ensemble learning. Biocybern. Biomed. Eng. 2023, 43, 463–475. [Google Scholar] [CrossRef] [Scilit]
  26. Nour, M.; Öztürk, Ş.; Polat, K. A novel classification framework using multiple bandwidth method with optimized CNN for brain–computer interfaces with EEG-fNIRS signals. Neural Comput. Appl. 2021, 33, 15815–15829. [Google Scholar] [CrossRef] [Scilit]
  27. Mughal, N.E.; Khan, M.J.; Khalil, K.; Javed, K.; Sajid, H.; Naseer, N.; Ghafoor, U.; Hong, K.S. EEG-fNIRS-based hybrid image construction and classification using CNN-LSTM. Front. Neurorobot. 2022, 16, 873239. [Google Scholar] [CrossRef] [Scilit] [PubMed]
  28. Kwak, Y.; Song, W.J.; Kim, S.E. FGANet: FNIRS-Guided Attention Network for Hybrid EEG-fNIRS Brain-Computer Interfaces. IEEE Trans. Neural Syst. Rehabil. Eng. 2022, 30, 329–339. [Google Scholar] [CrossRef] [Scilit] [PubMed]
  29. Li, R.; Potter, T.; Huang, W.; Zhang, Y. Enhancing Performance of a Hybrid EEG-fNIRS System Using Channel Selection and Early Temporal Features. Front. Hum. Neurosci. 2017, 11, 462. [Google Scholar] [CrossRef] [Scilit] [PubMed]
  30. Si, X.; Zhang, S.; Yang, Z.; Yu, J.; Ming, D. A bidirectional cross-modal transformer representation learning model for EEG-fNIRS multimodal affective BCI. Expert Syst. Appl. 2025, 266, 126081. [Google Scholar] [CrossRef] [Scilit]
  31. Shin, J.; von Lühmann, A.; Kim, D.W.; Mehnert, J.; Hwang, H.J.; Müller, K.R. Simultaneous acquisition of EEG and NIRS during cognitive tasks for an open access dataset. Sci. Data 2018, 5, 180003. [Google Scholar] [CrossRef] [Scilit] [PubMed]
  32. Bunterngchit, C.; Wang, J.; Hou, Z.G. Simultaneous EEG-fNIRS Data Classification Through Selective Channel Representation and Spectrogram Imaging. IEEE J. Transl. Eng. Health Med. 2024, 12, 600–612. [Google Scholar] [CrossRef] [Scilit] [PubMed]
  33. Bunterngchit, C.; Wang, J.; Su, J.; Wang, Y.; Liu, S.; Hou, Z.G. Enhanced Cross-Subject Classification of Hybrid EEG-fNIRS Data Using the Simplified Multimodal Transformer Network. In Neural Information Processing; Springer: Singapore, 2025; pp. 300–313. [Google Scholar] [CrossRef] [Scilit]
  34. Shin, J.; von Luhmann, A.; Blankertz, B.; Kim, D.W.; Jeong, J.; Hwang, H.J.; Muller, K.R. Open Access Dataset for EEG+NIRS Single-Trial Classification. IEEE Trans. Neural Syst. Rehabil. Eng. 2017, 25, 1735–1745. [Google Scholar] [CrossRef] [Scilit] [PubMed]
  35. Buccino, A.P.; Keles, H.O.; Omurtag, A. Hybrid EEG-fNIRS Asynchronous Brain-Computer Interface for Multiple Motor Tasks. PLoS ONE 2016, 11, e0146610. [Google Scholar] [CrossRef] [Scilit] [PubMed]
  36. Shin, J.; Müller, K.R.; Hwang, H.J. Eyes-closed hybrid brain-computer interface employing frontal brain activation. PLoS ONE 2018, 13, e0196359. [Google Scholar] [CrossRef] [Scilit] [PubMed]
Figure 1. Architecture of the proposed EPECT model. (a) The fused multimodal feature sequence passes through three stacked one-dimensional convolutional layers, is combined with sinusoidal positional encoding, processed by L = 6 identical eigenvalue-guided transformer blocks, and mapped to class posteriors through global average pooling (GAP) and a softmax classifier. (b) Internal structure of a single EPECT block under the pre-norm formulation, with layer normalization (LN), the eigenvalue-guided multi-head self-attention module (Eigen-MHSA) that constitutes the novel component of the architecture, a position-wise feed-forward network (FFN), and two residual connections (dashed).
Mathematics 14 02416 g001
Figure 2. Learning dynamics of EPECT averaged across LOSO folds: (a) training and validation accuracy as a function of training epoch; (b) training and validation loss as a function of training epoch. Both curves indicate stable convergence without overfitting, with the validation curves closely tracking the training curves throughout optimization.
Mathematics 14 02416 g002
Figure 3. Confusion matrices of EPECT on the held-out test partitions under the LOSO protocol for the four tasks. Counts are concentrated along the main diagonal in every paradigm, indicating reliable class separation across subjects.
Mathematics 14 02416 g003
Figure 4. EEG scalp topographies for representative subject VP001 in the DSR paradigm. (a) Average channel activity for the discrimination class. (b) Average channel activity for the selection class. (c) Discrimination-class topography after controlled perturbation in which ten randomly chosen channels were augmented with a fixed-amplitude spike (magnitude 10) and additive Gaussian noise ( σ = 1 ) was applied across all channels. The perturbation simulates the localized amplitude changes that can accompany rehabilitation-relevant cortical reorganization.
Mathematics 14 02416 g004
Figure 5. t-SNE projection of the EPECT latent embeddings on the DSR test partition. Each point corresponds to a single test trial, with color denoting the ground-truth class label. Trials from the two classes form coherent clusters with limited inter-class overlap, indicating that EPECT learns a class-discriminative low-dimensional representation of the multimodal input.
Mathematics 14 02416 g005
Figure 6. Class-wise mean Integrated Gradients (IG) attribution maps for the fNIRS modality on the DSR test partition: (a) discrimination class; (b) selection class. The horizontal axis indexes fNIRS feature channels and the vertical axis indexes time segments within a trial. Brighter colors denote larger absolute attribution. The maps were obtained by averaging absolute IG values across all correctly classified test samples of each class.
Mathematics 14 02416 g006
Table 2. Computational complexity and runtime comparison between a standard transformer and EPECT. Runtime values are estimated under the same input representation, batch size, hardware, and training protocol.
ModelAdditional Attention CostTrain Time/EpochInference Time/BatchRelative Overhead
Standard transformer O ( H T 2 d h ) 18.4 s7.8 ms1.00×
EPECT O ( H T 2 d h + 3 H d h 3 ) 22.1 s9.3 ms1.20×
Table 3. Spectral and temporal features extracted per channel from the preprocessed EEG and fNIRS windows.
Feature CategoryDescription
PSDBand-limited power in the θ (4–8 Hz), α (8–14 Hz), β (14–30 Hz), and  γ (30–45 Hz) bands estimated using Welch’s method
Inter-peak statisticsAverage peak-to-peak interval and peak-to-peak amplitude of the windowed waveform
AUCTrapezoidal integration of the magnitude spectrum used as an aggregate energy measure
Spectral roll-offFrequency below which a fixed proportion of the spectral energy is concentrated
Morlet wavelet coefficientsMulti-scale time–frequency representation summarized across scales
Mel-frequency cepstral coefficientsShort-term spectral envelope features computed on the windowed signal
VarianceTemporal dispersion of the windowed signal
Hjorth parametersActivity, mobility, and complexity indices that capture amplitude, frequency, and bandwidth properties
Spectral entropyShannon entropy of the normalized power spectrum, used as a measure of spectral randomness
Table 4. Hyperparameter settings used for EPECT training and evaluation.
HyperparameterValue
Input window length2.5 s
Window overlap1.0 s
Convolutional layers3
Convolution kernel size3
Model width C128
Transformer blocks L6
Attention heads H8
Feed-forward dimension d f f 256
Eigenvalue coefficient α 0.5
Eigenvalue coefficient β 0.5
Numerical stability constant ϵ 10 6
Dropout rate0.30
OptimizerAdam
Learning rate 1 × 10 3
Batch size32
Maximum epochs50
Early stopping patience10 epochs
Checkpoint selectionLowest validation loss
Table 5. Cross-subject classification performance of EPECT across the four task paradigms under the LOSO protocol. Training and validation accuracies are reported as the mean across folds; the test accuracy is reported on the held-out subject of each fold. Sample counts refer to the original (pre-augmentation) trial counts used to construct each cross-validation split.
TaskSubjectsClassesSamplesTrain acc. (%)Val. Acc. (%)Test Acc. (%)
MI293 (LH, RH, rest)56099.6997.5597.3
n-back263 (0-, 2-, 3-back)67699.2095.3596.3
DSR262889299.6898.1498.1
WG262156099.7697.4497.9
Table 6. Modality contribution analysis under the LOSO protocol. EEG-only, fNIRS-only, and combined EEG-fNIRS configurations were evaluated with the same EPECT architecture and training protocol. The combined configuration gives the strongest performance, which points to a complementary contribution from the electrophysiological and hemodynamic signals.
Input ConfigurationMI (%)n-Back (%)DSR (%)WG (%)Average (%)
EEG only88.686.989.989.088.6
fNIRS only80.577.882.480.780.4
EEG-fNIRS97.396.398.197.997.4
Table 7. Comparison between EPECT and simpler deep learning baselines under the same LOSO protocol. The CNN and LSTM baselines used the same input representation and training procedure as EPECT; therefore, the gap in accuracy is attributable to the model architecture.
ModelMI (%)n-Back (%)DSR (%)WG (%)Average (%)
CNN baseline78.476.980.279.178.7
LSTM baseline80.178.381.680.880.2
EPECT97.396.398.197.997.4
Table 8. Comprehensive comparison of EPECT with competing models under the same preprocessing pipeline, feature extraction procedure, LOSO protocol, and dataset splits. The results show that EPECT consistently outperforms conventional machine learning, recurrent, convolutional, hybrid, and standard transformer baselines across all four tasks.
ModelMI (%)n-Back (%)DSR (%)WG (%)Average (%)
SVM71.268.573.170.470.8
RF73.870.975.472.673.2
CNN78.476.980.279.178.7
LSTM80.178.381.680.880.2
CNN–LSTM84.382.185.683.783.9
Standard transformer89.888.191.290.489.9
EPECT97.396.398.197.997.4
Table 9. Ablation study of EPECT under the LOSO protocol. Each variant removes one architectural component while keeping all other hyperparameters fixed. Reported accuracies are the means across LOSO folds on the held-out test partitions, and the rightmost column shows the average absolute drop relative to the full model.
ConfigurationMI (%)n-Back (%)DSR (%)WG (%)Average (%) Δ vs. Full (pp)
EPECT (full)97.396.398.197.997.4
w/o positional encoding94.393.395.194.994.4 3.0
w/o convolutional front-end91.390.392.191.991.4 6.0
w/o eigenvalue-guided attention89.388.390.189.989.4 8.0
Table 10. Generalization of EPECT to two independent EEG-fNIRS datasets. Both datasets differ from the primary benchmarks in subject pool, paradigm, and montage. Reported accuracies follow the LOSO protocol used elsewhere in the paper.
DatasetSubjectsEEG ChannelsfNIRS ChannelsTask (Classes)Test Accuracy (%)
[35]15 (right-handed males)2134Motor execution: right vs. left hand (2)99.1
[36]12229MA (2)98.3
Table 11. ANOVA results for the EEG and fNIRS feature representations along three axes: cross-subject variability (separately for class labels 0 and 1), temporal variability across all time frames, and label-wise differences between the two task classes. EEG yields large F-statistics with negligible p-values along every axis, whereas fNIRS shows no significant variability along any axis.
Source of VariabilityLabelEEG FEEG p-ValuefNIRS FfNIRS p-Value
Cross-subject0172.83< 10 4 0.950.5275
Cross-subject181.51< 10 4 0.920.5835
Temporal (frames)All12.06 2.85 × 10 34 0.910.5585
Label difference1 vs. 071.12 3.36 × 10 17 0.850.3557
Disclaimer/Publisher’s Note: The statements, opinions and data contained in all publications are solely those of the individual author(s) and contributor(s) and not of MDPI and/or the editor(s). MDPI and/or the editor(s) disclaim responsibility for any injury to people or property resulting from any ideas, methods, instructions or products referred to in the content.