Article

Technology Blockade and R&D Investment Under Asymmetric Spillovers

School of Maritime Economics and Management, Dalian Maritime University, Dalian 116026, China
*
Author to whom correspondence should be addressed.
Mathematics 2026, 14(12), 2169; https://doi.org/10.3390/math14122169
Submission received: 28 April 2026 / Revised: 8 June 2026 / Accepted: 12 June 2026 / Published: 17 June 2026

Abstract

This paper examines how technology blockade affects leader and follower firms’ research and development (R&D) incentives and their cooperation decisions under asymmetric knowledge spillovers, while also exploring the role of government subsidies in mitigating market failures and restoring cooperation incentives. Motivated by the increasing restrictions on knowledge diffusion in high-technology industries, we develop a two-stage game in which firms first choose R&D investment and then compete in quantities under both non-cooperative and cooperative regimes. Our analysis shows that the impact of technology blockade on firms’ R&D investment and profit distribution depends on R&D efficiency and the presence of asymmetric knowledge spillovers. Specifically, under non-cooperative behavior, the interaction between asymmetric spillovers and R&D efficiency generates nonlinear effects on both R&D efforts and profit allocation. Under cooperative regimes, although firms can internalize spillovers, technology blockade reduces coordination benefits and leads to asymmetric profits, resulting in the absence of a self-enforcing cooperation region. Furthermore, our results indicate that government subsidies can partially or fully restore cooperation incentives, thereby increasing R&D investment and enhancing social welfare in most cases. These findings highlight a substitution effect between policy intervention and external technological constraints, emphasizing the importance of targeted subsidies in mitigating the adverse effects of technology blockade on innovation and collaboration.

1. Introduction

1.1. Background and Motivation

In recent years, rising geopolitical tensions have led to the widespread adoption of technology blockades, export controls, and restrictions on knowledge diffusion. These policies are particularly prominent in high-technology industries, where innovation depends not only on firms’ internal research and development (R&D) efforts but also critically on external knowledge spillovers. Consequently, the effect of technology blockades on firms’ R&D incentives has attracted significant attention from both academics and governments.
For instance, in the semiconductor and telecommunications equipment industries, governments have imposed export restrictions on firms such as Huawei Technologies Company, significantly limiting access to advanced chips and critical software tools. In general, a technology blockade refers to measures that restrict the flow of key technologies, patents, or knowledge to protect strategic advantages. Such restrictions reduce firms’ access to external advanced knowledge, increase R&D costs, and may compel firms to adjust their innovation strategies. Empirical evidence suggests that firms may respond to such restrictions by increasing and restructuring their R&D investment. For example, Huawei’s R&D expenditure increased steadily from 101.5 billion RMB in 2018 to 192.3 billion RMB in 2025, according to Huawei annual reports (2018–2025), indicating sustained innovation investment despite external technology constraints. The reports are available online at: https://www.huawei.com/cn/annual-report (accessed on 4 June 2026). In the field of artificial intelligence, export controls on high-performance computing chips—such as advanced GPUs supplied by NVIDIA—similarly constrain access to essential innovation inputs, affecting knowledge diffusion and R&D efficiency. Furthermore, competition over technological standard-setting in telecommunications reinforces a leader–follower structure in which knowledge spillovers are often asymmetric and restricted.
These real-world observations suggest that technology blockades do not necessarily eliminate innovation incentives, but rather reshape the structure and direction of R&D activities and knowledge flows.
Theoretical research in industrial organization has long emphasized the importance of knowledge spillovers in shaping firms’ R&D investment and market outcomes. Seminal contributions by d’Aspremont and Jacquemin (1988) [1] and Kamien et al. (1992) [2] demonstrate that R&D cooperation can internalize knowledge externalities and enhance innovation efficiency. However, these frameworks typically assume frictionless or symmetric knowledge diffusion and do not account for external constraints such as technology blockades. Recent theoretical work has further highlighted the implications of asymmetric knowledge spillovers for innovation strategies. For instance, Marini et al. (2014) [3] show that when knowledge primarily flows from leaders to followers, investing as an R&D follower can become highly profitable. Similarly, Ishikawa and Shibata (2021) [4] find that inflow spillover effects (gains obtained from competitors) often exceed outflow spillover effects (losses due to one’s own knowledge leakage), indicating that asymmetric spillovers can significantly shape firms’ R&D decisions. These findings underscore the importance of considering asymmetric knowledge diffusion when analyzing innovation behavior under external constraints.
In practice, knowledge spillovers are often asymmetric and subject to institutional constraints. Technology blockades may reduce or distort these spillovers without completely eliminating them, creating an environment in which firms face both incentives to cooperate and external constraints on innovation. In such an environment, firms’ R&D efficiency, the effectiveness of knowledge spillovers, and their propensity to engage in collaborative behavior may all be affected, highlighting the importance of examining these effects. Consequently, a central research question arises: how do technology blockades influence firms’ R&D investment decisions, cooperation incentives, the effectiveness of knowledge spillovers, and overall welfare outcomes?

1.2. Research Questions and Main Findings

To address these issues, this paper develops a unified framework that incorporates technology blockades and asymmetric knowledge spillovers into a model of R&D competition and cooperation. We focus on the following research questions (RQs):
RQ1: How do technology blockades affect firms’ R&D efficiency and the effectiveness of knowledge spillovers?
RQ2: How do technology blockades influence firms’ cooperation incentives, and whether government interventions, such as subsidies, can restore cooperation?
To answer these questions, we construct a multi-stage game in which firms first choose R&D investment and then compete in quantities. Both non-cooperative and cooperative regimes are analyzed, and the model is further extended to include government subsidies in order to explore the potential moderating role of policy interventions. Our main findings are summarized as follows. First, under non-cooperative competition, technology blockades generate nonlinear effects on R&D investment and firm profits due to the interaction between asymmetric knowledge spillovers and competitive incentives. Second, under cooperative regimes, although firms internalize knowledge spillovers, technology blockades weaken the benefits of coordination and lead to asymmetric profit outcomes. As a result, there is no parameter region in which both firms are better off under cooperation, implying that cooperation is generally not self-enforcing under technology blockades. Third, government interventions, such as subsidies, can restore cooperation incentives and improve social welfare in most cases, although limited welfare losses may occur when R&D efficiency is high and spillovers are weak.

1.3. Contributions and Paper Structure

This paper contributes to the literature in several ways. First, it extends the standard R&D cooperation framework by introducing a technology blockade as an exogenous constraint on knowledge diffusion. While existing studies focus on spillover internalization under symmetric environments, this paper highlights how external restrictions reshape the effectiveness of cooperation. Second, it shows that R&D cooperation may fail to emerge endogenously under asymmetric and restricted spillovers. This finding contrasts with the conventional view that cooperation improves outcomes and is often self-sustaining. Third, the paper provides a policy perspective by demonstrating that government subsidies can substitute for weakened spillovers and restore cooperation incentives. It also characterizes how the effectiveness of policy depends on the intensity of the technology blockade and the level of R&D efficiency. We show that technology blockade weakens the self-enforcing nature of R&D cooperation, but government subsidies can restore cooperation by substituting for reduced spillovers.
Unlike the existing literature on asymmetric spillovers and R&D cooperation, our contribution is not merely to analyze cooperation or government intervention in an asymmetric environment. Instead, we focus on how technology blockade simultaneously affects knowledge diffusion and innovation costs, and how this dual-channel effect reshapes firms’ innovation incentives, cooperation outcomes, and policy effectiveness. The introduction of technology blockade generates several novel implications, including non-monotonic follower R&D responses, changes in cooperation incentives, and new policy trade-offs that do not arise in standard R&D cooperation models.
The remainder of the paper is organized as follows. Section 2 reviews the related literature. Section 3 presents the basic model. Section 4 analyzes the non-cooperative R&D regime. Section 5 examines R&D cooperation. Section 6 introduces government subsidies and discusses policy implications. Section 7 concludes.

2. Literature Review

R&D cooperation and knowledge spillovers have long been central topics in industrial organization. This study is closely connected to two key streams of the existing literature: (i) firm heterogeneity and R&D cooperation under asymmetric spillovers and (ii) the impact of external shocks on firms’ R&D strategies.

2.1. Asymmetric Spillovers, R&D Cooperation, and Government Intervention

This subsection first briefly reviews the classic literature on R&D cooperation under symmetric spillovers, then focuses on asymmetric spillovers, analyzing how leader-follower structures arise endogenously and exploring the possibilities of cooperation under such structures. Further, it considers the role of government intervention, such as subsidies, as an extension to correct market failures and restore cooperation incentives.
Under symmetric spillovers, d’Aspremont and Jacquemin (1988) [1] (hereinafter AJ model) developed a two-stage game showing that knowledge spillovers weaken firms’ incentives to invest in R&D. Kamien et al. (1992) [2] endogenized spillovers and compared four R&D regimes, demonstrating that a research joint venture (RJV) fully internalizes knowledge externalities and yields the highest R&D levels and industry profits. Badra et al. (2025) [5] revisited these four regimes within the AJ framework, finding that when spillovers fall below a certain threshold, a non-cooperative RJV (full spillovers without coordinated R&D investment) generates higher social welfare than both the standard non-cooperative regime and the R&D cartel. Leahy and Neary (2005) [6] showed that symmetric R&D investments in an RJV are not always stable, and asymmetric allocations may be more profitable under certain conditions. Falvey et al. (2013) [7] incorporated coordination costs in RJVs, finding that higher coordination costs reduce firms’ R&D investments, and that there exists a range of coordination costs where RJVs are profitable for firms but reduce social welfare. Furthermore, Poyago-Theotoky and Teerasuwannajak (2020) [8] analyzed the impact of spillovers on cooperation incentives and demonstrated that the benefits of cooperation depend critically on the degree of knowledge diffusion. These studies provide important foundations for understanding the relationship between knowledge spillovers, R&D investment, and R&D cooperation, but mostly assume symmetric spillovers.
Regarding asymmetric spillovers, Amir and Wooders (1999, 2000) [9,10] systematically examined settings where knowledge spillovers occur only from the firm with higher R&D investment to its rival. They found that the unique pure-strategy Nash equilibrium is asymmetric: one firm becomes a high-R&D “innovator”, and the other becomes a low-R&D “imitator”, leading to asymmetric distributions of market shares, profits, and costs. Atallah (2005a, 2005b, 2007) [11,12,13] constructed duopoly models with asymmetric spillovers, showing that firms with high outward spillovers have stronger R&D incentives. Ishikawa and Shibata (2020, 2021) [4,14] introduced cost asymmetry and extended spillovers from symmetric to asymmetric settings, demonstrating that the inflow effect dominates the outflow effect, and that increasing spillover asymmetry enlarges the R&D investment gap. Cosandier et al. (2017) [15] studied the “equal treatment” constraint: even if the non-cooperative equilibrium is endogenously asymmetric, a social planner or policy maker may impose equal R&D levels to ensure fairness. Chu and Zhou (2022) [16] found that strengthening intellectual property protection alters system stability and bifurcation behavior in discrete dynamical systems under asymmetric spillovers. Wang and Atallah (2025) [17] introduced asymmetric environmental R&D spillovers in a polluting duopoly and compared non-cooperative, R&D cooperation, and RJV cartel modes, finding that non-cooperative R&D may outperform highly cooperative modes under certain conditions.
While the above studies explain how asymmetric spillovers generate firm heterogeneity and a leader-follower structure, most studies assume unrestricted knowledge diffusion and ignore external shocks. Extending this, recent studies analyzed government interventions as mechanisms to correct market failures caused by spillovers and external shocks. Hinloopen (2001) [18] compared R&D subsidies and policies allowing R&D cooperation, finding that optimal subsidy rates increase with the spillover level, and that subsidization can substitute for R&D cooperation policy. Amir et al. (2019) [19] demonstrated that spillovers are the core reason for R&D underinvestment, and when spillovers are zero, non-cooperative R&D can achieve the social optimum. Capuano and Grassi (2019) [20] highlighted that cooperation does not always improve welfare because it reduces the number of research lines, and that optimal subsidy decreases with spillover intensity. Wang and Yuan (2026) [21] found that under full technology sharing, competitive RJV strategies yield higher firm profits and higher optimal subsidy rates than cooperative RJVs, while Long and Zheng (2025) [22] incorporated asymmetric spillovers and government subsidies into a Stackelberg–Bertrand model, showing that subsidies help stabilize equilibrium prices, and moderate asymmetric spillovers can harm leaders’ profits while benefiting the industry overall.
These studies suggest that in the presence of asymmetric spillovers, government intervention can adjust firms’ R&D incentives, restore cooperation, and correct underinvestment caused by market failures or external shocks. Integrating this perspective provides a theoretical foundation for analyzing how subsidies interact with asymmetric knowledge diffusion and firm heterogeneity in leader-follower structures.

2.2. External Shocks and Firm R&D Strategies

This subsection focuses on how external policies such as technology blockade, export controls, and intellectual property protection restrict or distort knowledge diffusion and thereby affect firms’ innovation environment.
Lu et al. (2020) [23] examined the coordination of tariffs and intellectual property protection in a bilateral spillover framework and found that moderate IPR protection may lead to “welfare-reducing R&D”. Qi and Zhang (2024) [24] constructed a tripartite evolutionary game model under technology blockade and showed that domestic firms’ innovation path is stage-dependent (imitation → independent → joint venture), and that government subsidies are more effective when the technology gap is large. Yao et al. (2024) [25] explored how new entrants break through technology blockade through ambidextrous innovation, finding that external monopoly pressure forces firms to shift from imitation to exploration, and that fiscal subsidies are more effective than R&D subsidies in the basic R&D stage. Chang et al. (2025) [26] constructed a Hotelling game under the risk of core technology supply disruption and showed that independent R&D investment is more effective when the technology disadvantage is small, and that the supply disruption may harm the initiating country’s profit more than the victim’s.
These studies are among the first to incorporate external constraints such as technology blockade and export controls into innovation analysis, revealing how these constraints alter the intensity and direction of knowledge spillovers and how firms adopt stage-dependent innovation strategies. However, most of these studies adopt evolutionary games and lack a micro-foundational oligopoly framework that simultaneously captures asymmetric spillovers, technology blockade, and strategic firm interaction. In particular, existing theoretical models rarely analyze, within a Stackelberg structure, how technology blockade affects the R&D decisions of leaders and followers, the technology gap, and the possibility of cooperation.

2.3. Research Gaps and Contribution

Overall, the existing literature has advanced our understanding of firm heterogeneity under asymmetric spillovers, the impact of technology blockade, and the role of government subsidies. However, three key gaps remain. First, there is no unified micro-founded model that simultaneously integrates asymmetric knowledge spillovers, technology blockade, and Stackelberg competition. Second, it is unclear whether R&D cooperation can emerge endogenously when external blockades weaken knowledge spillovers and reduce R&D effectiveness. Third, existing studies provide limited insight into how government subsidies can substitute for weakened spillovers and restore cooperation incentives.
This paper addresses these gaps by constructing a Stackelberg duopoly framework with asymmetric knowledge spillovers and technology blockade. Compared with evolutionary game approaches commonly used in the literature (e.g., [24,25,26]), our approach offers several advantages. First, it is grounded in profit maximization, enabling a precise analysis of how incentives translate into equilibrium R&D and output decisions. Second, the model endogenously generates a leader-follower structure, allowing us to study how technology blockade affects firms differently through cost distortions and limited knowledge access. Third, it captures the mechanisms that make full cooperation difficult to sustain under asymmetric spillovers. Finally, this framework naturally accommodates analysis of policy interventions, such as targeted output subsidies, and allows evaluation of their effectiveness in restoring cooperation and improving welfare.
Additionally, the Stackelberg framework allows for clear derivation of comparative statics and threshold effects, such as the impact of R&D efficiency, which is difficult to obtain in evolutionary game models. Overall, our method provides a micro-founded, analytically tractable approach for examining innovation behavior under asymmetric knowledge environments and complements the existing literature on evolutionary and adaptive R&D models.

3. Basic Model

Consider a duopoly market in which two firms produce homogeneous commodities. Firm 1 is the technological leader, and Firm 2 is the technological follower. Firms invest in R&D in order to reduce their production costs. Each firm’s inverse demand function is
p = a Q
where p is the market price, Q = q i is the market output, a > 0 represents the market size, and q i is the output of Firm i i = 1 , 2 .
Firms can reduce their marginal production costs through R&D investment. Let x i denote the R&D investment of firm i. We assume asymmetric knowledge spillovers from the leader to the follower, following Amir and Wooders (1999, 2000) [9,10]. The leader does not benefit from the follower’s R&D, while the follower partially absorbs the leader’s technological advances.
In practice, knowledge spillover is often subject to external institutional constraints, such as technology blockade and export controls. These restrictions limit firms’ access to frontier knowledge, particularly for the technological leader, whose innovation activities may depend on global knowledge networks. As a consequence, the effective level of its innovation is reduced, leading to a decline in the amount of knowledge that can be transmitted to the follower. Following Lu et al. (2020) [23], who model intellectual property protection as reducing R&D spillovers, we capture this effect by scaling the spillover parameter β by 1 t , where t 0 , 1 measures the intensity of the technology blockade.
A technology blockade may also increase firms’ reliance on internal innovation and duplicative R&D efforts, thereby raising the effective cost of innovation. To capture these two channels in a parsimonious manner, we model t as a composite measure of technology blockade that simultaneously reduces effective knowledge spillovers and increases R&D costs. Therefore, t should be interpreted as the overall intensity of technology blockade rather than as a pure spillover shock or a pure innovation-cost shock. This parsimonious specification allows us to capture the overall impact of technology blockade as a unified external restriction, which is the primary focus of the present study.
The marginal production costs are therefore as follows
c 1 = c x 1
c 2 = c x 2 β 1 t x 1
The R&D cost function is specified as
C i = 1 + t γ x i 2
where γ > 0 represents the R&D efficiency parameter. A larger value of γ implies higher R&D costs and therefore lower R&D efficiency (To ensure the existence of an interior solution, we impose the condition γ > 2 / 3 , as derived in Appendix A). To ensure an economically meaningful interior equilibrium, we assume γ > 2 / 3 . Since γ is inversely related to R&D efficiency, this condition rules out parameter regions where innovation becomes unrealistically inexpensive, and firms would have incentives to overinvest in R&D. Therefore, the analysis focuses on economically relevant cases in which firms face meaningful innovation costs and positive equilibrium R&D levels.
To capture asymmetry in production efficiency between the leader and follower, this study assumes that the follower firm may face managerial inefficiencies or diseconomies of scale. Following Gil-Moltó (2011) [27], this is represented by introducing a convex output cost term q 2 2 in the follower’s profit function. The quadratic term q 2 2 implies that the marginal production cost of the follower increases with its output level, reflecting decreasing returns to scale or organizational inefficiencies. This specification captures structural disadvantages of the follower and ensures an interior equilibrium without altering the qualitative nature of the results. Such a specification is widely used in the literature to model asymmetric production structures and to prevent corner solutions in which one firm is driven out of the market [27]. By introducing this convex cost, the follower firm faces a cost disadvantage relative to the technological leader, which captures the possibility that late-moving firms may operate with lower production efficiency. Specifically, the profit functions of the two firms are given by
π 1 = p c 1 q 1 C 1
π 2 = p c 2 q 2 q 2 2 C 2
The strategic interaction between firms is modeled as a two-stage game. The Stackelberg structure reflects the hierarchical nature of technological competition in high-technology industries, where leading firms typically possess advantages in innovation and standard-setting, while follower firms adjust their strategies in response. This asymmetry becomes particularly relevant under a technology blockade, which may reinforce the leader–follower structure. In the first stage, firms determine their R&D investments. In the second stage, firms compete in quantities in the product market. Consistent with the leader–follower structure, the output competition follows a Stackelberg game in which the leader firm chooses its output first, and the follower firm subsequently determines its output. The equilibrium of the game is derived using backward induction, where the equilibrium outputs are substituted into the firms’ profit functions to determine optimal R&D investments in the preceding stage.

4. R&D Competition

In this section, we solve the model under non-cooperative R&D investment.

4.1. Equilibrium Output

In the second stage, given R&D investment levels x 1 and x 2 , firms choose outputs to maximize profits. The follower firm chooses q 2 after observing the leader’s output. The follower’s profit maximization problem is
π 2 q 2 m a x = a q 1 q 2 c 2 q 2 q 2 2
The first-order condition is π 2 q 2 = 0 , which yields the follower’s reaction function
q 2 = 1 4 a c q 1 + 1 t β x 1 + x 2
Anticipating the follower’s response, the leader firm chooses its output by solving π 1 q 1 m a x . Substituting the reaction function into the leader’s profit function, the Stackelberg equilibrium outputs as functions of the R&D investments are as follows:
q 1 = 1 6 3 a c + 4 1 t β x 1 x 2
q 2 = 1 24 3 a c + 7 1 t β 4 x 1 + 7 x 2
For ease of exposition, Table 1 summarizes the main variables and parameters used throughout the model. In particular, x i denotes firm i ’s R&D investment, β measures the intensity of knowledge spillovers, t captures the severity of the technology blockade, and γ represents the R&D cost coefficient (i.e., lower γ corresponds to higher R&D efficiency). Using this notation, we derive the equilibrium R&D investments and output decisions under the Stackelberg structure.

4.2. Equilibrium R&D Investment

In the first stage, firms choose R&D investments to maximize profits π i x i m a x x 1 , x 2 . The first-order conditions are π 1 x 1 = 0 , π 2 x 2 = 0 . Solving the two first-order conditions simultaneously yields the Nash equilibrium R&D investments, which depend on the parameters a , c , β , t , γ .
x 1 * = a c 4 1 t β A 1 B 1
x 2 * = 7 a c A 2 B 1
where A 1 = 36 1 + t γ 7 > 0 , B 1 = 576 1 + t 2 γ 2 7 1 t β 4 2 1 + t 145 6 1 t β 8 1 t β γ > 0 , A 2 = 6 γ 1 + t + 1 t β 5 1 t β 4 > 0 .
Equations (9)–(12) indicate that technology blockade affects firms through two channels. First, it weakens effective knowledge spillovers by reducing access to external technology. Second, it alters the relative profitability of innovation by changing the cost-saving benefits generated by R&D investment. As a result, both the level and the distribution of R&D investment depend critically on the interaction between β , t , and γ .
Then, substitute the equilibrium R&D into the profit formula to obtain the equilibrium profit under competitive conditions.
π 1 * = a c 2 1 + t γ A 1 2 A 3 B 1 2
π 2 * = a c 2 1 + t γ A 2 2 A 4 B 1 2
where A 3 = 48 1 + t γ 4 1 t β 2 > 0 , A 4 = 288 1 + t γ 49 > 0 .

4.3. Effects of Technology Blockade on R&D Investment

We now examine the impact of the technology blockade. The comparative statics analysis reveals how technology blockade affects firms’ R&D incentives. As the analysis above shows, the impact of technology blockade operates through two interacting channels: the reduction in knowledge spillovers and the increase in R&D costs. The interaction between these two effects plays a central role in shaping firms’ R&D incentives and market outcomes. The non-monotonic response identified below should therefore be interpreted as the combined outcome of these two channels rather than the effect of either channel in isolation.
Proposition 1.
An increase in technology blockade has asymmetric effects on firms’ R&D investment.
(i)
The leader’s R&D investment decreases monotonically with the degree of technology blockade, i.e., x 1 * t < 0 .
(ii)
The effect on the follower is non-monotonic. When spillover intensity is low, and the degree of technology blockade is small ( β < β ¯ 1 ), an increase in technology blockade promotes the follower’s R&D investment, i.e., x 2 * t > 0 . When spillover intensity is high, and the degree of technology blockade is sufficiently large ( β > β ¯ 1 ), technology blockade reduces the follower’s R&D investment, i.e., x 2 * t < 0 .
(iii)
There exists a threshold level of R&D efficiency, γ ¯ 1 , such that when γ > γ ¯ 1 , the effect of technology blockade on the follower’s R&D investment is always negative (see Appendix F for the definition and economic interpretation of γ ¯ 1 and the other thresholds).
The asymmetric effects arise from the interaction between technology blockade, knowledge spillovers, and R&D cost. For the leader, the technology blockade operates through two opposing channels. On the one hand, it reduces the spillover from the leader to the follower (i.e., β decreases), which weakens the strategic substitutability between the two firms’ R&D investments. This effect gives the leader an incentive to increase its R&D investment. On the other hand, a technology blockade raises the effective cost of R&D for the leader, as it forces firms to rely on inefficient internal and duplicative R&D efforts. This cost-effect induces the leader to decrease its R&D investment. When the cost effect dominates the spillover reduction effect, the leader’s R&D investment decreases monotonically as the degree of technology blockade t increases. For the follower, the effect depends on the relative strength of two opposing forces. When the effective spillover from the leader is low and the technology blockade is weak, the follower relies more on its own R&D level; thus, the follower has an incentive to increase R&D investment. This mechanism is consistent with empirical evidence from Huawei, whose R&D investment increased steadily from 2018 to 2025 despite external technology restrictions, suggesting a reallocation toward core technological domains rather than a reduction in innovation effort. In contrast, when the spillover from the leader is high and the technology blockade is strong, the restriction on knowledge diffusion dominates, leading to a decline in the follower’s R&D investment.
To further clarify the mechanism underlying Proposition 1, it is useful to examine how blockade intensity and R&D efficiency jointly affect the equilibrium R&D decisions of the leader and the follower.
The difference between the two firms originates from their distinct sources of technological improvement. The leader primarily relies on its own R&D activities, whereas the follower benefits from both internal R&D and knowledge spillovers from the leader. As a result, the technology blockade affects the two firms through different channels.
For the leader, a higher blockade intensity increases the effective cost of innovation over the term 1 + t γ . At the same time, the blockade also changes the spillover structure and the strategic interaction between firms. These effects are reflected in both the numerator and denominator of the equilibrium solution x 1 * = a c 4 1 t β A 1 B 1 .
Therefore, the leader is not completely unaffected by spillover-related changes. However, analytical results show that the derivative x 1 * t remains negative throughout the admissible parameter space. This implies that although technology blockade affects several channels simultaneously, the increase in innovation costs always dominates the indirect effects generated through spillovers and market interactions. Consequently, leader R&D decreases monotonically with blockade intensity.
For the follower, the situation is fundamentally different. The follower’s equilibrium R&D is x 2 * = 7 a c A 2 B 1 , where A 2 = 6 γ 1 + t + 1 t β 5 1 t β 4 .
Technology blockade simultaneously increases innovation costs and reduces effective knowledge spillovers. Both effects appear to discourage R&D investment. However, the reduction in external knowledge also increases the value of internal innovation. As external technological resources become less accessible, the follower has stronger incentives to compensate for the lost spillovers through its own R&D activities. This mechanism can be interpreted as a knowledge-substitution effect.
When R&D efficiency is sufficiently high (i.e., γ is relatively small), internal innovation remains relatively inexpensive. Since technology blockade simultaneously reduces effective knowledge spillovers and increases innovation costs, the follower’s R&D decision reflects the interaction between the knowledge-substitution effect and the cost effect. As external technological resources become less accessible, the follower has stronger incentives to compensate for the loss of external knowledge through its own R&D activities. When the knowledge-substitution effect outweighs the negative effects associated with higher innovation costs and weaker spillovers, follower R&D increases with blockade intensity. In contrast, when γ becomes sufficiently large, internal innovation becomes more costly, and the cost-effect dominates. As a result, follower R&D decreases with blockade intensity.
This mechanism is also reflected mathematically in the derivative
x 2 * t = A 2 t B 1 A 2 B 1 t B 1 2 = A 2 B 1 A 2 B 1 B 1 2
Because both A 2 and B 1 jointly depend on blockade intensity through the spillover channel and the innovation-cost channel, as well as on R&D efficiency, the sign of the derivative may change across parameter regions. This interaction gives rise to the threshold behavior and non-monotonic R&D response reported in Proposition 1.
Therefore, the interaction between blockade intensity and R&D efficiency affects both firms, but only the follower exhibits a non-monotonic response because its R&D decision is jointly determined by cost effects, spillover effects, and the endogenous substitution toward internal innovation.
Furthermore, when R&D costs are sufficiently high (i.e., γ is large), R&D becomes less profitable, and the negative effect of technology blockade dominates, resulting in a uniformly negative relationship. The asymmetric R&D responses identified in Proposition 1 naturally translate into differential profit effects across firms. In particular, the interaction between spillover intensity and technology blockade gives rise to distinct profit patterns.
Proposition 2.
The effect of technology blockade on firms’ profits depends on the intensity of knowledge spillovers from the leader to the follower:
(i)
When spillover intensity is sufficiently high, technology blockade increases the leader’s profit but decreases the follower’s profit.
(ii)
When spillover intensity is low, technology blockade decreases the leader’s profit but increases the follower’s profit.
The result follows directly from the comparative statics of firms’ R&D decisions in Proposition 1. When spillover intensity is high, the follower relies heavily on external knowledge from the leader. In this case, technology blockade mainly operates by reducing spillover effectiveness, which significantly lowers the follower’s R&D productivity and profit. At the same time, the reduction in knowledge diffusion protects the leader’s cost advantage, leading to an increase in its profit.
When spillover intensity is low, knowledge diffusion plays a limited role, and the impact of technology blockade is primarily reflected in higher R&D costs. Since the leader engages in higher R&D investment, it is more adversely affected by the increase in R&D costs, resulting in a decline in its profit. By contrast, the follower’s R&D investment is less sensitive to the cost increase, and the resulting narrowing of the R&D investment gap between the two firms alleviates the follower’s competitive disadvantage, allowing it to benefit from a relative improvement in its market position.
This result is further supported by the numerical analysis in Section 4.5. A similar pattern holds for output differences, as profit changes are driven by corresponding adjustments in equilibrium outputs.

4.4. Technology Gap and Profit Distribution

Let the technological gap be defined as Δ = x 1 * x 2 * . γ ¯ 2 is determined by solving x 1 * x 2 * t = 0 (see Appendix C for the derivation of γ ¯ 2 and related comparative statics). The following analysis shows that the technology blockade affects the relative innovation incentives of the two firms.
Proposition 3.
The impact of technology blockade on the technological gap depends on both R&D efficiency and spillover intensity.
(i)
When R&D efficiency is sufficiently low ( γ > γ ¯ 2 ), the technological gap decreases with technology blockade, i.e., x 1 * x 2 * t < 0 .
(ii)
When R&D efficiency is sufficiently high ( γ < γ ¯ 2 ), the effect depends on spillover intensity: If spillover intensity is sufficiently high ( β > β ¯ 2 ), technology blockade widens the technological gap, i.e., x 1 * x 2 * t > 0 . If spillover intensity is low ( β < β ¯ 2 ), technology blockade reduces the technological gap, i.e., x 1 * x 2 * t < 0 .
(iii)
The region in which technology blockade and the technological gap are positively related exists only when γ < γ ¯ 2 and shrinks as γ increases.
The effect of technology blockade on the technological gap reflects the interaction between R&D efficiency and knowledge spillovers. When R&D efficiency is low ( γ is high), innovation is relatively costly. Technology blockade reduces R&D incentives for both firms, and the reduction effect tends to be stronger for the leader, leading to a narrowing of the technological gap.
When R&D efficiency is high ( γ is low), firms rely more on innovation activities. In this case, the effect of the technology blockade depends on the extent of spillovers. If spillovers from the leader are high, the follower benefits significantly from this external knowledge, and the technology blockade mainly restricts its access, thereby widening the technological gap. By contrast, when spillovers are limited, firms rely more on independent innovation. Technology blockade then reduces R&D incentives for both firms, resulting in a reduction of the technological gap.
Therefore, as γ increases (i.e., as R&D efficiency decreases), the cost effect becomes more dominant, which gradually reduces the parameter region in which technology blockade widens the technological gap.
Lemma 1.
Technology blockade redistributes profits between the leader and the follower, and the effect depends on spillover intensity.
(i)
When spillover intensity is sufficiently high ( β > β ¯ 3 ), technology blockade increases the leader’s profit while reducing the follower’s profit, thereby widening the profit gap, i.e., π 1 * π 2 * t > 0 .
(ii)
When spillover intensity is low ( β < β ¯ 3 ), technology blockade weakens the leader’s advantage and may reduce the profit gap, i.e., π 1 * π 2 * t < 0 .
The result follows directly from substituting the equilibrium R&D levels into the profit (gap) functions and taking comparative statics with respect to t.
The redistributive effect of the technology blockade stems from the asymmetric reliance on knowledge spillovers. When spillover intensity is high, the follower depends heavily on external knowledge from the leader. Technology blockade restricts this channel, which significantly reduces the follower’s effective productivity. As a result, the follower’s profit declines, while the leader benefits from reduced competitive pressure, leading to a widening of the profit gap. In contrast, when spillover intensity is low, both firms rely primarily on independent innovation. Technology blockade then has a limited effect on knowledge transmission but may weaken overall innovation incentives. This reduces the leader’s competitive advantage and may narrow the profit gap.

4.5. Numerical Illustration

To complement the analytical results, we provide numerical illustrations of the equilibrium outcomes. Following the standard literature, we normalize the market size parameter and set a = 10 , c = 2 , which does not affect the qualitative results. The analysis focuses on the effects of spillover intensity ( β ), technology blockade (t), and R&D efficiency ( γ ), where a lower value of γ corresponds to higher R&D efficiency.
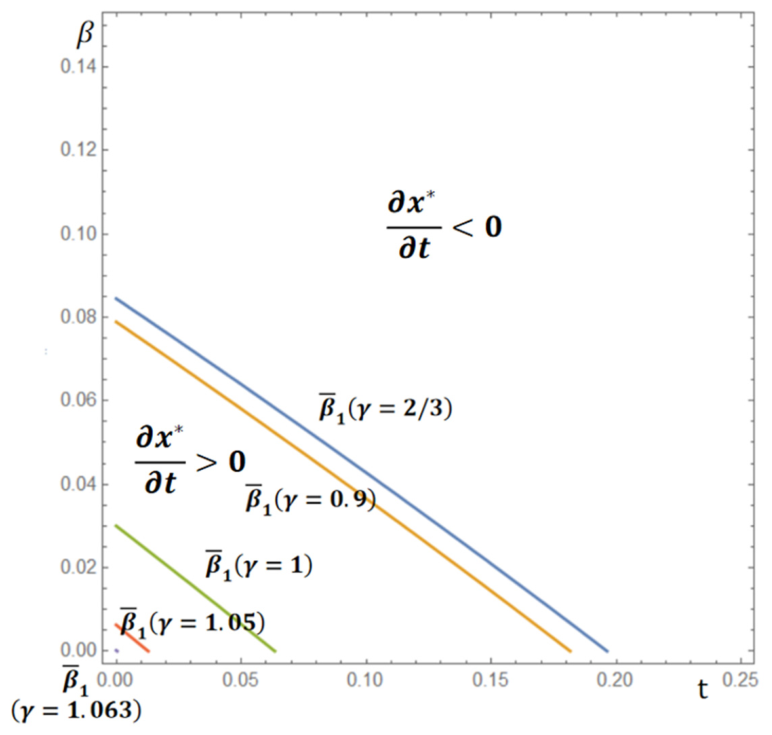
Figure 1 illustrates the effect of technology blockade on the follower’s R&D investment under different levels of R&D efficiency. We focus on the parameter range β [ 0 , 0.15 ] ,   t [ 0 , 0.25 ] , which captures the region where the marginal effect may change sign. Outside this region, the marginal effect is uniformly negative. The figure plots the locus defined by x 2 * t = 0 for different values of γ . Each curve represents a spillover threshold β ¯ 1 that separates the parameter space into two regions. The region below β ¯ 1 corresponds to x 2 * t > 0 , where the technology blockade increases the follower’s R&D investment. The region above β ¯ 1 corresponds to x 2 * t < 0 , where the technology blockade reduces R&D investment.
The numerical results reveal a threshold value γ ¯ 1 1.063 . When γ is sufficiently small, the positive-effect region is non-empty, indicating that technology blockade may stimulate R&D investment due to strategic responses. As γ increases, the curve shifts downward and the positive-effect region shrinks. Once γ exceeds the threshold, the curve disappears, and the marginal effect becomes uniformly negative over the entire parameter space.
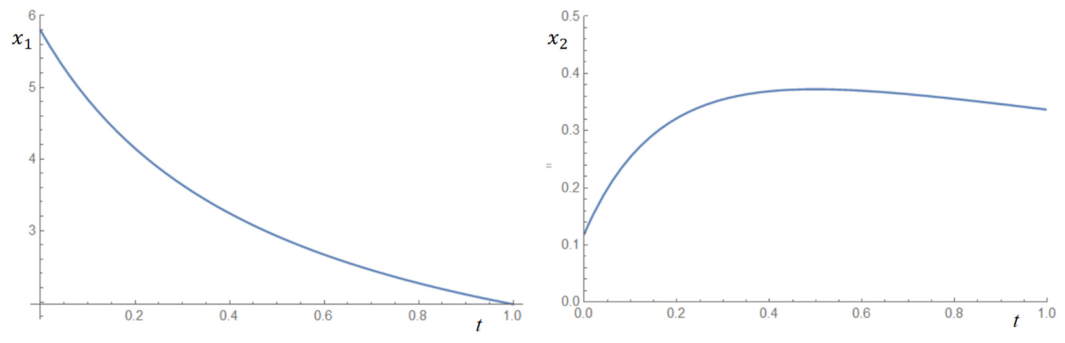
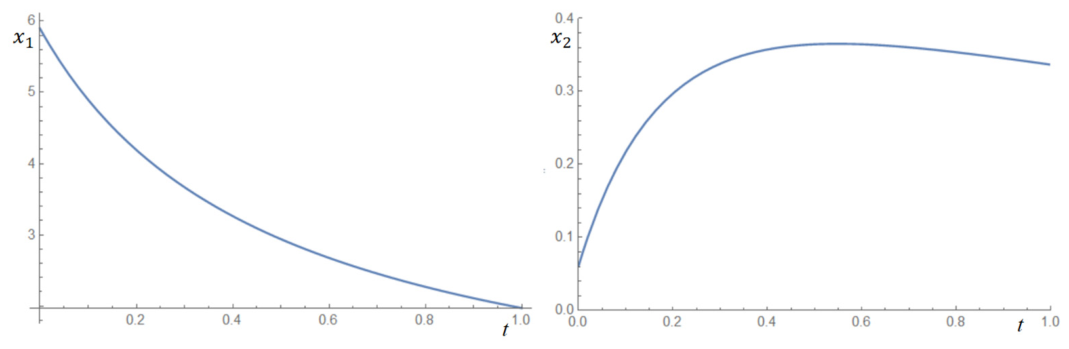
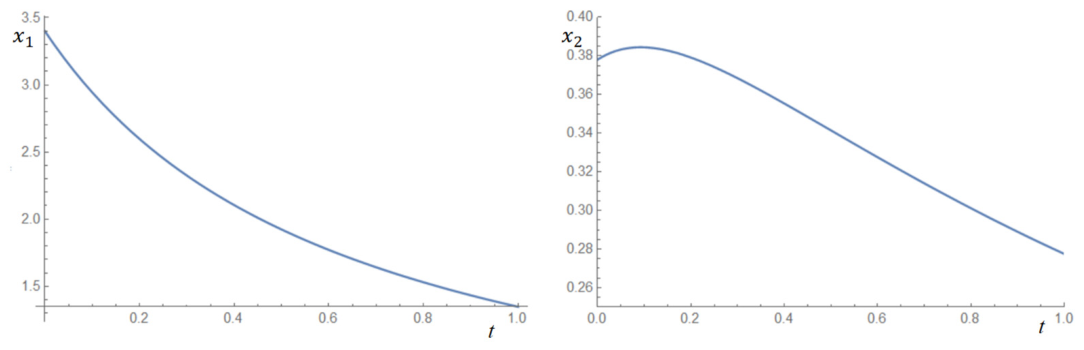
These findings are consistent with Proposition 1 and confirm that the effect of technology blockade on R&D investment is non-monotonic and depends on both spillover intensity and R&D efficiency. To illustrate the relationship between R&D investment and technology blockade intensity, we provide graphical illustrations in Appendix B (Figure A1, Figure A2 and Figure A3). The leader’s R&D investment monotonically decreases with increasing blockade intensity, while the follower’s R&D exhibits a non-monotonic pattern, first increasing and then decreasing, reflecting the knowledge-substitution effect emphasized in Proposition 1. Multiple parameter combinations of R&D efficiency ( γ ) and spillover intensity ( β ) are presented to demonstrate the robustness of these patterns across a range of economic environments.
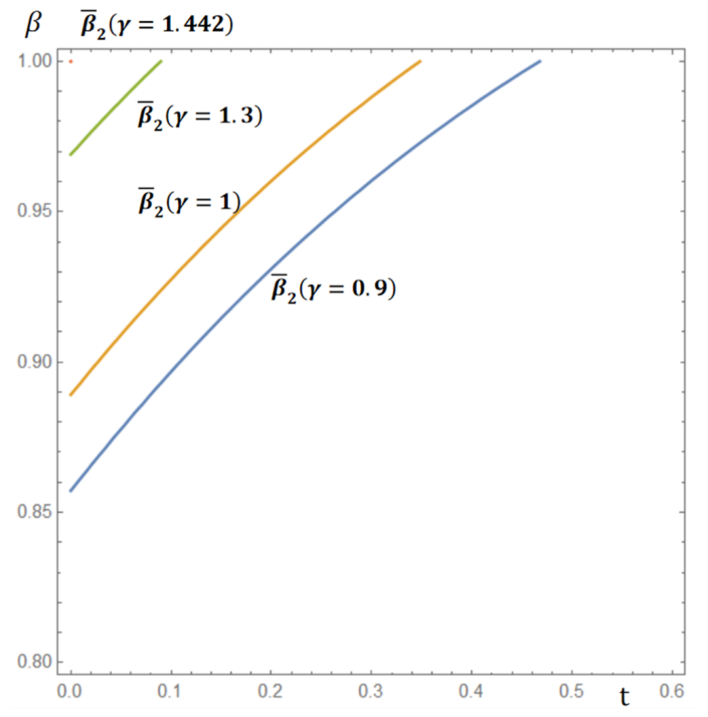
Figure 2 presents the effect of technology blockade on the technological gap between the leader and the follower. To highlight the threshold structure, the figure focuses on the region β [ 0.8 ,   1 ] and t [ 0 ,   0.6 ] . Outside this region, the marginal effect Δ x t is uniformly negative, implying that technology blockade unambiguously reduces the technological gap. As a result, no threshold behavior arises there, and the boundary curves do not exist. Focusing on the selected region, therefore, allows us to isolate the economically relevant parameter space where the sign of the marginal effect changes.
The figure plots the locus defined by x 1 * x 2 * t = 0 for different values of γ . Each curve represents a spillover threshold β ¯ 2 that separates the parameter space into two regions. When β > β ¯ 2 , technology blockade widens the technological gap, whereas when β < β ¯ 2 , the gap is reduced. The results show that the impact of technology blockade depends on both spillover intensity and R&D efficiency. In particular, there exists a threshold γ ¯ 2 1.442 . When γ exceeds this threshold, the boundary curves disappear, and the marginal effect becomes uniformly negative, implying that technology blockade always reduces the technological gap. When γ is below the threshold, the effect depends on spillover intensity: for sufficiently high spillovers, restricting knowledge diffusion dominates, and the gap widens; for low spillovers, the reduction in innovation incentives dominates, and the gap narrows. As γ increases, the boundary curves shift downward, indicating that the region in which the technology blockade widens the technological gap becomes progressively smaller. These findings are consistent with Proposition 2 and indicate that the technological gap is more robust to changes in R&D efficiency than R&D investment.
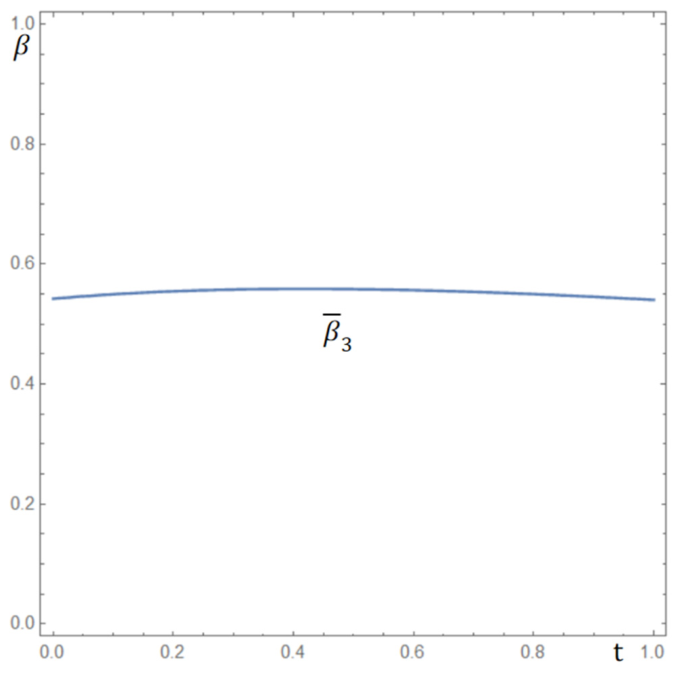
Figure 3 reports the effect of technology blockade on the profit gap between the leader and the follower. Let the profit gap be defined as Δ π = π 1 * π 2 * . β ¯ 3 is determined by solving π 1 * π 2 * t = 0 . For illustration, we fix γ = 1 . Additional numerical experiments with alternative values of γ yield qualitatively similar results.
The figure plots the threshold defined by Δ π t = 0 , which separates the parameter space into two regions. When spillover intensity is above the threshold ( β > β ¯ 3 ), Δ π t > 0 , and technology blockade increases the profit gap, strengthening the leader’s advantage. When spillovers are below the threshold ( β < β ¯ 3 ), Δ π t < 0 , and the profit gap is reduced. The results indicate that the redistributive effect of technology blockade is primarily governed by spillover intensity. When spillovers are strong, restricting knowledge diffusion disproportionately harms the follower, thereby widening the profit gap. When spillovers are weak, technology blockade reduces overall innovation incentives and weakens the leader’s advantage. These findings are consistent with Proposition 2 and Lemma 1, and confirm the asymmetric impact of technology blockade on firm performance. These findings suggest that the interaction between technology blockade and spillovers generates non-trivial effects on firms’ incentives, raising the question of whether coordination can improve efficiency, which we examine in the next section.
These results differ from standard asymmetric-spillover models because technology blockade simultaneously affects both the spillover channel and the innovation-cost channel. The non-monotonic response of follower R&D therefore emerges from the interaction of these two blockade-related mechanisms rather than from the spillover structure alone.

5. R&D Cooperation

5.1. Equilibrium R&D Investment

We consider a cooperative R&D regime in which firms coordinate their innovation decisions while continuing to compete in the product market. To isolate the pure effect of cooperation, we assume that both firms choose the same R&D level, i.e., x 1 = x 2 = x C . This assumption follows the standard treatment in the R&D cartel and research joint venture literature, as in [1,2], and is also consistent with the equal-treatment constraint discussed by [15]. In particular, cooperative agreements or policy interventions often require symmetric contributions to ensure fairness and enforceability, allowing us to isolate the coordination effect without introducing endogenous asymmetries. Therefore, this symmetric specification serves as a benchmark to isolate the coordination effect, rather than a restriction on feasible cooperative arrangements.
At the same time, the technology blockade remains exogenous and continues to distort knowledge diffusion. Following Amir and Wooders [9,10], spillovers are assumed to be unidirectional, flowing from the leader to the follower only. Cooperation does not eliminate this asymmetry, because the blockade constrains the direction and intensity of knowledge transmission. The asymmetric cost structure is implicitly captured through the unilateral spillover mechanism embedded in the model. This setting follows the standard additive spillover structure in the literature, where cost reduction arises from two distinct sources: own R&D effort and external knowledge spillovers. These components are independent rather than duplicative, implying that the follower benefits simultaneously from its own innovation and the (restricted) spillover from the leader. Therefore, the specification does not involve double-counting, but rather reflects the accumulation of different knowledge channels under cooperation. Solving the cooperative R&D problem yields the following equilibrium investment level:
x C = 3 a c D E
where D = 21 + 1 t β > 0 , E = 576 1 + t γ 6 1 t β 55 1 t 2 β 2 63 > 0 .
This expression shows that equilibrium R&D under cooperation depends jointly on market size, technology blockade, spillovers, and innovation efficiency. In particular, the presence of a technology blockade affects both the effective return to R&D and the degree of knowledge transmission embedded in the cooperative arrangement.

5.2. Effects of Technology Blockade on R&D and Profits

We first examine how technology blockade affects R&D investment and firm-level profitability under cooperation.
Lemma 2.
Technology blockade reduces R&D investment under cooperation, i.e.,  x C t < 0 .
The intuition is that cooperation eliminates strategic interaction in R&D decisions and internalizes spillovers, so firms behave as if maximizing joint profits. In this setting, technology blockade primarily acts as a distortion that weakens effective spillovers while raising the marginal cost of innovation. As a result, the incentive to invest in R&D declines monotonically. This differs fundamentally from the non-cooperative case, where strategic considerations may generate non-monotonic responses due to the interaction between competition and spillovers. Under cooperation, such strategic effects disappear, and the impact of the blockade becomes unambiguously negative.
Lemma 3.
Under cooperation, the effect of technology blockade on individual firm profits depends on spillover intensity and R&D efficiency:
(i)
The follower’s profit exhibits the opposite dependence on spillovers, decreasing with blockade when spillovers are high, i.e., π 2 C t < 0 and increasing when spillovers are low, i.e., π 2 C t > 0 .
(ii)
The leader’s profit depends on both spillovers and R&D efficiency. When R&D efficiency is high ( γ is low), the effect of blockade is positive under high spillovers, i.e., π 1 C t > 0 and negative under low spillovers, i.e., π 1 C t < 0 ; when R&D efficiency is low ( γ is high), the effect becomes uniformly negative, i.e., π 1 C t < 0 .
The intuition follows from the interaction between spillover effectiveness and R&D costs under technology blockade. For the follower, whose cost reduction relies partly on knowledge spillovers from the leader, the effect of technology blockade depends primarily on spillover intensity. When spillovers are high, the follower depends heavily on external knowledge, so the reduction in spillover effectiveness significantly lowers its R&D productivity and profit. In contrast, when spillovers are low, the follower relies mainly on its own R&D, and the impact of the technology blockade is weaker. In this case, the reduction in competitive pressure resulting from weaker knowledge diffusion may improve the follower’s relative position, leading to higher profits.
For the leader, the effect depends on both spillover intensity and R&D efficiency. When spillovers are high, technology blockade reduces knowledge leakage to the follower, thereby protecting the leader’s cost advantage. If R&D efficiency is high (i.e., R&D costs are low), this protection effect dominates, leading to higher profits. However, when spillovers are low, the reduction in knowledge leakage becomes less important, and the increase in R&D costs becomes the dominant channel, resulting in lower profits. When R&D efficiency is low (i.e., R&D costs are high), the cost-increasing effect of technology blockade dominates regardless of spillover intensity, leading to a uniformly negative impact on the leader’s profit.

5.3. Profit Distribution Under Cooperation

We next examine how the technology blockade affects the distribution of profits between firms under cooperation.
Lemma 4.
Under cooperation, the technology blockade has a non-monotonic effect on the profit gap between the leader and the follower. Specifically, the profit gap increases with technology blockade when spillovers are high, but decreases when spillovers are low.
The intuition is driven by the interaction between spillover effectiveness and R&D costs under technology blockade. When spillovers are sufficiently strong, the follower relies heavily on knowledge from the leader for cost reduction. In this case, technology blockade primarily operates by weakening spillover effectiveness, which disproportionately reduces the follower’s cost advantage. At the same time, reduced knowledge leakage preserves the leader’s cost advantage. As a result, the leader’s relative profit is strengthened, and the profit gap between the two firms widens.
By contrast, when spillovers are weak, knowledge diffusion plays a limited role, and the impact of technology blockade is mainly reflected in higher R&D costs. Since the leader undertakes a higher level of R&D investment, it is more adversely affected by the increase in R&D costs. This reduces the leader’s relative advantage and leads to a narrowing of the profit gap.
Overall, cooperation does not eliminate the asymmetry induced by technology blockade, but removes strategic interaction in R&D decisions, so that the distribution of profits is primarily determined by the interaction between spillover effectiveness and R&D costs.

5.4. Welfare Implications and Incentives for Cooperation

We finally examine whether cooperative R&D is incentive-compatible and whether it can be sustained as an equilibrium outcome. Although cooperation internalizes asymmetric spillovers, it also weakens market competition. As a result, its overall welfare effect is ambiguous. When the loss of competitive pressure dominates the efficiency gains from spillover internalization, cooperative R&D may reduce social welfare relative to the non-cooperative benchmark.
Proposition 4.
(i) 
Social welfare under cooperative R&D is lower than under non-cooperative R&D, i.e., W C W * < 0 .
(ii) 
The leader’s profit under cooperation is always lower than under competition: π 1 C π 1 * < 0 .
(iii) 
The follower’s profit difference depends on parameters. When spillovers are high and blockade is low, the follower is worse off under cooperation; in other regions, the follower may benefit from cooperation.
There exists no overlapping parameter region in which both firms prefer cooperation simultaneously under the benchmark full-cooperation setting considered in this paper. Therefore, voluntary full R&D cooperation cannot arise in equilibrium within the current framework. This is consistent with observed Huawei’s behavior, where increased R&D investment under technology restrictions does not necessarily translate into cooperative R&D arrangements, highlighting persistent coordination frictions.
The result reflects the interaction between spillover internalization and the distortions introduced by technology blockade. While cooperation allows firms to internalize knowledge externalities, technology blockade weakens these gains by reducing spillover effectiveness and increasing R&D costs. As a result, the efficiency gains from cooperation are insufficient to compensate for the loss of the technology blockade, particularly for the leader firm.
Furthermore, the asymmetric structure of spillovers implies that the follower benefits from external knowledge to a greater extent than the leader. When a technology blockade restricts this channel, the follower’s gains from cooperation are reduced, and the distribution of benefits becomes uneven. Consequently, although cooperation may benefit one firm in certain parameter regions, it does not generate mutual gains.
Therefore, under the benchmark full-cooperation setting, cooperation cannot be sustained as a voluntary equilibrium outcome, as no parameter region exists in which both firms obtain higher profits relative to non-cooperation.
This result should not be interpreted as a general property of R&D cooperation. In the standard R&D cooperation literature, higher spillovers typically strengthen cooperation incentives because firms can internalize knowledge externalities. In contrast, technology blockade directly reduces the effectiveness of spillovers and increases innovation costs, thereby weakening the surplus available for cooperation. Consequently, the cooperation incentives predicted by conventional R&D cooperation models are substantially altered under a technology blockade.
This result highlights that a technology blockade weakens the mutual gains from internalizing spillovers and generates asymmetric incentive structures between firms. Consequently, full R&D cooperation fails to emerge endogenously under the baseline framework.
It should be noted that the present analysis focuses on full cooperation. More limited forms of collaboration, such as project-specific R&D alliances, selective technology sharing, or partial joint ventures, may involve weaker coordination requirements and different incentive structures, and therefore may remain feasible under certain conditions. These extensions are left for future research.

5.5. Numerical Illustration

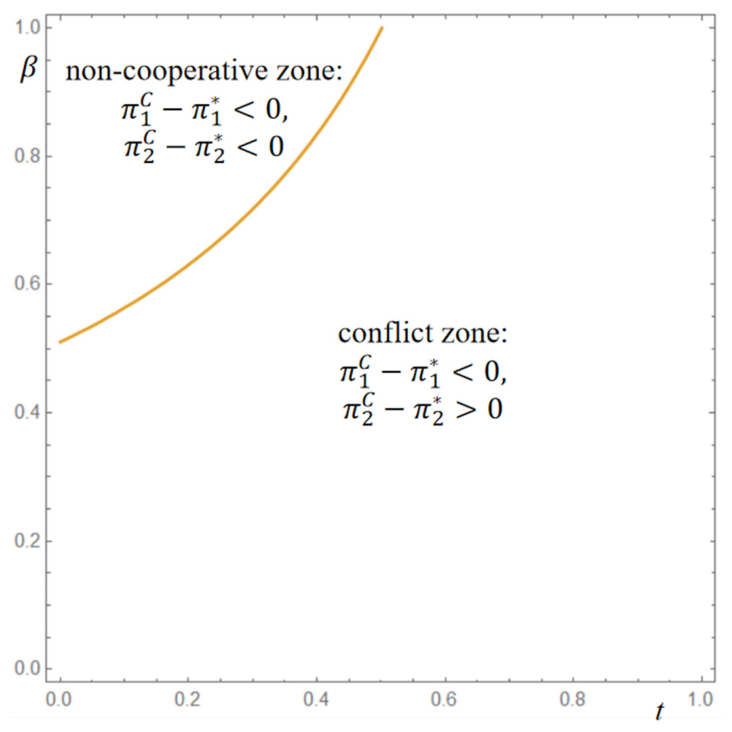
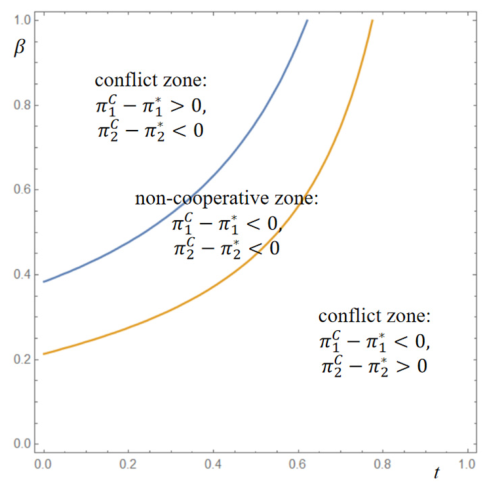
To further examine the incentives for cooperation, we provide a numerical illustration of Proposition 4. Figure 4 plots the regions defined by the profit differences between cooperative and non-cooperative regimes. Figure 4 is constructed based on the sign of profit differences across parameter combinations.
In particular, two relevant regions emerge. The first is the non-cooperative zone, defined by π 1 C π 1 * < 0 , π 2 C π 2 * < 0 , in which both firms are strictly worse off under cooperation. In this region, cooperation is dominated by non-cooperation and therefore cannot arise. The second is the conflict zone, defined by π 1 C π 1 * < 0 , π 2 C π 2 * > 0 , in which the follower benefits from cooperation while the leader does not. This asymmetry implies that cooperation cannot be sustained, as the leader has no incentive to participate despite the follower’s preference for cooperation. As shown in Figure 4, there is no region in which both firms simultaneously obtain higher profits under cooperation. That is, an overlapping region satisfying π 1 C π 1 * > 0 , π 2 C π 2 * > 0 does not exist. This confirms that full R&D cooperation is not self-enforcing under a technology blockade within the benchmark framework considered in this paper.
These findings are consistent with the analytical results in Proposition 4. The absence of mutual gains reflects the combined effect of spillover attenuation and increased effective R&D costs under cooperation. While cooperation internalizes spillovers, a technology blockade weakens these benefits and redistributes profits asymmetrically across firms. Importantly, the lack of a self-sustaining cooperation region provides a clear rationale for policy intervention. In the next section, we introduce government subsidies to examine whether cooperative R&D can be restored as an equilibrium outcome.
To verify the robustness of Proposition 4, we conducted several alternative specifications of the cooperative R&D structure. Specifically, we tested: Asymmetric R&D without convex output cost; Asymmetric R&D with convex output cost; Symmetric R&D without convex output cost. Across all three specifications, the qualitative conclusion remains the same: no parameter region exists in which both firms simultaneously benefit from cooperation under technology blockade. These results indicate that the absence of a self-enforcing cooperation region is robust and primarily driven by the interaction between technology blockade and asymmetric knowledge spillovers, rather than by specific modeling assumptions.
Furthermore, we examined the case of two-way knowledge spillovers, where the leader also benefits from the follower’s R&D. Although the threshold values governing the follower’s R&D responses shift, the qualitative patterns—such as non-monotonic follower responses and the absence of a mutually beneficial cooperation region—remain robust. Detailed derivations, numerical results, and parameter-region illustrations are reported in Appendix E.

6. Government Intervention

6.1. Government Subsidies

Although cooperative R&D internalizes spillovers, firms may still lack incentives to cooperate, as shown in Proposition 4. To address this coordination failure, we introduce government subsidies.
In this paper, the choice of subsidy instrument is closely linked to the underlying source of market failure. The key distortion in our framework is not merely insufficient R&D investment, but the inability of firms to sustain cooperative behavior under a technology blockade. As shown in Proposition 4, even when R&D investment is endogenous, full cooperation cannot arise because at least one firm lacks sufficient incentives to participate.
Importantly, the technology blockade introduces asymmetric distortions across firms, affecting both their cost structures and the distribution of gains from cooperation. In this context, a standard R&D subsidy or fiscal subsidy would primarily operate through cost reduction and may increase innovation effort, but it does not directly resolve the incentive incompatibility that prevents cooperation.
By contrast, the targeted output subsidy considered in this section directly affects realized profits from cooperative production. This mechanism allows the policy to intervene at the level of payoff comparison between cooperation and non-cooperation, rather than only affecting input decisions. As a result, it is particularly effective in addressing the coordination failure induced by the technology blockade.
While the literature has extensively studied R&D subsidies and fiscal transfers, in our framework, the central policy challenge is not underinvestment in innovation per se, but the absence of mutually acceptable incentives for cooperation. Therefore, a targeted output subsidy is the most appropriate instrument to restore cooperation incentives under firm-specific technology blockade.
Social welfare is defined as:
W s = C S + π 1 + π 2 s × q 1 s × q 2
where consumer surplus under linear demand is given by:
C S = q 1 + q 2 2 2
We extend the cooperative R&D framework by introducing a per-unit subsidy provided by the government, denoted by s * q i . The timing of the game is as follows. In the first stage, the government chooses the optimal subsidy level. In the second stage, firms jointly determine their R&D investment under cooperation. In the third stage, firms compete in quantities in the product market. Before presenting the main results, we first characterize the properties of the optimal subsidy.

6.2. Optimal Subsidy

Lemma 5.
The optimal subsidy level is negatively related to the intensity of technology blockade:
s C t < 0
The derivation of the optimal subsidy s C and the comparative static result in 18 are provided in Appendix D.
The negative relationship reflects a substitution between policy intervention and market-based incentives. A stronger technology blockade reduces knowledge diffusion and enhances firms’ incentives to preserve their cost advantage. As a result, part of the coordination problem is mitigated endogenously, lowering the marginal effectiveness of subsidies. Conversely, when the blockade is weak, spillovers are less constrained, and firms fail to internalize externalities, increasing the role of subsidies in promoting cooperative R&D. Therefore, the optimal subsidy is higher when the technology blockade is less severe. This implies that optimal policy design must account for the external technological environment.

6.3. Profit and Welfare Effects of Government Subsidies

We now examine how government subsidies affect firm incentives and social welfare under R&D cooperation.
Proposition 5.
Government subsidies restore cooperation incentives and improve firm profitability, while their welfare effect depends on R&D efficiency.
(i)
With government subsidies, both firms obtain higher profits under cooperation than under non-cooperation, i.e., π i C S π i * > 0 , i = 1,2 .
(ii)
The welfare effect of subsidized cooperation depends on R&D efficiency. When R&D efficiency is low (i.e., γ > γ ¯ 3 ), social welfare under subsidized cooperation is higher than under non-cooperation, i.e., W C S W * > 0 . When R&D efficiency is high (i.e., γ < γ ¯ 3 ), welfare under subsidized cooperation may be lower than under non-cooperation in a limited region characterized by low spillovers and weak technology blockade, i.e., W C S W * < 0 . However, in most parameter regions, subsidized cooperation still improves social welfare.
The intuition reflects the role of government subsidies in correcting distortions induced by the technology blockade. On the one hand, a technology blockade weakens spillover effectiveness and increases the effective cost of R&D, thereby undermining firms’ incentives to engage in cooperative innovation. Subsidies reduce the marginal cost of R&D investment and compensate for the loss of spillovers, effectively restoring the private incentives required for cooperation. As a result, both firms benefit from cooperative R&D once subsidies are introduced.
Unlike the non-cooperative case, subsidies also address coordination failure, which amplifies their welfare effect. On the other hand, the welfare effect depends on the relative importance of R&D costs and spillover distortions. When R&D efficiency is low (i.e., innovation is costly), subsidies primarily correct underinvestment in R&D and the coordination failure identified in the non-cooperative benchmark, leading to welfare gains. In contrast, when R&D efficiency is high, the distortionary effect of subsidies becomes more relevant. In such cases, especially when spillovers and technology blockade are both weak, subsidized cooperation may generate slight welfare losses. Nevertheless, this negative effect is limited, and in most parameter regions, subsidies improve welfare.
Overall, government subsidies act as a policy instrument that substitutes for weakened spillovers in the sense that it compensates for the reduction in effective knowledge diffusion and restores both participation and investment incentives under cooperation.

6.4. Numerical Verification

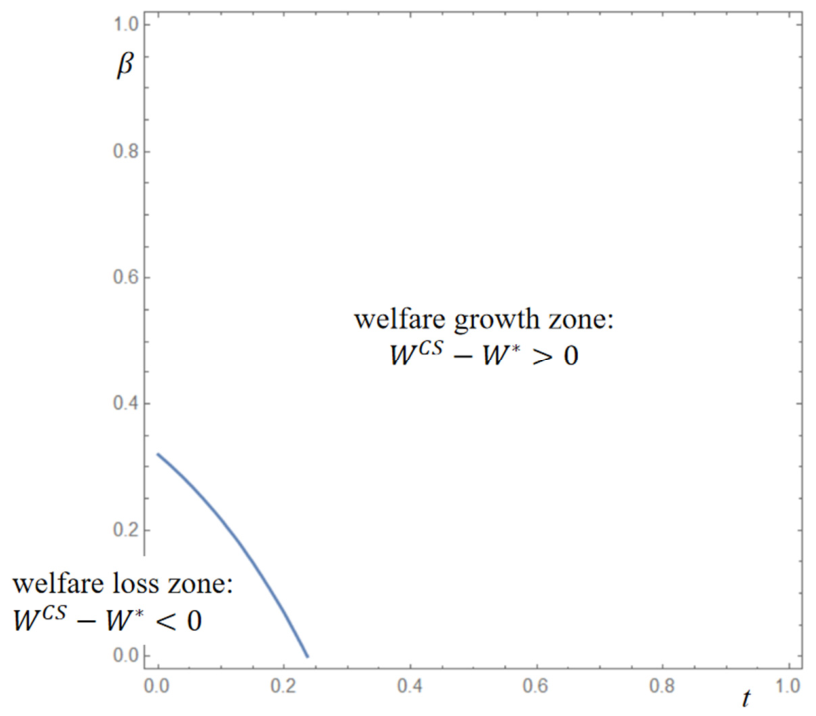
We provide numerical verification of the above results. Figure 5 illustrates the welfare comparison between subsidized cooperation and non-cooperation under high R&D efficiency, i.e., γ < γ ¯ 3 . γ ¯ 3 is determined by solving W C S W * = 0 . The results reveal the existence of a threshold value of R&D efficiency, denoted by γ ¯ 3 1.1 , which is consistent with the threshold structures identified in previous subsections. The threshold γ ¯ 3 1.1 arises from numerical calibration rather than analytical derivation.
When R&D efficiency is low ( γ > 1.1 ), social welfare under subsidized cooperation is always higher than under non-cooperation. In this case, subsidies effectively offset both the reduction in spillovers caused by the technology blockade and the coordination failure that prevents firms from cooperating. When R&D efficiency is high ( γ < 1.1 ), a small welfare loss zone emerges, defined by low spillovers and weak technology blockade. In this region, subsidized cooperation may lead to slight welfare losses due to overcompensation or inefficient allocation of resources. However, this region is limited, and in most parameter configurations, subsidized cooperation continues to generate welfare gains.
These findings are consistent with the results in Section 4.5. In particular, Section 4.5 shows that cooperation cannot arise endogenously due to the absence of mutual gains, while the present analysis demonstrates that subsidies can restore both private incentives and, in most cases, social welfare.

7. Conclusions

This paper investigates the interaction between technology blockade, R&D cooperation, and government intervention within a unified theoretical framework. By incorporating asymmetric spillovers and exogenous restrictions on knowledge spillover, we provide a systematic analysis of firms’ innovation incentives under both non-cooperative and cooperative regimes.
Our analysis yields several key findings. These results are driven by the interaction between spillover effectiveness and R&D costs under technology blockade, which jointly shape firms’ strategic incentives and the effectiveness of policy intervention.
First, under non-cooperation, technology blockade generates nonlinear effects on R&D investment and profit distribution, driven by the interaction between spillovers and competitive incentives. Second, under cooperation, although firms internalize spillovers, technology blockade significantly weakens the benefits of coordination and leads to asymmetric profit outcomes. As a result, there exists no parameter region in which both firms are better off under cooperation, implying that cooperative R&D is not self-enforcing. Third, we show that government subsidies can effectively restore cooperation incentives. The optimal subsidy level is negatively related to the intensity of technology blockade, highlighting a substitution between policy intervention and market-driven incentives. Moreover, subsidized cooperation improves social welfare in most cases, particularly when R&D efficiency is low. Only in a limited parameter region characterized by high efficiency and weak spillovers does subsidized cooperation lead to slight welfare losses.
Overall, our findings highlight the importance of policy intervention in environments where external constraints distort knowledge spillover and undermine cooperative incentives. The results suggest that optimal innovation policy should account for both technological asymmetries and the external institutional environment. These findings contribute to the growing literature on innovation under geopolitical and technological constraints.
While some welfare and cooperation mechanisms identified in this paper are consistent with the broader R&D cooperation literature, the main contribution of this study is to show how technology blockade modifies these mechanisms by simultaneously restricting knowledge diffusion and increasing innovation costs. The interaction of these two channels generates new implications for firms’ innovation behavior, cooperation incentives, and the design of innovation policy.
However, one limitation of the present framework is that technology blockade is represented by a single parameter that simultaneously captures spillover restrictions and innovation-cost distortions. While this specification reflects the composite nature of many real-world technology restrictions, it does not allow the two channels to be identified separately. Consequently, the effects reported in this paper should be interpreted as the joint outcome of reduced knowledge diffusion and increased innovation costs. Distinguishing the relative importance of these channels remains an important topic for future research.
Building on this limitation, several extensions may be explored in future research. For instance, introducing separate parameters for knowledge-access restrictions and innovation-cost distortions would allow researchers to identify the individual effects of the two channels more precisely. In addition, introducing endogenous technology leadership, dynamic R&D competition, or empirical validation using firm-level data could further enrich the analysis.
Moreover, although the present study focuses on a two-firm Stackelberg framework, the underlying mechanisms are not restricted to a duopoly setting. In a multi-firm environment, firms with stronger technological capabilities or greater knowledge outflows would continue to occupy relatively leading positions, while other firms would adjust their R&D and cooperation strategies accordingly. Therefore, the leader–follower asymmetry generated by asymmetric spillovers, the non-monotonic R&D responses identified under technology blockade, and the coordination challenges associated with R&D cooperation are expected to remain qualitatively robust. Extending the framework to a broader oligopolistic setting represents a promising avenue for future research.

Author Contributions

Conceptualization, N.Z.; Methodology, N.Z.; Validation, Z.Z.; Investigation, Z.Z.; Writing—original draft, N.Z. and Z.Z.; Writing—review and editing, N.Z. and Z.Z.; Funding acquisition, N.Z. All authors have read and agreed to the published version of the manuscript.

Funding

This research was funded by the NATURAL SCIENCE FOUNDATION OF LIAONING PROVINCE, grant number 2025-BS-0235; SOCIAL SCIENCE FOUNDATION OF LIAONING PROVINCE, grant number L24AGL003; and the FUNDAMENTAL RESEARCH FUNDS FOR THE CENTRAL UNIVERSITIES, grant number 3132026278.

Data Availability Statement

The data presented in this study are available on request from the corresponding author due to the nature of this theoretical research, which did not involve publicly available datasets. Detailed derivations and simulation codes can be shared upon reasonable request.

Conflicts of Interest

The authors declare no conflict of interest.

Appendix A. Parameter ( γ ) Restrictions and Feasibility

To ensure the existence and stability of the equilibrium, we derive the admissible range of the R&D cost parameter γ .
For each stage of the game, the second-order conditions require 2 π i q i 2 < 0 , 2 π i x i 2 < 0 (non-cooperative R&D), 2 π 1 + π 2 x 2 < 0 (cooperative R&D and subsidized cooperation), 2 W s 2 < 0 (subsidized cooperation). The bounds are obtained by solving the second-order conditions and feasibility constraints simultaneously. The range of γ obtained from these conditions is γ 1 / 3 . To ensure economically meaningful solutions, equilibrium outputs, R&D levels, and profits must satisfy: q i * > 0 , x i * > 0 , π i * > 0 . These conditions further restrict the parameter space and the range of γ obtained from these conditions is γ 2 / 3 .
Combining the second-order conditions and positivity constraints, we obtain: γ 2 / 3 , where γ 2 / 3 ensures both stability and feasibility of equilibrium.

Appendix B. Comparative Statics: Representative Derivation

To illustrate the mechanism underlying the propositions, we explicitly derive the effect of technology blockade on the follower’s R&D.

Appendix B.1. Derivation of x 2 * t

From the equilibrium solution π 2 x 2 = 0 , the follower’s R&D investment is given by: x 2 * = 7 a c A 2 B 1 . Taking the derivative of x 2 * with respect to t yields:
x 2 * t γ , β , t = 7 a c X 3 X 1 X 2 X 4 Y 1 + Y 2 Y 3 2
X 1 = 7 β 4 + 1 + t β 2
X 2 = 2 496 + 128 3 t 11 β + 1 + t 651 + 167 t β 2 + 12 1 t 2 5 t 8 β 3 + 6 1 t 4 β 4 γ
X 3 = 144 1 + t 32 + 8 3 t 7 β + t 15 t 1 β 2 γ 2
X 4 = 3456 1 + t 2 γ 3
Y 1 = 7 β 1 t 4
Y 2 = 2 1 + t 145 + 6 t 1 β 8 1 t β γ
Y 3 = 576 1 + t 2 γ 2
The threshold level of R&D efficiency, denoted by γ ¯ 1 , is defined by the condition: x 2 * t γ , β , t = 0 . Due to the complexity of γ ¯ , it is not possible to obtain a closed-form solution for γ ¯ 1 . Therefore, we solve the above condition numerically. Under the benchmark parameter values, the threshold is given by: γ ¯ 1 1.063 .

Appendix B.2. Interpretation

The sign of x 2 * t depends on the asymmetric spillover intensity and R&D efficiency, leading to the threshold behavior described in Proposition 1.
Figure A1. Effects of technology blockade t . γ = 2 / 3 ,   β = 0.04 .
Mathematics 14 02169 g0a1
Figure A2. Effects of technology blockade t . γ = 2 / 3 ,   β = 0.02 .
Mathematics 14 02169 g0a2
Figure A3. Effects of technology blockade t . γ = 0.9 ,   β = 0.04 .
Mathematics 14 02169 g0a3
These figures illustrate the relationship between technology blockade and R&D investment for both leader and follower firms under different parameter settings. The leader’s R&D decreases monotonically with blockade intensity, whereas the follower’s R&D is non-monotonic, initially rising due to knowledge substitution and then declining as blockade costs dominate.

Appendix C. Additional Comparative Statics

Following the same procedure, we obtain: x 1 * x 2 * t , π 1 * π 2 * t , π 1 C t , π 2 C t , γ ¯ 2 , γ ¯ 3 . These determine the results stated in Propositions 2–5. The derivations, γ ¯ 2 and γ ¯ 3 follow the same steps as in Appendix B and are therefore omitted for brevity.

Appendix D. Government Subsidy

The optimal subsidy is determined by W s = 0 :
s C = 3 a c V 1 V 2 + V 3 2 W 1 W 2 + W 3
V 1 = 32 39 1 + t γ 9 1 + t γ 1 1 > 0
V 2 = 427 1 t 3 β 3 101 1 t 4 β 4 > 0
V 3 = 32 1 t β 141 1 + t γ 7 6 1 t 2 β 2 355 1 + t γ 97 > 0
W 1 = 16 73 + 9 1 + t γ 243 1 + t γ 97 > 0
W 2 = 1261 1 t 3 β 3 316 1 t 4 β 4 > 0
W 3 = 8 1 t β 1656 1 + t γ 347 3 1 t 2 β 2 2217 1 + t γ 851 > 0
Comparative statics yield: s C t < 0 , indicating that a stronger technology blockade reduces the optimal subsidy level.

Appendix E. Robustness Check

Appendix E.1. Alternative Cooperative R&D Structures

To examine whether the absence of a self-enforcing cooperation region is driven by the benchmark cooperative structure, we consider three alternative specifications relaxing R&D symmetry, the convex output-cost assumption, or both.
Specification 1: Asymmetric R&D without Convex Output Cost
Firms are allowed to choose asymmetric cooperative R&D levels, and the follower’s convex output-cost term is removed. In this case, the leader’s cooperative profit remains below its non-cooperative profit in most parameter regions, while the follower may benefit from cooperation only in limited regions with high spillovers and weak technology blockade. Nevertheless, no parameter region exists in which both firms simultaneously gain from cooperation.
Specification 2: Asymmetric R&D with Convex Output Cost
Firms choose asymmetric R&D levels while retaining the follower’s convex output-cost term. Here, the leader may benefit from cooperation in certain regions, but the follower’s participation constraint remains binding due to the additional cost. As a result, no mutually beneficial cooperation region emerges.
Specification 3: Symmetric R&D without Convex Output Cost
Firms adopt identical R&D levels while removing the convex output-cost term. Under this scenario, the follower may gain from internalizing spillovers under cooperation, but the leader’s cooperative profit remains below the non-cooperative benchmark. Therefore, full cooperation is again unsustainable.
Across all three alternative cooperative structures, at least one firm’s participation constraint is violated in every parameter region. This indicates that the absence of a self-enforcing cooperation region is robust and primarily driven by the interaction between technology blockade and asymmetric knowledge spillovers, rather than by any specific modeling assumption regarding R&D symmetry or the follower-specific convex cost.

Appendix E.2. Two-Way Spillovers

We allow knowledge spillovers to flow in both directions. The leader receives spillovers from the follower with the same spillover parameter β and blockade adjustment 1 t β .
The follower’s response becomes more sensitive to R&D efficiency.
For γ < 1.063 , the follower’s R&D response is qualitatively similar to that reported in Proposition 1. For 1.063 < γ < 1.604 , follower R&D decreases monotonically with technology blockade. For γ > 1.604 , follower R&D decreases with blockade when spillovers are low but increases with blockade when spillovers are high.
Despite these shifts in threshold values, the qualitative result that follower R&D exhibits non-monotonic responses remains robust.
Figure A4 identifies three regions: Leader-benefit and Follower-loss region, Mutual-loss region, and Leader-loss and Follower-benefit region. No overlapping region exists where both firms simultaneously benefit from cooperation.
Figure A4. Regions of cooperation incentives under two-way spillovers.
Mathematics 14 02169 g0a4
Finally, introducing government subsidies generates a mutually beneficial cooperation region, and this result remains robust under two-way spillovers.

Appendix F. Threshold Values and Economic Interpretation

Several threshold values are used throughout the paper to characterize changes in firms’ strategic responses and welfare outcomes. For ease of reference, their definitions and economic interpretations are summarized below.
ThresholdDefinitionEconomic Interpretation
γ ¯ 1 x 2 * t γ , β , t = 0 Critical R&D efficiency level governing the follower’s response to technology blockade. When γ > γ ¯ 1 , the follower’s R&D investment decreases monotonically with blockade intensity.
γ ¯ 2 x 1 * x 2 * t = 0 Critical R&D efficiency level governing the effect of technology blockade on the technological gap between the leader and the follower.
γ ¯ 3 W C S W * = 0 Critical R&D efficiency level determining whether subsidized cooperation improves social welfare relative to non-cooperation.
The threshold values do not represent exogenous model parameters. Instead, they emerge endogenously from the comparative-static analysis and help characterize the boundary conditions under which firms’ innovation incentives and welfare outcomes change.

References

  1. D’Aspremont, C.; Jacquemin, A. Cooperative and noncooperative R&D in duopoly with spillovers. Am. Econ. Rev. 1988, 78, 1133–1137. [Google Scholar]
  2. Kamien, M.I.; Muller, E.; Zang, I. Research joint ventures and R&D cartels. Am. Econ. Rev. 1992, 82, 1293–1306. [Google Scholar]
  3. Marini, M.; Petit, L.; Sestini, R. Strategic timing in R&D agreements. Econ. Innov. New Technol. 2014, 23, 274–303. [Google Scholar]
  4. Ishikawa, N.; Shibata, T. R&D competition and cooperation with asymmetric spillovers in an oligopoly market. Int. Rev. Econ. Financ. 2021, 72, 624–642. [Google Scholar] [CrossRef] [Scilit]
  5. Badra, Y.; Chopard, B.; Liu, H. R&D cooperation and spillovers: When do research joint ventures improve welfare? Math. Soc. Sci. 2025, 139, 102489. [Google Scholar] [CrossRef] [Scilit]
  6. Leahy, D.; Neary, J.P. Symmetric research joint ventures: Cooperative substitutes and complements. Int. J. Ind. Organ. 2005, 23, 381–397. [Google Scholar] [CrossRef] [Scilit]
  7. Falvey, R.; Poyago-Theotoky, J.; Teerasuwannajak, K.T. Coordination costs and research joint ventures. Econ. Model. 2013, 33, 965–976. [Google Scholar] [CrossRef] [Scilit]
  8. Poyago-Theotoky, J.; Talerngsri Teerasuwannajak, K. Endogenous research and development spillovers and asymmetric firms. Manag. Decis. Econ. 2020, 41, 1282–1286. [Google Scholar] [CrossRef] [Scilit]
  9. Amir, R.; Wooders, J. Effects of one-way spillovers on market shares, industry price, welfare, and R&D cooperation. J. Econ. Manag. Strategy 1999, 8, 223–249. [Google Scholar] [CrossRef] [Scilit]
  10. Amir, R.; Wooders, J. One-way spillovers, endogenous innovator/imitator roles, and research joint ventures. Games Econ. Behav. 2000, 31, 1–25. [Google Scholar] [CrossRef] [Scilit]
  11. Atallah, G. R&D cooperation with asymmetric spillovers. Can. J. Econ.-Rev. Can. Econ. 2005, 38, 919–936. [Google Scholar] [CrossRef] [Scilit]
  12. Atallah, G. Research joint ventures cartelization with asymmetric R&D spillovers. Econ. Bull. 2005, 12, 1–11. [Google Scholar]
  13. Atallah, G. Research joint ventures with asymmetric spillovers and symmetric contributions. Econ. Innov. New Technol. 2007, 16, 559–586. [Google Scholar] [CrossRef] [Scilit]
  14. Ishikawa, N.; Shibata, T. Market competition, R&D spillovers, and firms’ cost asymmetry. Econ. Innov. New Technol. 2020, 29, 847–865. [Google Scholar]
  15. Cosandier, C.; Feo, G.D.; Knauff, M. Equal treatment and socially optimal R&D in duopoly with one-way spillovers. J. Public Econ. Theory 2017, 19, 1099–1117. [Google Scholar] [CrossRef] [Scilit]
  16. Chu, T.; Zhou, W. Complex dynamics of R&D competition with one-way spillover based on intellectual property protection. Chaos Solitons Fractals 2022, 163, 112491. [Google Scholar] [CrossRef] [Scilit]
  17. Wang, C.; Atallah, G. Carbon tax in a duopoly with asymmetric spillovers and symmetric contributions. Econ. Model. 2025, 148, 107099. [Google Scholar] [CrossRef] [Scilit]
  18. Hinloopen, J. Subsidizing R&d Cooperatives. De Econ. 2001, 149, 313–345. [Google Scholar] [CrossRef] [Scilit]
  19. Amir, R.; Liu, H.; Machowska, D.; Resende, J. Spillovers, subsidies, and second-best socially optimal R&D. J. Public Econ. Theory 2019, 21, 1200–1220. [Google Scholar] [CrossRef] [Scilit]
  20. Capuano, C.; Grassi, I. Spillovers, product innovation and R&D cooperation: A theoretical model. Econ. Innov. New Technol. 2019, 28, 197–216. [Google Scholar]
  21. Wang, C.; Yuan, K. Strategic coopetition among oligopolistic automakers under the dual credit policy: Incorporating subsidies and preferences. Ann. Oper. Res. 2026, 1–38. [Google Scholar] [CrossRef] [Scilit]
  22. Long, J.; Zheng, S. Dynamic complexity of Stackelberg-Bertrand game with one-way R&D spillovers, effective information and government subsidies. PLoS ONE 2025, 20, e0328071. [Google Scholar] [PubMed]
  23. Lu, T.C.; Hu, J.L.; Lin, Y.S. Coordination of trade and intellectual property rights policies. Singap. Econ. Rev. 2020, 68, 1771–1785. [Google Scholar] [CrossRef] [Scilit]
  24. Qi, N.; Zhang, A. Technological cooperation relationships among supply chain enterprises under the perspective of technological blockade: A tripartite evolutionary game model. J. Clean. Prod. 2024, 447, 141240. [Google Scholar] [CrossRef] [Scilit]
  25. Yao, S.; Wu, L.; Yu, D. The evolution of the ambidextrous innovation synergy strategy of new entrants from the perspective of key core technology monopoly. Heliyon 2024, 10, e33531. [Google Scholar] [CrossRef] [Scilit] [PubMed]
  26. Chang, X.; Sun, G.; Zhou, J. Technology outage risk and independent research and development investment decision in global supply chains. Fundam. Res. 2025, 5, 464–472. [Google Scholar] [CrossRef] [Scilit] [PubMed]
  27. Gil-Moltó, M.J.; Poyago-Theotoky, J.; Zikos, V. R&D subsidies, spillovers, and privatization in mixed markets. South. Econ. J. 2011, 78, 233–255. [Google Scholar] [CrossRef] [Scilit]
Figure 1. Effect of technology blockade on the follower’s R&D investment.
Mathematics 14 02169 g001
Figure 2. Effect of technology blockade on the technological gap.
Mathematics 14 02169 g002
Figure 3. Effect of technology blockade on the profit gap.
Mathematics 14 02169 g003
Figure 4. Non-cooperative and conflict zones under R&D cooperation.
Mathematics 14 02169 g004
Figure 5. Welfare gains and losses under subsidized cooperation ( γ < 1.1 ).
Mathematics 14 02169 g005
Table 1. Definitions of Main Variables and Parameters.
SymbolDefinition
a Market size parameter
c Initial marginal production cost
β Knowledge spillover intensity
t Technology blockade intensity
γ R&D cost coefficient (inverse R&D efficiency)
q i Output of firm i
x i R&D investment of firm i
π i Profit of firm i
C S Consumer surplus
W Social welfare
s Output subsidy rate
Disclaimer/Publisher’s Note: The statements, opinions and data contained in all publications are solely those of the individual author(s) and contributor(s) and not of MDPI and/or the editor(s). MDPI and/or the editor(s) disclaim responsibility for any injury to people or property resulting from any ideas, methods, instructions or products referred to in the content.