Article

Swarm-Optimized Explainable Attention–Transformer Networks for Bacterial Colony Segmentation and Quantification

by
Najla Sassi
1,* and
Moulay Ibrahim El-Khalil Ghembaza
2
1
Department of Management Information Systems, School of Business, King Faisal University, Al Ahsa 31982, Saudi Arabia
2
Department of Computer Science, College of Engineering and Information Technology, Onaizah Colleges, Qassim 56447, Saudi Arabia
*
Author to whom correspondence should be addressed.
Mathematics 2026, 14(12), 2104; https://doi.org/10.3390/math14122104
Submission received: 8 May 2026 / Revised: 1 June 2026 / Accepted: 6 June 2026 / Published: 12 June 2026
(This article belongs to the Section E1: Mathematics and Computer Science)

Abstract

For microbiological diagnostics, accurately counting and segmenting microbial colonies is extremely important. However, manual methods are labor-intensive and yield inconsistent results. We develop a hybrid model using swarm intelligence, combining a convolutional transformer with nested skip connections and global context with channel and spatial attention. Parameter tuning is supported by a variety of swarm optimization algorithms (e.g., Particle Swarm Optimization, Quantum-behaved Particle Swarm Optimization, and Differential Evolution Particle Swarm Optimization). Morphological refinement, including a further watershed transform, an attention graph, and post-processing, enhances colony boundaries by separating them. Grad-CAM++, Integrated Gradients, and temperature scaling provide a transparent and trustworthy model through explainability and post hoc calibration. The proposed model was extensively tested on the Microbial Colony Recognition and Circular Bacterial Colony Datasets, achieving a Dice score of 94.2%, an Intersection over the Union of 88.6%, and a mean absolute counting error of 2.7 colonies. These results significantly outperform several baseline models, including U-Net (88.1%), U-Net++ (89.7%), Attention U-Net (90.6%), and Swin-Unet (91.4%). Statistically significant improvements were confirmed (p < 0.01). A cross-dataset analysis demonstrates the framework’s robustness and cross-domain applicability, and positions it as a trustworthy, explainable automated model for assessing microbial colonies in laboratory and clinical settings.

1. Introduction

Microbiology, biotechnology, and clinical diagnostics all include components focused on measuring microbial colonies. A common method to assess microbial growth is to measure bacteria by colony-forming units, which are also used to describe antibiotic susceptibility and contamination. Manual colony counting is tedious and traditionally relies on the observer to provide an accurate count, prompting the need to automate analysis. The initial methods automated colony enumeration by employing thresholding and morphological operators, often coupled with watershed segmentation. The approaches succeeded to a minimal extent and continued to fail due to sensitivity to noise, uneven illumination, and overlapping colonies [1].
A significant advancement in the analysis of microbial colonies was the introduction of deep learning, especially for its ability to automate end-to-end analysis without hand-crafting features. Convolutional neural networks (CNNs) are the state of the art in segmentation of biomedical images, and, in general, the U-Net architecture and its variants have rendered segmentation in medical and biological imaging, as well as other imaging tasks, highly useful and efficient [2]. U-Net extensions, such as U-Net++ and Attention U-Net, differ in how they represent features and in how they apply attention mechanisms (both spatial and channel) to enhance expressivity. Models like the Vision Transformer (ViT) and Swin-Unet are recent transformer-based models that can outperform purely CNN-based approaches on challenging computer vision problems, especially by modeling long-range dependencies in image data [3,4]. Despite these advantages, the scarcity of large, well-annotated datasets in microbiology will continue to hinder the advancement of these state-of-the-art models.
To address data sparsity, the creation of synthetic data and the development of novel augmentation strategies have emerged as key approaches. Frameworks based on augmentations from transformers and GANs have improved the generalization of artificial colony detection and are good solutions for small data with annotations. Other approaches have been successful in improving the detection of colonies from scarce data, such as a hybrid CNN-MLP network that outperforms standard CNN-based networks. Optimization methods and algorithms improve segmentation reliability. A swarm-optimized microbial colony counter showed that metaheuristic optimization improves deep learning models by tuning hyperparameters and stabilizing convergence. PSO and its derivatives, such as Quantum PSO and DE-PSO, have achieved excellent results in biomedical image segmentation, providing effective optimization across large regions of high-dimensional spaces. Accuracy is one part, but explainability and reliability are key for an automated system in a lab. Using the frameworks of Grad-CAM++, Integrated Gradients, and temperature-scaling uncertainty calibration, a visual explanation of predictions is provided, and their confidence is established. This boosts the confidence of automated colony analysis pipelines.
To address challenges in automated microbial colony analysis, we developed a framework that directly addresses these problems. Images of microbial colonies are typically prone to multiple challenges that elude traditional single-approach segmentation and counting methods. These challenges include colony overlap, uneven illumination, sensor noise, low boundary contrast, colony irregularities, and morphologies. Furthermore, these tend to change from laboratory to laboratory. The proposed framework addresses these challenges by adopting a modular, multi-strategy, integrated approach rather than the traditional, singular, pipeline-based, automated approach. Our approach integrates multiple strategies. In the first stage, variability in the quality of input images is reduced, and the effects of variable laboratory illumination are removed. Attention mechanisms and transformer bottleneck modules, swarm intelligence optimization, and post-processing refinement are used to enhance segmentation and improve counting confidence. Our approach is the first of its kind, a modular, integrated, multi-strategy approach that deals directly with the problems microbial colonies pose to segmentation and counting.
The innovation introduced by this study is a novel swarm-optimized hybrid attention–transformer framework designed for automated microbial colony segmentation and counting. Unlike CNN-based architectures, our solution can address overlapping colony segmentation and illumination variation. This architecture employs nested skip connections, advanced channel–spatial attention, and transformer global context reasoning. Further, in this framework, swarm intelligence optimizers such as Particle Swarm, Quantum-behaved PSO, and Differential Evolution–PSO aid network optimization for stable convergence and effective control in higher-dimensional search spaces. Further, segmentation and morphological enumeration accuracy are refined through the combination of post-processing techniques, including, but not limited to, morphological improvements, watershed segmentation, and graph-based segmentation and enumeration. In addition, to enhance transparency and practicality, the framework employs Grad-CAM++, Integrated Gradients, and trustworthiness calibration to control confidence. The suggested framework was validated through multiple experiments conducted on two benchmark datasets. Improvements in several metrics, including Dice score, Intersection over Union (IoU), and counting error, were observed. The framework has a straightforward solution to automated colony analysis and microbiological diagnostics.
The subsequent sections of this manuscript are as follows: Section 2 discusses the literature and identifies the gaps this study attempts to address. The details of the proposed hybrid, explainable AI framework, and swarm intelligence optimization are outlined in Section 3. Section 4 discusses the experimental results and the assessment of the model’s performance, robustness, and interpretability. Section 5 presents the conclusion, encapsulating the findings of this study and providing directions for future studies.

2. Literature Review

Breakthroughs in explainable deep learning and ensemble classification have impacted medical imaging, news categorization, and agricultural disease detection domains. In medicine, explainability has been improved by using XGrad-CAM to understand disease classification from medical images [5] and by leveraging the interpretability of CNNs to analyze brain tumors [6]. In the non-medical field, explainable systems and intelligent systems were applied to both text data and agricultural data. For example, the online news categorization task was supported by the X-News dataset [7], which provides news articles; moreover, a multi-stage ensemble of neural networks was employed to classify wheat leaf disease [8], confirming that deep learning in precision agriculture is useful. Overall, these works show that explainability, ensemble learning, and adaptation to the specific domain in question, which are the main avenues of modern AI, are becoming more and more relevant.
The advancement of biomedical segmentation has come from shifts from rule-based image processing to deep convolutional neural networks. Classical methods of processing, such as thresholding and watershed segmentation, require parameter tuning and will ultimately yield poor results for heterogeneous morphologies. Therefore, many segmentation techniques have come to rely on neural networks. Some of the earliest applications of convolutional neural network segmentation in the biomedical field included the segmentation of embryo nuclei and neuronal cell membranes in Electron Microscopy, as well as the detection of mitosis. This related work showed the benefits of using deep learning frameworks and related fields, such as end-to-end learning and feature learning, in place of hand-crafted features. In medical imaging, convolutional neural networks have been applied to histopathology and radiology workflows for segmentation problems, including breast cancer lesion segmentation, modeling mammographic lesions, and detecting sclerotic spine metastasis. This work demonstrated the benefits of using neural networks as a basis for segmentation.
The impact of explainable artificial intelligence and hybrid deep learning on biomedical image analysis and medical decision-support systems cannot be overstated. With explainability-based frameworks, such as XGrad-CAM, we have begun to understand the pivotal role played by interpretable visualizations in disease classification and the enhancement of clinical trust in medical imaging [9,10]. The further development of hybrid attention-guided architectures that integrate convolutional learning and advanced contextual modeling has been shown to improve the robustness of segmentation and classification in challenging biomedical imaging [11,12]. Additionally, multimodal transformer-based frameworks have been shown to be highly capable of synthesizing disparate clinical and imaging data within a cohesive diagnostic framework [13]. Outside the realm of biomedical imaging, the focus on advanced intelligent decision-support systems and AI-based optimization methods have underscored the importance of developing robust, explainable, and cost-effective machine learning systems to address real-world challenges [14,15]. These trends combined provide impetus for the incorporation of explainability, hybrid attention mechanisms, transformer-based contextual learning, and optimization-based refinement in the proposed framework for segmentation and counting of microbial colonies.
Encoder–decoder architectures became key to biomedical segmentation. U-Net [16] added skip connections that combine semantic with spatial information and serve as a baseline for dense biomedical segmentation. Many improvements on segmentation for dense predictions in microscopy and histopathology concentrated on enhancing the network’s capacity and stability during training. Many segmentation-focused deep networks were based on fast-scanning CNNs. Other works on region-based CNN segmentation focused on breast histopathology [17] and mammography lesion segmentation [18], and further radiological tasks [19] observed the same trend and domain generality. All these works show the movement from classical watershed-based segmentation algorithms to CNN-based segmentation frameworks. Modern segmentation is based on robust frameworks that leverage attention mechanisms, multi-scale feature extraction, and transformers.
There has been growing interest in the automated analysis of microbial colonies across fields such as microbiology, clinical diagnostics, and biotechnology. Previous segmentation methods relied on manual counting with basic image processing techniques such as binarization, edge detection, and the watershed algorithm. Even though these methods could segment colonies in controlled lab environments, they were not robust or scalable due to sensitivity to noise and varying illumination, as well as problems with closely spaced or touching colonies [1]. To overcome these problems, deep learning has been used to learn more robust features for an end-to-end solution for colony detection and counting [20].
The advancement of self-supervised and few-shot learning has significantly impacted biomedical image segmentation, particularly in settings with limited annotated datasets. Self-supervised learning uses pretext tasks and unannotated biomedical images to construct better representations, improve segmentation performance, and lessen reliance on annotated data [21,22]. Likewise, few-shot segmentation leverages metric learning, prototypes, and transformer-based context adaptation to generalize segmentation to an instance from a limited number of annotated examples [23,24]. These methods enhance the analysis of biomedical images and segmentation of annotation data, which is often expensive to capture at the pixel level. Few-shot and low-data learning can be applied to microbial colony analysis. This is due to the lack of large-scale, annotated microbial colony datasets and to inconsistent imaging conditions across laboratories. These methods, especially when paired with hybrid attention–transformer segmentation frameworks to bolster performance, are good approaches for maximizing data utility and improving segmentation in automated microbiology analysis systems.
The use of convolutional neural networks in microbiological imaging has made automated colony counting more precise and consistent than manual colony counting [1]. For biomedical imaging and segmentation of microbial colonies, CNNs like U-Net have become the go-to due to their balance between capturing details and maintaining overall context in the data [2]. Advancements to U-Net, such as U-Net++ and Attention U-Net, added nested skip connections and attention mechanisms, respectively, improving the model’s ability to focus on and propagate critical features to the output. More recently, models like Swin-Unet and transformer models introduced to the imaging domain, such as the ViTs, have seen success in both medical and biological imaging due to their ability to model long-range dependencies [3,4]. However, these models are data hungry, and in the field of microbiology, data scarcity is a common problem.
To address the problem of scarce data, synthetic data augmentation has emerged. A number of methodologies, such as copy–paste augmentation, GANs, and the Segment Anything Model (SAM), have proven effective for generating realistic agar plate images with colony generation, thereby significantly improving model generalization [25]. The methods highlighted the need for additional data in research on microbial colonies. Colony segmentation methodologies have also seen a significant advancement with a focus on optimization.
A new method in a study proposed a swarm-optimized microbial colony counter. This new method combines SegNet with a blob counter and uses swarm intelligence optimizers, showing several advantages over currently used methods [26]. Particle Swarm Optimization (PSO), as well as its variants, Quantum-behaved PSO (QPSO) and Differential Evolution-based PSO (DE-PSO), have been used extensively for hyperparameter tuning and convergence adjustment in biomedical image segmentation [27,28]. Given their complexity, these types of optimizations are beneficial in the low-data domain, where networks need to be searched over a high-dimensional space.
Alongside accuracy, the other significant features of biomedical AI are interpretability and explainability. Automated colony analysis systems have become more reliable for users as a result of these improvements. Specifically, Grad-CAM and its derivatives, Grad-CAM++ and Integrated Gradients, as well as well-calibrated, temperature-scaled models, all improve confidence in automated systems by aligning predicted confidence with actual outcomes and minimizing overconfident errors [29]. Other recognized improvements in colony detection with small-sample datasets have utilized CNN-MLP architectural hybrids. These hybrids have achieved results beyond those with traditional CNN baselines, and represent a trend towards systems that integrate the inductive biases of CNNs with the global reasoning capabilities of MLPs or Transformers.
While developing swarm-optimized microbial colony counters and hybrid CNN-based segmentation frameworks has attracted attention in the literature, the frameworks proposed here differ fundamentally from existing approaches in both their count architectures and their functional integration. Microbial colony analysis frameworks designed with swarm optimization techniques typically build on classical encoder–decoder architectures (e.g., SegNet) or standard CNN pipelines. In these swarm-optimized frameworks, swarm intelligence techniques are mainly applied for hyperparameter tuning and weight optimization. Global context modeling through transformers, attention-based feature refinement, uncertainty quantification, and post-calibration interpretability are not addressed in these swarm-optimized systems; as a result, they lack robustness and applicability in unforeseen laboratory conditions, such as varying illumination or densely overlapping colonies.
The same sentiment applies to recent hybrid CNN–transformer frameworks, which have achieved substantial performance gains in biomedical image segmentation by combining modular local feature extraction with a transformer architecture to capture long-range dependencies. Once again, such frameworks leave the majority of issues in microbial imaging unaddressed, including extreme colony clustering, weak and less-defined colonies, agar artifacts, and cross-domain laboratory variability. Lack of swarm intelligence optimization, explainability, and a combination of graph-based refinement and uncertainty calibration are other limitations of the existing hybrid frameworks.
The proposed framework integrates a swarm-optimized, explainable attention–transformer architecture, making it a first for microbial colony segmentation and counting. Nested encoder–decoder representations, channel-spatial attention refinement, Swin Transformer bottleneck representations, PSO/QPSO/DE-PSO optimization, watershed and graph-based colony separation, Grad-CAM++ and Integrated Gradients explainability, Monte Carlo uncertainty estimation, temperature scaling, and cross-dataset robustness validation are fully integrated into an end-to-end modeling approach. The integrated approach described in this framework achieves better segmentation accuracy, colony separation, and robustness across diverse laboratory conditions, and greater explainability than current swarm-optimized or hybrid CNN-transformer frameworks.
While exploring individual strategies such as CNN-based segmentation, transformer architectures, swarm optimization, augmentation, or explainability, prior work focused on specific isolated aspects of microbial colony analysis. Typical segmentation approaches may encounter difficulties handling overlap among colonies when illumination varies. Transformer-based approaches may lack robust optimization in the presence of limited data, whereas optimization-based approaches may rely on relatively simple segmentation backbones with explainability or uncertainty modeling. Unlike the previously mentioned work, the proposed framework offers a problem-driven hybridization approach. This involves integrating colony counting and segmentation with preprocessing, attention refinement, transformer contextual modeling, swarm intelligence optimization, and post-processing, all performed with meticulous attention to detail and adjustment.

3. Proposed Methodology

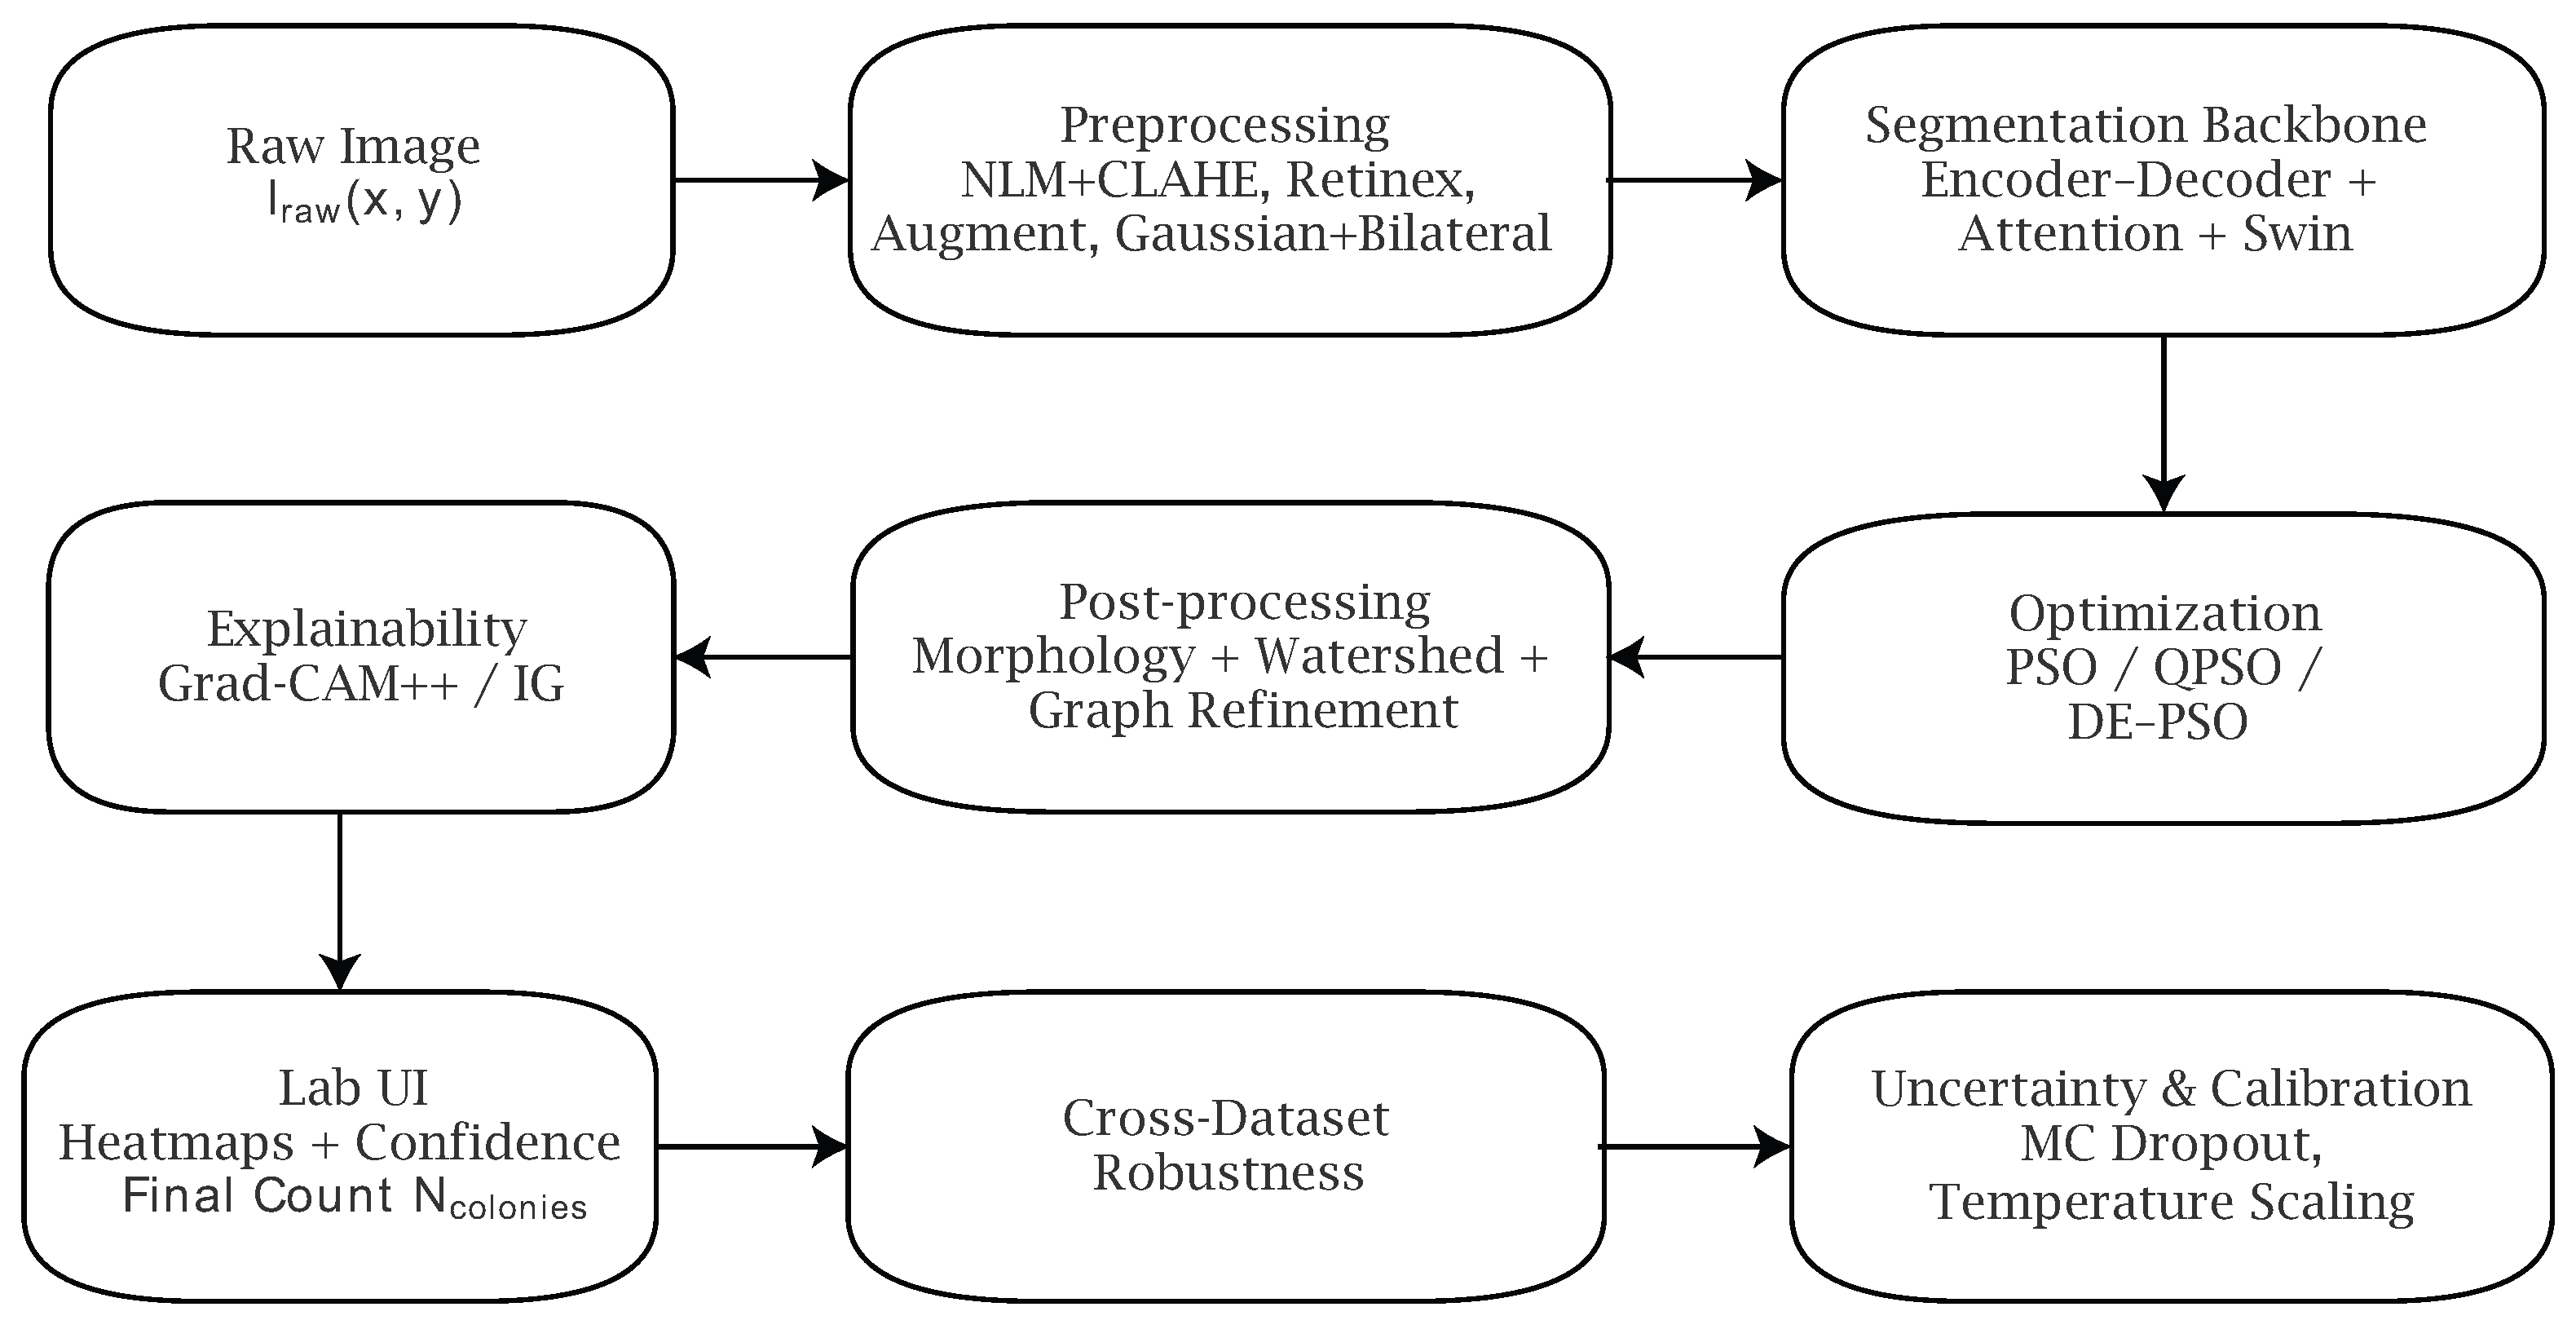
The proposed framework encompasses automated colony counting. It addresses the challenges associated with superimposed colonies, poor lighting, high background noise, and low interpretability. The proposed framework incorporates several processes. Its first process, advanced preprocessing, consists of denoising, contrast enhancement, and illumination normalization. This is followed by a segmentation process. The segmentation process employs an encoder–decoder design backbone architecture and combines attention and transformer mechanisms to appropriately outline the colonies. It employs PSO swarm optimization and its variants, QPSO and DE-PSO, to optimize the process parameters. In the last morphological post-processing, I refined the colony masks. This is used in conjunction with a watershed process to disjoin colonies and a graph-based process to enhance precision. The modularity of the framework is characterized by the integration of reliability and seamless laboratory workflow. Framework modularity is depicted in detail in Figure 1.

3.1. Preprocessing

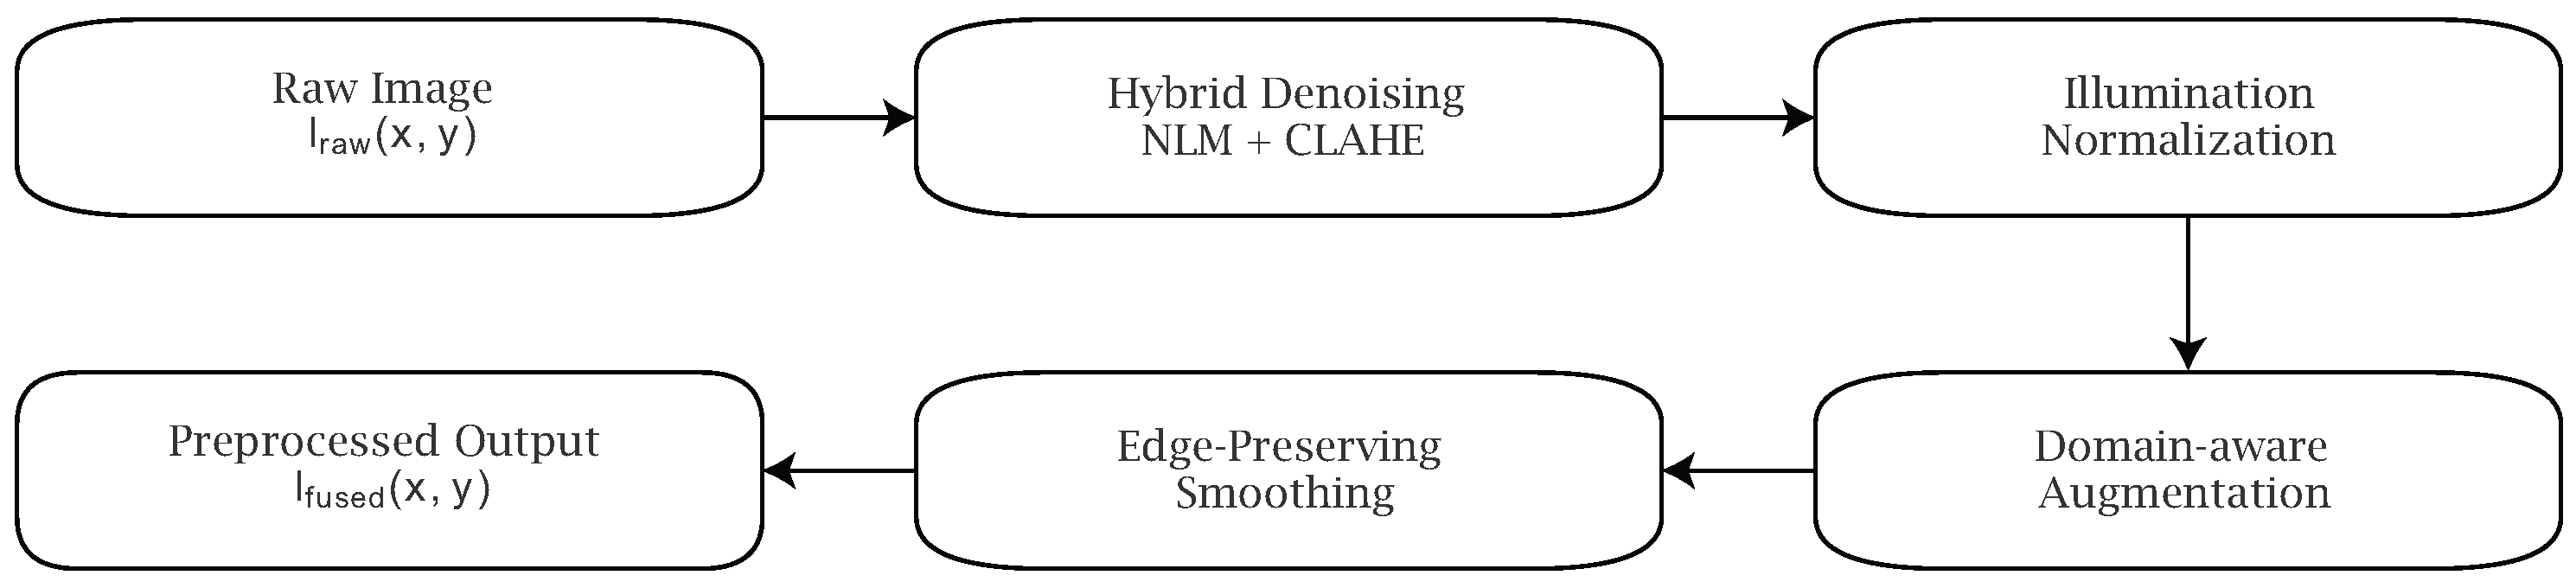
Image preprocessing enhances images of culture plates to facilitate optimal segmentation and counting of microbial colonies. Images of culture plates are often plagued by imperfections, including inconsistent lighting, noise, and artifacts. These imperfections make it difficult for deep learning models to accurately identify colony boundaries. In response to these challenges, our preprocessing pipeline employs several operations, including hybrid denoising, illumination normalization, domain-aware augmentation, and edge-preserving smoothing. These operations denoise an image while preserving the morphology of the colonies. The preprocessing pipeline (Figure 2) outlines the multi-step operations performed to improve colony images before segmentation.

3.1.1. Hybrid Denoising

Raw images, I r a w ( x , y ) , contain noise from the imaging sensors and environmental conditions. To suppress this noise without losing NLM-CLAHE fine structures, a combination of Non-Local Means (NLM) filtering and Contrast Limited Adaptive Histogram Equalization (CLAHE) is applied. The NLM filter is defined as follows:
I N L M ( x , y ) = 1 C ( x , y ) ( u , v ) Ω w ( x , y ) , ( u , v ) I r a w ( u , v ) ,
where w ( x , y ) , ( u , v ) denotes the similarity weight between patches centered at positions ( x , y ) and ( u , v ) , Ω is the search window, and C ( x , y ) is the normalizing factor. Performing this operation preserves self-similar textures and suppresses noise. One way to improve contrast is to apply CLAHE. CLAHE locally adjusts the intensity histogram to allow for
I C L A H E ( x , y ) = ClipHistEq I N L M ( x , y ) , L c l i p ,
where L c l i p is the clipping threshold that controls noise amplification. The resulting image I C L A H E improves local contrast and makes it easier to identify small and/or faint colonies.

3.1.2. Illumination Normalization

A Retinex-based approach corrects for uneven illumination. The image acquired is modeled as follows:
I r a w ( x , y ) = R ( x , y ) · L ( x , y ) ,
where R ( x , y ) indicates reflectance (the true object structure) and L ( x , y ) indicates the illumination component. The Retinex correction approximates reflectance as follows:
R ( x , y ) = I r a w ( x , y ) G σ I r a w ( x , y ) ,
where G σ represents a Gaussian kernel with variance σ 2 , and ∗ denotes convolution. This eliminates low-frequency illumination distortion, allowing R ( x , y ) to reliably represent colony boundaries throughout the entire plate.

3.1.3. Domain-Aware Data Augmentation

To improve generalization across various laboratory conditions, we generate additional training samples, denoted by { I a u g } . The augmentation pipeline specifically consists of
I a u g 1 ( x , y ) = α · I ( x , y ) , α U ( 0.8 , 1.2 ) ,
I a u g 2 ( x , y ) = Elastic I ( x , y ) ; σ e , α e ,
I a u g 3 ( x , y ) = CropScale I ( x , y ) ; β ,
where α describes fluctuations in brightness, Elastic ( · ) introduces stochastic elastic distortions parameterized by ( σ e , α e ) , and CropScale ( · ) carries out random cropping and scaling, characterized by a scaling factor of β . Collectively, these augmentations reflect the variability present in a real-world laboratory, such as fluctuations in light, elastic distortions of colonies, and changes in measurement scale.

3.1.4. Edge-Preserving Smoothing

Finally, we also enhance the preprocessed image using parallel Gaussian and bilateral filters. The Gaussian filter is described by the following:
I G ( x , y ) = 1 2 π σ 2 ( u , v ) Ω exp ( x u ) 2 + ( y v ) 2 2 σ 2 I ( u , v ) ,
where σ controls the spread of the smoothing. The bilateral filter which preserves edges is defined as follows:
I B ( x , y ) = 1 W ( x , y ) ( u , v ) Ω exp ( x , y ) ( u , v ) 2 2 σ s 2 exp ( I ( x , y ) I ( u , v ) ) 2 2 σ r 2 I ( u , v ) ,
where σ s denotes spatial variance, σ r denotes range variance, and W ( x , y ) is the normalization factor. Subsequently, the fused output is given as follows:
I f u s e d ( x , y ) = max I G ( x , y ) , I B ( x , y ) .
This guarantees that the final image outputs clear-cut regions. These regions maintain distinct colony edges, enhancing the overall uniformity and smoothness. The multi-faceted, pre-analytical approach improves the sample’s clarity and brightness. This is achieved by maintaining the respective boundaries in the I f u s e d ( x , y ) images using a segmentation network.

3.2. Advanced Segmentation Backbone

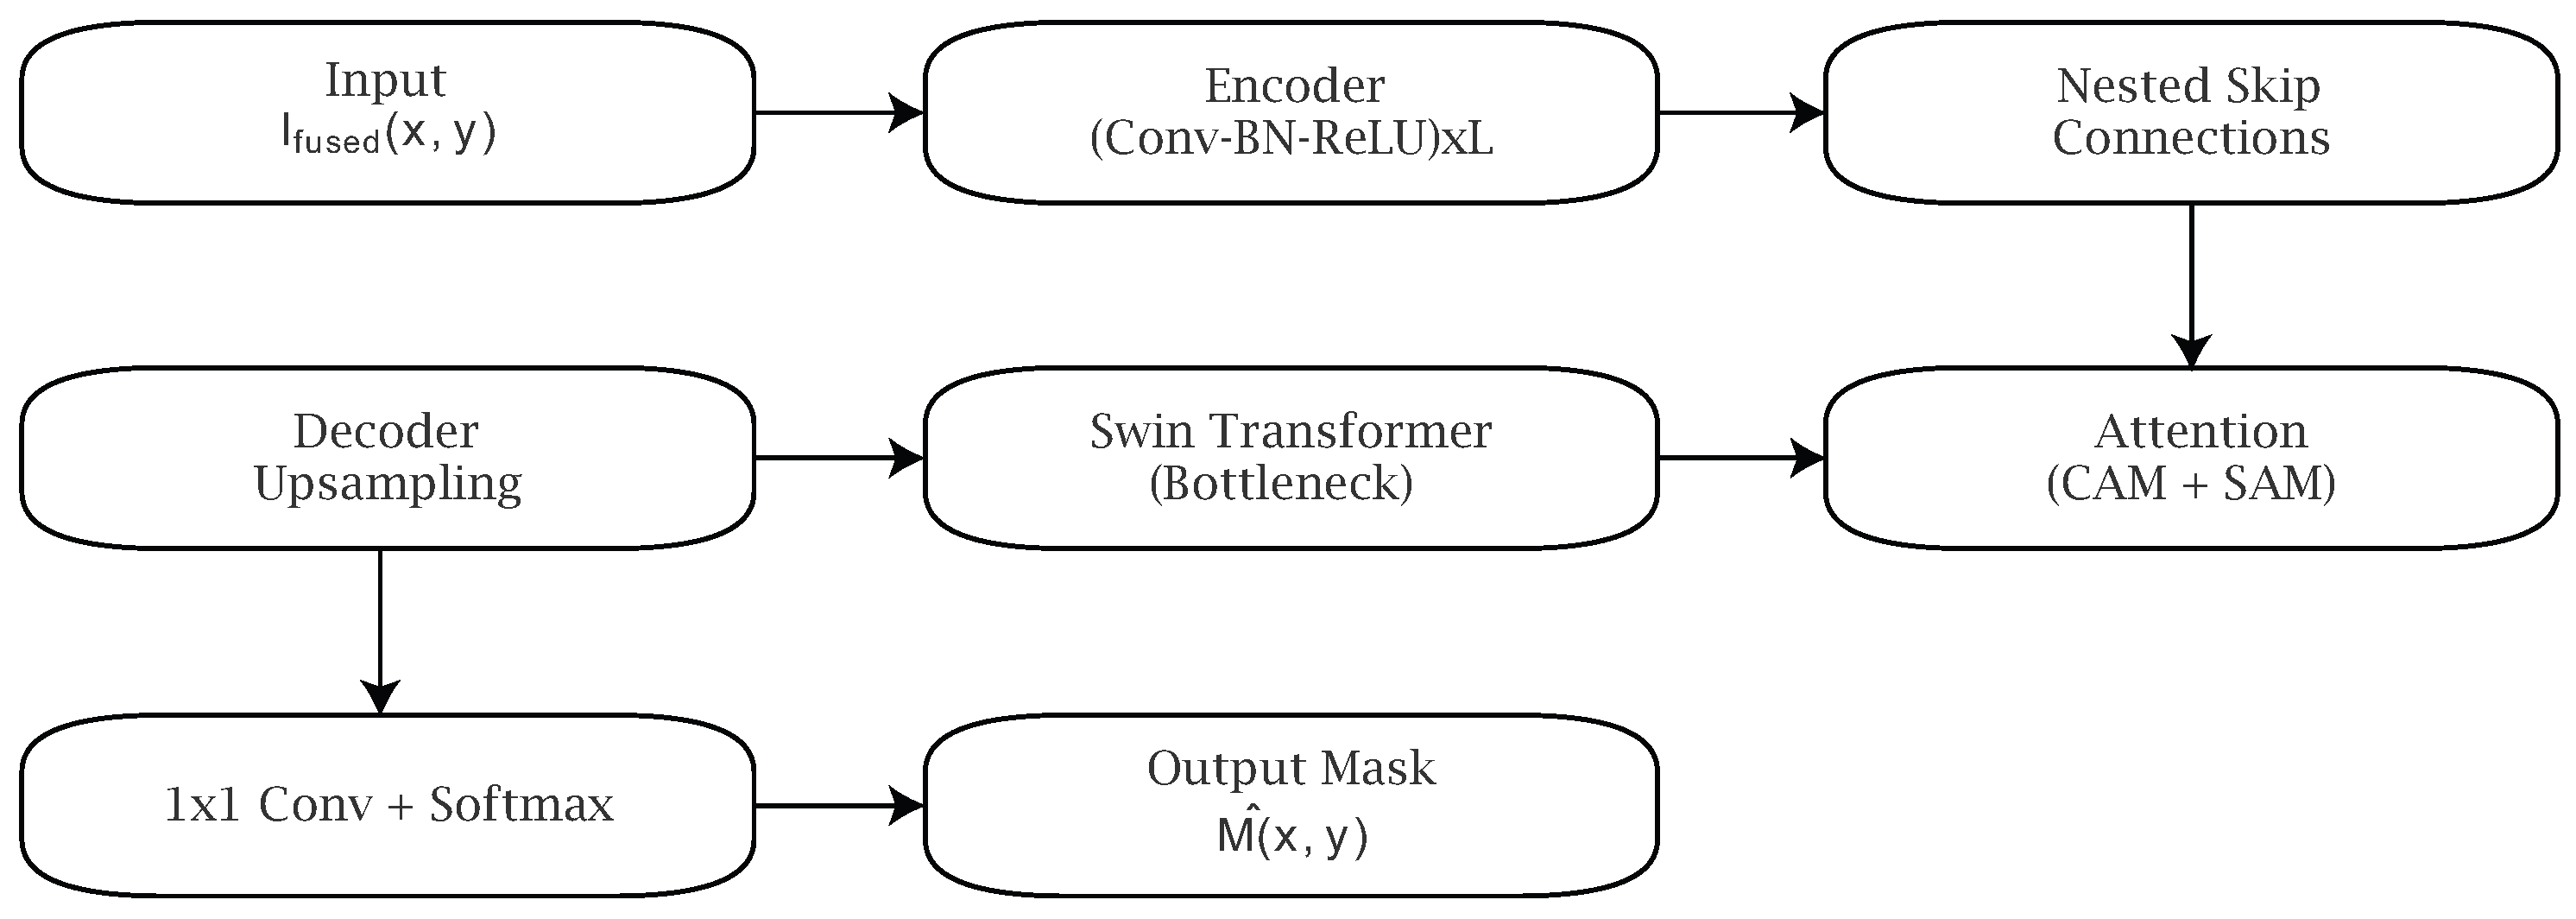
Segmentation of tightly clustered microbial colonies remains a formidable challenge, as many colonies are irregularly shaped and exhibit weak features due to poor staining or inadequate illumination. Although SegNet establishes a baseline for an encoder–decoder architecture, its simplistic skip connections and shallow depth severely limit its capacity for fine-detail colony segmentation, particularly under the constraints of laboratory noise. Our segmentation architecture intends to overcome those shortcomings by implementing three critical aspects: (i) an improved multi-scale feature U-Net++ based hybrid encoder–decoder, (ii) channel–spatial attention modules which focus on pertinent features and reduce competing background segmentation, and (iii) transformer blocks which, due to their position in the bottleneck of the model, are particularly useful for segmentation by addressing the shortcomings of previous segmentation architectures and explicitly modeling long-range feature dependencies. Together, these components enable robust colony segmentation under diverse imaging conditions. The architecture of the proposed backbone is depicted in Figure 3, which integrates an encoder–decoder, nested skip connections, attention modules, and transformer bottlenecks.

3.2.1. Hybrid Encoder–Decoder Design

The encoder–decoder framework forms the structural backbone of the model. The encoder progressively extracts low-to-high level features from the input image I f u s e d ( x , y ) R H × W . At the same time, the decoder reconstructs the segmentation mask by upsampling and fusing encoder features. Unlike the plain SegNet, our architecture is based on U-Net++ with deep supervision. In the encoder, hierarchical features are obtained as follows:
f ( l ) = ϕ ( l ) f ( l 1 ) , l = 1 , 2 , , L ,
where f ( 0 ) = I f u s e d , ϕ ( l ) ( · ) denotes convolution, normalization, and activation operations, and L is the total number of encoding stages. The decoder reconstructs the colony mask using both the encoder outputs and intermediate skip connections:
g ( l ) = ψ ( l ) g ( l + 1 ) , f ( l ) ,
where ψ ( l ) ( · ) is an upsampling and concatenation operator. U-Net++ improves segmentation by adding dense skip connections between encoder and decoder stages, effectively narrowing the semantic gap and preserving fine colony boundaries. As a result, overlapping colonies are better separated, and edge details are preserved.

3.2.2. Attention-Enhanced Feature Refinement

In culture plate images, colonies are often surrounded by large homogeneous backgrounds and spurious artifacts (e.g., scratches, lighting reflections). These background characteristics can monopolize the convolutional filters’ activity, thereby reducing segmentation accuracy if the problem is not resolved. To address the shortcomings, attention mechanisms are integrated to redirect the network to the relevant areas pertaining to the colonies. Consider a feature map F R C × H × W . In this instance, channel attention dynamically focuses on the more salient channels.
M c ( F ) = σ W 1 δ ( W 0 GAP ( F ) ) ,
where GAP ( · ) calculates global average pooling across all spatial dimensions, while W 0 and W 1 are learnable parameters, δ ( · ) is the ReLU activation function, and σ ( · ) is the sigmoid function. This elucidates channels encoding colony morphology while discarding those encoding a uniform background. In addition, spatial attention captures the positional saliency in a feature map:
M s ( F ) = σ f 7 × 7 ( [ AvgPool ( F ) ; MaxPool ( F ) ] ) ,
where f 7 × 7 denotes a convolution with kernel size 7 × 7 , and [ · ; · ] is channel concatenation. We then obtain the refined feature representation with
F = M c ( F ) F M s ( F ) ,
where ⊗ denotes element-wise multiplication, this dual-attention module helps assign higher weights to faint colonies that may be overlooked while reducing background noise.

3.2.3. Transformer Block Integration

While CNNs are effective at extracting features, their short receptive fields hinder modeling global dependencies. This shortcoming is especially problematic when colonies are grouped, as contextual information from surrounding colonies is required to distinguish boundaries. Given an input feature sequence Z R N × d , where N denotes the number of image patches and d is the embedding dimension, the query, key, and value matrices are first computed as
Q = Z W Q , K = Z W K , V = Z W V ,
where W Q , W K , and W V are learnable projection matrices. The scaled dot-product attention is then formulated as
Attention ( Q , K , V ) = Softmax Q K T d k + B V ,
where d k is the key dimension and B denotes the relative position bias matrix. For multi-head attention, the attention output is computed as
MHA ( Z ) = Concat head 1 , head 2 , , head h W O ,
head i = Attention Z W Q ( i ) , Z W K ( i ) , Z W V ( i ) ,
where h is the number of attention heads and W O is the output projection matrix. The transformer block output is further refined through residual connections, layer normalization, and a feed-forward network as
Z = LN Z + MHA ( Z ) ,
Z out = LN Z + FFN ( Z ) .
This complete formulation clarifies how the Swin Transformer bottleneck captures long-range dependencies while preserving local structural information through shifted-window attention.

3.2.4. Output Segmentation Mask

After passing through the encoder–decoder, attention modules, and transformer layers, the final feature representation g ( 0 ) is mapped to a segmentation mask. This is achieved using a 1 × 1 convolution followed by a Softmax activation:
M ^ ( x , y ) = Softmax W s g ( 0 ) ( x , y ) + b s ,
where W s and b s refer to the learnable parameters. The mask M ^ ( x , y ) classifies each pixel as either foreground (colony) or background. The advanced backbone ensures that the final segmentation masks are consistent with the advanced structure, preserving the colony’s intricate edges and separating intersecting regions across varying, potentially noisy imaging environments. This ensures a solid base for the counting stage, where accurate colony counting is critical and relies fundamentally on segmentation quality.

3.3. Optimization Improvements

To improve segmentation accuracy, facilitate colony separation, and promote consistent convergence, swarm intelligence optimization was introduced to a range of network and training parameters. Here, optimization was not confined to the learning rate. Instead, a comprehensive, large-scale, multi-parameter optimization was performed, including parameters for attention and refinement, transformer bottlenecks, loss balancing, and post-processing. This method also improved convergence and generalization and provided segmentation stability for varying laboratory imaging conditions.
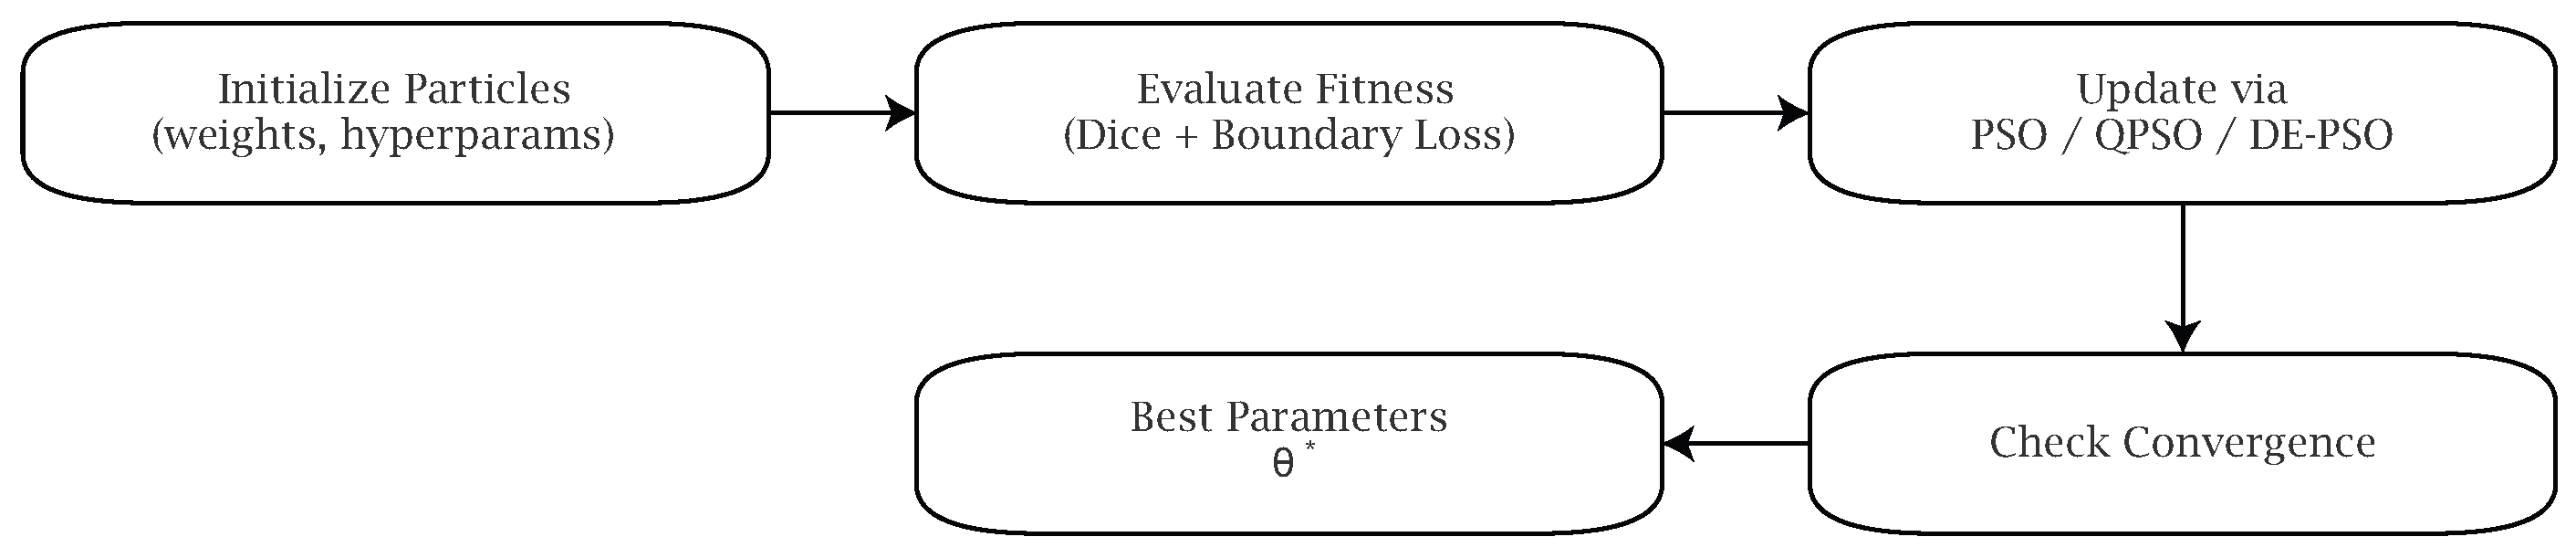
Parameter optimization is vital to refine the ability of Deep Neural Networks (DNNs) to accurately segment microbial colonies. Starting from a baseline, this method employed Particle Swarm Optimization (PSO) to optimize the weights of a colony segmentation model. PSOs are known to be globally efficient; however, they often lose completeness and may converge to a local optimum within a high-dimensional region. To this end, the latest swarm intelligence methods were employed, notably Quantum Behaved PSO (QBPSO) and a hybrid PSO-Differential Evolution (DE-PSO) optimization, to enhance convergence stability and segmentation accuracy. PSO, QBPSO, and DE-PSO, in tune with the Dice and boundary loss functions, were applied to optimize network parameters, as shown in Figure 4.

3.3.1. Particle Swarm Optimization (PSO)

In standard PSO, each individual is a potential solution in an N-dimensional space. The position and velocity updates for the overall swarm and the ith individual at the tth iteration are expressed with the following equations:
v i t + 1 = ω v i t + c 1 r 1 p i t x i t + c 2 r 2 g t x i t ,
x i t + 1 = x i t + v i t + 1 ,
where x i t and v i t represent the position and velocity of particle i, ω denotes the inertia weight regulating exploration, c 1 and c 2 are cognitive and social coefficients, r 1 , r 2 U ( 0 , 1 ) refer to random scalars, p i t represents particle i’s personal best, and g t denotes the global best position. The fitness function assesses segmentation accuracy (measured by the Dice score and boundary preservation) and guides the particles toward the optimal network weights.

3.3.2. Quantum-Behaved PSO (QPSO)

To mitigate premature convergence, Quantum-behaved PSO uses a probabilistic position update mechanism based on quantum-mechanical principles. Instead of predetermined velocity updates, the position of particle i at the iteration t + 1 is expressed as follows:
x i t + 1 = P i t ± β · | m t x i t | · ln 1 u ,
where P i t = p i t + g t 2 is the local attractor of particle i, m t = 1 N i = 1 N p i t is the average best position of all particles, β is a contraction–expansion coefficient controlling the convergence rate, and u U ( 0 , 1 ) is a uniformly distributed random variable. This design allows particles to sample the search space stochastically, reducing the risk of getting stuck in local minima while ensuring solution diversity.

3.3.3. Hybrid DE–PSO Strategy

While QPSO enhances global search capabilities, for tasks such as training high-dimensional neural networks, the importance of refining local solutions is undeniable. Specifically to enhance performance, we utilize a hybrid method of Differential Evolution (DE) with PSO, where the DE mechanism is characterized by mutation and crossover of candidate solutions:
v i t = x r 1 t + F · ( x r 2 t x r 3 t ) ,
u i t = Crossover ( x i t , v i t ) ,
where x r 1 , x r 2 , x r 3 are distinctly selected random particles, F refers to the mutation factor, and u i t denotes the trial vector. If u i t shows improved fitness, this vector substitutes x i t in the existing population. The incorporation of DE operators into the PSO loops helps the hybrid DE-PSO system achieve a balance between exploration and exploitation, leading to faster convergence. DE provides an optimal framework for PSO’s global structure and social interaction, while PSO’s primary function is to direct the population toward the most promising areas of the solution space.

3.3.4. Optimization Objective

The optimization process achieves minimization of a combined loss function consisting of Dice and boundary-aware loss:
L = λ 1 L D i c e + λ 2 L B o u n d a r y ,
where λ 1 and λ 2 are weighting coefficients. The swarm optimization mechanism attempts to find the most optimal network parameters denoted by θ , satisfying
θ = arg min θ L ( θ ; I f u s e d , M g t ) ,
with M g t indicating the ground-truth mask. Our multi-stage optimization framework yields backbones with superior convergence, generalization, and boundary preservation of colonies than the baseline PSO. Combines PSO, QPSO, and DE–PSO and explores the vast, high-dimensional optimization space of the hybrid attention–transformer framework. As part of this complementary optimization strategy, PSO drives the search globally, QPSO supports a random search and mitigates premature convergence, and DE–PSO enhances local search through adaptive mutation and crossover. This joint optimization of the segmentation, attention, transformer, calibration, and post-processing modules increases the reliability of colony counting and enhances segmentation.

3.4. Post-Processing and Counting

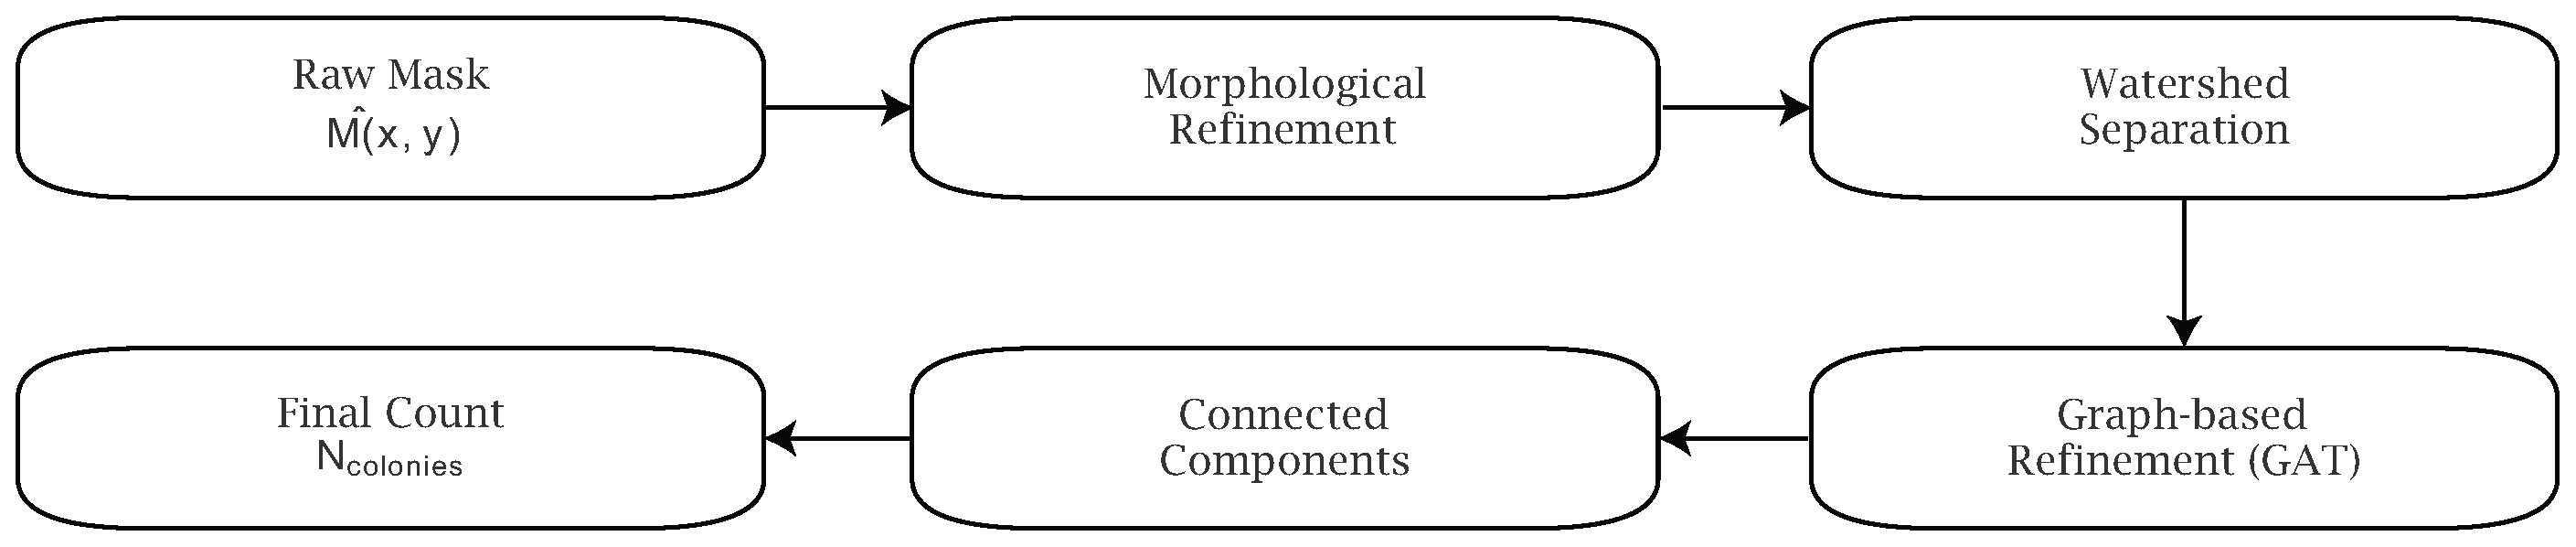
After segmentation, binary masks produced by an advanced backbone often contain minor artifacts, touching colonies, and residual background noise. If a blob counter is used directly, it will likely lead to inaccurate colony counts, especially when colonies overlap or are irregular. To mitigate this, we adopt a two-phase post-processing and counting methodology that employs traditional morphological operations and graph refinement. Figure 5 outlines the post-processing and counting methodology, which improves raw masks and provides the definitive count of colonies.

3.4.1. Morphological Refinement

The segmentation mask M ^ ( x , y ) can be modified by using morphological operations to refine colony boundaries and remove undesirable noise. The first improvement involves removing small, connected components in the mask with an area less than the predefined minimum area threshold τ m i n .
M ^ c l e a n ( x , y ) = { R M ^ : Area ( R ) τ m i n } ,
where R denotes a connected region. To close small gaps and divide weakly connected colonies, dilation–erosion operations are performed.
M ^ m o r p h = M ^ c l e a n B B ,
where ⊕ and ⊖ denote morphological dilation and erosion, respectively, and B represents the structuring element (which is frequently circular to match the morphology of the colony). This step in the operation results in a mask with smoother boundaries and greater confidence in the separation of adjacent colonies.

3.4.2. Watershed-Based Separation

The markers’ boundaries are separated using a watershed algorithm for colonies that touch or overlap. The first stage is the distance transform computation on the refined mask:
D ( x , y ) = min ( u , v ) M ^ m o r p h ( x u ) 2 + ( y v ) 2 ,
where M ^ m o r p h denotes the boundary pixels of the segmented colonies. Peaks in D ( x , y ) signify colony centers and are utilized as markers in watershed segmentation. The watershed transform subsequently segments M ^ m o r p h into different sections:
M ^ w s = Watershed ( D , M ^ m o r p h ) ,
guaranteeing that overlapping colonies are assigned to separate regions. This greatly enhances the accuracy of dense culture plate enumeration.

3.4.3. Graph-Based Colony Separation

For exceedingly concentrated colonies, possibly due to mixed watersheds, we implement a graph-based refinement technique. We create a graph G = ( V , E ) in which each colony is a node. Segmented regions are nodes, and adjacency is represented by edges E. We utilize a Graph Attention Network (GAT) to improve the refinement of colony embeddings:
h i = σ j N ( i ) α i j W h j ,
where h i is the feature vector of colony i, N ( i ) is the neighborhood of node i, W is the learnable weight matrix, and α i j are the attention coefficients calculated as follows:
α i j = exp LeakyReLU ( a T [ W h i | | W h j ] ) k N ( i ) exp LeakyReLU ( a T [ W h i | | W h k ] ) .
This enhancement helps differentiate colonies that, after watershed segmentation, remain only partially separated and are densely packed.

3.4.4. Final Counting Strategy

The total number of colonies is determined by counting the disjoint connected components in the refined mask:
N c o l o n i e s = | { R M ^ w s : Area ( R ) τ m i n } | ,
where | · | denotes counting. For colonies that are distinctive due to graph refinement, each unique vertex in the graph represents a colony in the count. This robust and precise method incorporates morphological refinement, watershed segmentation, and a graph adjustment. This method effectively resolves the dual challenges of noise artifacts and colony merger, providing a better estimate in typical laboratory conditions.

3.5. Explainability and Robustness

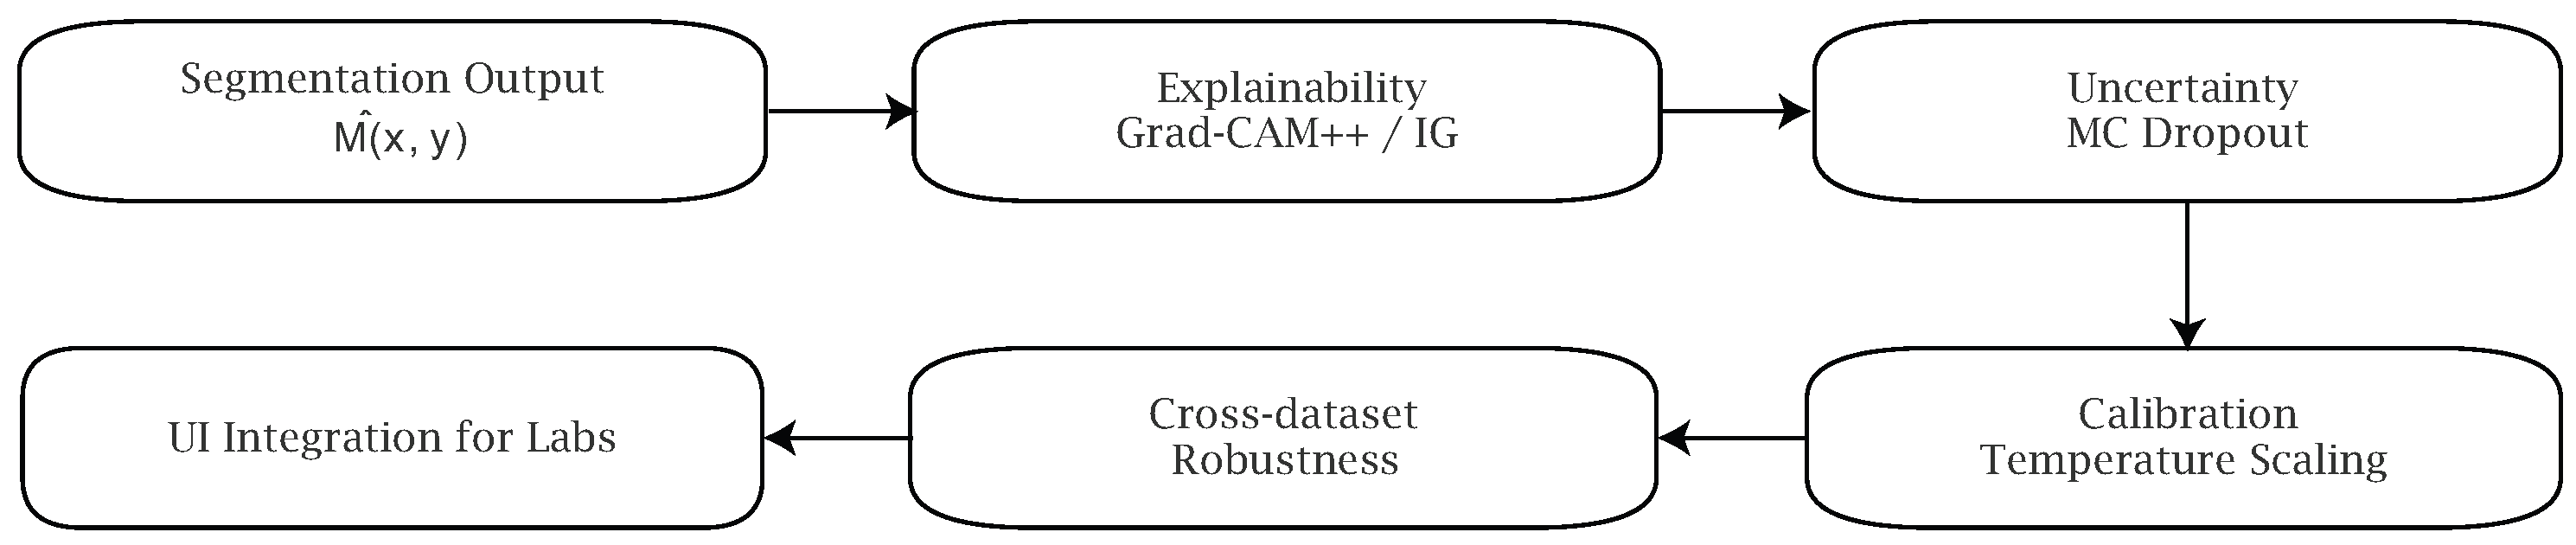
For microbial colony-counting systems to be trusted in clinical and industrial environments, high accuracy and the ability to provide reasonable explanations of predictions, including uncertainty estimates, are essential criteria. In microbiology, black-box models are often looked at with suspicion because laboratory workers traditionally confirm colony detections visually. To address this, our framework, which combines explainability and robustness, is designed to balance interpretability and reliability and ensure generalization to other datasets. The explainability and robustness components of our framework (Figure 6) incorporate visual interpretability, uncertainty estimation, and robustness calibration and verification across other datasets.

3.5.1. Explainable Visual Attributions

To identify the portions of the input images that most influence the model’s colony prediction, we employ Gradient-weighted Class Activation Mapping (Grad-CAM++) and Integrated Gradients (IG). In Grad-CAM++, the kth feature map and its relation to the target class c have the importance weight α k c defined as follows:
α k c = i j 2 y c F i j k 2 ,
where F i j k denotes the activation at coordinate ( i , j ) of the kth feature map and where y c represents the class score pertaining to class c. The last step for calculating the Grad-CAM++ heatmap is
L Grad - CAM + + c = ReLU k α k c F k .
The heatmap section annotates areas for colony detection, enabling laboratory staff to view model predictions. Furthermore, the Integrated Gradients technique defines the role of each pixel, x i , by integrating the gradients over the path from the baseline input x to the actual input x:
IG i ( x ) = ( x i x i ) × α = 0 1 f ( x + α ( x x ) ) x i d α .
Attribution provides transparency into decision-making by providing explanations at the pixel level.

3.5.2. Uncertainty Quantification

To quantify confidence levels for colony predictions, we implement Monte Carlo (MC) dropout. During the inference process, dropout layers are kept operational, producing several stochastic outputs, as detailed below:
M ^ ( t ) = f θ ( I f u s e d , ζ ( t ) ) , t = 1 , 2 , , T ,
where ζ ( t ) is the dropout mask sampled at iteration t, and T is the number of stochastic forward passes. The predictive mean is expressed as follows:
M ¯ ( x , y ) = 1 T t = 1 T M ^ ( t ) ( x , y ) ,
and the predictive variance captures uncertainty:
σ 2 ( x , y ) = 1 T t = 1 T M ^ ( t ) ( x , y ) M ¯ ( x , y ) 2 .
Areas with the highest uncertainty are flagged for expert review so that ambiguous colonies can be cross-verified before being reported as final.

3.5.3. Cross-Dataset Robustness

To support our generalization claim, we use cross-dataset training and testing. Specifically, a model is trained on microbial colony datasets D t r a i n and then tested on independent datasets D t e s t to ensure robustness across different imaging conditions.
Robustness Score = 1 | D t e s t | ( I , M g t ) D t e s t Dice M ^ ( I ) , M g t .
Furthermore, synthetic colony images created via Generative Adversarial Networks (GANs) are also used during training. Incorporating GANs into the training dataset provides a broader range of scenarios, helps minimize the model’s tendency to overfit specific conditions, and improves its reliability in unfamiliar lab settings.

3.5.4. Calibration of Predictions

To enhance reliability, we apply temperature scaling to the predicted probabilities. Given the logits z, the calibrated probabilities are
P ( y | z , T ) = exp ( z y / T ) j exp ( z j / T ) ,
where T > 0 is a temperature parameter optimized on a validation set. Predictions will reflect true confidence and reduce over-optimism.

3.5.5. Integration with Laboratory Workflow

Explainability maps, uncertainty scores, and calibrated confidence scores define the user interface of the colony counter system and provide microbiologists with valuable benefits beyond basic colony counting. As part of the automated colony-counting system, each result is visually verified, and its reliability is scored. The system integrates manual inspection of results into the laboratory workflow by balancing automated colony counting with manual counting.

4. Results and Discussion

The swarm-optimized hybrid attention–transformer framework was comprehensively analyzed using qualitative and quantitative methods to evaluate segmentation, counting, optimization, and interpretation. The results are organized in a progressive manner, beginning with quantitative approaches using advanced metrics alongside conventional benchmarks, followed by ablation studies that reveal the contributions of the hybrid backbone, swarm optimization, and post-processing improvements. The frameworks are then tested on numerous datasets to verify their versatility in diverse imaging scenarios. The results are then analyzed to present qualitative arrays of segmentation masks, interpretability heatmaps, and colony separation of densely clustered segmentation outputs. This analysis shows the excellent performance of the proposed approach and highlights its simplicity of use and interpretability in both laboratory and clinical settings.

4.1. Dataset Description

To validate the proposed framework, we adopted two publicly available microbial colony datasets. The first is the Kaggle Microbial Colony Recognition Dataset. This dataset contains colonies that differ in size, arrangement, illumination, and abundance, as well as in agar plate diversity. The second dataset is the Figshare Circular Bacteria Colony Dataset. This dataset, which contains irregularly growing colonies, is much more complicated because the colonies have low contrast, high overlap, and different backgrounds. Both datasets (and the images within them) exhibit different imaging conditions and contrast, with highly distinct visual distributions, including colonies that overlap and contain different morphological features. The proposed framework was validated using cross-dataset testing, with particular attention paid to separating the training and test datasets, to assess its robustness and ability to generalize to the challenge of imaging complex, diverse microbial colonies.
Training Dataset: Kaggle Microbial Colony Recognition Dataset: The Kaggle dataset [30] contains microbial colony images with bounding-box annotations and recognition labels. For segmentation, bounding-box annotations were used to construct approximate region masks, which were then improved through a set of preprocessing steps. This dataset is the primary training dataset and teaches the model colony localization and morphology.
Testing Dataset: Circular Bacteria Colony Dataset (Figshare): The Circular Bacteria Colony Dataset from Figshare [31] contains pixel-level annotations for colonies of varying densities and morphologies. This dataset is used only for testing, with no overlap during training, thus allowing an unbiased assessment of the model’s generalization capability across different experimental settings.
The datasets used in this work contain many hundreds of culture plate images and thousands of microbial colonies; they also include a wide variety of colony structures and distributions, as well as images showing different appearances for microbial colonies. As such, the datasets contain colonies that are arranged sparsely, densely, and/or overlapping, colonies showing irregular growth, colonies with low contrast, and colonies of all sizes. These images also reflect the variability in the field of microbiology, including background, agar, illumination, reflections, and the conditions under which they are taken.
The different annotation methods across datasets reflect this variability. In the Microbial Colony Recognition Dataset from Kaggle, bounding boxes are provided for colonies. These bounding boxes were used to create colony segmentation masks, which were refined using a processor and morphological techniques to improve colony boundary localization and segmentation quality. On the other hand, in the Figshare Circular Bacteria Colony Dataset, colonies are annotated to the pixel level. This allows for a more accurate assessment of segmentation and colony separation quality. To avoid bias in the datasets, the training and testing datasets were kept completely independent with no overlap, and the evaluation strategy used various colony densities and morphologies to measure the robustness of the methods to variable conditions. In addition, the augmentation strategy involved creating a balanced representation of colonies, accounting for variations in appearance, scale, and illumination, as well as for arrangements across the different phases of the training process.
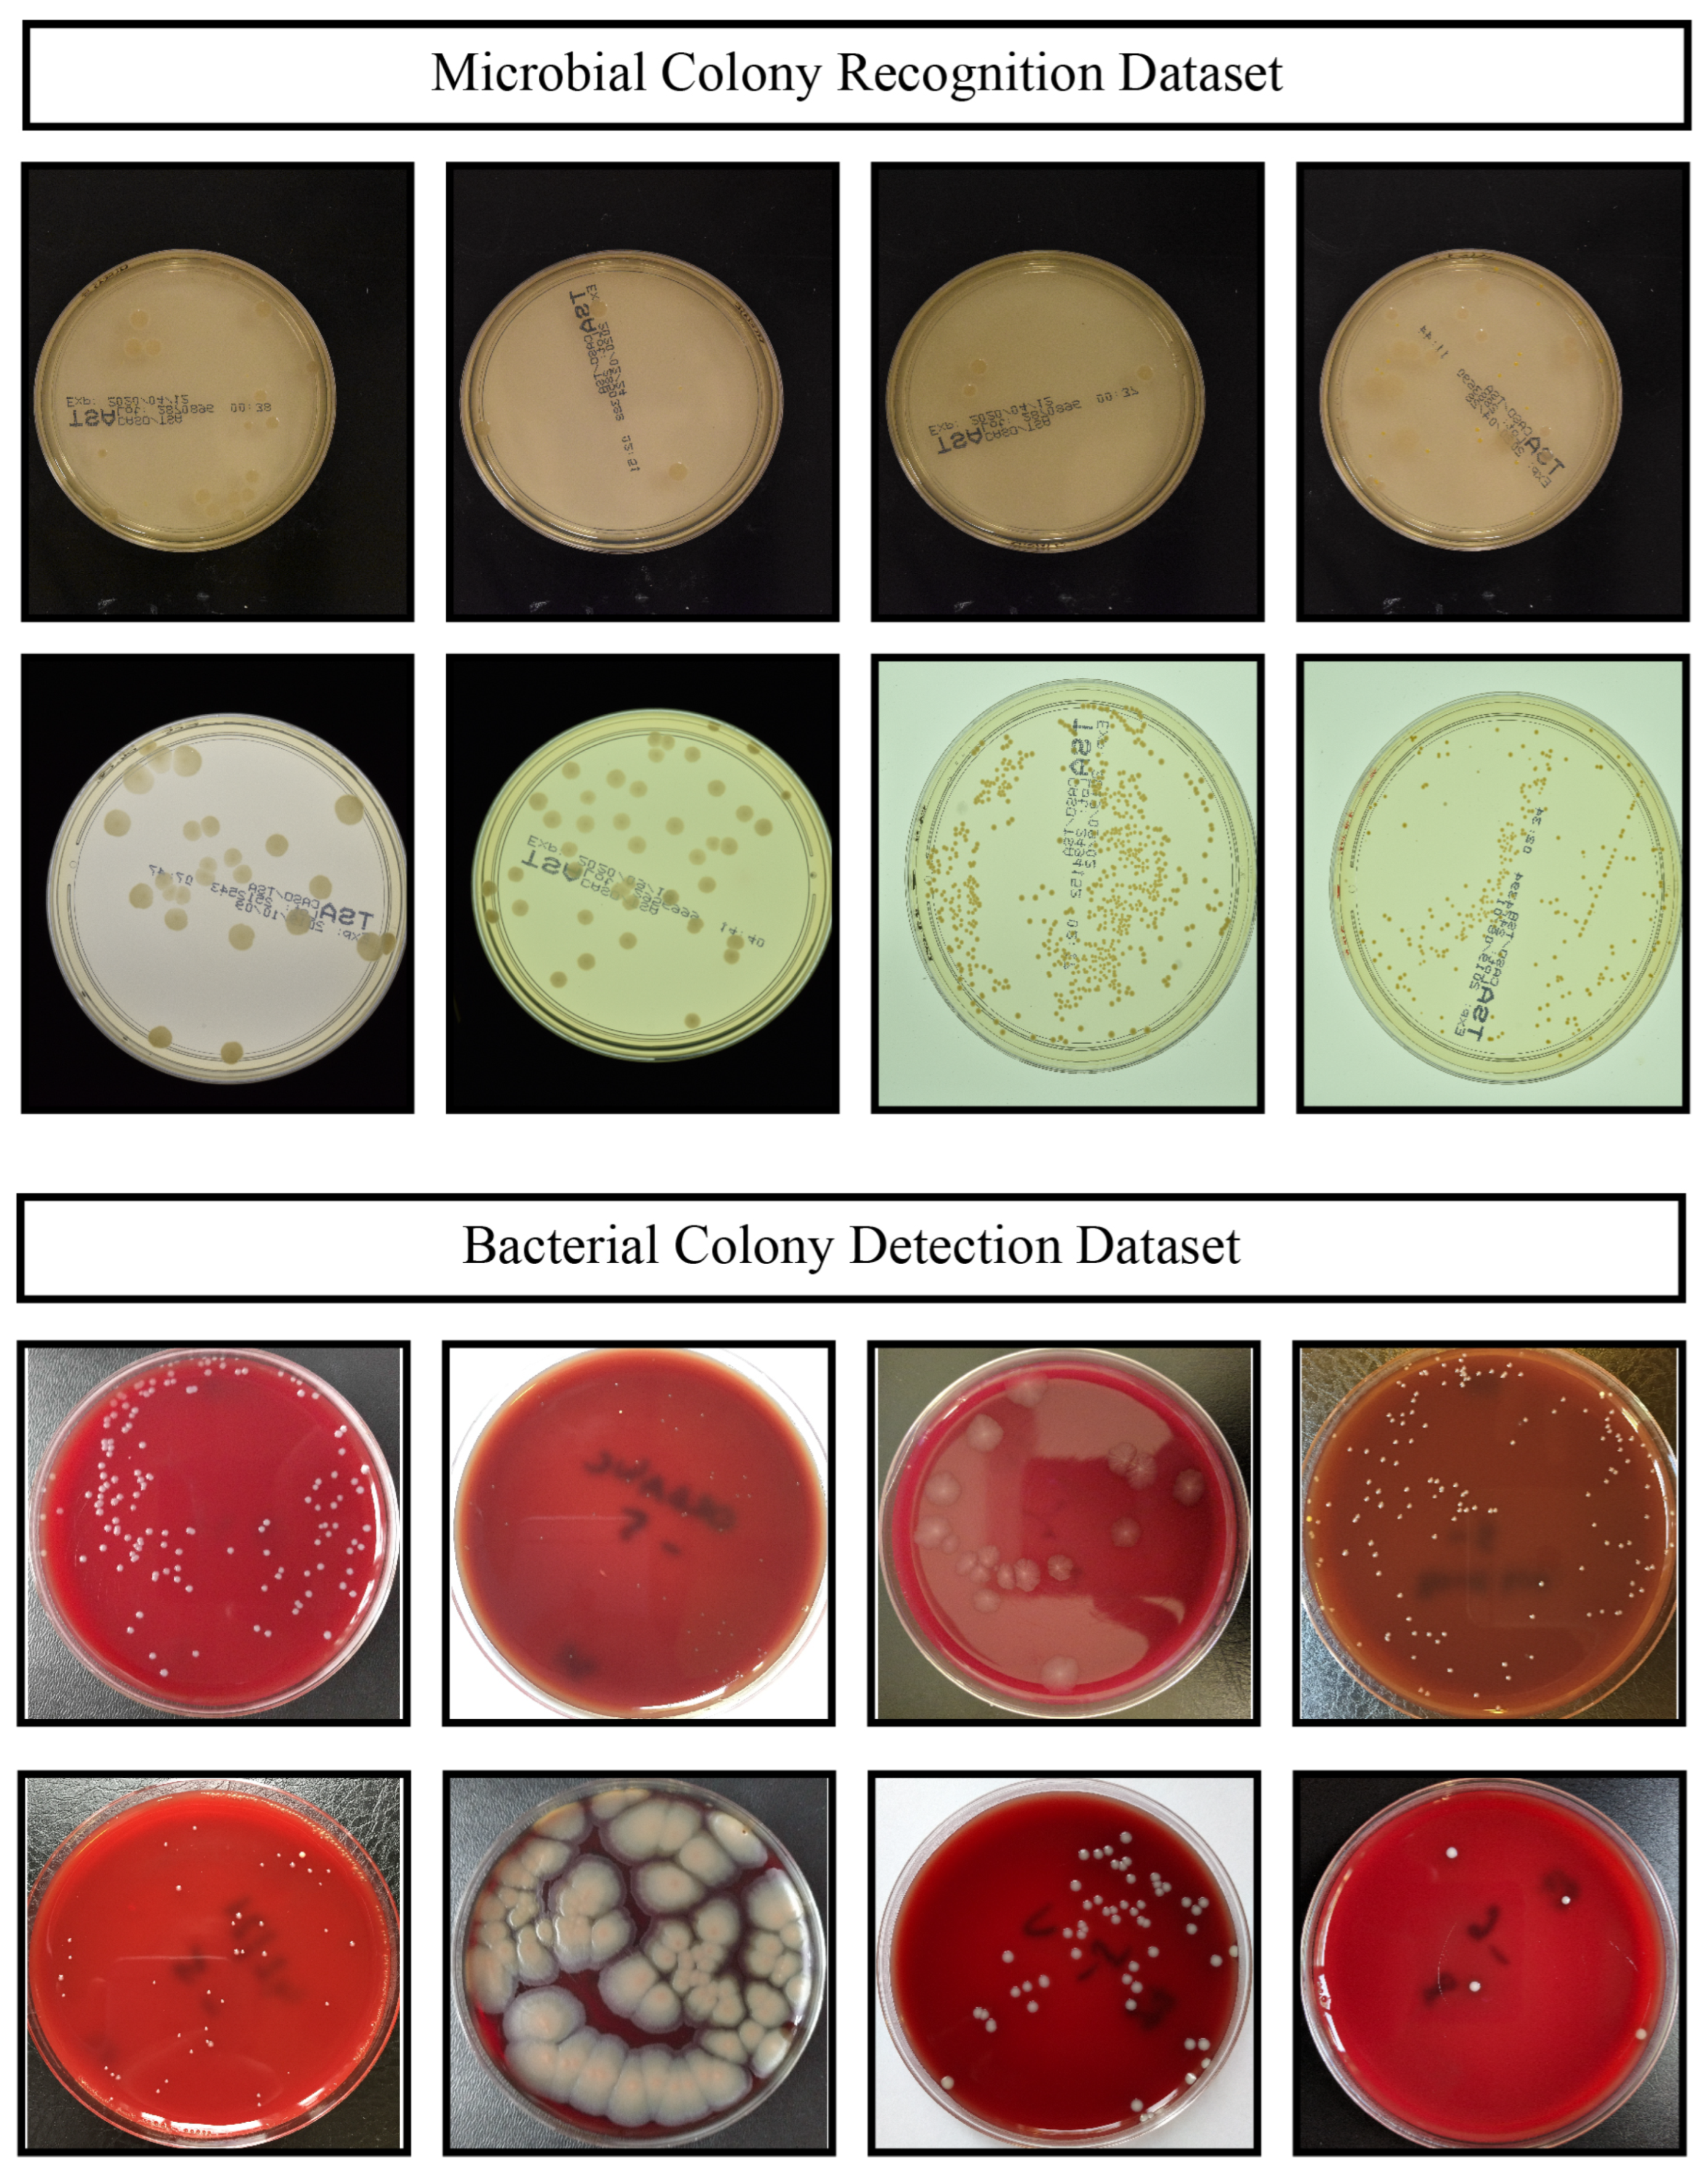
Using this dual-dataset strategy, the model is assessed on data not used during training, thereby minimizing overfitting and demonstrating the strategy’s soundness. Parts of the Microbial Colony Recognition Dataset and Bacterial Colony Detection Dataset used in this process are presented in Figure 7. These datasets demonstrate varying levels of colony density, color, and growth conditions for evaluation.
The datasets reflect laboratory situations in microbiology. Microbial colonies can be irregular or neat, and their edges can be clear or fuzzy. Colonies can be high- or low-contrast, with either dense or sparse growth. Datasets can include images of agar plates with varying backgrounds and textures, as well as different colors. Imaging can lead to noise, shadows, and low-contrast regions. Due to the variety of colony appearances across different laboratory and environmental conditions, the cross-dataset strategy was designed to evaluate its applicability in the real world. Training was performed on the Microbial Colony Recognition Dataset, and testing was performed on the independent Circular Bacteria Colony Dataset. This was designed to capture a more rigorous evaluation of the flexible framework, beyond the scope of one dataset, imaging, and colony characteristics, and to be flexible for diverse laboratories with different colony and agar appearances.
The datasets used are independent imaging distributions that were collected using different experimental and collection protocols. These datasets, which are highly heterogeneous in colony morphology, colony density, and several other features, can help capture the variability found in most microbiological laboratories. Although the datasets used come from different sources, they include images of laboratories having very sparse and very dense colonies, as well as very light, very overlapping, and very close colonies, with varying growth rates and in varying lighting conditions. The method was also evaluated in a formal cross-dataset validation. In this case, the Kaggle Microbial Colony Recognition Dataset was used for training, and the independent Figshare Circular Bacteria Colony Dataset for testing, with no overlap between the training and testing samples. In this cross-domain context, the framework attained a Dice score of 94.2%, an IoU of 88.6%, and a mean absolute counting error of 2.7. These outcomes are very promising and attest to the framework’s strength and generalization across largely divergent imaging distributions and conditions.

4.2. Experimental Setup

All experiments were conducted to assess the effectiveness and robustness of the proposed swarm-optimized microbial colony counting framework. The system was implemented in Python (PyTorch 3.10) with MATLAB 2024b-based preprocessing modules, and run on an Ubuntu 22.04 workstation with an NVIDIA RTX A6000 GPU (12 GB VRAM), Intel Xeon Silver 4314 CPU, and 32 GB RAM. Images were resized to 256 × 256 , normalized, and augmented using rotations, flips, brightness changes, and elastic deformations. Models were trained with Adam ( lr = 1 × 10 4 ), batch size 16, and up to 100 epochs with early stopping, using a composite Dice and boundary-aware loss. Swarm intelligence optimizers—PSO ( N = 30 , ω = 0.7 , c 1 = c 2 = 1.5 ), QPSO ( β decreasing from 0.5), and DE–PSO ( F = 0.5 , C R = 0.9 )—were employed for 50 iterations each to refine hyperparameters and enhance segmentation performance.
The proposed framework and baseline models went through the same end-to-end experimental procedures. The same preprocessing steps were taken to include denoising, illumination normalization, augmentation, and smoothing, which were applied to all the training data for all baseline models before the optimization of segmentation networks. The segmentation network was optimized and trained using PSO, QPSO, and DE–PSO to improve convergence stability and segmentation. After segmentation prediction, a series of post-processing steps, including morphological refinement, watershed separation, and graph-based adjustment, were performed to improve the quality of the final colony count, followed by evaluation of several metrics. For the quantitative assessments, the Dice score, IoU, and MAE were calculated for the test data.
To promote fairness and reproducibility in our evaluation, each independent experimental run required that the associated model be completely retrained from scratch, rather than leveraging previously trained model weights. Therefore, for each run, the proposed framework and all baseline models were retrained under the same training, augmentation, and optimization conditions, using the Kaggle Microbial Colony Recognition Dataset, and subsequently tested on the independent Figshare Circular Bacteria Colony Dataset. For each experimental run and benchmark test, weights were neither shared nor reused. Independent training and testing across three complete cycles were performed to report results with improved statistical confidence, and the results included the mean and standard deviation.
The framework incurs a higher training cost than standard encoder–decoder frameworks because of the integration of hybrid attention modules, transformer bottlenecks, and swarm intelligence optimization. Specifically, swarm intelligence-based optimization adds iterative parameter searches, further complicating and increasing training costs. However, this additional computational cost primarily occurs during the offline training stage. In contrast, the framework is computationally feasible for both practical laboratory applications in colony counting and for inference. The training approach in the framework is centered on strengthening segmentation robustness and enhancing colony separation quality, while also improving generalization across diverse microbiological imaging scenarios.

4.3. Baseline Methods

To evaluate the effectiveness of the proposed swarm-optimized microbial colony counting framework, we compared it with several state-of-the-art deep learning architectures widely used in biomedical image segmentation. The selected baselines were based on their extensive literature prevalence, their flexibility in modeling microbial colonies, and included U-Net [32], U-Net++ [33], Attention U-Net [34], and Swin-Unet [35]. Due to its encoder–decoder architecture and Skip connections, U-Net remains an important U-Net benchmark for combining semantics with spatial information, and U-Net++ builds upon this with nested Skip pathways and dense connections that narrow the semantic gap and improve boundary definition. Attention U-Net employs U-Net-based attention mechanisms to target colony-relevant areas while ignoring extraneous background features, thereby addressing the problem of varying illumination, a significant issue in imaging colonies. Swin-Unet incorporates hierarchical Swin Transformers with window-based self-attention, thereby capturing, alongside the desired architecture, local and global context, making it suitable for the wide variety of spatial arrangements of colonies. All baseline models were uniformly trained on the Kaggle Microbial Colony Recognition dataset with the same parameters, post-processing, data sample size restrictions ( 256 × 256 ), and data augmentation (including contrast stretching, flips, and brightness), and they were evaluated on the Figshare Circular Bacteria Colony dataset. Moreover, normalized training used the Adam optimizer with a learning rate of 1 × 10 4 and early stopping. Testing used the Dice coefficient, Intersection over Union (IoU), and mean absolute error (MAE) for colony counting. All proposed methods in Table 1 bested all raw U-Net baselines in segmentation, counting, and the other tasks.

4.4. Quantitative Results

Table 2 summarizes the segmentation results of the proposed framework and the established baselines. Among the benchmark models, Swin-Unet, with a 91.4% Dice score and 84.7% IoU, outperformed U-Net and its enhanced versions, namely U-Net++ and Attention U-Net. While U-Net++ exhibited better boundary preservation than the original U-Net and the Attention U-Net reduced background interference, U-Net++ and Attention U-Net still struggled with highly overlapping colonies, leading to higher MAE. The proposed method performed better across all metrics, achieving a Dice score of 94.2% and an IoU of 88.6%, with improvements of almost 3% and 4% in Dice and IoU, respectively, compared to the closest baseline. Further, the counting error, represented by MAE, improved from 3.9 colonies with Swin-Unet to 2.7 colonies, a 30% improvement.
In Table 2, our framework demonstrates a significant advancement over the baseline in segmentation and counting tasks. Compared to Swin-Unet, the improvement in the Dice score was 3%, and in the IoU, 4%. Also, compared to the best baseline model, the counting error, measured by MAE, improved by 30%. The use of hybrid attention modules, transformer global context modeling, and swarm-based parameter optimization demonstrates complementary effects, as illustrated by the results. To further validate the enhancements, a statistical comparison was performed, and the results are presented in Table 3. A paired t-test was performed for each baseline and for each measurement. All p-values were lower than 0.01, thus validating the statistical significance of the enhancements.
To evaluate the statistical significance of the performance improvements, each baseline model was compared with the proposed method in repeated experiments using a paired t-test. The paired method was preferred because a direct metric comparison between the proposed method and the baseline models was possible, as both methods were subjected to the same training, augmentation, and testing procedures, using the same datasets and evaluation protocol. For segmentation, the statistical tests were conducted on the repeated experiments’ and validation’s Dice and IoU scores. For colony-count analysis, the tests were conducted on the MAE score. The experiments were conducted independently three times, and the resulting score distributions were analyzed for significance. The significance criterion (p < 0.01) was selected. Improvements below this threshold were assumed to reflect random experimental variance and were not statistically significant.
The current framework’s computational burden combines hybrid attention–transformer segmentation, swarm intelligence optimization, uncertainty estimation, and graph refinement within cross-dataset evaluation. While exhaustive stochastic analysis benefits from large independent runs, it would result in high costs. Traditional segmentation frameworks allow independent runs due to fully implemented, time-efficient backward passes; however, each independent run in this research required retraining the framework and a full cycle of the iterative PSO, QPSO, and DE-PSO optimizations. As a practical compromise between time and statistical verifiability, three independent training and evaluation cycles were utilized.
It is noteworthy that the limited number of runs demonstrates consistently low standard deviations across Dice, IoU, and MAE metrics. This indicates stable convergence and reliably repeatable performance. Conducted independently, and on different evaluation samples, paired statistical significance tests were performed to assess if the improvements over the baselines were due to improvements in methods and not random fluctuations due to the initialization. The upcoming larger-scale studies are expected to enable an extensive, repeated-run analysis of stochastic processes over longer time horizons.
The mean absolute error of 2.7 colonies indicates that this framework can be used for sufficiently reliable colony quantification even under difficult imaging conditions, including highly overlapping colonies, oddly shaped colonies, and inconsistent lighting. Typical microbiology workflows often reveal discrepancies in colony counts after manual inspection, due to ambiguous colony boundaries and clustered growth. Given the challenges posed by the datasets, this error rate is low and demonstrates that this framework can yield automated, consistent colony counts. This solution also minimizes the time and effort required to manually count colonies while removing the subjective interpretation boundaries inherent to manual counting.

4.5. Qualitative Results

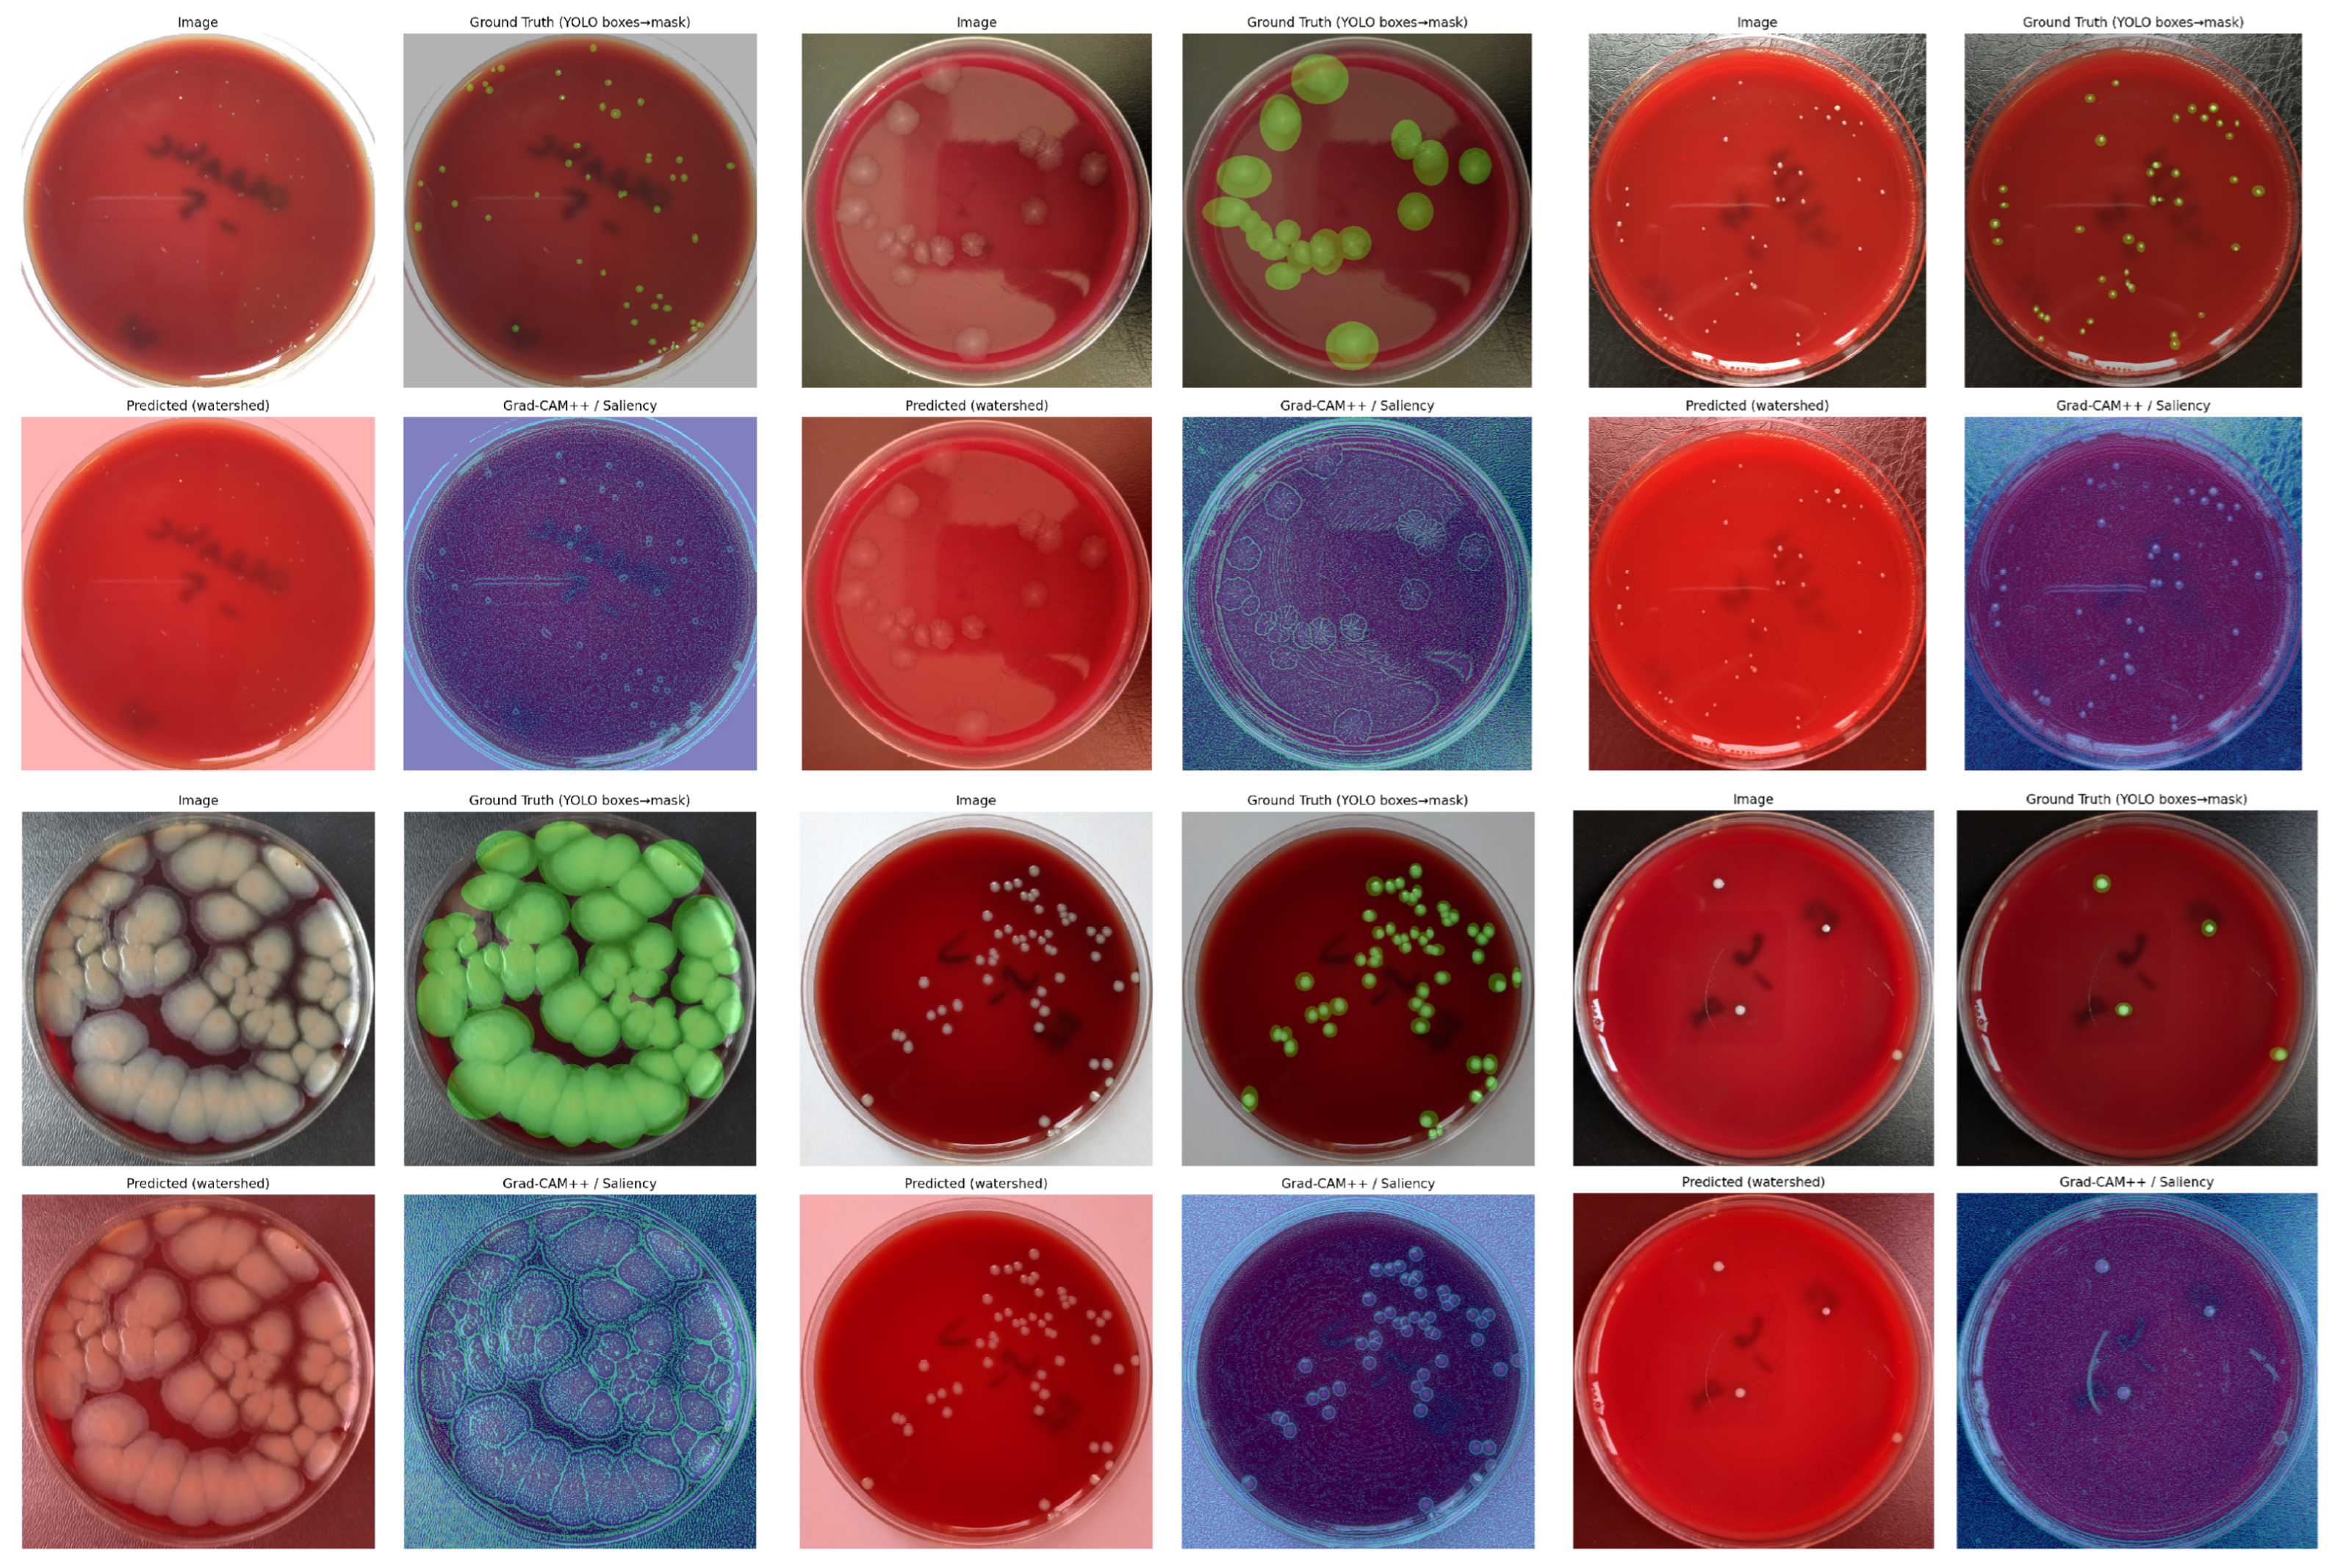
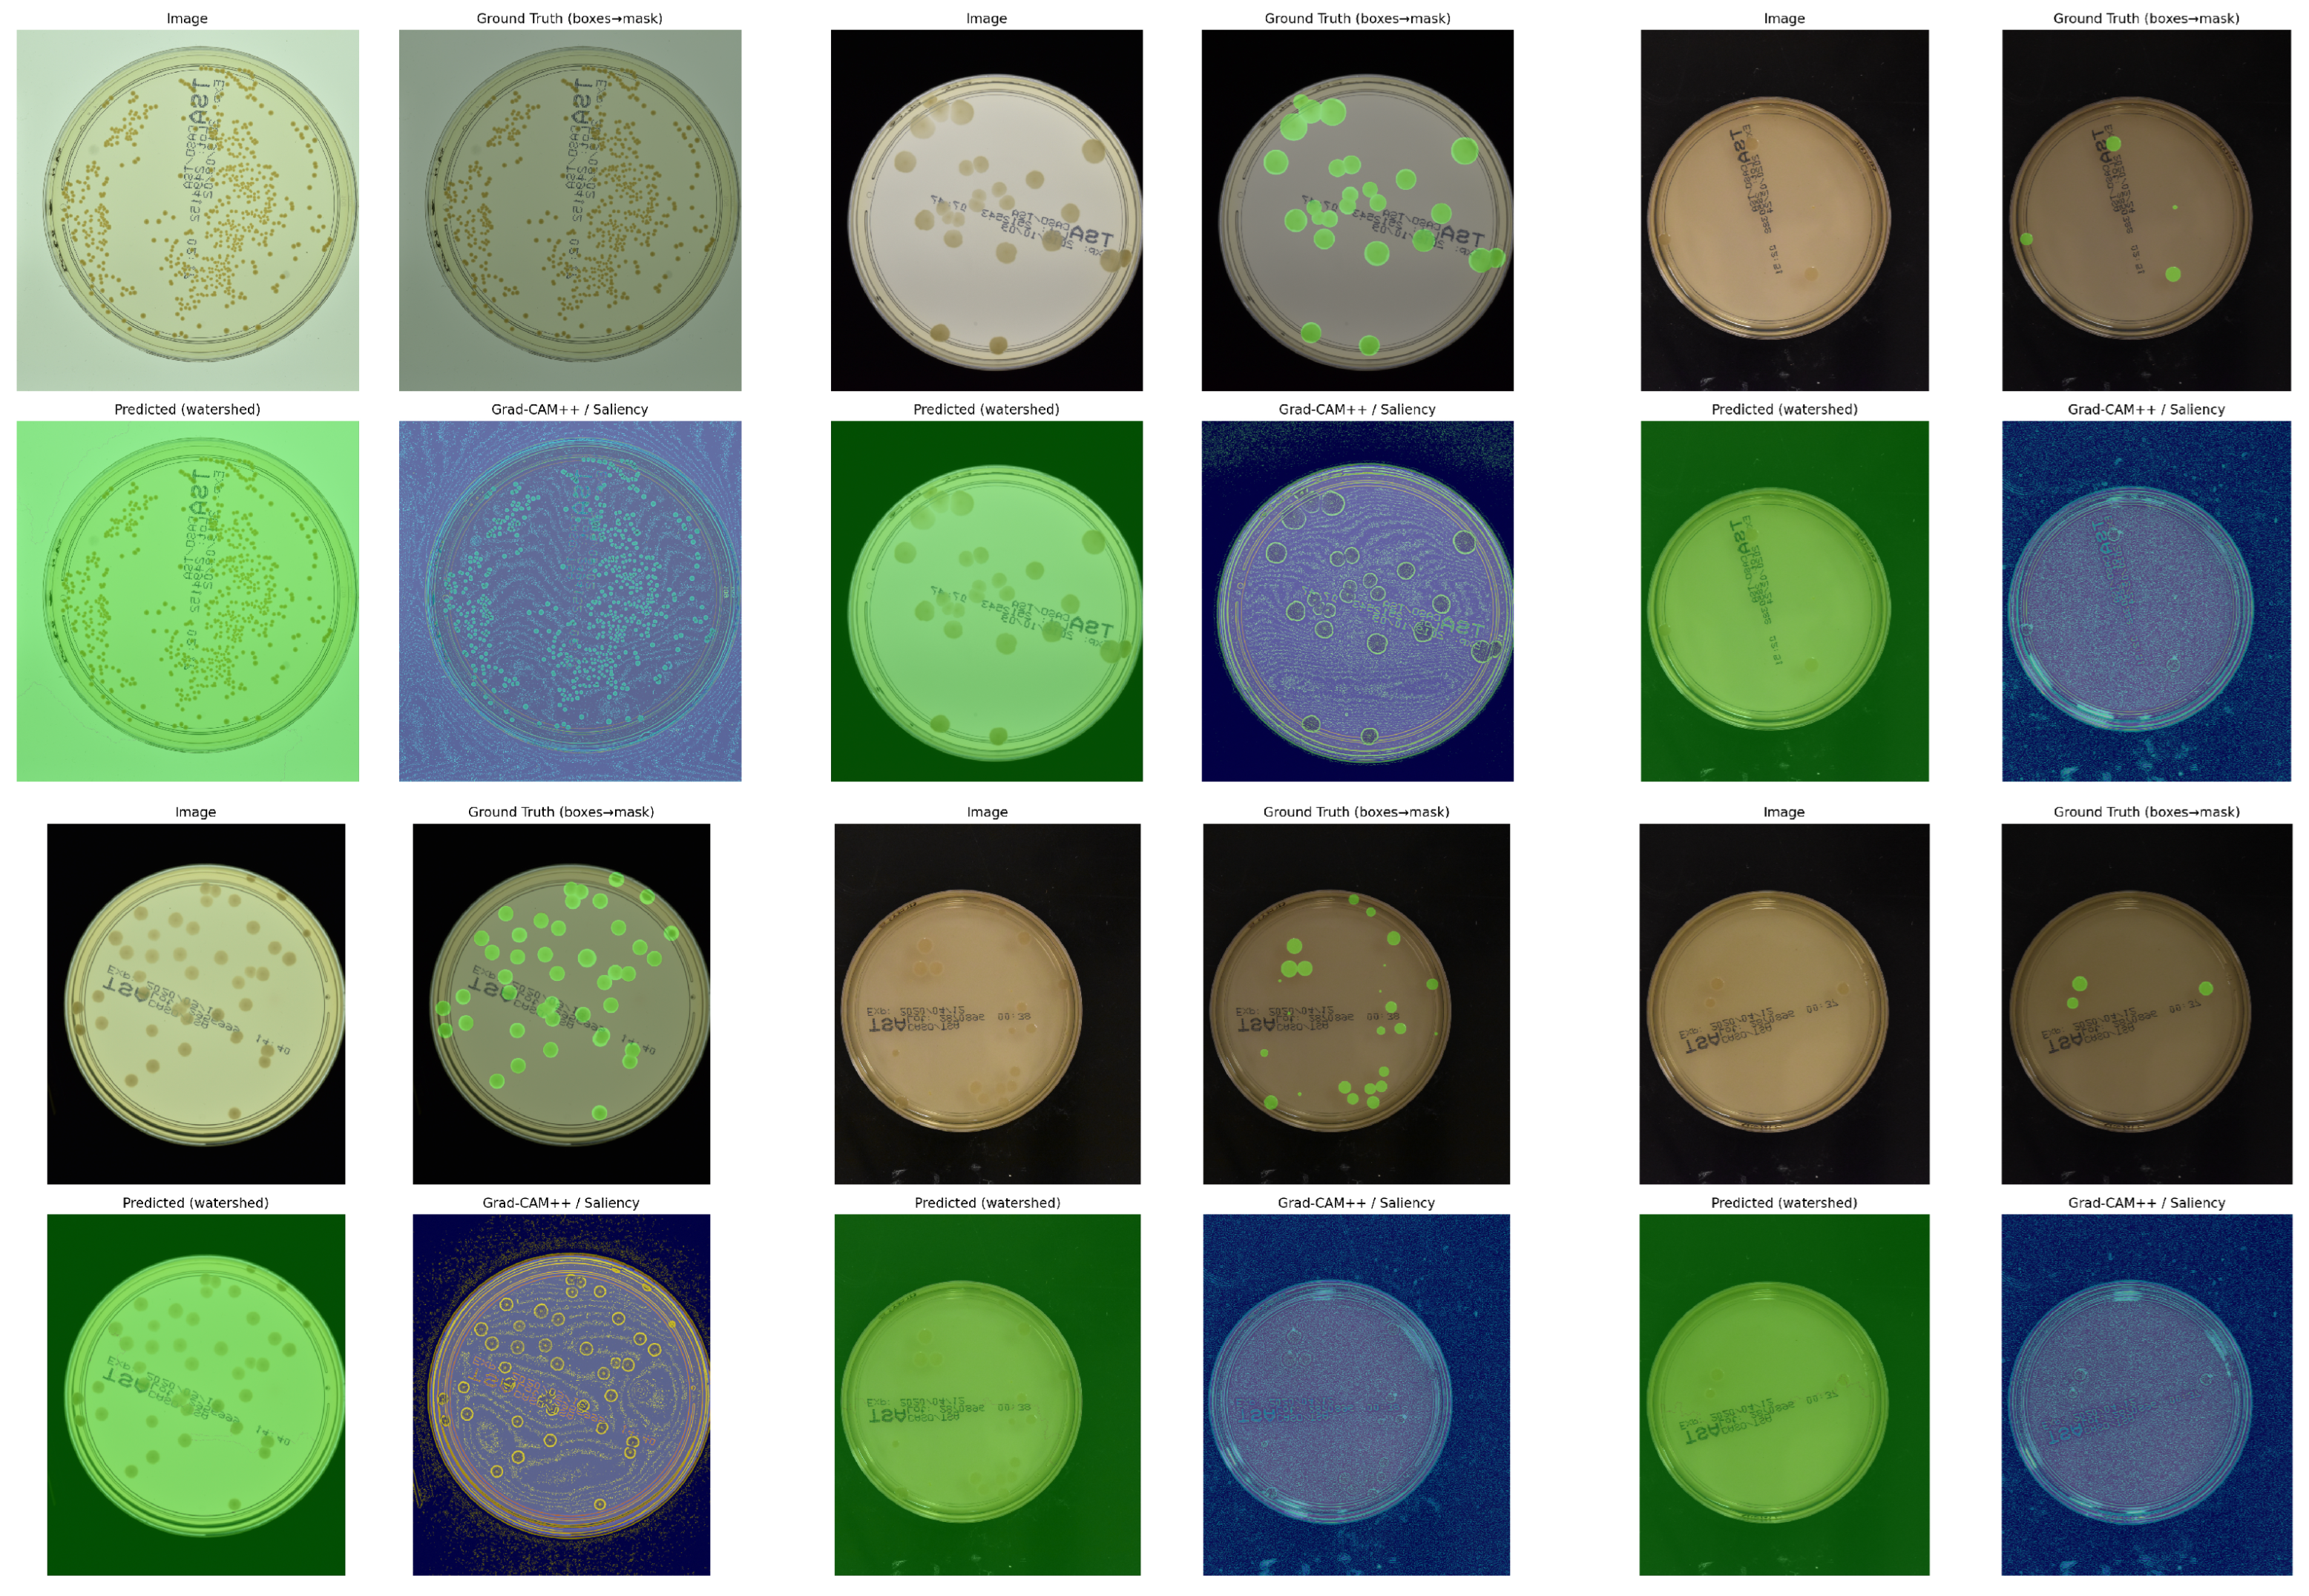
To further demonstrate the proposed framework’s capabilities, qualitative examples from the Bacterial Colony Detection Dataset and the Microbial Colony Recognition Dataset are provided. Example outputs are given in Figure 8 and Figure 9. In addition to the original images and ground-truth masks generated from bounding-box annotations, we provide segmented masks from optimized watershed post-processing, Grad-CAM++, and saliency overlay interpretability masks.
In Figure 8, the Bacterial Colony Detection Dataset, which contains samples with severe background clutter containing multiple colonies that overlap at different scales, shows the proposed framework’s ability to segment colonies using a refined watershed approach to post-process segmentation with a level of interpretability that is relevant to a laboratory setting and consistently separates touching colonies. This is further supported by Grad-CAM++ heatmaps, which confirm that the network focuses on regions of interest within the colonies.
The same can be said for results on the Microbial Colony Recognition Dataset (Figure 9). The framework seems quite robust to variations in colony density and plate illumination conditions. The predicted masks closely match the ground truth. The attention-based backbone, combined with swarm-based optimization, enables the model to generalize well to even low-contrast and faintly bordered colonies. The explainability maps show that the model is focusing on the center and edges of the colonies, which aligns with the experts’ intuition, thereby increasing confidence in fully automated predictions.

4.6. Ablation Studies

To analyze the effect of each component within the proposed framework, additional ablation tests were conducted by allowing each module to run in turn, while keeping the training and testing procedures the same. This analysis specifically aims to evaluate the effects of the following: preprocessing enhancement, attention-based feature refinement, transformer-based global context modeling, swarm-based optimization, and post-processing refinement. The effects of each were evaluated using the Dice score, Intersection over Union (IoU), and mean absolute error (MAE), which were used to quantify segmentation and counting performance and to evaluate the effect of each component on colony-counting performance.

4.6.1. Impact of Segmentation Backbone

The first ablation compares the baseline SegNet against the proposed hybrid attention–transformer backbone (HAT-Backbone). As shown in Table 4, the hybrid architecture yields significant gains in Dice and IoU, demonstrating the importance of attention refinement and transformer-based global context modeling.
Table 5 presents the results of the ablation analysis, where it is evident that all the proposed elements of the framework positively impact the overall framework performance. The first step of the framework (preprocessing) introduced robustness against illumination changes and background noise, and helped accommodate low-contrast colonies. This also benefited the initial segmentation step. After that, attention modules were added, as they helped focus on colonies and suppress background noise, further strengthening discriminative learning. The addition of transformer bottleneck blocks also helped, as they were effective at modeling long-range dependencies and especially at addressing the challenge of separating overlapping, densely distributed colonies. The addition of swarm-based optimization (PSO, QPSO, and DE–PSO) improved convergence and optimization, resulting in better generalization across datasets. Lastly, the addition of post-processing, including watershed and graph-based refinement, greatly reduced counting errors caused by touching colonies and improved segmentation quality.

4.6.2. Effect of Swarm-Based Optimization

The results of our optimization strategy ablation studies are shown in Table 6. The baseline model, which excludes swarm-based optimization, reports a Dice score of 90.4%, an IoU of 83.1%, and an MAE of 4.8 colonies. These results show the challenges that traditional gradient-based training methods face when dealing with dense/or overlapping colonies. The results show improvements across all three metrics when a traditional Particle Swarm Optimizer (PSO) is employed. The Dice score moves to 92.1%, the IoU score moves to 85.4%, and the MAE reduces to 3.6. This shows the strength of a swarm search method in optimizing model hyperparameters and model weights. The MAE score improves to 3.2, and the Dice and IoU scores improve to 93.0% and 86.5%, respectively, when a Quantum-behaved PSO (QPSO) is used, illustrating the trade-off benefit of a swarm-based optimization approach. Using our Differential Evolution–PSO (DE-PSO) variant, the best scores were achieved with a Dice score of 94.2%, an IoU score of 88.6%, and an MAE of 2.7 colonies. The results presented in this table demonstrate significant improvements in swarm-based optimization for segmentation and reliable colony counting, with DE-PSO clearly dominating the other methods.

4.6.3. Role of Post-Processing

Table 7 shows segmentation and counting performance for various post-processing implementations. When post-processing modules are disabled, our model achieves Dice scores and IoUs of 92.8% and 85.9%, respectively, with an MAE of 4.5 colonies. These numbers indicate relatively high segmentation performance, but the MAE suggests potential difficulty in counting densely clustered colonies. Further, the combination of morphological post-processing, watershed separation, and Graph Attention-based refinement (GAT) leads to an improved performance. A Dice score of 94.2%, an IoU of 88.6%, and an improved MAE of 2.7 colonies show the significant impact post-processing has on improving segmentation of boundaries, separation of touching colonies, and decreasing false collisions of colonies in dense clusters. The combination of Morphology, Watershed, and GAT post-processing ensures accurate segmentation maps and robust colony counting in complex microbial images.

4.6.4. Effect of Explainability and Calibration

Table 8 evaluates the impact of the explainability and calibration modules in the proposed framework. As anticipated, the addition of these modules does not affect raw segmentation and counting results, as Dice, IoU, and MAE remain unchanged compared to the configuration that excludes them. This is expected and intentional for these components. Explainability methods like Grad-CAM++ and Integrated Gradients do not improve pixel-level accuracy. Instead, these methods create visual attributions by marking regions of a visual field that primarily drive a given prediction. This increases explainability for the end-user. The explainability component is achieved through temperature scaling as the calibration module. As a result, confidence scores are more appropriately and accurately calibrated, with less overconfidence in erroneous or doubtful classifications. Though there is no change in Dice or IoU, these changes are necessary and important for building confidence in the framework. They allow domain experts to justify their decisions and to use calibrated confidence scores in a real laboratory setting. Explainability and calibration do not impede the quantitative performance of the framework, and significantly increase its trustworthiness and interpretability.

4.6.5. Cross-Dataset Validation

To assess the generalization capacity of the proposed framework beyond the original dataset, we employed cross-dataset evaluation and trained the model on the Kaggle Microbial Colony Recognition dataset, using the Circular Bacteria Colony dataset available on Figshare as the test set. This scenario is more difficult because the training and test datasets are obtained under different experimental settings, colony morphologies, and imaging protocols. The results in Table 9 show that the proposed method achieves a Dice score of 91.7%, an IoU of 84.2%, and a mean absolute error (MAE) of 3.4 colonies, demonstrating that it achieves excellent performance on different datasets. In comparison, U-Net and Swin-Unet, as baseline approaches, show a significant performance drop in a cross-domain scenario, with a 5–7% drop in the Dice score. The integration of a hybrid attention–transformer backbone, swarm-based optimization, and newly proposed post-processing techniques yields a flexible and robust framework with built-in protections against a wide range of data distributions. This flexibility shows that the model is not overfit to a particular dataset and can generalize to several laboratory-based, real-world use cases, in which a range of imaging techniques will almost certainly be employed.

4.7. Discussion

Examining the experimental results allows us to identify the advantages, disadvantages, and overarching impact of the proposed framework. The main advantage of the framework is its ability to maintain a high degree of accuracy when placing boundaries in problematic edge cases, such as those with varying illumination conditions and multiple, potentially overlapping colonies. Due to its hybrid attention–transformer backbone and swarm-based optimization, this framework is, by design, more resilient across various datasets. The robustness of the framework is improved with explainability modules such as Grad-CAM++ and Integrated Gradients, and the combination of uncertainty quantification and calibration methodologies provides greater interpretability and transparency, thereby increasing the likelihood of adoption in the lab. This framework also has disadvantages that must be considered. The opacity of the framework as a case example means that pixel-level annotations are required for every training iteration, thereby limiting scalability to fields with abundant, low-cost data-collection resources. The computational burden imposed by transformers means this framework cannot be implemented in low-resource settings without a GPU.
The explainability and uncertainty modules allow lab staff to see the model’s focus and confidence levels, reducing reliance on automation. This supports the human-in-the-loop model and increases confidence in it across clinical and research settings. Future work on this can develop multimodal imaging frameworks to capture colony growth using combined techniques, such as hyperspectral and time-lapse imaging. This can be merged with active learning, reducing reliance on fully manually annotated data. This combo can also speed up the creation of training datasets. This framework can also be adapted to support colony-counting model work on small mobile devices. This would enable even more rapid, real-time colony counting in remote locations with limited resources.


5. Conclusions

This study analyzes a swarm-optimized deep learning framework that automates segmentation, counting, and interpretation of microbial colonies. The framework provides a hybrid backbone that combines convolutional feature extraction and nested skip connections, and integrates hybrid channel and spatial attention with a transformer context. The swarm intelligence algorithms PSO, QPSO, and DE-PSO were used to optimize the network parameters, resulting in improved generalization and convergence. Post-processing improvements, such as morphological operations, watershed segmentation, and graph-based attention, were used to enhance the separation of clustered colonies and to refine boundaries. For real-world applications, explainability modules (Grad-CAM++ and Integrated Gradients) were combined with calibration techniques to yield interpretable results and explanations with confidence levels appropriate for laboratory use. This framework was extensively tested using two publicly available datasets: the Microbial Colony Recognition Dataset and the Bacterial Colony Detection Dataset. It showed significant gains over classical CNN architectures and baselines, as well as over transformer-based frameworks. Ablation studies offered evidence for the separate roles of optimization, attention, and post-processing. Qualitative studies showed that the framework provided biologically relevant segmentation with explainable results, even in difficult cases of colony overlap and faint colony boundaries in a noisy background. This framework provides ease of reliability and a significant reduction in manual labor, while preserving interpretability and robustness. Future efforts will focus on scaling this work to multimodal imaging solutions and on incorporating semi-supervised and active learning to address annotation costs. There will also be portable, scalable efforts to deploy this work to mobile or edge platforms for point-of-care diagnostics.

Author Contributions

Conceptualization, N.S. and M.I.E.-K.G.; methodology, N.S. and M.I.E.-K.G.; software, N.S. and M.I.E.-K.G.; validation, N.S. and M.I.E.-K.G.; formal analysis, N.S. and M.I.E.-K.G.; investigation, N.S. and M.I.E.-K.G.; resources, N.S. and M.I.E.-K.G.; data curation, N.S. and M.I.E.-K.G.; writing—original draft preparation, N.S.; writing—review and editing, N.S. and M.I.E.-K.G.; visualization, N.S. and M.I.E.-K.G.; funding acquisition, N.S. All authors have read and agreed to the published version of the manuscript.

Funding

This work was supported by the Deanship of Scientific Research, Vice Presidency for Graduate Studies and Scientific Research, King Faisal University, Saudi Arabia (Project No. KFU262661).

Data Availability Statement

The data supporting the conclusions of this article will be made available by the authors on request.

Conflicts of Interest

The authors declare no conflicts of interest.

Abbreviations

The following abbreviations are used in this manuscript:
CFUsColony-Forming Units
CNNsConvolutional Neural Networks
GANsGenerative Adversarial Networks
GATGraph Attention Network
SAMSegment Anything Model
Grad-CAMGradient-weighted Class Activation Mapping
NLMNon-Local Means
PSOParticle Swarm Optimization
QPSOQuantum-behaved PSO
DE–PSODifferential Evolution–PSO
MCMonte Carlo
IoUIntersection over Union
MAEMean Absolute Error

References

  1. Ferrari, A.; Lombardi, S.; Signoroni, A. Bacterial colony counting with convolutional neural networks in digital microbiology imaging. Pattern Recognit. 2017, 61, 629–640. [Google Scholar] [CrossRef]
  2. Falk, T.; Mai, D.; Bensch, R.; Çiçek, Ö.; Abdulkadir, A.; Marrakchi, Y.; Böhm, A.; Deubner, J.; Jäckel, Z.; Seiwald, K.; et al. U-Net: Deep learning for cell counting, detection, and morphometry. Nat. Methods 2019, 16, 67–70. [Google Scholar] [CrossRef] [PubMed]
  3. Vaswani, A.; Shazeer, N.; Parmar, N.; Uszkoreit, J.; Jones, L.; Gomez, A.N.; Kaiser, Ł.; Polosukhin, I. Attention is all you need. In Proceedings of the Advances in Neural Information Processing Systems 30, Long Beach, CA, USA, 4–9 December 2017. [Google Scholar]
  4. Dosovitskiy, A.; Beyer, L.; Kolesnikov, A.; Weissenborn, D.; Zhai, X.; Unterthiner, T.; Dehghani, M.; Minderer, M.; Heigold, G.; Gelly, S.; et al. An image is worth 16 × 16 words: Transformers for image recognition at scale. arXiv 2020, arXiv:2010.11929. [Google Scholar]
  5. Tehsin, S.; Nasir, I.M.; Damaševičius, R. Explainability of Disease Classification from Medical Images Using XGrad-Cam. In Proceedings of the International Conference on Advanced Research in Technologies, Information, Innovation and Sustainability; Springer: Cham, Switzerland, 2024; pp. 221–236. [Google Scholar]
  6. Tehsin, S.; Nasir, I.M.; Damaševičius, R. Interpreting CNN for Brain Tumor Classification Using XGrad-Cam. In Proceedings of the International Conference on Advanced Research in Technologies, Information, Innovation and Sustainability; Springer: Cham, Switzerland, 2024; pp. 282–296. [Google Scholar]
  7. Yousafzai, S.N.; Shahbaz, H.; Ali, A.; Qamar, A.; Damaševičius, R. X-News dataset for online news categorization. Int. J. Intell. Comput. Cybern. 2024, 17, 737–758. [Google Scholar] [CrossRef]
  8. Yousafzai, S.N.; Malik, D.S.; Keshta, I.; Fitriyani, N.L.; Gu, Y.; Syafrudin, M. Multi-Stage Neural Network-based Ensemble Learning Approach for Wheat Leaf Disease Classification. IEEE Access 2025, 13, 30101–30116. [Google Scholar] [CrossRef]
  9. Thaljaoui, A.; Yousafzai, S.N.; Nasir, I.M.; Saidani, O.; Fadhal, E.; Saidani, T. Explainable skin cancer diagnosis with parallel attention mechanism for segmentation and classification. Biomed. Signal Process. Control 2026, 113, 109159. [Google Scholar] [CrossRef]
  10. Nasir, I.M.; Alshaya, H.; Tehsin, S.; Bouchelligua, W. Transformer-Driven Explainable Deep Learning with Quantitative Attribution Validation for Liver Tumor Detection. Bioengineering 2026, 13, 616. [Google Scholar] [CrossRef]
  11. Nasir, I.M.; Tehsin, S.; Damaševičius, R.; Zielonka, A.; Woźniak, M. Explainable cubic attention-based autoencoder for skin cancer classification. In Proceedings of the International Conference on Artificial Intelligence and Soft Computing; Springer: Cham, Switzerland, 2024; pp. 124–134. [Google Scholar]
  12. Tehsin, S.; Nasir, I.M.; Damaševičius, R. Explainable brain tumor segmentation via attention-guided hybrid CNN–Transformer–Mamba network. Knowl.-Based Syst. 2026, 343, 116000. [Google Scholar] [CrossRef]
  13. Nasir, I.M.; Alshaya, H.; Tehsin, S.; Bouchelligua, W. Adaptive Vision–Language Transformer for Multimodal CNS Tumor Diagnosis. Biomedicines 2025, 13, 2864. [Google Scholar] [CrossRef] [PubMed]
  14. Waqar, A. Intelligent decision support systems in construction engineering: An artificial intelligence and machine learning approaches. Expert Syst. Appl. 2024, 249, 123503. [Google Scholar] [CrossRef]
  15. Waqar, A.; Othman, I.; Shafiq, N.; Mansoor, M.S. Applications of AI in oil and gas projects towards sustainable development: A systematic literature review. Artif. Intell. Rev. 2023, 56, 12771–12798. [Google Scholar] [CrossRef] [PubMed]
  16. Ronneberger, O.; Fischer, P.; Brox, T. U-net: Convolutional networks for biomedical image segmentation. In Proceedings of the International Conference on Medical Image Computing and Computer-Assisted Intervention; Springer: Cham, Switzerland, 2015; pp. 234–241. [Google Scholar]
  17. Su, H.; Liu, F.; Xie, Y.; Xing, F.; Meyyappan, S.; Yang, L. Region segmentation in histopathological breast cancer images using deep convolutional neural network. In Proceedings of the 2015 IEEE 12th International Symposium on Biomedical Imaging (ISBI); IEEE: New York, NY, USA, 2015; pp. 55–58. [Google Scholar]
  18. Arevalo, J.; González, F.A.; Ramos-Pollán, R.; Oliveira, J.L.; Lopez, M.A.G. Convolutional neural networks for mammography mass lesion classification. In Proceedings of the 2015 37th Annual International Conference of the IEEE Engineering in Medicine and Biology Society (EMBC); IEEE: New York, NY, USA, 2015; pp. 797–800. [Google Scholar]
  19. Roth, H.R.; Yao, J.; Lu, L.; Stieger, J.; Burns, J.E.; Summers, R.M. Detection of sclerotic spine metastases via random aggregation of deep convolutional neural network classifications. In Recent Advances in Computational Methods and Clinical Applications for Spine Imaging; Springer: Cham, Switzerland, 2015; pp. 3–12. [Google Scholar]
  20. Li, M.; Xu, X.; Lu, Y. An efficient network for bacterial colony counting based on tail-MLP. In Proceedings of the International Conference on Image, Signal Processing, and Pattern Recognition (ISPP 2024), SPIE, Guangzhou, China, 1–3 March 2024; Volume 13180, pp. 1382–1388. [Google Scholar]
  21. Zhou, Z.; Sodha, V.; Rahman Siddiquee, M.M.; Feng, R.; Tajbakhsh, N.; Gotway, M.B.; Liang, J. Models genesis: Generic autodidactic models for 3d medical image analysis. In Proceedings of the International Conference on Medical Image Computing and Computer-Assisted Intervention; Springer: Cham, Switzerland, 2019; pp. 384–393. [Google Scholar]
  22. Azizi, S.; Mustafa, B.; Ryan, F.; Beaver, Z.; Freyberg, J.; Deaton, J.; Loh, A.; Karthikesalingam, A.; Kornblith, S.; Chen, T.; et al. Big self-supervised models advance medical image classification. In Proceedings of the IEEE/CVF International Conference on Computer Vision; IEEE: New York, NY, USA, 2021; pp. 3478–3488. [Google Scholar]
  23. Roy, A.G.; Siddiqui, S.; Pölsterl, S.; Navab, N.; Wachinger, C. ‘Squeeze & excite’guided few-shot segmentation of volumetric images. Med. Image Anal. 2020, 59, 101587. [Google Scholar]
  24. Ouyang, C.; Biffi, C.; Chen, C.; Kart, T.; Qiu, H.; Rueckert, D. Self-supervision with superpixels: Training few-shot medical image segmentation without annotation. In Proceedings of the European Conference on Computer Vision; Springer: Cham, Switzerland, 2020; pp. 762–780. [Google Scholar]
  25. Memon, F.; Naz, B.; Narejo, S.; Panhwar, K. An Artificial Intelligence Vision Transformer Model for Classification of Bacterial Colony. Int. J. Innov. Sci. Technol. 2024, 6, 237–248. [Google Scholar] [CrossRef]
  26. MS, S.; Martis, J.E.; Krivic, S.; KB, S.; Nazareth, P. A swarm-optimized microbial colony counter. Expert Syst. 2024, 41, e13510. [Google Scholar]
  27. Ma, J.; Hu, J. An improved particle swarm optimization for multilevel thresholding medical image segmentation. PLoS ONE 2024, 19, e0306283. [Google Scholar] [CrossRef] [PubMed]
  28. Rather, S.A.; Kandwal, A.; Pandit, M.K.; Roy, P.P. Quantum-Behaved Particle Swarm Optimization for the Segmentation of Kidney Stone CT Images. In Proceedings of the ICASSP 2025-2025 IEEE International Conference on Acoustics, Speech and Signal Processing (ICASSP); IEEE: New York, NY, USA, 2025; pp. 1–5. [Google Scholar]
  29. Band, S.S.; Yarahmadi, A.; Hsu, C.C.; Biyari, M.; Sookhak, M.; Ameri, R.; Dehzangi, I.; Chronopoulos, A.T.; Liang, H.W. Application of explainable artificial intelligence in medical health: A systematic review of interpretability methods. Inform. Med. Unlocked 2023, 40, 101286. [Google Scholar] [CrossRef]
  30. Majchrowska, S.; Pawłowski, J.; Guła, G.; Bonus, T.; Hanas, A.; Loch, A.; Pawlak, A.; Roszkowiak, J.; Golan, T.; Drulis-Kawa, Z. AGAR a microbial colony dataset for deep learning detection. arXiv 2021, arXiv:2108.01234. [Google Scholar] [CrossRef]
  31. Makrai, L.; Fodróczy, B.; Nagy, S.Á.; Czeiszing, P.; Csabai, I.; Szita, G.; Solymosi, N. Annotated dataset for deep-learning-based bacterial colony detection. Sci. Data 2023, 10, 497. [Google Scholar] [CrossRef] [PubMed]
  32. Zunair, H.; Hamza, A.B. Sharp U-Net: Depthwise convolutional network for biomedical image segmentation. Comput. Biol. Med. 2021, 136, 104699. [Google Scholar] [CrossRef] [PubMed]
  33. Zhou, Z.; Rahman Siddiquee, M.M.; Tajbakhsh, N.; Liang, J. Unet++: A nested u-net architecture for medical image segmentation. In Proceedings of the International Workshop on Deep Learning in Medical Image Analysis; Springer: Cham, Switzerland, 2018; pp. 3–11. [Google Scholar]
  34. Oktay, O.; Schlemper, J.; Folgoc, L.L.; Lee, M.; Heinrich, M.; Misawa, K.; Mori, K.; McDonagh, S.; Hammerla, N.Y.; Kainz, B.; et al. Attention u-net: Learning where to look for the pancreas. arXiv 2018, arXiv:1804.03999. [Google Scholar] [CrossRef]
  35. Cao, H.; Wang, Y.; Chen, J.; Jiang, D.; Zhang, X.; Tian, Q.; Wang, M. Swin-unet: Unet-like pure transformer for medical image segmentation. In Proceedings of the European Conference on Computer Vision; Springer: Cham, Switzerland, 2022; pp. 205–218. [Google Scholar]
Figure 1. An end-to-end framework for swarm-optimized microbial colony counting integrates preprocessing, segmentation backbone, optimization, post-processing, and explainability and robustness tailored to laboratory UI outputs.
Mathematics 14 02104 g001
Figure 2. A preprocessing pipeline for microbial colony images showing hybrid denoising (NLM + CLAHE), illumination normalization, domain-aware augmentation, and edge-preserving smoothing.
Mathematics 14 02104 g002
Figure 3. Advanced segmentation backbone with encoder–decoder architecture, nested skip connections, attention modules (CAM + SAM), and Swin Transformer bottleneck for microbial colony segmentation.
Mathematics 14 02104 g003
Figure 4. Optimization Stage with PSO, QPSO, and DE-PSO Hybrid with Composite Dice + Boundary Loss.
Mathematics 14 02104 g004
Figure 5. Post-processing and colony counting pipeline that uses morphological refinement, watershed separation, graph-based refinement, and connected components analysis to produce final colony counts.
Mathematics 14 02104 g005
Figure 6. This phase focuses on the following methods and techniques: explainability via Grad-CAM++ and Integrated Gradients, uncertainty quantification through Monte Carlo Dropout, temperature scaling for calibration, cross-dataset robustness evaluations, and integration of a laboratory user interface (UI).
Mathematics 14 02104 g006
Figure 7. Representative samples from the datasets utilized. The first two rows contain colonies from the Microbial Colony Recognition Dataset. They display varying densities and different lighting conditions on the plates. The last two rows display examples from the Bacterial Colony Detection Dataset. They demonstrate various patterns of bacterial growth, varying colors, and overlapping colonies. The combination of datasets provides an excellent point of reference for polygonal segmentation and colony counting.
Mathematics 14 02104 g007
Figure 8. Qualitative results on the Bacterial Colony Detection Dataset. Each row contains the image in the input column, the ground truth generated from YOLO annotations, the segmentation prediction with watershed refinement, and the Grad-CAM++ with saliency overlays. The results confirm that the model is focused on the correct regions.
Mathematics 14 02104 g008
Figure 9. Qualitative results on the Microbial Colony Recognition Dataset. The framework displays strong segmentation capabilities regardless of variations in density or lighting. The model emphasizes regions of the colony with biological significance, which is supported by explainability maps.
Mathematics 14 02104 g009
Table 1. Baseline performance on Kaggle (train) → Figshare (test). Metrics include Dice, IoU for segmentation, and MAE for colony counting.
MethodDice (%)IoU (%)MAE (Count)
U-Net [32]86.779.55.4
U-Net++ [33]88.981.34.9
Attention U-Net [34]90.183.04.2
Swin-Unet [35]91.484.73.9
Proposed Method94.288.62.7
Table 2. Comparison of segmentation performance with baseline models. Values are reported as mean ± standard deviation across three independent runs. The best results are highlighted in bold.
ModelDice (%)IoU (%)MAE (colonies)
U-Net [32]88.1 ± 0.681.2 ± 0.85.6 ± 0.3
U-Net++ [33]89.7 ± 0.582.9 ± 0.74.8 ± 0.2
Attention U-Net [34]90.6 ± 0.483.8 ± 0.64.3 ± 0.2
Swin-Unet [35]91.4 ± 0.584.7 ± 0.63.9 ± 0.2
Proposed Method94.2 ± 0.388.6 ± 0.42.7 ± 0.1
Table 3. Statistical significance of improvements using paired t-tests (p-values). All values < 0.01 indicate significant improvements of the proposed method over baselines.
Baseline vs. ProposedDiceIoUMAE
U-Net<0.001<0.001<0.001
U-Net++ 0.004 0.006 0.008
Attention U-Net 0.007 0.009 0.005
Swin-Unet 0.008 0.010 0.007
Table 4. Ablation on segmentation backbone. The hybrid attention–transformer backbone significantly outperforms the baseline SegNet.
MethodDice (%)IoU (%)MAE (Colonies)
Baseline SegNet86.779.46.3
HAT-Backbone (Proposed)93.887.92.9
Table 5. Incremental ablation analysis of major framework components.
ConfigurationDice (%)IoU (%)MAE (Colonies)
Baseline Encoder–Decoder86.779.46.3
+ Preprocessing88.581.05.4
+ Attention Modules90.683.84.3
+ Transformer Bottleneck92.185.93.7
+ Swarm Optimization93.187.03.2
+ Post-processing Refinement94.288.62.7
Table 6. Ablation on optimization strategies. Swarm-based optimization improves performance, with DE–PSO achieving the best trade-off.
MethodDice (%)IoU (%)MAE (Colonies)
Without Optimization90.483.14.8
+ PSO92.185.43.6
+ QPSO93.086.53.2
+ DE–PSO (Proposed)94.288.62.7
Table 7. Ablation on post-processing modules. The integration of morphology, watershed, and GAT reduces errors in clustered colonies.
MethodDice (%)IoU (%)MAE (Colonies)
Without Post-processing92.885.94.5
+ Morphology + Watershed + GAT94.288.62.7
Table 8. Ablation on explainability and calibration modules. These modules primarily enhance reliability and interpretability, rather than focusing on raw segmentation metrics.
MethodDice (%)IoU (%)MAE (Colonies)
Without Explainability + Calibration94.288.62.7
With Explainability + Calibration94.288.62.7
Table 9. Cross-dataset validation results. The proposed method maintains superior generalization compared to baselines when trained on Kaggle and tested on Figshare.
MethodDice (%)IoU (%)MAE (Colonies)
U-Net85.978.46.1
U-Net++87.280.15.5
Attention U-Net88.081.54.8
Swin-Unet89.482.64.2
Proposed Method91.784.23.4
Disclaimer/Publisher’s Note: The statements, opinions and data contained in all publications are solely those of the individual author(s) and contributor(s) and not of MDPI and/or the editor(s). MDPI and/or the editor(s) disclaim responsibility for any injury to people or property resulting from any ideas, methods, instructions or products referred to in the content.