Article

A Weighted Multi-Objective Intelligent Grey Target Decision Model for Optimal Natural Rubber Selection in Aircraft Tires

1
School of Business, Macau University of Science and Technology, Macao 999078, China
2
College of Economics and Management, Nanjing University of Aeronautics and Astronautics, Nanjing 211106, China
3
School of Intelligent Manufacturing, Huanghuai University, Zhumadian 463000, China
4
China Economics and Management Academy, Central University of Finance and Economics, Beijing 100081, China
*
Author to whom correspondence should be addressed.
Mathematics 2026, 14(10), 1588; https://doi.org/10.3390/math14101588
Submission received: 30 January 2026 / Revised: 25 March 2026 / Accepted: 30 March 2026 / Published: 8 May 2026
(This article belongs to the Special Issue Advanced Mathematical Models in Engineering Design Optimization)

Abstract

In response to the bottleneck issue of natural rubber selection in aircraft tire formulation design, this study proposes a data-driven screening methodology that integrates a simulated performance database with grey system theory. A multidimensional performance simulation database was constructed, encompassing representative NR brands from six major global producing regions: Malaysia, Indonesia, Thailand, Vietnam, Hainan (China), and Yunnan (China). This repository encompasses critical metrics, including raw rubber constitution, molecular characteristics, and the static/dynamic mechanical behaviors of vulcanizates. Utilizing this foundation, a novel material selection protocol was formulated, grounded in a multi-objective weighted intelligent grey target decision framework. The Analytic Hierarchy Process (AHP) was applied to ascertain differentiated performance criteria and assign corresponding weights, specifically tailored to the functional necessities of distinct aircraft tire sections. To substantiate the model’s efficacy, the primary tire of the ubiquitous Boeing 737-800 served as a validation case. The optimal Natural Rubber (NR) grade identified by the algorithm was cross-referenced with the empirical expertise and engineering practices of premier global tire manufacturers, thereby confirming the framework’s robustness and predictive accuracy. Consequently, this investigation establishes a comprehensive intelligent decision-making architecture, spanning data construction to engineering deployment, offering a quantitative and referential pathway for NR material screening in aviation applications.

1. Introduction

Aircraft tires, serving as the sole point of contact with the ground during takeoff, landing, and taxiing, are of paramount importance for flight safety and operational efficiency [1]. They operate under exceptionally severe conditions, requiring the ability to withstand instantaneous massive impact loads, intense frictional heat generation, and the complex stresses associated with high-speed rolling [2]. Consequently, the constituent materials are subjected to stringent demands for strength, heat resistance, abrasion resistance, and dynamic endurance [3].
Aircraft tire manufacturing typically utilizes natural rubber as the base material, incorporating various composite additives to enhance tire performance [4]. Nevertheless, the conventional selection of natural rubber for such applications has predominantly relied upon the accumulated experiential insights of engineers. Such a methodology lacks a rigorous scientific foundation and suffers from poor reproducibility. Furthermore, traditional material screening procedures typically operate under the presumption of material uniformity. This conventional perspective, which regards the aircraft tire as a homogeneous entity, neglects its intrinsic nature as a sophisticated multilayered composite architecture. In reality, the four primary functional zones—comprising the tread, shoulder, sidewall, and carcass, are subjected to markedly distinct regimes of mechanical and thermal loading throughout landing and takeoff cycles. Consequently, the performance requirements for the natural rubber [5] matrix material exhibit significant, and often contradictory, diversification. For instance, the tread, as the main contact area, demands compounds with exceptionally high abrasion resistance and tear strength [6]. The shoulder, acting as a locus for stress concentration, demands exceptional resilience against shear fatigue and fracture propagation. Conversely, the sidewall endures persistent high-deflection bending, rendering superior flex fatigue resistance vital for longevity. Finally, the carcass functions as the structural framework, requiring minimal dynamic heat generation to preserve the integrity of the cord-rubber adhesive interface [7]. Consequently, such intrinsic material non-uniformity renders the selection of natural rubber for aircraft tires a complex, constrained multi-objective optimization challenge.
Currently, the selection of natural rubber for manufacturing aircraft tires continues to depend predominantly on trial-and-error methods and experiential screening within the industry. A systematic decision-making framework capable of quantitatively reconciling the aforementioned differentiated requirements across various tire components is conspicuously absent. While significant advancements have been made by researchers in elucidating the structure–property correlations of natural rubber, examining aircraft tire operational environments, and implementing multi-criteria decision analysis techniques, substantial research gaps persist. Firstly, a standardized reference database aggregating the properties of natural rubber from key global producing areas is missing, hindering equitable and comparative assessment. Secondly, prior studies have not succeeded in deeply integrating material characteristics with the distinct functional demands of individual tire components, failing to establish an accurate linkage from “component service conditions” to “targeted material parameters”. Thirdly, there is a notable paucity of documented research that utilizes established industrial cases to retrospectively verify the efficacy of such screening models, which undermines the credibility and practical engineering value of the proposed methodologies.
In response to this, the current research seeks to address the drawbacks of conventional empirical screening by introducing a component-adaptive selection framework grounded in multi-objective intelligent grey target decision theory. The investigation will proceed in the following sequence. Initially, a multi-dimensional performance simulation database covering representative natural rubber brands from six major global producing areas will be established, forming the data foundation for the study. A weighted multi-objective intelligent grey target decision model will be presented as the central methodological advancement. Using the tread material of an aircraft tire as a modeling paradigm, the AHP will be utilized to harmonize subjective and objective information, thereby accomplishing a precise and quantifiable mapping from “performance specifications” to “material solutions”. To demonstrate the efficacy and robustness of the proposed approach, the main tire of the widely utilized Boeing 737-800 aircraft will be employed as a test case. The selection outcomes of the model will be evaluated against the established engineering practices of prominent international tire manufacturers. Ultimately, this work intends to furnish a scientific and systematic basis for natural rubber selection in aircraft tire production.

2. Literature Review

2.1. Structure Property Relationship of Natural Rubber

Natural rubber [5] is a biopolymer whose main chain is predominantly composed of cis-1,4-polyisoprene [8]. The ultimate performance of natural rubber exhibits marked heterogeneity, fundamentally rooted in its intricate microstructural architecture. Comprehensive investigations indicate that critical parameters, including molecular weight distribution, gel content, and non-rubber constituent profiles are synergistically governed by geographical provenance, climatic conditions, harvesting protocols, and processing technologies. These factors collectively determine the final material functionality and service life [9]. A thorough comprehension of the structure–property correlation establishes the foundational basis for the accurate selection of high-performance NR in aircraft tire applications. This insight is particularly crucial for addressing the distinct performance requirements of different tire components, thereby supporting the advanced design of specialized tire systems.
With respect to source-specific properties, the Standard Malaysian Rubber (SMR) series, particularly the chemically modified Constant Viscosity rubber [10], boasts a core advantage in effectively inhibiting aldehyde condensation reactions during storage, thereby maintaining Mooney viscosity within a narrow range of low values. This superior processing uniformity is paramount for products demanding exceptional manufacturing consistency, such as aircraft tires. It safeguards inter-batch uniformity in compound viscosity, thereby ensuring reliable performance for critical elements like treads and shoulder components [11].
In contrast, the cup lump processing employed in major production regions like Indonesia (STR) and Thailand (SIR) imparts a distinct polymer profile to the resulting rubber, characterized by elevated molecular weight, a broader molecular weight distribution, and a higher gel content [12]. Although this structural attribute can enhance the material’s uncured strength, an excessively elevated gel content may introduce stress concentrators. These can detrimentally affect the dynamic fatigue resistance of the cured rubber compound, a factor of paramount importance for sidewalls subjected to severe cyclic deformation [13].
Standard Chinese Rubber Whole Field Latex (SCR WF), sourced from regions like Hainan and Yunnan, is distinguished by its bright visual appearance and high purity profile. These attributes stem from rigorous control of fresh latex sources and advanced centrifugal purification techniques. Furthermore, recent progress in cultivation and processing technology has significantly enhanced its key mechanical properties. Consequently, fundamental metrics such as tensile strength and elongation at break for Chinese SCR WF have now reached a level comparable to international benchmarks [14]. However, in terms of the regularity of molecular chain structure, controllability of gel structure, and the resulting long-term thermal aging resistance and dynamic fatigue performance, there remains a gap compared with internationally top-tier aviation-grade constant viscosity [15] rubber. These differences directly affect its adaptability in various tire components.

2.2. Extreme Working Conditions of Aircraft Tires and Differentiated Performance Requirements of Components

Aircraft tires are subjected to exceptionally demanding service environments. They must sustain substantial impact loads, multiples of the aircraft’s weight, during landing events, while simultaneously experiencing intense thermomechanical coupling under high-speed taxiing and braking. These extreme operational conditions dictate specific material performance criteria. Constructed as a multifunctional composite system, an aircraft tire integrates various components, each designed to fulfill a distinct role in managing the overall structural loads. Consequently, their performance requirements are significantly divergent [16].
As the direct contact region, the tread sustains the most severe abrasion, shear stress, and impact loads. Its performance requirements focus on extremely high abrasion resistance, excellent tear resistance, and optimized dynamic viscoelasticity; these performance requirements are directly related to aircraft braking performance and takeoff and landing safety [17]. The shoulder, as a critical stress concentration zone, presents distinct performance criteria. It requires a precise balance between tear resistance and crack growth inhibition, coupled with controlled heat generation under compression to mitigate thermal degradation. These multifaceted demands complicate the compound formulation for this region. The sidewall components endure continuous, large-amplitude flexing during service; thus, their paramount requirement is outstanding fatigue resistance under cyclic deformation. This must be complemented by high elongation to maintain flexibility and sufficient resistance to ozone aging. Serving as the tire’s foundational framework, the carcass is essential for maintaining structural shape, distributing operational stresses, and safeguarding internal elements. Its performance is predominantly defined by minimal hysteretic heat buildup, which is crucial for protecting the cord-rubber interface from thermo-oxidative damage and preserving structural integrity under severe loads and speeds. Furthermore, the carcass must exhibit high tensile strength and durability to withstand complex, repetitive stress cycles during all phases of aircraft operation, ensuring long-term functional reliability [18].
These variations in performance criteria not only underpin the engineering basis for component-specific material selection in the present work but also underscore the constraints of conventional screening approaches when confronting such multi-objective and often competing performance targets.

2.3. Advantages of the Intelligent Grey Target Decision-Making Model

Material selection is essentially a multi-objective decision-making problem that requires finding an optimal balance point within a complex space defined by multiple performance indicators [19]. Selecting natural rubber for aircraft tires poses a distinct challenge due to a constrained candidate pool, typically comprising fewer than ten premium NR grades from key global sources, alongside scarce data on critical performance indicators. This substantial limitation hinders the effective use of conventional statistical approaches, which generally depend on larger datasets for reliable analysis.
Grey system theory, founded by Deng Julong [20], provides an effective tool for dealing with such “small sample, poor information” systems. In fact, such complex decision-making problems under “data-scarce and information-poor” conditions are widespread in the field of industrial intelligence. For example, in equipment fault diagnosis, methods like comprehensive Grey Relational Analysis have been proposed to identify key subsystems by evaluating fault process correlations from limited time-series data [21].
Furthermore, the challenge of achieving reliable performance with scarce labeled data across different domains (e.g., machines or operating conditions) is a central focus in areas like cross-domain fault diagnosis. Recent research, such as [22] addresses this challenge via a “pre-training and fine-tuning” paradigm. Its core idea is to learn general representations from large amounts of unlabeled data and then rapidly adapt them with very few labeled samples. The intelligent grey target decision model studied in this paper, on the other hand, provides a complementary framework at the “decision-making” level. It aims to effectively integrate and rank incomplete and uncertain multivariate information, such as partially simulated data and expert knowledge. Thus, both “aircraft tire material selection” and “cross-domain fault diagnosis” can be seen as typical scenarios facing the core challenge of making robust decisions with insufficient information, approached from the complementary angles of “data representation learning” and “decision-level information synthesis”, respectively. Furthermore, the uncertain programing paradigm established by [23] and the fuzzy chance-constrained method applied by [24] provide a theoretical framework and tools for dealing with decision-making problems under incomplete information. The grey target decision-making model proposed in this study is methodologically complementary to the above studies at the level of decision logic by aggregating heterogeneous information through effect measures. The multi-objective weighted intelligent grey target decision model represents an important development direction in decision theory within grey system theory. Based on the construction of four types of consistency effect measurement functions, Liu Sifeng [25] proposed this model to help decision-makers identify relatively optimal decisions from multiple objectives under conditions of limited data and poor information. Compared to traditional grey target decision models, the multi-objective weighted intelligent grey target decision model offers two significant advantages: first, it incorporates weight considerations to account for the different importance levels of various decision objectives; second, it explicitly considers both target-hitting and target-missing scenarios in the objective effect values and effect vectors, significantly improving the resolution of comprehensive effect measurements.
The multi-objective weighted intelligent grey target decision model has been widely employed to address various decision-making and selection problems [26]. For instance, Zhang and Yuan utilized this model to validate the performance of energy service companies [27]. Li and Liu proposed a two-stage multi-objective weighted intelligent grey target decision model to determine optimal equipment maintenance strategies [28]. Yang and Tan applied this method for supplier selection in supply chains [29], while Dai et al. leveraged it to solve the problem of emergency shelter site selection [30]. Xie and Liu used it for military transportation mode selection [31]. Furthermore, this methodology has also been applied to resolve decision-making problems in fields such as coal mining [32], military equipment [33], load adjustment [34], and geological hazard assessment [35].
The common characteristics of the aforementioned target selection problems are as follows:
  • Lack of directly available target decision-making information;
  • Presence of multiple decision objectives;
  • Unequal importance levels of the multiple decision objectives for the overall decision;
  • Identification of the optimal decision by comparing comprehensive effect measurement values.
The multi-objective weighted intelligent grey target decision-making model is therefore exceptionally well-suited for addressing complex selection problems characterized by multiple, often competing criteria of varying priority under data-scarce conditions. In light of this suitability, the present study will first delineate the theoretical framework and key computational procedures of this model. Following this exposition, a comprehensive numerical example will be employed to empirically verify the model’s practical utility and effectiveness in the context of high-performance natural rubber selection, thereby demonstrating its capability to balance diverse performance indicators.

3. Construction of the Natural Rubber Performance Simulation Database

3.1. Data Sources and Generation Methodology

To establish a robust data foundation for the subsequent intelligent screening framework, this work initially constructed a comprehensive, reliable, and comparable performance database for natural rubber. All relevant data were methodically simulated based on a synthesis of information drawn from three distinct categories of authoritative sources. (1) international/industry standards (e.g., ASTM and ISO); (2) published academic literature; and (3) recognized empirical principles within the rubber industry. To eliminate interference caused by variations in formulation and curing processes, all performance data were generated based on a unified benchmark formulation and standardized curing conditions [36].
Baseline vulcanization formulation: natural rubber (Chaiyaput et al.) [5] 100; zinc oxide (ZnO) 5; stearic acid (SA) 2; accelerator CZ 0.7; sulfur (S) 2.5 (note: all dosages are expressed in parts per hundred rubbers (phr), a standard unit in rubber formulation research).
Baseline vulcanization conditions: temperature, 150 °C; pressure, 15 MPa; time, t90 (determined from the vulcanization curve of this formulation).
The intrinsic properties of natural rubber are inherently dependent on the specifics of its production process. For instance, Malaysian Standard Natural Rubber, Constant Viscosity grade 60 (SMR CV60), is a high-quality, constant-viscosity rubber produced from fresh field latex. Its typical Mooney viscosity resides within the range of 60–65, and a value of 62 was selected as the simulation input in Table 1 of this study. It is acknowledged, however, that the exact viscosity can be influenced by multiple external and batch-specific factors, including storage duration, detailed processing conditions, the use of stabilizers, and inter-batch variability. The simulated values for all six major natural rubber types examined in this work are selected from within their respective, well-documented, typical value ranges. For practical engineering applications, it is essential to utilize the actual measured data from the specific procured rubber batch.
This simulated database is designed to establish a fair and consistent performance benchmark and research paradigm for methodological validation, systematic comparison among different NR grades, and demonstration of the decision-making framework, moving beyond the traditional approach of relying solely on worker experience for rubber selection. In practical engineering design and material selection, decision-makers should utilize this framework as a guide and input the actual measured performance data of specific procurement batches to ensure that the decision outcomes accurately reflect the real-world state of the materials. For scenarios involving parameter uncertainty, the actual measured data of the procured rubber should be used to fulfill the requirements of product screening and commercial application. The core step of the multi-objective weighted intelligent grey target decision model proposed in this study involves transforming the raw effect values, which possess different dimensions and optimization directions into dimensionless and unidirectional effect measures via the “effect measurement function”. This function essentially maps specific numerical values onto a continuous measurement interval. Consequently, it possesses an inherent ability to smooth and absorb minor fluctuations within a reasonable range of the input parameters, thereby building resistance to interference directly into the decision logic itself.
This study selected representative brands from six major global natural-rubber-producing regions and established the following multi-dimensional performance parameter simulated database.

3.2. Database Structure and Content

Natural rubber production is intrinsically tied to the specific climatic environments of its geographic origins, which are predominantly situated in tropical and subtropical zones. Globally, principal producing regions include Thailand, Malaysia, Indonesia, and China’s Hainan and Yunnan provinces. The diversity in cultivated rubber tree clones, local climatic factors, and regional processing methodologies across these areas results in notable variations in the critical performance parameters of the final rubber material. Building upon this foundation, the present research targeted six key global producing regions. A comprehensive performance database for NR specimens from these primary origins was developed to establish a data foundation enabling the analysis of origin-to-performance correlation. The parameter simulation dataset, detailed in Table 1, Table 2 and Table 3, exhaustively covers the key parameters governing the end-use performance of natural rubber.

4. Construction of the Multi-Objective Weighted Intelligent Grey Target Decision Model

In grey decision-making systems, an event refers to a problem that requires research or resolution, a matter that needs to be handled, or the current state of a system’s behavior, serving as the starting point of the decision-making process. A countermeasure refers to the set of action plans or strategies formulated and implemented by the decision-maker in response to a specific problem or situation within the decision model. An effect measure refers to the use of one or multiple indicators to characterize the effect values obtained under the action of a countermeasure for one or more objectives. Since the effect values corresponding to different objectives may have different dimensions and properties, it is necessary to convert these effect values into uniform effect measures.
Here, the example of international supplier selection for a critical component in a commercial aircraft program under the prime manufacturer–supplier management model is used to illustrate the concepts of event, countermeasure, and effect measure. We can define the decision of selecting a supplier for a critical component of a commercial aircraft as event a 1 , with the event set A = a 1 . Suppose there are three suppliers to choose from: Supplier 1, Supplier 2, and Supplier 3. Each choice is a countermeasure, corresponding to b 1 , b 2 , b 3 , respectively. This procurement has set three objectives: quality, price, and delivery time. The performance of each of the three suppliers under each objective is referred to as the effect value for that objective. The matrix formed by the effect values of all suppliers across all objectives is called the effect measure matrix.

4.1. Multi-Objective Weighted Intelligent Grey Target Decision Model

Based on the multi-objective weighted grey target decision model proposed by Liu Sifeng, the following definitions are formulated [26]:
Definition 1.
A matter requiring study, a problem to be solved, an affair to be handled, or the current state of a system’s behavior is collectively termed an event. The complete set of events within the research scope is called the event set, denoted as,
A = { a 1 , a 2 , a 3 , , a n }
where  a i ( i = 1 , 2 , 3 , , n )  represents the  i _ t h  event.
Definition 2.
The complete set of all possible countermeasures is called the countermeasure set, denoted as  B = b 1 , b 2 , b 3 , , b n ,  where b j ( j = 1 , 2 , 3 , , n )  represents the  j _ t h  countermeasure.
Definition 3.
The Cartesian product of the event set  A = { a 1 , a 2 , a 3 , , a n }  and the countermeasure set B = b 1 , b 2 , b 3 , , b n , defined as S = A × B = { ( a i , b j ) a i A , b j B } , is termed the decision scheme set. Any element s i j = ( a i , b j ) is called a decision scheme.
Definition 4.
Let  S = A × B = { ( a i , b j ) a i A , b j B }  be the decision scheme set. Then,  u i j ( k )  is defined as the effect value of decision scheme  s i j  under objective  k .
Definition 5.
(1) If  max 1 j m r i j = r i j 0 , then  b j 0  is called the optimal countermeasure for event  a i ;
(2) If  max 1 i n r i j = r i 0 j , then  a i 0  is called the optimal event for countermeasure  b j ;
(3) If  max 1 i m   max 1 j n r i j = r i 0 j 0 , then  s i 0 j 0  is called the optimal scheme.

4.2. Calculation Steps

Suppose that for the event set A = a 1 , a 2 , , a n and the countermeasure set B = b 1 , b 2 , , b m , the decision scheme set is S = s i j = ( a i , b j ) a i A , b j B with n events and m countermeasures. The effect sample matrix under objective k ( k = 1 , 2 , , s ) is described as:
U k = ( u i j k ) = u 11 k u 12 k u 1 m k u 21 k u 22 k u 2 m k   u n 1 k u n 2 k u n m k
Objectives are typically categorized into benefit-oriented, cost-oriented, and moderate-type. The objective effect values are unified through a consistent effect measurement function. For benefit-oriented objectives, where a larger objective effect value is preferable, the decision grey target under the k _ t h objective is set as:
u i j ( k ) u i 0 j 0 ( k ) , max i   max j u i j ( k )
where u i 0 j 0 ( k ) represents the critical value of the objective effect under the k _ t h objective. Consequently, the effect measurement function for benefit-oriented objectives is:
r i j ( k ) = u i j ( k ) u i 0 j 0 ( k ) max i   max j u i j ( k ) u i 0 j 0 ( k )
For cost-oriented objectives, where a smaller objective effect value is preferable, the decision grey target under the k _ t h objective is set as:
u i j ( k ) min i   min j u i j ( k ) , u i 0 j 0 ( k )
Similarly, u i 0 j 0 ( k ) represents the critical value of the objective effect under the k _ t h objective. The effect measurement function for cost-oriented objectives is:
r i j ( k ) = u i 0 j 0 ( k ) u i j ( k ) u i 0 j 0 ( k ) min i   min j u i j ( k )
For moderate-type objectives, where the objective effect value is ideally as close as possible to a specified moderate value A , the decision grey target for the k _ t h objective is defined as u i j ( k ) A u i 0 j 0 ( k ) , A + u i 0 j 0 ( k ) . Here A u i 0 j 0 ( k ) and A + u i 0 j 0 ( k ) represent the lower and upper critical effect limits for the k _ t h objective, respectively. When u i j ( k ) A u i 0 j 0 ( k ) , A , the lower-limit effect measurement function is:
r i j ( k ) = u i j ( k ) A + u i 0 j 0 ( k ) u i 0 j 0 ( k )
When u i j ( k ) A , A + u i 0 j 0 ( k ) , the upper-limit effect measurement function is:
r i j ( k ) = A + u i 0 j 0 ( k ) u i j ( k ) u i 0 j 0 ( k )
When determining the decision weights for the objectives, if we assume η k ( k = 1 , 2 , , s ) represents the decision weight for the k _ t h objective, then k = 1 s η k = 1 . In setting the critical values for the different types of objectives, to ensure the effect measures for all objective types satisfy the normalization condition, specifically, that the effect measurement function r i j ( k ) 1 , 1 , the following conditions are established:
(1)
For a benefit-oriented objective, the decision grey target under objective k is set as u i j ( k ) 2 u i 0 j 0 ( k ) max i   max j u i j ( k ) ;
(2)
For a cost-oriented objective, the decision grey target under objective k is set as u i j ( k ) 2 u i 0 j 0 ( k ) min i   min j u i j ( k ) ;
(3)
For a moderate-type objective where the effect value is below the lower critical effect limit A u i 0 j 0 ( k ) , the decision grey target under objective k is set as u i j ( k ) A 2 u i 0 j 0 ( k ) ;
(4)
For a moderate-type objective where the effect value exceeds the upper critical effect limit A + u i 0 j 0 ( k ) , the decision grey target under objective k is set as u i j ( k ) A + 2 u i 0 j 0 ( k ) .
Due to differences in the nature, dimensionality, and meaning of the effect values under different objectives, these objective effect values often cannot be directly compared. To obtain comparable values, it is necessary to convert the objective effect values into uniform effect measures, thereby forming the uniform effect measure matrix of the objective sample. That is, for the decision scheme set S , the uniform effect measure matrix under the k _ t h objective is:
R ( k ) = ( r i j k ) = r 11 ( k ) r 12 ( k ) r 1 m ( k ) r 21 ( k ) r 22 ( k ) r 2 m ( k )   r n 1 ( k ) r n 2 ( k ) r n m ( k )
The comprehensive effect measure function for decision scheme s i j :
r i j = k = 1 s η k · r i j ( k )
Comprehensive effect measure matrix:
R = ( r i j ) = r 11 r 12 r 1 m r 21 r 22 r 2 m   r n 1 r n 2 r n m
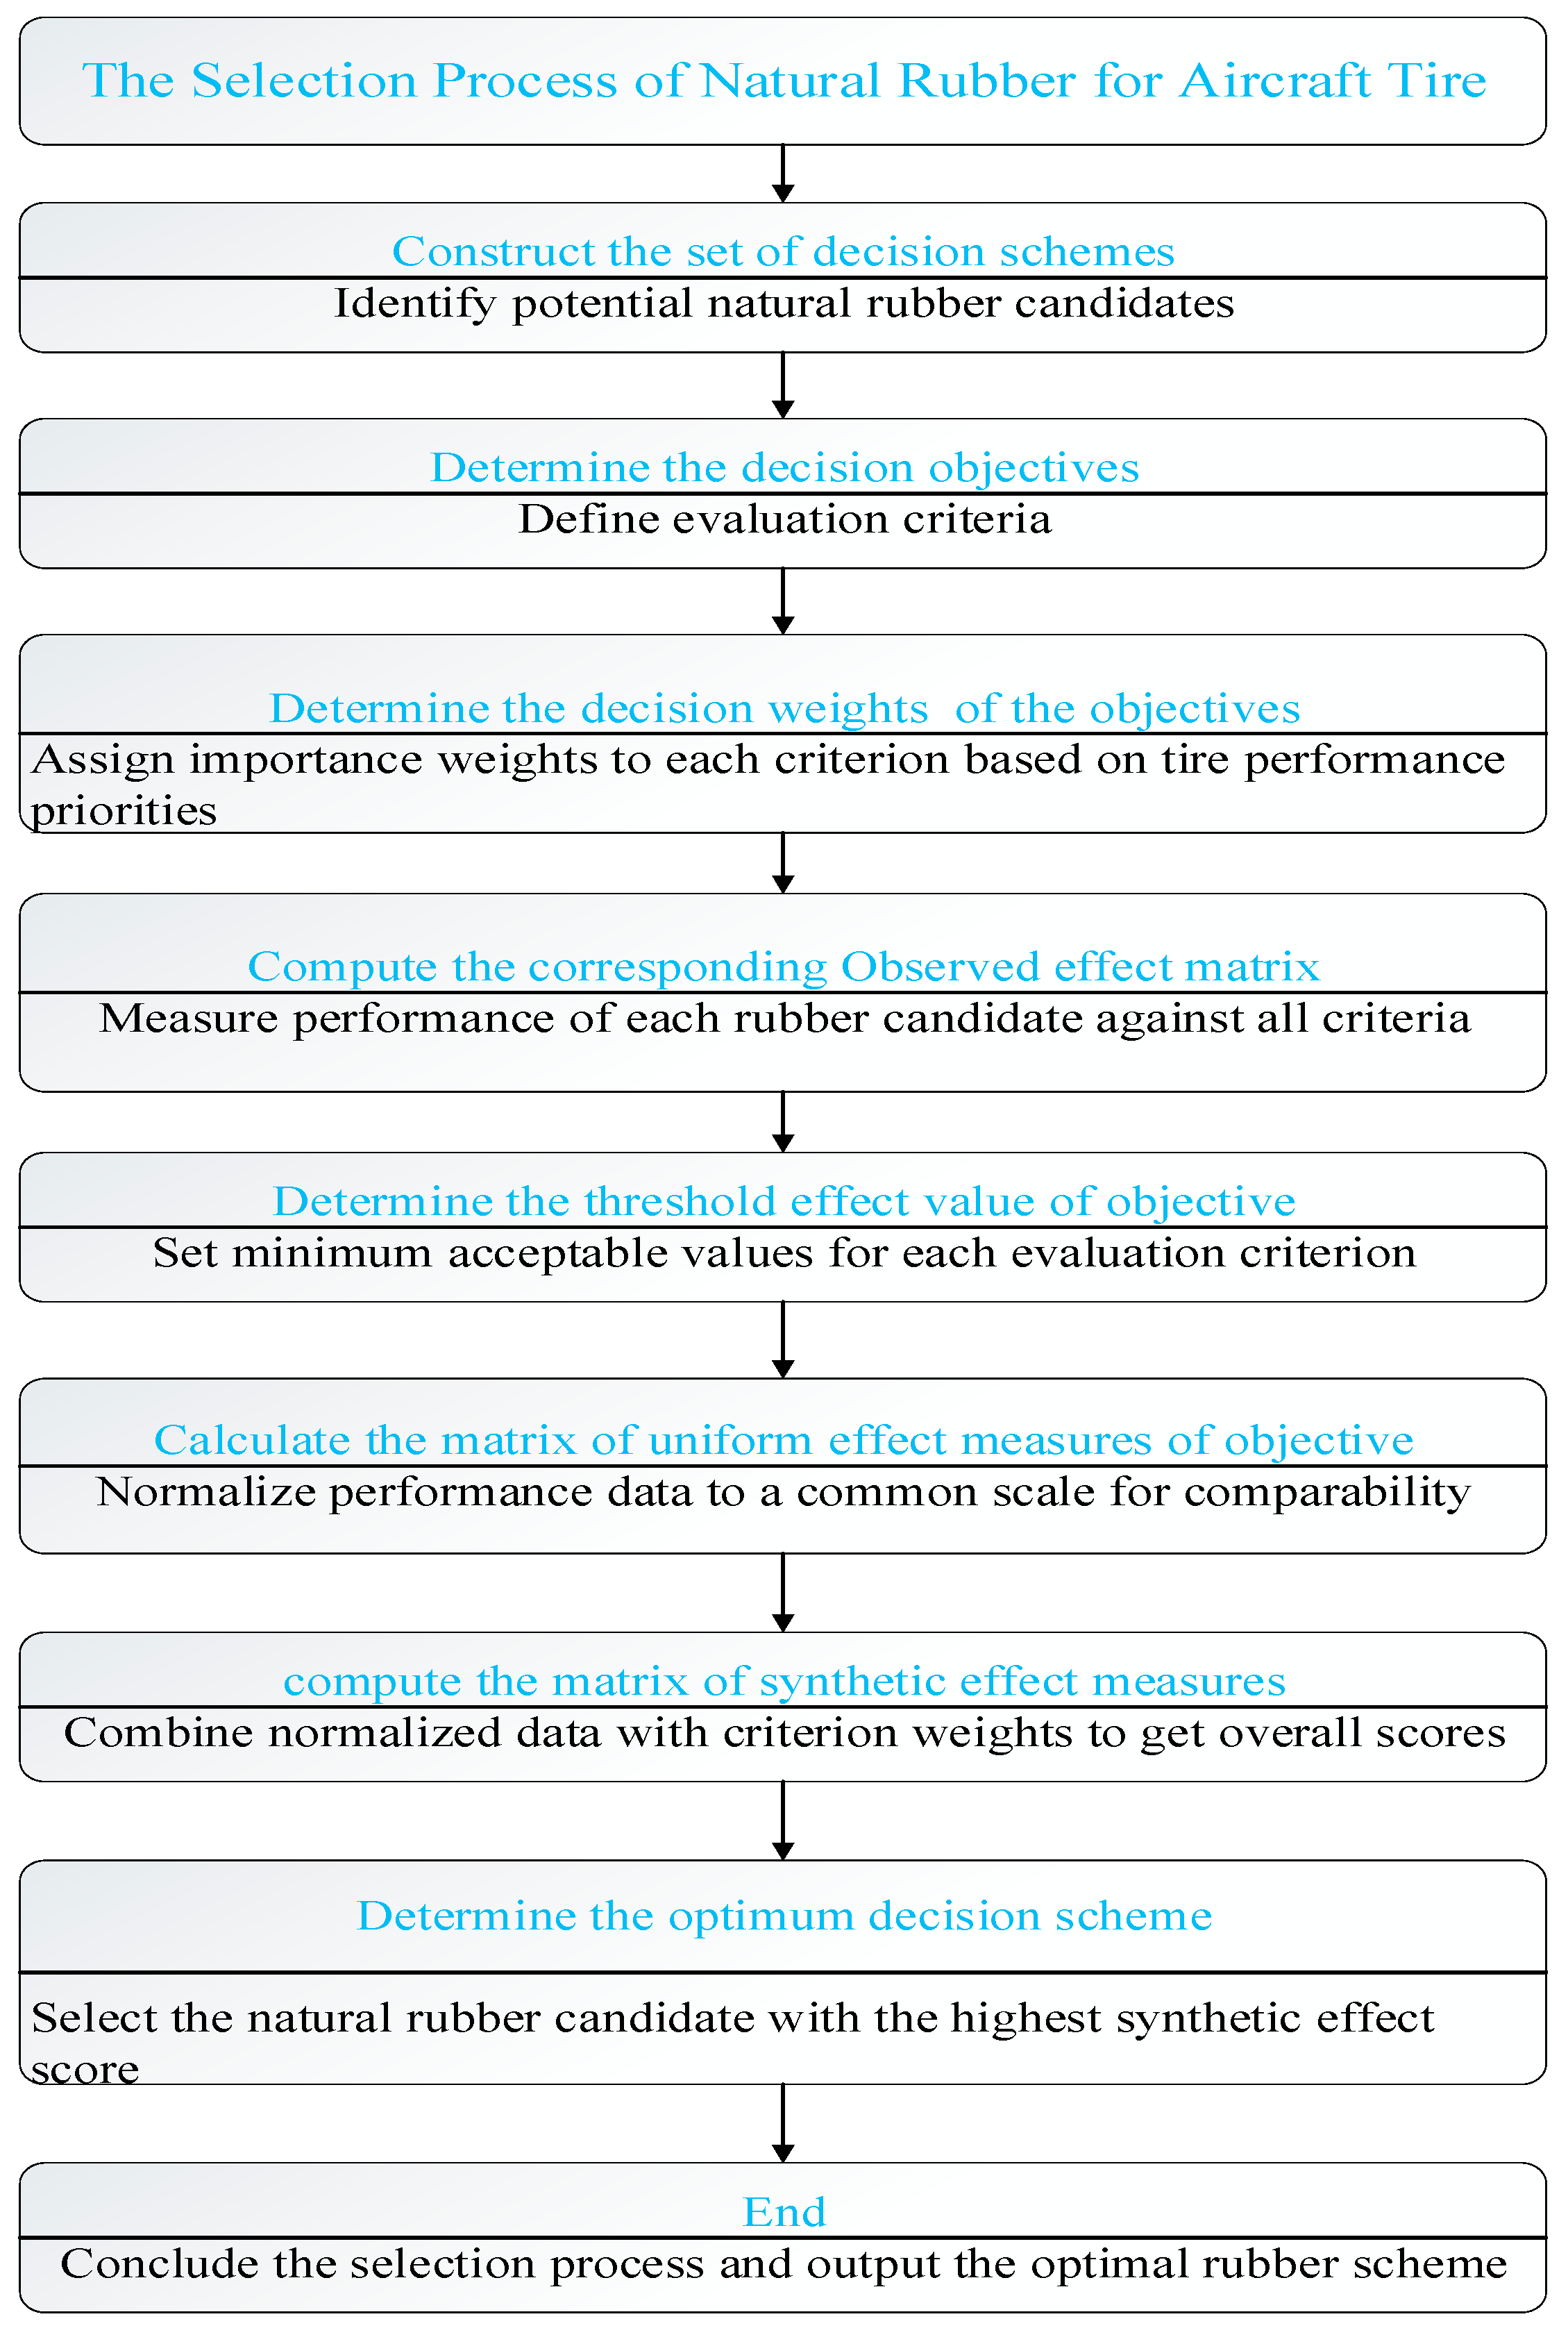
Finally, a determination of whether the grey target is hit is made based on the comprehensive effect measure value: when r i j ( k ) 0 , 1 , it indicates that the effect value for the k _ t h objective hits the grey target; when r i j ( k ) 1 , 0 , it indicates that the effect value for the k _ t h objective misses the grey target. The calculation flowchart for the multi-objective weighted intelligent grey target decision model is shown in the Figure 1.

5. Case Study

As a representative case within the civil aviation industry, the Boeing 737-800 has served as a foundational platform for short- and medium-haul operations worldwide since its entry into service in 1997. In the context of China’s rapidly expanding aviation market, this aircraft type is one of the most extensively deployed models within the national commercial fleet. Current operational figures indicate a fleet of over 1400 units, which comprises nearly half of the total active commercial aircraft in the country, underscoring its critical role in domestic and regional connectivity. As a key variant of the Boeing 737 Next Generation (737NG) series, its design emphasizes operational efficiency and reliability. The original equipment manufacturer (OEM) tires specified for this model are primarily supplied by industry leaders Goodyear (United States) and Bridgestone (Japan). For the subsequent generation, the Boeing 737 MAX series, the principal OEM tire shifts to Michelin’s advanced Near Zero Growth (NZG) radial tire technology, which aims to enhance performance and durability. The fundamental operational and dimensional parameters characterizing the Boeing 737-800 are comprehensively summarized in Table 4 for reference.
The Boeing 737-800 aircraft employs a tricycle landing gear configuration, consisting of one nose gear and two main gears located under the wings. Each landing gear unit is equipped with two tires, resulting in a total of six tires. On the ground, the nose gear typically bears only 10–15% of the aircraft’s weight [46]. The main gear tires possess a nominal diameter of 1.1 m and a width of 0.4 m, dimensions marginally less than those of typical truck tires. However, with a substantial section height of 0.38 m, they present a significantly enlarged footprint area. An individual unit has a mass of approximately 60 kg, representing an approximately sixfold increase over a standard passenger car tire. The carcass thickness reaches 20 centimeters, comparable to the combined cross-section of ten conventional automotive tires. The tread compound is a formulated blend of natural rubber and styrene-butadiene rubber (SBR), fortified with reinforcing agents such as carbon black to achieve a hardness of Shore A 85. This engineered material exhibits tear strength surpassing that of conventional rubber by a factor of three. The foundational reinforcement structure, or carcass ply, is constructed from aramid fibers. This high-strength material provides tensile capabilities five times greater than ordinary steel while boasting a density merely one-fifth of steel. The primary tire carcass integrates 18 distinct layers of cross-woven aramid cord, a configuration that enables it to sustain an inflation pressure of 14 kg per square centimeter.
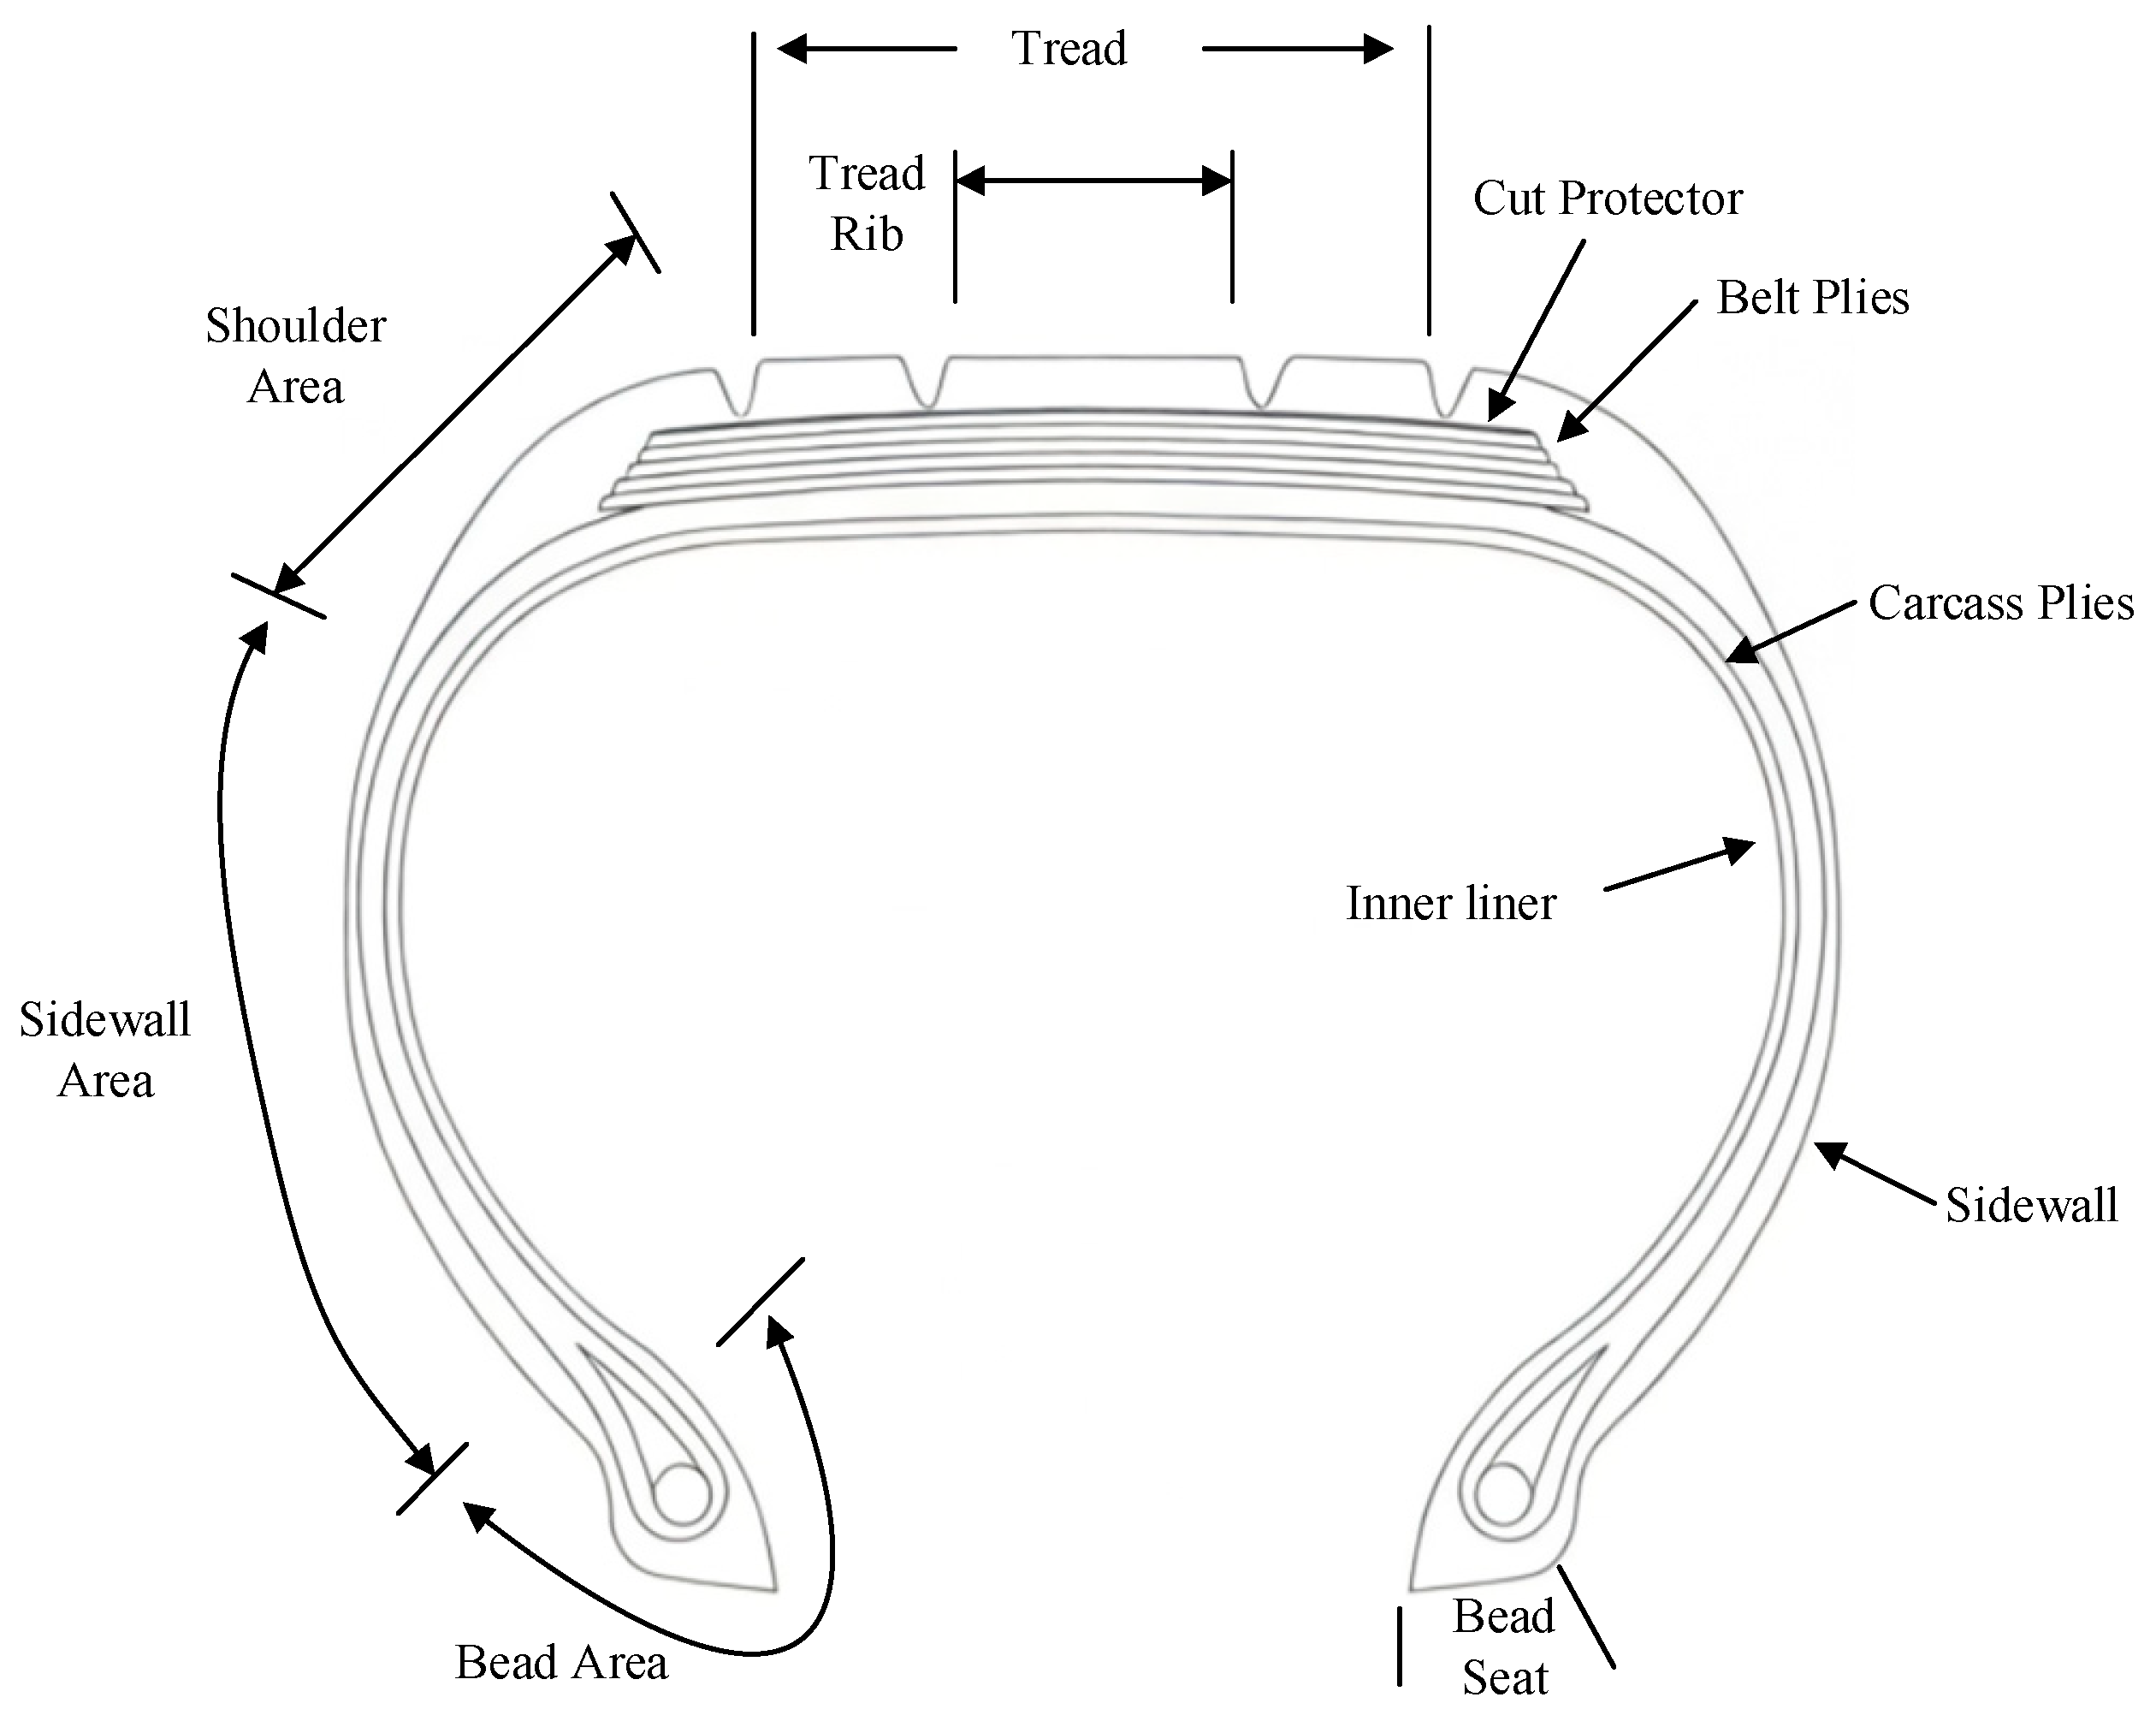
Utilizing a tubeless construction, aircraft landing gear tires are engineered to absorb the substantial impact forces, amounting to hundreds of tons, encountered during touchdown. They are inflated with inert nitrogen to maintain chemical stability and prevent a rapid pressure surge that could result from frictional heating, which can approach 400 °C and thereby avert potential failure. The tread design integrates longitudinal straight grooves for effective water dispersal with lateral sipes to enhance energy dissipation. Between the 18 reinforcing cord plies, elastic rubber interlayers are incorporated. Upon ground contact, the tire structure can undergo deformation of up to 30%, transforming the kinetic impact into elastic potential energy which is subsequently released in a controlled manner [47]. The cross-sectional view of the aircraft tire is as shown in Figure 2.
The precise material constitution of aircraft tires, specifically regarding distinct rubber formulations and cord specifications, is regarded as proprietary technological know-how and is rarely elucidated in public literature. Notwithstanding this, high-confidence inferences regarding material composition can be simulated by leveraging public data, industry standards, and reverse engineering. Grounded in the analysis of Boeing 737 parameters, "simulated sequences" for the tread, sidewall, and carcass have been established. These values are comprehensively derived from the extreme operating conditions, performance ceilings, and pragmatic engineering requisites of each component. As the simulated performance values for key components of the Boeing 737-800 main tire is shown in Table 5.

5.1. Numerical Calculation

Natural rubber is the primary raw material for manufacturing aircraft tires. To produce tires that meet performance requirements, selecting appropriate natural rubber for different components, namely the tread, shoulder, sidewall, and carcass, is essential. In this framework, the selection of NR for each tire component is defined as the “event”, the six major global NR origins are considered the “countermeasures”, and the analysis is conducted based on the multi-objective intelligent weighted grey target decision-making model. Finally, the comprehensive effect measure matrix is obtained through the effect measure function in Section 4.2, Equation (9), thereby selecting the preferred natural rubber material for the corresponding tire component. The complete calculation procedure is described below.
Step 1: Establishing the event set, countermeasure set, and decision scheme set.
Taking the aircraft tire tread compound as an example (the screening processes for the shoulder, sidewall, and carcass are analogous), the selection of natural rubber for the aircraft tire tread component is defined as an event a 1 . Thus, the event set is defined as A = a i = a 1 . Six types of natural rubber from different producing regions are considered as potential countermeasures. These are: Malaysian SMR CV60, Indonesian SIR 20, Thai STR 20, Vietnamese SVR 3L, Chinese Hainan SCR WF, and Chinese Yunnan SCR WF, designated as b 1 , b 2 , b 3 , b 4 , b 5 , b 6 , respectively. Consequently, the countermeasure set is defined as:
B = b j = b 1 , b 2 , b 3 , b 4 , b 5 , b 6
The decision scheme set formed by the event set A and the countermeasure set B :
S = s i j = ( a i , b j ) a i A , b j B = s 11 , s 12 , s 13 , s 14 , s 15 , s 16
Step 2: Determination of decision objectives.
The Expert Consultation Method was employed. Following consultations with domain experts, DIN abrasion volume, tear strength, tan δ @ 60 °C, and tan δ @ 0 °C were determined as the decision objectives for the tread natural rubber, as is shown in Table 6.
Step 3: Determination of decision weights for objectives.
The decision weight coefficients for the four primary decision objectives were determined utilizing the AHP. To obtain representative and professional judgments, we formed a panel of five experts. The panel includes two engineers from tire manufacturing companies, two scholars from the field of rubber materials research in academia, and one maintenance engineer from an airline. All experts possess extensive experience in their respective fields. Based on Saaty’s 1–9 scale, they performed pairwise importance comparisons for the decision objectives under each component. Finally, consistency checks were conducted, and the weights were calculated after passing these checks. The weights for the main tire tread objectives are shown in Table 7. The calculation process can be found in Appendix A.
Step 4: Calculation of effect sample vectors for each objective.
Based on Table 8, the objective effect sample matrix is formulated as follows:
U ( k ) = ( u i j ( k ) ) = 105 115 112 125 108 110 42 40 41 37 39 38.5 0.095 0.105 0.103 0.110 0.098 0.100 0.255 0.245 0.248 0.235 0.250 0.248 62 82 86 76 77 76 78 62 60 52 68 66
Step 5: Setting critical values for objective effects.
This step primarily prepares for the normalization of the objective effect sample matrix. Specifically, DIN Abrasion Volume (k = 1) and tan δ @ 60 °C (k = 3) are cost-oriented objectives, with critical values set as u i 0 j 0 ( 1 ) = 115 and u i 0 j 0 ( 3 ) = 0.1025 , respectively. Tear Strength (k = 2), Tan δ @ 0 °C (k = 4) and Plasticity Retention Index (k = 6) are benefit-oriented objectives, with critical values set as u i 0 j 0 ( 2 ) = 39.5 , u i 0 j 0 ( 4 ) = 0.245 , and u i 0 j 0 ( 6 ) = 65 , respectively. Mooney Viscosity (k = 5) is a moderate-type objective, with a specified moderate value of 70 and a tolerance limit of u i 0 j 0 ( 5 ) = 10 .
Step 6: Calculation of the uniform effect measure matrix for objective k
r 11 ( 1 ) = u i 0 j 0 ( 1 ) u 11 ( 1 ) u i 0 j 0 ( 1 ) min i   min j u i j ( 1 ) = 115 105 115 105 = 1 r 12 ( 1 ) = u i 0 j 0 ( 1 ) u 12 ( 1 ) u i 0 j 0 ( 1 ) min i   min j u i j 1 = 115 115 115 105 = 0 r 13 ( 1 ) = u i 0 j 0 ( 1 ) u 13 ( 1 ) u i 0 j 0 ( 1 ) min i   min j u i j 1 = 115 112 115 105 = 0.3 r 14 ( 1 ) = u i 0 j 0 ( 1 ) u 14 ( 1 ) u i 0 j 0 ( 1 ) min i   min j u i j 1 = 115 125 115 105 = 1 r 15 ( 1 ) = u i 0 j 0 ( 1 ) u 15 ( 1 ) u i 0 j 0 ( 1 ) min i   min j u i j 1 = 115 108 115 105 = 0.7 r 16 ( 1 ) = u i 0 j 0 ( 1 ) u 16 ( 1 ) u i 0 j 0 ( 1 ) min i   min j u i j 1 = 115 110 115 105 = 0.5
Similarly, by applying the same rule, the uniform effect measure matrix for when k = 3 can be obtained:
r 31 ( 3 ) = 1 ,   r 32 ( 3 ) = 0.333 ,   r 33 ( 3 ) = 0.067 ,   r 34 ( 3 ) = 1 ,   r 35 ( 3 ) = 0.6 ,   r 36 ( 3 ) = 0.333
When k = 6 , r 61 ( 6 ) = 1 , r 62 ( 6 ) = 0.2308 , r 63 ( 6 ) = 0.3846 , r 64 ( 6 ) = 1 , r 65 ( 6 ) = 0.2308 , r 66 ( 6 ) = 0.0769
When k = 2 ,
r 21 ( 2 ) = u 11 ( 2 ) u i 0 j 0 ( 2 ) max i   max j u i j ( 2 ) u i 0 j 0 ( 2 ) = 42 39.5 42 39.5 = 1 r 22 ( 2 ) = u 12 ( 2 ) u i 0 j 0 ( 2 ) max i   max j u i j ( 2 ) u i 0 j 0 ( 2 ) = 40 39.5 42 39.5 = 0.2 r 23 ( 2 ) = u 13 ( 2 ) u i 0 j 0 ( 2 ) max i   max j u i j ( 2 ) u i 0 j 0 ( 2 ) = 41 39.5 42 39.5 = 0.6 r 24 ( 2 ) = u 14 ( 2 ) u i 0 j 0 ( 2 ) max i   max j u i j ( 2 ) u i 0 j 0 ( 2 ) = 37 39.5 42 39.5 = 1 r 25 ( 2 ) = u 15 ( 2 ) u i 0 j 0 ( 2 ) max i   max j u i j ( 2 ) u i 0 j 0 ( 2 ) = 39 39.5 42 39.5 = 0.2 r 26 ( 2 ) = u 11 ( 2 ) u i 0 j 0 ( 2 ) max i   max j u i j ( 2 ) u i 0 j 0 ( 2 ) = 38.5 39.5 42 39.5 = 0.4
Similarly, r 41 ( 4 ) = 1 , r 42 ( 4 ) = 0 , r 43 ( 4 ) = 0.3 , r 44 ( 4 ) = 1 , r 45 ( 4 ) = 0.5 , and r 46 ( 4 ) = 0.3 .
For the moderate-type decision indicator, when k = 5 , the target value is set as 70 and the tolerance limit as 10. When u i j ( 5 ) A u i 0 j 0 ( 5 ) , A :
r i j ( 5 ) = u i j ( 5 ) A + u i 0 j 0 ( 5 ) u i 0 j 0 ( 5 )
That is:
r 51 ( 5 ) = 62 60 10 = 0.2
When u i j ( 5 ) A , A + u i 0 j 0 ( 5 ) :
r i j ( 5 ) = A + u i 0 j 0 ( 5 ) u i j ( 5 ) u i 0 j 0 ( 5 ) r 52 ( 5 ) = 80 82 10 = 0.2 ,   r 53 ( 5 ) = 80 86 10 = 0.6 ,   r 54 ( 5 ) = 80 76 10 = 0.4 ,   r 55 ( 5 ) = 80 77 10 = 0.3 ,   r 56 ( 5 ) = 80 76 10 = 0.4
The uniform effect measure function values under all k objectives are aggregated to form the uniform effect measure matrix R ( k ) for the k _ t h objective, that is:
R ( k ) = ( r i j ( k ) ) = r 11 ( 1 ) r 12 ( 1 ) r 13 ( 1 ) r 14 ( 1 ) r 15 ( 1 ) r 16 ( 1 ) r 21 ( 2 ) r 22 ( 2 ) r 23 ( 2 ) r 24 ( 2 ) r 25 ( 2 ) r 26 ( 2 ) r 31 ( 3 ) r 32 ( 3 ) r 33 ( 3 ) r 34 ( 3 ) r 35 ( 3 ) r 36 ( 3 ) r 41 ( 4 ) r 42 ( 4 ) r 43 ( 4 ) r 44 ( 4 ) r 45 ( 4 ) r 46 ( 4 ) r 51 ( 5 ) r 52 ( 5 ) r 53 ( 5 ) r 54 ( 5 ) r 55 ( 5 ) r 56 ( 5 ) r 61 ( 6 ) r 62 ( 6 ) r 63 ( 6 ) r 64 ( 6 ) r 65 ( 6 ) r 66 ( 6 ) = 1 0 0.3 1 0.7 0.5 1 0.2 0.6 1 0.2 0.4 1 0.333 0.067 1 0.6 0.333 1 0 0.3 1 0.5 0.3 0.2 0.2 0.6 0.4 0.3 0.4 1 0.2308 0.3846 1 0.2308 0.0769
By the formula r i j = η k · r i j ( k ) , calculate the comprehensive effect measure matrix.
According to the decision weight matrix for objective k :
η k = 0.18 0.09 0.04 0.4 0.06 0.23
Then, the comprehensive effect measure matrix is obtained as:
R = η k T · R ( k ) = 0.952 0.0604 0.1 0.916 0.4031 0.229
Based on the comprehensive effect measure vector, Malaysia SMR CV60 is identified as the optimal selection for the tire tread rubber material. We employed a cross-validation approach to ensure the robustness of the conclusions. The Technique for Order Preference by Similarity to Ideal Solution (TOPSIS), a widely-used multi-criteria decision-making method, was applied, the detailed calculation process of TOPSIS can be found in Appendix B. Using the same parameters and decision objective weights established in the case study (Section 5), the TOPSIS analysis also identified Malaysia SMR CV60 as the optimal choice for the tire tread rubber, which aligns perfectly with the result obtained from our proposed multi-objective weighted intelligent grey target decision model. It is worth noting, however, that, while TOPSIS provides a relative closeness coefficient (ranging from 0 to 1), it cannot directly indicate whether a solution meets specific absolute performance requirements. In contrast, our grey target model utilizes the comprehensive effect measure. By determining whether this value is greater than zero, it can directly judge if a solution “hits the target”—that is, whether it meets the established comprehensive performance benchmark. This characteristic offers more intuitive guidance for engineering decisions where clear performance thresholds are mandated.
Following the same calculation procedure, the multi-objective weighted intelligent grey target decision model was applied to perform numerical simulations for the shoulder, sidewall, and carcass components. The results are summarized as Table 9.
To clearly present the final selection results, Table 10 summarizes the final ranking of the six natural rubber brands for each component, which is derived from the multi-objective weighted intelligent grey target decision-making model.

5.2. Sensitivity Analysis

Recognizing that the weight for Tan δ @ 0 °C ( w 4 ) is the largest, we adjusted w 4 by ±10%, ±20%, and ±30% from its original value. The remaining weights were proportionally normalized to maintain w i = 1 .
Taking the case of a +20% increase in w 4 as an example:
New weight w4’ = 0.48.
The sum of the remaining weights becomes 0.52.
The normalization coefficient is therefore k = 0.52/0.6 0.867.
The new weight vector is calculated as:
w = [ 0.18 × k ,   0.09 × k ,   0.04 × k ,   0.48 ,   0.06 × k ,   0.23 × k ] [ 0.156 ,   0.078 ,   0.035 ,   0.48 ,   0.052 ,   0.200 ] .
Recalculating the comprehensive effect measures with this new weight vector yields: [0.9594, −0.0526, 0.1271, −0.9282, 0.4164, 0.2386]. The results show that SMR CV60 rubber remains the optimal choice. The outcomes for all perturbation scenarios are summarized below.
As shown in the Table 11, Criterion 4 ( Tan δ @ 0 °C) demonstrates robustness across all six perturbation scenarios, and the final recommended rubber remains Malaysia SMR CV60. This outcome is anticipated because, according to the baseline weights derived from expert scoring, Criterion 4 carries the highest weight. Even with perturbations, it retains its dominant position. Simultaneously, SMR CV60 exhibits the best performance on this specific criterion. This evidence further substantiates the inherent robustness of the grey target decision model in handling the uncertainty characteristic of “small sample, poor information” systems.

5.3. Material Selection Recommendations

Aircraft tires impose extreme demands on the durability and heat resistance of the tread compound. Natural rubber is seeing a significant increase in its application in modern radial tires due to its excellent green strength, tear strength, and low heat build-up characteristics [48]. The same literature also highlights that constant-viscosity natural rubber (CV NR) is produced via a “viscosity stabilization” technique. Based on this, CV NR, by providing more stable and reliable product quality, emerges as a superior choice over standard technically specified rubbers (e.g., STR) in aircraft tire applications where exceptionally high processing consistency and safety are paramount.
The calculations performed using the multi-objective weighted intelligent grey target decision model indicate that Malaysian SMR CV60 is the optimal selection for the tread, shoulder, and carcass compounds of Boeing 737-800 class tires, while Yunnan, China, SCR WF natural rubber is recommended for the sidewall compound. These results can serve as a guide for material screening in the development of new aircraft tire models.

6. Conclusions, Application Potential and Future Work

6.1. Conclusions

Focusing on the specialized application of aircraft tires, this research established and validated a structured methodology for NR formulation design and selection, utilizing a multi-objective weighted intelligent grey target model. This framework aims to provide a scientifically rigorous, data-informed basis for screening rubber compounds in tire applications. The principal findings are summarized as follows.
(1)
This study developed a comprehensive simulation database covering key natural rubber grades from six primary global production zones. This resource provides a foundational data repository for the systematic investigation of materials for aircraft tire applications.
(2)
An intelligent, component-targeted selection model for aircraft tire natural rubber was developed, utilizing a weighted multi-objective intelligent grey target decision framework. This model establishes distinct performance target sequences for the four critical tire components: tread, shoulder, sidewall, and carcass. It thereby enables a transition in natural rubber selection from a predominantly experience-based process to a data-driven methodology. The model’s validity, efficacy, and reliability were verified by comparing the selection outcomes for a Boeing 737-800 application with established international industrial standards.
(3)
The methodological framework developed in this work establishes a foundation for subsequent studies. Specifically, the assembled performance database for major international NR grades, coupled with the systematic approach for translating aircraft design parameters into material performance requirements, offers a repeatable and scalable analytical model for selecting materials for other aircraft types or structural components.

6.2. Generalizability and Application Potential

This paper is a structured, domain-agnostic methodological framework, the intelligent grey target decision model, rather than merely a specific solution for B737-800 tread rubber selection. The generality of this framework stems from its standardized decision-making logic:
(1)
Methodological Core: Define the “event” (decision context) and “countermeasures” (alternative options) to construct a multi-dimensional “objective” system to use the “effect measurement function” to homogenize heterogeneous and uncertain raw information (measured, simulated, expert judgment) to perform comprehensive quantitative evaluation and ranking by integrating AHP weights.
(2)
Generalization Pathways: Therefore, applying it to other scenarios essentially involves adapting this universal core with specific external knowledge:
  • Horizontal Transfer (Within Domain): Applying it to other aircraft platforms (e.g., A320 and C919) or tire components only requires updating the corresponding performance database and the AHP weights that reflect the new requirements.
  • Vertical Extension (Across Decision Types): Within aviation operation and maintenance, it can be applied to problems like maintenance strategy optimization or spare parts supplier evaluation, which requires redefining the specific “event–countermeasure–objective” system.
  • Cross-Domain Application: The framework is suitable for any complex decision-making problem characterized by “multiple conflicting objectives, incomplete information (scarce or uncertain), and the need to synthesize qualitative and quantitative judgments”. Examples include new energy vehicle battery material screening and supply chain risk management. The key to application lies in inputting domain knowledge, not modifying the framework itself.

6.3. Future Work

This work presents a novel paradigm for material selection, providing a scientific and quantifiable decision-making framework for choosing NR in specialized engineering contexts. While acknowledging the constraints imposed by the proprietary nature of commercial tire formulations, future research will seek collaboration with manufacturers to integrate authentic experimental data for database enhancement. Further proposed work involves exploring the integration of machine learning techniques with grey decision theory to improve the model’s predictive precision and generalization ability. Deeper investigations in the following directions are recommended to facilitate more significant theoretical and applied advancements.
(1)
Developing a Dynamic Screening Model
The existing grey decision model operates primarily as a static, data-informed screening tool. Future work could incorporate time series analysis with grey forecasting models to simulate the property degradation or structural "health" decline of natural rubber under prolonged aging or fatigue conditions. This integration would facilitate the prediction of material performance throughout its entire service life, thereby shifting the assessment focus from initial performance optimization towards a comprehensive lifecycle evaluation.
(2)
Developing a Heterogeneous Integrated Grey Model
Different analytical methodologies are founded on distinct principles and exhibit specific applicability. Future research could focus on integrating heterogeneous models drawn from grey relational analysis, grey clustering, grey decision-making, and artificial intelligence. Such a synthesis would improve the precision of the selection algorithm, especially in resolving trade-offs between competing material properties, for instance, balancing high tear strength against low hysteretic heat generation. Furthermore, calibrating the weighting of various model outputs against experimental data would enhance the overall accuracy and reliability of the integrated framework.
(3)
Incorporating Broader Data Metrics
Although the present work focused on key natural rubber performance parameters, subsequent research could incorporate a broader array of evaluation metrics to establish a more holistic framework for evaluating and selecting natural rubber. Given the advancement of artificial intelligence and enhanced computational capabilities, the future screening process may effectively integrate grey system modeling with AI methodologies or large-scale data analytics [49]. In the context of expanding datasets, AI can analyze extensive empirical data and knowledge to produce initial material screening recommendations. Subsequent evaluation and refinement of these suggestions can be performed by grey decision models. This synergistic hybrid methodology holds considerable potential for substantially improving selection efficiency. Regarding data constraints, critical parameters for aviation tires are often protected as commercial secrets by manufacturers. Consequently, when applying the multi-objective weighted intelligent grey target model, the actual measured parameters of the procured rubber materials should be utilized for all computational procedures.

Author Contributions

Conceptualization, K.J.; Methodology, K.J.; Software, K.J. and B.W.; Validation, B.W.; Investigation, B.W.; Resources, K.J.; Data curation, K.J.; Writing—original draft, K.J.; Visualization, K.J. All authors have read and agreed to the published version of the manuscript.

Funding

This research received no external funding.

Data Availability Statement

The original contributions presented in this study are included in the article. Further inquiries can be directed to the corresponding author.

Conflicts of Interest

The authors declare no conflict of interest.

Appendix A. Code for the AHP to Determine the Decision Weights in Table 7

clc; clear all;
% Input judgment matrix
A = [1 3 5 1/3 4 1/2; 1/3 1 3 1/5 2 1/3; 1/5 1/3 1 1/7 1/2 1/4; 3 5 7 1 6 2; 1/4 1/2 2 1/6 1 1/3; 2 3 4 1/2 3 1];
n = size(A, 1); % Matrix order (number of criteria)
% Calculate eigenvalues and eigenvectors
[B, E] = eig(A); % B: Eigenvector matrix; E: Eigenvalue diagonal matrix
lambda = diag(E); % Extract all eigenvalues
[lambda_max, idx] = max(lambda); % Maximum eigenvalue and its index
v = B(:, idx); % Eigenvector corresponding to the maximum eigenvalue (column vector)
% Normalize eigenvector to get weights
w = v/sum(v); % Normalization (sum of elements equals 1)
w = w’; % Transpose to row vector for convenient output
% Consistency check
CI = (lambda_max − n)/(n − 1); % Consistency index
RI = 0.89; % Average random consistency index for n = 4 (Saaty standard)
CR = CI/RI; % Consistency ratio
% Output results
fprintf(‘Matrix order n = %d\n’, n);
fprintf(‘Maximum eigenvalue λ_max = %.4f\n’, lambda_max);
fprintf(‘Criterion weight vector w = ‘); fprintf(‘%.4f ‘, w); fprintf(‘\n’);
fprintf(‘Consistency index CI = %.4f\n’, CI);
fprintf(‘Consistency ratio CR = %.4f\n’, CR);
if CR < 0.1
        fprintf(‘Consistency check: Passed (CR < 0.1)\n’);
else
        fprintf(‘Consistency check: Failed (CR ≥ 0.1)\n’);
end
eta_k_row = [0.18, 0.09, 0.04, 0.4, 0.06, 0.23]; % Row vector form
% Define the matrix in the second image
matrix = [1, 0, 0.3, −1, 0.7, 0.5;
                   1, 0.2, 0.6, −1, −0.2, −0.4;
                   1, −0.333, −0.067, −1, 0.6, 0.333;
                   1, 0, 0.3, −1, 0.5, 0.3;
                   0.2, −0.2, −0.6, 0.4, 0.3, 0.4;
                   1, −0.2308, −0.3846, −1, 0.2308, 0.0769];
% Direct matrix multiplication (row vector * matrix)
result = eta_k_row * matrix;
% Display result
disp(‘Result of row vector multiplied by matrix:’);
disp(result);

Appendix B. TOPSIS Calculation Process

To provide a quantitative comparison with the intelligent grey target decision model proposed in this paper, the Technique for Order Preference by Similarity to Ideal Solution (TOPSIS) is employed as a benchmark method. The following demonstrates the complete calculation process using the selection of the six natural rubber (NR) brands for the tire tread component as an example. The decision matrix (simulated performance data) and the indicator weights determined by the AHP method are identical to those used in the case study in Section 5.1.
Step 1: Construct the Initial Decision Matrix
Based on the simulated data in Table 2 and Table 3, along with engineering expertise, the performance matrix X for the six NR brands across the six decision objectives for the tread component is constructed. The benefit-type indicators (larger values are better) are: Abrasion Resistance (index), Tear Strength (kN/m), Wet Grip (tan δ @0 °C), and Fatigue Resistance (k cycles). The cost-type indicators (smaller values are better) are: Heat Build-up (ΔT, °C) and Rolling Resistance (tan δ @60 °C).
X = B r a n d T e a r S t r e n g t h H e a t   Build-up Tan   δ   @ 0   ° C Tan   δ   @ 60   ° C D e M a t t i a D I N A b r a s s i o n S M R C V 60 42 28 28 0.095 155 105 S I R 20 40 35 35 0.105 120 115 S T R 20 41 34 34 0.103 125 112 S V R 3 L 37 38 38 0.110 110 125 H a i n a n S C R W F 39 30 30 0.098 140 108 Y u n n a n S C R W F 38.5 31 31 0.100 135 110
Step 2: Construct the Normalized Decision Matrix
Matrix X is processed using the vector normalization method to eliminate dimensional effects. For the “Tear Strength” column:
D e n o m = 42 2 + 40 2 + 41 2 + 37 2 + 39 2 + 38.5 2 94
Thus, r 11 = 42 / 94 = 0.4468 for Malaysia SMR CV60.
The normalized matrix R is:
R 0.4468 0.3313 0.4189 0.3313 0.4599 0.3573 0.4255 0.4141 0.4025 0.3661 0.3561 0.3915 0.4362 0.4023 0.4074 0.3590 0.3709 0.3812 0.3936 0.4495 0.3861 0.3835 0.3265 0.4254 0.4149 0.3550 0.4107 0.3418 0.4155 0.3676 0.4096 0.3668 0.4074 0.3487 0.4007 0.3744
Step 3: Construct the Weighted Normalized Decision Matrix
Apply the AHP weights from Table 7, w = [ 0.18 , 0.09 , 0.04 , 0.40 , 0.06 , 0.23 ] .
The weighted normalized matrix V is:
V 0.0804 0.0298 0.0168 0.1325 0.0276 0.0822 0.0766 0.0373 0.0161 0.1464 0.0214 0.0900 0.0785 0.0362 0.0163 0.1436 0.0223 0.0877 0.0708 0.0405 0.0154 0.1534 0.0196 0.0978 0.0747 0.0319 0.0164 0.1367 0.0249 0.0845 0.0737 0.0330 0.0163 0.1395 0.0240 0.0861
Step 4: Determine the Positive and Negative Ideal Solutions
Indicator types: Benefit (cols 1, 3, and 5); Cost (cols 2, 4, and 6).
A + = [ max ( V : , 1 ) , max ( V : , 2 ) , max ( V : , 3 ) , max ( V : , 4 ) , max ( V : , 5 ) , max ( V : , 6 ) ] = 0.0804 , 0.0298 , 0.0168 , 0.1325 , 0.0276 , 0.0822 A = [ min ( V : , 1 ) , max ( V : , 2 ) , min ( V : , 3 ) , max ( V : , 4 ) , min ( V : , 5 ) , max ( V : , 6 ) ] = 0.0708 , 0.0405 , 0.0154 , 0.1534 , 0.0196 , 0.0978
Step 5: Calculate the Distance of Each Alternative to the Ideal Solutions
Calculate Euclidean distance D i + and D i for each brand to A + and A .
Results:
D + = [ 0 , 0.0237 , 0.0193 , 0.0372 , 0.0127 , 0.0145 ] D = [ 0.0372 , 0.0135 , 0.0179 , 0 , 0.0245 , 0.0227 ]
Step 6: Calculate the Relative Closeness and Rank
Calculate relative closeness C i = D i / ( D i + + D i + ) and sort in descending order.
RankBrand D + D C i
1SMR CV6000.03721
2Hainan China SCR WF0.01270.02450.6586
3Yunnan, China SCR WF0.01450.02270.61
4STR 200.01930.01790.4811
5SIR 20002370.01350.363
6SVR 3L0.037200

References

  1. Cai, J.; Huang, Y.; Li, Y.; Zhao, H.; Dai, X. Analysis of the influence of pavement roughness on wet pavement-aircraft tire interaction. Sci. Technol. Eng. 2024, 24, 5583–5594. [Google Scholar] [CrossRef]
  2. Zhou, C.; Zhong, Q.; Mo, Y.; Liao, M.; Yao, X.; Li, J. Aircraft tire-flooded runway fluid-structure interaction simulation: Hydroplaning characterization using the material point method. Aerosp. Sci. Technol. 2026, 169, 111482. [Google Scholar] [CrossRef]
  3. Zhang, X.; Huan, Y.; Zhang, Y.; Wang, C.; Cheng, C.; Li, J. The impacts of loads and temperatures on aircraft tyres electrical conductivity performance. Results Eng. 2026, 29, 108510. [Google Scholar] [CrossRef]
  4. Popescu, R.C.; Popescu, D.; Grumezescu, A.M. 4-Applications of rubber-based blends. In Recent Developments in Polymer Macro, Micro and Nano Blends; Visakh, P.M., Markovic, G., Pasquini, D., Eds.; Woodhead Publishing: Cambridge, UK, 2017; pp. 75–109. [Google Scholar] [CrossRef]
  5. Chaiyaput, S.; Jaroonrat, P.; Liangsunthonsit, A.; Mase, L.Z.; Kotkhangphlu, P.; Ayawanna, J. Feasibility study of using natural para rubber for reinforced embankment. Case Stud. Constr. Mater. 2023, 19, e02516. [Google Scholar] [CrossRef]
  6. Chen, D.; Wu, J.; Wang, Y.; Su, B.; Liu, Y. High-speed tribology behaviors of aircraft tire tread rubber in contact with pavement. Wear 2021, 486–487, 204071. [Google Scholar] [CrossRef]
  7. Zhang, Y.F.; Shao, H.F.; Wang, R.G.; He, A.H. Structure and properties of aircraft tire sidewall rubber modified by trans-1,3-pentadiene rubber. Chem. J. Chin. Univ. 2019, 40, 1733–1739. [Google Scholar] [CrossRef]
  8. Kohjiya, S.; Ikeda, Y. Chemistry, Manufacture and Applications of Natural Rubber; Woodhead Publishing: Cambridge, UK, 2021. [Google Scholar]
  9. Omar, M.F.; Ali, F.; Jami, M.S.; Azmi, A.S.; Ahmad, F.; Marzuki, M.Z.; Muniyandi, S.K.; Zainudin, Z.; Kim, M.P. A Comprehensive Review of Natural Rubber Composites: Properties, Compounding Aspects, and Renewable Practices with Natural Fibre Reinforcement. J. Renew. Mater. 2025, 13, 497–538. [Google Scholar] [CrossRef]
  10. Hewitt, N. (Ed.) Natural Rubber Formulary. In Compounding Precipitated Silica in Elastomers; William Andrew Publishing: Norwich, NY, USA, 2007; pp. 89–167. [Google Scholar] [CrossRef]
  11. Ma, Z.; Lu, H.; Liu, C.; Rui, X. Study on the camber angle of an aircraft radial tire: Stress, contact, damage, and modal behaviors. Int. J. Non-Linear Mech. 2025, 175, 105118. [Google Scholar] [CrossRef]
  12. Yang, N.; Yang, D.-d.; Yu, X.-c.; Xu, C. Multi-omics-driven development of alternative crops for natural rubber production. J. Integr. Agric. 2023, 22, 959–971. [Google Scholar] [CrossRef]
  13. Sun, S.; Yang, L.; Shi, X.; Yu, X.; Xu, Z.; Song, Y.; Zuo, M.; Zheng, Q. Influence of axial pressure on the Payne effect of natural rubber vulcanizates. Polymer 2024, 303, 127103. [Google Scholar] [CrossRef]
  14. Zhao, L.; Zeng, R.; Ding, L.; Xing, P.; Xin, Z.; Qiu, J.; Gui, H. Practices of six-day tapping system for enhanced natural rubber yield and quality in China. Ind. Crops Prod. 2025, 224, 120343. [Google Scholar] [CrossRef]
  15. Markovic, D.; Cvetkovic, D.; Masic, B. Survey of software tools for energy efficiency in a community. Renew. Sustain. Energy Rev. 2011, 15, 4897–4903. [Google Scholar] [CrossRef]
  16. Singh, S.; Nimmo, W.; Gibbs, B.M.; Williams, P.T. Response to the comment by J.C. Jones on ‘waste tyre rubber as a secondary fuel for power plants’. Fuel 2009, 88, 2320. [Google Scholar] [CrossRef]
  17. Hu, Y.; Liang, Y.; Wang, X.; Ren, X.; Li, Y.; Tan, D.; He, Q. Influence of contact pressure on the thermo-chemical reactions and wear mechanisms of aircraft tire tread rubber under sliding friction. Wear 2025, 578–579, 205912. [CrossRef]
  18. Wu, J.; Chen, L.; Wang, Y.; Su, B.; Cui, Z.; Wang, D. Effect of temperature on wear performance of aircraft tire tread rubber. Polym. Test. 2019, 79, 106037. [Google Scholar] [CrossRef]
  19. Liu, S.; Wang, J.; Ma, S.; Tang, W. Using Grey System Analysis Methods and Models to Achieve the Design and Optimization of Aviation Tire Rubber Formulations. J. Grey Syst. 2025, 37, 1–10. [Google Scholar]
  20. Julong, D. Grey control system. J. Huazhong Univ. Sci. Technol. 1982, 3, 9–18. [Google Scholar] [CrossRef]
  21. Shen, G.; Han, C.; Chen, B.; Dong, L.; Cao, P. Fault analysis of machine tools based on grey relational analysis and main factor analysis. J. Phys. Conf. Ser. 2018, 1069, 012112. [Google Scholar] [CrossRef]
  22. Yang, L.; Zhang, X.; Zhu, F.; Wang, Z.; Zhang, X. Semi-supervised cross-domain fault diagnosis via contrastive pre-training and annotation-efficient alignment strategy. J. Ind. Inf. Integr. 2026, 50, 101076. [Google Scholar] [CrossRef]
  23. Majumder, S. Some network optimization models under diverse uncertain environments. arXiv 2021, arXiv:2103.08327. [Google Scholar]
  24. Pal, D.; Sharma, H.K.; Prentkovskis, O.; Chakraborty, F.; Maskeliūnaitė, L. Multi-objective Windy Postman Problem in a Fuzzy Transportation Network. Promet-Traffic Transp. 2025, 37, 853–873. [Google Scholar] [CrossRef]
  25. Liu, S. Grey Systems Analysis: Methods, Models and Applications; Springer Nature: Berlin/Heidelberg, Germany, 2025. [Google Scholar]
  26. Liu, S.; Yuan, W.; Sheng, K. Multi-attribute intelligent grey target decision model. Control Decis. 2010, 25, 1159–1163. [Google Scholar] [CrossRef]
  27. Zhang, W.; Wang, H. A Weighted Multi-objective Grey Target Decision Model for Selecting an Optimum ESCO. Chin. J. Manag. Sci. 2019, 27, 179–186. [Google Scholar] [CrossRef]
  28. Li, Q.; Liu, S.F. Grey target decision model for two-stage equipment maintenance strategy selection. Control Decis. 2023, 38, 1712–1720. [Google Scholar] [CrossRef]
  29. Yang, Y.; Tan, P. The Application of Supplier Selection in Green Supply Chain Based on Multi-objective Intelligent Weighted Grey Target Decision. J. North China Inst. Water Conserv. Hydroelectr. Power 2012, 33, 137–139. [Google Scholar] [CrossRef]
  30. Dai, L.; Lei, S.; Zhou, W. The Application of GIS and Grey Decision-making Method in the Site Selection of Emergency Shelters. China Emerg. Rescue 2016, 21–25. [Google Scholar] [CrossRef]
  31. Xie, W.; Liu, B. Application of Multi-attribute Intelligent Weight Grey Target Decision Model in Military Transportation Mode Selection. J. Mil. Transp. Univ. 2016, 18, 15–19. [Google Scholar] [CrossRef]
  32. Liang, B.; Qin, B.; Sun, W. The application of intelligent weighting grey target decision model in the assessment of coal-gas outburst. J. China Coal Soc. 2013, 38, 1611–1615. [Google Scholar] [CrossRef]
  33. Xie, Q.; Zhao, H. Application Research of Air Conditioning Equipment Maintenance Decision based on Multi-attribute Gray Target. Equip. Manuf. Technol. 2015, 100–103. [Google Scholar] [CrossRef]
  34. Li, R.; Jiang, Z.; Ji, C.; Li, A.; Yu, S. An improved risk-benefit collaborative grey target decision model and its application in the decision making of load adjustment schemes. Energy 2018, 156, 387–400. [Google Scholar] [CrossRef]
  35. Gao, C.; Cui, X. Landslide risk assessment based on multi-index weighted grey target decision model. J. Cent. South Univ. (Sci. Technol.) 2016, 47, 524–530. [Google Scholar] [CrossRef]
  36. Sattayanurak, S.; Sahakaro, K.; Kaewsakul, W.; Dierkes, W.K.; Reuvekamp, L.A.E.M.; Blume, A.; Noordermeer, J.W.M. Synergistic effect by high specific surface area carbon black as secondary filler in silica reinforced natural rubber tire tread compounds. Polym. Test. 2020, 81, 106173. [Google Scholar] [CrossRef]
  37. Sethuraj, M.R.; Mathew, N.T. Natural Rubber: Biology, Cultivation and Technology; Elsevier: Amsterdam, The Netherlands, 2012; Volume 23. [Google Scholar]
  38. ASTM D1646–19a; Standard Test Methods for Rubber—Viscosity, Stress Relaxation, and Pre-Vulcanization Characteristics (Mooney Viscometer). ASTM International: West Conshohocken, PA, USA, 2019. [CrossRef]
  39. ASTM D3194–17; Standard Test Method for Rubber from Natural Sources—Plasticity Retention Index (PRI). ASTM International: West Conshohocken, PA, USA, 2022. [CrossRef]
  40. Sarkawi, S.S. Silica-reinforced deproteinized natural rubber. In Silicon Materials; IntechOpen: London, UK, 2019. [Google Scholar]
  41. ASTM D412–16; Standard Test Methods for Vulcanized Rubber and Thermoplastic Elastomers—Tension. ASTM International: West Conshohocken, PA, USA, 2021. [CrossRef]
  42. ASTM D624–00; Standard Test Method for Tear Strength of Conventional Vulcanized Rubber and Thermoplastic Elastomers. ASTM International: West Conshohocken, PA, USA, 2020. [CrossRef]
  43. Zhang, H.; Zhang, Z.; Zhao, G.; Liu, Y.; Li, Y.; Shou, J.; Bai, L. Influence of fillers on semi-efficient vulcanized natural rubber: Dynamic properties and heat buildup. Rubber Chem. Technol. 2015, 88, 412–420. [Google Scholar] [CrossRef]
  44. ASTM D813-07; Standard Test Method for Rubber Deterioration—Crack Growth. ASTM International: West Conshohocken, PA, USA, 2025. [CrossRef]
  45. ASTM D5963-22; Standard Test Method for Rubber Property—Abrasion Resistance (Rotary Drum Abrader). ASTM International: West Conshohocken, PA, USA, 2022. [CrossRef]
  46. Xie, M.; Yao, H.; Zhao, Z. Failure analysis on tread throw of the tire of B737-800 airplane. Eng. Fail. Anal. 2011, 18, 789–796. [Google Scholar] [CrossRef]
  47. Rodgers, M.B. Rubber Tires. In Encyclopedia of Materials: Science and Technology; Buschow, K.H.J., Cahn, R.W., Flemings, M.C., Ilschner, B., Kramer, E.J., Mahajan, S., Veyssière, P., Eds.; Elsevier: Amsterdam, The Netherlands, 2001; pp. 1–5. [Google Scholar] [CrossRef]
  48. Rodgers, B.; Waddell, W. Chapter 9-The Science of Rubber Compounding. In The Science and Technology of Rubber, 4th ed.; Mark, J.E., Erman, B., Roland, C.M., Eds.; Academic Press: Cambridge, MA, USA, 2013; pp. 417–471. [Google Scholar] [CrossRef]
  49. Hagag, A.M.; Yousef, L.S.; Abdelmaguid, T.F. Multi-criteria decision-making for machine selection in manufacturing and construction: Recent trends. Mathematics 2023, 11, 631. [Google Scholar] [CrossRef]
Figure 1. Multi-attribute weighted intelligent grey target decision model.
Mathematics 14 01588 g001
Figure 2. Tire cross-sectional view.
Mathematics 14 01588 g002
Table 1. Basic performance data of natural rubber crude.
Property [37]
(Test Standard)
Malaysia SMR V60Indonesia SIR 20Thailand STR 20Vietnam SVR 3LHainan, China SCR WFYunnan,
China SCR WF
Mooney Viscosity [ML(1 + 4)100 °C] [38]628286767776
Plasticity Retention Index PRI, % [39]786260526866
Number-Average Molecular Weight Mn (×105 g/mol) (GPC)1.151.251.221.181.201.18
Molecular Weight Distribution Mw/Mn (GPC)2.303.043.072.752.672.67
Gel Content, %83532251518
Table 2. Comparative analysis of static mechanical properties for vulcanizates.
Property [40]
(Test Standard)
Malaysia SMR CV60Indonesia SIR 20Thailand STR 20Vietnam SVR 3LHainan, China SCR WFYunnan,
China SCR WF
Tensile Strength, MPa [41]29.528.028.226.528.528.3
Elongation at Break, % [41]620590595570605600
Tear Strength, kN/m [42]424041373938.5
Table 3. Dynamic/durability performance data for vulcanizates.
Property [43]
(Test Standard)
Malaysia SMR CV60Indonesia SIR 20Thailand STR 20Vietnam SVR 3LHainan, China SCR WFYunnan,
China SCR WF
Tan δ @ 0 °C (Dynamic Mechanical Analysis)0.2550.2450.2480.2350.2500.248
Tan δ @ 60 °C (Dynamic Mechanical Analysis)0.0950.1050.1030.1100.0980.100
Heat Build-up, °C 283534383031
DeMattia Crack Growth, k cycle [44] 155120125110140135
DIN Abrasion Volume, mm3 [45]105115112125108110
Note: The data are simulated values based on a unified benchmark formulation and curing conditions.
Table 4. Main parameters of the Boeing 737-800 aircraft.
Parameter CategoryKey IndicatorValueEngineering Significance for Aircraft Tire
Selection and Use
Weight ParametersMaximum Take-off Weight (MTOW)79,010 KgDirectly determines the maximum load the tires must bear, serving as the primary basis for tire size, ply rating, and inflation pressure design. A higher weight demands greater load-bearing capacity.
Maximum Landing Weight (MLW)66,360 KgDetermines the impact load on the tires at the instant of landing, directly influencing the required impact strength, tear strength, and durability of the tread and carcass compounds.
Maximum Taxi Weight (MTW)79,245 KgAffects the tires’ sustained load-bearing capacity during ground taxiing.
Standard Operating Empty Weight (SOEW)41,413 KgProvides the aircraft’s basic weight for calculating the load distribution from payload and fuel onto the tires.
Speed ParametersMaximum Cruise Speed876 km/hIndirectly reflects the overall performance grade of the aircraft. Correspondingly high take-off and landing speeds impose requirements on the tire’s speed rating.
Landing Approach Speed240–278 km/hThe tires are accelerated from rest to this speed upon landing, causing intense friction between the tread and runway. This represents the core service condition governing tread compound wear resistance and heat dissipation capability.
Take-off, Landing and Runway ParametersTake-off Field Length (TOFL)2027 mThe take-off rolls distance influences the duration of sustained accelerated rolling, relating to heat generation and wear.
Landing Field Length (LFL)1327 mThe landing roll distance, especially under braking action, is one of the operating conditions generating the highest thermal load on tires, placing extreme demands on heat resistance and anti-reversion properties.
Required Landing Distance (RLD)1646 mComprehensively reflects the aircraft’s landing performance and is related to the braking effectiveness and durability of the tires.
Power and Geometric ParametersEngine Ground Clearance460 mmConstrains the maximum allowable outer diameter of the main tires, serving as a critical boundary condition for tire size design.
Engine Model & ThrustCFM56-7B (Max Thrust: 27,300 lbf)Engine thrust affects acceleration during take-off and torque during reverse-thrust braking, indirectly influencing the tire’s traction and braking adhesion.
Fuselage Height4.01 mAffects the aircraft’s center of gravity height, indirectly influencing the lateral forces acting on the tires during ground taxiing.
Data Source: Civil Aviation Resources Network of China (CARNOC) link: https://data.carnoc.com/aircraft/type/list/124.html (accessed on 10 November 2025).
Table 5. Simulated performance values for key components of the Boeing 737-800 main tire.
Performance IndicatorIdeal TreadIdeal ShoulderIdeal SidewallIdeal CarcassRationale for Specification
DIN Abrasion Volume (mm3)≤100≤115≤120≤130The tread is in direct contact with the ground, requiring the most stringent specification.
Tear Strength (kN/m)≥45≥44≥40≥35Progressive requirements for damage resistance.
Tan δ @ 60 °C≤0.090≤0.088≤0.085≤0.080Progressive requirements for low heat generation.
Tan δ @ 0 °C≥0.260≥0.255≥0.240≥0.200Progressive requirements for wet traction.
Mooney Viscosity [ML(1 + 4)100 °C]65 ± 570 ± 568 ± 572 ± 5Requirements for process adaptability.
Plasticity Retention Index PRI (%)≥75≥70≥68≥65Progressive requirements for heat aging resistance.
Table 6. Decision objectives for the Boeing 737-800 main tire tread.
No.Decision Objective (k)UnitObjective TypeRemarks
1DIN Abrasion Volumemm3Cost-oriented ObjectiveQuantitative
2Tear StrengthkN/mBenefit-oriented ObjectiveQuantitative
3Tan δ @ 60 °C--Cost-oriented ObjectiveQuantitative
4Tan δ @ 0 °C--Benefit-oriented ObjectiveQuantitative
5Mooney ViscosityMLModerate-type ObjectiveQuantitative
6Plasticity Retention Index--Benefit-oriented ObjectiveQuantitative
Table 7. Statistical table of decision weights for the main tire tread objectives of Boeing 737-800.
No.Decision Objective (k)Weight (η)
1DIN Abrasion Volume0.18
2Tear Strength0.09
3Tan δ @ 60 °C0.04
4Tan δ @ 0 °C0.40
5Mooney Viscosity0.06
6Plasticity Retention Index0.23
Table 8. Statistical table of objective effect samples for the main tire tread of Boeing 737-800.
Decision ObjectiveMalaysia SMR CV60Indonesia
SIR 20
Thailand STR 20Vietnam SVR 3LHainan, China SCR WFYunnan, China SCR WF
DIN Abrasion Volume105115112125108110
Tear Strength424041373938.5
Tan δ @ 60 °C0.0950.1050.1030.1100.0980.100
Tan δ @ 0 °C0.2550.2450.2480.2350.2500.248
Mooney Viscosity628286767776
PRI786260526866
Table 9. Natural rubber selection recommendations for the shoulder, sidewall, and carcass of Boeing 737-800 tires.
ComponentDecision ObjectivesUnitObjective TypeRecommended Selection
ShoulderTear StrengthkN/mBenefit-orientedMalaysia SMR CV60
DeMattia Crack GrowthkcyclesBenefit-oriented
Compression Heat Build-up°CCost-oriented
SidewallDeMattia Crack GrowthkcyclesBenefit-orientedYunnan, China SCR WF
Elongation at Break%Benefit-oriented
Heat Build-up (ΔT)°CCost-oriented
CarcassCompression Heat Build-up°CCost-orientedMalaysia SMR CV60
Heat Build-up (ΔT)°CCost-oriented
Tensile StrengthMPaBenefit-oriented
Table 10. Summarizes the final ranking of the six natural rubber brands.
Natural Rubber BrandTreadShoulderSidewallCarcass
Malaysia SMR CV601121
Indonesia SIR 205444
Thailand STR 204333
Vietnam SVR 3L6666
Hainan, China SCR WF2555
Yunnan, China SCR WF3212
Table 11. The outcomes for all perturbation scenarios.
Weight w 4 Comprehensive Effect MeasureMaximum Value
w b a s e 0.4[0.9520, −0.0604, 0.1009, −0.9160, 0.4031, 0.2290]SMR CV60
w b a s e − 30%0.28[0.9424, −0.0725, 0.0610, −0.9192, 0.3837, 0.2148]SMR CV60
w b a s e − 20%0.32[0.9456, −0.0684, 0.0742, −0.9048, 0.3900, 0.2195]SMR CV60
w b a s e − 10%0.36[0.9488, −0.0645, 0.0877, −0.9104, 0.3967, 0.2244]SMR CV60
w b a s e + 10%0.44[0.9552, −0.0563, 0.1140, −0.9216, 0.4094, 0.2337]SMR CV60
w b a s e + 20%0.48[0.9594, −0.0526, 0.1271, −0.9282, 0.4164, 0.2386]SMR CV60
w b a s e + 30%0.52[0.9616, −0.0483, 0.1407, −0.9328, 0.4225, 0.2432]SMR CV60
Disclaimer/Publisher’s Note: The statements, opinions and data contained in all publications are solely those of the individual author(s) and contributor(s) and not of MDPI and/or the editor(s). MDPI and/or the editor(s) disclaim responsibility for any injury to people or property resulting from any ideas, methods, instructions or products referred to in the content.