Abstract
Improving the fuel economy of electric buses requires traction motors that provide not only high-power density but also high efficiency under diverse driving conditions. While high slot fill factor (HSFF) coils such as the maximum slot occupation (MSO) coil improve motor torque and power density, they inevitably increase AC copper losses due to elevated AC resistance, especially at high speeds. Unlike conventional motor optimization studies that mainly focus on efficiency at specific operating points, this paper proposes a drive-cycle-aware design optimization method that minimizes AC copper loss to enhance real-world fuel economy. By combining 2D finite element analysis (FEA) with vehicle-level simulations under three representative driving cycles (Manhattan, HWFET, HDUDDS), an optimal motor design was derived. The optimized motor achieved improvements in fuel economy by 0.20%, 0.86%, and 0.36%, respectively, compared to the initial design. Experimental validation through prototype fabrication confirmed the effectiveness of the proposed method. These results demonstrate that the proposed design approach can contribute to improving energy efficiency and reducing operational costs in electric bus applications.
Keywords:
AC copper loss; electric bus; fuel economy; optimal design; traction motor; vehicle simulation MSC:
49S05
1. Introduction
Recently, along with the rapid development of electric vehicles, various related studies have been conducted. In [1], an analysis of domain- and zone-based automotive architecture topologies with vehicle-centralized or controller-based mappings was conducted. Reference [2] proposed the practical methodology for security analysis of grid-connected electric vehicle charging stations with wind-generating resources. Reference [3] proposed a decentralized resource allocation mechanism based on deep reinforcement learning. Reference [4] proposes a method to enhance the fuel efficiency (FE) of an electric vehicle by altering the winding connection in a wound field synchronous motor. In addition, recent studies have explored the optimization of thermal management in electric vehicle powertrain systems to further improve energy efficiency and overall vehicle performance [5]. Among various studies, there is also a method to improve mileage, which has been pointed out as a problem in terms of electric vehicle (EV) supply [6]. In terms of components, various studies are being conducted on improving the power density and efficiency of a traction motor to improve EV mileage [7].
Proposals for increasing the power density of the motor have included coil technologies [8,9,10]. The slot fill factor (SFF) of the winding is directly related to the area of the slot and consequently affects the volume of the motor. Essentially, the utilization of high slot fill factor (HSFF) coils, as discussed in reference [11], contributes to the enhancement of the motor’s power density. A representative coil technology developed due to the demand for HSFF coils is hairpin winding. Hairpin windings have a SFF of about 60% and are applied to motors in various automotive industries [11,12]. The maximum slot occupation (MSO) coil developed by The Korea Institute of Industrial Technology (KITECH) is also one of the HSFF coils, like hairpin winding. By cutting copper blocks to match the slot’s form, MSO coils can achieve a SFF of up to 80%. Thus, applying MSO coils to the motor can lead to an enhancement in the motor’s power density.
However, HSFF coils have a large area of the conductor, resulting in large AC resistance due to skin and proximity effects at high frequencies [13]. The motor encounters difficulties in achieving high efficiency because AC resistance leads to additional losses commonly referred to as AC copper loss within the motor. For this reason, the use of HSFF coils can help to improve the power density, but it is difficult to achieve high efficiency. Therefore, to achieve high efficiency as well as the high-power density of the motor using HSFF coils, AC resistance must be considered when designing the motor.
Several papers have reported methods for reducing AC copper loss. Reference [14] reported a decrease in AC copper loss, achieved through the winding transposition techniques. Reference [13] discussed strategies involving the arrangement of the strands bundle to reduce AC copper loss. Reference [15] reported a winding technique aimed at minimizing the AC copper loss of a hairpin winding. However, these methods are not suitable for application in the motor using MSO coils. For this reason, a method for reducing AC copper loss that is suitable for MSO coils has been recently reported. Reference [16] reported the trend of AC resistance of MSO coils according to the current density and the number of parallel circuits. Reference [17] reported a method of decreasing the AC copper loss of MSO coils through the optimal design of the tooth width. However, no research has been conducted on the optimal design that takes AC copper loss into account to enhance the FE of the EV.
The purpose of this paper is to enhance the electric bus’s FE by optimizing the traction motor while considering its AC copper loss. First, the influence of the traction motor design variables on its electrical performance is analyzed. Second, a multi-objective optimization is performed using energy consumption as an objective function. Three driving cycles are selected to represent different operational purposes of the bus.
In this study, an optimal design method to increase FE considering AC copper loss of motor for the electric bus traction using the MSO coil is proposed. First, the specifications and issues of electric bus traction motors using MSO coils will be described. Next, the effect of design variables on electrical performance is checked through 2D finite element analysis (FEA). Tooth width and slot opening width are stator design variables related to the slot leakage flux. The slot leakage flux affects the AC resistance, so the tooth width and slot opening width are important stator design variables. Since AC resistance occurs almost on the coil side, the stack length is also an important design variable. Third, a multi-objective optimization for improving the FE of electric buses is conducted. Three driving cycles have been selected to consider the various purposes of the electric bus. The energy consumption according to the driving cycle is defined as an objective function. Additionally, this study conducts a comparative analysis of the FE of electric buses with respect to both the initial motor and the optimal motor resulting from the multi-purpose optimal design. Finally, an optimal motor is fabricated and subjected to testing procedures to validate this study.
2. Electric Bus and Initial Motor for Traction
A bus terminal is a place where all buses begin or end a designated route. For this reason, the bus is more advantageous than the passenger vehicle in applying the electric powertrain system because the battery-charging device only needs to be installed at the bus terminal. Due to this advantage, research is being conducted to replace the powertrain of the bus with an electric system consisting of a motor and inverter instead of an internal combustion engine.
2.1. Initial Motor for Electric Bus Traction
Figure 1 shows the shape of an initial motor, which is an Interior Permanent Magnet Synchronous Motor (IPMSM) using an MSO coil. The initial motor applying the MSO coil is designed for electric bus traction. Reference [18] introduces the MSO coil as one of several coil types developed to enhance the SFF. The bare SFF of the MSO coil is up to 80% because the copper block is cut according to the form of the slot, unlike other coils. An advantage of HSFF coils is that they help to achieve high-torque density or high-power density of the motor. However, at high-speed operation, the large area of the conductor causes AC resistance. For this reason, the motor encounters difficulties in achieving high efficiency because AC resistance leads to additional losses that are commonly referred to as AC copper loss within the motor.
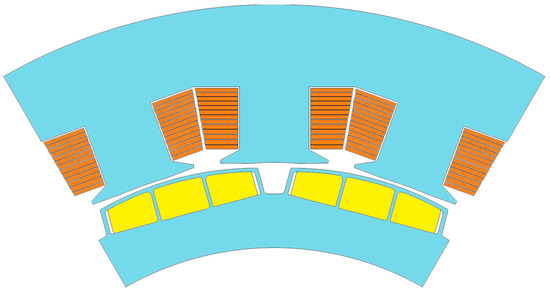
Figure 1.
The shape of the initial motor using MSO coil.
Table 1 provides the specifications of the initial motor intended for electric bus traction. For electric bus traction, the motor is required to deliver a maximum torque of 800 Nm, maximum power output of 130 kW, and operate at a maximum speed of 5200 rpm.

Table 1.
Specification of initial motor.
2.2. Issue of Initial Motor for Electric Bus Traction
In general, buses serve three primary purposes: transit, express, and suburban. Each type of bus is tailored to specific operational requirements:
- Transit bus: Designed to operate between short stops within downtown areas.
- Express bus: Intended for long-distance travel between cities, typically covering extensive routes.
- Suburban bus: Geared towards medium-length journeys within metropolitan areas, serving commuters traveling to and from suburban locations.
To summarize the characteristics of the bus, the bus drives at a low or high speed, depending on the purpose. Therefore, it is necessary to design the motor in consideration of all purposes of the bus. As mentioned in Section 2.1, due to the high fill factor of the MSO coil, the initial motor causes additional losses due to AC resistance when operating at a high speed. AC copper loss, which is the additional loss caused by AC resistance, worsens fuel efficiency. The FE is expressed as (1) and obtained by dividing the total driving distance by the total energy consumption. The total energy consumption is obtained as the integral of the input power with respect to time. As shown in (2), the input power is obtained using the output power, the motor efficiency, the inverter efficiency, and the battery efficiency. At this time, the motor efficiency is obtained using the output power and the losses, including the AC copper loss and the iron loss, as indicated in (3). Therefore, an increase in AC resistance results in greater AC copper loss and reduced motor efficiency. The reduced motor efficiency, in turn, increases the input power required for motoring and decreases the input power during the generating operation. Consequently, the FE deteriorates. Conversely, it can be concluded that the reduction in the AC copper loss, which is the design target of this paper, leads to an increase in the FE. Hence, given that buses operate at varying speeds depending on their purpose, from low speed to high speed, it is imperative to design the motor while considering AC copper loss to enhance the FE of electric buses.
where Vv is the vehicle speed, Pin is the input power, Pout is the output power, ηM is the motor efficiency, ηInv is the inverter efficiency, and ηBat is the battery efficiency. Pcopper,AC represents the AC copper loss, Piron is the iron loss, and TM is motor torque.
3. Stator Design Variables Affecting Efficiency of Motor Using High Fill Factor Coil
This section describes the design variables that affect the efficiency of motors using HSFF coils. First, the reason for analyzing the AC resistance of the motor through 2D FEA due to the limitation of the AC resistance coefficient formula is explained. Next, the influence of tooth width and slot opening width, which are design variables that affect the AC copper loss of a motor using HSFF coils through 2D FEA, is investigated. Finally, the tendency of the torque, copper loss, and line-to-line induced voltage with the change in the design variable were examined to confirm.
3.1. Limitation of Analytical Method for Predicting AC Resistance
Under DC current conditions, the current density in the conductor is uniform. However, under AC current conditions, the voltage induced by the magnetic flux passing through the conductor causes an imbalance in the current density distribution in the conductor [19]. As illustrated in Figure 2a, the current density in the conductor is not uniform for the area of one conductor and is concentrated in a specific area like the red square in Figure 2a. In particular, this phenomenon is remarkable in conductors close to the air gap. The imbalance of the current density, which occurs within one conductor, increases the copper loss because the concentrated areas in the current density have a greater effect on the copper loss than the unconcentrated areas. In addition, the larger the cross-section area of the conductor, the larger the concentrated areas in the current density are, and the more severe imbalance of the current density is. As referenced in [15], larger conductor areas correspond to increased AC copper loss. In addition, as shown in Figure 2a, the current density distribution of the conductor far from the air gap is constant in the horizontal direction and changes in the vertical direction. However, the current density distribution of the conductor close to the air gap is not similar to the current density distribution of the conductor far from the air gap. This is because the leakage magnetic flux flows through the arc-shaped path due to the tooth tip shape, as presented in Figure 2b. These results imply that not only the slot width but also the tooth tip shape affects the AC copper loss.
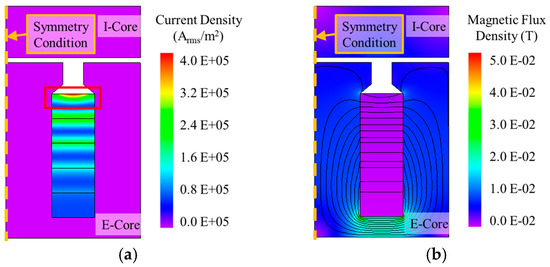
Figure 2.
Time-harmonic analysis results of the E- and I-shaped cores: (a) current density; (b) magnetic flux density and magnetic flux line.
The AC resistance coefficient is a value obtained by dividing the AC resistance by the DC resistance and is a representative coefficient representing the effect of the AC resistance [19]. From [17], it was confirmed that the AC resistance coefficient calculated through the time-harmonic analysis and formula is almost similar. However, the formula for predicting the AC resistance coefficient has the following disadvantages:
- It ignores the influence of field flux.
- Slot leakage magnetic flux generated by the field cannot be reflected.
- It ignores the nonlinearity of the iron core.
- It is impossible to reflect the magnetic flux of leakage in the slot that changes due to the nonlinearity of the stator core.
- Assume that the slot leakage magnetic flux flows horizontally with the air gap.
- It is not possible to accurately reflect the path of the leakage magnetic flux flowing through the arc-shaped path due to the tooth tip.
Due to the above assumptions of the formula for predicting AC resistance, it is difficult to calculate the accurate characteristics of the AC copper loss of the motor through the formula. For this reason, it is necessary to analyze the tendency of AC copper loss through 2D FEA.
3.2. Determination of Design Variables Considering Electric Performance
In this section, the design variables that affect torque and copper loss are defined for the optimization process described in Section 4.3. The design variables are determined by analyzing the trend of motor performance, as the tooth width and slot opening width are varied. This analysis utilizes the results of the 2D FEA, conducted at both the base speed and maximum speed of the initial motor, exploring the impact of the changes in these dimensions on motor performance. When the stator design parameters change, the area of the slot remains constant. Reducing the tooth width while preserving the area of the slot results in the widening of both the yoke width and the slot width. Consequently, the form of the coil adjusts accordingly in response to alterations in the slot form, reflecting the unique characteristics of the MSO coil. In addition, when motor performance according to the change in one design variable is examined, the other variable is kept constant to independently examine the influence of each design variable.
The motor performance to be checked in common at base speed and maximum speed is torque and copper loss. Moreover, at the maximum speed, the peak value of line-to-line induced voltage was additionally checked. At high speeds, since the harmonic component of the induced voltage is remarkable, the line-to-line induced voltage may exceed the DC-link voltage. Due to this phenomenon, sinusoidal current cannot be input in the motor and additional torque ripple may occur due to the current containing harmonics component. This is the reason the line-to-line voltage at the maximum speed is checked.
Figure 3 illustrates the motor performance with varying tooth widths under the condition that the slot opening width is maintained at 15 mm. As shown in Figure 3, when checking motor performance through 2D FEA, the magnitude and phase angle of the current are (500 Arms, 10°) and (350 Arms, 65°) at the base and maximum speed, respectively. Figure 3a presents the torque and copper loss at the base speed, and Figure 3b shows the torque, copper loss, and peak values of line-to-line induced voltage at the maximum speed. Figure 3 depicts several key parameters as follows: the torque is represented by the black line, the copper loss by the red dotted line, the peak value of line-to-line induced voltage by the blue dashed line, and the maximum torque required by the electric bus system, accounting for manufacturing tolerances, is illustrated by the green line with rectangular symbols. To consider potential deviations in the motor performance due to manufacturing tolerances, the target torque was established at 105% of the maximum torque. As the tooth width increases, the torque tends to increase up to a certain dimension, after which it starts to decrease. However, the copper loss decreases and then increases. At the base speed, there is little variation in copper loss between the tooth widths ranging from 30 to 40 mm, all of which fulfill the maximum torque requirement of the electric bus system. Conversely, at maximum speed, there is a noticeable trend of continuous increase in copper loss as the tooth width increases within the range of 30 to 40 mm. Here, the difference between the maximum and minimum copper losses is approximately 61%. In addition, the peak value of line-to-line induced voltage at maximum speed increases and then decreases as the tooth width increases and is largest at 38 mm of the tooth width. Also, 38 mm of the tooth width is the point generating the largest torque at the base speed.
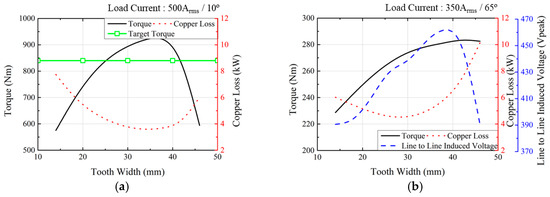
Figure 3.
Electric performance according to tooth width: (a) base speed and (b) maximum speed.
Figure 4 depicts the motor performance according to the slot opening width. At this time, the tooth width is fixed to 30 mm. As demonstrated in Figure 4, the current condition is the same as when examining the motor performance according to the tooth width. Figure 4a shows the tendency of torque and copper loss at the base speed, and Figure 4b illustrates the torque, copper loss, and peak values of line-to-line induced voltage at maximum speed. In Figure 4, the black line is the torque, the red dotted line is the copper loss, the blue dashed line is the peak value of line-to-line induced voltage, and the green line with a rectangular symbol is the target torque considering manufacturing tolerances. Figure 4a shows that it is not more dramatic than the tendency of torque or copper loss according to the change in tooth width. However, as can be seen from Figure 4b, the slot opening width greatly affects the copper loss or peak value of line-to-line induced voltage at maximum speed. The copper loss and the peak value of the line-to-line induced voltage are the smallest at 11 mm of slot opening width.
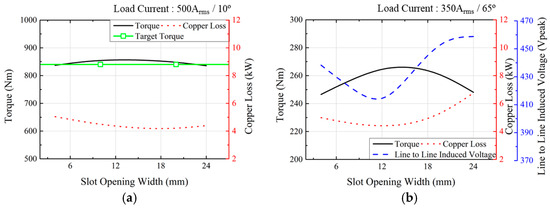
Figure 4.
Electric performance according to slot opening width: (a) base speed and (b) maximum speed.
Through the above analysis, the tooth width and slot opening width affect the torque, the copper loss, and the peak value of the line-to-line induced voltage. Although not included in the above analysis, the stack length is also one factor that influences the torque, the copper loss, and the peak value of the line-to-line induced voltage. The stack length proportionally affects the torque, AC resistance, and line-to-line induced voltage under the same current condition. As the stack length increases, the effective magnetic flux, conductor length, and flux linkage also increase proportionally, resulting in a linear increase in torque, AC resistance, and induced voltage. Therefore, the stack length is also added as a design variable, and according to the design variables, such as the tooth width, the slot opening width, and the stack length, the optimal design to improve the FE of the electric bus is performed.
4. Multi-Objective Optimization Design for Improving Fuel Economy
This section presents the motor multi-objective optimization design method and its results for enhancing the FE of the electric bus. First, a vehicle simulation model is introduced to evaluate the FE based on the motor’s electrical performance. Next, the optimization design process applied to the motor is described in detail. Finally, the performance of the optimized motor is compared with that of the initial motor.
The overall procedure of the proposed multi-objective optimization is illustrated in Figure 5. The detailed steps are summarized as follows:
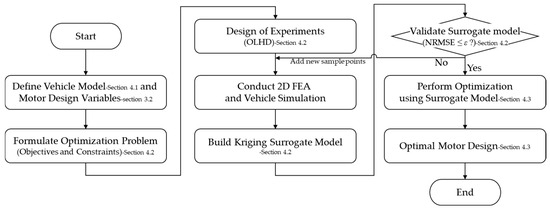
Figure 5.
Flowchart of the proposed multi-objective optimization process for the motor design.
- Define the vehicle model and motor design variables.
- Formulate the optimization problem (objectives and constraints).
- Design of the experiments using the optimal Latin hypercube design (OLHD).
- Conduct 2D FEA and vehicle simulation to obtain results.
- Build a Kriging surrogate model.
- Validate the surrogate model.
- Perform optimization using a surrogate model.
- Obtain an optimal motor design.
4.1. Vehicle Simulation for Calculating Fuel Economy of Electric Bus
Vehicle simulation is a method used to calculate the fuel economy (FE) of a vehicle under specific driving conditions. It enables the evaluation of how various component designs and control strategies impact the overall vehicle’s performance without the need for full-scale experiments. In this study, the vehicle simulation model is developed using the ADVISOR platform, a widely validated simulation tool created by the National Renewable Energy Laboratory (NREL) [20]. To ensure accurate simulation results, the model reflects the specifications of the target vehicle and its major components, including the motor, inverter, gear, and battery, as well as the intended driving cycles. All major parameters, such as vehicle mass, frontal area, wheel radius, gear ratio, inverter efficiency, and battery characteristics, are set according to the actual specifications of the target electric bus. The motor efficiency map is generated from 2D finite element analysis (FEA) results and experimentally validated data to accurately represent the motor’s electrical performance under various operating conditions. Figure 6 shows a schematic diagram of the vehicle simulation process used to calculate the fuel economy by considering the drive cycle and system characteristics. Through this modeling approach, the established vehicle simulation model reliably reflects the real-world performance characteristics of the electric bus system. This ensures that the subsequent fuel economy evaluation and optimization results are based on a realistic and credible framework.

Figure 6.
Schematic diagram of the vehicle simulation process.
4.1.1. Longitudinal Vehicle Dynamics
Figure 7 depicts the dynamic force diagram of a vehicle. As shown in Figure 7, there is a rolling resistance, air resistance, and gradient resistance as the resistance forces applied to the vehicle. According to vehicle longitudinal dynamics, the torque demand at the wheel can be calculated as:
where Tw is the torque demand at the wheel, FR is the rolling resistive force, FG is the grading resistive force, FD is the aerodynamic drag force, m is the vehicle mass, g is the gravity acceleration, fR is the rolling resistance coefficient, θ is the slope of the road, AF is the frontal area, Cd is the aerodynamics drag coefficient, v is the vehicle speed, and r is the wheel radius.
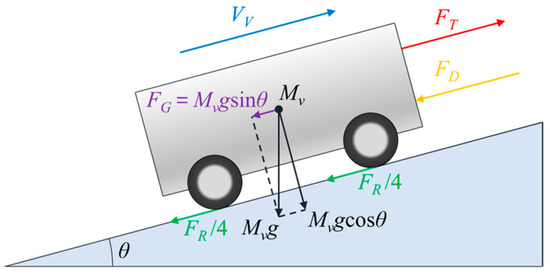
Figure 7.
Dynamic force diagram of the vehicle.
In addition, the vehicle’s powertrain provides torque demand at the wheel, and the energy balance is as follows:
where ηT is the efficiency of the gear, and ig is the gear ratio.
4.1.2. Motor Model
The motor model needs a motor efficiency map according to the rotation speed and torque to perform vehicle simulation. The efficiency of the motor is predicted over three steps [21]. First, the d- and q-axes based electrical parameters, are calculated through 2D FEA according to the magnitude and phase of the current. Next, the magnitude and phase angle of the current according to the torque and rotational speed are determined through maximum torque per ampere control. Also, the torque equation is used to determine the current condition, which is expressed below.
where pp is the number of pole-pairs, ψf is the rms value of the flux linkage by field, ioq and iod are the magnetizing q-axis and d-axis current, and Ld and Lq are the d, q-axis inductance, respectively. Here, the d- and q-axes equivalent circuit of the motor illustrated in Figure 8 is used to consider the voltage limit [22]. Finally, the motor efficiency is calculated through the copper loss and iron loss calculated by 2D FEA according to the magnitude and phase of the current.

Figure 8.
The d- and q-axes equivalent circuit of the motor: (a) d-axis; (b) q-axis.
4.1.3. Battery Model
The battery model is modeled as a 2nd RC equivalent circuit, as shown in Figure 9. Figure 10 presents the battery model parameters measured through experiments [23,24,25]. The state-space model of the battery is as follows:
where SOC represents the state of charge, i denotes the current, Cbat refers to the nominal capacity of the battery, and R and C indicate the resistance and capacitance, respectively. Further, v1 and v2 correspond to the voltages across the first and second capacitors, respectively. R0 is the ohmic resistance, and vt represents the terminal voltage. R1 and C1 are related to the first RC pair, while R2 and C2 are linked to the second RC pair.
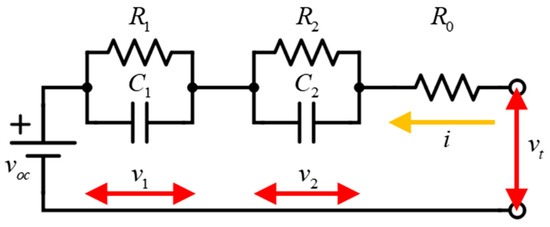
Figure 9.
Battery equivalent circuit.

Figure 10.
Battery model parameters according to SOC: (a) open circuit voltage; (b) resistance; (c) capacitance.
4.1.4. Vehicle Model and Vehicle Simulation Conditions
The target vehicle for this study is an electric bus. Table 2 outlines the specifications of the electric bus, and Table 3 delineates the vehicle simulation conditions. The gear and inverter are both expected to operate with an efficiency of 95%.

Table 2.
Specification of electric bus traction.

Table 3.
Drive condition.
As explained in Section 2.2, the bus is used for three purposes: transit bus, express bus, and suburban bus. In this study, three driving cycles were selected to conduct the multi-objective optimization design of the motor to improve FE, considering all three purposes of the bus. Figure 11 depicts the target driving cycle. The Manhattan cycle was chosen considering that the electric bus was used as a transit bus because it was developed for the FE test of the transit bus, and HWFET was developed for the highway driving test, so it was selected to consider the case where the electric bus was used as an express bus. The suburban bus has the characteristics of a transit bus and an express bus at the same time. Because HDUDDS reflects the driving characteristics of both the Manhattan cycle and HWFET, it is chosen as a driving pattern of the suburban bus. Thus, based on the depicted driving cycle in Figure 11, a multi-objective optimization design of the motor is conducted with the aim of enhancing the FE of the electric bus.

Figure 11.
Target driving cycle: (a) Manhattan; (b) HWFET; (c) HDUDDS.
4.2. Multi-Objective Optimization Formulation
As discussed in Section 3, the consideration of AC resistance is crucial when designing motors applying HSFF coil. The form of the stator, as previously mentioned, directly impacts AC resistance. Iron loss, as well as AC resistance is determined by the shape of the stator. In other words, it is necessary to design an appropriate stator shape to increase the efficiency of the motor. However, the motor design that improves efficiency without considering the driving point of the motor is meaningless in terms of vehicle FE. Therefore, the motor design that improves efficiency considering the driving cycle should be made to improve the FE of the electric bus.
Utilizing in-house codes, the multi-objective optimization was conducted employing the Kriging surrogate model. This optimization aimed to confirm the optimal design point across multiple driving conditions [26,27]. The energy consumption according to the driving cycle is defined as an objective function, and a multi-objective optimization model in which all objective functions are combined is defined using the desirability function to minimize energy consumption [28]. The defined objective functions and multi-objective optimization model are as follows:
where fi denotes the objective function, x is the design parameter, EManhattan, EHWFET, and EHDUDDS are the energy consumption according to the driving cycle, fo is the multi-objective optimization function, di is the individual desirability function, and wi is the weighting factor, respectively. In this paper, a genetic algorithm was employed to find the optimal design that maximizes the overall desirability. The individual desirability function, di, is expressed as follows:
where fi is the arbitrary value, and fimax and fimin are the maximum and minimum values of the objective function, respectively [29]. At this time, fimax and fimin are the maximum and minimum among the values obtained from all sample points of each objective function.
In addition to the optimization objectives, constraints have been established, taking into consideration the requirements of the vehicle. Initially, to account for potential reductions in torque due to mechanical loss or manufacturing tolerances, the target torque was set at 105% of the required torque for the vehicle system. Next, the ratio of the peak value of line-to-line induced voltage and the DC link voltage were added to the constraints at high speeds so that the inverter could flow a sinusoidal current to the motor. The constraints can be expressed as follows:
where gi is the constraint, Tbase is the maximum torque required by the vehicle system at the base speed, Tmax is the maximum torque required by the vehicle system at the maximum speed, VLL is line-to-line induced voltage, nmax denotes the maximum speed of the motor, and VDC is the DC link voltage.
Sample points for multi-objective optimization are sampled using the optimal Latin hypercube design (OLHD) [30]. The initial sample points are sampled as follows:
where ns is the number of the initial sample points, and nd is the number of the design variable.
The number of the initial sample points is selected as the boundary values of the input parameters to encompass a feasible region as widely as possible, but the initial sample points are the minimum number to compose the surrogate model. In general, since the more sample points (the higher the accuracy of the Kriging surrogate model) to determine the appropriate number of sample points, a cross-validation method is implemented to evaluate the model’s accuracy. Here, calculating the normalized root mean square error (NRMSE) is used as an evaluation index to evaluate model accuracy [6]. Based on this method, the number of sample points was determined to be 40, which is 4 times the number of the initial sample points obtained through (15).
4.3. Multi-Objective Optimization Result and Discussion
Figure 12 presents the contours of the multi-objective optimization function with respect to variations in two design variables, while the other design variable is kept constant. The direction in which the desirability function increases is indicated by an orange-colored arrow. Also, areas that satisfy the constraints are shaded. The shaded area with a dotted red border indicates the area that satisfies all the constraints. As a result, through multi-objective optimization, the tooth width, slot opening width, and stack length were determined to be 31.7 mm, 9.6 mm, and 83 mm, respectively. The optimal design point is indicated by a white circle with a black border in Figure 12.

Figure 12.
Contour plot of the multi-objective optimization function: (a) tooth width–stack length (@ slot opening width: 9 mm); (b) slot opening width–stack length (@ tooth width: 29 mm); (c) tooth width–slot opening (@ stack length: 85 mm).
Figure 13 shows the initial and optimal motors, and Table 4 lists the dimensions of each design variable according to the motor. The tooth width, slot opening width, and stacking length of the initial motor are 26 mm, 16 mm, and 90 mm, respectively, and those of the optimal motor are 31.7 mm, 9.6 mm, and 83 mm, respectively. As a result, compared to the initial motor, the optimal motor has a wider tooth width, a narrower slot opening width, and a reduced stack length.
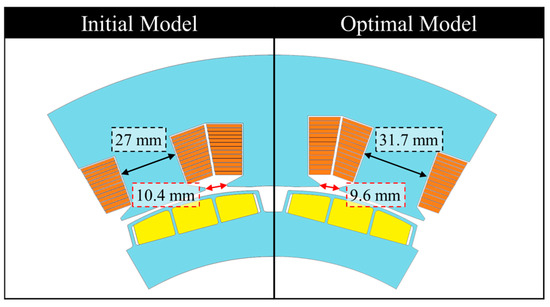
Figure 13.
The shape of the initial and optimal motors.

Table 4.
Dimension of each design variable according to the motor.
Figure 14 depicts the FE performance of the electric bus when equipped with different motors. In Manhattan, the optimized motor led to a 0.20% increase in FE, improving from 1.592 km/kWh to 1.596 km/kWh. Similar enhancements were noted in the HWFET and HDUDDS cycles. Specifically, the HWFET exhibited an increase of 0.86%, with FE rising from 1.196 km/kWh to 1.207 km/kWh. Likewise, the HDUDDS showed a 0.36% improvement, with FE increasing from 1.229 km/kWh to 1.233 km/kWh. Overall, these results indicate that the FE has improved across all driving cycles.
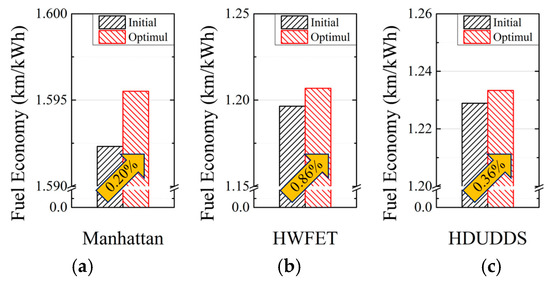
Figure 14.
Fuel economy according to motors: (a) Mahattan; (b) HWFET; (c) HDUDDS.
Considering the real-world operations of electric buses, which typically cover 200–300 km per day for about 300 days annually, the accumulated driving distance exceeds 60,000 to 90,000 km [31,32]. Even a 0.5% improvement in FE translates into annual energy savings of approximately 150–200 kWh per vehicle. This contributes to significant operational cost reductions and helps lower the environmental impact by reducing electricity consumption and the associated carbon emissions. In this optimization, design variables related to stator geometry—such as the tooth width, slot opening width, and stack length—were strategically selected and adjusted. By carefully modifying only essential parameters without major structural changes, the optimized motor achieved meaningful improvements in FE while maintaining manufacturability and cost efficiency. Given the already high baseline efficiencies of electric buses, such incremental improvements are considered valuable advancements in electric vehicle technology.
The analysis of FE improvement for each driving cycle begins with an examination of the distribution of operating points (OP) corresponding to each cycle. Figure 15 illustrates the motor operating proportion map across different driving cycles. This map aids in effectively analyzing the motor’s OPs. The heatmap visually displays the frequency of motor operation, with the darker colors indicating a higher frequency. Additionally, the bar graph illustrates the operating proportion concerning the motor’s speed or torque.
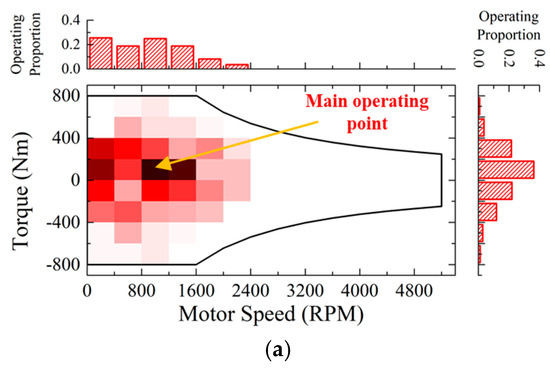
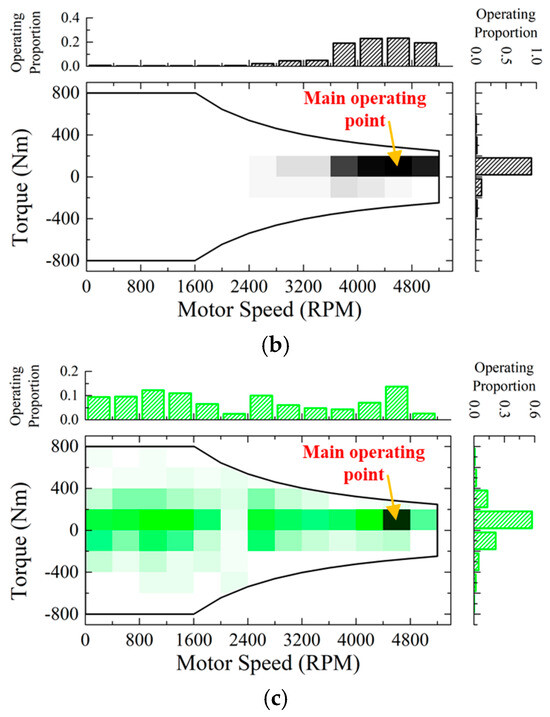
Figure 15.
Motor operating proportion map according to the driving cycles: (a) Manhattan; (b) HWFET; (c) HDUDDS.
In the Manhattan cycle, as depicted in Figure 15a, the motor’s OPs are primarily concentrated in the low-speed region, with higher torque being utilized more frequently compared to other driving cycles. The main OP is at 1000 rpm and 100 Nm. Likewise, during the HWFET cycle, the OPs are focused on a particular speed. In contrast to the Manhattan cycle, the motor mostly functions in the high-speed range. In the HWFET cycle, the main OP is at 4600 rpm and 100 Nm. In contrast, the HDUDDS cycle shows OPs distributed more evenly across the speed range, but the main OP remains the same as in the HWFET cycle at 4600 rpm and 100 Nm.
Figure 16 displays the efficiency map and the efficiency difference between the initial motor and the optimal motor, generated based on the electrical parameters obtained through 2D FEA. The efficiency of the optimal motor improved across all speed ranges compared to the initial motor, although a slight decrease was observed in the low-speed, high-torque regions. The maximum improvement in efficiency reached up to 3.62%p.
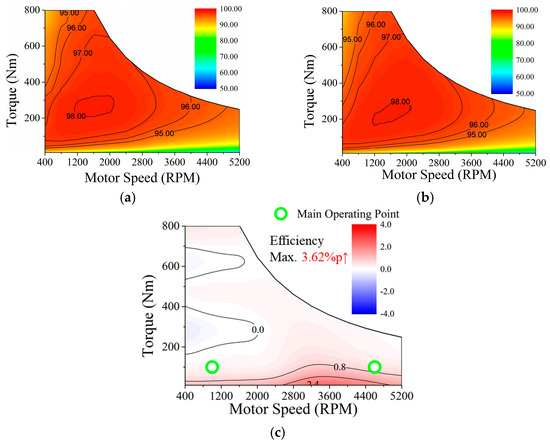
Figure 16.
Efficiency map: (a) initial motor; (b) optimal motor; (c) difference between initial and optimal motors.
As shown in Figure 15, the OPs during typical driving cycles for the electric bus are predominantly concentrated in the low-torque region. Based on this observation, the optimization strategy specifically focused on enhancing efficiency in the low-torque operating range to maximize real-world fuel economy (FE).
Therefore, the improvements observed in the low-torque regions of the efficiency map (Figure 16) are consistent with the intended optimization objectives and contribute meaningfully to the FE enhancement across all driving cycles.
In particular, the HWFET cycle exhibited a more significant improvement in FE, as the vehicle mainly operated in the high-speed, low-torque region where the efficiency of the optimal motor was further enhanced. Conversely, in the Manhattan and HDUDDS cycles, the FE improvement was less noticeable because the vehicle also operated in the low-speed, high-torque area, where the efficiency of the optimal motor was relatively reduced.
5. Experimental Verification
The validity of the proposed design method was confirmed via experiments with the fabricated optimal motor. Figure 17 shows the experiment configuration and the fabricated optimal motor. As presented in Figure 17, the pieces of equipment such as inverters, power analyzers, and dynamometers were used in the experiment. The motor was controlled with the current condition obtained through 2D FEA. To calculate the efficiency, the power analyzer recorded the input power, while the output power was determined based on data obtained from speed and torque sensors on the dynamometer. However, due to the limitations of the dynamometer, measurements were limited to only 50% of the power and torque.
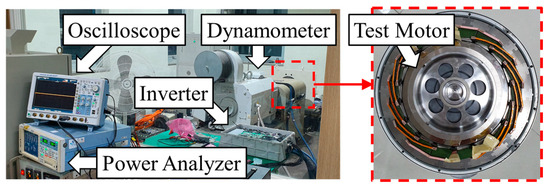
Figure 17.
Configuration of the experimental setup and fabricated optimal motor.
The no-load phase BEMF was measured at 1000 rpm. Figure 18 illustrates the waveforms of the phase BEMF of the FEA and experiment. As shown in Figure 18, the FEA and experimental results are almost the same. The peak values of the no-load phase BEMF of the FEA and experiment are 83.3 Vpeak and 83.2 Vpeak, respectively, and the error between the two results is 0.1%. Based on the no-load experimental result, it can be seen that the test motor is well-fabricated.
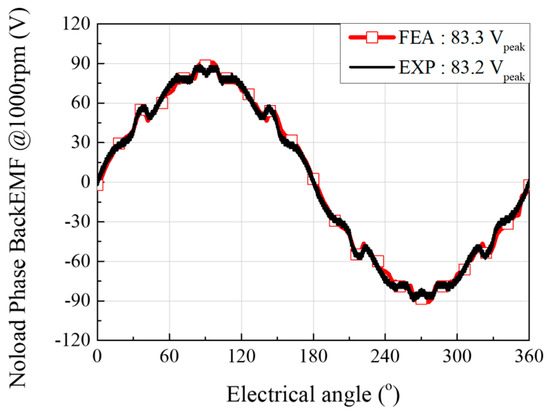
Figure 18.
Waveforms of the no-load phase BEMF of the FEA and experiment.
Figure 19a shows the efficiency map measured through the experiment, and Figure 19b depicts the error between the measured efficiency map and the efficiency map calculated using the 2D FEA presented in Figure 16b. Each operating point was measured over 5 s with 10 Hz sampling, and the efficiency results were averaged from 50 samples, ensuring repeatability and reliability of the experimental data shown in Figure 19. Since the main operating points are located near 100 Nm, the experiment was conducted up to 400 Nm. The maximum error and average error between measured efficiency and calculated efficiency through 2D FEA are 2.54%p and 0.73%p, respectively. In other words, the difference between the measured efficiency and the efficiency calculated through 2D FEA is very small. Thus, the experimental results confirm the validity of the proposed design method. Furthermore, the motor experiment results indirectly demonstrate that this method contributes to enhancing the FE of EVs.
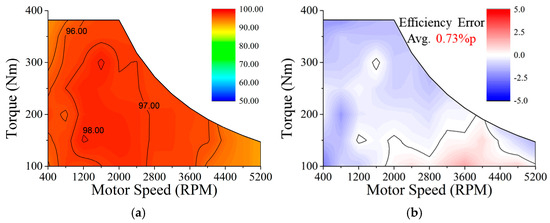
Figure 19.
Efficiency map: (a) experimental result; (b) error between calculated and measured values.
6. Conclusions
This paper proposes a motor design method that accounts for AC resistance in motors’ HSFF coils to enhance the FE of EVs. Among the HSFF coils, MSO coils are effective in improving motor torque density. However, HSFF coils inherently have a disadvantage: the large conductor area results in high AC resistance, which, in turn, decreases motor efficiency. To address this issue, a motor design method considering AC resistance has been proposed. Moreover, since designing for efficiency improvement without considering OPs is not meaningful for EV traction motors, the proposed method also considers multiple driving cycles reflecting different vehicle operation purposes.
Through the multi-objective optimization process aimed at enhancing FE, improvements were achieved across all considered driving cycles. Specifically, the FE increased by 0.20%, 0.86%, and 0.36% in the Manhattan, HWFET, and HDUDDS cycles, respectively. To analyze the factors contributing to the FE improvement, OP analysis and efficiency map analysis were conducted. First, the OP analysis revealed that motor operation predominantly occurs in low-torque regions across all cycles. Second, the motor efficiency map demonstrated overall efficiency enhancements in the optimized motor, although a slight decrease was observed in the low-speed, high-torque regions. As a result, the FE of the electric bus was improved through the proposed multi-objective optimization approach. Notably, the HWFET cycle exhibited the most significant FE improvement, primarily because it operates in a high-speed, low-torque region where the optimized motor showed enhanced efficiency. Conversely, the Manhattan and HDUDDS cycles showed less pronounced FE improvements due to a greater proportion of operation in low-speed, high-torque regions, where the motor efficiency gains were relatively smaller. To validate the effectiveness of the proposed motor design method, an optimal motor was fabricated and tested. The experimentally measured efficiency closely matched the efficiency predicted by 2D FEA, thus verifying the reliability of the simulation results.
Although this study primarily focused on simulations under specific vehicle configurations and representative driving cycles, the proposed approach provides a strong foundation for further advancements. Future research will aim to significantly expand the optimization framework by incorporating real-world driving data, accounting for detailed thermal and aging effects, and applying the methodology across a wider range of electric vehicle platforms and operating environments. In addition, the adoption of advanced optimization techniques and the integration of more complex multi-physics models are expected to further enhance the applicability and robustness of the proposed design approach.
In conclusion, this proposed method proves highly effective in improving the FE of electric buses equipped with MSO coils and opens promising pathways for future research and development in motor design optimization for electric mobility.
Author Contributions
Conceptualization, K.-S.C. and Y.-H.J.; methodology, S.-H.P.; software, S.-H.P.; validation, K.-S.C.; resources, K.-S.C.; data curation, Y.-H.J.; writing—original draft preparation, Y.-H.J. and K.-S.C.; writing—review and editing, S.-H.P. and M.-R.P.; visualization, Y.-H.J.; supervision, S.-H.P.; project administration, M.-R.P.; funding acquisition M.-R.P. All authors have read and agreed to the published version of the manuscript.
Funding
This work was supported by the Soonchunhyang University Research Fund.
Data Availability Statement
Data are contained within the article.
Conflicts of Interest
The authors declare no conflicts of interest.
Correction Statement
This article has been republished with a minor correction to the reference 5. This change does not affect the scientific content of the article.
References
- Frigerio, A.; Vermeulen, B.; Goossens, K.G.W. Automotive Architecture Topologies: Analysis for Safety-Critical Autonomous Vehicle Applications. IEEE Access 2021, 9, 62837–62846. [Google Scholar] [CrossRef]
- Kim, G.; Hur, J. Methodology for Security Analysis of Grid-Connected Electric Vehicle Charging Station With Wind Generating Resources. IEEE Access 2021, 9, 63905–63914. [Google Scholar] [CrossRef]
- Ye, H.; Li, G.Y.; Juang, B.-H.F. Deep Reinforcement Learning Based Resource Allocation for V2V Communications. IEEE Trans. Veh. Technol. 2019, 68, 3163–3173. [Google Scholar] [CrossRef]
- Cha, K.S.; Kim, D.M.; Jung, Y.H.; Lim, M.S. Wound field synchronous motor with hybrid circuit for neighborhood electric vehicle traction improving fuel economy. Appl. Energy 2020, 263, 114618. [Google Scholar] [CrossRef]
- Feng, R.; Hua, Z.; Yu, J.; Zhao, Z. A comparative investigation on the energy flow of pure battery electric vehicle under different driving conditions. Appl. Therm. Eng. 2025, 269, 126035. [Google Scholar]
- Kwon, K.; Seo, M.; Min, S. Efficient multi-objective optimization of gear ratios and motor torque distribution for electric vehicles with two-motor and two-speed powertrain system. Appl. Energy 2020, 259, 114190. [Google Scholar] [CrossRef]
- Fang, L.; Jung, J.-W.; Hong, J.-P.; Lee, J.-H. Study on High-Efficiency Performance in Interior Permanent-Magnet Synchronous Motor With Double-Layer PM Design. IEEE Trans. Magn. 2008, 44, 4393–4396. [Google Scholar] [CrossRef]
- Widmer, J.D.; Spargo, C.M.; Atkinson, G.J.; Mecrow, B.C. Solar Plane Propulsion Motors with Precompressed Aluminum Stator Windings. IEEE Trans. Energy Convers. 2014, 29, 681–688. [Google Scholar] [CrossRef]
- Jung, D.S.; Kim, T.H.; Lee, U.H.; Lee, H.D. Optimum Design of the Electric Vehicle Traction Motor Using the Hairpin Winding. In Proceedings of the 2012 IEEE 75th Vehicular Technology Conference (VTC Spring), Yokohama, Japan, 6–9 May 2012; pp. 5–8. [Google Scholar]
- Zhao, Y.; Li, D.; Pei, T.; Qu, R. Overview of the rectangular wire windings AC electrical machine. CES Trans. Electr. Mach. Syst. 2019, 3, 160–169. [Google Scholar] [CrossRef]
- Park, H.-J.; Lim, M.-S. Design of High Power Density and High Efficiency Wound-Field Synchronous Motor for Electric Vehicle Traction. IEEE Access 2019, 7, 46677–46685. [Google Scholar] [CrossRef]
- Momen, F.; Rahman, K.; Son, Y.C. Electrical Propulsion System Design of Chevrolet Bolt Battery Electric Vehicle. IEEE Trans. Ind. Appl. 2019, 55, 376–384. [Google Scholar] [CrossRef]
- Bardalai, A.; Gerada, D.; Golovanov, D.; Xu, Z.; Zhang, X.; Li, J.; Zhang, H.; Gerada, C. Reduction of Winding AC Losses by Accurate Conductor Placement in High Frequency Electrical Machines. IEEE Trans. Ind. Appl. 2020, 56, 183–193. [Google Scholar] [CrossRef]
- Paradkar, M.; Böcker, J.; Cker, J.B. Analysis of eddy current losses in the stator windings of IPM machines in electric and hybrid electric vehicle applications. In Proceedings of the 8th IET International Conference on Power Electronics, Machines and Drives (PEMD 2016), Glasgow, UK, 19–21 April 2016; pp. 1–5. [Google Scholar]
- Bianchi, N.; Berardi, G. Analytical Approach to Design Hairpin Windings in High Performance Electric Vehicle Motors. In Proceedings of the 2018 IEEE Energy Conversion Congress and Exposition (ECCE), Portland, OR, USA, 23–27 September 2018; pp. 4398–4405. [Google Scholar]
- Chin, J.-W.; Cha, K.-S.; Park, M.-R.; Park, S.-H.; Lee, E.-C.; Lim, M.-S. High Efficiency PMSM with High Slot Fill Factor Coil for Heavy-Duty EV Traction Considering AC Resistance. IEEE Trans. Energy Convers. 2020, 36, 883–894. [Google Scholar] [CrossRef]
- Cha, K.-S.; Chin, J.-W.; Park, S.-H.; Jung, Y.-H.; Lee, E.-C.; Lim, M.-S. Design Method for Reducing AC Resistance of Traction Motor using High Fill Factor Coil to Improve Fuel Economy of eBus. IEEE/ASME Trans. Mechatron. 2021, 26, 1260–1270. [Google Scholar] [CrossRef]
- Lee, E.C.; Soon, O.K.; Lee, H.Y.; Lee, S.W. Method for Manufacturing MSO Coil and Device for Manufacturing Same. U.S. Patent US20200099279A1, 2 August 2020. [Google Scholar]
- Pyrhonen, J.; Jokinen, T.; Hrabovcova, V. Design of Rotating Electrical Machines, 2nd ed.; John Wiley & Sons: Hoboken, NJ, USA, 2013. [Google Scholar]
- Markel, T.; Brooker, A.; Hendricks, T.; Johnson, V.; Kelly, K.; Kramer, B.; O’keefe, M.; Sprik, S.; Wipke, K. ADVISOR: A systems analysis tool for advanced vehicle modeling. J. Power Sources 2002, 110, 255–266. [Google Scholar] [CrossRef]
- Lim, M.S.; Chai, S.H.; Yang, J.S.; Hong, J.P. Design and Verification of 150-krpm PMSM Based on Experiment Results of Prototype. IEEE Trans. Ind. Electron. 2015, 62, 7827–7836. [Google Scholar] [CrossRef]
- Jung, Y.-H.; Park, M.-R.; Kim, K.-O.; Chin, J.-W.; Hong, J.-P.; Lim, M.-S. Design of High-speed Multi-layer IPMSM Using Ferrite PM for EV traction Considering Mechanical and Electrical Characteristics. IEEE Trans. Ind. Appl. 2021, 57, 327–339. [Google Scholar] [CrossRef]
- Perez, H.E.; Siegel, J.B.; Lin, X.; Stefanopoulou, A.G.; Ding, Y.; Castanier, M.P. Parameterization and Validation of an Integrated Electro-Thermal Cylindrical LFP Battery Model. In Proceedings of the ASME 2012 5th Annual Dynamic Systems and Control Conference Joint with the JSME 2012 11th Motion and Vibration Conference, Fort Lauderdale, FL, USA, 17–19 October 2012; pp. 41–50. [Google Scholar]
- Perez, H.E. Model Based Optimal Control, Estimation, and Validation of Lithium-Ion Batteries. Ph.D. Thesis, Civil and Environmental Engineeering, University of California, Berkeley, CA, USA, 2016. [Google Scholar]
- Klein, M.; Tong, S.; Park, J. In-plane nonuniform temperature effects on the performance of a large-format lithium-ion pouch cell. Appl. Energy 2016, 165, 639–647. [Google Scholar] [CrossRef]
- Diao, K.; Sun, X.; Lei, G.; Bramerdorfer, G.; Guo, Y.; Zhu, J. System-level Robust Design Optimization of a Switched Reluctance Motor Drive System Considering Multiple Driving Cycles. IEEE Trans. Energy Convers. 2020, 36, 348–357. [Google Scholar] [CrossRef]
- Sun, X.; Shi, Z.; Lei, G.; Guo, Y.; Zhu, J. Multi-Objective Design Optimization of an IPMSM Based on Multilevel Strategy. IEEE Trans. Ind. Electron. 2021, 68, 139–148. [Google Scholar] [CrossRef]
- Altinoz, O.T.; Yilmaz, A.E.; Ciuprina, G. A multiobjective optimization approach via systematical modification of the desirability function shapes. In Proceedings of the 2013 8th International Symposium on Advanced Topics in Electrical Engineering (ATEE), Bucharest, Romania, 23–25 May 2013; pp. 1–6. [Google Scholar] [CrossRef]
- Costa, N.R.; Lourenço, J.; Pereira, Z.L. Desirability function approach: A review and performance evaluation in adverse conditions. Chemom. Intell. Lab. Systems 2011, 107, 234–244. [Google Scholar] [CrossRef]
- Kim, H.; Kim, S.; Kim, T.; Lee, T.H.; Ryu, N.; Kwon, K.; Min, S. Efficient design optimization of complex system through an integrated interface using symbolic computation. Adv. Eng. Softw. 2021, 126, 34–45. [Google Scholar] [CrossRef]
- Gilleran, M.; Kotz, A.; Eudy, L.; Kelly, K. National Park Service Bus Electrification Study: 2020 Report; NREL/TP-5400-78012; National Renewable Energy Laboratory: Golden, CO, USA, 2021. Available online: https://www.nrel.gov/docs/fy21osti/78012.pdf (accessed on 26 April 2025).
- Prohaska, R.; Kelly, K.; Eudy, L.; Jeffers, M. Financial Analysis of Battery Electric Transit Buses; NREL/TP-5400-74832; National Renewable Energy Laboratory: Golden, CO, USA, 2019. Available online: https://www.nrel.gov/docs/fy20osti/74832.pdf (accessed on 26 April 2025).
Disclaimer/Publisher’s Note: The statements, opinions and data contained in all publications are solely those of the individual author(s) and contributor(s) and not of MDPI and/or the editor(s). MDPI and/or the editor(s) disclaim responsibility for any injury to people or property resulting from any ideas, methods, instructions or products referred to in the content. |
© 2025 by the authors. Licensee MDPI, Basel, Switzerland. This article is an open access article distributed under the terms and conditions of the Creative Commons Attribution (CC BY) license (https://creativecommons.org/licenses/by/4.0/).