Article

Fairness in Healthcare Services for Italian Older People: A Convolution-Based Evaluation to Support Policy Decision Makers

by
Davide Donato Russo
1,2,*,
Frida Milella
3 and
Giuseppe Di Felice
2
1
Institute for Systems Analysis and Computer Science “Antonio Ruberti”, National Research Council, Via dei Taurini 19, 00185 Rome, Italy
2
Departiment of Bioscience and Territory (DiBT), University of Molise, C.da Fonte Lappone, 86090 Pesche, Italy
3
Department of Informatics, Systems and Communication (DISCo), University of Milano-Bicocca, Viale Sarca 336, 20126 Milan, Italy
*
Author to whom correspondence should be addressed.
Mathematics 2025, 13(9), 1448; https://doi.org/10.3390/math13091448
Submission received: 10 March 2025 / Revised: 8 April 2025 / Accepted: 20 April 2025 / Published: 28 April 2025
(This article belongs to the Special Issue Improved Mathematical Methods in Decision Making Models)

Abstract

:
In Italy, the current demographic transition makes it a strategic goal to realign the distribution of health services based on the population aged over 65. The traditional challenge of achieving a fine-grained assessment of health resource statistics and evaluating the fairness of health services across regions is a concern in current research on the fairness of health services. In this study, the authors propose a methodological approach to foster a novel analysis of fairness in the allocation of primary health care services in Italy with a specific focus on the population aged 65 or over, which facilitates the processing of extensive administrative and demographic data to ensure a clear and precise visualization for informed decision making. The proposed methodology integrates convolution matrices weighted by aged population density within a fine-grained geographic grid representation. This approach is combined with an image convolution technique for filtering, enabling an effective estimation of health resource impact and a clear visualization of their spatial distribution across geographical areas. The integration of several data sources to evaluate the equity in accessibility distribution through the Gini index is also exploited to quantify the disparity between healthcare service provision and the aged population at the regional district level. Our findings showed a substantial unfairness in service distribution, with a concentration of healthcare effect in prominent regions such as Campania, Lazio, and Lombardia, indicating that healthcare accessibility is predominantly disproportionate in Italy, particularly for the population aged over 65.

1. Introduction

In light of the significant demographic changes towards an aging population, there is a need to ensure that older people have convenient access to healthcare services, thereby preserving their overall well-being [1]. In particular, policymakers are increasingly concerned with the need to guarantee adequate and equitable healthcare access for older people in order to establish a society that is supportive of aging individuals [1].
Accessibility encompasses various dimensions, including spatial and nonspatial factors such as social, cultural, and economic aspects [2,3]. Therefore, when examining access, particularly in terms of fairness, it is important to consider the allocation of resources with respect to social and health requirements and to assess the geographical distribution of services in connection with measurements of needs and access [4]. Several studies have examined the issue of equity in older people’s healthcare accessibility [1]. As an example, using a geographical accessibility and inequity index, Wu and Tseng [5] concluded that geographic accessibility and the equity of resource distribution must be considered concurrently in order to optimize the spatial locations of community-based care resources. Similarly, geographic accessibility aids in the identification of healthcare shortage areas and facilitates the equitable distribution of resources, according to Cheng et al. [6]. Nevertheless, the choices made by policymakers regarding the allocation of health services across different catchment areas affect geographical accessibility [7]. For instance, strategically locating diagnostic services in urban areas might result in efficiencies due to the clustering of highly trained personnel and infrastructures [7]. However, this creates geographical, financial, and social obstacles for rural patients, leading to unequal access to healthcare [7]. Consequently, decision makers should consider the location of health services by carefully weighing the compromises between ensuring equal access to healthcare and optimizing placement to take advantage of economies of scale [7,8]. Hence, it is imperative to delve deeper into the examination of geographical accessibility to health resources. This will empower policymakers to make well-informed decisions on the spatial allocation of health services, with the aim of mitigating potential health inequalities [7]. From this perspective, the combined use of geographical data and administrative data might encourage decision makers to visualize and analyze the consequences of their decisions on the territories [9]. Policymakers can identify areas where local services are not meeting population requirements and areas where there may be an excess of services through the use of Geographical Information Systems (GIS) methodologies, spatial statistics analysis, and the quantification of accessibility benchmarks [9]. As an example, a study conducted by Calovi et al. [9] mapped the degree of accessibility to outpatient services in the Tuscany region using spatial statistics and geographical analyses as supporting tools for healthcare policymakers. Nevertheless, the inherent challenge of achieving a fine-grained assessment of health resource statistics and evaluating the fairness of health services across regions is a concern in current research on the equity of health services [10]. In their work, Han et al. [10] proposed a geographical grid hot words statistics method to replace administrative geographical boundaries with geographical grids to carefully estimate the health resources within the target area. The proposed method exploited the hot words query to obtain the number of health resources within a geographical grid combined with maximum likelihood estimation to determine the corresponding population size. Recently, Pinto et al. [11] integrated the geographic grid representation form [10] and convolution theory in a mixed-integer linear programming (MILP) model to optimize the placement of Nature-Based Solutions (NBSs), such as parks, in Italian urban cities. They assessed the fairness of NBS distribution in relation to population density and used the Gini coefficient to globally evaluate the impact of NBS installations on the general resident population.
In this vein, additional studies are investigating the potential of the convolutional method across several domains. As an example, ref. [12] presents a cascading attention transformation network for marine image classification, termed CATNet, which incorporates an efficient channel attention module that uses deep convolution to effectively extract essential image features. Ref. [13], instead, integrates a semi-supervised generative adversarial network (SSGAN) for data augmentation and a cross-aware attention network (CAANet) using a combination of 3D and 2D convolutions along with an attention mechanism to improve the identification of different wheat varieties by focusing on their spectral, spatial, and textual features. To the best of our knowledge, there is a dearth of research pertaining to geographical accessibility to healthcare services for older people in the Italian context. The purpose of this study was to create a new methodological approach to assist policymakers in assessing the fairness in the geographical accessibility to health services, namely, hospitals, pharmacies, and parapharmacies, for older people across Italian regions.
This study specifically aids in developing an advanced and innovative approach to assist policymakers in their allocation decisions about health services for the increasing demography of individuals over 65 in Italy. The study offers the following multiple contributions:
  • It uses advanced artificial intelligence methods to automate how healthcare services are distributed in Italy for people over 65, tackling the issue of thoroughly assessing healthcare resources and checking the fairness of services in different regions.
  • It provides a new way to evaluate the unfair distribution of health services by combining an image processing technique with geographic analysis, using weighted convolution matrices as statistical units instead of administrative boundaries, which improve the accuracy of estimating health resources in the area.
  • It uses a measure of inequality called Gini Index to assess the fairness of health services distribution, taking into account both how many from the aged population live in an area and how the wealth is spread out in that area.
  • It could aid in the future practical development of support systems by incorporating the proposed methodological model into decision support systems improved through dashboards with more accessible information for policymakers.
  • All the software and scripts used for this analysis are available on GitHub in their first release at the following link: https://github.com/daviderusso/FairnessForHealthServices.git (accessed on 8 April 2025), promoting reproducibility and open science.
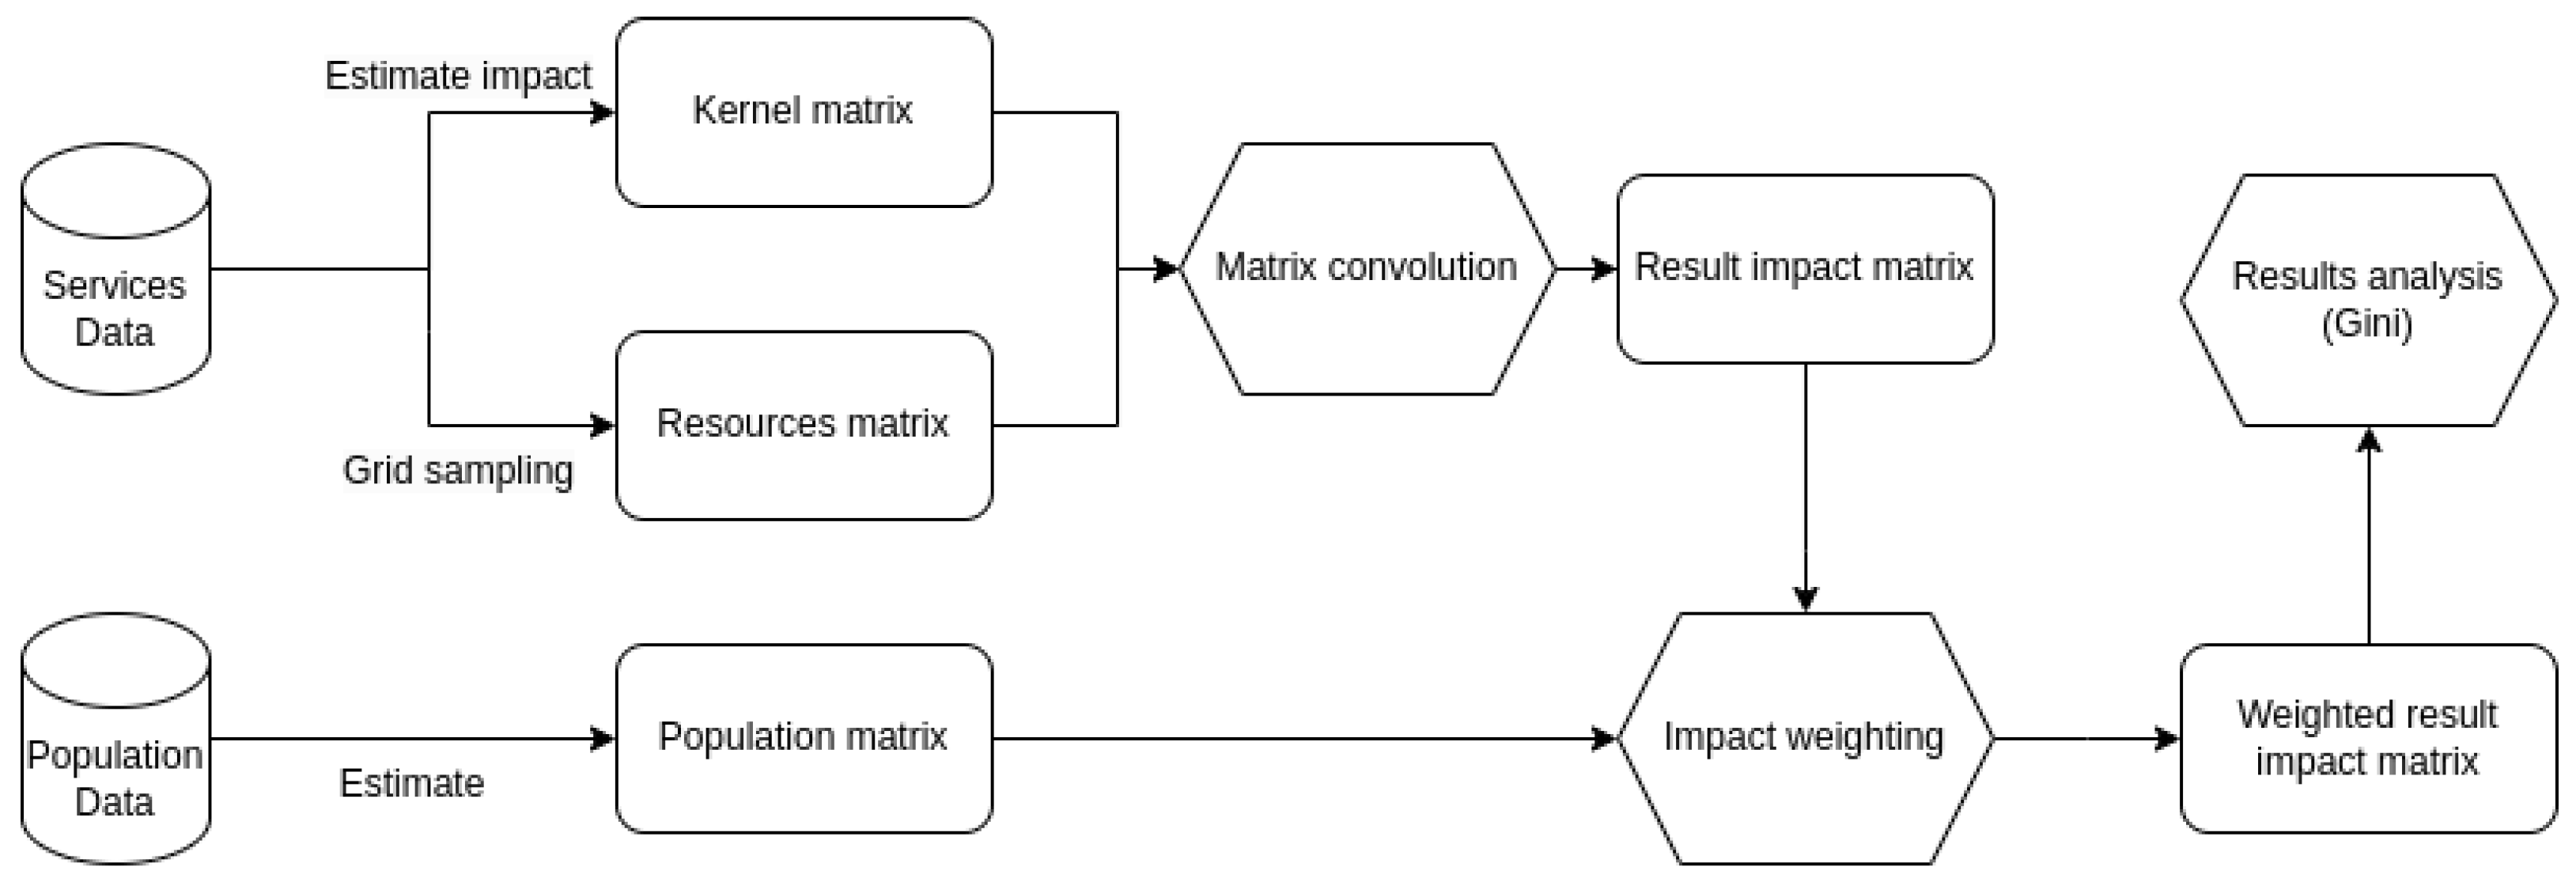
The remainder of this paper is structured as follows: Section 2 outlines the proposed methodology by defining also the data employed in the study and all the necessary definitions that come from the state of the art. Section 3 presents the results of the study, while Section 4 discusses their significance. Section 5 highlights the limitations of the study and proposes potential avenues for further research.

2. Methodology

A two-phase strategy was chosen to develop the proposed methodology. First, the integration of convolution matrices weighted with aged population density was executed in the fine-grained approach proposed by Han et al. [10] to visually map the spread and impact of health resources across the territory and a potential unfair service distribution.
In their work, the authors employed a geographic grid to develop a grid partition model of the study area at 5 km by 5 km intervals, systematically searching each grid for 30 designated keywords pertinent to healthcare and community resources, such as hospitals, to produce a vector quantifying hot words for each grid. They utilized a maximum likelihood estimation method to assess the grid population using the hot words quantity vector, and contrasted the actual distribution density of per capita hospital resources by examining the population inside each grid along with the number of hospitals available. Second, the research conducted by Pinto et al. [11] inspired the creation of a geographic grid representation, which was integrated with an image convolution technique for image filtering [14] to improve precision in evaluating the equitable distribution of services for our target users.
In their study [11], a convolutional technique was employed to evaluate the impact of Nature-Based Solutions (NBSs), such as parks, on the urban grid, with the kernel matrix delineating the neighborhood effect of the NBS. They assessed the cumulative impact of an NBS at each point on the grid by convolving this kernel with the array of possible locations, and they utilized a mixed-integer linear programming (MILP) model to determine the ideal places for the installation of NBSs from a selection of candidate locations. Furthermore, the combination of multiple data sources to assess the fairness in distribution of accessibility using the Gini index was exploited to measure the misalignment between healthcare services provision and aged population within a district level of interest (e.g., [11,15,16]). These works outline the methodological underpinnings of this study.

2.1. Data

A comprehensive set of data focused on health services across the Italian territory was used. Our examination focused on health services due to their significance in supporting older people in their day-to-day independent living [1,17]. Data regarding pharmacies, parapharmacies, and hospitals were retrieved from the open data website of the Ministero della Salute [18]. This dataset was integrated with georeferencing information as described below and cleaned of tuples that did not have a corresponding entry in the OpenStreetMap (OSM) dataset [19]. A brief example of the health services data retrieved from the Ministero della Salute is shown in Table 1.
Furthermore, data on population density per km2 were obtained from the Istituto Nazionale di Statistica (ISTAT) [20]. In particular, we retrieved information about the population by age class for each municipality, province, and region in Italy. We combined this information to estimate the density of the population over 65 per km2. Population data were updated to 2021 [21], while the resource data were updated to 2023.
An example of population data per square kilometer in the city of Rome is shown in Figure 1. The values reported in each tile represent the resident population in that specific square kilometer.

2.2. Method

Let T represent the set of service types under consideration, where  t T  denotes each service type (i.e., pharmacies, parapharmacies, and hospitals). The proposed methodology can be articulated in the following steps: Data Matrix Generation, Kernel Definition, Matrix Convolution, and Results Analysis. The methodology was implemented using Python 3.12, and the graphical results were generated using QGIS [22]. Figure 2 summarizes the flow of information of the proposed procedure. Particularly, it illustrates the process from retrieving population and service data to applying convolution between kernels and resource matrices. The convolution results are then weighted with population data before econometric indices (i.e., Gini coefficient) are applied.

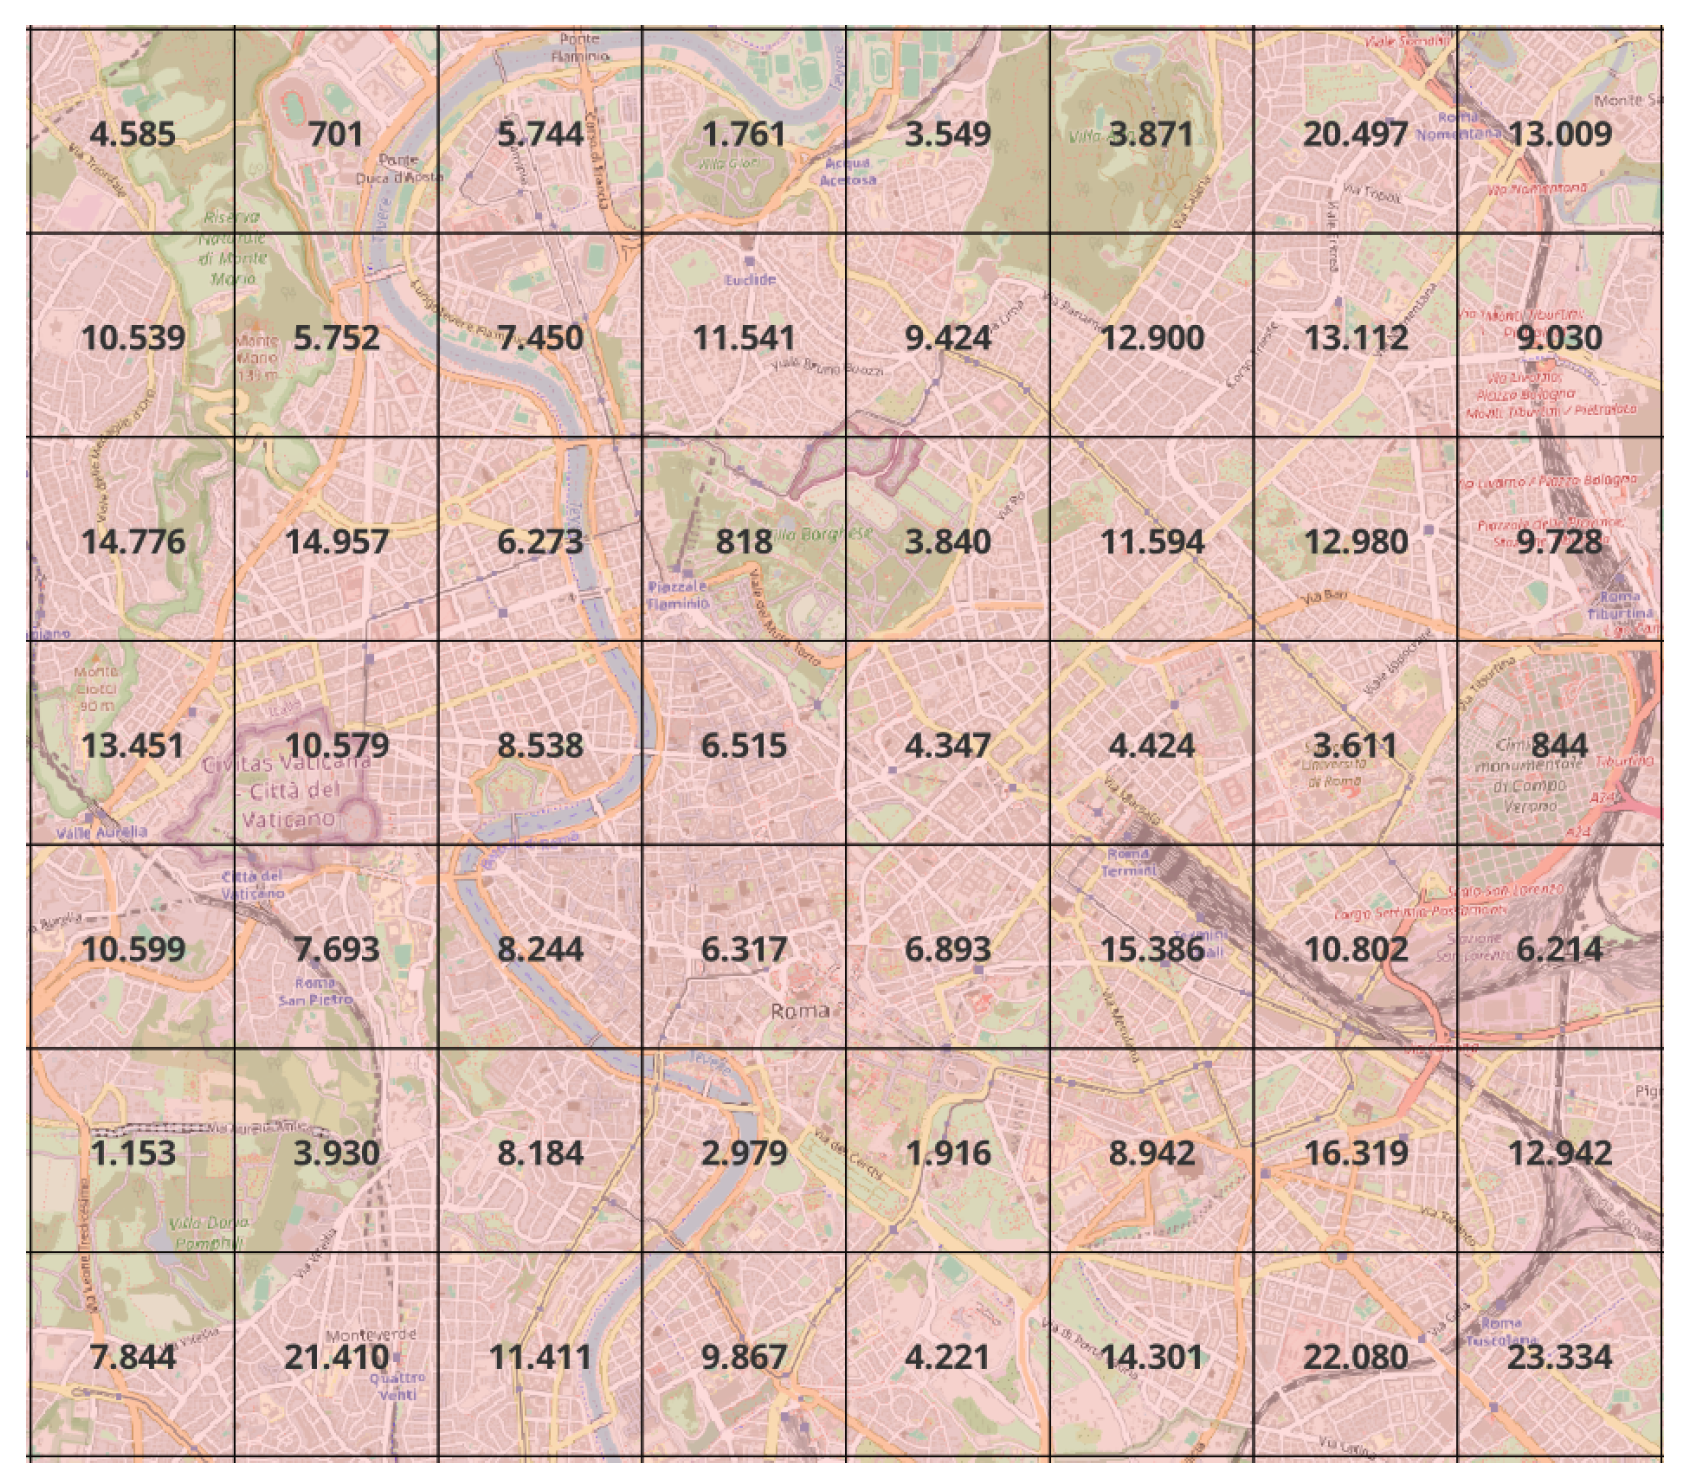
2.2.1. Data Matrix Generation

A grid sampling with tiles of 1 km2 was created. We retrieved geographical information (i.e., latitude and longitude) of health resources using OSM API [19]. For each tuple in the services dataset, we checked whether there was a corresponding reference in OSM by sequentially verifying the complete address provided in the dataset (i.e., name and street), only the service name, only the street, and only the city. If no coordinates were found during this process, we removed the entry from the dataset. Through this filtering step, only one entry was removed from the hospital dataset. We then further filtered the dataset to remove all duplicate entries. Specifically, if two services had the same name or street, only one was retained. By removing these duplicates, we eliminated 42.8% of the hospital entries, 28.7% of the parapharmacy entries, and 38.4% of the pharmacy entries.
For each service (i.e., pharmacy, parapharmacy, and hospital), we created a resource matrix  R t  of integer values, where each tile  ( i , j ) R t  contains the number of services of type t within that specific tile.
We used population data to weight the impact of the services. To estimate aged population data for the entire area of interest, we retrieved population data for each municipality and the population distribution per square kilometer. We then proportionally combined these data with the percentage of older people in the municipality to which the tiles belonged.
For this purpose, let  P o p  be the matrix containing population data per square kilometer, where  p o p i j  represents the population residing in tile  ( i , j ) . Given M the set of municipalities where each  m M  represents a specific municipality, let  P o p m  be the total population residing in municipality  m M , and let  e P o p m  be the number of elderly residents (i.e., those over 65) in m. We define  f ( i , j ) m  as a function that, given the coordinate of tile  ( i , j ) , returns the municipality to which the tile belongs. First, we compute the percentage of aged residents in municipality m as  % e P o p m = e P o p m P o p m × 100 . Then, we calculate the number of aged residents residing in each tile  ( i , j )  using the formula  % e P o p m × p o p i j 100 .
This resulted in the matrix P, where each tile  ( i , j ) P  represents the estimated aged population residing in that tile. Note that matrix P is an estimation and can be further refined or customized to represent subgroups of the population that differ in other characteristics.
Note that we weight the convolution results with population data to account for the potential demand for services, rather than just their presence. Without this weighting, the analysis would focus solely on the supply of services, overlooking how many people reside in each area and might use them. By incorporating population data, we address both supply and demand, which are crucial for accurately assessing service distribution [23,24]. This step enhances the validity and interpretability of our findings by emphasizing the real impact on the population.

2.2.2. Kernel Design Rationale

To estimate the impact of services residing in a tile, we defined a kernel matrix  K t  for each service  t T .
The sizes of the kernels were determined based on state-of-the-art estimations [25] of the area of impact for each service and the authors’ experience. In this regard, we evaluated the report by [25], which involved mapping representative municipalities that function as supply centers for primary services (health, mobility, and education) and assessing the distance of other municipalities from these centers. It results in classifying the Italian municipalities into three distance categories based on average road travel distance, employing the following three primary metrics: median, third quartile, and 95th percentile. The national grouping criteria were 27.7 min for the median, 40.9 min for the third quartile, and 66.9 min for the 95th percentile.
Thus, by considering an average speed of 60 km/h, in 60 min, it is possible to cover almost 60 km. This value is used as the radius of the kernel to the hospital (i.e., the size of the kernel is  121 × 121  for a hospital). In particular, since each grid cell represents a  1 × 1  km area, a 60 km radius from the center requires extending 60 cells in every direction. Consequently, we have 60 cells to the left, 60 cells to the right, and the central cell, yielding a  121 × 121  kernel (i.e.,  60 + 60 + 1 = 121 ). This ensures the coverage of 60 km in each direction from the central tile. Similarly, based on a 10 min travel time at an average speed of 60 km/h, we defined the pharmacy kernel as a  21 × 21  matrix. In contrast, by considering a walking speed of 0.8 m/s for older adults [26], we defined a  5 × 5  kernel for a parapharmacy. The values within the kernels were defined in the interval  [ 0.1 , 1.0 ] . Once the kernel size is set, the values in the matrix decrease linearly from the central highest value (equal to 1) to a minimum at the outermost layer. Consequently, any layer not included in the kernel is assumed to have a value of 0. This ensures that all elements of the kernel matrix have a value greater than zero. As an example, the  5 × 5  kernel defined for a parapharmacy is shown in Table 2. Nonetheless, it is possible to create new kernels to refine the estimation of the impact.

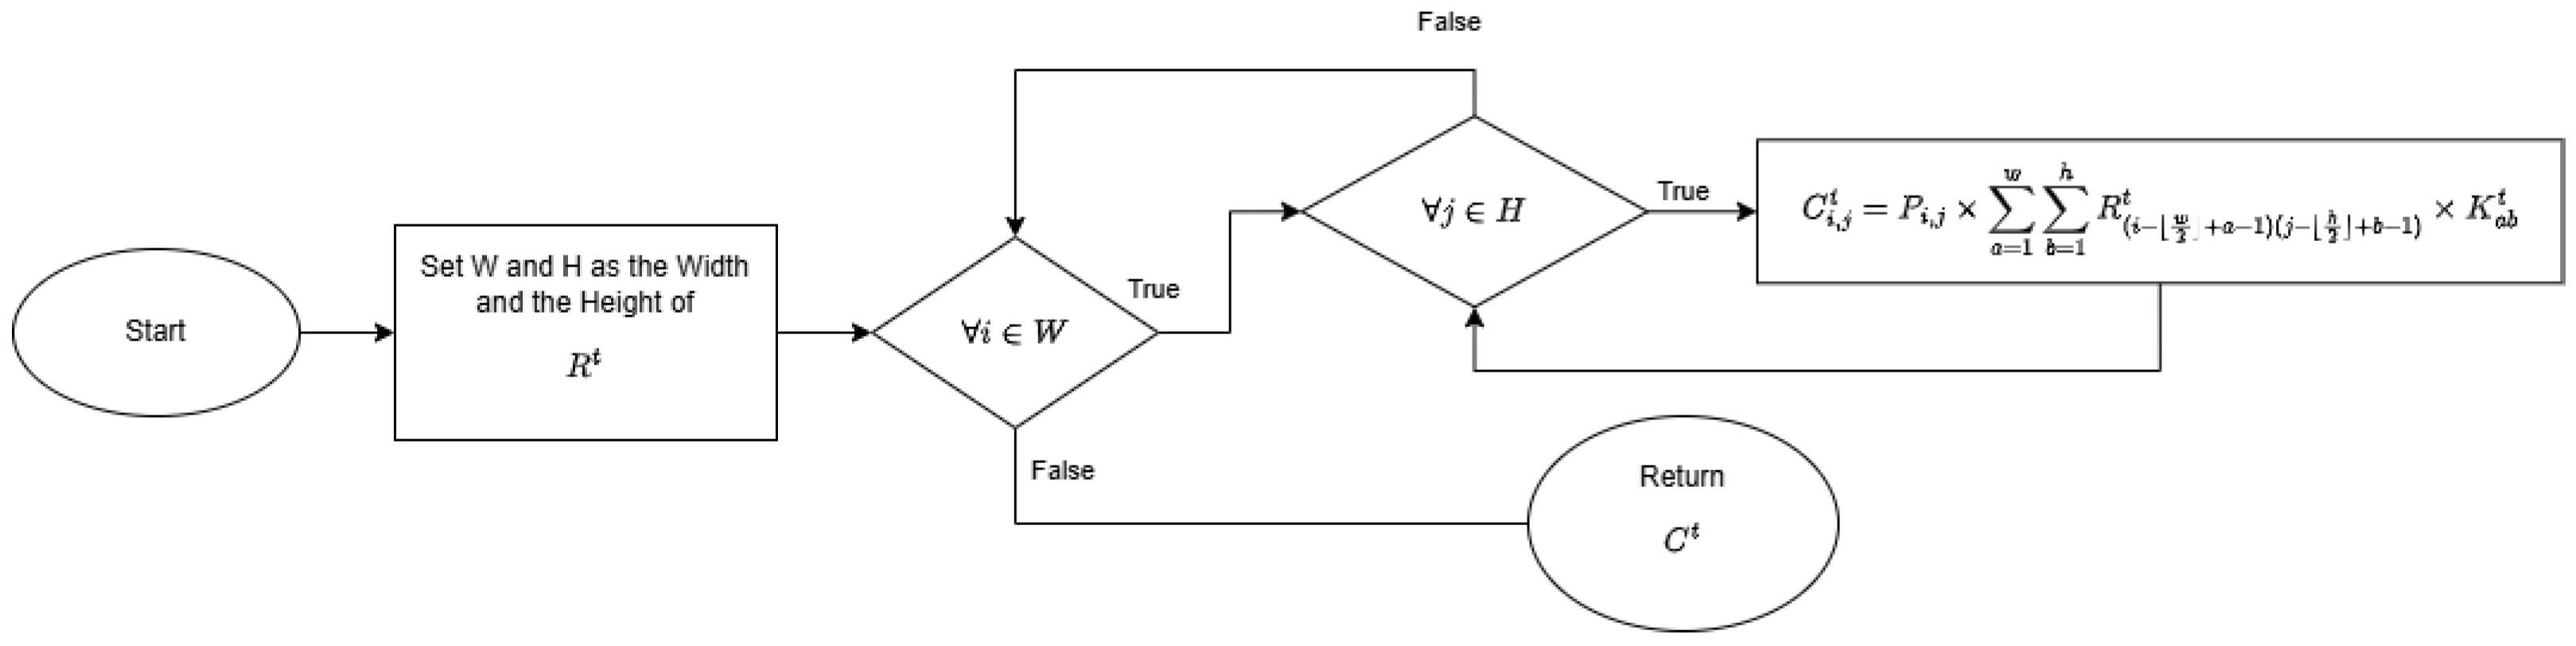
2.2.3. Convolution Implementation

Convolution is a mathematical operation that, given the two functions f and g, produces a third function that expresses how the shape of one is modified by the other [14]. It is commonly used in image filtering, where images and kernels are essentially matrices of numbers. The core idea of this methodology is to use it to combine the information from the service’s kernels with the service distribution. By weighting the convolution results with the population density, we can estimate the impact of each service on the surrounding territory and its population.
An example of this application is the following: Given an image I and a kernel k of size  w × h , we denote the image resulting from the application of the kernel k to I as  I = f ( I ) . To obtain the output image  I , the kernel matrix is applied pixel by pixel. Specifically, the value of a generic pixel  I i , j  is computed using the following equation:
f ( I i , j ) = I i , j = a = 1 w b = 1 h I ( i w 2 + a 1 ) ( j h 2 + b 1 ) × k a b
Figure 3 shows an example of applying a kernel k (Figure 3b) to an input image I (Figure 3a), resulting in the output image  I  (Figure 3d). When either the height h or width w of the kernel is even, the indices need to be adjusted accordingly. For the purposes of this work, we assume that both h and w are odd.
We note that, in our work, we considered the matrices  R t , which contain data on the distribution of resources for each service type  t T , as the images I. Similarly, the kernels  K t  were specifically designed to represent the impact of each service type  t T . To estimate the impact of services on the population, we weighted the results of the convolution using the population data in the matrix P. Figure 4 illustrates the application of these weights to the convolution results.
We note that the top-right tile of Figure 4c shows that even if a portion of the population lives in that tile, the final result will be zero if no services reach that tile. Similarly, in the top-left tile, even if services do reach the tile, the final result will be zero if no population resides there. Thus, the result matrix  C t  representing the impact of the services  t T , weighted according to the population matrix P, can be computed using the following formula:
C i , j t = P i , j × a = 1 w b = 1 h R ( i w 2 + a 1 ) ( j h 2 + b 1 ) t × K a b t
where  R t  is the resource distribution matrix for service t, and  K t  is the kernel for service t. Furthermore,  i , j  denotes the specific tile of the relative matrix. To ensure accurate spatial data processing, we also converted shapefiles (SHP) to TIFF (Tagged Image File Format) format using standard GIS libraries (e.g., GDAL), preserving spatial metadata and projection integrity. This step enhances the adaptability and reproducibility of our methodology, aligning with best practices in geospatial analysis [27,28,29,30,31].
A flowchart detailing the Matrix Convolution step introduced in Figure 2 and described in this section is shown in Figure 5. It illustrates the logical structure of the computational process used to obtain the matrix  C t . After determining the dimensions of the resource matrix  R t , namely, W and H, the algorithm iterates over each tile  ( i , j )  in the matrix and calculates the convolution between  R t  and the corresponding resource kernel, as given by Equation (2). The result of this convolution is then weighted by the population  P i , j  residing in the tile  ( i , j ) . Finally, the algorithm returns the convolved matrix  C t .

2.2.4. Gini Coefficient Calculation
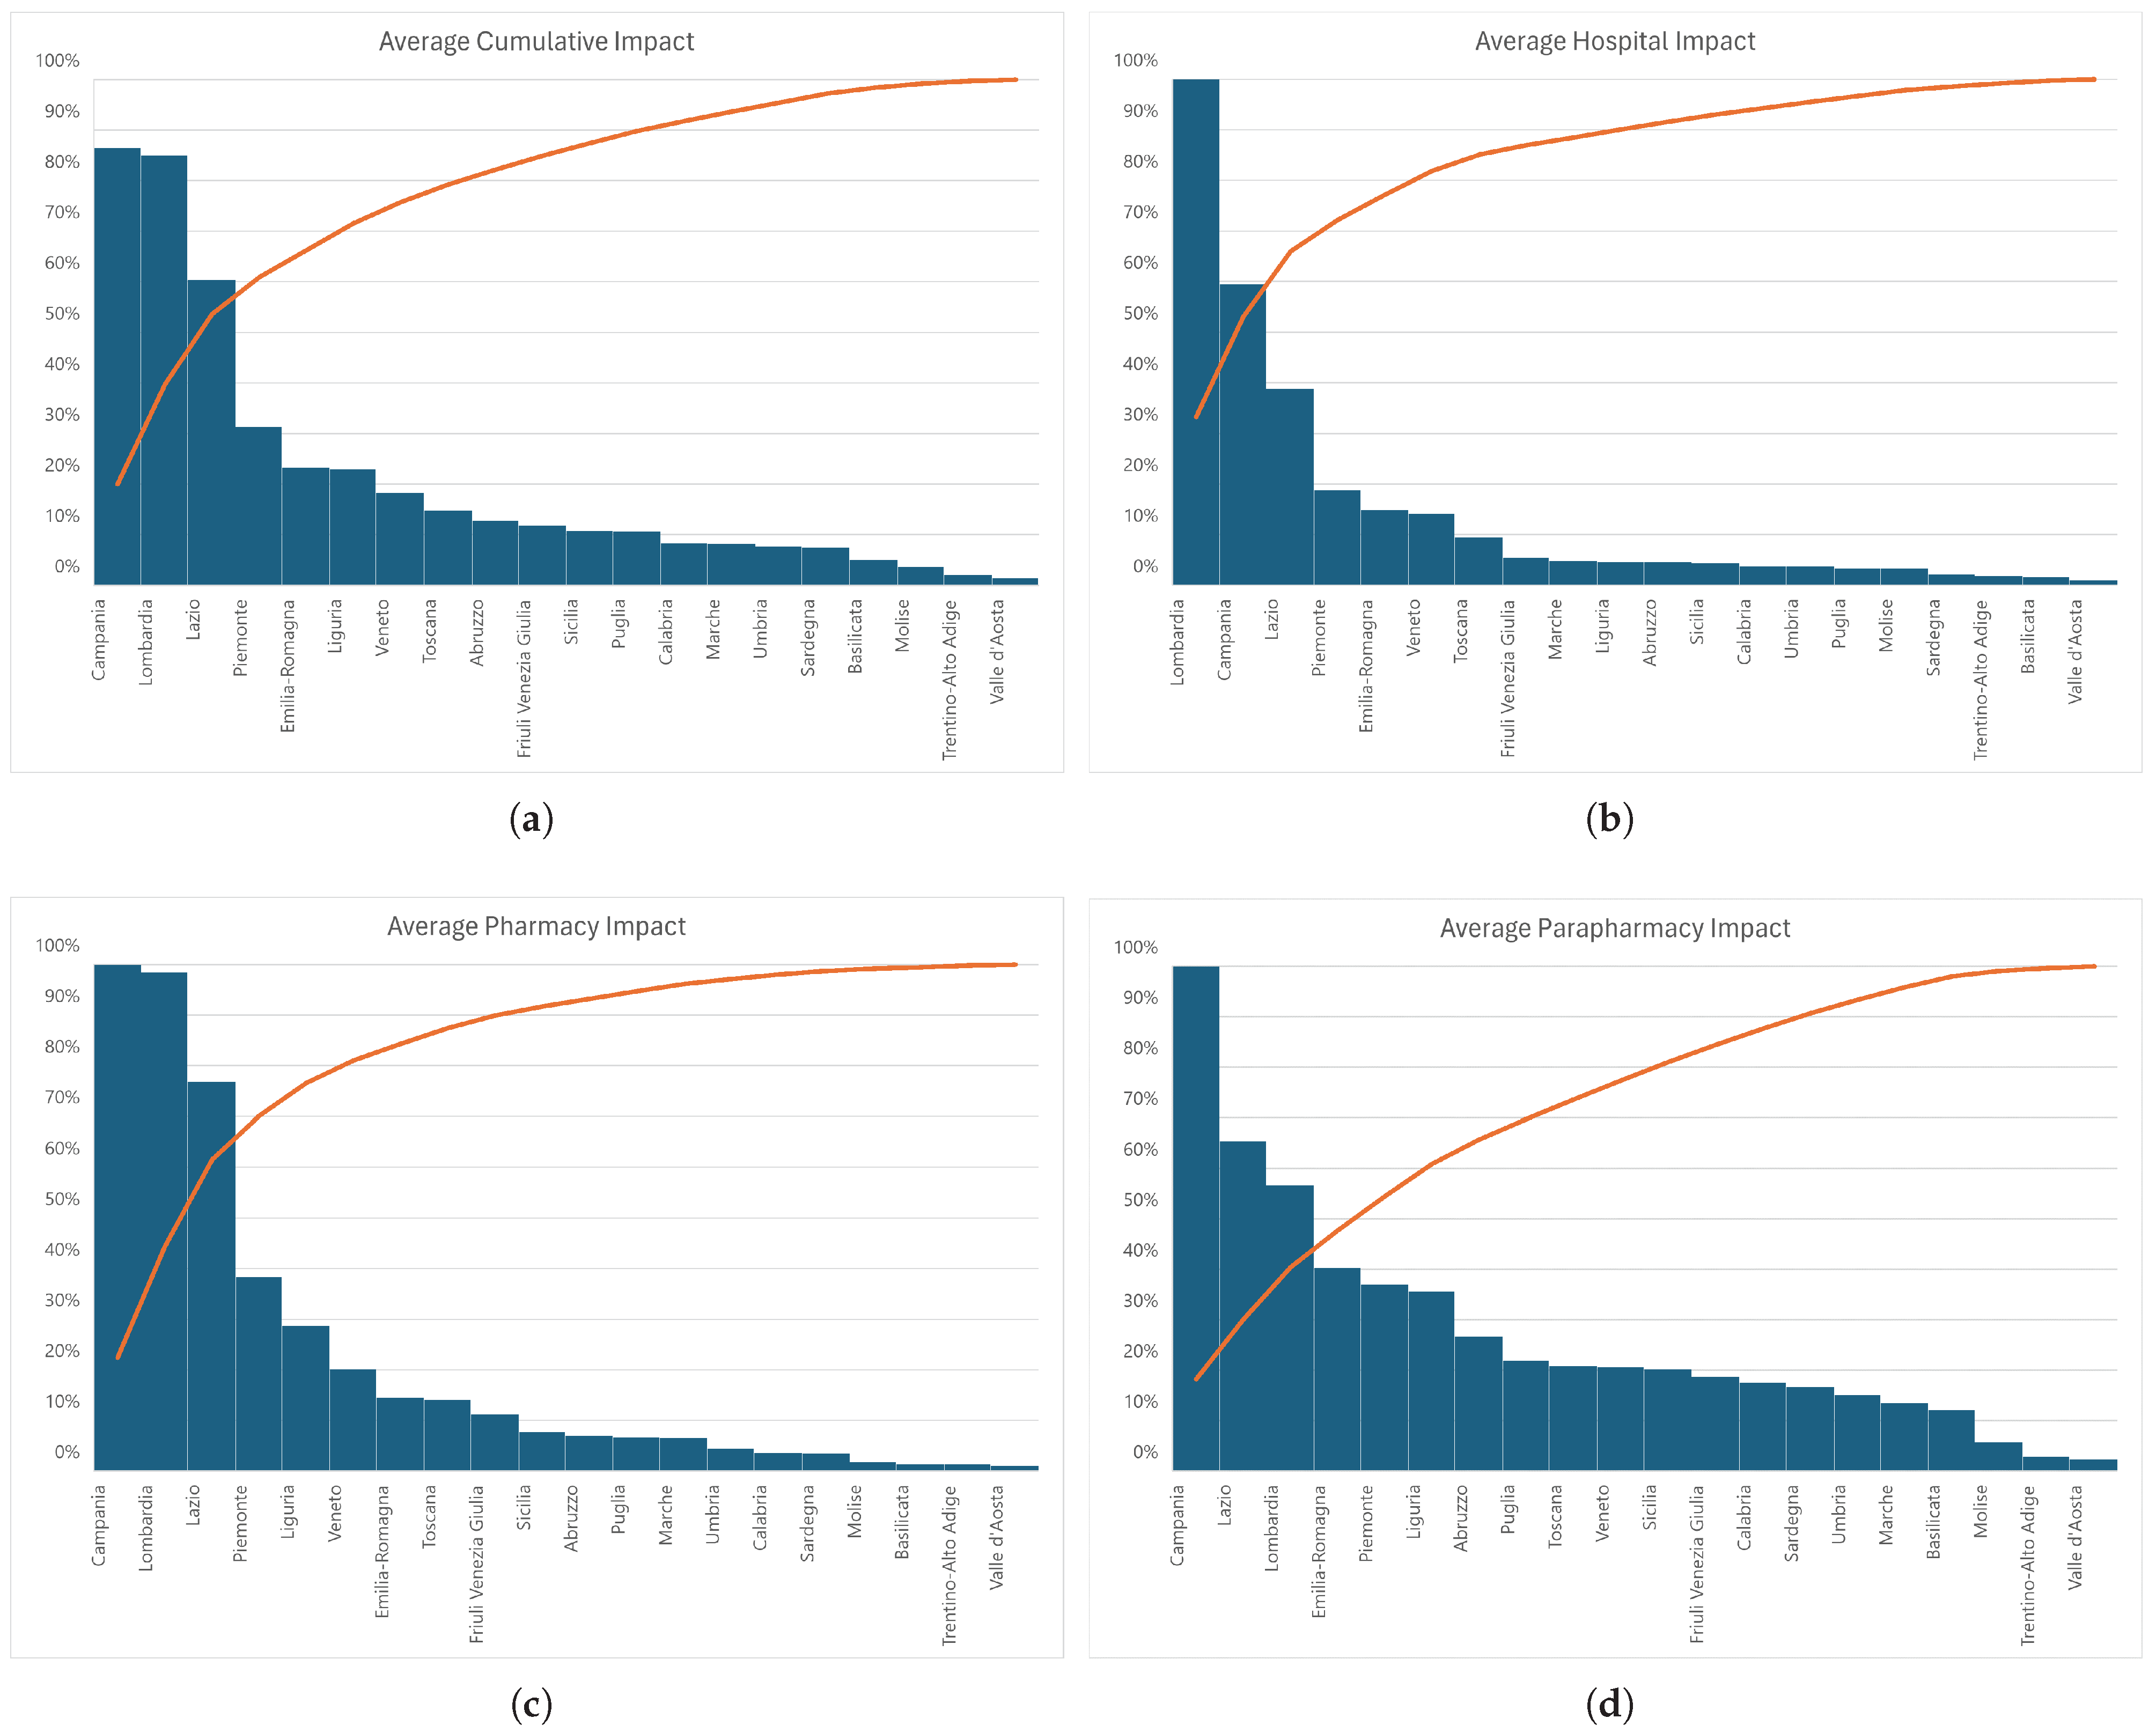
After computing the matrix containing the impact of each health service type  t T  weighted on the population matrix P, we performed a normalization step. We generated a normalized impact matrix  n C t  by normalizing the impact matrix  C t  in the range  [ 0 , 1 ]  using the following formula:  X normalized = X X maximum . We computed the average and total impact values,  n C a v g t  and  n C t o t t , respectively, for the entire area of interest and for a subportion of the area. We note that the average value is computed as the average of the territory extension.
To provide a single value that summarizes the cumulative impact matrix, we define the matrix  n C  by summing the matrices of all services  t T  as follows:  n C i , j = t T θ t n C i , j t . We note that  θ t  is a weight parameter that can be used to personalize the importance of each service in the cumulative matrix  n C . For our experimentation, we considered all the services as having equal weight. We computed the total and average impact values on  n C , denoted respectively as  n C t o t  and  n C a v g .
Fairness in resource distribution can be addressed from multiple angles across different domains, as demonstrated in a recent study that proposes and compares several fairness metrics [32]. In our work, to evaluate the fairness of the distribution of health services, we applied an econometric index widely recognized as a measure of income inequality, the Gini coefficient [33,34,35]. For the scope of this work, we used it to express the fairness of the distribution of health services across the population by considering the tiles of the matrices  n C  as statistical units. It ranges between  [ 0.0 , 1.0 ] , where lower values indicate a fairer distribution of health resources, while higher values suggest a more unfair allocation [16]. We compute the Gini coefficient of the matrices  n C t  for each  t T  and of the cumulative one  n C .

3. Results

The integration of multiple data sources to evaluate the fairness of health services distribution through the proposed methodology provides valuable insights for decision makers. Figure 6 maps the results obtained by applying the methodology described in Section 2 for the three resources analyzed (i.e., pharmacy, parapharmacy, and hospital) and the total cumulative impact. We note that the gray color represents the absence of services or population, while darker green corresponds to a higher service impact.
Parapharmacies appear to have the smallest effect on the Italian population, whereas hospitals and pharmacies demonstrate a significant impact due to the large kernel used, for the former, and the broad coverage provided by the latter’s numerous locations (Figure 6a–c). The cumulative effect of the three services combined across Italy (Figure 6d) reveals a stark contrast in service coverage between the northern and southern regions of the country. The northern portion of Italy is predominantly well-served, featuring a robust availability of healthcare facilities, especially in major urban centers. Conversely, the southern regions exhibit markedly lesser coverage, with the exception of Rome and Naples, which hold significantly higher levels of service provision, indicating a concentration of healthcare resources in these urban centers. Other southern areas remain insufficiently served.
Table 3 provides a comprehensive analysis of the total and average impact scores of the three categories of healthcare services (pharmacy, parapharmacy, and hospital) throughout various areas in Italy, along with the aggregate effect of these services. The Lombardia Region has the highest impact across all services, with a cumulative score of 0.978 and an average of 0.850, confirming that the Lombardia Region provides an extensive and densely populated network of healthcare services. Nonetheless, the the Campania and Lazio Regions demonstrate considerable cumulative effects in pharmacies and hospitals, exhibiting a notably uneven distribution of healthcare services.
To further validate our convolution-based evaluation, we conducted a comparative analysis with traditional spatial accessibility methods, such as the Enhanced Two-Step Floating Catchment Area (E2SFCA) model [23,36,37,38]. While E2SFCA effectively assesses healthcare accessibility by integrating travel times and demand–supply ratios, our approach leverages convolution techniques to provide a more detailed representation of fine-scale spatial disparities. The results indicate that our method enhances the precision of localized healthcare distribution assessments, which is crucial for identifying underserved areas and informing targeted policy interventions.
Figure 7 encapsulates the average impact results for each service, incorporating the cumulative data derived from the suggested methodology. The figure shows that hospital distribution exhibits the greatest unfairness (i.e., Figure 7b), with the most significant gap between the Lombardia Region and the other regions. Conversely, parapharmacy (i.e., Figure 7d) appears to be the service most fairly spread, with the majority of regions exhibiting a percentage over 10%. Campania and Lombardia exhibit the highest average cumulative impact, at nearly 80% and 70%, respectively (Figure 7a), making them primary centers for healthcare services, particularly regarding accessibility and demographic influence weighted with individuals aged over 65. On the other hand, the Piemonte, Emilia-Romagna, Liguria, and Veneto Regions are classified as mid-tier, demonstrating moderate cumulative impact levels (Figure 7a), whereas Puglia, Calabria, Marche, Umbria, and Sardegna are designated as low-tier regions, exhibiting considerably lower average cumulative impacts (Figure 7a). This suggests that low-tier regions may have inadequate healthcare services or that the population is not optimally served by the existing services, whereas mid-tier regions possess adequate healthcare infrastructure, albeit less densely developed than in top-performing regions. Instead, the Basilicata, Molise, Trentino-Alto Adige, and Valle d’Aosta Regions rank lowest on this chart, signifying a minimal healthcare service impact due to a low population density, a lack of healthcare facilities, or both (Figure 7a). Although Trentino-Alto Adige and Valle d’Aosta’s closeness to well-serviced regions may alleviate this trend, Molise and Basilicata do not have this advantage. The orange line in Figure 7a indicates that a limited number of regions contribute significantly to the overall impact of healthcare services. The initial steep incline on the left side of the line indicates that regions such as Campania and Lombardia play a substantial role in the overall impact. As one progresses to the right, the cumulative percentage exhibits a slower rate of increase, suggesting that the subsequent regions contribute less significantly to the overall impact. The uneven distribution indicates a necessity for targeted policies to improve healthcare service delivery in underserved areas. Less than half of the Italian regions contribute to over 80% of the total cumulative impact of health services.
Table 4 presents the Gini index values computed on the impact matrices of three types of health services (pharmacies, parapharmacies, and hospitals) across Italian regions. The Veneto Region displays the lowest cumulative Gini score of 0.812, signifying the fairest distribution of healthcare services among the regions. The Gini coefficients for pharmacy and parapharmacy are 0.844 and 0.964, respectively, but the distribution for hospitals appears to be fairest at 0.775. Conversely, Trentino-Alto Adige shows the highest cumulative Gini index of 0.945, indicating the most unfair distribution of healthcare services and thus a persistently low degree of equity in access to all three categories of healthcare services throughout the region.

4. Discussions

In this work, we propose a novel methodological approach to assist policymakers in assessing fairness in geographical accessibility to health services, namely, hospitals, pharmacies, and parapharmacies, for older people across Italian regions.
Our findings revealed a significant discrepancy between the availability of healthcare services and the older population at the district level of reference (i.e., regions). The Gini index for the health services analyzed in this study indicates a disproportionately inadequate allocation relative to the distribution of the over-65 population in the country. The cumulative values of the Gini index indicate that all captured indicators exceed 0.8, suggesting that the current coverage of hospital and territorial supply services, including pharmacies and parapharmacies, for the over-65 demographic is mostly unfair compared with the overall population. This is particularly noteworthy because, despite the uneven distribution of supply points of interest nationwide, areas with a more concentrated and widespread network of services exhibit inadequate fairness in accessibility for the over-65 demographic (the Lombardia Region has a cumulative Gini coefficient of 0.881; see Table 4). Nonetheless, by categorizing the chosen district levels (i.e., regions) according to geographical area, namely, Northern Italy, Southern Italy, and Central Italy, it is possible to observe a discernible disparity in fairness regarding access to supply points. Within the northern regional cluster (i.e., Lombardia, Veneto, Friuli-Venezia Giulia, Emilia-Romagna, Aosta Valley, Piedmont, Trentino-Alto Adige and Liguria), the Lombardia Region provides a remarkable degree of service accessibility for people over aged 65 relative to those living in the same regional cluster (0.850, see Table 3). Despite the Veneto Region exhibiting the lowest cumulative Gini index (0.812, see Table 4), the distribution of health service coverage is rather constrained within the same regional cluster (0.183, see Table 3). This means that a less-structured supply network does not necessarily make access to services of interest of the older population less equitable in comparison with other geographical areas within the same regional cluster. In this vein, the Liguria Region has a greater cumulative average impact of healthcare distribution compared with the Veneto Region (0.230, see Table 3) but the highest cumulative Gini index within the regional cluster (0.954, see Table 4). This is particularly interesting as the Liguria Region hosts the oldest population of Italy (29%) [39], thus confirming that there exists a geographical imbalance in the health services coverage concerning the older population within the regional cluster. Nonetheless, the Gini index proposed in this study only relies on the spatial distribution of services, thereby representing a measure of global unfairness in territorial access to health services. Indeed, the Friuli-Venezia Giulia Region is ranked second in the list of oldest population (27.2%) [39], but its cumulative Gini index is slightly higher (0.888, see Table 4) than the best in class within the northern regional cluster (i.e., Veneto Region). Consequently, generalizability is prevented, as additional nonspatial factors excluded from the calculation may influence the overall index, such as the regional health policies regulating the equity of access to health services. However, it is important to highlight that the regions comprising the southern regional cluster (i.e., Basilicata, Calabria, Campania, Molise, Puglia, Sardegna, and Sicilia) demonstrate, on average, a higher cumulative Gini index compared with those in the northern regional cluster, with all indexes exceeding 0.9, except for Calabria, which has a slightly lower cumulative Gini index (0.897). This indicates a significant disparity in equity of access to health services for people aged over 65 living in the southern regions when compared with those in the northern ones. Interestingly, this cluster demonstrates a general relatively limited supply network (see Table 3) with the exception of the Campania Region, which achieves an average cumulative effect of 0.865, comparable to the best-performing region in Italy (i.e., Lombardia). This may suggest the existence of disparities in access to the regional supply network related to the presently limited or ineffective distribution of supply points for individuals aged over 65. Indeed, the Campania Region, which has the lowest percentage of individuals aged over 65 in Italy at 20.9% [39], emphasizes the presence of an imbalanced supply network concerning the density of the over-65 resident population, although it holds the highest concentration of territorial services, such as pharmacies and parapharmacies, within the southern regional cluster and across the Italian territory as a whole.
The cluster consisting of regions in Central Italy (Toscana, Umbria, Lazio, Marche, and Abruzzo) represents an intermediate level of fairness in accessibility distribution as compared with the southern regional cluster, which encounters the highest unfairness in access to health services, and the northern cluster exhibits the lowest degree of unfairness (see Table 4). It is significant to note that the Lazio Region points out an association between service distribution and equitable access to the supply network for individuals aged over 65, similar to the southern regional cluster (i.e., Campania Region). This region holds a dense and complex set of supply points weighted for individuals aged over 65, despite having the lowest demographic representation within the cluster (22.6%), while exhibiting the highest level of accessibility equity (0.927, see Table 4). This suggests that incorporating spatial factors into the measurement of fairness in services coverage for individuals aged over 65 could effectively explain the underlying misalignment between healthcare services supply and the older population across Italian regional clusters, even though the findings in the northern regional cluster pave the way for further research.

5. Conclusions

This paper presents a methodological framework for evaluating the fairness of health services distribution for seniors in Italy, using a geographical grid sampling combined with a convolution-based approach inspired by [10,11]. This methodological framework facilitates the processing of extensive administrative and demographic data and a comparative analysis of results across different territorial entities to ensure a clear and precise data visualization for informed decision making. In this view, this study opens the door for creating better technologies that use the proposed methodological model in decision support systems, enhancing the dashboard of accessible information, and developing an effective and user-friendly interface design.
Notwithstanding our results, we believe that several limits of our study must be acknowledged. Future research should improve the methodology’s accuracy by refining how to measure distance. Rather than spatial distance, incorporating traveling distance would provide a more realistic assessment of healthcare accessibility. Additionally, expanding the range of services (e.g., touristic places and restaurants) included in the analysis and assigning appropriate weights to them could account for an innovative measure of accessibility. Analyses at municipal, provincial, and regional levels could also offer insights by considering characteristics such as population density or geographic features (e.g., altitude). This approach would help capture the diversity in service distribution from different points of view. Currently, the same kernel is applied across the entire territory, but creating kernels that dynamically adapt to the intrinsic characteristics of the territory might enhance accuracy. Tailoring these kernels could provide a more precise understanding of how accessibility varies in different contexts.
Moreover, this study uses the Gini coefficient to assess fairness. Future work could explore other indices that might be better suited for spatial applications, such as the Spatial Gini [40,41] or the Generalized Entropy Index [42]. In particular, future research could integrate the Spatial Gini Index—by considering its distance decay function to emphasize local disparities—or the Generalized Entropy Index, whose parameter  α  offers sensitivity to different disparity levels. Both indices allow for decomposing overall inequality into within-group and between-group components, thereby providing insights into local and regional inequities and offering a more comprehensive assessment of spatial fairness in healthcare access when compared with the conventional Gini coefficient.

Author Contributions

D.D.R.: conceptualization, methodology, software, results analysis, writing. F.M.: conceptualization, formal analysis, results analysis, writing, revision. G.D.F.: results analysis, revision. All authors have read and agreed to the published version of the manuscript.

Funding

This publication was produced with the co-funding of European Union—Next Generation EU, in the context of the National Recovery and Resilience Plan, PE8—Mission 4, C2, Intervention 1.3—“Conseguenze e sfide dell’invecchiamento”, Project Age-It (AGE—IT—A Novel Public-private Alliance to Generate Socioeconomic, Biomedical and Technological Solutions for an Inclusive Italian Ageing Society—Ageing Well in an Ageing Society)—AGE-IT—PEO0000015—CUP: H43C22000840006. The views and opinions expressed are only those of the authors and do not necessarily reflect those of the European Union or the European Commission. Neither the European Union nor the European Commission can be held responsible for them.

Data Availability Statement

All data used in this study are open access. However, the source code, the dataset considered, and the obtained results can be made available upon request.

Acknowledgments

We thank Cecilia Tomassini and Rocco Oliveto for their valuable insights during the development of the manuscript.

Conflicts of Interest

The authors declare that they have no conflicts of interest.

References

  1. Cheng, L.; Yang, M.; De Vos, J.; Witlox, F. Examining geographical accessibility to multi-tier hospital care services for the elderly: A focus on spatial equity. J. Transp. Health 2020, 19, 100926. [Google Scholar] [CrossRef]
  2. Wang, F.; Luo, W. Assessing spatial and nonspatial factors for healthcare access: Towards an integrated approach to defining health professional shortage areas. Health Place 2005, 11, 131–146. [Google Scholar] [CrossRef] [PubMed]
  3. Carroll, C.; Sworn, K.; Booth, A.; Tsuchiya, A.; Maden, M.; Rosenberg, M. Equity in healthcare access and service coverage for older people: A scoping review of the conceptual literature. Integr. Healthc. J. 2022, 4, e000092. [Google Scholar] [CrossRef]
  4. Levesque, J.F.; Harris, M.F.; Russell, G. Patient-centred access to health care: Conceptualising access at the interface of health systems and populations. Int. J. Equity Health 2013, 12, 18. [Google Scholar] [CrossRef]
  5. Wu, H.C.; Tseng, M.H. Evaluating disparities in elderly community care resources: Using a geographic accessibility and inequality index. Int. J. Environ. Res. Public Health 2018, 15, 1353. [Google Scholar] [CrossRef]
  6. Cheng, Y.; Wang, J.; Rosenberg, M.W. Spatial access to residential care resources in Beijing, China. Int. J. Health Geogr. 2012, 11, 32. [Google Scholar] [CrossRef]
  7. Iyer, H.S.; Flanigan, J.; Wolf, N.G.; Schroeder, L.F.; Horton, S.; Castro, M.C.; Rebbeck, T.R. Geospatial evaluation of trade-offs between equity in physical access to healthcare and health systems efficiency. BMJ Glob. Health 2020, 5, e003493. [Google Scholar] [CrossRef]
  8. Peters, D.H.; Garg, A.; Bloom, G.; Walker, D.G.; Brieger, W.R.; Hafizur Rahman, M. Poverty and access to health care in developing countries. Ann. N. Y. Acad. Sci. 2008, 1136, 161–171. [Google Scholar] [CrossRef]
  9. Calovi, M.; Seghieri, C. Using a GIS to support the spatial reorganization of outpatient care services delivery in Italy. BMC Health Serv. Res. 2018, 18, 883. [Google Scholar] [CrossRef]
  10. Han, J.; Jiang, W.; Shi, J.; Xin, S.; Peng, J.; Liu, H. A method for assessing the fairness of health resource allocation based on geographical grid. Comput. Mater. Contin. 2020, 64, 1171–1184. [Google Scholar] [CrossRef]
  11. Pinto, D.M.; Russo, D.D.; Sudoso, A.M. Optimal Placement of Nature-Based Solutions for Urban Challenges. arXiv 2025, arXiv:2502.11065. [Google Scholar]
  12. Zhang, W.; Chen, G.; Zhuang, P.; Zhao, W.; Zhou, L. CATNet: Cascaded attention transformer network for marine species image classification. Expert Syst. Appl. 2024, 256, 124932. [Google Scholar] [CrossRef]
  13. Zhang, W.; Li, Z.; Li, G.; Zhuang, P.; Hou, G.; Zhang, Q.; Li, C. GACNet: Generate adversarial-driven cross-aware network for hyperspectral wheat variety identification. IEEE Trans. Geosci. Remote Sens. 2023, 62, 5503314. [Google Scholar] [CrossRef]
  14. Capobianco, G.; Cerrone, C.; Di Placido, A.; Durand, D.; Pavone, L.; Russo, D.D.; Sebastiano, F. Image convolution: A linear programming approach for filters design. Soft Comput. 2021, 25, 8941–8956. [Google Scholar] [CrossRef]
  15. Erdenee, O.; Paramita, S.A.; Yamazaki, C.; Koyama, H. Distribution of health care resources in Mongolia using the Gini coefficient. Hum. Resour. Health 2017, 15, 56. [Google Scholar] [CrossRef]
  16. Pu, L. Fairness of the distribution of public medical and health resources. Front. Public Health 2021, 9, 768728. [Google Scholar] [CrossRef]
  17. Lee, J.K.; Alshehri, S.; Kutbi, H.I.; Martin, J.R. Optimizing pharmacotherapy in elderly patients: The role of pharmacists. Integr. Pharm. Res. Pract. 2015, 4, 101–111. [Google Scholar] [CrossRef]
  18. della Salute, M. Open Data per la Salute Pubblica. 2024. Available online: https://www.dati.salute.gov.it/dati/homeDataset.jsp (accessed on 1 October 2024).
  19. Contributors, O. Open Street Map. 2017. Available online: https://www.openstreetmap.org/#map=6/42.09/12.56 (accessed on 1 October 2024).
  20. ISTAT. Banca Dati Istat. 2024. Available online: http://dati.istat.it/Index.aspx (accessed on 1 October 2024).
  21. Khan, S.; Mohiuddin, K. Evaluating the parameters of ArcGIS and QGIS for GIS Applications. Int. J. Adv. Res. Sci. Eng. 2018, 7, 582–594. [Google Scholar]
  22. QGIS. QGIS Geographic Information System; QGIS Association: Grüt, Switzerland.
  23. Guagliardo, M.F. Spatial accessibility of primary care: Concepts, methods and challenges. Int. J. Health Geogr. 2004, 3, 3. [Google Scholar] [CrossRef]
  24. Hui, E.C.; Chau, C.K.; Pun, L.; Law, M. Measuring the neighboring and environmental effects on residential property value: Using spatial weighting matrix. Build. Environ. 2007, 42, 2333–2343. [Google Scholar] [CrossRef]
  25. NUVAP. Aggiornamento 2020 della Mappa delle Aree Interne; Nota Tecnica NUVAP: Rome, Italy, 2022. [Google Scholar]
  26. Castell, M.V.; Sánchez, M.; Julián, R.; Queipo, R.; Martín, S.; Otero, Á. Frailty prevalence and slow walking speed in persons age 65 and older: Implications for primary care. BMC Fam. Pract. 2013, 14, 86. [Google Scholar] [CrossRef] [PubMed]
  27. Belcore, E.; Colucci, E.; Aicardi, I.; Angeli, S. Analisi, classificazione e visualizzazione di dati UAV ad alta risoluzione spaziale e spettrale con l’utilizzo di FOSS. In FOSS4G Italia 2020 Raccolta Abstract; FOSS4G IT: Portland, OR, USA, 2020; pp. 31–32. [Google Scholar]
  28. Amaduzzi, S.; Pascolini, M. GIS e metodi di analisi territoriale. Una proposta per la caratterizzazione del paesaggio italiano. Dalla Mappa Al GIS 2011, 1, 13–32. [Google Scholar]
  29. QGis. Rasterize (Vector to Raster). Available online: https://download.qgis.org/qgisdata/QGIS-Documentation-2.6/live/html/it/docs/user_manual/processing_algs/gdalogr/gdal_conversion/rasterize.html (accessed on 1 October 2024).
  30. ArcGis. ArcGIS—Rasterize Features Function. Available online: https://pro.arcgis.com/en/pro-app/latest/help/analysis/raster-functions/rasterize-features-function.htm (accessed on 1 October 2024).
  31. GDAL. GDAL—Rasterize. Available online: https://gdal.org/en/stable/programs/gdal_rasterize.html (accessed on 1 October 2024).
  32. Lujak, M.; Salvatore, A.; Fernández, A.; Giordani, S.; Cousy, K. How to fairly and efficiently assign tasks in individually rational agents’ coalitions? Models and fairness measures. Comput. Sci. Inf. Syst. 2024, 21, 269–289. [Google Scholar] [CrossRef]
  33. Dorfman, R. A formula for the Gini coefficient. Rev. Econ. Stat. 1979, 61, 146–149. [Google Scholar] [CrossRef]
  34. Chen, Y.; Ge, Y.; Yang, G.; Wu, Z.; Du, Y.; Mao, F.; Liu, S.; Xu, R.; Qu, Z.; Xu, B.; et al. Inequalities of urban green space area and ecosystem services along urban center-edge gradients. Landsc. Urban Plan. 2022, 217, 104266. [Google Scholar] [CrossRef]
  35. Dixon, P.M.; Weiner, J.; Mitchell-Olds, T.; Woodley, R. Bootstrapping the Gini coefficient of inequality. Ecology 1987, 68, 1548–1551. [Google Scholar] [CrossRef]
  36. Benassi, F.; Tomassini, C.; Di Felice, G. Spatial Heterogeneities or Inequalities? Health Care Supply and Demand of the Older Population in Italy. Appl. Spat. Anal. Policy 2025, 18, 44. [Google Scholar] [CrossRef]
  37. Luo, W.; Qi, Y. An enhanced two-step floating catchment area (E2SFCA) method for measuring spatial accessibility to primary care physicians. Health Place 2009, 15, 1100–1107. [Google Scholar] [CrossRef]
  38. Higgs, G. A literature review of the use of GIS-based measures of access to health care services. Health Serv. Outcomes Res. Methodol. 2004, 5, 119–139. [Google Scholar] [CrossRef]
  39. ISTAT. Indicatori Demografici: Regione Liguria, Friuli Venezia Giulia, Campania. 2024. Available online: http://dati.istat.it/Index.aspx?QueryId=18563# (accessed on 28 January 2025).
  40. Mucciardi, M.; Benassi, F. Measuring the spatial concentration of population: A new approach based on the graphical representation of the Gini index. Qual. Quant. 2023, 57, 5193–5211. [Google Scholar] [CrossRef]
  41. Rey, S.J.; Smith, R.J. A spatial decomposition of the Gini coefficient. Lett. Spat. Resour. Sci. 2013, 6, 55–70. [Google Scholar] [CrossRef]
  42. Mussard, S.; Seyte, F.; Terraza, M. Decomposition of Gini and the generalized entropy inequality measures. Econ. Bull. 2003, 4, 1–6. [Google Scholar]
Figure 1. Example of Rome’s population distribution, with each 1 km2 tile labeled by the number of residents.
Mathematics 13 01448 g001
Figure 2. The figure summarizes the methodology flow of information from data retrieval to application of the Gini coefficient in the analysis of results.
Mathematics 13 01448 g002
Figure 3. This figure shows an example of the convolution procedure. First, (a) displays the original  5 × 5  image matrix with its corresponding pixel values. This matrix corresponds to the service matrix  R t , where a value of 1 (i.e., in blue) indicates the presence of the service and 0 (i.e., in black) indicates its absence. The kernel  K t , which describes the impact of the service, is shown in (b). It is applied to the input image presented in (c).We note that the red arrows represents the movement of the kernel over the image. Finally, (d) shows the pixel values of the resulting filtered image after applying the convolution formula presented in Equation (1).
Mathematics 13 01448 g003
Figure 4. Figure 3 illustrates an example of the weighting procedure applied to the convolution results. (a) displays the pixel values of the filtered image obtained after convolving with the kernel  k t  associated with the service of interest. (b) shows the population matrix P in the area of interest. Finally, (c) presents the weighted results (i.e., the impact matrix  C t ) derived from the element-wise multiplication of the population matrix P with the convolution result. This figure also reports the outcome of Equation (2).
Mathematics 13 01448 g004
Figure 5. Flowchart illustrating the process used to compute the matrix  C t  by convolving the resource matrix  R t  with the corresponding service kernel  K t . The algorithm iterates over each tile  ( i , j )  applying the convolution formula at each step.
Mathematics 13 01448 g005
Figure 6. The maps show the impact of the services considered over the Italian territory weighted by the population aged over 65. Dark green indicates regions with the highest service levels and concentrations of aged residents, whereas gray zones denote areas lacking population (e.g., the Alps, which are largely uninhabited) or areas without health services. The maps contain the impact of (a) pharmacy, (b) parapharmacy, (c) hospital, and (d) their cumulation.
Mathematics 13 01448 g006
Figure 7. The figure reports the impact of the three services over the Italian territory weighted by the population aged over 65. The x-axis lists the regions, while the y-axis shows the percentage of the average impact for each region. The regions are sorted from the one with the highest impact level to the one with the lowest. The orange line represents the cumulative percentage of the total impact moving from left to right across the regions. (a) contains the average impact for all services, while (bd) contain the region details for each service.
Mathematics 13 01448 g007
Table 1. Example of the processed healthcare services data (hospitals, pharmacies, and parapharmacies). The original dataset included additional attributes that were removed as they were not relevant for this study.
TypeNameAddressMunicipalityLatitudeLongitude
Hospitalospedale ca’ granda-niguarda—milanoPiazza Ospedale Maggiore 3Milano45.50912269.1890984
fondaz.irccs ca’ granda—ospedale maggiVia Francesco Sforza, 28Milano45.46047899.1957932
Pharmacycomunale ponte vittorioCorso Vittorio Emanuele, 343Roma41.720387812.713078
farmacia durazzano srlViale XXI Aprile, 42-42aRoma41.923680912.571148
Parapharmacyparafarmacia dott.ssa valeria di pintoVia Torino, 12Termoli41.992674514.969991
parafarmacia di lombardi antoniaViale Trieste N.9Termoli42.001507614.990566
Table 2. Kernel of size  5 × 5  used to estimate the impact of a parapharmacy.
0.10.10.10.10.1
0.10.550.550.550.1
0.10.551.00.550.1
0.10.550.550.550.1
0.10.10.10.10.1
Table 3. Results of the methodology showing the total and average impact of health services in Italy. The table reports the impact of individual services and the cumulative impact.
RegionPharmacyParapharmacyHospitalCumlative Effect
TotalAverageTotalAverageTotalAverageTotalAverage
NorthValle d’Aosta0.0010.0110.0040.0230.0010.0090.0020.014
Veneto0.1670.2010.2780.2060.1160.1420.1870.183
Piemonte0.4210.3830.6600.3700.2040.1880.4280.314
Liguria0.1190.2870.2390.3560.0190.0460.1260.230
Lombardia1.0000.9840.9340.5671.0001.0000.9780.850
Trentino-Alto Adige0.0070.0140.0240.0290.0100.0190.0140.020
Friuli Venezia Giulia0.0340.1120.0930.1870.0170.0550.0480.118
Emilia-Romagna0.1280.1450.5790.4030.1300.1490.2790.232
CentreToscana0.1500.1420.3580.2080.1000.0950.2030.148
Umbria0.0140.0440.0740.1500.0110.0370.0330.077
Lazio0.7250.7681.0000.6540.3610.3880.6950.603
Marche0.0260.0650.0860.1350.0190.0480.0430.083
Abruzzo0.0270.0700.1650.2670.0170.0460.0700.128
SouthBasilicata0.0050.0140.0670.1210.0060.0170.0260.051
Calabria0.0230.0370.1770.1750.0240.0380.0740.083
Campania0.5521.0000.8951.0000.3230.5950.5900.865
Molise0.0030.0180.0140.0570.0050.0340.0070.036
Puglia0.1030.0660.5510.2190.0520.0340.2350.107
Sardegna0.0260.0350.2000.1670.0150.0210.0800.074
Sicilia0.1680.0770.7150.2020.0930.0430.3250.107
Table 4. Gini index values computed for pharmacies, parapharmacies, and hospitals (i.e.,  n C t  for each service  t T ) across Italian regions. The regions are listed in the first column, followed by the Gini index for each type of service (pharmacy, parapharmacy, and hospital). The last column shows the Gini values computed on the cumulative impact matrix  n C . The regions with the lowest and highest values in the “Cumulated” column represent, respectively, the regions with the most and least equal distribution of healthcare services.
RegionGini Index
PharmacyParapharmacyHospitalCumulated
NorthValle d’Aosta0.9210.9860.8780.908
Veneto0.8440.9640.7750.812
Piemonte0.9730.9880.9030.937
Liguria0.9700.9860.8990.954
Lombardia0.9310.9660.8630.881
Trentino-Alto Adige0.9570.9920.9340.945
Friuli Venezia Giulia0.9010.9800.8370.888
Emilia-Romagna0.9260.9860.8600.899
CentreToscana0.9420.9840.8760.909
Umbria0.9180.9860.8540.904
Lazio0.9660.9740.8980.927
Marche0.8790.9750.8330.871
Abruzzo0.8950.9800.8250.896
SouthBasilicata0.9500.9880.9080.953
Calabria0.8920.9700.8570.897
Campania0.9520.9700.8850.913
Molise0.9120.9910.8830.907
Puglia0.9300.9670.8980.928
Sardegna0.9640.9830.9250.956
Sicilia0.9440.9730.8980.929
Disclaimer/Publisher’s Note: The statements, opinions and data contained in all publications are solely those of the individual author(s) and contributor(s) and not of MDPI and/or the editor(s). MDPI and/or the editor(s) disclaim responsibility for any injury to people or property resulting from any ideas, methods, instructions or products referred to in the content.

