Article

Port–Shipping Interplay: A Multi-Stage Analysis of Facility Upgrades and Cargo Movement

1
School of Business, Huaiyin Normal University, Huaian 223001, China
2
School of Business, Macau University of Science and Technology, Macau, China
*
Authors to whom correspondence should be addressed.
Mathematics 2025, 13(7), 1152; https://doi.org/10.3390/math13071152
Submission received: 18 February 2025 / Revised: 26 March 2025 / Accepted: 27 March 2025 / Published: 31 March 2025

Abstract

:
The ports and shipping industry is crucial in the global supply chain. Amid complex market and geopolitical dynamics, strengthening stakeholder collaboration becomes imperative to enhance maritime supply chain profit. Therefore, we develop a three-stage game model consisting of a port operator and a shipping company. We consider the impact of upgrading port facilities with advanced technology on the logistic decisions of the shipping company. In the first stage, the port decides whether to invest in upgrades, while the shipping company chooses one-way or two-way logistics. In subsequent stages, the port sets cargo handling charges, and the shipping company determines the freight rate. Equilibria under decentralized and centralized decision frameworks are derived. The equilibrium results show that market size has a significant effect on the shipping company’s choice. Specifically, the shipping company prefers two-way logistics when the market size is moderate, while one-way logistics is preferred when the market size is large or small. In addition, based on the fixed costs associated with port facility upgrades and two-way logistics, it is found that there exist three possible equilibria. Moreover, further analysis suggests that collaboration between the two parties, under appropriate financial conditions, can result in mutually beneficial outcomes. Our findings highlight the critical role of port–shipping company collaboration in enhancing operational efficiency and achieving greater mutual benefits.

1. Introduction

The maritime industry has undergone significant transformations in recent years due to increased market competition, local political conflicts, and traffic congestion, which have significantly impacted the profits of maritime supply chain stakeholders [1]. In particular, COVID-19 has disrupted global shipping activities in the past few years as countries imposed stringent navigational policies. During this period, the disruption of the maritime supply chain has caused heavy losses to the global economy and trade [2]. Although the import and export trade has resumed, surging demand and cargo flow imbalance still place enormous pressure on ports and shipping companies [3]. The impact of shipping disruptions on the global economy highlights the need to enhance decision-making flexibility among maritime supply chain members, which has also become a common concern for policymakers, stakeholders, and researchers. Ports, an essential member of the maritime supply chain, are not only points of transit but also key facilitators of trade efficiency [4,5]. They handle cargo loading and unloading while providing the infrastructure support for the shipping lines to operate efficiently [3]. Recently, governments have adopted ports as a policy tool to promote growth in related maritime sectors to avoid the risks caused by unbalanced and uncertain market demand [6].
Facing an increasingly complex world and diverse market demands, shipping companies prefer to select ports with high efficiency, large capacity, and advanced infrastructure as hubs to ensure high service quality and minimize risks. Shanghai Port has become one of the busiest container ports in the world based on its world-class infrastructure and automated loading and unloading systems [4]. Traditional shipping clusters that focus only on cargo handling will gradually decline, such as Naples and Liverpool. Thus, the inevitable trend for port development is to adopt more advanced maritime technologies to provide more comprehensive logistics and high value-added services and satisfy growing marine demands while maintaining competitiveness [4]. More and more port operators upgraded facilities to improve cargo handling efficiency and attract services beyond traditional businesses, such as legal services and insurance, to add more value to the maritime services industry and enhance risk resistance capabilities [7]. For example, artificial intelligence (AI) technology has powerful predictive analysis capabilities. If port operators adopt AI technology, it can reduce the impact of environmental uncertainty on ports, help them quickly respond to various potential risks, effectively improve the quality of port services in the maritime supply chain, and generate more revenue.
Differing from port operators who face the problems of port upgrading and transformation, shipping companies feel the increasing pressure from backhaul issues in two-way transportation as trade demands and port operations evolve. Backhaul arises from asymmetric demand between inbound and outbound shipping volumes. It is often observed that outbound demand surpasses inbound demand and even faces the issue of empty return voyages for shipping companies [5,8,9]. Therefore, the problem of backhaul shipping considerably escalates operational expenses and poses significant logistical challenges for shipping companies [9]. To mitigate costs and better meet customer needs, shipping companies must make appropriate ship route decisions to balance the cost of loading and unloading containers on long-distance liner service routes while avoiding risks [9]. Facing a significant cost imbalance or other natural or artificial risks, shipping companies must consider the advantages of one-way transportation. In contrast to two-way logistics, this approach focuses solely on the shipping demand from the departure port to the destination port without taking the demand for backhaul shipping into account, which can eliminate the inefficiency of returning empty containers [10]. Recently, the topic of strategic decision-making processes of port operators and shipping companies within complex markets has become increasingly popular.
Several studies [11,12,13] have shown that vertical integration is beneficial for optimizing port operations and enhancing the efficiency of the maritime supply chain. Zhao and Sun [13] developed a two-stage game model to examine how port investment decisions and cooperation mechanisms benefit ports and shipping liners. However, it remains to be determined how the port operator facility upgrade decisions and shipping company route selection decisions interact and how they affect the efficiency of the maritime supply chain. Few studies have explored the interaction between the two.
To bridge this gap, we developed a three-stage game model consisting of a port operator and a shipping company to analyze their interactions. We used the game theory modeling approach inspired by Adler et al. [14] and the foundational work of Zhao and Sun [13]. Following this model, we can investigate the influence of port facility upgrades and shipping company logistics decisions on port vertical integration. We aim to answer the following questions: What impact does the port operator with advanced technology in its facilities have on its own and downstream shipping companies’ profits? What is the interaction between the upgrade decision of port operators’ facilities and shipping companies’ choice of one-way or two-way logistics? How can we coordinate the strategic decisions of port operators and shipping companies to achieve Pareto improvement?
Based on the derived equilibrium results, we first found that shipping companies prefer two-way logistics when the potential market size is moderate but shift towards one-way logistics when the market size is very large or very small. Second, our analysis reveals three potential equilibria depending on the fixed costs of port facility upgrades and two-way logistics. If these costs are moderate, the shipping company and port operator may reach one of two pure strategy equilibria—either both opting for upgrades and two-way logistics or neither investing in upgrades and the shipping company choosing one-way logistics. Otherwise, they may converge to a mixed strategy equilibrium where each party probabilistically decides whether to upgrade or adopt two-way logistics. The optimal decision to upgrade facilities depends on fixed costs and whether the shipping company chooses two-way logistics. Last, our results suggest that collaboration between the two parties can lead to mutually beneficial outcomes under the right financial terms.
This study contributes in several ways. Specifically, although several studies [15,16] have discussed the role of upgrading port facilities in the maritime supply chain through empirical research, we constructed a game model to study how port facility upgrades affect the decisions and profit of shipping companies and the maritime supply chain. The model highlights the interaction between port infrastructure upgrades and shipping companies’ route optimization strategies. Secondly, the imbalance of transportation volume in sea freight has always been a problem that troubles shipping companies and scholars [17,18,19]. We analyze the optimal decisions for shipping companies regarding one-way or two-way logistics in different market sizes. Based on existing literature [20,21,22], we further explore port cooperation and the coordinating role of revenue-sharing contracts in the maritime supply chain. We find that revenue-sharing contracts could be beneficial for both parties under certain circumstances. Cooperation, facility upgrades, and route selection in different market sizes are all beneficial for improving the maritime supply chain to withstand risks.
The remainder of the paper is organized as follows. Section 2 reviews the most related work in the literature. Section 3 presents the three-stage game model. Section 4 examines the decentralized equilibrium results for port and shipping companies. The centralized equilibrium results are derived in Section 5. Section 6 is a case study. In Section 7, conclusions are drawn from the results. For the sake of clarity, all proofs are provided in the Appendix A.

2. Literature Review

Most related studies in the literature can be divided into three streams: Section 2.1 addresses maritime industrial transformation and upgrading, Section 2.2 examines back-haul shipping, and Section 2.3 pertains to port cooperation.

2.1. Maritime Industrial Transformation and Upgrading

The number and scale of ships calling at seaports are increasing worldwide, which has put pressure on port resources and infrastructure. The increased ship waiting time indicates that ports are struggling to cope with this pressure [23]. Gong et al. [24] found that new infrastructure contributes to upgrading the industrial structure using the instrumental variables analysis based on Chinese inter-provincial panel data from 2003 to 2017. Continuously upgrading their facilities, services, and operational processes enables them to address these challenges. Since the “Belt and Road” launch, China strategically prioritized port infrastructure investments and expedited the development of globally competitive shipping hubs to reinforce its maritime connectivity Zhao and Sun [13]. The Ministry of Transport issued a guideline in 2014 that promotes port transformation and upgrading and requires port operators to shift from mainly providing loading and unloading services to providing both loading and unloading services and modern port services and from primarily pursuing throughput growth to focusing on improving quality and efficiency [25]. Diniz et al. [3] reviewed 117 port-related studies published between 2017 and 2022, summarizing the emerging trends in port development within sustainable development. Recently, using 2006–2019 data from 11 Chinese coastal provinces, Cui et al. [26] analyzed policy impacts on transforming and upgrading marine structures.
Yang et al. [27] proposed a feasible path for transforming the port industry with overcapacity. It has been claimed that digital transformation in the maritime sector would promote economic benefits [28]. Several studies [15,16] have discussed the role of upgrading port facilities to reduce energy consumption in the green development of maritime transportation. Ding et al. [29] examined the role of technical and financial support positively affecting the upgrading of the marine industrial structure using panel data from coastal cities around the Bohai Sea from 2006 to 2020. Vrakas et al. [30] argued that technological advances and process optimization can improve various aspects of port operational performance. Zhang et al. [31] developed new indicators that measure the development of the marine economy, including the convenience of facilities and equipment and the level of technological progress.
Research in this stream primarily focuses on empirical analysis to analyze factors that affect industrial upgrading, but very little research has examined how upgrading decisions affect profitability.

2.2. Backhaul Shipping

Maritime transportation plays a dominant role in various modes of transportation, so the imbalanced round-trip transportation volume, which is manifested in the concentration of transportation flow in one dominant direction in ocean shipping, is more likely to have greater economic consequences [17,18,19]. And then, this results in asymmetric transportation costs that affect the carrier’s profits [32]. Ishikawa and Tarui [33] constructed a duopoly game model to verify that transportation costs are affected by backhaul problems and vary depending on the trade protection policies of each country.
Therefore, studying the backhaul shipping decisions in the two-way transportation of shipping companies can help improve shipping costs for shipping companies, while also being related to maritime supply chains and regional economic development. Lee et al. [34] mentioned that trade surplus will reduce the rate of empty loads of return transportation, thereby lowering transportation costs. Ardelean and Lugovskyy [35] empirically explored the price discrimination within the route in liner shipping and condition it on market density, indicating that reducing market power distortion in the transportation sector may amplify price discrimination in importing industries. Wong [36] and Hayakawa et al. [37] both analyzed the impact of different policies on the costs of passenger transport and the impact on the selection of the route of the shipping company. Rahayu et al. [38] examined ways to improve maritime transport in Indonesia, with a particular focus on addressing the backhaul issue. Kuhlemann et al. [39] studied how shipping companies manage inventory and reduce empty loads in the presence of uncertainty of demand and uncertainty of transport time by building a two-stage stochastic model. Chen et al. [40] built a monopoly model to analyze the carrier’s pricing strategy and discuss under what conditions should the carrier ship waste instead of repositioning empty containers. In addition, Zhou and Lee [41] and Xu et al. [42] study the optimal pricing decision of shipping companies considering backhaul shipping problems.
In two-way transportation, many scholars have discussed the repositioning and pricing decisions of shipping companies for empty containers. However, few studies have considered the impact of port decisions on shipping companies’ two-way logistics.

2.3. Port Cooperation

Port systems are the key nodes in global supply chains, and the port is an important member of the maritime supply chain. With the development of maritime transportation, port cooperation is becoming increasingly important because it can effectively enhance collective competitiveness [20,21,22] and alleviate the problem of pollution [43]. Thus, cooperation between ports and shipping companies is particularly important [44]. Based on the research of Luo et al. [22], we found that previous studies mainly focused on the development and impact of port cooperation and integration, reviewing 28 literature on port cooperation topics.
The types of port cooperation are very diverse, mainly divided into horizontal cooperation and vertical cooperation [45]. Xu and Lee [46] examined port supply chain integration between a port and its shipping line and compared competition contracts between shipping lines under vertically mixed market competition. Wang et al. [47] formulated a port’s pricing strategy choice of whether to charge a uniform or two different service prices in the competitive market. Zhang et al. [48] constructed a two-stage game model to compare horizontal integration with vertical integration and concluded that horizontal integration can reduce shipping costs and maximize overall benefits. The concept of competition and cooperation among members in game theory can provide a theoretical basis for port cooperation [49]. However, only three papers focusing on port cooperation adopted game theory as a research method to study vertical integration [22]. Zheng and Luo [50] adopted dynamic game models to analyze the relationship between ports and other members in the maritime supply chain, indicating that it is beneficial for local social welfare. Zhao and Sun [13] constructed a two-stage game model consisting of a shipping company and two heterogeneous ports to explore port equilibrium price decisions and shipping company equilibrium investment decisions in port cooperation. Meng et al. [51] constructed a game model between ports and shipping companies under government regulation and analyzed the joint emission reduction strategies of ports and shipping companies under different government regulations and port incentives. Shi et al. [52] conclude that ports can integrate with inland logistics providers to improve the efficiency and resilience of maritime supply chains. In general, the literature on port cooperation is still relatively scarce despite growing interest in the field, particularly concerning vertical integration [53], which is where our study lies.
While previous studies have extensively examined maritime industrial upgrading, backhaul shipping decisions, and port cooperation, they often analyze these aspects in isolation. In contrast, our research integrates these dimensions within a game-theoretical framework to investigate the role of port and shipping company collaboration in optimizing operational efficiency and maximizing mutual benefits. The gap between the existing literature and our research is shown in Table 1.

3. Model Description

We consider a port operator (she) and a liner container shipping company (he) in the context of port upgrades. Port upgrading in this study refers to port operators introducing advanced technology to existing infrastructure to improve operational efficiency and analytical capabilities. The upgraded port can attract and induce additional business as a result, and we set the proportion of business brought about by the port upgrade as b, 0 < b < 1 . To simplify the analysis, the shipping company in the model can be viewed as an aggregate of all associated shipping companies. During midterm strategic planning, the port operator needs to determine whether to upgrade the port to attract additional demand, and the shipping company needs to determine whether the logistics should be carried out one way or two ways within a single round trip; as part of their short-term tactical decision making, the port operator ought to determine her handling charge per 20-foot equivalent unit (TEU), and the shipping company has to decide on their freight rate per TEU.
To understand their implications for both parties involved, a three-stage game-theoretic model is developed to examine the interplay between midterm and short-term decision-making processes. And, the decision-making processes of both parties satisfied profit maximization in all scenarios. Specifically, in the first stage, the port operator decides whether to upgrade her facilities, while the shipping company simultaneously decides whether to engage in one-way or two-way logistics in a single round-trip. In the paper, one-way logistics refers to shipping companies not considering the backhaul shipping demand, while two-way logistics represent the shipping company considering both the demand from the departure port to the destination port and the shipping demand from the destination port back to the departure port. According to what was previously stated, she has two decision options about facilities upgrade (upgrade or not), and he also has two choices about backhaul shipping (one-way or two-way logistics). We obtain a 2 × 2 framework with four possible game scenarios in the decision-making process between shipping companies and terminal operators:
  • Port upgrade with two-way logistics (UT): The port operator upgrades facilities, that is, introduces artificial intelligence technology to existing infrastructure, and the shipping company makes two port calls, ensuring backhaul cargo transport.
  • No upgrade with two-way logistics (NT): The port operator does not upgrade facilities, and the shipping company makes two port calls, ensuring backhaul cargo transport.
  • Port upgrade with one-way logistics (UO): The port operator upgrades facilities, that is, introduces artificial intelligence technology to existing infrastructure, but the shipping company opts for only a single port call, not taking backhaul cargo.
  • No upgrade with one-way logistics (NO): The port operator does not upgrade facilities, and the shipping company makes one port call without backhauling.
In the second stage, the port operator determines her unit handling charge (w) to maximize her total profit. In the third stage, the shipping company decides on the freight rate (p) to maximize profit. The sequence of events in this three-stage game is illustrated in Figure 1. The notations used in this paper are summarized in Table A1.

3.1. Upgrade with Two-Way Logistics (UT)

In the UT scenario, during midterm strategic planning, the port operator decides to introduce advanced technology to upgrade existing facilities, and the shipping company uses the port for both outbound and inbound backhaul cargo. After that, during short-term decision-making, the port operator sets her handling charge w per TEU, followed by the shipping company deciding on their freight rate p per TEU. Both parties aim to maximize their profits.
Assuming a linear demand function, the quantity of outbound freight in TEUs is determined by ( a + ξ ) p and the quantity of backhaul freight in TEUs is calculated as ( a + ξ ) ϕ p , where a represents the baseline market size for freight in TEUs, ξ denotes the incremental freight demand attributed to the port’s facility upgrade, and ϕ signifies the load factor for backhaul freight.
Accordingly, the shipping company’s gross profit is calculated as follows, where F s is the fixed cost associated with backhauling for the shipping company.
π s = ( p w ) ( a + ξ ) p + ( p w ) ( a + ξ ) ϕ p F s = ( p w ) ( a + ξ ) ( 1 + ϕ ) 2 p F s
The port operator’s revenue from handling outbound freight is w ( a + ξ ) p , and its revenue from handling backhaul freight is w ( a + ξ ) ϕ p . In addition to handling charges, the port is able to secure additional business through her value-added services, such as customs clearance. The proportion of cargo associated with the port’s value-added service is denoted by b and the price of this service is denoted by p t . Therefore, the port’s additional revenue from this service is calculated as b p t ( a + ξ ) p + b p t ( a + ξ ) ϕ p . In addition, F p is the cost of upgrading the port facility. As a result, the total profit of the port operator is
π p = w ( a + ξ ) p + w ( a + ξ ) ϕ p + b p t ( a + ξ ) p + b p t ( a + ξ ) ϕ p F p = w + b p t ( a + ξ ) ( 1 + ϕ ) 2 p F p
Subsequently, the port sets her handling charge, followed by the shipping company pricing their freight rate. The equilibrium outcomes of this subgame in the scenario UT are derived and summarized in Proposition 1.
Proposition 1.
Under scenario UT, the equilibrium freight rate is p U T = 3 ( a + ξ ) ( 1 + ϕ ) 8 b p t 4 and the equilibrium port handling charge is w U T = ( a + ξ ) ( 1 + ϕ ) 4 b p t 2 . The corresponding profit of the shipping company is
π s U T = ( a + ξ ) ( 1 + ϕ ) 8 + b p t 4 ( a + ξ ) ( 1 + ϕ ) 4 + b p t 2 F s ,
and the corresponding profit of the port operator is
π p U T = ( a + ξ ) ( 1 + ϕ ) 4 + b p t 2 ( a + ξ ) ( 1 + ϕ ) 4 + b p t 2 F p .
Proposition 1 indicates that both the equilibrium freight rate p U T and the equilibrium port handling charge w U T increase in a, ξ and ϕ , while decreasing in b and p t . As the values of a, ξ , or ϕ go up, the overall market size expands, allowing the shipping company to levy higher rates on their customers and enabling the port operator to impose higher service charge on the shipping company. Conversely, as b or p t increases, which reflects the proportion and price of value-added logistics services, the port operator’s revenue from these additional services goes up. In response to this, the port operator reduces the handling charge w U T , thereby reducing p U T , making her service more attractive to a larger customer base and potentially increasing its total revenue.

3.2. No Upgrade with Two-Way Logistics (NT)

In the NT scenario, during midterm strategic planning, the port operator decides not to upgrade facilities, and the shipping company uses the port for both outbound and inbound backhaul cargo.
Given a specific freight rate p, the quantity of outbound freight in TEUs is a p , and the quantity of backhaul freight in TEUs a ϕ p . The gross profit of the shipping company is then calculated as
π s = ( p w ) a ( 1 + ϕ ) 2 p F s .
The port operator’s revenue from the outbound shipping is w a p , and her revenue from the inbound shipping is w a ϕ p . Furthermore, by facilitating trade with the shipping company, the port operator is able to attract additional value-added services, leading to extra revenue streams, which is b p t a p + b p t a ϕ p . Therefore, the total profit for the port operator is then determined by
π p = w + b p t a ( 1 + ϕ ) 2 p .
Afterward, in the phase of short-term decision-making within the NT scenario, the port operator sets the terminal handling charge w to maximize her profit first. Then, the shipping company determines the freight rate p to maximize their profit. The equilibrium results that stem from this subgame in the scenario NT are derived and summarized in Proposition 2.
Proposition 2.
Under scenario NT, the equilibrium freight rate is p N T = 3 a ( 1 + ϕ ) 8 b p t 4 and the equilibrium port handling charge is w N T = a ( 1 + ϕ ) 4 b p t 2 . The corresponding profit of the shipping company is
π s N T = a ( 1 + ϕ ) 8 + b p t 4 a ( 1 + ϕ ) 4 + b p t 2 F s ,
and the corresponding profit of the port operator is
π p N T = a ( 1 + ϕ ) 4 + b p t 2 a ( 1 + ϕ ) 4 + b p t 2 .
Proposition 2 suggests that both the equilibrium freight rate p N T and the equilibrium port handling charge w N T increase in a and ϕ but decrease in b and p t . An increase in a or ϕ leads to an expansion of the market size, enabling the shipping company to elevate its rate charged to customers and allowing the port operator to impose a higher service charge on the shipping company. On the other hand, when b or p t increases, indicating a higher proportion of cargo using value-added logistics services and a higher price for those services, the port operator sees an increase in revenue from these additional services. To capitalize on this opportunity and attract more customers, the port operator chooses to lower the terminal handling fee w N T , which in turn reduces the freight rate p N T , thereby increasing the port’s revenue streams through value-added services and boosting her total profit.

3.3. Upgrade with One-Way Logistics (UO)

In the UO scenario, during midterm strategic planning, the port operator upgrades her facilities, and the shipping company makes one port call without backhauling.
Given a specific freight rate p, the quantity of outbound freight in TEUs is ( a + ξ ) p , and the shipping company’s gross profit is
π s = ( p w ) ( a + ξ ) p .
The port operator’s revenue derived from the handling charge is w ( a + ξ ) p . And her revenue from the value-added service is b p t ( a + ξ ) p . Therefore, the total profit of the port operator is
π p = w + b p t ( a + ξ ) p F p .
Following this, in the short-term decision-making phase within the UO scenario, the port operator sets the terminal handling charge w to maximize her profit first. Afterwards, the shipping company determines the freight rate p to maximize their profit. Proposition 3 summarizes the equilibrium results for this subgame in scenario UO.
Proposition 3.
Under UO scenario, the equilibrium freight rate is p U O = 3 ( a + ξ ) 4 b p t 4 and the equilibrium port handling charge is w U O = ( a + ξ ) 2 b p t 2 . The corresponding profit of the shipping company is
π s U O = ( a + ξ ) 4 + b p t 4 ( a + ξ ) 4 + b p t 4 ,
and the corresponding profit of the port operator is
π p U O = ( a + ξ ) 2 + b p t 2 ( a + ξ ) 4 + b p t 4 F p .
Proposition 3 states that, in the subgame equilibrium of scenario NT, both the freight rate p U O and the port handling charge w U O increase in a and ξ but decrease in b and p t . An increase in a or ξ results in an expansion of the market, thereby enabling the shipping company to impose higher rates on customers. Concurrently, the port operator can request an increase in handling charge from the shipping company. On the other hand, when b or p t increase, it signifies an increase in the revenue stream generated from the value-added service for the port operator. To entice a broader customer base and thus augment its total revenue, the port operator decides to reduce her terminal handling charge w U O , leading to a lower freight rate p U O .

3.4. No Upgrade with One-Way Logistics (NO)

In the NO scenario, during midterm strategic planning, the port operator does not upgrade her facilities, and the shipping company makes one port call without backhauling.
Given a specific freight rate p, the quantity of outbound freight in TEUs is a p , and the shipping company’s profit is
π s = ( p w ) a p .
The port operator’s revenue from the handling charge is w a p , and her revenue from the value-added service is b p t a p . Therefore, the total profit of the port operator is
π p = w + b p t a p .
Thereafter, the port operator decides the terminal handling charge w, followed by the shipping company determining the freight rate p. Proposition 4 summarizes the equilibrium results obtained from this subgame within scenario NO.
Proposition 4.
Under scenario NO, the equilibrium freight rate is p N O = 3 a 4 b p t 4 and the equilibrium port handling charge is w N O = a 2 b p t 2 . The corresponding profit of the shipping company is
π s N O = a 4 + b p t 4 a 4 + b p t 4 ,
and the corresponding profit of the port operator is
π p N O = a 2 + b p t 2 a 4 + b p t 4 .
Proposition 4 implies that both the freight rate p N O and the equilibrium port handling charge w N O increase in a but decrease in b and p t .
An increase in parameter a results in the expansion of the market. Consequently, the shipping company raises prices for his customers, and the port operator also increases her handling fee charged to the shipping company. When b or p t increases, the additional revenue generated from the value-added service for the port operator increases. To attract more customers and boost revenue, the port operator decreases her handling charge w N O , thereby lowering the freight rate, denoted as p N O . This strategic adjustment enables the port operator to attract a larger customer base and increase her overall revenue.
The profits at equilibrium for both the port operator and the liner container shipping company in all four possible scenarios are further summarized in Table 2.
We obtain Table 3 by solving the first-order partial derivatives of the parameters contained in it using the equilibrium price and profit above. The “+” in this table represents positive correlation, the “−” represents negative.

4. Upgrade and Logistics Strategies

In this section, in the framework of backward induction, we examine the strategic choices made by the port operator in terms of upgrading facilities or maintaining existing facilities, and by the shipping company in terms of one-way or two-way logistics. These decisions are made simultaneously by both parties. The Nash equilibrium will be determined by examining the optimal responses from both parties.

4.1. Best Responses for the Shipping Company

We first examine the optimal response for the shipping company. Based on the profits presented in Table 2, we present Proposition 5.
Proposition 5.
Let F s U = ( a + ξ ) 2 ( 1 + ϕ ) 2 2 32 + b 2 p t 2 16 + ϕ b p t ( a + ξ ) 8 and F s N = a 2 ( 1 + ϕ ) 2 2 32 + b 2 p t 2 16 + ϕ b p t a 8 .
A. 
When F s < F s U , π s U T > π s U O ; when F s > F s U , π s U T < π s U O .
B. 
When F s < F s N , π s N T > π s N O ; when F s > F s N , π s N T < π s N O .
Proposition 5 states that, when the port facility is upgraded (when the port facility is not upgraded), if the associated fixed cost for the two-way logistics is sufficiently low, i.e., F s < F s U ( F s < F s N ), the optimal response of the shipping company is to adopt two-way logistics. Moreover, the cost thresholds F s U and F s N increase in b, p t , and ϕ . This indicates that, as the market size increases due to two-way logistics, the demand for value-added services increases, or the price of the value-added service increase, the shipping company may switch from one-way logistics to two-way logistics. As the market size expands due to the adoption of two-way logistics, shipping companies may transition from one-way to two-way logistics to capitalize on the growing market opportunities. This shift is further driven by an increasing demand for value-added services, indicating that customers seek more comprehensive and sophisticated logistics solutions. Additionally, if value-added service prices rise, companies may find optimizing their operations through two-way logistics more profitable. The effects of a and ξ on the cost thresholds F s U ( F s N ) are further discussed in Proposition 6.
Proposition 6.
When ϕ 2 1 , F s U increases in a and ξ, and F s N increases in a; when ϕ < 2 1 , F s U increases and then decreases in a + ξ , and F s N increases and then decreases in a.
Proposition 6 points out that, when ϕ , the market size growth due to two-way logistics is sufficiently large ( ϕ 2 1 ), as the market potential—driven by increases in a or ξ —rises, the shipping company switches from one-way to two-way logistics. On the other hand, when ϕ is low ( ϕ < 2 1 ), the shipping company prefers two-way logistics if the market potential is moderate, and prefers one-way logistics if the market potential is either high or low. This finding is further illustrated in Figure 2. Figure 2 describes the impact of a and ξ on the fixed cost thresholds associated with two-way logistics F s U ( F s N ) and the optimal decision of the shipping company in different scenarios. Obviously, the fixed cost related to two-way logistics for the shipping company increases and then decreases in laden container demand in TEU, regardless of whether the port operator updates facilities if the load factor for backhaul freight is low (see Proposition 6). Where Figure 2a describes when the port operator upgrading the facility, the best optimal backhaul shipping decision for the shipping company. When the port operator does not upgrade the facilities, the shipping company’s decision is shown in Figure 2b.

4.2. Best Response for the Port Operator

We then examine the best response for the port operator. Based on the results summarized in Table 2, we present Proposition 7.
Proposition 7.
Let F p T = ( 1 + ϕ ) 2 ( 2 a + ξ ) ξ 16 + b p t ξ ( 1 + ϕ ) 4 and F p O = ( 2 a + ξ ) ξ 8 + ξ b p t 4 .
A. 
When F p < F p T , π p U T > π p N T ; when F p > F p T , π p U T < π p N T .
B. 
When F p < F p O , π p U O > π p N O ; when F p > F p O , π p U O < π p N O .
Proposition 7 suggests that, when the shipping company chooses two-way (one-way) logistics, it is better for the port operator to upgrade her facilities if the associated upgrading costs are below a certain threshold, i.e., F p < F p T ( F p < F p O ). Cost thresholds F p T and F p O increase as b, p t , ξ , or a increases. This indicates that, when there is growth in the market size for shipping goods, or an increase in demand resulting from facility upgrades, or an increase in the demand for the port operator’s value-added services, or an increase in the price for the value-added services, shipping companies that have not upgraded their facilities may consider reconsidering and initiating an upgrade. Facility upgrades in response to several key market dynamics will be helpful for the port operator. Growth in the market size for shipping, increased demand stemming from facility upgrades, or an increase in the price of these services all serve as compelling reasons for the port operator to upgrade their infrastructure. Facilities upgrading can lead to improved operational efficiency, better service offerings, and the ability to capitalize on higher revenue opportunities.

4.3. Nash Equilibrium

By combining the best responses of the shipping company and the port operator, we are able to derive Nash equilibrium. After comparing the cost thresholds derived above, we arrive at the following conclusion, which is summarized in Proposition 8.
Proposition 8.
Let ϕ t solve ( 1 + ϕ ) 2 2 ( 2 a + ξ ) + 4 ξ ϕ b p t = 0 .
A. 
When ϕ > ϕ t , F s U > F s N and F p T > F p O ;
B. 
When ϕ < ϕ t , F s U < F s N and F p T < F p O .
The equilibrium results are further summarized in Table 4 and Table 5.
According to Proportion 8, in the presence of significant growth in the market size of shipping goods due to two-way logistics, the upgrade cost threshold rises with a higher fixed cost threshold for two-way logistics; similarly, the fixed cost threshold for adopting two-way logistics increases with a higher facility upgrade cost threshold.
Moreover, there is at least one equilibrium between the port operator and the shipping company. In particular, when the incremental increase in the market size due to two-way logistics is substantial ( ϕ > ϕ t ), if F p < F p T and F s < F s U , there exists an equilibrium in which the shipping company adopts two-way logistics and the port operator upgrades its facility. Interestingly, when F s N < F s < F s U and F p O < F p < F p T , there exist three equilibria. Two of them are pure strategy equilibrium: UT and NO, and one is the mixed equilibrium. In UT equilibrium, the shipping company adopts two-way logistics and the port operator upgrades its facility; in NO equilibrium, the shipping company adopts one-way logistics and the port operator does not upgrade its facility; in the mixed equilibrium, the shipping company has a probability of adopting two-way logistics and the port operator also has a probability of upgrading her facilities.

5. Centralized Decision Making and Revenue Sharing

Next, in this section, we explore the ways in which the port operator and the shipping company can collaborate to improve their profitability. We first model a centralized decision-making process in which the port operator and the shipping company jointly determine the freight rate to maximize overall profit. Secondly, we consider a revenue-sharing contract between the port operator and the shipping company, where the port operator’s revenue share is s and the shipping company’s revenue share is 1 − s. Table 6 provides the preliminary profit functions of both parties, and Table 7 further presents the final equilibrium freight rate and attained profits of the two parties under the revenue-sharing contract.

5.1. Best Responses and Nash Equilibrium

We then consider the best response for the port operator. On the basis of Table 7, we derive Proposition 9 as follows.
Proposition 9.
Let F ˜ s U = ( 1 s ) ( a + ξ ) 2 ( 1 + ϕ ) 2 2 2 b 2 p t 2 8 , F ˜ s N = ( 1 s ) a 2 ( 1 + ϕ ) 2 2 2 b 2 p t 2 8 , F ˜ p O = ( 2 a + ξ ) ξ s 4 + ξ b p t 2 , and F ˜ p T = ( 1 + ϕ ) 2 ( 2 a + ξ ) ξ s 8 + b p t ξ ( 1 + ϕ ) 2 , the port operator’s profits under different scenarios are related as follows:
A. 
When F p < F ˜ p T , π ˜ p U T > π ˜ p N T ; when F p > F ˜ p T , π ˜ p U T < π ˜ p N T ; When F p < F ˜ p O , π ˜ p U O > π ˜ p N O ; when F p > F ˜ p O , π ˜ p U O < π ˜ p N O ;
B. 
When F s < F ˜ s U , π ˜ s U T > π ˜ s U O ; when F s > F ˜ s U , π ˜ s U T < π ˜ s U O ; When F s < F ˜ s N , π ˜ s N T > π ˜ s N O ; when F s > F ˜ s N , π ˜ s N T < π ˜ s N O .
Obviously, F ˜ s U > F ˜ s N and F ˜ p T > F ˜ p O always hold. Following that, Table 8 further summarizes the equilibrium results. It shows that at least one equilibrium exists between the shipping company and the port operator. When F p < F ˜ p T and F s < F ˜ s U , there exists one equilibrium in which the shipping company adopts two-way logistics and the port operator upgrades her facilities. While there exist three equilibria when F ˜ s N < F s < F ˜ s U and F ˜ p O < F p < F ˜ p T . Two of them are pure strategy equilibrium, UT and NO, while one is a mixed equilibrium. In UT equilibrium, the shipping company adopts two-way logistics and the port operator upgrades her facilities; in NO equilibrium, the shipping company adopts one-way logistics and the port operator does not upgrade her facilities; in the mixed equilibrium, the shipping company has a probability of using two-way logistics and the port operator also has a probability of upgrading her facilities.

5.2. Coordination Mechanism

By collaborating through a revenue-sharing contract, both the shipping company and the port operator can achieve improved profits via an appropriately selected s, leading to a Pareto improvement. Next, we identify the range of s that facilitates this Pareto improvement across four different scenarios, which is summarized in Proposition 10.
Proposition 10.
The Pareto improvement ( π ˜ p i > π p i and π ˜ s i > π s i , where i = U T , N T , U O , N O ) can be achieved when
A. 
( a + ξ ) ( 1 + ϕ ) 6 b p t 2 ( a + ξ ) ( 1 + ϕ ) 2 b p t s 3 ( a + ξ ) ( 1 + ϕ ) 10 b p t 4 ( a + ξ ) ( 1 + ϕ ) 2 b p t under scenario UT;
B. 
a ( 1 + ϕ ) 6 b p t 2 a ( 1 + ϕ ) 2 b p t s 3 a ( 1 + ϕ ) 10 b p t 4 a ( 1 + ϕ ) 2 b p t under scenario NT;
C. 
a + ξ 3 b p t 2 a + ξ b p t s 3 ( a + ξ ) 5 b p t 4 a + ξ b p t under scenario UO;
D. 
a 3 b p t 2 a b p t s 3 ( a ) 5 b p t 4 a b p t under scenario NO.
According to Proposition 10, we have obtained the conditions for mutual benefit between both parties when using a profit-sharing contract in four game scenarios. Under corresponding conditions, the profit-sharing contract can effectively coordinate the profits of both parties in each scenario.

6. Case Study

Through the game-theoretic model developed above, we can obtain all analytical solutions to the problem we are focused on, all of which have closed-form. Based on this, parameters in the model can basically cover all actual variations, which enables us to analyze almost all possible scenarios in reality. In this section, we extracted empirical values about some parameters in the paper from existing research to validate our analysis results.
Wu et al. [54] adopted the Baowu Group as a case study to analyze how the shipping company plans backhaul shipping to improve operational efficiency. In the research of Wu et al. [54], the Baowu Group needs to import 1.5 million tons of steel through the Shanghai Port in each production cycle, which is a stable demand. In order to achieve business needs more economically, the Baowu Group regularly leases a fleet of bulk carriers and pays USD 6.17 per ton to the shipping company. Therefore, the shipping company that carries the Baowu Group’s cargo has a fixed shipping demand that is 1.5 million tons, and it is one-way logistics. Although there are differences between bulk carriers transporting steel and container ships in TEU units in the model, these two only differ in terms of carrying units in our research. As mentioned above, the shipping company in the model can be viewed as an aggregate of all associated shipping companies. Therefore, we take the value above as a reference value and convert it into TEU units, that is, we set a = 85,714 ,   p t = 5.34 in the model. Then, we adopt the data from [55] and set w = 1.7. Meanwhile, ξ represents the increase in demand brought about by port upgrades, which is an exogenous variable we can set to any value greater than 0. In this section, we set it to 5000. Similarly, we set b = 0.5 .
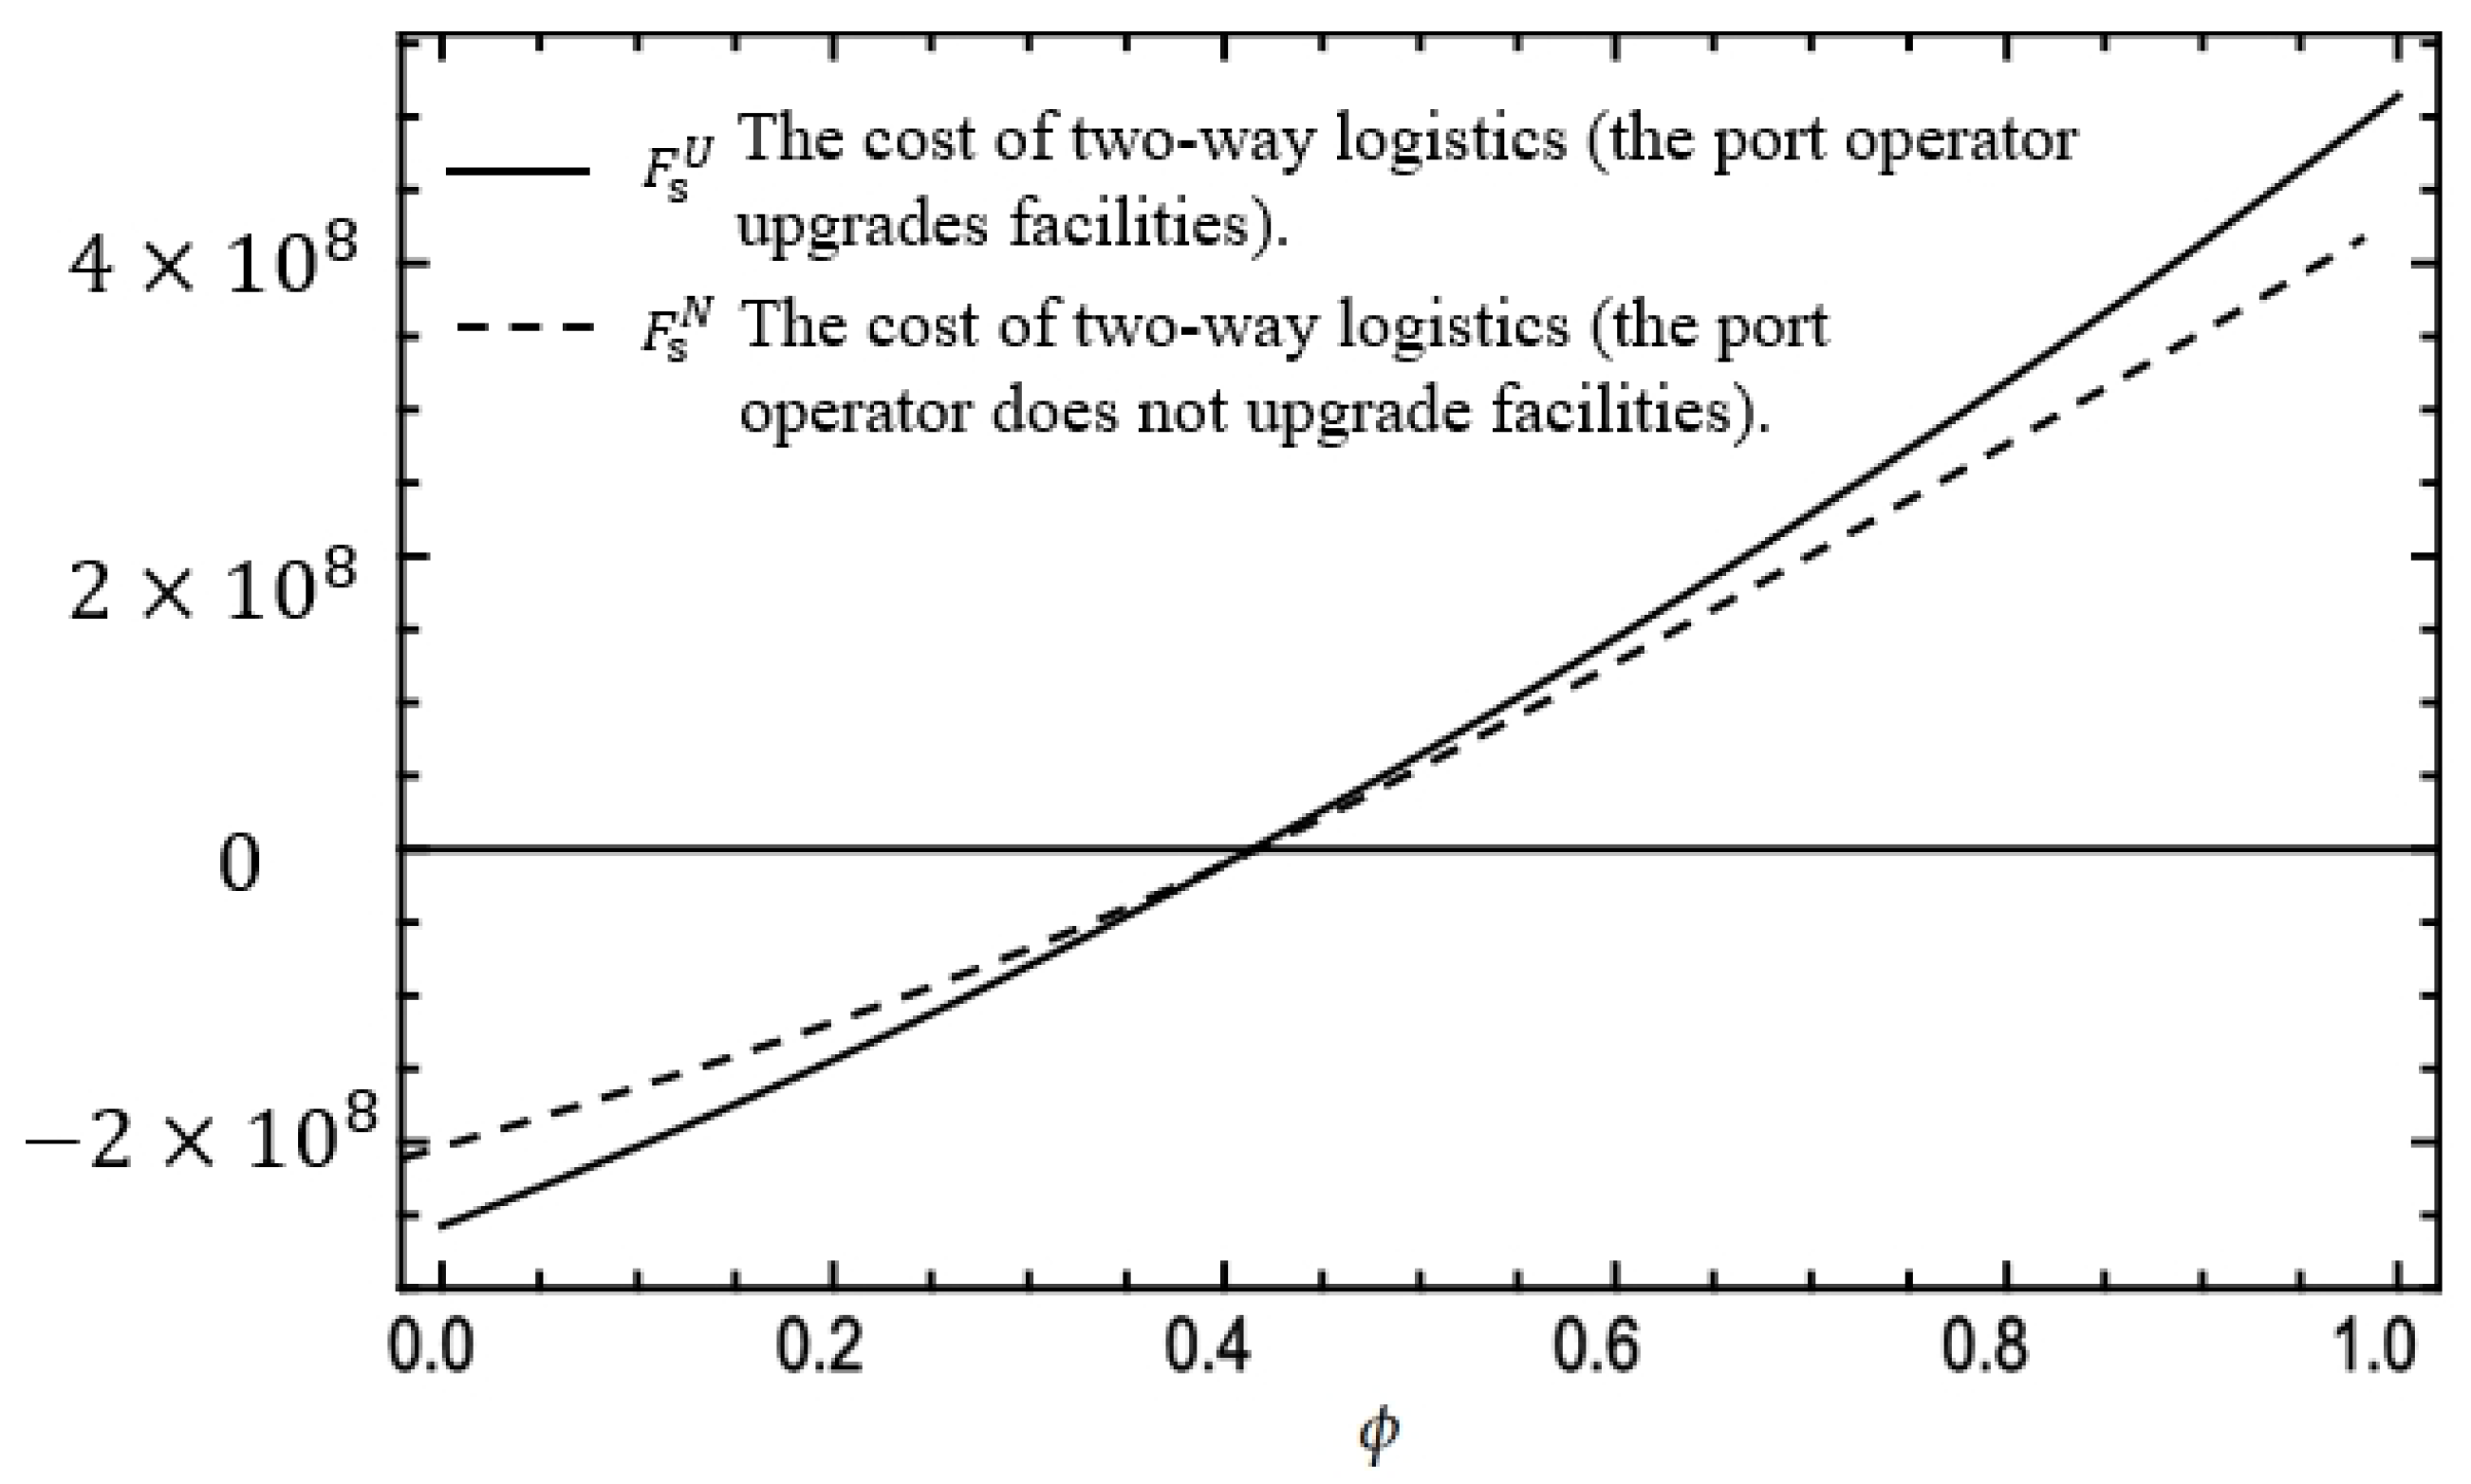
According to the profit functions of the shipping company in the four game scenarios constructed in the previous, we can obtain the relationship between the profit difference caused by two-way logistics in backhaul shipping (i.e., the fixed cost associated with two-way logistics for the shipping company) and the load factor of backhaul for the shipping company when the port operator upgrades facilities and the relationship between the two when not upgrading the port. We reached a conclusion consistent with the derivation of the model. As shown in Figure 3, with the increasing shipping demand for backhaul shipping, the shipping company switches from one-way to two-way logistics. In addition, when the port operator upgrades facilities, which means that demand for value-added services increases or the price of the value-added service increases, the shipping company will switch from one-way logistics to two-way logistics.

7. Conclusions

In this section, we first discuss the policies’ impact and then briefly summarize our study’s main findings. Based on that, we develop the limitations and conduct future research.

7.1. Policy Implications in Practice

There is a multi-tier relationship between policies and port upgrades. Policy often plays a role as the catalyst for port modernization and expansion. China’s Belt and Road Initiative (BRI) aims to enhance global trade connectivity. Under the BRI, several countries, such as Pakistan, Greece, and Sri Lanka, have invested significantly in upgrading their ports. Governments have adopted ports as a policy tool to promote growth in related maritime sectors and avoid the risks caused by unbalanced and uncertain market demand. Similarly, Europe has pushed ports like Rotterdam in the Netherlands to invest in eco-friendly upgrades, such as shore power systems and renewable energy integration, to reduce carbon emissions. In conclusion, policies provide the financial support needed for port modernization.
We focus on the interaction between the port upgrades and the shipping company’s backhaul shipping decisions. Although we did not specifically discuss the role of policies, the research is based on the current policy. This means that the policy provides subsidies to the port operator. It can also be viewed as a cost discount coefficient. To a certain extent, this reduces the cost of upgrading port facilities, thereby promoting the port operator to be more willing to upgrade facilities. With policy support, the upgraded facilities can provide higher value-added services at higher prices and lower costs. In research conclusions, the impact of policies on the main conclusions of the model will be similar to that of the profit-sharing coefficient (s).

7.2. Major Findings

As markets become more complex and diverse and technological advancements develop rapidly, the maritime supply chain must enhance its resilience while ensuring greater efficiency and stability. This is essential for reducing the risks of supply chain disruptions that can impact stakeholders. We construct a three-stage game model to explore the interactions between the port operator and the shipping company under various scenarios. The first stage involves a strategic choice by the port operator on whether to upgrade her facilities that use artificial intelligence on existing facilities to help improve operational efficiency. While the shipping company chooses between one-way or two-way logistics. This leads to four possible scenarios: (1) upgrading with two-way logistics, (2) upgrading with one-way logistics, (3) no upgrade with two-way logistics, and (4) no upgrade with one-way logistics. In each scenario, the sequence of decisions begins with the port operator setting the terminal handling charge to maximize her profit at the second stage. Following this, at the third stage, the shipping company determines the freight rate to optimize their own profit.
We first derive equilibrium outcomes under both decentralized and centralized decision-making processes. Equilibria under decentralized decision making, where the port operator and the shipping company optimize their own objectives independently, and centralized decision making, where a unified authority coordinates decisions to maximize collective outcomes, are derived. Then, we examine the impact of main factors on these equilibrium outcomes, including the potential market size, the incremental demand generated by two-way logistics and facility upgrades, the additional service demand faced by the port operator, the price of the port’s value-added service, and the fixed costs associated with implementing two-way logistics and upgrading the facility. One interesting finding is that shipping companies tend to choose two-way logistics when the potential market size is moderate, whereas they opt for one-way logistics when the market size is either large or small. Moreover, when fixed costs for port facility upgrades and two-way logistics are moderate, there exists three equilibria: two pure strategy equilibrium (UT and NO) and one mixed-strategy equilibrium. In UT equilibrium, the shipping company adopts two-way logistics and the port operator upgrades her facilities; in NO equilibrium, the shipping company adopts one-way logistics and the port operator does not invest in upgrade; in the mixed equilibrium, the shipping company has a probability of adopting two-way logistics and the port operator also has a probability of upgrading her facilities. Whether the operator introduces AI technology into the existing facilities depends on fixed costs and whether the shipping company chooses a two-way route.
Furthermore, we constructed a cooperative model involving the port operator and the shipping company, demonstrating that an appropriately designed revenue-sharing contract could benefit both parties under certain circumstances. We find that the cooperation between ports and shipping companies, upgrade facilities, and shipping routes will all affect the risk tolerance, operational efficiency, and customer satisfaction of the maritime supply chain in different market sizes.

7.3. Limitations and Future Research

Considering that the model highlights the interaction between port infrastructure upgrades and shipping company route optimization strategies. To explore port cooperation and vertical integration, we constructed a cooperation model involving a port operator and a shipping company and obtained the conditions under which the revenue-sharing contract benefits both parties. The research has several limitations that warrant further exploration. Firstly, the coordination mechanisms employed in this study are simplistic. Future research could expand on this by conducting the comparative analyses of various coordination mechanisms in the maritime supply chain. Secondly, the model does not account for the impact of inter-port competition on port–shipping company cooperation. Incorporating port selection probabilities for shipping companies would introduce additional complexity that may detract from our current research focus. in the future, we will examine port competition dynamics and their influence on vertical integration in the maritime supply chain. Finally, while we have discussed policy implications, our study lacks a quantitative assessment of policy impacts. Additionally, our policy analysis has primarily focused on subsidy support. Future could include comparative studies examining the differential effects of regulatory control vs. incentive-based policies on terminal operations and shipping companies’ performance.

Author Contributions

Conceptualization, M.W., X.L. and Y.C.; Funding acquisition, X.L.; Methodology, M.W., X.L. and Y.C.; Supervision, X.L. and Y.C.; Validation, M.W. and X.L.; Visualization, M.W. and X.L.; Writing—original draft, M.W.; Writing—review and editing, X.L. and Y.C. All authors have read and agreed to the published version of the manuscript.

Funding

This research was funded by Macau University of Science and Technology Faculty Research Grants through FRG-24-002-MSB.

Data Availability Statement

The data used to support the findings of this study are included within the article.

Acknowledgments

The authors thank the editor and four anonymous reviewers of the paper. Their constructive suggestions and comments have considerably improved the quality of the paper.

Conflicts of Interest

The authors declare no conflicts of interest.

Appendix A

Appendix A.1

Table A1. List of notations.
NotationsDescription
Parameters:
aInitial laden container demand in TEU
ξ Additional laden container demand in TEU due to port upgrade
ϕ Load factor of backhaul
bProportion of cargo associated with value-added services
F s Fixed cost associated with two-way logistics for shipping company
F p Cost of port facility upgrading
p t Price of value-added service per TEU
sPort operator’s revenue share from freight rates
Decision variables:
pFreight rate per TEU
wTerminal handling charge per TEU
Proof of Proposition 1.
Based on (2), taking the first order derivative of π s with respect to p, we obtain
π s p = ( a + ξ ) ( 1 + ϕ ) 4 p + 2 w .
Let π s p = 0 , we obtain p * ( w ) = ( a + ξ ) ( 1 + ϕ ) + 2 w 4 . With the optimal price p * ( w ) , based on (1), we can derive
π p ( p * ( w ) ) = w + b p t ( a + ξ ) ( 1 + ϕ ) ( a + ξ ) ( 1 + ϕ ) + 2 w 2 F p .
Taking the first order derivative of π p ( p * ( w ) ) with respect to w, we can derive
π p w = ( a + ξ ) ( 1 + ϕ ) 4 w 2 b p t 2 .
Let π p w = 0 , we obtain the optimal service fee for the port operator is w U T = ( a + ξ ) ( 1 + ϕ ) 4 b p t 2 w U T = ( a + ξ ) ( 1 + ϕ ) 4 b p t 2 . Coupled with π p ( p * ( w ) ) , (1) and (2), we obtain p U T = 3 ( a + ξ ) ( 1 + ϕ ) 8 b p t 4 , the corresponding profit of the shipping company is
π s U T = ( a + ξ ) ( 1 + ϕ ) 8 + b p t 4 ( a + ξ ) ( 1 + ϕ ) 4 + b p t 2 F s ,
and the corresponding profit of the port operator is
π p U T = ( a + ξ ) ( 1 + ϕ ) 4 + b p t 2 ( a + ξ ) ( 1 + ϕ ) 4 + b p t 2 F p .

Appendix A.2

Proof of Proposition 2.
Coupled with (5) and (6), the proof is similar with the proof of Proposition 1. □

Appendix A.3

Proof of Proposition 3.
Coupled with (9) and (10), the proof is similar with the proof of Proposition 1. □

Appendix A.4

Proof of Proposition 4.
Coupled with (13) and (14), the proof is similar with the proof of Proposition 1. □

Appendix A.5

Proof of Proposition 5.
Based on Table 2, we can derive π s U T π s U O = ( a + ξ ) 2 ( 1 + ϕ ) 2 2 32 + b 2 p t 2 16 + ϕ b p t ( a + ξ ) 8 F s and π s N T π s N O = a 2 ( 1 + ϕ ) 2 2 32 + b 2 p t 2 16 + ϕ b p t a 8 F s .
Let F s U = ( a + ξ ) 2 ( 1 + ϕ ) 2 2 32 + b 2 p t 2 16 + ϕ b p t ( a + ξ ) 8 and F s N = a 2 ( 1 + ϕ ) 2 2 32 + b 2 p t 2 16 + ϕ b p t a 8 , we can obtain the result. □

Appendix A.6

Proof of Proposition 6.
Taking the first order derivative of F s U with respect to ( a + ξ ) , we derive
F s U ( a + ξ ) = ( 1 + ϕ ) 2 2 ( a + ξ ) + 2 ϕ b p t 16 .
Consequently, when ϕ 2 1 , F s U ( a + ξ ) > 0 ; when ϕ < 2 1 , 2 F s U ( ( a + ξ ) ) 2 = ( 1 + ϕ ) 2 2 16 < 0 . Then, we obtain the results. □

Appendix A.7

Proof of Proposition 7.
Based on Table 2, we can derive π p U T π p N T = ( 1 + ϕ ) 2 ( 2 a + ξ ) ξ 16 + b p t ξ ( 1 + ϕ ) 4 F p   π p U O π p N O = ( 2 a + ξ ) ξ 8 + ξ b p t 4 F p . Let F p T = ( 1 + ϕ ) 2 ( 2 a + ξ ) ξ 16 + b p t ξ ( 1 + ϕ ) 4 and F p O = ( 2 a + ξ ) ξ 8 + ξ b p t 4 , we can obtain the result. □

Appendix A.8

Proof of Proposition 8.
Based on Propositions 5 and 7, F s U F s N = ( 1 + ϕ ) 2 2 ( 2 a + ξ ) ξ + 4 ξ ϕ b p t 32 and F p T F p O = ( 1 + ϕ ) 2 2 ( 2 a + ξ ) ξ + 4 ξ ϕ b p t 16 .
Let ϕ t solves ( 1 + ϕ ) 2 2 ( 2 a + ξ ) + 4 ξ ϕ b p t = 0 , we can derive when ϕ > ϕ t , F s U > F s N and F p T > F p O ; when ϕ < ϕ t , F s U < F s N and F p T < F p O .
When ϕ > ϕ t , if F s < F s N and F p < F p O , then F s < F s N < F s U and F p < F p O < F p T . Based on Proposition 5 and 7, π s N T > π s N O , π s U T > π s U O , π p U T > π p N T and π p U O > π p N O . Then, facility upgrading is the dominant strategy for the port operator and two-way logistics is the dominant strategy for the shipping company such that UT is the Nash equilibrium. Similarly, we can obtain equilibria in other cases. Specially, when F s N < F s < F s U and F p O < F p < F p T , based on Proposition 5 and 7, π s N T < π s N O , π s U T > π s U O , π p U T > π p N T and π p U O < π p N O . Then, there are three equilibria: UT, NO, and mixed equilibrium. The equilibrium results are summarized in Table 4.
Similarly, when ϕ < ϕ t , the equilibrium results are summarized in Table 5. □

Appendix A.9

Proof of Proposition 9.
Based on Table 7, the proof is similar with the proofs of Propositions 5 and 7. □

Appendix A.10

Proof of Proposition 10.
Based on Table 2 and Table 7, under UT scenario,
π ˜ p U T π p U T = s ( a + ξ ) 2 ( 1 + ϕ ) 2 4 b 2 p t 2 8 + ( a + ξ ) ( 1 + ϕ ) + 2 b p t b p t 2 ( a + ξ ) ( 1 + ϕ ) + 2 b p t 4 2 and
π ˜ s U T π s U T = ( 1 s ) ( a + ξ ) 2 ( 1 + ϕ ) 2 4 b 2 p t 2 8 1 2 ( a + ξ ) ( 1 + ϕ ) + 2 b p t 4 2 . The Pareto improvement, in another word, both π ˜ p U T > π p U T and π ˜ s U T > π s U T is equivalent to ( a + ξ ) ( 1 + ϕ ) 6 b p t 2 ( a + ξ ) ( 1 + ϕ ) 2 b p t s 3 ( a + ξ ) ( 1 + ϕ ) 10 b p t 4 ( a + ξ ) ( 1 + ϕ ) 2 b p t .
Similarly, we can obtain the range of s under NT, UO, and NO scenarios. □

References

  1. Zhang, W.; Lam, J.S.L. An empirical analysis of maritime cluster evolution from the port development perspective–Cases of London and Hong Kong. Transp. Res. Part A Policy Pract. 2017, 105, 219–232. [Google Scholar]
  2. Gavalas, D.; Syriopoulos, T.; Tsatsaronis, M. COVID-19 impact on the shipping industry: An event study approach. Transp. Policy 2022, 116, 157–164. [Google Scholar]
  3. Diniz, N.V.; Cunha, D.R.; de Santana Porte, M.; Oliveira, C.B.M.; de Freitas Fernandes, F. A bibliometric analysis of sustainable development goals in the maritime industry and port sector. Reg. Stud. Mar. Sci. 2023, 69, 103319. [Google Scholar]
  4. Shi, X.; Jiang, H.; Li, H.; Wang, Y. Upgrading port-originated maritime clusters: Insights from Shanghai’s experience. Transp. Policy 2020, 87, 19–32. [Google Scholar]
  5. Tongzon, J.L.; Nguyen, H.O. Effects of port-shipping logistics integration on technical and allocative efficiency. Asian J. Shipp. Logist. 2021, 37, 109–116. [Google Scholar]
  6. Haralambides, H.E. Globalization, public sector reform, and the role of ports in international supply chains. Marit. Econ. Logist. 2017, 19, 1–51. [Google Scholar]
  7. Qingmei, L.; Hong, Z. The effect of maritime cluster on port production efficiency. Marit. Policy Manag. 2021, 48, 61–74. [Google Scholar]
  8. Castrellon, J.P.; Sanchez-Diaz, I.; Roso, V.; Altuntas-Vural, C.; Rogerson, S.; Santén, V.; Kalahasthi, L.K. Assessing the eco-efficiency benefits of empty container repositioning strategies via dry ports. Transp. Res. Part D Transp. Environ. 2023, 120, 103778. [Google Scholar]
  9. Du, J.; Wu, N.; Zhao, X.; Wang, J.; Guo, L. Container liner shipping schedule optimization with shipper selection behavior considered. Marit. Policy Manag. 2024, 51, 1385–1409. [Google Scholar]
  10. Song, D.P.; Dong, J.X. Long-haul liner service route design with ship deployment and empty container repositioning. Transp. Res. Part B Methodol. 2013, 55, 188–211. [Google Scholar]
  11. Notteboom, T.; Rodrigue, J.P. The corporate geography of global container terminal operators. Marit. Policy Manag. 2012, 39, 249–279. [Google Scholar]
  12. Takebayashi, M.; Hanaoka, S. Efficient inter-port cooperation considering port congestion and port charge. Marit. Transp. Res. 2021, 2, 100011. [Google Scholar]
  13. Zhao, X.; Sun, Z. Cooperation and Investment Decisions of One Shipping Liner to Multiple Ports under Differential Pricing. Comput. Ind. Eng. 2023, 186, 109744. [Google Scholar]
  14. Adler, N.; Brudner, A.; Proost, S. A review of transport market modeling using game-theoretic principles. Eur. J. Oper. Res. 2021, 291, 808–829. [Google Scholar]
  15. Chen, P.S.L.; Fan, H.; Enshaei, H.; Zhang, W.; Shi, W.; Abdussamie, N.; Miwa, T.; Qu, Z.; Yang, Z. A review on ports’ readiness to facilitate international hydrogen trade. Int. J. Hydrogen Energy 2023, 48, 17351–17369. [Google Scholar]
  16. Hoang, A.T.; Foley, A.M.; Nižetić, S.; Huang, Z.; Ong, H.C.; Ölçer, A.I.; Pham, V.V.; Nguyen, X.P. Energy-related approach for reduction of CO2 emissions: A critical strategy on the port-to-ship pathway. J. Clean. Prod. 2022, 355, 131772. [Google Scholar]
  17. Samuelson, P.A. The transfer problem and transport costs, II: Analysis of effects of trade impediments. Econ. J. 1954, 64, 264–289. [Google Scholar] [CrossRef]
  18. Behrens, K.; Gaigné, C.; Thisse, J.F. Industry location and welfare when transport costs are endogenous. J. Urban Econ. 2009, 65, 195–208. [Google Scholar] [CrossRef]
  19. Demirel, E.; Van Ommeren, J.; Rietveld, P. A matching model for the backhaul problem. Transp. Res. Part B Methodol. 2010, 44, 549–561. [Google Scholar]
  20. Hwang, C.C.; Chiang, C.H. Cooperation and competitiveness of intra-regional container ports. J. East. Asia Soc. Transp. Stud. 2010, 8, 2283–2298. [Google Scholar]
  21. Zhou, X. Competition or cooperation: A simulation of the price strategy of ports. Int. J. Simul. Model. 2015, 14, 463–474. [Google Scholar] [CrossRef]
  22. Luo, M.; Chen, F.; Zhang, J. Relationships among port competition, cooperation and competitiveness: A literature review. Transp. Policy 2022, 118, 1–9. [Google Scholar] [CrossRef]
  23. Nikghadam, S.; Vanga, R.; Rezaei, J.; Tavasszy, L. Cooperation between vessel service providers in ports: An impact analysis using simulation for the Port of Rotterdam. Marit. Transp. Res. 2023, 4, 100083. [Google Scholar] [CrossRef]
  24. Gong, M.; Zeng, Y.; Zhang, F. New infrastructure, optimization of resource allocation and upgrading of industrial structure. Financ. Res. Lett. 2023, 54, 103754. [Google Scholar] [CrossRef]
  25. Notteboom, T.; Yang, Z. Port governance in China since 2004: Institutional layering and the growing impact of broader policies. Res. Transp. Bus. Manag. 2017, 22, 184–200. [Google Scholar] [CrossRef]
  26. Cui, Y.; Xu, H.; An, D.; Yang, L. Evaluation of marine economic development demonstration zone policy on marine industrial structure optimization: A case study of Zhejiang, China. Front. Mar. Sci. 2024, 11, 1403347. [Google Scholar] [CrossRef]
  27. Yang, Z.; Guo, L.; Lian, F. Port integration in a region with multiport gateways in the context of industrial transformation and upgrading of the port. Transp. Res. Part E Logist. Transp. Rev. 2019, 122, 231–246. [Google Scholar]
  28. Mergel, I.; Edelmann, N.; Haug, N. Defining digital transformation: Results from expert interviews. Gov. Inf. Q. 2019, 36, 101385. [Google Scholar] [CrossRef]
  29. Ding, L.; Zhao, Z.; Wang, L. Exploring the role of technical and financial support in upgrading the marine industrial structure in the Bohai Rim region: Evidence from coastal cities. Ocean. Coast. Manag. 2023, 243, 106659. [Google Scholar] [CrossRef]
  30. Vrakas, G.; Chan, C.; Thai, V.V. The effects of evolving port technology and process optimisation on operational performance: The case study of an Australian container terminal operator. Asian J. Shipp. Logist. 2021, 37, 281–290. [Google Scholar] [CrossRef]
  31. Zhang, R.; Gao, Q.; Gao, K. Impact of marine industrial agglomeration on the high-quality development of the marine economy—A case study of China’s coastal areas. Ecol. Indic. 2024, 158, 111410. [Google Scholar]
  32. Ishikawa, J.; Tarui, N. Backfiring with backhaul problems: Trade and industrial policies with endogenous transport costs. J. Int. Econ. 2018, 111, 81–98. [Google Scholar]
  33. Ishikawa, J.; Tarui, N. You cannot always get what you want: Protectionist policies with the transport sector. Econ. Lett. 2021, 207, 110009. [Google Scholar]
  34. Lee, J.; Wei, S.J.; Xu, J. Trade imbalance, heavy goods, and pollution. J. Int. Money Financ. 2024, 144, 103090. [Google Scholar]
  35. Ardelean, A.; Lugovskyy, V. It pays to be big: Price discrimination in maritime shipping. Eur. Econ. Rev. 2023, 153, 104403. [Google Scholar]
  36. Wong, W.F. The round trip effect: Endogenous transport costs and international trade. Am. Econ. J. Appl. Econ. 2022, 14, 127–166. [Google Scholar]
  37. Hayakawa, K.; Ishikawa, J.; Tarui, N. What goes around comes around: Export-enhancing effects of import-tariff reductions. J. Int. Econ. 2020, 126, 103362. [Google Scholar]
  38. Rahayu, L.; Busscher, T.; Tillema, T.; Woltjer, J. Maritime transport governance challenges in the Global South. Mar. Policy 2024, 163, 106147. [Google Scholar]
  39. Kuhlemann, S.; Ksciuk, J.; Tierney, K.; Koberstein, A. The stochastic liner shipping fleet repositioning problem with uncertain container demands and travel times. EURO J. Transp. Logist. 2021, 10, 100052. [Google Scholar]
  40. Chen, R.; Dong, J.X.; Lee, C.Y. Pricing and competition in a shipping market with waste shipments and empty container repositioning. Transp. Res. Part B Methodol. 2016, 85, 32–55. [Google Scholar]
  41. Zhou, W.H.; Lee, C.Y. Pricing and competition in a transportation market with empty equipment repositioning. Transp. Res. Part B Methodol. 2009, 43, 677–691. [Google Scholar]
  42. Xu, L.; Govindan, K.; Bu, X.; Yin, Y. Pricing and balancing of the sea–cargo service chain with empty equipment repositioning. Comput. Oper. Res. 2015, 54, 286–294. [Google Scholar]
  43. Zhao, X.; Liu, L.; Di, Z.; Xu, L. Subsidy or punishment: An analysis of evolutionary game on implementing shore-side electricity. Reg. Stud. Mar. Sci. 2021, 48, 102010. [Google Scholar]
  44. Wang, J.; Zhang, B.; Dai, Q.; Kong, Y. Vertical Structure Selection and Evolution in Shipping Supply Chains Under Bilateral Bargaining. Expert Syst. Appl. 2024, 238, 122032. [Google Scholar]
  45. Wang, C.; Ducruet, C.; Wang, W. Port integration in China: Temporal pathways, spatial patterns and dynamics. Chin. Geogr. Sci. 2015, 25, 612–628. [Google Scholar]
  46. Xu, L.; Lee, S.H. Port supply chain integration under mixed ownership. Transp. Policy 2024, 146, 371–385. [Google Scholar]
  47. Wang, H.; Ruan, Y.; Niu, B.; Zhang, H. Intra-port demand coordination and inter-port competition: Ports’ pricing strategies with congestion concerns. Ocean. Coast. Manag. 2024, 248, 106918. [Google Scholar]
  48. Zhang, L.H.; Liu, C.; Zhang, C.; Wang, S. Upstream encroachment and downstream outsourcing in competing shipping supply chains. Int. J. Prod. Econ. 2023, 255, 108655. [Google Scholar]
  49. Lin, F.; Xiaodong, L.; Adolf, K.; Peng, J.; Haibo, K.; Xingxing, Z. Can port systems be enhanced by government promotion? The case of port cooperation along the maritime silk road. Ocean. Coast. Manag. 2023, 242, 106669. [Google Scholar]
  50. Zheng, S.; Luo, M. Competition or cooperation? Ports’ strategies and welfare analysis facing shipping alliances. Transp. Res. Part E Logist. Transp. Rev. 2021, 153, 102429. [Google Scholar]
  51. Meng, L.; Wang, J.; Yan, W.; Han, C. A differential game model for emission reduction decisions between ports and shipping enterprises considering environmental regulations. Ocean. Coast. Manag. 2022, 225, 106221. [Google Scholar]
  52. Shi, J.; Chen, J.; Xu, L.; Di, Z.; Qu, Q. Improving the resilience of maritime supply chains: The integration of ports and inland transporters in duopoly markets. Front. Eng. Manag. 2023, 10, 51–66. [Google Scholar]
  53. Notteboom, T.; Knatz, G.; Parola, F. Port co-operation: Types, drivers and impediments. Res. Transp. Bus. Manag. 2018, 26, 1–4. [Google Scholar]
  54. Wu, L.; Pan, K.; Wang, S.; Yang, D. Bulk ship scheduling in industrial shipping with stochastic backhaul canvassing demand. Transp. Res. Part B Methodol. 2018, 117, 117–136. [Google Scholar]
  55. Zheng, S.; Negenborn, R.R. Centralization or decentralization: A comparative analysis of port regulation modes. Transp. Res. Part E Logist. Transp. Rev. 2014, 69, 21–40. [Google Scholar]
Figure 1. The sequence of events in the game between the port operator and the shipping company.
Mathematics 13 01152 g001
Figure 2. The impacts of a and ξ on the thresholds of fixed cost associated with two-way logistics F s U ( F s N ).
Mathematics 13 01152 g002
Figure 3. The impacts of ϕ on the thresholds of fixed cost associated with two-way logistics F s U ( F s N ).
Mathematics 13 01152 g003
Table 1. Gap between existing literature and our research.
PaperMaritime Industrial UpgradingBackhaul Shipping DecisionsPort CooperationGame-Theoretical ModelPort PerformancePricing Strategy
Wang et al. (2024) [47]
Zhao and Sun (2023) [13]
Xu and Lee (2024) [46]
Meng et al. (2022) [51]
Zhang et al. (2023) [48]
Zheng and Luo (2021) [50]
Shi et al. (2023a) [52]
Zhou and Lee (2009) [41]
Xu et al. (2015) [42]
This paper
Table 2. Profits at equilibrium for port operator and liner container shipping company in all four scenarios.
ScenarioEquilibrium Profit
UT π s U T = ( a + ξ ) ( 1 + ϕ ) 8 + b p t 4 ( a + ξ ) ( 1 + ϕ ) 4 + b p t 2 F s
π p U T = ( a + ξ ) ( 1 + ϕ ) 4 + b p t 2 ( a + ξ ) ( 1 + ϕ ) 4 + b p t 2 F p .
NT π s N T = a ( 1 + ϕ ) 8 + b p t 4 a ( 1 + ϕ ) 4 + b p t 2 F s
π p N T = a ( 1 + ϕ ) 4 + b p t 2 a ( 1 + ϕ ) 4 + b p t 2
UO π s U O = ( a + ξ ) 4 + b p t 4 ( a + ξ ) 4 + b p t 4
π p U O = ( a + ξ ) 2 + b p t 2 ( a + ξ ) 4 + b p t 4 F p
NO π s N O = a 4 + b p t 4 a 4 + b p t 4
π p N O = a 2 + b p t 2 a 4 + b p t 4
Table 3. Sensitivity analysis.
p U T w U T π s U T π p U T p N T w N T π s N T π p N T p N O w N O π s N O π p N O p U O w U O π s U O π p U O
a++++++++++++++++
ξ ++++ ++++
ϕ ++++++++
b
F s
F p
p t
Table 4. Equilibrium strategies ( ϕ > ϕ t ).
Conditions of F s and F p Equilibrium Strategies
F s < F s N and F p < F p O UT
F s N < F s < F s U and F p < F p O UT
F s > F s U and F p < F p O UO
F s < F s N and F p > F p T NT
F s N < F s < F s U and F p > F p T NO
F s > F s U and F p > F p T NO
F s < F s N and F p O < F p < F p T UT
F s N < F s < F s U and F p O < F p < F p T NO, UT and mixed equilibrium
F s > F s U and F p O < F p < F p T NO
Table 5. Equilibrium strategies and associated conditions under a decentralized decision-making process ( ϕ < ϕ t ).
Conditions of F s and F p Equilibrium Strategies
F s < F s U and F p < F p T UT
F s U < F s < F s N and F p < F p T UT
F s > F s N and F p < F p T UO
F s < F s U and F p > F p O NT
F s U < F s < F s N and F p > F p O NO
F s > F s N and F p > F p O NO
F s < F s U and F p T < F p < F p O UT
F s U < F s < F s N and F p T < F p < F p O NO, UT and mixed equilibrium
F s > F s N and F p T < F p < F p O NO
Table 6. Profits function of the port operator and the shipping company under centralized decision making and revenue sharing contract.
ScenarioShipping Company’s ProfitPort Operator’s Profit
UT π ˜ s = [ ( a + ξ ) ( 1 + ϕ ) 2 p ] ( 1 s ) p F s π ˜ p = [ ( a + ξ ) ( 1 + ϕ ) 2 p ] s p + [ ( a + ξ ) ( 1 + ϕ ) 2 p ] b p t F p
NT π ˜ s = [ a ( 1 + ϕ ) 2 p ] ( 1 s ) p F s π ˜ p = [ a ( 1 + ϕ ) 2 p ] s p + [ a ( 1 + ϕ ) 2 p ] b p t
UO π ˜ s = [ ( a + ξ ) p ] ( 1 s ) p π ˜ p = [ ( a + ξ ) p ] s p + [ ( a + ξ ) p ] b p t F p
NO π ˜ s = [ a p ] ( 1 s ) p π ˜ p = [ a p ] s p + [ a p ] b p t
Table 7. Equilibrium freight rate and attained profits of the port operator and the shipping company under the revenue-sharing contract.
Optimal PriceShipping Company’s Optimal ProfitPort Operator’s Optimal Profit
p ˜ U T = ( a + ξ ) ( 1 + ϕ ) 2 b p t 4 π ˜ s U T = ( 1 s ) ( a + ξ ) 2 ( 1 + ϕ ) 2 4 b 2 p t 2 8 F s π ˜ p U T = s ( a + ξ ) 2 ( 1 + ϕ ) 2 4 b 2 p t 2 8 + ( a + ξ ) ( 1 + ϕ ) + 2 b p t b p t 2 F p
p ˜ N T = a ( 1 + ϕ ) 2 b p t 4 π ˜ s N T = ( 1 s ) a 2 ( 1 + ϕ ) 2 4 b 2 p t 2 8 F s π ˜ p N T = s a 2 ( 1 + ϕ ) 2 4 b 2 p t 2 8 + a ( 1 + ϕ ) + 2 b p t b p t 2
p ˜ U O = ( a + ξ ) b p t 2 π ˜ s U O = ( 1 s ) ( a + ξ ) 2 b 2 p t 2 4 π ˜ p U O = s ( a + ξ ) 2 b 2 p t 2 4 + ( a + ξ + b p t ) b p t 2 F p
p ˜ N O = a b p t 2 π ˜ s N O = ( 1 s ) a 2 b 2 p t 2 4 π ˜ p N O = s a 2 b 2 p t 2 4 + a + b p t b p t 2
Table 8. Equilibrium strategies and associated conditions under centralized decision making and revenue-sharing contract.
Conditions of F s and F p Equilibrium Strategies
F s < F ˜ s N and F p < F ˜ p O UT
F ˜ s N < F s < F ˜ s U and F p < F ˜ p O UT
F s > F ˜ s U and F p < F ˜ p O UO
F s < F ˜ s N and F p > F ˜ p T NT
F ˜ s N < F s < F ˜ s U and F p > F ˜ p T NO
F s > F ˜ s U and F p > F ˜ p T NO
F s < F ˜ s N and F ˜ p O < F p < F ˜ p T UT
F ˜ s N < F s < F ˜ s U and F ˜ p O < F p < F ˜ p T NO, UT and Mixed Equilibrium
F s > F ˜ s U and F ˜ p O < F p < F ˜ p T NO
Disclaimer/Publisher’s Note: The statements, opinions and data contained in all publications are solely those of the individual author(s) and contributor(s) and not of MDPI and/or the editor(s). MDPI and/or the editor(s) disclaim responsibility for any injury to people or property resulting from any ideas, methods, instructions or products referred to in the content.

