Abstract
In the current context of severe environmental challenges and climate change, the low-carbon green development model has become an international consensus. This study establishes a green supply chain duopoly competition model, considering two types of government subsidies and data-driven marketing (DDM) to help achieve supply chain development. The aim of the research is to explore how to provide green subsidies, enhance green levels, maintain competitive advantage, and improve profits in supply chain enterprises with inconsistent green levels. The study discusses the impact of green consumer preferences, market competition, and DDM quality on the profits of supply chain enterprises. It also analyzes how to use supply chain contracts to achieve coordination and optimization within the supply chain. The findings are summarized as follows. (1) As consumer preferences for green products increase, the unit subsidy model continues to enhance performance and market share more effectively than the total subsidy model. (2) The unit subsidy model requires a more relaxed subsidy coefficient, making it easier for enterprises to develop without needing high subsidies. It consistently achieves better total performance, particularly with improved DDM quality. (3) Manufacturers and retailers can achieve a win–win situation through internal coordination of the supply chain via wholesale price contracts. (4) Under certain conditions, consumers more sensitive to green products will increase the product pricing of both M1 and M2. The level of greenness of M2 will also increase. But also, the wholesale and retail prices of M1 will decrease because of the effect of DDM. (5) The effect of the intensity of market competition on pricing decisions is more complex. Under certain conditions, the market competition coefficient has a positive impact on the pricing of M1 and a negative impact on the pricing and green level of M2. This can be changed due to an increase in the level of DDM quality, where an increase in the market competition coefficient results in lower pricing for M1 and higher pricing for M2. The green level for M2 is also improved. In addition, the improvement in DDM quality consistently has a positive impact on pricing decisions and green levels for M2. Pricing decisions for M1 are affected differently, depending on the customer’s sensitivity to DDM.
Keywords:
duopoly competition model; government subsidy; data-driven marketing; green level; contract coordination MSC:
90B06
1. Introduction
The process of economic development has brought new challenges to society due to resource scarcity and environmental pressure caused by waste. According to the 2022 data from the International Energy Agency (IEA), global carbon dioxide emissions reached an unprecedented high of 36.8 gigatons, marking a 1.5% increase from the previous year. Specifically, carbon emissions in North America rose by 261 million tons, while emissions in Asia (excluding China) increased by 254 million tons. China’s carbon emissions remained relatively stable [1,2,3].
In today’s globalized and highly competitive business environment, supply chain management has become a crucial strategy for companies to achieve sustainable development and reduce environmental impacts. Apple Inc. has committed to achieving full carbon neutrality across its supply chain and products by 2030. The company plans to reduce its carbon emissions by 75% by this deadline and develop innovative technologies to eliminate the remaining 25% of its carbon footprint [4]. Moreover, Apple operates entirely on 100% renewable energy and requires its suppliers to switch to clean energy. Over 70 suppliers have pledged to use 100% renewable energy, which expected to reduce over 14.3 million metric tons of carbon dioxide emissions annually [5]. Therefore, supply chain enterprises need to pay part of the cost for the upgrade of the green supply chain, including the purchase of installation equipment for the use of clean energy and the daily maintenance of subsequent equipment [6]. In addition, JD.com is a Chinese e-commerce company that provides shopping services to consumers through supply chain technology and an omnichannel retail model. JD.com can significantly reduce energy consumption by building automated storage systems and energy-saving lighting systems [7]. Enterprises must create automation systems and replace lighting equipment to construct a green supply chain. Improving the economic effect of green supply chains can help supply chain enterprises carry out green transformation.
Sustainability, environmental, social, and governance (ESG) are essential in supply chain management. In the global pursuit of net-zero emissions and the fight against climate change, companies must achieve low-carbon operations and ensure that their upstream and downstream supply chains meet green environmental goals [8]. For example, Apple has actively responded to this challenge, aiming to achieve complete carbon neutrality in the supply chain by 2030 [9]. A detailed report of Apple’s carbon footprint reveals that product manufacturing accounts for 55% of its carbon emissions. Therefore, effective measures to reduce carbon emissions from the beginning of product design to the end of manufacturing are required to optimize the green level of the entire supply chain. However, due to the varying levels of green manufacturing development among different companies, there are disparities in green levels between enterprises.
As consumers become more conscious of low-carbon initiatives, their preference for green products is shaping market trends. To attract more consumer interest, sales platforms are increasingly incorporating information technology to gather consumer data. This enables them to customize products more effectively according to consumer preferences, thereby boosting sales.
Data-driven marketing (DDM) is a data-based marketing method. After collecting data through technical analysis, enterprises can locate precise consumer groups to achieve higher revenue [10]. Specifically, companies can integrate and analyze data through various technologies to develop personalized marketing strategies, target precise consumer groups, and create targeted marketing programs for them.
For example, Amazon collects user data such as website browsing history, shopping cart data, purchase history, and consumer reviews [11]. Data analysis is performed through machine learning algorithms. After that, Amazon can divide consumers into different groups and adopt various marketing strategies. Price-sensitive consumers will push discount ads. For high-frequency buyers, Amazon recommends ads for premium products and the latest products.
In addition, Starbucks also collects a large amount of consumer data through mobile apps and membership programs, such as consumption amounts, product preferences, geographic locations, and purchase frequency. Through this information, Starbucks uses big data algorithms to identify high-frequency consumer groups and provide exclusive offers and recommendations [12]. Starbucks will push reminder notifications and customized coupons for consumers at risk of churn to improve consumer retention. DDM is based on consumer data, and through big data algorithms, it can not only improve consumer satisfaction but also improve enterprise profits. With the future development of artificial intelligence technology, the application of DDM in supply chain enterprises will be more extensive and in-depth.
The purpose of this paper is to study what kind of subsidy policy the government should implement to help enterprises gain more profits in the green supply chain. The paper discusses the impact of data-driven marketing (DDM) on pricing decisions, green levels, and profits. According to the duopoly competition model, when the green consumer sensitivity coefficient is considered against the background of ESG, due to the green-level variable, the intensity of competition has an influence on the manufacturers of pricing decisions and the level of green products. This study uses the electronic product industry as the background to establish a model based on the above description. The primary research questions addressed in this paper are divided as follows:
- What are the optimal decisions for manufacturers and retailers under unit and total subsidy models?
- How do consumer preferences for green products influence the price decision and green level of manufacturers, retailers, and the supply chain as a whole?
- How does the market competition coefficient affect the price decision and green level of manufacturers, retailers, and the overall supply chain?
- How does the quality level of data-driven marketing (DDM) impact the price decision and green level of manufacturers, retailers, and the entire supply chain?
- When two subsidy policies are compared, which policy can enable the supply chain to achieve higher profits?
The contributions of this study are significant. First, this study establishes a duopoly competition model and considers two subsidy policies for comparison. The study finds that, regardless of the green sensitivity coefficient of consumers or the market share of products with high green levels, increasing the quality level of DDMs results in higher profits for firms under the government’s unit subsidy policy than in the total subsidy strategy. This extends the study of Li and He [13]. If, in this market, consumers are more sensitive to the green level of products, the higher the proportion of products with high green levels, the higher the DDM quality level, the government can adopt a lower unit subsidy coefficient, and the enterprise will also obtain higher profits under the unit subsidy policy than under the total subsidy strategy. In addition, the existing literature has rarely studied the influence of DDM on green levels. This study finds that DDM quality has a positive impact on the green levels of manufacturers, and improving the DDM quality level is helpful to improve the green levels of manufacturers. However, it is necessary to pay attention to the cost of DDM, which cannot improve DDM quality infinitely and will affect a platform’s profit, consistent with the study by Xu, Tang and Huang [3]. In addition, in order to improve the overall profit of the supply chain, this study introduces the wholesale price contract to promote cooperation among the members of the supply chain in order to achieve Pareto optimization.
The structure of this paper is as follows: The Section 2 presents a review of the literature. The Section 3 summarizes the problem statement and the definitions of symbols. The Section 4 formulates the model. The Section 5 examines the impact of consumer green preferences, competition coefficients, and DDM quality on decision variables and profit functions. The Section 6 incorporates numerical simulations to validate the effects of relevant parameters on the profits of supply chain members and overall profitability, and it compares the profits under different subsidy policies. The Section 7 proposes a wholesale price contract to verify the coordination mechanism of the supply chain, aiming to further enhance the overall performance of the supply chain.
2. Literature Review
This paper will review the literature from four key perspectives: the duopoly competition model, green supply chains, government subsidies, and data-driven marketing.
2.1. Duopoly Competition Model
Duopoly competition refers to a market scenario where there are two independent and competing enterprises. The existing research on duopoly competition models has primarily focused on organizational behavior, with scholars concentrating on three main aspects: product pricing decisions, influence mechanisms, and dynamic decision-making. Several scholars have studied the pricing decisions of SMEs [14] and how companies make pricing decisions under carbon emission control policies [15]. Kuang, Lian, Lien, and Zheng [16] studied how to optimize the routes of transport companies and how to achieve more profit by building a model of duopoly competition. Ding, Sun, Sun, and Han [17] discuss how to reduce price differences between supply chain firms through dynamic decision modeling, thus avoiding price competition. Zhu, Zhou, and Chu [18] investigate the effects of heterogeneous goods on market stability and firm behavior by building a mixed duopoly model. Some studies have also discussed how to adjust the government’s strategy of regulating firms based on the duopoly competition model [19].
Subsequently, a number of scholars have considered whether investments in green technologies have an impact on manufacturers’ profits [20]. There are also a number of studies in the field of economics, some of which discuss the relationship between environmental R&D risk and emissions taxes in a model of duopoly competition [21]. Brianzoni, Campisi, and Colasante [22] built a nonlinear bank duopoly model to study how to improve the operational efficiency of banks. Some other scholars have studied the optimal trade policy in a duopoly market [23].
Furthermore, existing research includes various other competition models, such as competition among multiple retailers [24] and competition between green and non-green enterprises [13].
In summary, the duopoly competition model serves as the theoretical foundation of this paper. Most of the existing research focuses on how the duopoly competition model affects corporate decision-making, including company profits and strategies. These models primarily consider price competition among firms and lack models that address competition between green manufacturing enterprises and green products. Therefore, this paper explores the competition among manufacturers with varying levels of green practices within the framework of the duopoly competition model, thereby supplementing existing research.
2.2. Green Supply Chain
The green supply chain achieves the goal of high efficiency and low pollution by managing communication, coordination, economy, and resources among the various entities within the supply chain [25]. Green supply chain management is primarily divided into internal and external aspects [26]. Internal environmental management includes green technology, green manufacturing, green procurement, green finance, and green logistics [27,28,29,30]. External environmental management encompasses the management and cooperation of supply chain members and collaboration with governmental or non-governmental organizations [31,32,33].
In the practice of green supply chain management, the existing research primarily focuses on the following aspects. First, Konstantaras, Skouri, and Benkherouf [34] proposed that optimizing green supply chain processes could reduce total costs while effectively lowering carbon emissions. Another area of focus is management issues related to the green supply chain and circular economy [35]. Kazancoglu et al. [36] mainly solved the multi-objective optimization problem in the design of a green, dual-channel, closed-loop supply chain network in the context of e-commerce and finally concluded that, by improving the network structure and transportation mode, enterprises can simultaneously reduce carbon dioxide and particulate matter emissions and reduce total costs.
Moreover, by optimizing the competition model of closed-loop supply chains under different carbon emission policies, it is suggested that enterprises adopt mixed carbon policies to achieve a balance between environmental and economic objectives [37]. In addition, many scholars have studied pricing decisions in green supply chains, including the green supply chain pricing decisions coordinated via different contracts [38]. Other scholars have studied the pricing decisions of different financing schemes in the closed-loop supply chain. Chen et al. [39] proposed that the trade credit financing scheme is more beneficial to recyclers and that the reduction in remanufacturing costs and government subsidies will affect the selection of financing strategies. They suggested adopting revenue-sharing contracts to achieve a win–win situation among supply chain enterprises and stressed the importance of green consumption awareness and government subsidies.
The green cost in the supply chain includes many aspects [40]. The primary sources are energy consumption, water management, waste management, environmentally friendly packaging, and pollution control. The first is the costs associated with environmental policies, such as energy consumption and water control [41]. There is also the pollution generated via activities such as the raw materials of products and harm to the environment [42], as well as the cost of environmentally friendly product packaging, recycling, and disposal [43].
The existing literature usually regards the green supply chain, and the green level of the supply chain members, as consistent, regardless of the differences among the supply chain members. This study fills this research gap, considering that the green level of each supply chain member is different, and most upstream and downstream enterprises have inconsistent development and make optimization decisions based on green levels and prices.
2.3. Government Subsidies
Some early studies laid the foundation and proposed that subsidy policies could encourage enterprises to reduce emissions, thereby regulating environmental pollution [44]. Some studies suggest that government incentive measures can encourage enterprises to carry out green technology innovation, which greatly promotes the development of the supply chain [36,45,46]. In the existing research, the most common subsidy beneficiaries are consumers, retailers, and manufacturers. Some researchers have discussed the impact of government subsidies on different enterprises in the green supply chain. For example, Yi, Wang, Fu, and Li [47] established a two-level supply chain consisting of manufacturers and retailers, indicating that government subsidy policies can produce more effective green emission reduction impacts than emission taxes. Other studies have explored how subsidies to manufacturers and subsidies to consumers affect optimal decision-making in the supply chain, respectively [48].
Moreover, in the green supply chain, in addition to government subsidies, consumer preferences are also taken into account [23,49]. The effects of government subsidies on pricing and green product quality in the dual-channel supply chain model are also studied [50]. Furthermore, Liu et al. [51] proposed that the subsidy threshold should be set, and consumer preferences should also be considered. Research shows that a lower subsidy threshold is more conducive to increasing profits, but consumers’ environmental preferences will be changed. Research methods for the comparison of multiple subsidy models are frequently used in the existing literature [37,39]. Since there is little literature that considers the inconsistency of green levels of supply chain members, this study combines this with the subsidy threshold and proposes two subsidy strategies for comparison, and explores which subsidy method has a more positive impact on supply chain profits.
2.4. Data-Driven Marketing (DDM)
The core of supply chain operation is data. With the rapid development of information technology, such as artificial intelligence, the marketing needs of sales platforms can be realized through DDM [52,53]. DDM plays a massive role in grasping user trends and discovering consumer needs [54]. Therefore, in recent years, many scholars have studied DDM, and some scholars have found that DDM can help enterprises record and evaluate the degree of consumer participation and consumer behavior in each activity [55]. Some scholars believe DDM is conducive to sales platforms providing consumers with customized services [56,57]. Some scholars have found that DDM can more accurately discover consumers’ consumption preferences and recommend more targeted promotional activities for a platform [58]. DDM can help a platform improve efficiency; with the help of DDM, the platform can implement a more accurate pricing and promotion plan to avoid the loss of profits caused by consumer loss [59]. Some scholars also analyzed how DDM affects pricing and delivery time decisions and its influence on optimal decisions in dual-channel supply chains by establishing mathematical models [3]. Therefore, some scholars believe DDM is a better approach to marketing and can change and improve management [60].
Table 1 concludes from the above literature review that there is a lack of research on the inconsistent green level of supply chain members in the existing literature. Therefore, based on the duopoly competition model, this study considered the inconsistent levels of supply chain members. It integrated green-level competition and various subsidy schemes, taking subsidy thresholds into account, and introduced DDM information technology to help sales platforms collect consumer preferences. Based on the theoretical foundation of the Stackelberg game, the study conducted pricing decisions, compared different subsidy schemes, and proposed a wholesale price contract for coordination.

Table 1.
Key related studies in the literature.
3. Problem Notations and Assumptions
In the context of the electronics industry, take Apple as an example; it requires all of its supply chain companies to be 100% carbon neutral by 2030 [9]. Many companies are not yet 100% carbon neutral in the current supply chain. Therefore, Apple needs to provide manufacturers with incentives, such as subsidies, to encourage its manufacturers to upgrade green technology actively in order to meet Apple’s requirements. In this process, manufacturers will also form a competitive pattern, and manufacturers that do not meet the green standards will lose subsidies or even be eliminated.
In addition, in the context of the rapid development of artificial intelligence, we considered the role of DDM in the supply chain. We added it to the model for further research.
This paper focuses on two manufacturers with differing levels of green practices as participants. Figure 1 illustrates the model structure.
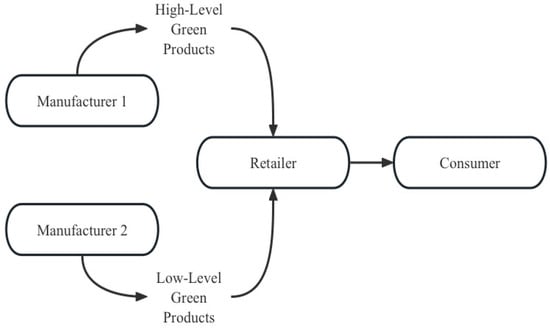
Figure 1.
The structure of the green supply chain.
This study constructed a green supply chain comprising two manufacturers and one retailer. It analyzed consumers’ green preferences and the competition coefficient in the context of low-carbon sustainable development. The government encourages green production by manufacturers, offering subsidies to those that meet the mandated green standards. Additionally, manufacturers use data-driven marketing (DDM) to provide targeted green products to consumers, enhancing demand.
This research considers two different subsidy strategies: a total subsidy for manufacturers’ green production (Model Z), and a per-unit subsidy for the production cost of green products (Model H). Using the Stackelberg game model and referencing the existing literature, the two manufacturers are positioned as leaders. The retailer, as the follower, purchases products with varying green levels from these manufacturers and sells them to consumers. Consumers choose products based on their green preferences.
3.1. Notations
The variables and their notations are shown in Table 2.
Table 2.
Related notations.
3.2. Problem Assumptions
Assumption 1.
The demand for each product is a linear function of market share, retail price, product green level, market competition intensity, and the quality of data-driven marketing (DDM). The demand function for high-level green products is given by , while the demand function for lower-level green products is . According to the duopoly competition model and considering the impact of market share on product prices and corporate profits, if Manufacturer 1 (M1) occupies a market share of , then Manufacturer 2 (M2) has a market share of [13]. Consumers’ green preference is denoted as , and is the market competition intensity coefficient, with higher indicating more intense market competition [63]. Additionally. represents the quality of DDM, and denote consumer sensitivity to DDM [3]. In order to simplify the calculations, it is assumed that the retailer’s order quantity is equal to the demand function.
Assumption 2.
M1 has achieved the government-mandated green level , while M2 has not, with a green level of . In order to represent the costs incurred by manufacturers for green production activities to enhance their green levels, we use the following cost functions and . Here, represents the cost coefficient related to the green level.
Assumption 3.
To avoid trivial situations, based on the research, and are set.
Assumption 4.
In this study, the production costs, , for goods manufactured by M1 and M2 are identical. Given the high costs associated with green investments, the government will reward enterprises with higher green levels. Considering the differences in green levels between M1 and M2, the government will only provide subsidies to M1, which has achieved higher green standards.
4. Model Formulation and Optimal Decision-Making
According to the duopoly competition game model, the decision-making sequence is as follows: First, M1 and M2, as leaders, determine the wholesale prices of the goods they produce, as well as the level of green development that does not meet the government-mandated green standards. Second, the retailer, as the follower, sets the retail prices of the products from both manufacturers based on the decisions made by M1 and M2. Additionally, the analysis includes the impact of the consumer green sensitivity coefficient, the competition intensity coefficient between manufacturers, and the quality of data-driven marketing (DDM) on the profits of manufacturers, the retailer, and the total profit of the supply chain. Finally, a wholesale price contract is proposed to coordinate the relationship between manufacturers and the retailer.
4.1. Policy 1: Total Subsidy for Manufacturers’ Green Production Costs (Model Z)
In Model Z, where the government provides a total green production subsidy to Manufacturer 1 (M1) for achieving the green level, the profit functions for the manufacturers and the retailer are as follows:
Equation (1) represents the profit function for Manufacturer M1, which meets the government-mandated green standards. The first component denotes revenue, while the second part reflects green production costs. Here, is the cost coefficient associated with the green level, and the green cost is given by . The third component is the government subsidy, with representing the subsidy coefficient provided to companies that meet the green standards, and the subsidy amount is .
Equation (2) represents the profit function for Manufacturer M2, which does not meet the government-mandated green standards. The first component denotes revenue, while the second part reflects green costs. As M2’s green level has not reached the government’s prescribed green standard, no green subsidy has been provided.
Equation (3) represents the profit function for the retailer. The retailer’s revenue includes the profit from selling products from M1 and M2, as well as the costs associated with using data-driven marketing (DDM). Here, denotes the cost coefficient for data analysis, and represents the cost of data collection. Both products are sold on the same retail platform, and the DDM cost is given by [3,57].
In the centralized decision-making model, manufacturers and retailers jointly decide on the retail price and green level with the objective of maximizing the supply chain’s profit. Therefore, the profit function for the centralized decision-making model is as follows:
Proposition 1.
In the decentralized decision-making model (D), based on backward induction, if the condition is satisfied, then an optimal solution exists.
where , , , .
Proof of Proposition 1.
See Appendix A.1. □
Proposition 2.
In a centralized decision-making model, the optimal solution can be obtained if is satisfied.
where .
Proof of Proposition 2.
See Appendix A.2. □
4.2. Policy 2: Unit Subsidy for Manufacturers’ Green Production Costs (Model H)
In Model H, the government provides unit subsidies for manufacturers (M1) who meet green production standards. The profit functions of manufacturers and retailers in Model H are as follows:
The government provides unit subsidies to the manufacturer M1 based on the unit production cost, , the unit subsidy coefficient, , and the green production level, . The unit subsidy amount is thus calculated as . Additionally, since the manufacturer M2 does not meet the subsidy criteria, the profit functions for M2 and the retailers remain unchanged.
The profit function in the centralized model is as follows:
Proposition 3.
The optimal solution in Model H in the decentralized decision-making model is as follows:
Proof of Proposition 3.
See Appendix A.3. □
Proposition 4.
The optimal solution in Model H in the centralized decision-making model is as follows:
where , , .
Proof of Proposition 4.
See Appendix A.4. □
5. Further Analysis
Since the sensitivity analyses of Model Z and Model H are consistent, based on the above equilibrium solutions, this section will study how the green sensitivity coefficient, competition intensity coefficient, and DDM quality affect the decisions and profits of manufacturers and retailers and compare these decision outcomes.
Proposition 5.
In the decentralized model, when and , , ; when and , , , where and .
Proposition 5 it indicates that the more sensitive consumers are to green products, the more advantageous it is for the retailer and M1 to increase both the retail price and the wholesale price of green products, consistent with the findings of Li and He [13]. When the quality of DDM improves, companies can better grasp market demand data, making retailers and M1 more willing to lower retail and wholesale prices to attract consumers sensitive to green products.
Proposition 6.
In the decentralized model, .
Proposition 6 indicates that the more sensitive consumers are to green products, the more advantageous it is for M2 to increase both the wholesale and retail prices of its products. Additionally, this sensitivity can incentivize M2 to enhance its green production level, contributing to sustainable development.
Proof of Propositions 5 and 6.
See Appendix A.5. □
Proposition 7.
In the decentralized model, when and , , ; when and , , .
where , .
Proposition 7 indicates that, when market potential demand is limited, and the quality level of data-driven marketing (DDM) is low, the market competition coefficient has a positive impact on both the wholesale and retail prices of M1’s products. Conversely, when the quality of DDM is high, companies have a precise consumer base, and as market competition intensifies, M1 needs to lower its wholesale and retail prices to attract more consumer demand.
Proposition 8.
In the decentralized model, when and , , ; when and , , .
where .
Proposition 8 indicates that, in the context of high green production costs, DDM can provide greater advantages for M2. When the quality level of DDM is high, the market competition coefficient positively affects the selling and wholesale prices of M2’s green products. Conversely, when the DDM quality is low, M2, with a lower green level, needs to reduce prices to attract more demand.
Proposition 9.
In the decentralized model, when , , ; when , , , where .
Proposition 9 indicates that, when market potential demand is limited and the quality level of DDM is high, the competition coefficient positively affects M2’s green production level, promoting the development of M2’s green level. Conversely, when the quality level of DDM is low, intensified market competition is detrimental to the development of the green level in supply chain enterprises.
Proof of Propositions 7–9.
See Appendix A.6. □
Proposition 10.
In the decentralized model, when , , , ; when , , , .
Proposition 10 indicates that, when M2’s consumers are not sensitive to DDM, the quality of DDM has a positive impact on M1’s product prices, with retail and wholesale prices continuously rising. When M2’s consumers are sensitive to DDM, M1 will lower its wholesale prices, and retailers will reduce M1’s selling prices to capture a larger market share.
Proposition 11.
In the decentralized model, , , .
Proposition 11 indicates that, as the quality level of DDM continuously improves, M2’s wholesale price, retail price, and green production level will keep rising, thereby encouraging M2’s sustainable development.
Proof of Propositions 10 and 11.
See Appendix A.7. □
Proposition 12.
when , , , (1) when , ; (2) when , .
Proposition 12 indicates that, when consumers’ green preferences are less than , and the market share of high-level green products is below a specific value, while the unit subsidy coefficient and the total subsidy coefficient are above certain thresholds, the total profit of the unit subsidy model (Model H) will be greater than that of the total subsidy model (Model Z). Conversely, when the DDM quality level is lower than a certain value, the total profit of Model Z will exceed that of Model H.
Proposition 13.
When , , , . (1) When , ; (2) when , .
Proposition 13 shows that, when consumers’ green preference is higher than , the market share of high-level green products exceeds a specific value, and the total subsidy coefficient is above a certain threshold—regardless of whether the unit subsidy coefficient is high or low—if the DDM quality level is greater than a specific value, the total profit of the unit subsidy model (Model H) will be greater than that of the total subsidy model (Model Z). Conversely, when the DDM level is lower than a certain value, the total profit of Model Z will surpass that of Model H.
Where , , , .
Proof of Propositions 12 and 13.
See Appendix A.8. □
Propositions 12 and 13 indicates that, when the market share of high-level green products is small and consumer green preference is low, both subsidy models require additional subsidies to support supply chain enterprises. As the quality level of DDM improves, the profit performance of the unit subsidy model will surpass that of the total subsidy model. Furthermore, when the consumer green preference increases and the market share of high-level green products aligns with consumer needs, the total subsidy model still necessitates a higher subsidy. However, the requirement for the subsidy coefficient of the unit subsidy model becomes more relaxed, and a higher subsidy is no longer essential. Additionally, with continued improvement in DDM quality, the unit subsidy model’s profit performance will remain superior to that of the total subsidy model.
6. Numerical Analysis
In this section, numerical analysis is used to verify the models and conclusions mentioned above. The impacts of and on decision variables and profit functions are clearly illustrated. In order to evaluate the proposed model, some numerical examples are taken from Li and He [13] and Xu, Tang and Huang [3], with modifications to fit the conditions of our models. We assume the potential market demand of , a unit production cost for M1 and M2 of , a green production level for M1 of , a market share of M1 , a green production cost coefficient of , a government green subsidy coefficient of , and . The sensitivity coefficients of consumers to DDM , the DDM data collection cost is , and the data analysis cost coefficient is . According to these values, the study also takes into account the theoretical assumptions mentioned above, and it concludes that , , and all have limited ranges. In Section 6.1, Section 6.2 and Section 6.3, the ranges of these parameters are considered for numerical analysis.
6.1. Comparison of Profits Under Different Green Sensitivity Coefficients ()
This subsection compares the profits of manufacturers and retailers under different green sensitivity coefficients in two models. According to Li and He [13], θ is set to 25, v is set to 5, and 0 < γ < 16. Figure 2 shows the effect of γ on the profits of M1, M2, retailers, and the total supply chain in both models, and the figure compares them.
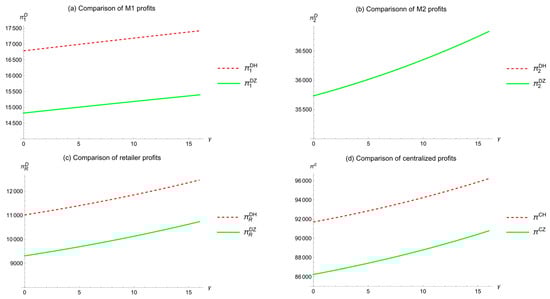
Figure 2.
Comparison of profits under different green sensitivity coefficients ().
As Figure 2a shows, in the decentralized model, as γ increases, M1’s profit gradually increases, and M1’s profit in Model H is higher than in Model Z.
Figure 2b shows that, as γ increases, M2’s profit continuously increases, and M2’s profit in Model H is equal to that in Model Z.
Figure 2c shows that, as γ increases, the retailer’s (R) profit continuously increases, which is consistent with the finding of Li and He [13], and R’s profit in Model H is generally higher than in Model Z.
Additionally, Figure 2d shows that, as γ increases, the total profit function in the centralized model also continuously increases. For M1, M2, and R, the profit in the centralized model is higher than in the decentralized model, and the centralized profit in Model H is generally higher than in Model Z.
In summary, consumers’ green product preferences have a positive impact on the profits of M1, M2, retailers, and the overall supply chain. In Model H, the profits of supply chain members and the overall supply chain are better than those in Model Z.
6.2. Comparison of Profits Under Different Competition Coefficients ()
This subsection compares the profits of manufacturers and retailers in the supply chain under different competition coefficients (). With set to 15, set to 5, and , Figure 3 shows the impact of on the profits of M1, M2, retailers, and the total supply chain in two models.
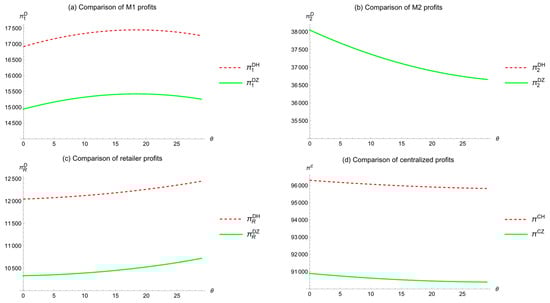
Figure 3.
Comparison of profits under different competition coefficients (θ).
As Figure 3a shows, in the decentralized model, as increases, M1’s profit first increases and then decreases, and M1’s profit in Model H is higher than in Model Z.
Figure 3b shows that, as increases, M2’s profit continuously decreases, and M2’s profit is consistent in both models.
Figure 3c shows that, as increases, the retailer’s (R) profit continuously increases, and R’s profit in Model H is generally higher than in Model Z.
Additionally, in the centralized model, Figure 3d shows that, as increases, the total supply chain profit for M1, M2, and R continuously decreases. This contradicts the findings of Li and He [13], which indicated that market competition increases the total supply chain profit. This difference arises because the previous study considered price competition, while this study focuses on green-level competition. Inappropriate green-level competition affects supply chain profit performance.
In summary, the competition coefficient has a negative impact on the profits of M1 and M2, a positive impact on the retailer’s profit, and a negative impact on the overall supply chain profit. This indicates that inappropriate competition in the market affects the profitability of competing enterprises within the supply chain.
6.3. Comparison of Profits Under Different DDM Quality Levels ()
This subsection compares the profits of manufacturers and retailers in the supply chain under different DDM quality levels (). With set to 15 and set to 25, , Figure 4 shows the impact of v on the profits of M1, M2, retailers, and the total supply chain.
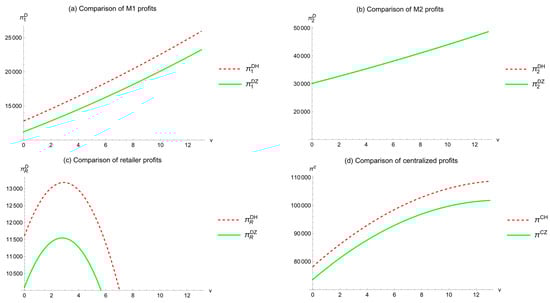
Figure 4.
Comparison of profits under different DDM quality levels ().
As Figure 4a shows, in the decentralized model, as increases, M1’s profit continuously increases, and M1’s profit in Model H is higher than in Model Z.
Figure 4b shows that, as increases, M2’s profit continuously increases, and M2’s profit is consistent in both models.
Figure 4c shows that, as increases, the retailer’s (R) profit first increases and then decreases, and R’s profit in Model H is generally higher than in Model Z.
Additionally, Figure 4d shows that, as increases, the total profit function in the centralized model also gradually increases, and the centralized profit in Model H is generally higher than in Model Z. For M1, M2, and R, the profit in the centralized model is higher than in the decentralized model.
In summary, the quality level of DDM has a positive impact on the profits of M1 and M2, but over-pursuing higher DDM quality levels can affect the retailer’s profit. This is consistent with other studies on DDM [3,57]; DDM can improve the previous research on green supply chains and increase economic returns.
7. Supply Chain Contract Coordination (Model CS)
This section mainly focuses on the coordination mechanisms in the supply chain to further improve overall performance. Without a coordination mechanism, it is difficult to optimize supply chain profits. The purpose of contract coordination is to ensure that the combined profits of both parties, after coordination, achieve the same effect as centralized decision-making and that each party’s profit is not lower than their profit in decentralized decision-making [64]. This paper introduces wholesale price contracts to encourage cooperation among companies, a widely used approach in supply chain management.
On the one hand, to better encourage the development of supply chain companies, M1, M2, and retailers agree on product prices through contracts to maximize the overall supply chain profit. On the other hand, M1, M2, and retailers agree on the wholesale price of green products, ensuring that the profits achieved through contracts are not lower than their profits from individual decision-making. The key to coordination is the range of wholesale prices for green products.
Proposition 14.
After the wholesale price contract is adopted, the following conditions must be satisfied to achieve Pareto optimality: , , , and .
Due to the complexity of calculations, we need to substitute the values from the previous section with , , and . The results are , . By setting , we get and by setting .
Additionally, we can obtain the following. Table 3 presents a numerical comparison of the three models. The results show that the total profit under the decentralized model is 66,483.22, the total profit under the centralized model is 95,857.42, and the total profit under the contract coordination model is 95,857.42. It can be concluded that the centralized supply chain profit increases by 44.18% with respect to that under the decentralized system.
Table 3.
Numerical comparison of three decision models.
8. Conclusions and Managerial Implications
This research takes Apple’s sustainable development strategy as the background and draws some conclusions at the theoretical level. And this paper is based on a green supply chain duopoly competition model, considering the inconsistent green levels of supply chain members and introducing data-driven marketing (DDM). It compares two subsidy policies and analyzes three models: D, C, and CS. It examines the impact of green consumer preferences, market competition, and DDM quality on the profits of manufacturers, retailers, and the overall supply chain. The specific conclusions are as follows:
(1) The proportion of high-level green products in the market must meet consumer needs. When consumer green preferences are low, the market share of high-level green products is also low, necessitating high subsidies in both subsidy models to support enterprise development. An improvement in DDM quality is more beneficial for the total profit performance of the unit subsidy model, which outperforms the total subsidy profit model. As consumer preference for green products increases, the market share of high-level green products also rises. In this scenario, improvements in DDM quality continue to favor the unit subsidy model, which remains more profitable than the total subsidy profit model. However, the total subsidy model still requires a high subsidy coefficient, while the unit subsidy model’s subsidy coefficient requirements become more relaxed, eliminating the need for a higher coefficient.
(2) In Model H, the total supply chain profit under centralized decision-making exceeds that under decentralized decision-making. After coordination through wholesale price contracts, the total profit in the CS model can equal the total supply chain profit achieved under centralized decision-making, thus achieving Pareto optimality.
(3) Regardless of the subsidy strategy, the coefficient of consumer sensitivity to green products affects the pricing decisions and green levels of manufacturers and retailers. When the market size is small and the level of DDM quality is low, the coefficient of consumer sensitivity to green products has a positive effect on the pricing decision of M1 with a high green level, and the more consumers are sensitive to green products, the more expensive the pricing of products with a high level of green is, both in terms of the retail price of the product and the manufacturer’s wholesale price. However, when the market size is small but the level of DDM quality is high, the coefficient of consumer sensitivity to green products has a negative effect on the pricing decision of M1, and the more sensitive consumers are to green products, the price of products with high green level decreases instead. In addition, in general, in any case, for a manufacturer, M2, with a low green level, the coefficient of consumer sensitivity to green products has a positive effect on M2’s decisions on retail and wholesale prices, which can also incentivize M2 to increase its level of greenness.
(4) Under any subsidy strategy, the market competition intensity coefficient affects the pricing decisions and green levels of manufacturers and retailers. Under certain conditions, the market competition intensity coefficient has a positive effect on the pricing decision of M1 with a higher green level when the DDM quality level is low. The more competitive the market is when the DDM quality level is high, the lower the pricing of M1. Conversely, at lower levels of DDM quality, M2’s retail and wholesale prices will reduce pricing as the market becomes more competitive. The market competition intensity coefficient has a positive effect on the pricing decisions of M2 with a higher level of green when the level of DDM quality is high. The explanation for this phenomenon is that, in general market competition, M2’s green products, which need to reduce prices to get more sales opportunities due to the intervention of DDM, making customer targeting more accurate, do not need to attract customers through price wars. Therefore, M2 does not need to reduce the price.
(5) Under either subsidy strategy, the DDM quality level affects the pricing decisions and green levels of both manufacturers and retailers. Under certain conditions, the DDM quality level positively affects the pricing decisions of M1, which has a higher green level. However, when M2’s customer group is sensitive to DDM, a high level of DDM quality leads to lower retail and wholesale prices for M1. This phenomenon is explained by the possibility that, when customers are more easily attracted to M2, M1 has to lower its price to attract more customers. In addition, the quality level of DDM has a positive effect on M2’s pricing decision, as well as the level of greenness; a higher level of DDM quality can incentivize M2 to increase the level of greenness, as well as wholesale and retail prices.
The managerial insights of this research are proposed as follows.
(1) The government should prioritize the adoption of the unit subsidy strategy to subsidize the production costs of manufacturers. Research shows that the unit subsidy strategy is more effective in improving the profit level of supply chain enterprises than other subsidy methods. At the same time, this strategy offers the advantage of controllable fiscal expenditure, which can reduce the government’s fiscal burden while stimulating industrial development and realizing the balance between policy effect and fiscal sustainability.
(2) Sales platforms should actively promote the application and innovation of data-driven marketing (DDM) technology. Under the background of the rapid iteration of artificial intelligence technology and the deepening of global consensus on sustainable development, DDM technology has multiple strategic values: for upstream manufacturers, it can establish an effective incentive mechanism for green technology upgrading and accelerate the achievement of the 2030 carbon neutrality target; for downstream consumers, it can accurately match the supply of products with consumption demand and optimize the price formation mechanism; for downstream consumers, it can precisely match product supply and consumption demand and optimize the price formation mechanism; for the platform itself, it can enhance operational efficiency and market competitiveness. Therefore, it is recommended to take DDM technology as the core hand of supply chain digital transformation and fully allow its key role in promoting supply chain collaborative innovation and sustainable development.
(3) Supply chain members should establish a cooperative mechanism for in-depth synergy. The study shows that, through the introduction of coordination mechanisms such as wholesale price contracts, not only can manufacturers and retailers realize a win–win situation but they can also promote the overall profit level of the supply chain to increase significantly by 44.18%. This finding confirms the value of supply chain collaborative management: through the establishment of effective benefit distribution mechanisms and cooperation frameworks, it is possible to break through the traditional limitations and create greater synergistic value. Therefore, it is recommended that supply chain participants build a strategic partnership to realize the sustainable improvement of the overall competitiveness of the supply chain through information sharing, risk sharing, and benefit sharing.
9. Limitations and Future Research
To enhance the robustness and practical relevance of the findings, future research could address the following limitations by integrating multi-period dynamics and stochastic factors.
1. Multi-period dynamics: The current model assumes fixed parameters over a single decision period. In reality, market conditions (e.g., consumer preferences, subsidy policies, and DDM technology) evolve over time. For instance, government subsidies may be phased out gradually, or consumer sensitivity to green products could shift due to environmental awareness campaigns. A multi-period framework would allow an analysis of how long-term strategies (e.g., dynamic subsidy adjustments and iterative green technology investments) affect supply chain performance.
2. Stochastic demand and external shocks: The deterministic demand function neglects uncertainties such as economic fluctuations, supply chain disruptions, or sudden shifts in consumer behavior (e.g., pandemics and regulatory changes). Introducing stochastic demand models (e.g., Poisson processes or Brownian motion) would better reflect real-world volatility and enable risk-aware decision-making.
By addressing these limitations, future work can provide deeper insights into the resilience and adaptability of green supply chains in complex, real-world environments.
Author Contributions
Conceptualization, Y.Y. and H.T.; methodology, Y.Y., S.G. and H.T.; formal analysis, Y.Y., J.C. and F.S.; writing—original draft preparation, Y.Y.; writing—review and editing, S.G., F.S. and H.T.; supervision, S.G. and H.T.; project administration, S.G. and H.T. All authors have read and agreed to the published version of the manuscript.
Funding
This research was supported by the Tianjin Natural Science Foundation Multi-Investment Project (Grant No. 24JCQNJC00210).
Data Availability Statement
The original contributions presented in this study are included in the article. Further inquiries can be directed to the corresponding author.
Conflicts of Interest
The authors declare no conflicts of interest.
Appendix A
Appendix A.1. Proof of Proposition 1
In a decentralized decision-making process, there is a Stackelberg game where two manufacturers lead, and the retailer follows. To find the equilibrium solution, we use the backward induction method.
Firstly, the first-order partial derivatives of over in Equation (3) are as follows:
Secondly, the Hessian matrix is , which is a negative definite for and , existing the unique optimal solution for and , and that maximizes .
Thirdly, let the first derivative of with respect to and be equal to 0. So,
By substituting Equation (A1) into Equation (1) and Equation (A2) into Equation (2), we can obtain the following:
Therefore, the first derivative of with respect to and with respect to is as follows:
The Hessian matrix is . If the condition is satisfied, then is a concave function. And let the first derivative of with respect to , and with respect to , be equal to 0. It can obtain the following:
Through substitution into Equations (A1) and (A2), it can obtain the following:
And through substitution into profit functions, it can obtain the following:
Appendix A.2. Proof of Proposition 2
Firstly, the first-order partial derivatives of over in Equation (4) are as follows:
Secondly, the Hessian matrix is , and its first-order, second-order, and third-order master sub-determinants are , ,, respectively. If , the Hessian matrix is a negative definite. And let the first derivative of with respect to be equal to 0. It can obtain the following:
And, through substitution into Equation (4), it can obtain the following:
Appendix A.3. Proof of Proposition 3
Similar to Proposition 1.
Appendix A.4. Proof of Proposition 4
Similar to Proposition 2.
Appendix A.5. Proof of Propositions 5 and 6
Proposition 5 when and , , ; when and , , .
Proposition 6 .
Appendix A.6. Proof of Propositions 7–9
Proposition 7 When and , , ; when and , , .
Proposition 8 When and , , ; when and , , .
Proposition 9 When , , ;when , , .
Appendix A.7. Proof of Propositions 10 and 11
Proposition 10 When , , , ; when , , , .
Proposition 11 , , .
Appendix A.8. Proof of Propositions 12 and 13
Proposition 12 When , , , (1) when , ; (2) when , .
Proposition 13 When , , , . (1) when , ; (2) when , .
References
- International Energy Agency. CO2 Emissions in 2022. 2023. Available online: https://www.iea.org/reports/co2-emissions-in-2022 (accessed on 11 March 2025).
- Liu, Z.; Deng, Z.; Davis, S. Monitoring global carbon emissions in 2022. Nat. Rev. Earth Environ. 2023, 4, 205–206. [Google Scholar] [CrossRef] [PubMed]
- Xu, S.; Tang, H. Decisions of pricing and delivery-lead-time in dual-channel supply chains with data-driven marketing using internal financing and contract coordination. Ind. Manag. Data Syst. 2023, 123, 1005–1051. [Google Scholar] [CrossRef]
- Li, X.; Zhu, G.L. Green supply chain coordination considering carbon emissions and product green level dependent demand. Mathematics 2023, 11, 2355. [Google Scholar] [CrossRef]
- Shen, J.Y. A green supply chain with sales effort under a cost-sharing contract. Mathematics 2024, 12, 1435. [Google Scholar] [CrossRef]
- Ma, T.F.; Tian, X.C.; Liu, Y.; Jin, Y.; Wang, S.A. Mixed-integer optimization for ship retrofitting in green logistics. Mathematics 2024, 12, 1831. [Google Scholar] [CrossRef]
- Mak, H.Y.; Shen, Z.J.M. When triple-a supply chains meet digitalization: The case of JD.com’s C2M model. Prod. Oper. Manag. 2021, 30, 656–665. [Google Scholar] [CrossRef]
- Wang, H.; Pang, C.; Tang, H. Pricing and carbon-emission-reduction decisions under the bops mode with low-carbon preference from customers. Mathematics 2023, 11, 2736. [Google Scholar] [CrossRef]
- Apple. Apple 2030 a Plan as Innovative as Our Products. 2025. Available online: https://www.apple.com/environment/ (accessed on 11 March 2025).
- Ravat, L.; Hemonnet-Goujot, A.; Hollet-Haudebert, S. Exploring how to develop data-driven innovation capability of marketing within b2b firms: Toward a capability model and process-oriented approach. Ind. Mark. Manag. 2024, 118, 110–125. [Google Scholar] [CrossRef]
- Li, Z.T.; Xu, H.; Lyu, R.X. Effectiveness analysis of the data-driven strategy of ai chips supply chain considering blockchain traceability with capacity constraints. Comput. Ind. Eng. 2024, 189, 109947. [Google Scholar] [CrossRef]
- Tan, Y.; Gu, L.Y.; Xu, S.Y.; Li, M.C. Supply chain inventory management from the perspective of “cloud supply chain”-a data driven approach. Mathematics 2024, 12, 573. [Google Scholar] [CrossRef]
- Li, X.; He, J. Mechanism of the green supply chain profit of building materials considering the duopoly competition model and consumer green preference. Int. J. Syst. Sci. Oper. Logist. 2024, 11, 2311283. [Google Scholar] [CrossRef]
- Yao, Y.; Zhao, H.; Chen, Y.; Xu, D.; Long, Y. Positioning–pricing problem of heterogeneous duopoly with uncertain consumer preferences. Soft Comput. 2018, 22, 5775–5782. [Google Scholar] [CrossRef]
- Jian, M.; He, H.; Ma, C.; Wu, Y.; Yang, H. Reducing greenhouse gas emissions: A duopoly market pricing competition and cooperation under the carbon emissions cap. Environ. Sci. Pollut. Res. 2019, 26, 16847–16854. [Google Scholar] [CrossRef] [PubMed]
- Kuang, Z.H.; Lian, Z.; Lien, J.W.; Zheng, J. Serial and parallel duopoly competition in multi-segment transportation routes. Transp. Res. Part. E Logist. Transp. Rev. 2020, 133, 101821. [Google Scholar] [CrossRef]
- Cataldo, I.; Banaitis, A.; Samadhiya, A.; Banaitiene, N.; Kumar, A.; Luthra, S. Sustainable supply chain management in construction: An exploratory review for future research. J. Civ. Eng. Manag. 2022, 28, 536–553. [Google Scholar] [CrossRef]
- Zhu, Y.L.; Zhou, W.; Chu, T. Analysis of complex dynamical behavior in a mixed duopoly model with heterogeneous goods. Chaos Solitons Fractals 2022, 159, 112153. [Google Scholar] [CrossRef]
- Wang, Y.; Jin, H.; Zheng, S.Y.; Shang, W.L.; Wang, K. Bike-sharing duopoly competition under government regulation. Appl. Energy 2023, 343, 121121. [Google Scholar] [CrossRef]
- Zhu, X.; Du, J.; Boamah, K.B.; Long, X. Dynamic analysis of green investment decision of manufacturer. Environ. Sci. Pollut. Res. 2020, 27, 16998–17012. [Google Scholar] [CrossRef]
- Xing, M.Q.; Tan, T.T.; Wang, X. Emission taxes and environmental R&D risk choices in a duopoly market. Econ. Model. 2021, 101, 105530. [Google Scholar]
- Brianzoni, S.; Campisi, G.; Colasante, A. Nonlinear banking duopoly model with capital regulation: The case of Italy. Chaos Solitons Fractals 2022, 160, 112209. [Google Scholar] [CrossRef]
- Chen, J.; Xie, X.; Sun, C.; Lin, L.; Liu, J. Optimal trade policy and welfare in a differentiated duopoly. Manag. Decis. Econ. 2022, 43, 3019–3043. [Google Scholar] [CrossRef]
- Sarkar, S.; Bhadouriya, A. Manufacturer competition and collusion in a two-echelon green supply chain with production trade-off between non-green and green quality. J. Clean. Prod. 2020, 253, 119904. [Google Scholar] [CrossRef]
- Xu, L.; Wang, C.; Li, H. Decision and coordination of low-carbon supply chain considering technological spillover and environmental awareness. Sci. Rep. 2017, 7, 3107. [Google Scholar] [CrossRef] [PubMed]
- Birasnav, M.; Chaudhary, R.; Dunne, J.H.; Bienstock, J.; Seaman, C. Green supply chain management: A theoretical framework and research directions. Comput. Ind. Eng. 2022, 172, 108441. [Google Scholar] [CrossRef]
- Agyabeng-Mensah, Y.; Ahenkorah, E.; Afum, E.; Agyemang, A.N.; Agnikpe, C.; Rogers, F. Examining the influence of internal green supply chain practices, green human resource management and supply chain environmental cooperation on firm performance. Supply. Chain. Manag. Int. J. 2020, 25, 585–599. [Google Scholar] [CrossRef]
- Hussain, M.; Al-Aomar, R.; Melhem, H. Assessment of lean-green practices on the sustainable performance of hotel supply chains. Int. J. Contemp. Hosp. Manag. 2019, 31, 2448–2467. [Google Scholar] [CrossRef]
- Pinto, L. Green supply chain practices and company performance in portuguese manufacturing sector. Bus. Strategy Environ. 2020, 29, 1832–1849. [Google Scholar] [CrossRef]
- Zhu, J.H.; Lu, Y.; Song, Z.T.; Shao, X.F.; Yue, X.G. The choice of green manufacturing modes under carbon tax and carbon quota. J. Clean. Prod. 2023, 384, 135336. [Google Scholar] [CrossRef]
- Abdallah, A.B.; Al-Ghwayeen, W.S. Green supply chain management and business performance: The mediating roles of environmental and operational performances. Bus. Process Manag. J. 2020, 26, 489–512. [Google Scholar] [CrossRef]
- Habib, A.; Bao, Y. Impact of knowledge management capability and green supply chain management practices on firm performance. Int. J. Res. Bus. Soc. Sci. 2019, 8, 240–255. [Google Scholar] [CrossRef]
- Kalyar, M.N.; Shoukat, A.; Shafique, I. Enhancing firms’ environmental performance and financial performance through green supply chain management practices and institutional pressures. Sustain. Account. Manag. Policy J. 2019, 11, 451–476. [Google Scholar] [CrossRef]
- Konstantaras, I.; Skouri, K.; Benkherouf, L. Optimizing inventory decisions for a closed–loop supply chain model under a carbon tax regulatory mechanism. Int. J. Prod. Econ. 2021, 239, 108185. [Google Scholar] [CrossRef]
- Gao, J.Q.; Li, D.; Qiao, G.H.; Jia, Q.R.; Li, S.R.; Gao, H.L. Circular economy strategies in supply chains, enhancing resource efficiency and sustainable development goals. Environ. Sci. Pollut. Res. 2024, 31, 8751–8767. [Google Scholar] [CrossRef] [PubMed]
- Kazancoglu, Y.; Yuksel, D.; Sezer, M.D.; Mangla, S.K.; Hua, L. A green dual-channel closed-loop supply chain network design model. J. Clean. Prod. 2022, 332, 130062. [Google Scholar] [CrossRef]
- Huang, Y.; He, P.; Cheng, T.; Xu, S.; Pang, C.; Tang, H. Optimal strategies for carbon emissions policies in competitive closed-loop supply chains: A comparative analysis of carbon tax and cap-and-trade policies. Comput. Ind. Eng. 2024, 195, 110423. [Google Scholar] [CrossRef]
- Taleizadeh, A.A.; Alizadeh-Basban, N.; Sarker, B.R. Coordinated contracts in a two-echelon green supply chain considering pricing strategy. Comput. Ind. Eng. 2018, 124, 249–275. [Google Scholar] [CrossRef]
- Chen, J.; Tian, Y.; Chan, F.T.; Tang, H.; Che, P.H. Pricing, greening, and recycling decisions of capital-constrained closed-loop supply chain with government subsidies under financing strategies. J. Clean. Prod. 2024, 438, 140797. [Google Scholar] [CrossRef]
- Ghaderi, Z.; Shakori, H.; Bagheri, F.; Hall, C.M.; Rather, R.A.; Moaven, Z. Green supply chain management, environmental costs and supply chain performance in the hotel industry: The mediating role of supply chain agility and resilience. Curr. Issues Tour. 2024, 27, 2101–2117. [Google Scholar] [CrossRef]
- Salehi, M.; Filimonau, V.; Ghaderi, Z.; Hamzehzadeh, J. Energy conservation in large-sized hotels: Insights from a developing country. Int. J. Hosp. Manag. 2021, 99, 103061. [Google Scholar] [CrossRef]
- Luthra, S.; Govindan, K.; Kannan, D.; Mangla, S.K.; Garg, C.P. An integrated framework for sustainable supplier selection and evaluation in supply chains. J. Clean. Prod. 2017, 140, 1686–1698. [Google Scholar] [CrossRef]
- Kafa, N.; Hani, Y.; El Mhamedi, A. Sustainability performance measurement for green supply chain management. IFAC Proc. Vol. 2013, 46, 71–78. [Google Scholar] [CrossRef]
- Hojnik, J.; Ruzzier, M. The driving forces of process eco-innovation and its impact on performance: Insights from slovenia. J. Clean. Prod. 2016, 133, 812–825. [Google Scholar] [CrossRef]
- Wang, Z.R.; Wu, Q.H. Carbon emission reduction and product collection decisions in the closed-loop supply chain with cap-and-trade regulation. Int. J. Prod. Res. 2021, 59, 4359–4383. [Google Scholar] [CrossRef]
- Zhu, Q.; Dou, Y. A game model for green supply chain management based on government subsidies. J. Manag. Sci. 2011, 14, 86–95. [Google Scholar]
- Yi, Y.; Wang, Y.; Fu, C.; Li, Y. Taxes or subsidies to promote investment in green technologies for a supply chain considering consumer preferences for green products. Comput. Ind. Eng. 2022, 171, 108371. [Google Scholar] [CrossRef]
- Sun, H.; Wan, Y.; Zhang, L.; Zhou, Z. Evolutionary game of the green investment in a two-echelon supply chain under a government subsidy mechanism. J. Clean. Prod. 2019, 235, 1315–1326. [Google Scholar] [CrossRef]
- Su, C.; Liu, X.; Du, W. Green supply chain decisions considering consumers’ low-carbon awareness under different government subsidies. Sustainability 2020, 12, 2281. [Google Scholar] [CrossRef]
- Xu, Y.; Tian, Y.; Pang, C.; Tang, H. Manufacturer vs. Retailer: A comparative analysis of different government subsidy strategies in a dual-channel supply chain considering green quality and channel preferences. Mathematics 2024, 12, 1433. [Google Scholar] [CrossRef]
- Liu, J.; Nie, J.J.; Zhang, W.J.; Li, L.Y.; Yuan, H.P. Product development strategies of electric vehicle manufacturers: Considering government subsidy and consumers’ environmental preferences. Technol. Forecast. Soc. Change 2024, 201, 123222. [Google Scholar] [CrossRef]
- Xu, S.; Tang, H.; Huang, Y. Inventory competition and quality improvement decisions in dual-channel supply chains with data-driven marketing. Comput. Ind. Eng. 2023, 183, 109452. [Google Scholar] [CrossRef]
- Zhang, J.; Chan, F.T.; Xu, X. Data-driven analysis on optimal purchasing decisions in combined procurement. Int. J. Prod. Res. 2023, 61, 4265–4278. [Google Scholar] [CrossRef]
- Choi, T.M.; Wallace, S.W.; Wang, Y. Big data analytics in operations management. Prod. Oper. Manag. 2018, 27, 1868–1883. [Google Scholar] [CrossRef]
- Kakatkar, C.; Spann, M. Marketing analytics using anonymized and fragmented tracking data. Int. J. Res. Mark. 2019, 36, 117–136. [Google Scholar] [CrossRef]
- Çalı, S.; Balaman, Ş.Y. Improved decisions for marketing, supply and purchasing: Mining big data through an integration of sentiment analysis and intuitionistic fuzzy multi criteria assessment. Comput. Ind. Eng. 2019, 129, 315–332. [Google Scholar] [CrossRef]
- Liu, W.; Yan, X.; Li, X.; Wei, W. The impacts of market size and data-driven marketing on the sales mode selection in an internet platform based supply chain. Transp. Res. Part. E Logist. Transp. Rev. 2020, 136, 101914. [Google Scholar] [CrossRef]
- Ćurko, K.; Merkaš, Z.; Silović, T. Challenges of application of the big data in marketing: Case study Croatia. WSEAS Trans. Bus. Econ. 2018, 15, 162–170. [Google Scholar]
- Xing, P.; Jiang, G.Y.; Zhao, X.R.; Wang, M.X. Quality effort strategies of video service supply chain considering fans preference and data-driven marketing under derived demand. Electron. Commer. Res. Appl. 2023, 62, 101338. [Google Scholar] [CrossRef]
- McAfee, A.; Brynjolfsson, E.; Davenport, T.H.; Patil, D.; Barton, D. Big data: The management revolution. Harv. Bus. Rev. 2012, 90, 60–68. [Google Scholar]
- Meng, Q.C.; Wang, Y.T.; Zhang, Z.; He, Y.Y. Supply chain green innovation subsidy strategy considering consumer heterogeneity. J. Clean. Prod. 2021, 281, 125199. [Google Scholar] [CrossRef]
- Guo, L.B.; Zhang, Q.Q.; Wu, J.; Gonzalez, E. An evolutionary game model of manufacturers and consumers’ behavior strategies for green technology and government subsidy in supply chain platform. Comput. Ind. Eng. 2024, 189, 109918. [Google Scholar] [CrossRef]
- Huang, D.; Zhang, J. The impacts of carbon tax on emissions abatement level in a supply chain under different power structures. Chin. J. Manag. Sci 2021, 29, 57–70. [Google Scholar]
- Zhong, Y.; Lai, I.K.W.; Guo, F.; Tang, H. Research on government subsidy strategies for the development of agricultural products e-commerce. Agriculture 2021, 11, 1152. [Google Scholar] [CrossRef]
Disclaimer/Publisher’s Note: The statements, opinions and data contained in all publications are solely those of the individual author(s) and contributor(s) and not of MDPI and/or the editor(s). MDPI and/or the editor(s) disclaim responsibility for any injury to people or property resulting from any ideas, methods, instructions or products referred to in the content. |
© 2025 by the authors. Licensee MDPI, Basel, Switzerland. This article is an open access article distributed under the terms and conditions of the Creative Commons Attribution (CC BY) license (https://creativecommons.org/licenses/by/4.0/).