1. Introduction
Direction-of-arrival (DOA) estimation is fundamental in array signal processing with applications in radar, wireless communications, sonar, and radio astronomy [
1,
2,
3,
4]. Array structure critically influences DOA estimation performance, directly impacting degrees of freedom (DOF), resolution, hardware cost, and algorithmic complexity [
5]. Traditional uniform linear arrays (ULA) require numerous physical sensors for high resolution, with estimated sources limited by array elements, imposing substantial costs and computational complexity.
Sparse arrays significantly enhance DOF and resolution through non-uniform element distribution with the same number of physical sensors. Earlier proposed sparse arrays include Minimum Redundancy Arrays (MRA) [
6,
7] and Minimum Hole Arrays (MHA) [
8], which lack closed-form expressions for sensor positions, limiting their practical engineering applications. To address this, nested arrays [
9,
10] and coprime arrays [
11,
12] with closed-form expressions were subsequently introduced. Among various sparse array designs, coprime arrays stand out due to their unique structural design and performance advantages.
However, traditional coprime arrays face two significant challenges in practical applications. First, the holes (missing elements) in their difference coarrays limit the effective DOF and potentially reduce estimation accuracy [
5]. Second, mutual coupling effects between closely spaced sensors can severely degrade DOA estimation performance [
13,
14]. To address these fundamental limitations, the research community has developed various modified coprime array architectures. In what follows, we review the major advancement directions in coprime array design, which can be organized into four complementary research streams.
Strategic subarray modification: Pal and Vaidyanathan [
12] developed the Augmented Coprime Array (ACA) by doubling one subarray’s sensors, expanding the continuous difference coarray segment from N + M − 1 to MN + M − 1. Qin et al. [
15] introduced Coprime Arrays With Displaced Subarrays (CADIS), achieving MN + 2M + N−1 continuous lags with only M + N − 1 physical sensors through calculated subarray displacement.
Sensor position optimization: Ahsan et al. [
16] proposed Thinning Coprime Arrays (TCA), which produce 2M(N + 1) − 1 consecutive lags using only M + N + [M/2] − 1 physical sensors. Importantly, the structure’s sparser configuration substantially reduces the number of sensor pairs with small separation, significantly improving its robustness against mutual coupling effects. Zheng et al. [
17] developed Relocating Extended Coprime Arrays (RECA). This approach achieves 4MN + 4M − 2N[M/2] − 1 consecutive lags with 2M + N − 1 physical sensors.
Advanced displacement methodologies: Alamoudi et al. [
18] introduced Shifted Coprime Arrays (SCA) utilizing displacement Ls = [N/2]M to maximize continuous virtual aperture. Shaalan and Yu [
19] further refined displacement strategies with their Optimized Coprime Array (OpCA) configuration. Unlike previous techniques using fixed displacement values, OpCA adaptively selects the optimal displacement Ls based on the particular coprime pair, ensuring maximum virtual array continuity. The structure maintains the same physical sensor count as ACA (N + 2M − 1) while substantially extending the continuous difference coarray segment from MN + M − 1 to MN + M − 1 + Ls + M. This enhancement effectively incorporates the displacement value itself into the DOF equation.
Difference-sum coarray techniques: Recent research has expanded beyond difference coarrays to incorporate difference-sum coarrays. Wang et al. [
20] introduced Prototype Coprime Arrays (PCA) achieving 2MN + 2M + 2N − 1 continuous DOF by leveraging both difference and sum operations. Ye et al. [
21] introduced Novel Shifted Coprime Arrays (NSCA), achieving remarkable DOF enhancement: for odd configurations, 3MN + 2M + 2N − 1 consecutive DOF, and for even configurations, 3MN + 2M + 2N + (M − 1) consecutive DOF, while demonstrating superior mutual coupling resistance through optimized sensor displacement strategy. Ye et al. [
22] presented Interpolated Coprime Arrays (ICA), replacing conventional subarrays with sparse sub-uniform linear arrays. This configuration generates at least 2MN + 1 continuous DOF with only M + N physical sensors for difference coarrays, and 4MN − 1 continuous DOF for difference-sum coarrays, while maintaining favorable mutual coupling characteristics.
The aforementioned studies have made significant strides in addressing either DOF limitations or mutual coupling challenges through various structural modifications and displacement strategies. However, opportunities remain for exploring alternative mathematical frameworks that can simultaneously optimize both aspects. Motivated by the unique equidistribution and aperiodic properties of the golden ratio, this paper proposes a novel approach that integrates mathematical principles into the geometric design of coprime arrays.
This paper proposes the Golden ratio Inspired Coprime Array (GICA). GICA consists of three strategically designed subarrays with positions determined by golden ratio (
) principles, creating optimal spacing patterns that naturally minimize mutual coupling while preserving critical spatial information. We employ Toeplitz matrix reconstruction [
23] and TLS-ESPRIT [
24] for all array configurations to ensure fair comparative evaluation. The main contributions of this paper are summarized as follows:
1. A unique three-subarray configuration based on golden ratio, where the design incorporates a uniform baseline subarray, a golden ratio progression subarray for optimized distribution, and a strategic compensation subarray targeting critical positions for enhanced virtual coverage.
2. A balanced “physical domain optimization + virtual domain processing” methodology that achieves superior mutual coupling resistance through strategic sensor placement while maintaining effective DOA estimation capability through enhanced virtual array synthesis.
3. Comprehensive analysis and validation demonstrating simultaneous enhancement of DOA accuracy and mutual coupling robustness across varying conditions.
The remainder of this paper is organized as follows:
Section 2 introduces the preliminaries, including the signal model and mutual coupling model.
Section 3 presents the proposed GICA structure, detailing its design principles, virtual array characteristics, and degrees of freedom analysis.
Section 4 evaluates GICA’s performance through comprehensive simulations, examining DOA estimation accuracy and mutual coupling resistance.
Section 5 concludes the paper with a summary of key findings.
3. Proposed Special Coprime Array Structure
3.1. Array Structure and Design Principles
The golden ratio represents an irrational number characterized by unique mathematical properties, satisfying the fundamental relation . This constant exhibits superior equidistribution properties and minimal periodicity, thereby offering a distinctive mathematical framework for array design applications.
The suitability of golden ratio-based spacing stems from its exceptional low-discrepancy properties [
25]. While Weyl’s equidistribution [
26] theorem formally applies to linear sequences such as
, the exponential form
employed in
inherits analogous distribution characteristics [
25,
26] that ensure optimal spatial coverage without periodic clustering. As a quadratic irrational,
ensures that sequences based on
exhibit strong aperiodicity [
25], minimizing redundant spatial samples in the difference coarray while avoiding regular patterns that generate grating lobes in array processing. The exponential growth
generates spacings following Fibonacci-like ratios [
27], creating a hierarchical structure that naturally distributes sensors across multiple spatial scales. These mathematical properties yield direct performance benefits. The quasi-random positioning reduces closely spaced sensor pairs (primary contributors to mutual coupling) while maintaining sufficient sampling density for DOA resolution. Unlike random arrays lacking structure or uniform arrays suffering periodic ambiguities, golden ratio-based placement balances spatial diversity with structural predictability, enabling both analytical tractability and superior performance. While practical implementation requires rounding to integer sensor positions, the underlying
-based design principle ensures that the resulting discrete array preserves the favorable spatial distribution characteristics inherent to golden ratio sequences.
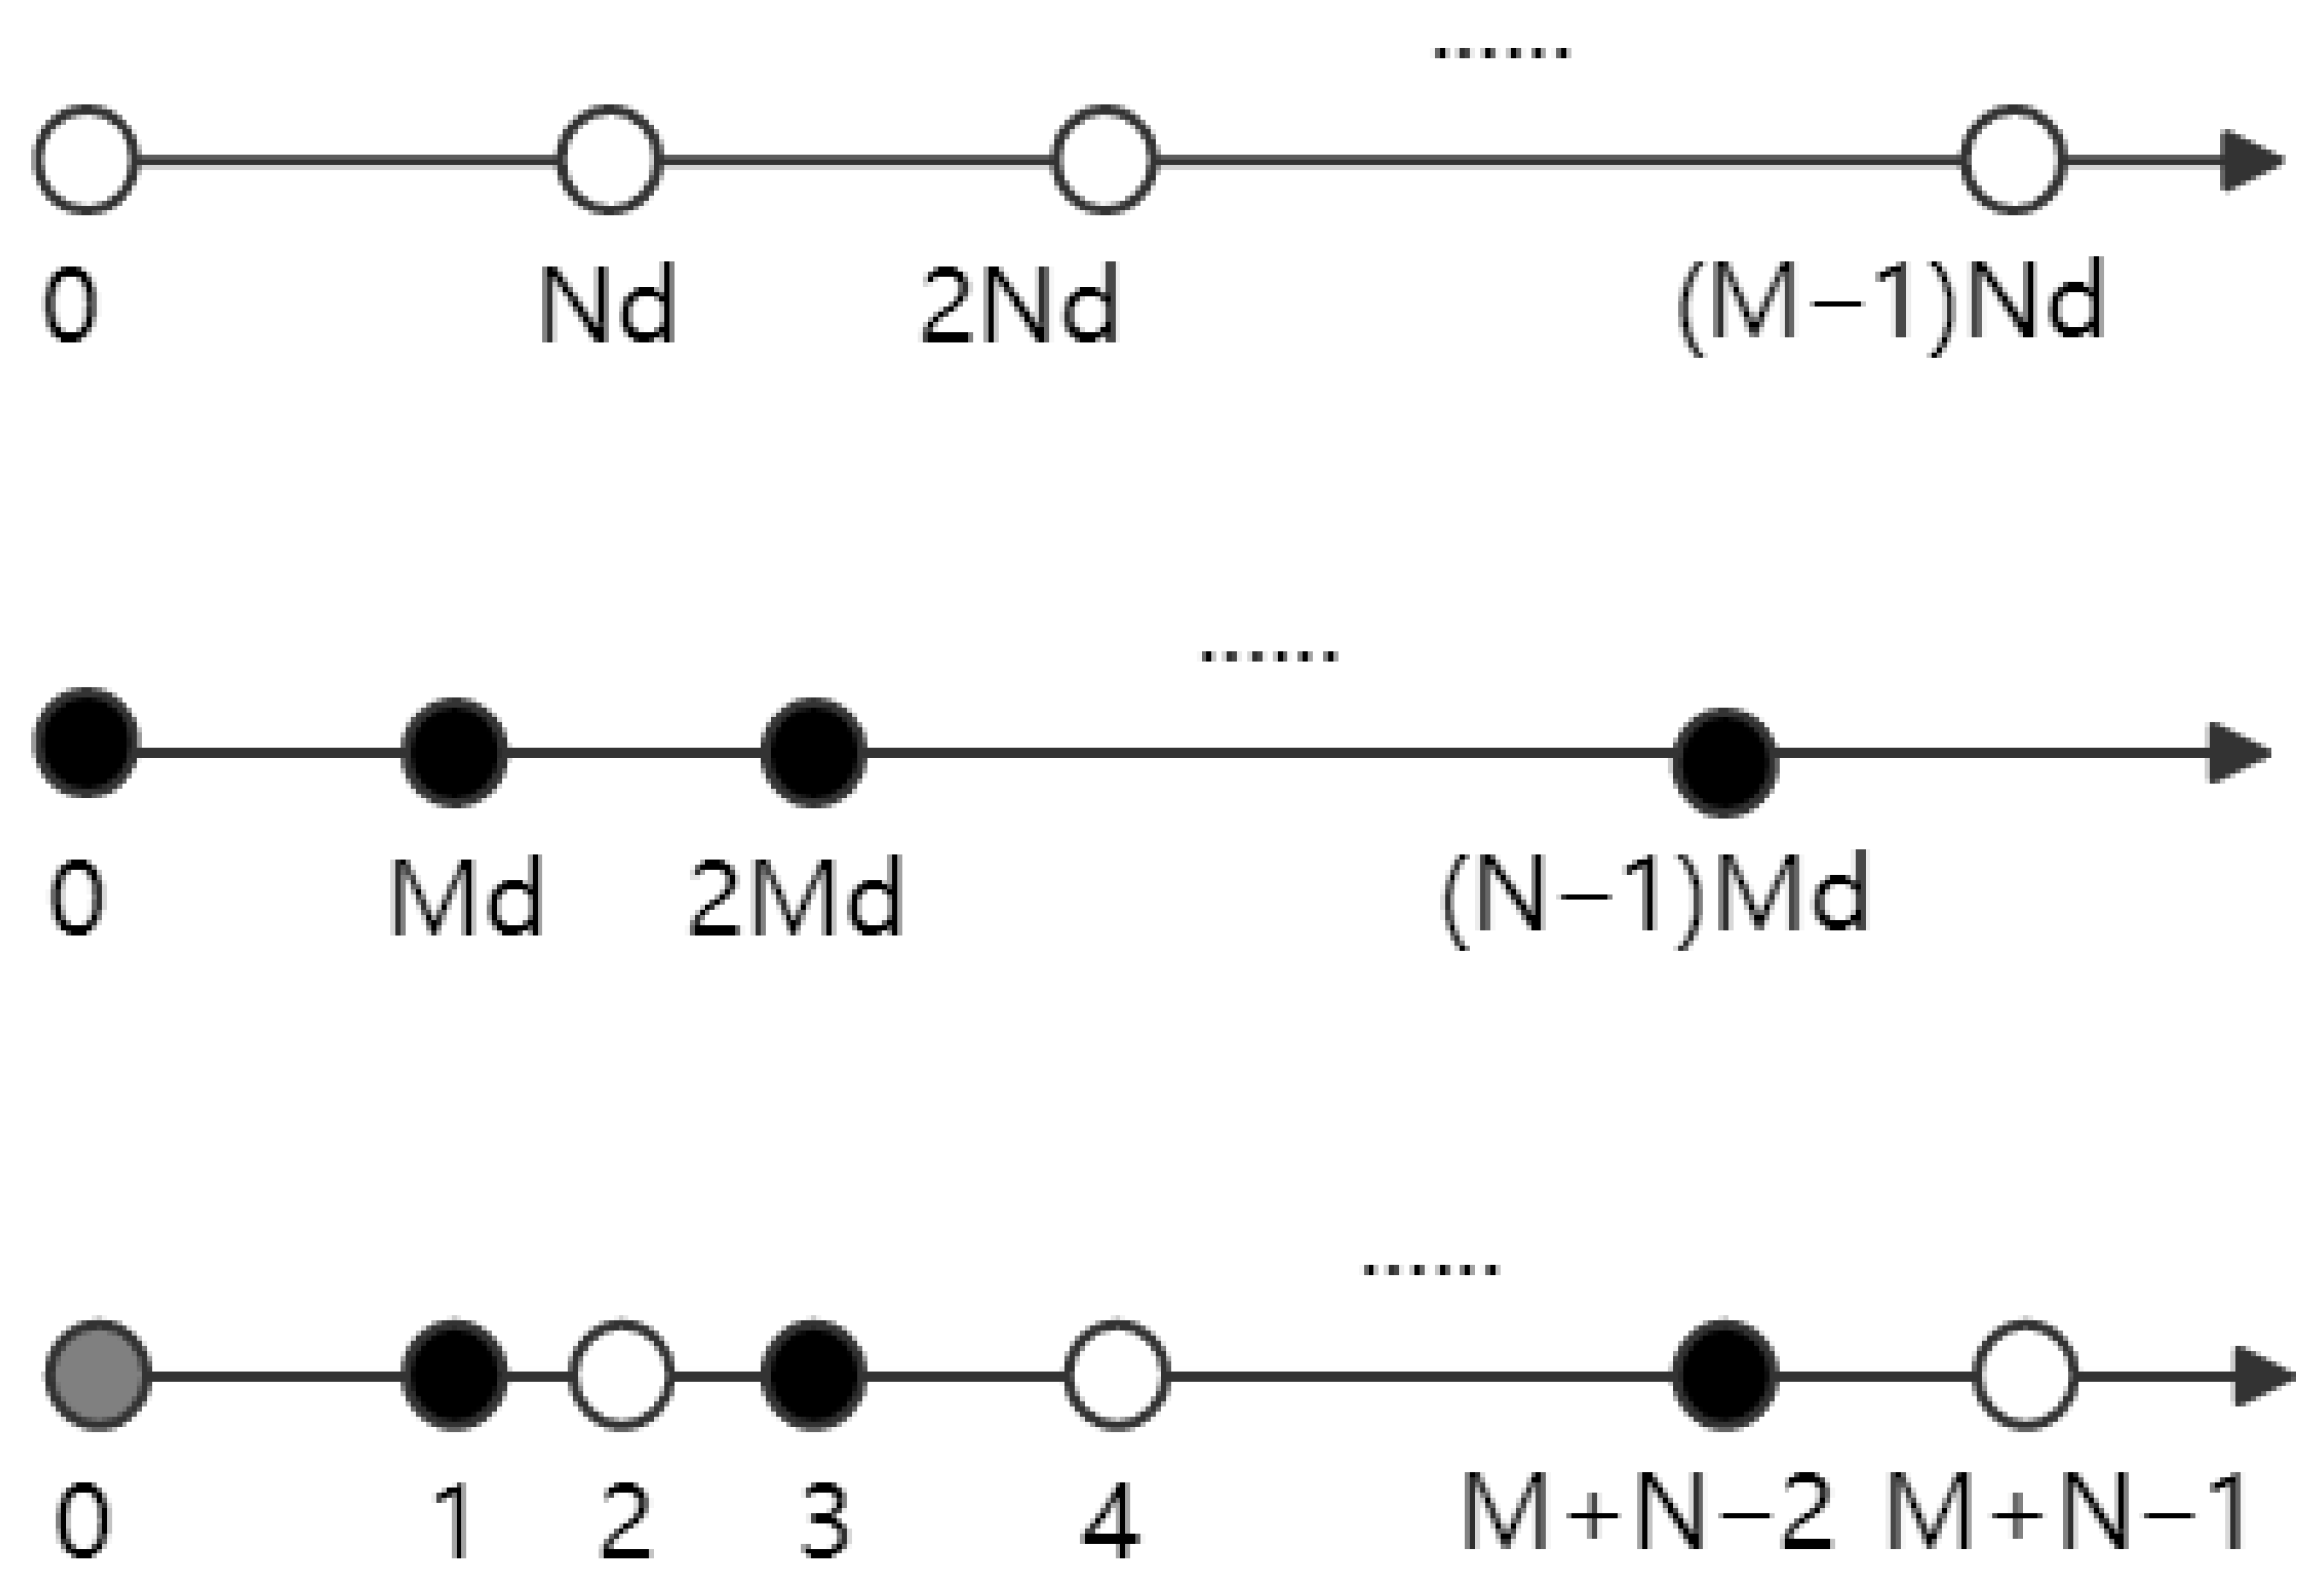
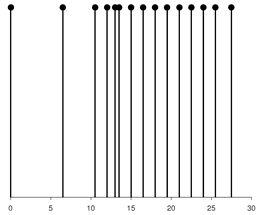
To construct a high-performance array structure with optimized mutual coupling characteristics, this paper proposes GICA based on golden ratio mathematical properties. The structure employs a three-layer hierarchical design that enhances performance and suppresses mutual coupling in traditional coprime arrays through golden ratio parameter incorporation. GICA’s physical element distribution consists of three functionally complementary subarrays, each undertaking specific optimization functions to synergistically maximize overall performance. The GICA physical array structure is shown in
Figure 2, with mathematical formulation defined as
where
is the golden ratio,
M and
N are coprime positive integers. GICA employs a three-layer hierarchical architecture, with each layer undertaking distinct functional roles and synergistic optimization:
Foundation Layer (): Linear distribution with uniform spacing N, providing the stable core structure of traditional coprime arrays for direction estimation.
Optimization Layer (): Utilizes golden ratio recurrence for non-uniform distribution. The term provides quasi-randomness avoiding periodic repetition, while linear term i ensures monotonic increase maintaining density gradients, achieving optimized spatial sampling.
Filling Layer (): Strategically selects three critical positions , , and based on difference coarray theory for hole compensation, optimizing virtual array continuity.
3.2. Virtual Array Characteristic Analysis
For the proposed GICA structure
, the difference coarray is constructed by computing pairwise differences between physical elements. The virtual covariance matrix reconstruction employs the Toeplitz matrix approach [
23]. Given GICA’s position set
and following (
6), the difference coarray is constructed through
To obtain discretized lag representation, we introduce the quantization operator:
where
d denotes the unit element spacing. Applying this operator yields the normalized lag matrix:
Extracting unique lag values forms the difference lag set:
GICA’s three-layer architecture produces a uniquely structured difference coarray. The contribution from each layer exhibits distinct characteristics:
Layer Contribution: The uniform subarray
with positions
generates a foundational lag structure:
This creates a periodic sampling pattern with spacing
N, forming the backbone of the difference coarray.
Layer Contribution: The golden ratio-based positions
introduce a revolutionary non-uniform sampling:
The exponential growth rate ensures that generates increasingly sparse lags at larger distances, balancing local density with global coverage.
Layer Contribution: The strategic positions
serve as compensators:
These chosen values fill some of the critical gaps in the combined - lag distribution.
For the processing of differential arrays, GICA adopts a virtual domain completion strategy to expand the sparse differential lag set to the continuous domain. Define the virtual domain boundaries:
Construct the complete virtual lag domain:
This construction process can be formalized as an embedding map:
Having determined the virtual domain extent
, the next step establishes mapping from physical covariance measurements to virtual array responses. Following (
5), GICA’s covariance matrix is
For each virtual lag
, define its pre-image set in the physical array:
The virtual array response is constructed through the following piecewise function:
When
, redundancy is exploited by averaging contributing elements; when
, zero assignment maintains covariance matrix positive semi-definiteness. The virtual array response preserves original signal second-order statistics. For
K uncorrelated far-field sources with powers
and angles
, the expected virtual response is
where
denotes noise power and
represents the Kronecker delta. This demonstrates the virtual array response is statistically equivalent to a uniform linear array with
elements.
Equation (
25) completes virtual response construction. The next step constructs these discrete values
into a structured covariance matrix.
First, locate the zero-lag position:
Starting from the zero-lag position, extract all non-negative lag responses:
The virtual covariance matrix is constructed via the Toeplitz operation [
23]:
This completes GICA’s virtual array construction and the resulting matrix can be directly used for subspace-based DOA estimation.
3.3. Degrees of Freedom Analysis
Building upon
Section 3.2’s virtual array construction, GICA’s DOF are determined by the difference coarray’s continuous range. The virtual lag set
constructed through hole-filling directly translates to available DOF for DOA estimation. GICA’s single-sided DOF can be derived from the virtual array construction process in
Section 3.2.
For GICA structure, the maximum difference lag is determined by the H2 layer’s furthest element:
Therefore, the single-sided DOF of GICA is
To quantitatively demonstrate GICA’s performance advantages and verify its innovative value,
Table 1 systematically compares physical elements and single-sided DOF of various coprime array configurations. This comparison illustrates how different array design strategies impact DOF performance and how GICA’s unique exponential growth characteristic yields significant advantages for large N values.
4. Simulation Results
4.1. Methodology and Simulation Setup
To evaluate the proposed GICA performance, we employ root mean square error (RMSE) as the primary metric. RMSE is a widely used statistical measure for assessing predictive model accuracy, particularly suitable for regression and estimation tasks. It quantifies deviation between estimated and true values, providing comprehensive algorithm performance evaluation. The RMSE for DOA estimation is defined as
where
L represents the number of Monte Carlo simulation trials, ensuring statistical reliability,
K denotes the number of signal sources,
is the DOA estimate of the
ith source in the
jth trial, and
is the true direction angle of the
ith source.
All simulations use a unit element spacing of
(half-wavelength spacing), which is the standard practice in sparse array design to avoid spatial aliasing while maximizing aperture. To evaluate the performance of different array structures, this study compares GICA, ICA, SCA, and OpCA. All DOA estimations use the ESPRIT algorithm after Toeplitz matrix reconstruction, with physical array elements fixed at 15 for fair comparison. Each estimation is based on 500 independent Monte Carlo trials for statistical reliability. The Cramér–Rao Bound (CRB) [
28] is also introduced as a theoretical reference curve to assess the estimation efficiency. Performance evaluation is conducted under two signal source scenarios: three sources (angles at [11.5°, 22.8°, 30°]) and five sources (angles at [10°, 20°, 30°, 40°, 50°]).
For mutual coupling analysis, coupling leakage
serves as the primary evaluation metric [
13,
21] and is calculated as
where C is the mutual coupling matrix, and
denotes the Frobenius norm. This indicator effectively reflects the relative intensity of non-diagonal coupling elements to the overall coupling matrix in the array, with smaller values indicating weaker mutual coupling effects.
The following experiments are designed to comprehensively evaluate GICA’s performance:
Experiment 1—SNR Variation: With a fixed snapshot count of 256, DOA estimation RMSE curves are plotted as a function of SNR. SNR varies from dB to 20 dB with 5 dB steps to examine performance under different noise conditions.
Experiment 2—Snapshot Variation: With SNR maintained at 20 dB and utilizing the same array configuration as the previous experiment, RMSE performance is systematically examined as a function of varying snapshot numbers. Snapshot count increases from 8 to 298 with 36 steps to assess how estimation accuracy is affected by the quantity of available measurement samples.
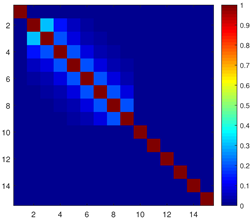
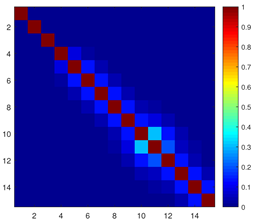
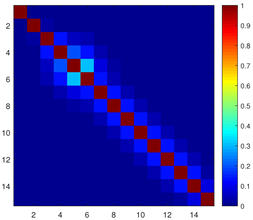
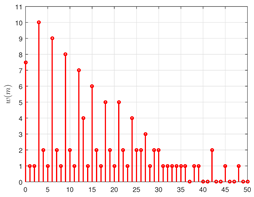
Experiment 3—Mutual Coupling Analysis: This experiment comprehensively evaluates the mutual coupling resistance performance of different array structures by calculating the coupling leakage indicator , analyzing mutual coupling matrix heatmaps, and examining weight function distributions. To ensure fair comparison, the number of physical array elements is consistently maintained at 15 for all array structures. The primary coupling coefficient is characterized by , with a distance threshold of .
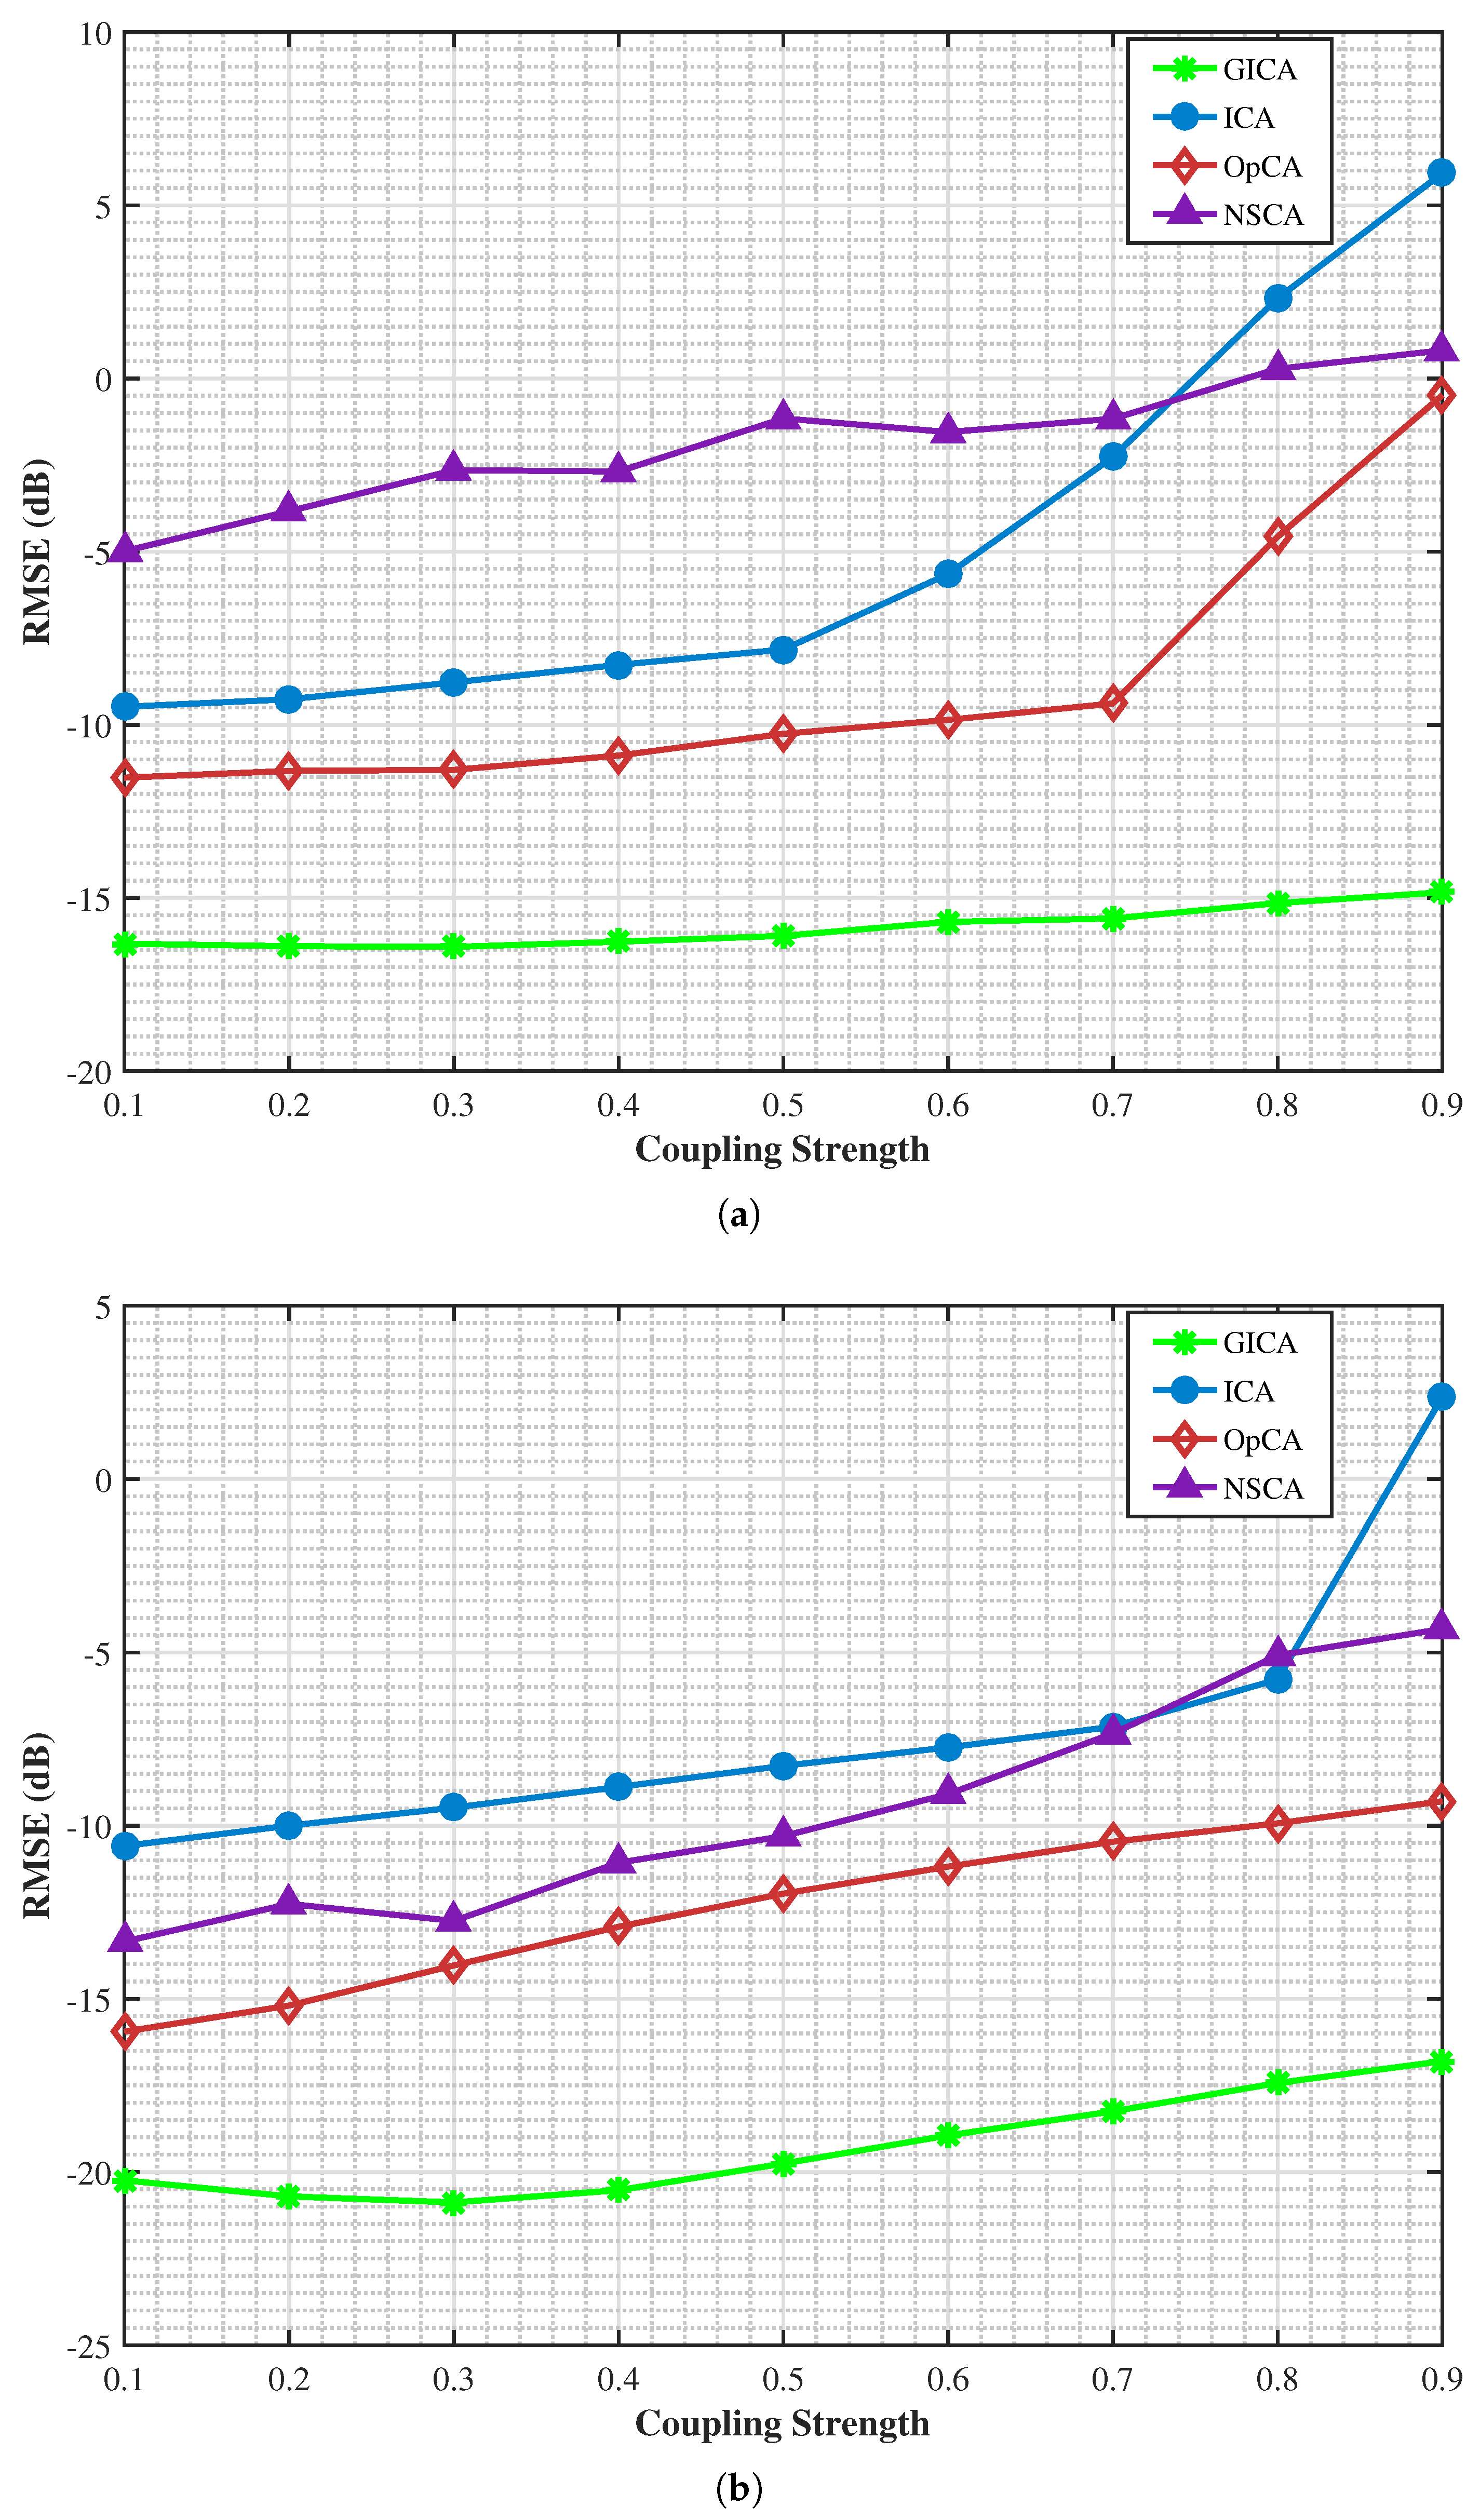
Experiment 4—Coupling Strength Variation: Three signal sources are configured with identical angles as Experiment 1’s three-source scenario. SNR is set to −5 dB and 10 dB with 256 snapshots. Mutual coupling effects are introduced with coupling strength varying from 0.1 to 0.9 across 500 Monte Carlo simulations. DOA estimation uses the same method as Experiment 1.
4.2. Results and Analysis
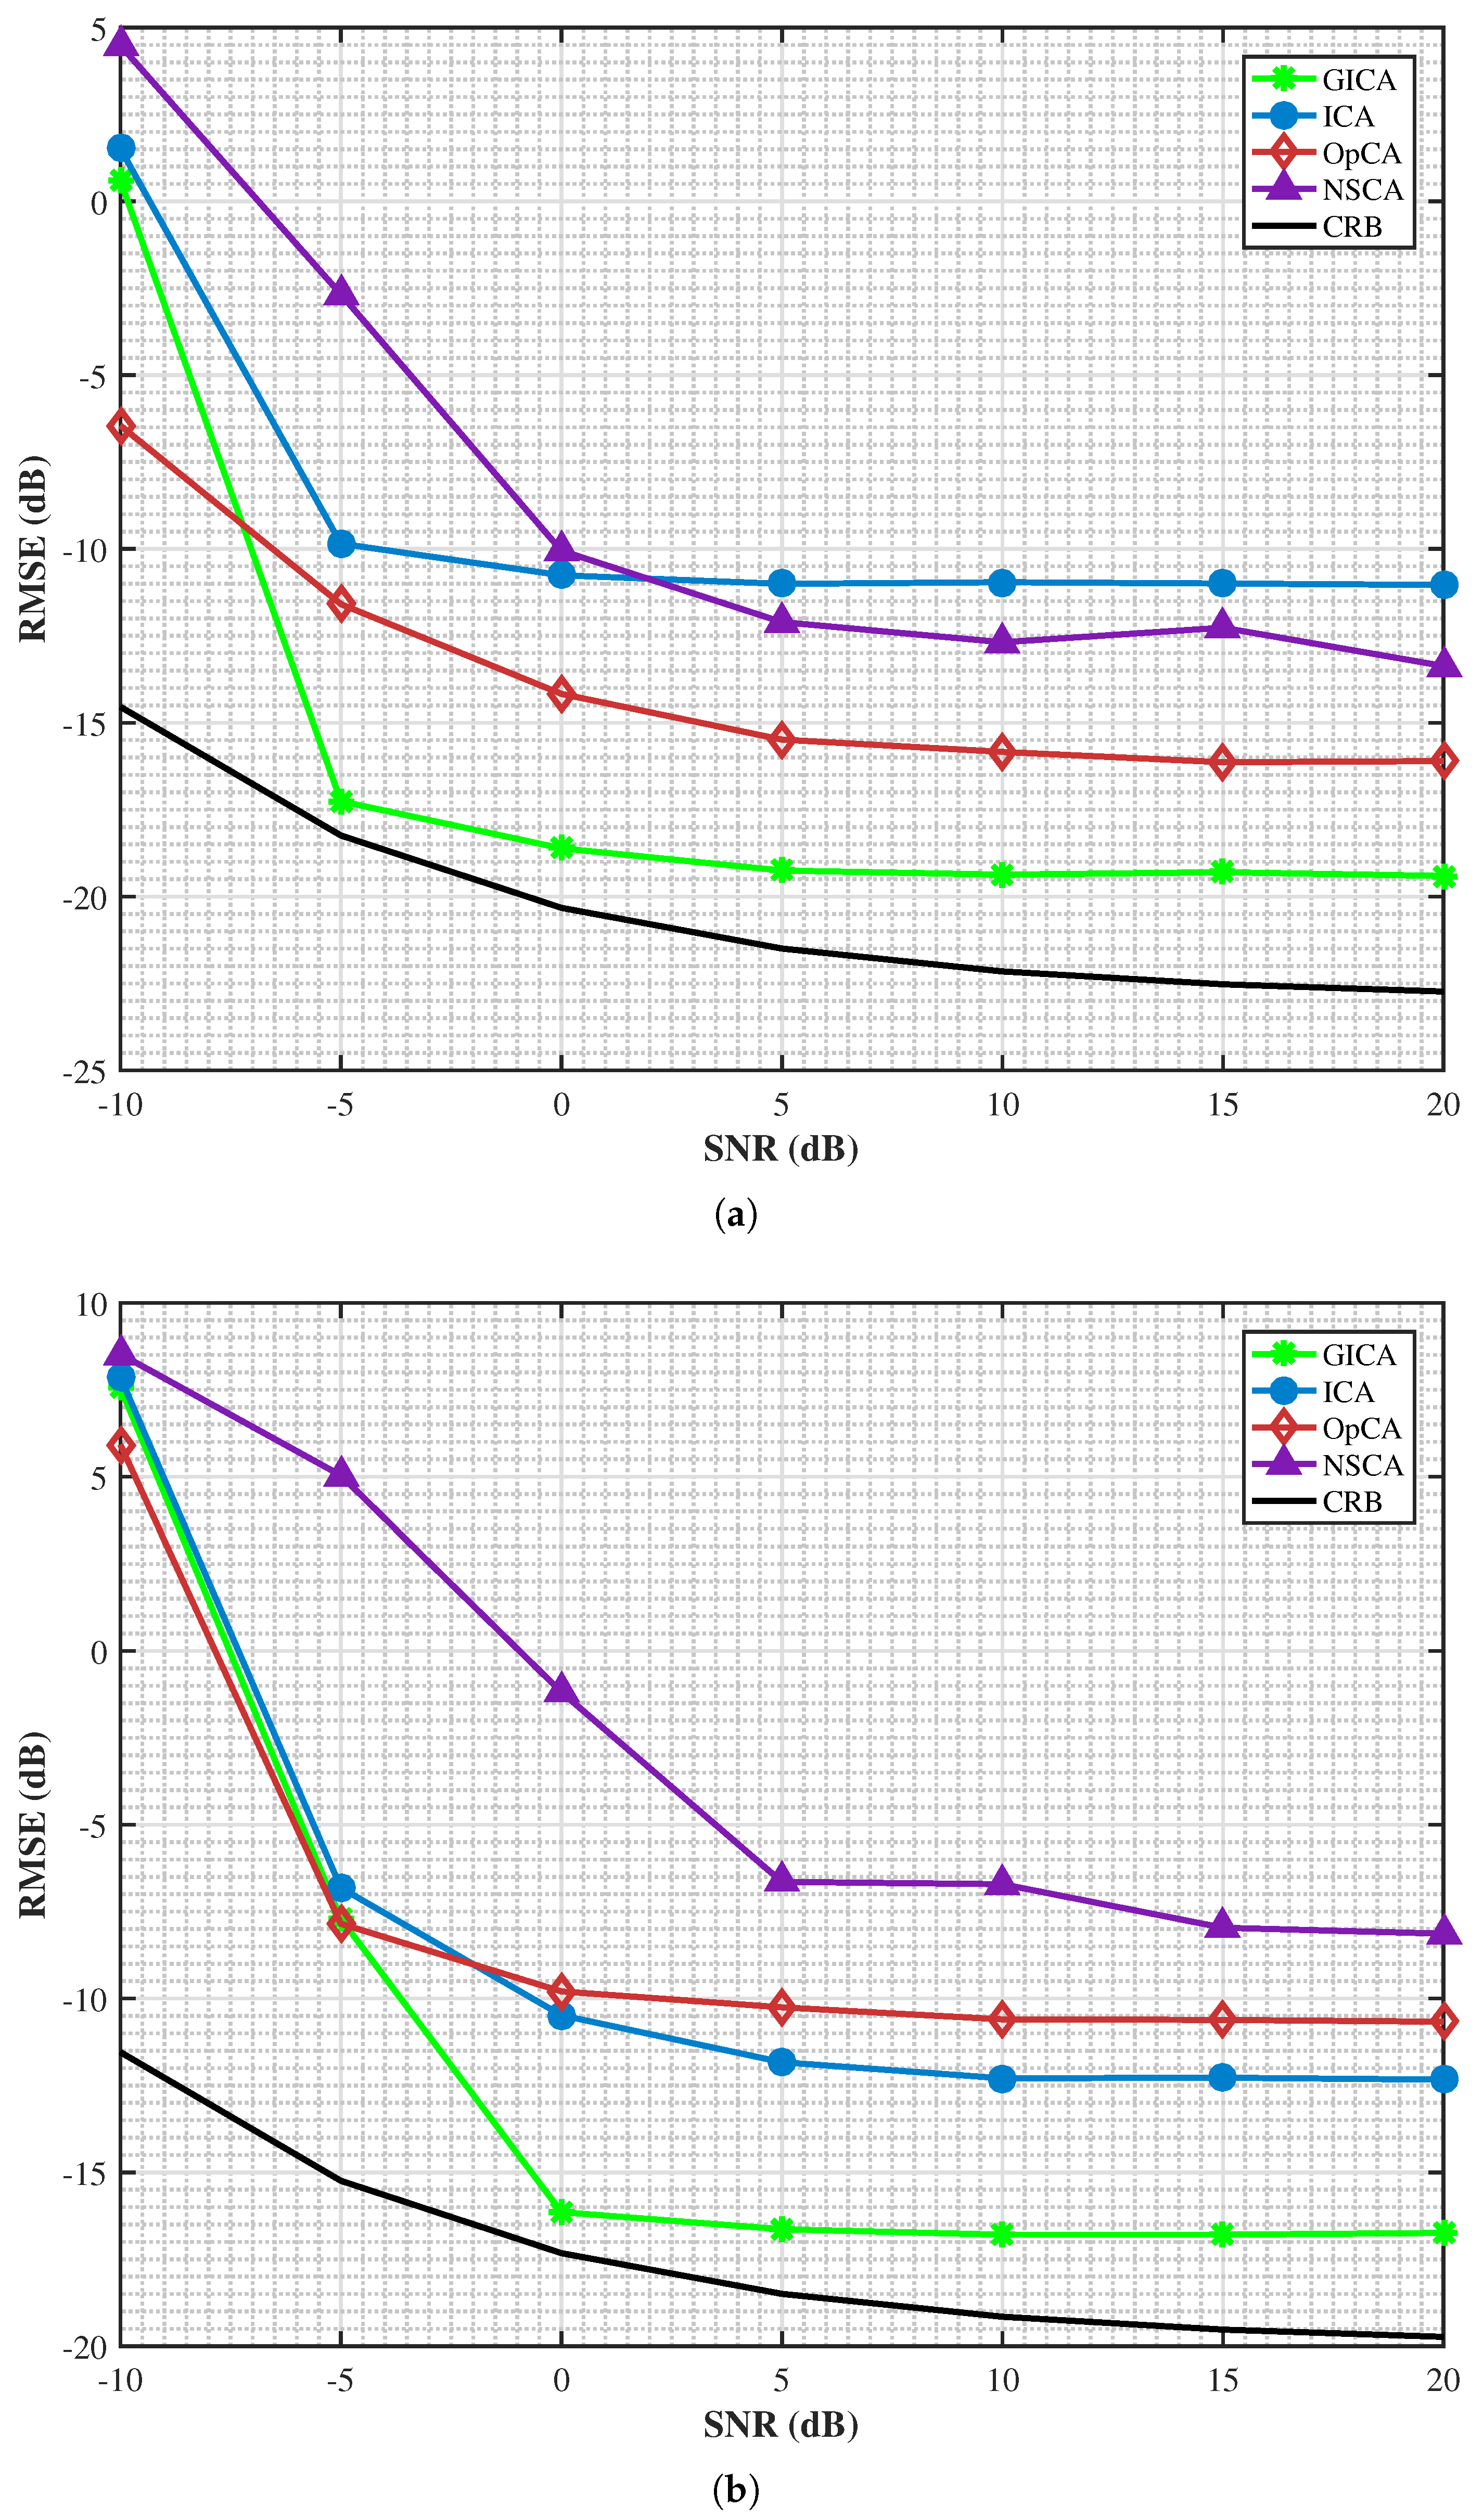
Figure 3 illustrates RMSE performance for both scenarios as a function of SNR. As shown in
Figure 3a,b, estimation performance of all array structures improves as SNR increases from
dB to 20 dB. The proposed GICA generally exhibits the best performance across the entire SNR range in both scenarios (though slightly inferior to OpCA in very few ranges), with particularly significant advantages in the higher SNR region (≥−5 dB), demonstrating substantially lower RMSE values compared to other structures.
Figure 4 illustrates the RMSE performance for both the 3-source and 5-source scenarios as a function of snapshot number. As shown in
Figure 4a,b, the estimation performance of all array structures improves as the snapshot number increases from 8 to 298. The proposed GICA structure generally exhibits the best performance across the entire snapshot range in both testing scenarios (though slightly inferior to OpCA and ICA in very few ranges), with particularly significant advantages in the higher snapshot region (≥100), demonstrating substantially lower RMSE values compared to other structures.
The preceding results of experiments (1–2) have validated GICA’s DOA estimation performance, which benefits from virtual domain optimization where the difference coarray construction through ’s exponential growth and ’s strategic positioning expands the effective aperture via Toeplitz reconstruction. The following experiments (3–4) examine GICA’s physical domain optimization, where golden ratio-based sensor placement in creates naturally dispersed spacings that reduce closely spaced element pairs, thereby suppressing electromagnetic mutual coupling. This physical arrangement directly influences the weight function and coupling leakage metric . These dual-domain mechanisms work synergistically: virtual processing enhances DOA estimation capability while physical design ensures robust hardware implementation with reduced coupling.
To systematically evaluate mutual coupling resistance performance across different array structures, this study compares GICA, ICA, OpCA, and NSCA using key metrics: weight function
, mutual coupling matrix
C, and coupling leakage
. The analysis examines how these structures mitigate mutual coupling effects, which are critical for accurate DOA estimation. The experimental results are presented in
Table 2.
As shown in
Table 2, GICA exhibits an
value of 0.1526, significantly lower than those of ICA (0.2261), OpCA (0.2054), and NSCA (0.2103). This demonstrates that GICA has the minimum coupling leakage value, indicating its superior mutual coupling resistance capability compared to the other three array structures.
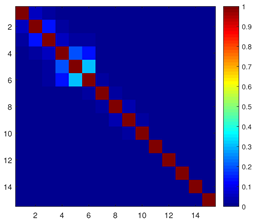
From the mutual coupling matrix heatmaps (C) in
Table 2, it can be observed that GICA’s coupling matrix displays deeper blue tones in the non-diagonal regions, indicating generally lower coupling intensity. In contrast, the coupling matrices of ICA, OpCA, and NSCA exhibit brighter cyan to yellow transition tones in multiple non-diagonal regions, revealing higher degrees of mutual coupling at these positions, which further confirms the comparative results of the
values.
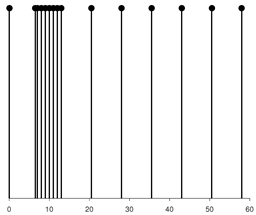
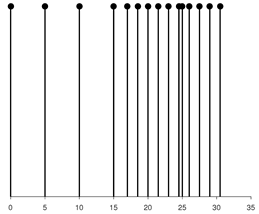
Examining the weight function distributions of the four array structures in
Table 2, GICA demonstrates relatively uniform spatial distribution, with first three weight values of (1, 1, 2) and maximum weight not exceeding 7.5. This balanced distribution effectively reduces spatial correlation concentration, suppressing mutual coupling effects. In comparison, ICA, OpCA, and NSCA exhibit significant non-uniformity with multiple high peaks (maximums of 8, 9, and 10, respectively), increasing spatial correlation and leading to stronger mutual coupling effects, consistent with
value trends.
Based on the above analysis, GICA demonstrates superior mutual coupling resistance across multiple dimensions, including weight function distribution, coupling matrix characteristics, and coupling leakage indicators. This feature holds significant importance in practical DOA estimation applications, where GICA’s mutual coupling resistance advantage translates into more robust and accurate direction angle estimation performance.
Figure 5a,b show RMSE trends with increasing coupling strength under SNR = −5 dB and SNR = 10 dB, respectively. Under both SNR conditions, all array structures show increasing RMSE as coupling strength rises from 0.1 to 0.9, indicating mutual coupling significantly degrades DOA estimation accuracy. However, GICA maintains the lowest RMSE values across the entire coupling strength range with the smallest performance degradation slope, demonstrating superior mutual coupling resistance. These results align with previous mutual coupling resistance analysis.
