1. Introduction
The concept of “new agricultural quality productivity” was formally introduced in China’s No. 1 central document of 2025, outlining a strategic direction for achieving agricultural modernization. This paradigm emphasizes technological innovation and the deep integration of advanced technologies with traditional agriculture, aiming to overcome the limitations of conventional practices. Despite this policy impetus, the agricultural sector in China continues to confront significant challenges, including resource and environmental constraints, low production efficiency, and a pattern of being “large but not strong, abundant but not optimal.” The transition towards this new form of productivity is thus considered imperative, leading to the implementation of various support policies at national and local levels designed to facilitate agricultural upgrading [
1,
2].
A pivotal challenge in this transition involves the alignment between the technology-intensive development model and the vast number of small-scale farmers, who are the ultimate executors of agricultural production. The adoption of new technologies and participation in new models by farmers is critical to the policy’s success. Consequently, any neglect or undermining of farmer interests may result in ineffective policy implementation, reduced efficiency, and potential social tensions [
3]. The central problem, therefore, revolves around effectively coordinating the objectives of government policy, the transformation of agricultural enterprises, and the individual interests of farmers within the framework of the new quality agricultural productivity policy.
Scholarly research on new quality agricultural productivity has evolved along three main trajectories. The first stream has focused on establishing its conceptual foundation, defining its core principles and characteristics as a new form of agricultural productivity centered on technology, talent, and green development [
4,
5]. Studies here have also outlined key development pathways, emphasizing technological innovation, factor optimization, and policy support [
6,
7,
8]. A second stream of research examines the empirical factors influencing policy effectiveness and technology diffusion. These studies confirm overall progress while highlighting persistent challenges, most notably significant regional disparities and a growing misalignment between existing production structures and the requirements of the new productivity model [
9,
10,
11,
12]. A third stream directly addresses the role of farmers, analyzing their decision-making behaviors and the constraints they face. This research identifies critical barriers to adoption at the household level, including issues of technology access, allocation efficiency, and risk management [
3,
12,
13,
14]. It establishes that farmers’ capacities, such as digital literacy, are crucial determinants for successful engagement with new agricultural models. Collectively, this body of work provides a multifaceted understanding. While this existing literature provides a valuable multi-faceted understanding, it predominantly examines the involved actors—government, enterprises, and farmers—in isolation or within simplified dyads. A critical nexus remains underexplored: the dynamic and strategic interdependence among all three parties within a unified analytical framework. The absence of such a framework limits the ability to model how their strategies co-evolve over time—for instance, how government subsidies influence enterprise innovation, which in turn affects farmer adoption costs and decisions, creating complex feedback loops.
This gap motivates the central research question of this study: how do the strategic interactions among the government, agricultural enterprises, and farmers evolve under the new quality agricultural productivity policy, and what are the key policy levers—such as subsidy allocation and infrastructure investment—that can steer the system towards a stable, optimal equilibrium?
To address this question, the present study makes two key contributions. Theoretically, it develops a tripartite evolutionary game model that captures the long-term strategic interactions and co-adaptation processes among the core stakeholders, thereby filling a conceptual gap in the literature. Practically, the model functions as a virtual policy laboratory; by simulating the effects of critical parameters, it provides evidence-based guidance for optimizing policy design and fostering synergistic collaboration among all parties to facilitate a sustainable agricultural transition.
2. Tripartite Evolutionary Game Model Construction
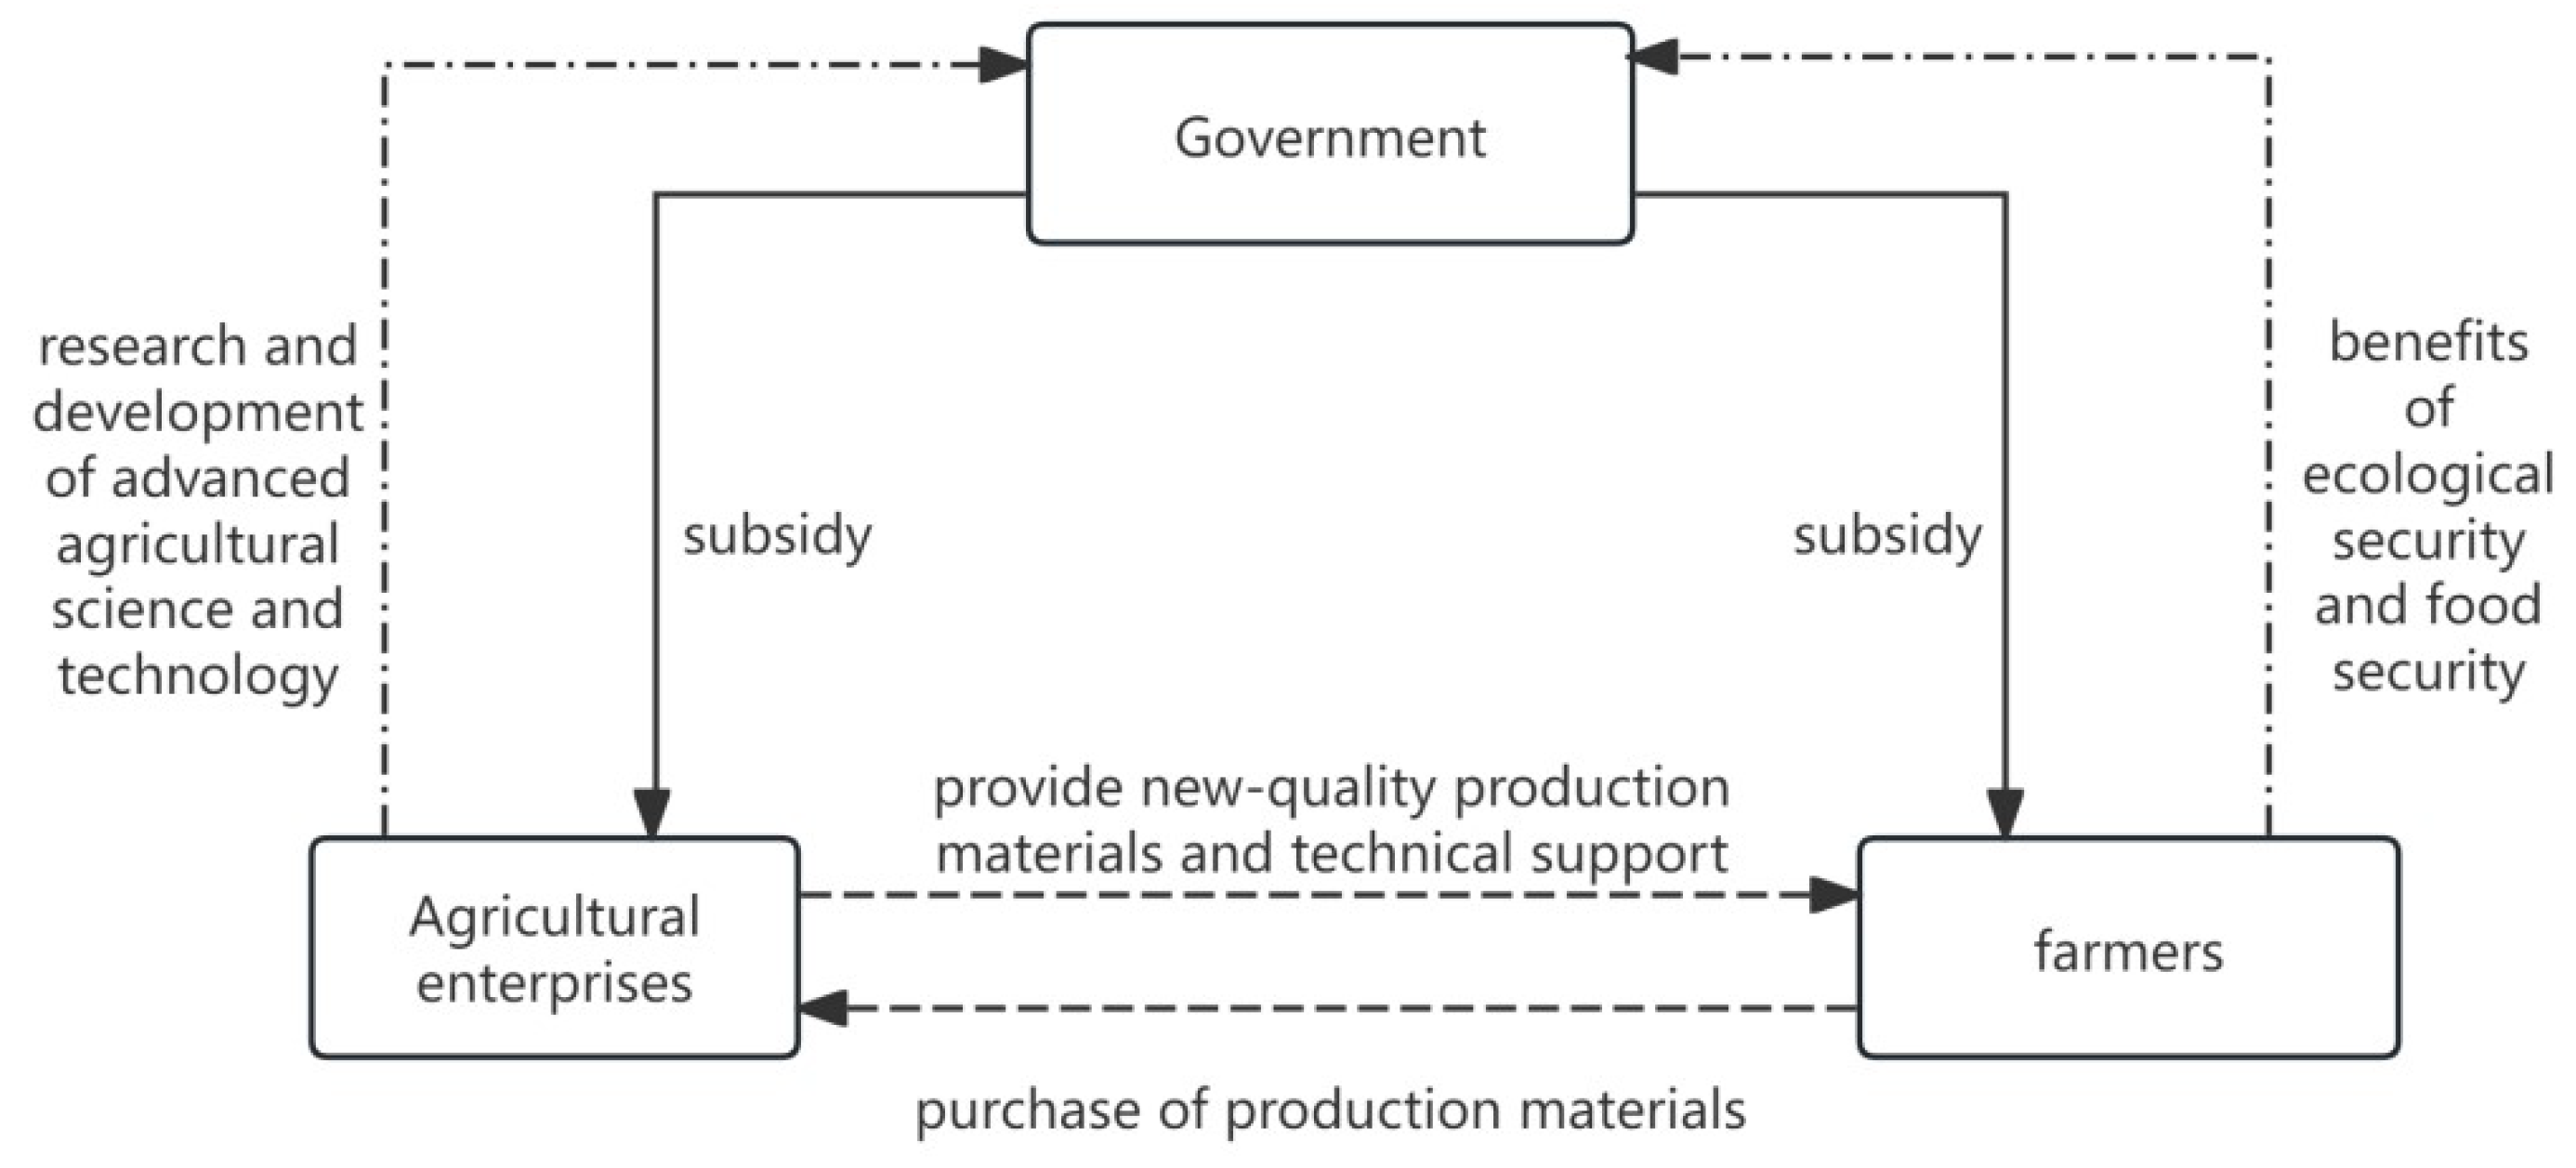
Based on the preceding analysis of the collaborative dynamics among the three parties in new agricultural production, the logical relationships between the main agents in the tripartite evolutionary game model constructed in this study are illustrated in
Figure 1.
2.1. Model Assumptions
To build the game model and analyze the stability of strategies and equilibrium points, as well as the relationships between various factors, the following assumptions are made:
Assumption 1. The three parties in the game are government, agricultural enterprises, and farmers, all of which are participants with bounded rationality. At the beginning of the evolution, three parties are in their initial stages. During the process, no other potential influencing factors are considered, and the strategies of the three parties evolve over time and ultimately converge to stable strategies.
Assumption 2. The government can choose between two strategies: “subsidy” and “no subsidy.” The probability of choosing the “subsidy” strategy is denoted by x, and the probability of choosing the “no subsidy” strategy is . When the government chooses the “subsidy” strategy, it will provide subsidies to agricultural enterprises for actively responding to the “new quality agricultural productivity” policy by transforming and researching agricultural scientific technologies and smart equipment. The subsidy coefficient for enterprises is denoted by α. It will also subsidize farmers who actively respond to the policy and use new technologies, tools, and other new quality production materials for agricultural cultivation. The subsidy coefficient for farmers is denoted by β. The total subsidy amount provided by the government to agricultural enterprises and farmers is S, with subsidies for enterprises and for farmers. The research achievements of agricultural enterprises bring objective benefits to the government, denoted by , and the active response of farmers brings objective benefits to the government, like food security guarantees and the political reputation of rural revitalization, denoted by . To promote the development of new quality agricultural productivity, the government needs to invest in the renovation of infrastructure such as water, electricity, transportation, and network communications in rural and agricultural areas, with a construction cost of . The direct benefit of this renovation to the government is denoted by . When the government chooses the “no subsidy” policy, no subsidies or infrastructure construction are provided. However, if agricultural enterprises and farmers actively respond to the policy, they still bring certain objective benefits to the government, with benefit coefficients λ and μ, resulting in benefits of and , respectively. Here, .
Assumption 3. Agricultural enterprises face a choice between “innovative transformation” and “negative transformation”. The probability of an enterprise choosing the “innovative transformation” strategy is denoted by y; consequently, the probability of choosing the “negative transformation” strategy is . When an enterprise adopts the “innovative transformation” strategy, it incurs a research and development cost and generates operational revenue . Additionally, this transformation, driven by technological innovation and upgrading, attracts non-operational benefits such as talent acquisition and investment attraction through technological innovation upgrades. These non-operational benefits are denoted by . However, the enterprise must also bear costs , encompassing expenses for providing instructional support to farmers on emerging agricultural equipment and facilities, and purchasing insurance coverage for both its products and the outputs of contracted farmers. Conversely, if the enterprise opts for the “negative transformation” strategy, it secures a revenue . Here, .
Assumption 4. Farmers may choose between “New-quality Production Materials” and “Traditional Production Materials”. The probability of selecting “New-quality Production Materials” is denoted by z, and the probability of selecting “Traditional Production Materials” is . When farmers adopt “New-quality Production Materials”, they obtain revenue , but incur an additional cost . This additional cost is reduced to . If agricultural enterprises implement the “innovative transformation” strategy by providing technical support and relevant guarantees. Furthermore, if the government chooses a “Subsidy” strategy to actively promote rural and agricultural construction/renovation, farmers gain an indirect benefit of . If farmers choose “Traditional Production Materials”, their revenue is recorded as . Here, .
Assumption 5. When agricultural enterprises opt to transform and produce new quality production materials, they tend to sell at a premium, with the premium amount being P. When the government chooses to provide subsidies, it will take measures such as imposing fines to deter enterprises from the premium selling behavior and levy a fine of F on them.
2.2. Construction of the Payoff Matrix
In this study, evolutionary game theory is employed to model the strategic interactions among the government, agricultural enterprises, and farmers. In contrast to classical game theory, which assumes fully rational decision-makers, evolutionary game theory is particularly suited to analyzing agents exhibiting bounded rationality—individuals who are unable to determine optimal strategies in a single step but instead gradually refine their behaviors through mechanisms such as trial and error, learning, and imitation [
15,
16]. The replicator dynamics equation, a central component of evolutionary game theory, characterizes the evolution of behavioral strategies within a population by positing that strategies generating payoffs above the population average are more likely to be adopted over time. Given that the decision-making processes of the three stakeholders in this study align with the features of bounded rationality and incremental adjustment, and considering the objective of examining long-term strategic evolution rather than static equilibrium outcomes, the replicator dynamics serve as an appropriate analytical framework.
Based on the assumptions above, the payoff matrix for the government, agricultural enterprises, and farmers is constructed, which is shown in
Table 1 and
Table 2, respectively.
2.3. Construction of Expected Payoff Functions
2.3.1. Government’s Expected Payoff
Assuming the expected return of the government when subsidizing is
, the expected return of the government when not subsidizing is
, and the average expected return is
, we have
2.3.2. Agricultural Enterprises’ Expected Payoff
Assuming that the expected return of agricultural enterprises during the transition to a new quality is
, the expected return when choosing to refuse the transition is
, and the average expected return is
, we have
2.3.3. Farmers’ Expected Payoff
Assuming that the expected income of farmers when choosing new quality production materials is
, the expected income when choosing traditional production materials is
, and the average expected income is
, we have
3. Model Analysis
3.1. Stability Analysis of Government Strategy
The government’s replicator dynamic equation is
and the first derivative of
x is
Let . According to the stability theorem of differential equations, the government’s strategy of choosing the subsidy will stabilize if and . Since , is a decreasing function with respect to z.
Therefore, if
,
, and
, then the government cannot determine a stabilization strategy. If
,
, at this time
, then the evolutionary stable strategy (ESS) for the government is
, and conversely, if
, the ESS is
. The government’s strategy evolution phase diagram is shown in
Figure 2.
In
Figure 2, the volume
of
represents the probability of the government’s stable choice of non-subsidy behavior, and the volume
of
represents the probability of stable choice of subsidy behavior.
These probability volumes are calculated by integrating over the strategy space. In the unit cube representing all possible initial strategy combinations , the stability analysis defines a critical surface that partitions the cube into regions where different strategies prevail. The volume of each region corresponds to the probability of converging to that particular stable strategy.
For the government’s strategy, the critical surface in the
y-
z plane is defined by
. The region where the government stabilizes at “no subsidy” (
) is bounded by this surface. The volume of this region is obtained through double integration:
where
represents the critical threshold that separates the two strategy basins.
After the calculation, we obtain
Proposition 1. The probability of the government choosing subsidies is positively correlated with the objective benefits of agricultural enterprises and farmers and the benefits of construction and transformation, and negatively correlated with the required construction costs.
Proof. According to (
1) and (2), we take the first-order partial derivatives of each element and obtain
,
,
, and
. Therefore, increasing
,
,
, or decreasing
can increase the government’s probability of choosing to subsidize. □
Proposition 1 indicates that higher objective benefits for agricultural enterprises and farmers, as well as greater benefits from construction and transformation, lead to increased enthusiasm among them. Consequently, policy implementation becomes easier, and the government becomes more proactive in selecting subsidies. Conversely, when the cost of infrastructure reconstruction and construction rises, policy implementation becomes more challenging, resulting in the government adopting a more passive stance towards subsidies.
3.2. Stability Analysis of Agricultural Enterprises’ Strategy
The replicator dynamic equation for agricultural enterprises is
and the first derivative of
y is
Let
. According to the stability theorem of differential equations, agricultural enterprises’ strategy of innovative transformation will stabilize if
and
. Since
,
is a decreasing function with respect to
x. Therefore, if
,
and
, then the government cannot determine a stabilization strategy. If
,
, and
, then the evolutionary stable strategy (ESS) for the government is
, and conversely, if
, the ESS is
. The strategy evolution phase diagram for agricultural enterprises is shown in
Figure 3.
In
Figure 3, the volume
of
represents the probability of agricultural enterprises to stably choose to reject the transformation behavior, and the volume
of
represents the probability of stably choosing innovative transformation behavior. Following the same integration procedure as described above, after the calculation, we obtain
Proposition 2. The likelihood of agricultural enterprises engaging in innovative transformation is positively associated with their operating and non-operating incomes, as well as the coefficient of government subsidies for farmers, and inversely related to the costs associated with research and development.
Proof. According to (3) and (4), the first-order partial derivatives of each element are obtained as follows: , , , , and the formula (3) does not contain r. Therefore, increasing or decreasing can increase the probability of the government choosing a subsidy, which is irrelevant. □
Proposition 2 demonstrates that increased operating and non-operating income for agricultural enterprises facilitates their adoption of innovative transformation. Enterprises ought to intensify the promotion of innovative products and draw investments, whereas government departments might set up awards to spur technological progress, elevate market influence, and shares, thereby augmenting non-operating income. Higher government subsidies for farmers incentivize them to adopt new productivity methods, addressing both corporate revenue generation and technology product sales challenges. Moreover, this enables enterprises to expand downstream into the market and extend their industrial chains. Simultaneously, enterprises should actively cultivate agricultural talents, train new farmers, and attract more farmers to choose new quality production materials.
3.3. Stability Analysis of Farmers’ Strategy
The replicator dynamic equation for farmers is
and the first derivative of y is
Let
. According to the stability theorem of differential equations, the farmers’ strategy of choosing new quality production materials will stabilize if
and
. Since
,
is a decreasing function with respect to
y. Therefore, if
,
and
at the point
, the government cannot determine a stabilization strategy. If
,
, and
, then the evolutionary stable strategy (ESS) for the government is
, and conversely, if
, the ESS is
. The strategy evolution phase diagram for farmers is shown in
Figure 4.
In
Figure 4, the volume
of
is the probability of the farmers’ stable choice of traditional means of production, and the volume
of
is the probability of stable choice of the new quality means of production. Similarly, applying the same integration methodology, after calculation, we obtain
Proposition 3. Empirical studies suggest that the likelihood of farmers adopting new quality production methods is positively correlated with the perceived benefits of these methods. The teaching and guarantee costs of enterprises to farmers, and the subsidy coefficient of government to farmers can be understood through the distribution of subsidy funds as shown in the statistical table, where specific amounts are allocated for various agricultural support measures such as agricultural land subsidies, agricultural machinery purchase subsidies, and agricultural toilet improvement rewards, as well as the benefits of rural construction and transformation, while negatively correlated with the benefits of traditional production means and the additional costs of new quality production means.
Proof. According to (5) and (6), the first-order partial derivatives of each factor are obtained as follows: , , , , , . Therefore, the increase of , , r, and , or the decrease of and , can increase the probability that the government chooses to subsidize. □
Proposition 3 indicates that as the efficiency of new-quality production materials increases, the additional costs incurred tend to decrease, thereby enhancing the net benefit. When traditional production materials provide lesser efficiency gains, farmers tend to favor new-quality materials based on profit comparisons. The increased training and support costs borne by enterprises, coupled with government subsidies, serve to mitigate farmers’ operational concerns. With new-quality materials, rural infrastructure improvements further facilitate agricultural operations, encouraging farmers to adopt these advanced production tools.
3.4. Stability Analysis of the Tripartite Evolutionary Game System Equilibrium Points
Since asymmetric games require that the evolutionary stable strategies must satisfy both strict Nash equilibrium and pure strategy Nash equilibrium conditions [
16,
17], we focus on the stability of eight pure strategy equilibrium points. Mixed strategies cannot be evolutionary stable strategies. The system equilibrium points are determined from the equations
,
,
, yielding the following equilibrium points
,
,
,
,
,
,
,
.
The Jacobian matrix for the tripartite evolutionary game system is
where
Using the method from Friedman [
16], the stability of the equilibrium points of the system can be judged by the sign of the eigenvalues of the Jacobian matrix: if all the eigenvalues are negative, the corresponding equilibrium point is asymptotically stable, and the strategy combination forms an evolutionary stable strategy (ESS). If there is a zero eigenvalue but all other eigenvalues are negative, the equilibrium point is in a critical stable state, and its stability must be determined by further methods. If all the eigenvalues are positive, the equilibrium point is unstable.
Table 3 shows the stability analysis of the eight pure strategy equilibrium points.
At the same time, to provide a comprehensive stability analysis of the equilibrium points, we employ both algebraic classification and manifold dimension analysis. Each equilibrium is categorized into one of three fundamental types based on the eigenvalues of the Jacobian matrix: sinks (asymptotically stable points where all eigenvalues have negative real parts), sources (unstable points where all eigenvalues have positive real parts), and saddles (unstable points with mixed eigenvalue signs). For saddle points, we further specify the dimensions of the stable and unstable manifolds, denoted as “Stable/Unstable Manifold Dim” [
18]. This notation indicates the number of independent directions in phase space along which trajectories converge to (stable manifold) or diverge from (unstable manifold) the equilibrium point. The manifold dimensions are determined by counting the number of eigenvalues with negative and positive real parts, respectively. Equilibria containing zero eigenvalues are classified as non-hyperbolic and require center manifold theory for complete stability characterization; these are marked with a dash in the classification columns. This systematic approach allows for a precise understanding of the local dynamical behavior around each equilibrium and provides insights into the basin of attraction for desirable system states. A more detailed table is presented in
Appendix A,
Table A1.
4. Simulation Analysis
To verify the results of the evolutionary stability analysis, specific parameter values are assigned to the model based on real-world scenarios. The simulation model for agricultural development evolutionary games is built using MATLAB 2021a. Based on the game model and assumptions from the above sections, along with references from related literature [
15,
16,
19], the initial parameter values for Case 2 are set as follows:
,
,
,
,
,
,
,
,
,
,
,
,
,
,
,
,
,
,
, and
. The initial time is set to 0, and the end time is set to
(this time duration may be adjusted depending on the evolutionary stability of the model). The ode45 function is used for automatic step size adjustment in MATLAB.
4.1. Basins of Attraction Analysis
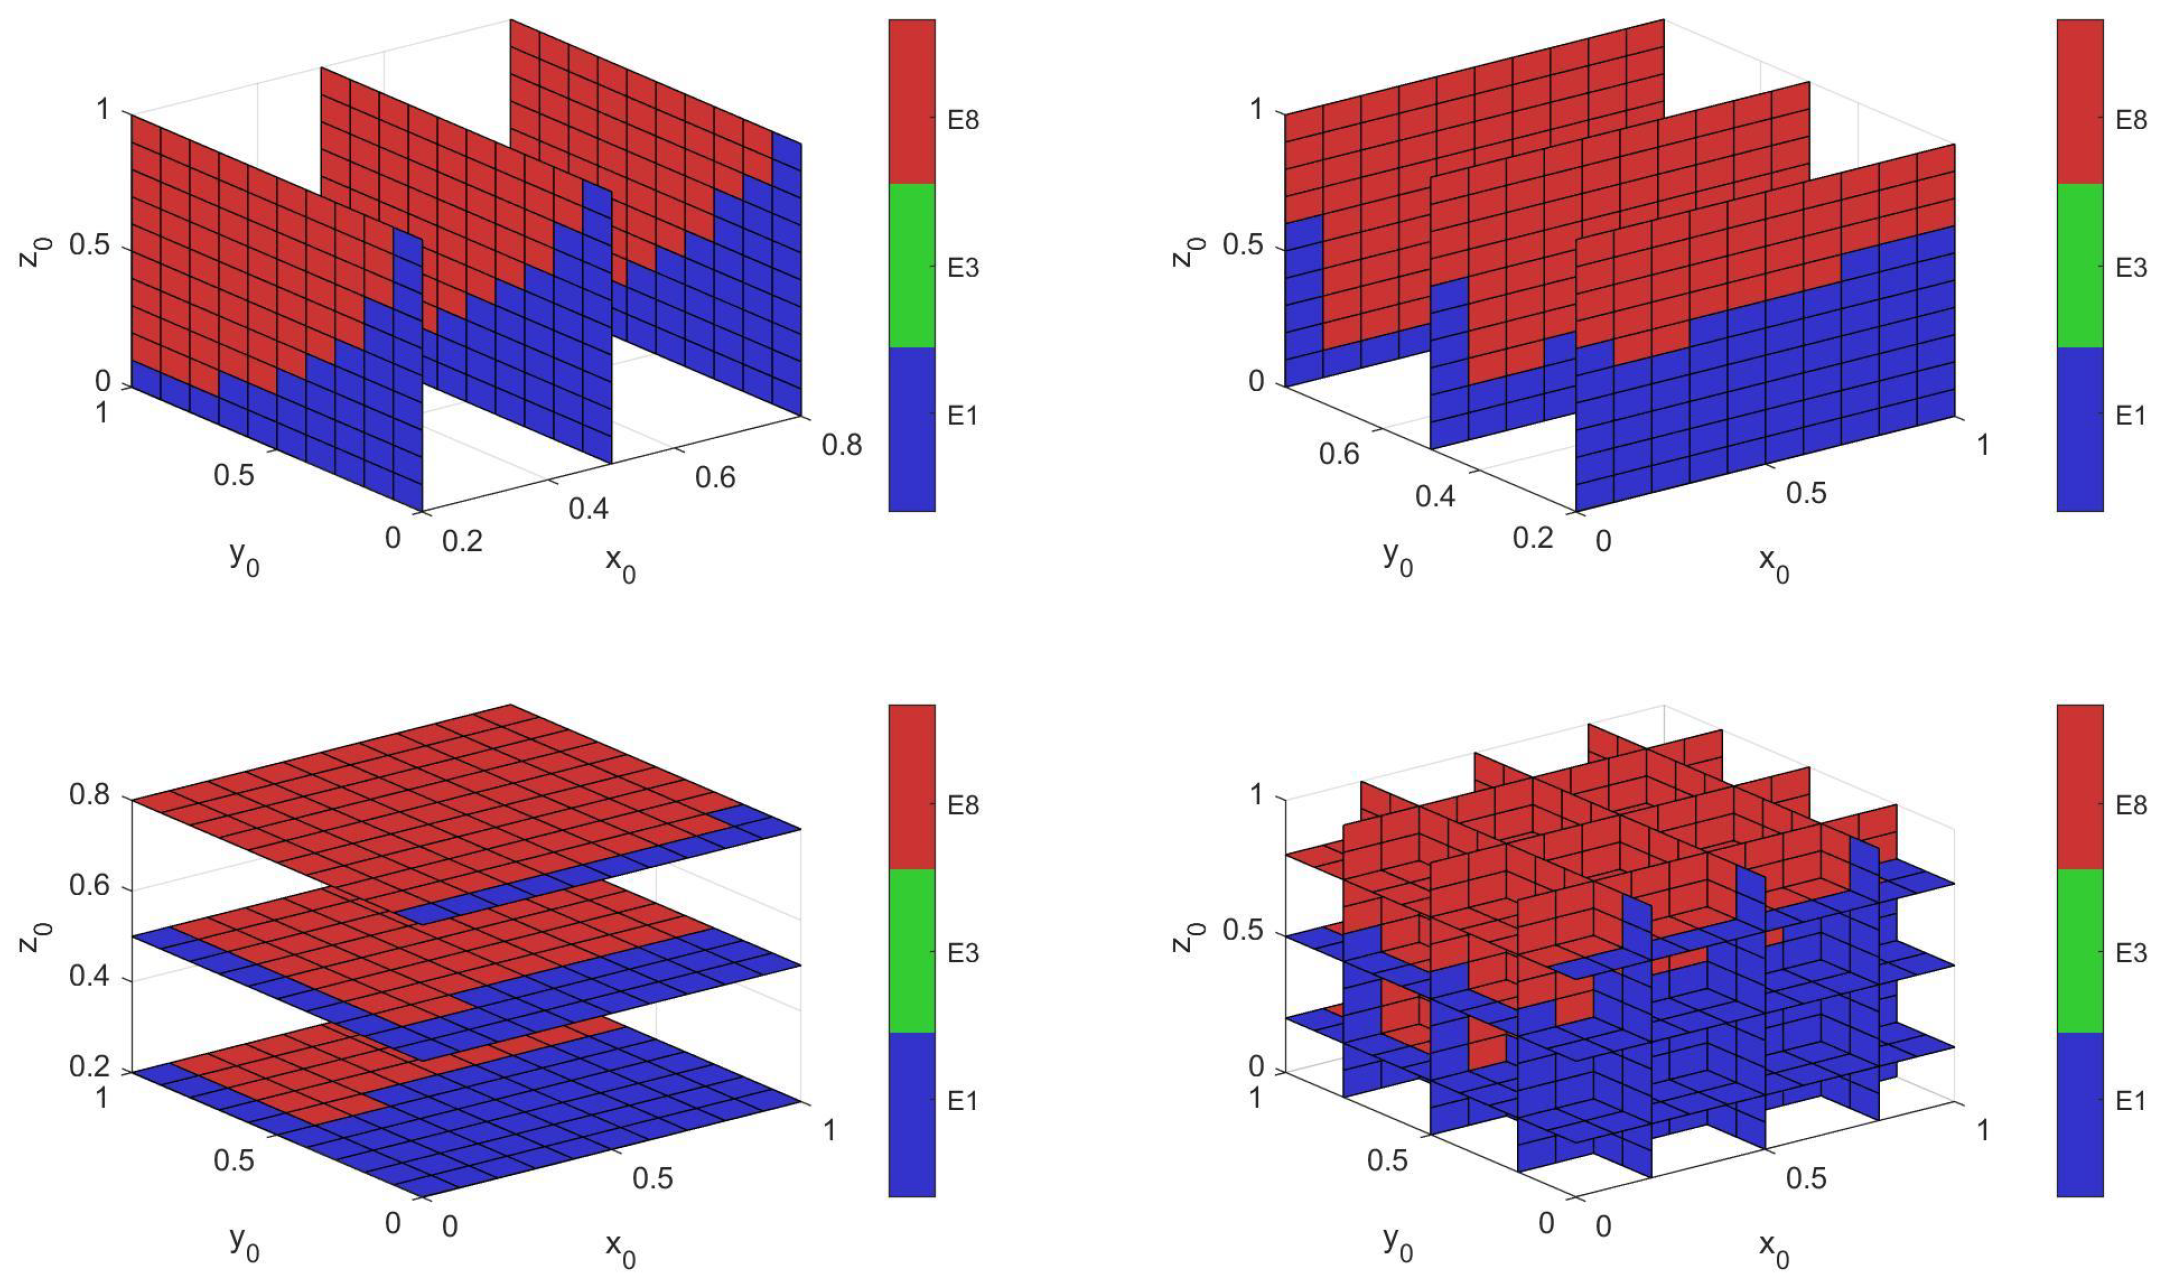
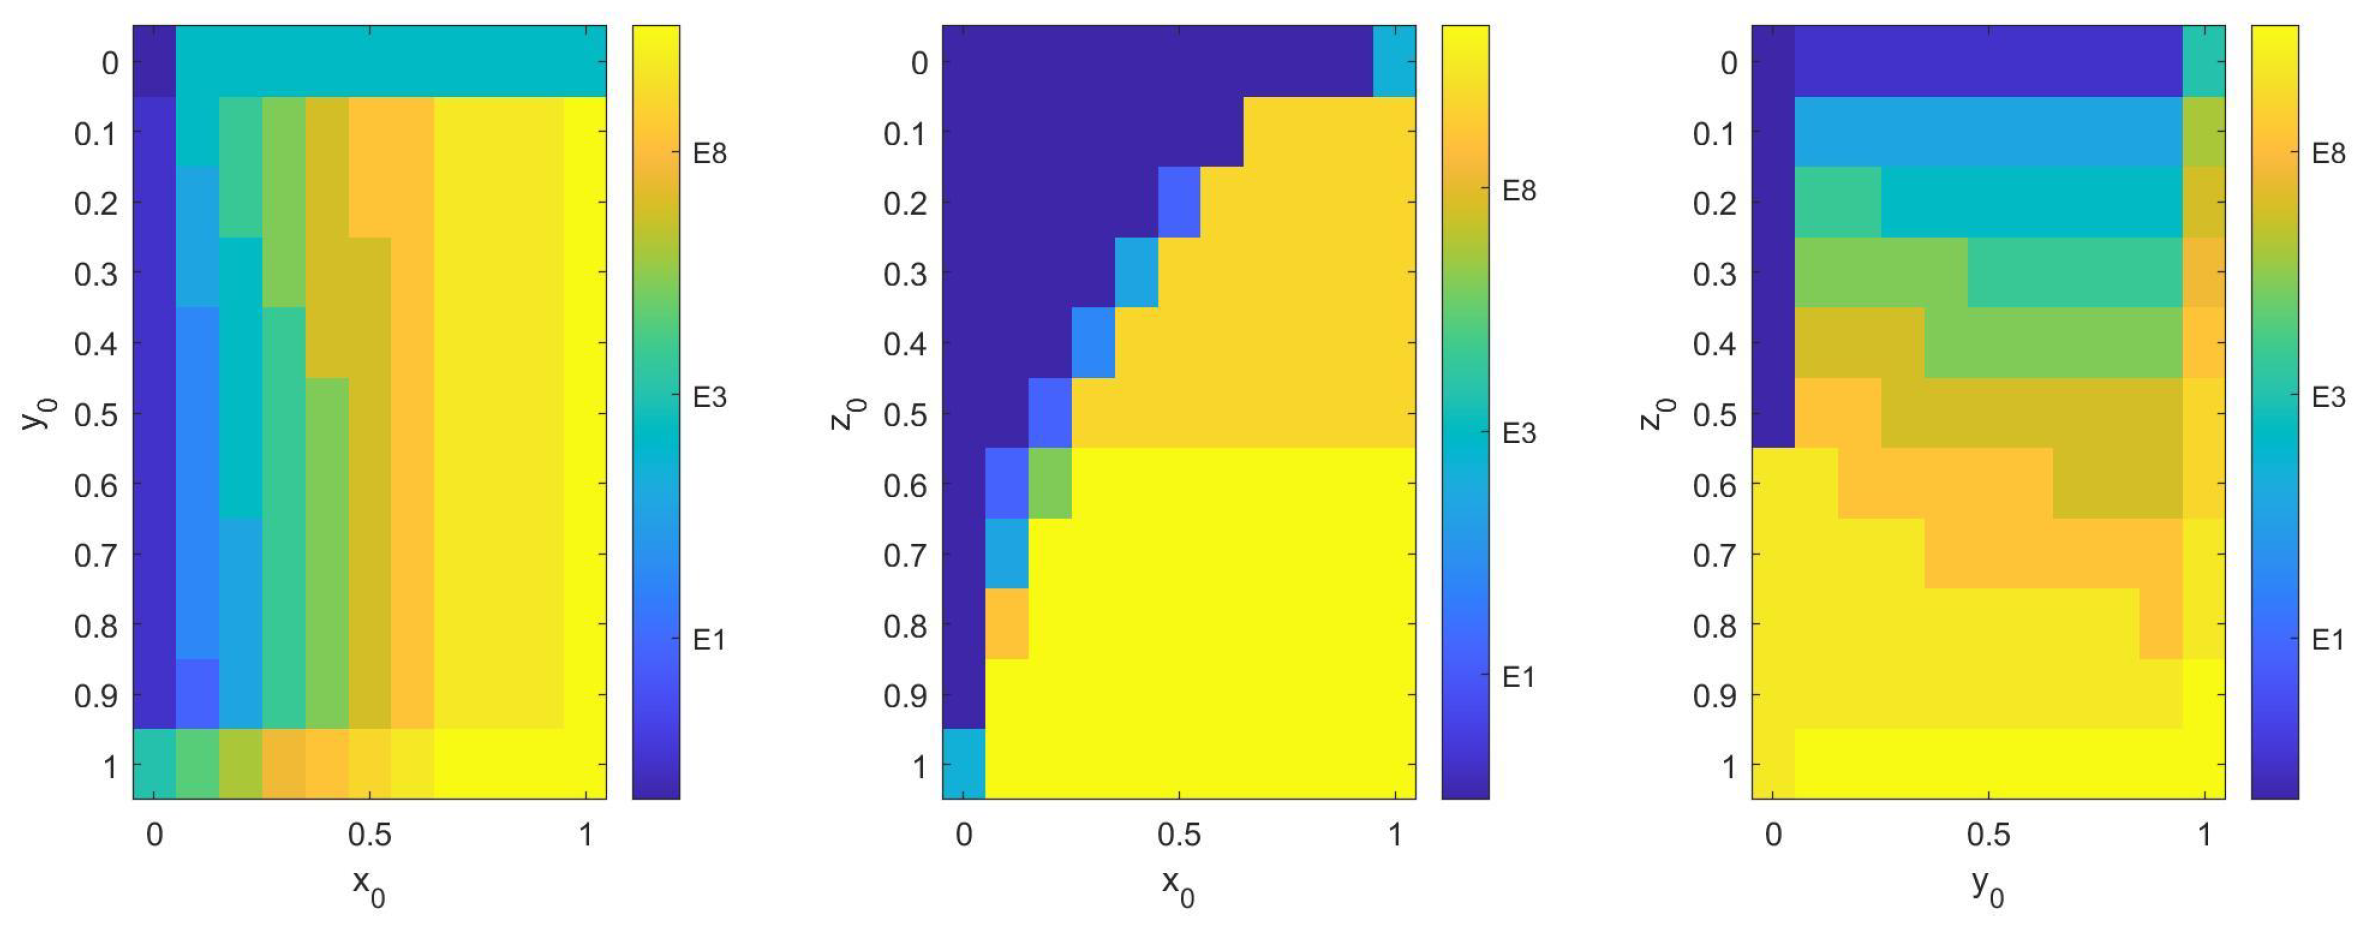
To comprehensively understand the dynamic evolution of the tripartite game system under varying initial conditions, we conducted a systematic basins of attraction analysis that identifies the sets of initial strategy combinations leading to each stable equilibrium, thereby assessing the robustness of the desired cooperative outcome. We employed a grid-scanning method across the three-dimensional strategy space spanned by the initial probabilities of government subsidy, enterprise transformation, and farmer adoption, discretizing the unit cube with a resolution of 0.1 to generate 1331 initial condition combinations. For each initial point, we simulated the replicator dynamics until convergence and classified the final state based on proximity to the three stable equilibria using Euclidean distance minimization.
Under the baseline parameter configuration, the basins of attraction analysis reveals a promising landscape for policy implementation, with the ideal equilibrium E
8(1,1,1) attracting the largest basin covering 63.04% of valid initial conditions. This cooperative outcome dominates the strategy space region where government exhibits moderate to high initial willingness to subsidize (x
0 > 0.10) and farmers show at least some openness to adoption (z
0 > 0.10), with a geometric center (0.62, 0.51, 0.63). The status quo equilibrium E
1(0,0,0) captures 32.23% of initial conditions primarily in regions of low government and farmer initiative, while the partial transformation equilibrium E
3(0,1,0) represents only 4.73% of cases, indicating that enterprise-led transformation without government support is relatively uncommon. See
Figure A1 and
Figure A2 for details.
Considering the empirical context of agricultural transition, where initial conditions typically feature moderate government willingness to subsidize, cautious but growing enterprise interest in innovation, and varying farmer adoption rates across regions, our basin analysis confirms that the system most frequently converges to the cooperative equilibrium E8 under empirically plausible initial states. The substantial volume of the E8 basin provides strong theoretical support for the policy’s feasibility, though the significant E1 basin highlights the risk of policy failure if initial stakeholder attitudes are predominantly pessimistic, underscoring the critical importance of early-stage interventions such as demonstration projects and training programs to shift initial attitudes toward cooperation.
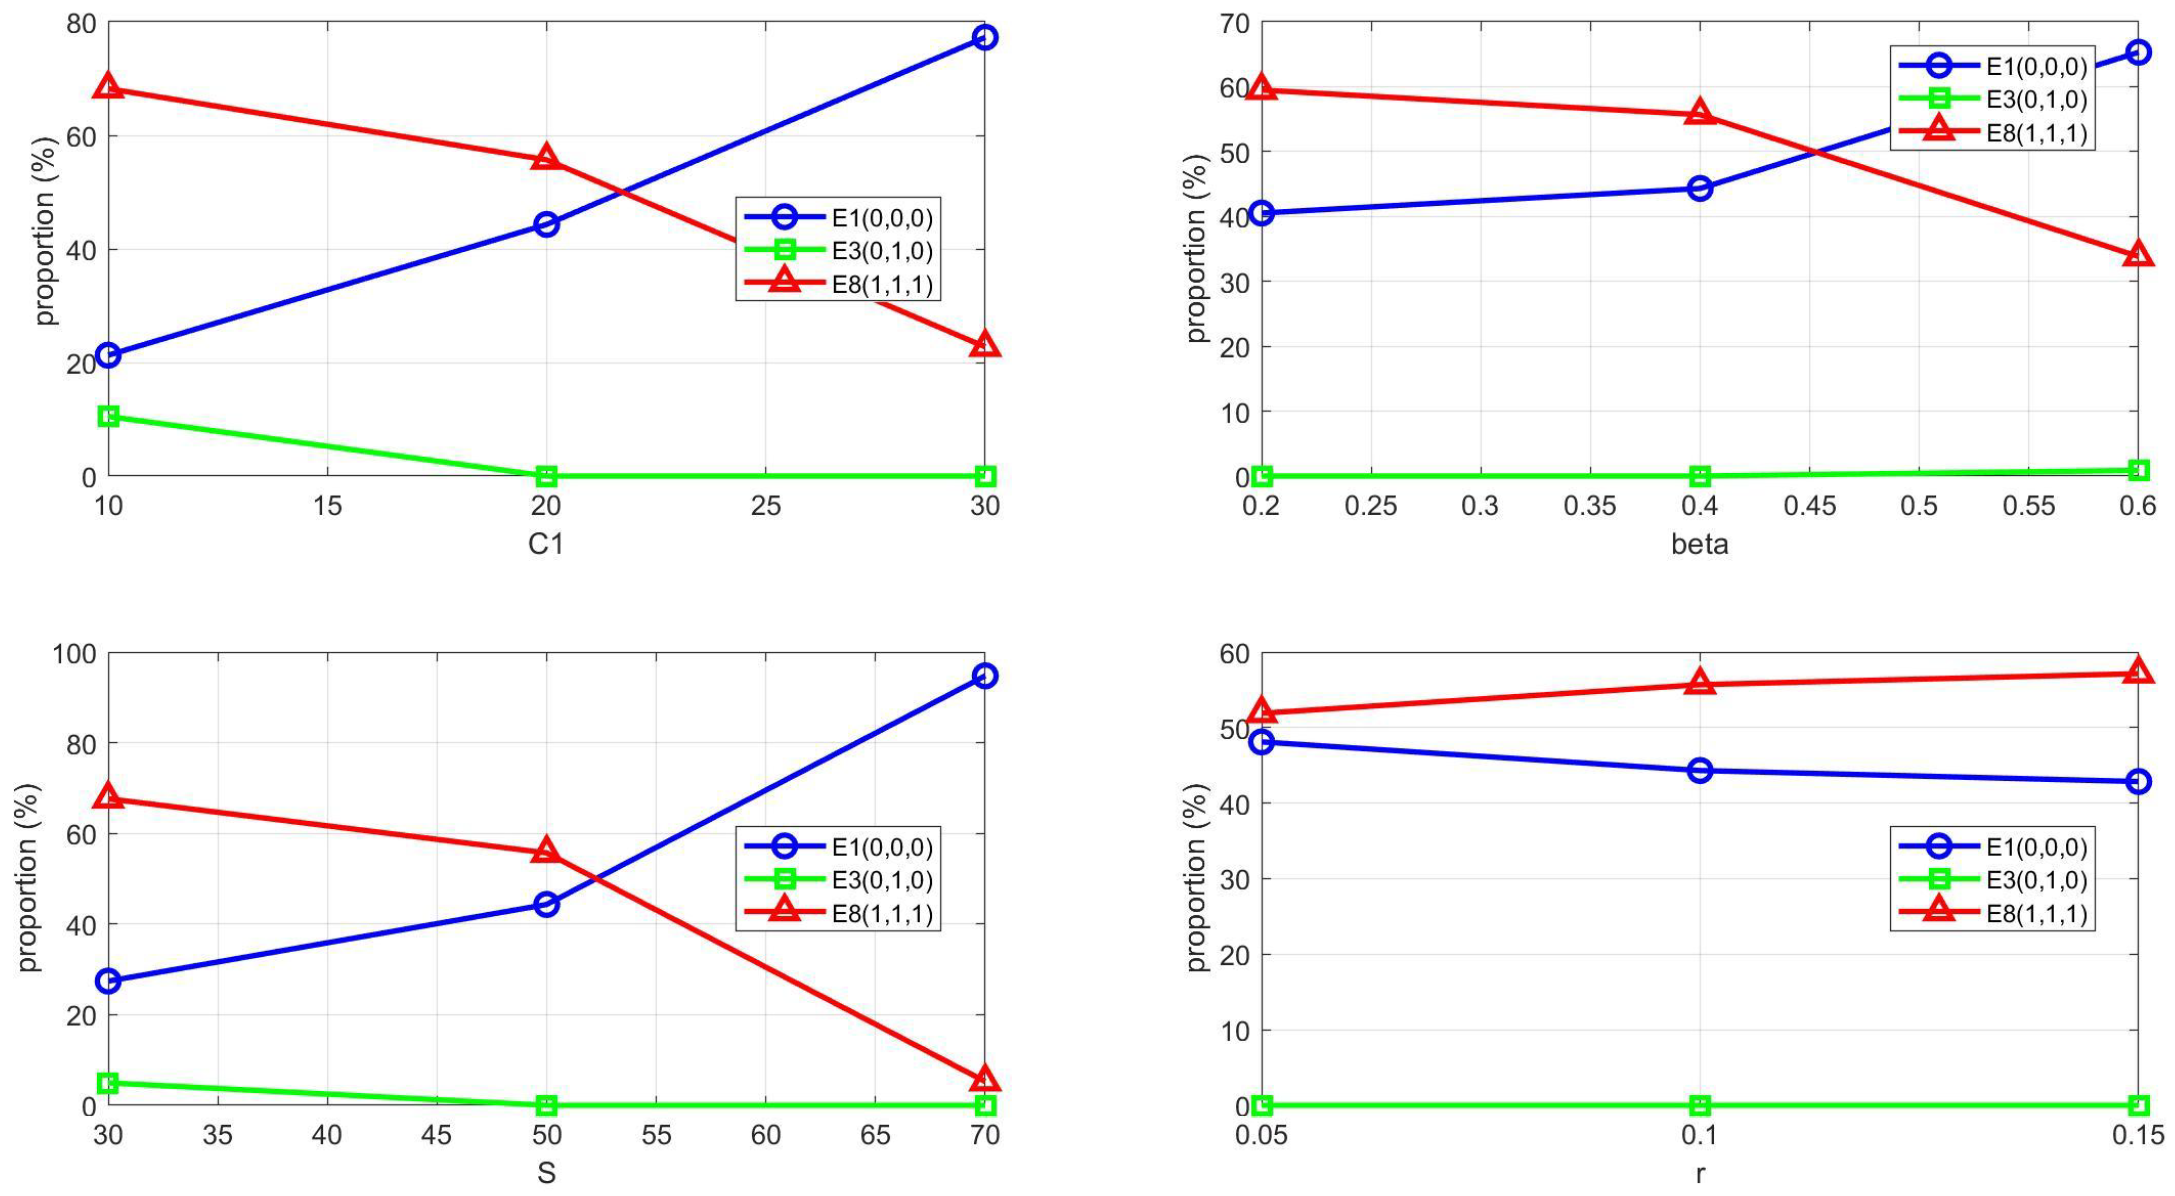
To evaluate the sensitivity of the basin stability to key parameters, we selected four core parameters—Government Initial Infrastructure Cost (
), Farmers Subsidy Coefficient (
), Government Total Subsidy Amount (S), and Agricultural Enterprises Assistance Coefficient (r)—for analysis. Each parameter was subjected to three levels of perturbation around the baseline value, with a variation amplitude of ±40–50%. By fixing the other parameters and varying the target parameter, we systematically examined the influence of parameter changes on the proportions of the basins of attraction for each equilibrium point. The results are presented in
Appendix B,
Table A2,
Table A3,
Table A4 and
Table A5 and
Figure A3. The sensitivity analysis further reveals that the relative sizes of attraction basins are strongly influenced by key policy parameters, with infrastructure cost exhibiting the strongest influence as E
8 proportion varies by 45.5% across the tested range. Total subsidy shows dramatic nonlinear effects where moderate subsidies yield 67.6% E
8 coverage while excessive subsidies reduce it to only 5.2%, suggesting potential crowding-out effects or fiscal unsustainability. The farmer subsidy coefficient demonstrates that moderate values optimize E
8 attraction while both under-subsidizing and over-subsidizing diminish cooperative outcomes, whereas enterprise assistance has minimal impact with only 5.2% variation, indicating that it does not fundamentally alter the basin structure. These findings emphasize that parameter calibration is crucial for policy design, with the identified thresholds providing quantitative guidance for optimizing policy instruments to maximize the likelihood of achieving the desired cooperative equilibrium.
4.2. Pure Strategy Game Simulation Analysis
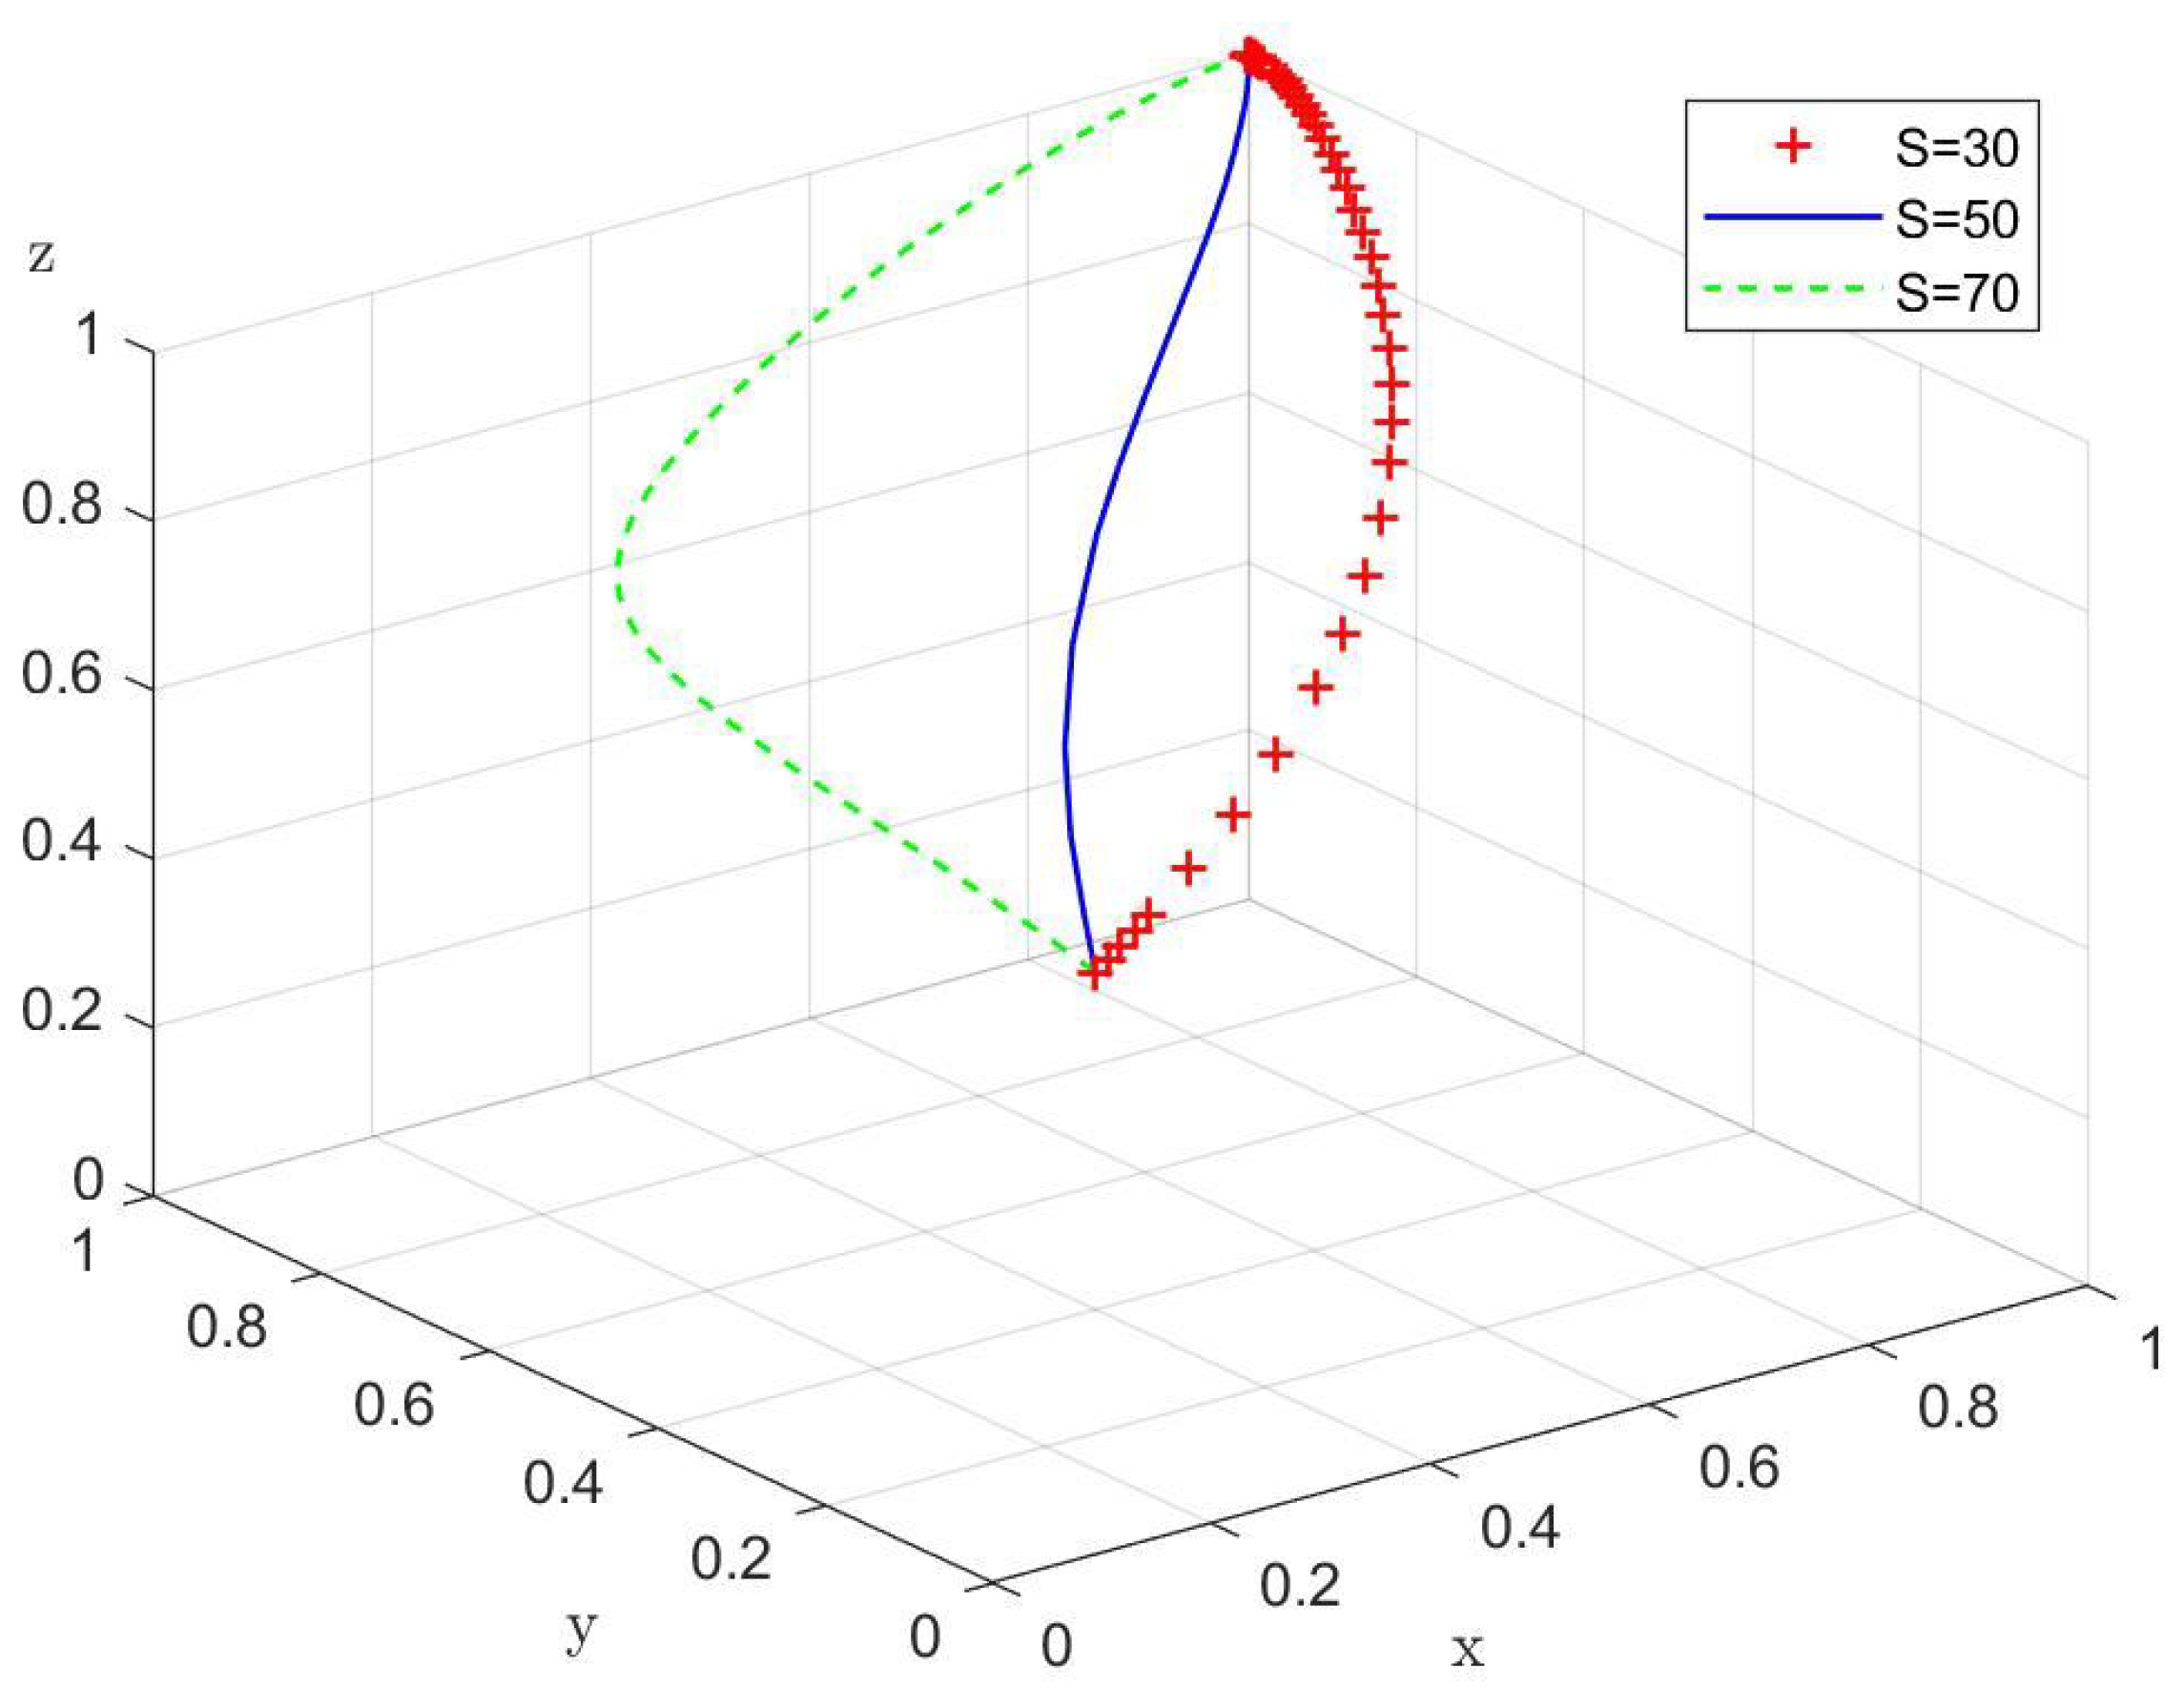
MATLAB simulations demonstrate that when the initial strategy choices of the government, agricultural enterprises, and farmers correspond to any one of the eight possible strategy combinations, all three parties persistently adhere to their original strategies without change. However, even a slight deviation by any single party is sufficient to disrupt the system’s stable state. To comprehensively analyze the evolutionary trajectories of the three parties, this study introduces minor perturbations to their initial strategies. For Case 2, the initial strategy probabilities are set to 0.01 for the government’s subsidy decision and 0.99 for the non-subsidy decision [
18,
20]. The strategy choices of the three parties evolve over time, which can be seen in
Figure 5.
As shown in
Figure 6a,c, when the government initially decides against subsidizing, and farmers choose traditional new-quality productivity, enterprises continue with their traditional practices.
Figure 6b,d demonstrate that when farmers adopt new-quality productivity, enterprises either transition to new-quality transformation or remain unchanged, with corresponding fluctuations in government strategies. However, over time, as farmers shift toward traditional new-quality productivity, the government continues to withhold subsidies while enterprises maintain new-quality transformation until stabilization occurs.
Figure 6e–h reveal that when the government initially chooses “no subsidy” and farmers choose traditional production materials, agricultural enterprises opt for negative transformation. As farmers shift towards adopting new quality production materials, enterprises begin transitioning to new quality production, which influences the government’s policy to stabilize with subsidies. This leads to a stable strategy combination of subsidy, innovative transformation, and new quality production materials. As the government and enterprises transition towards new agricultural practices, the model reaches a stable equilibrium point where all three parties cooperate. This is confirmed through the simulation, where the stable strategies of the system are identified as
,
, and
, as expected.
4.3. Sensitivity Analysis of Key Parameters
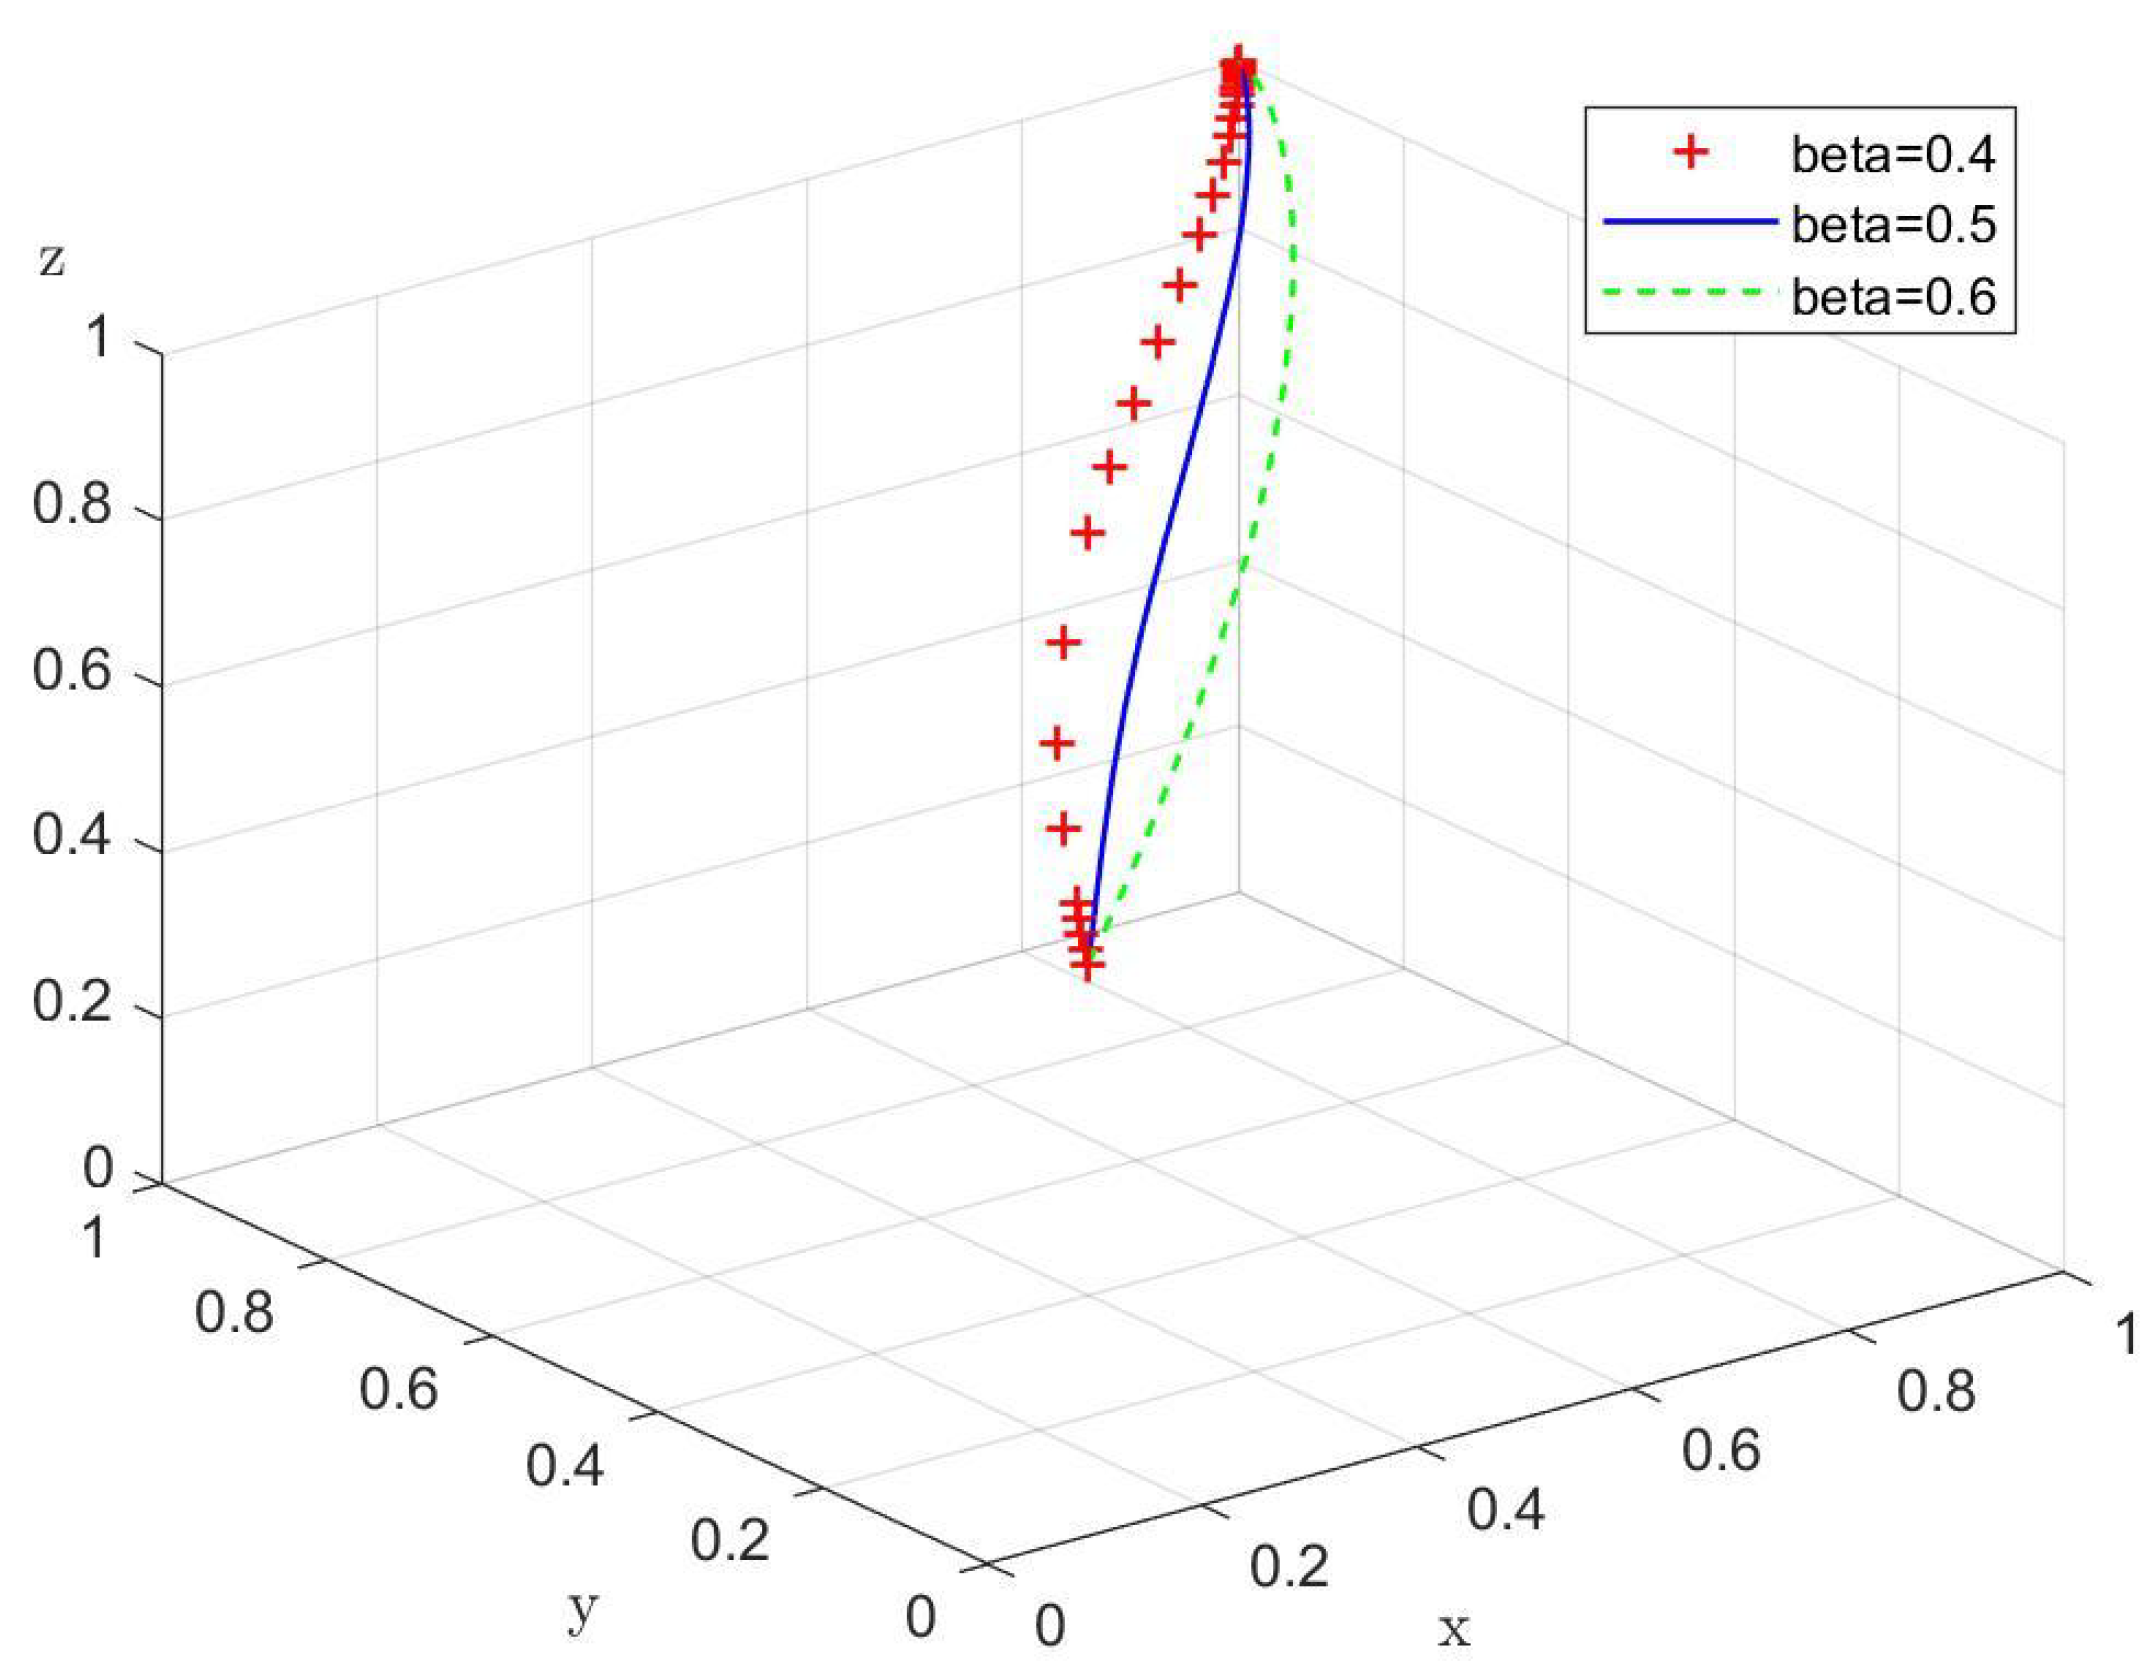
In this section, sensitivity analysis is performed to explore how changes in various parameters impact the stability and evolution of the system. We selected four core parameters—Government Initial Infrastructure Cost (), Farmers Subsidy Coefficient (), Government Total Subsidy Amount (S), and Agricultural Enterprises Assistance Coefficient (r)—for analysis. Each parameter was subjected to two levels of perturbation around the baseline value, with a variation amplitude of ±40–50%.
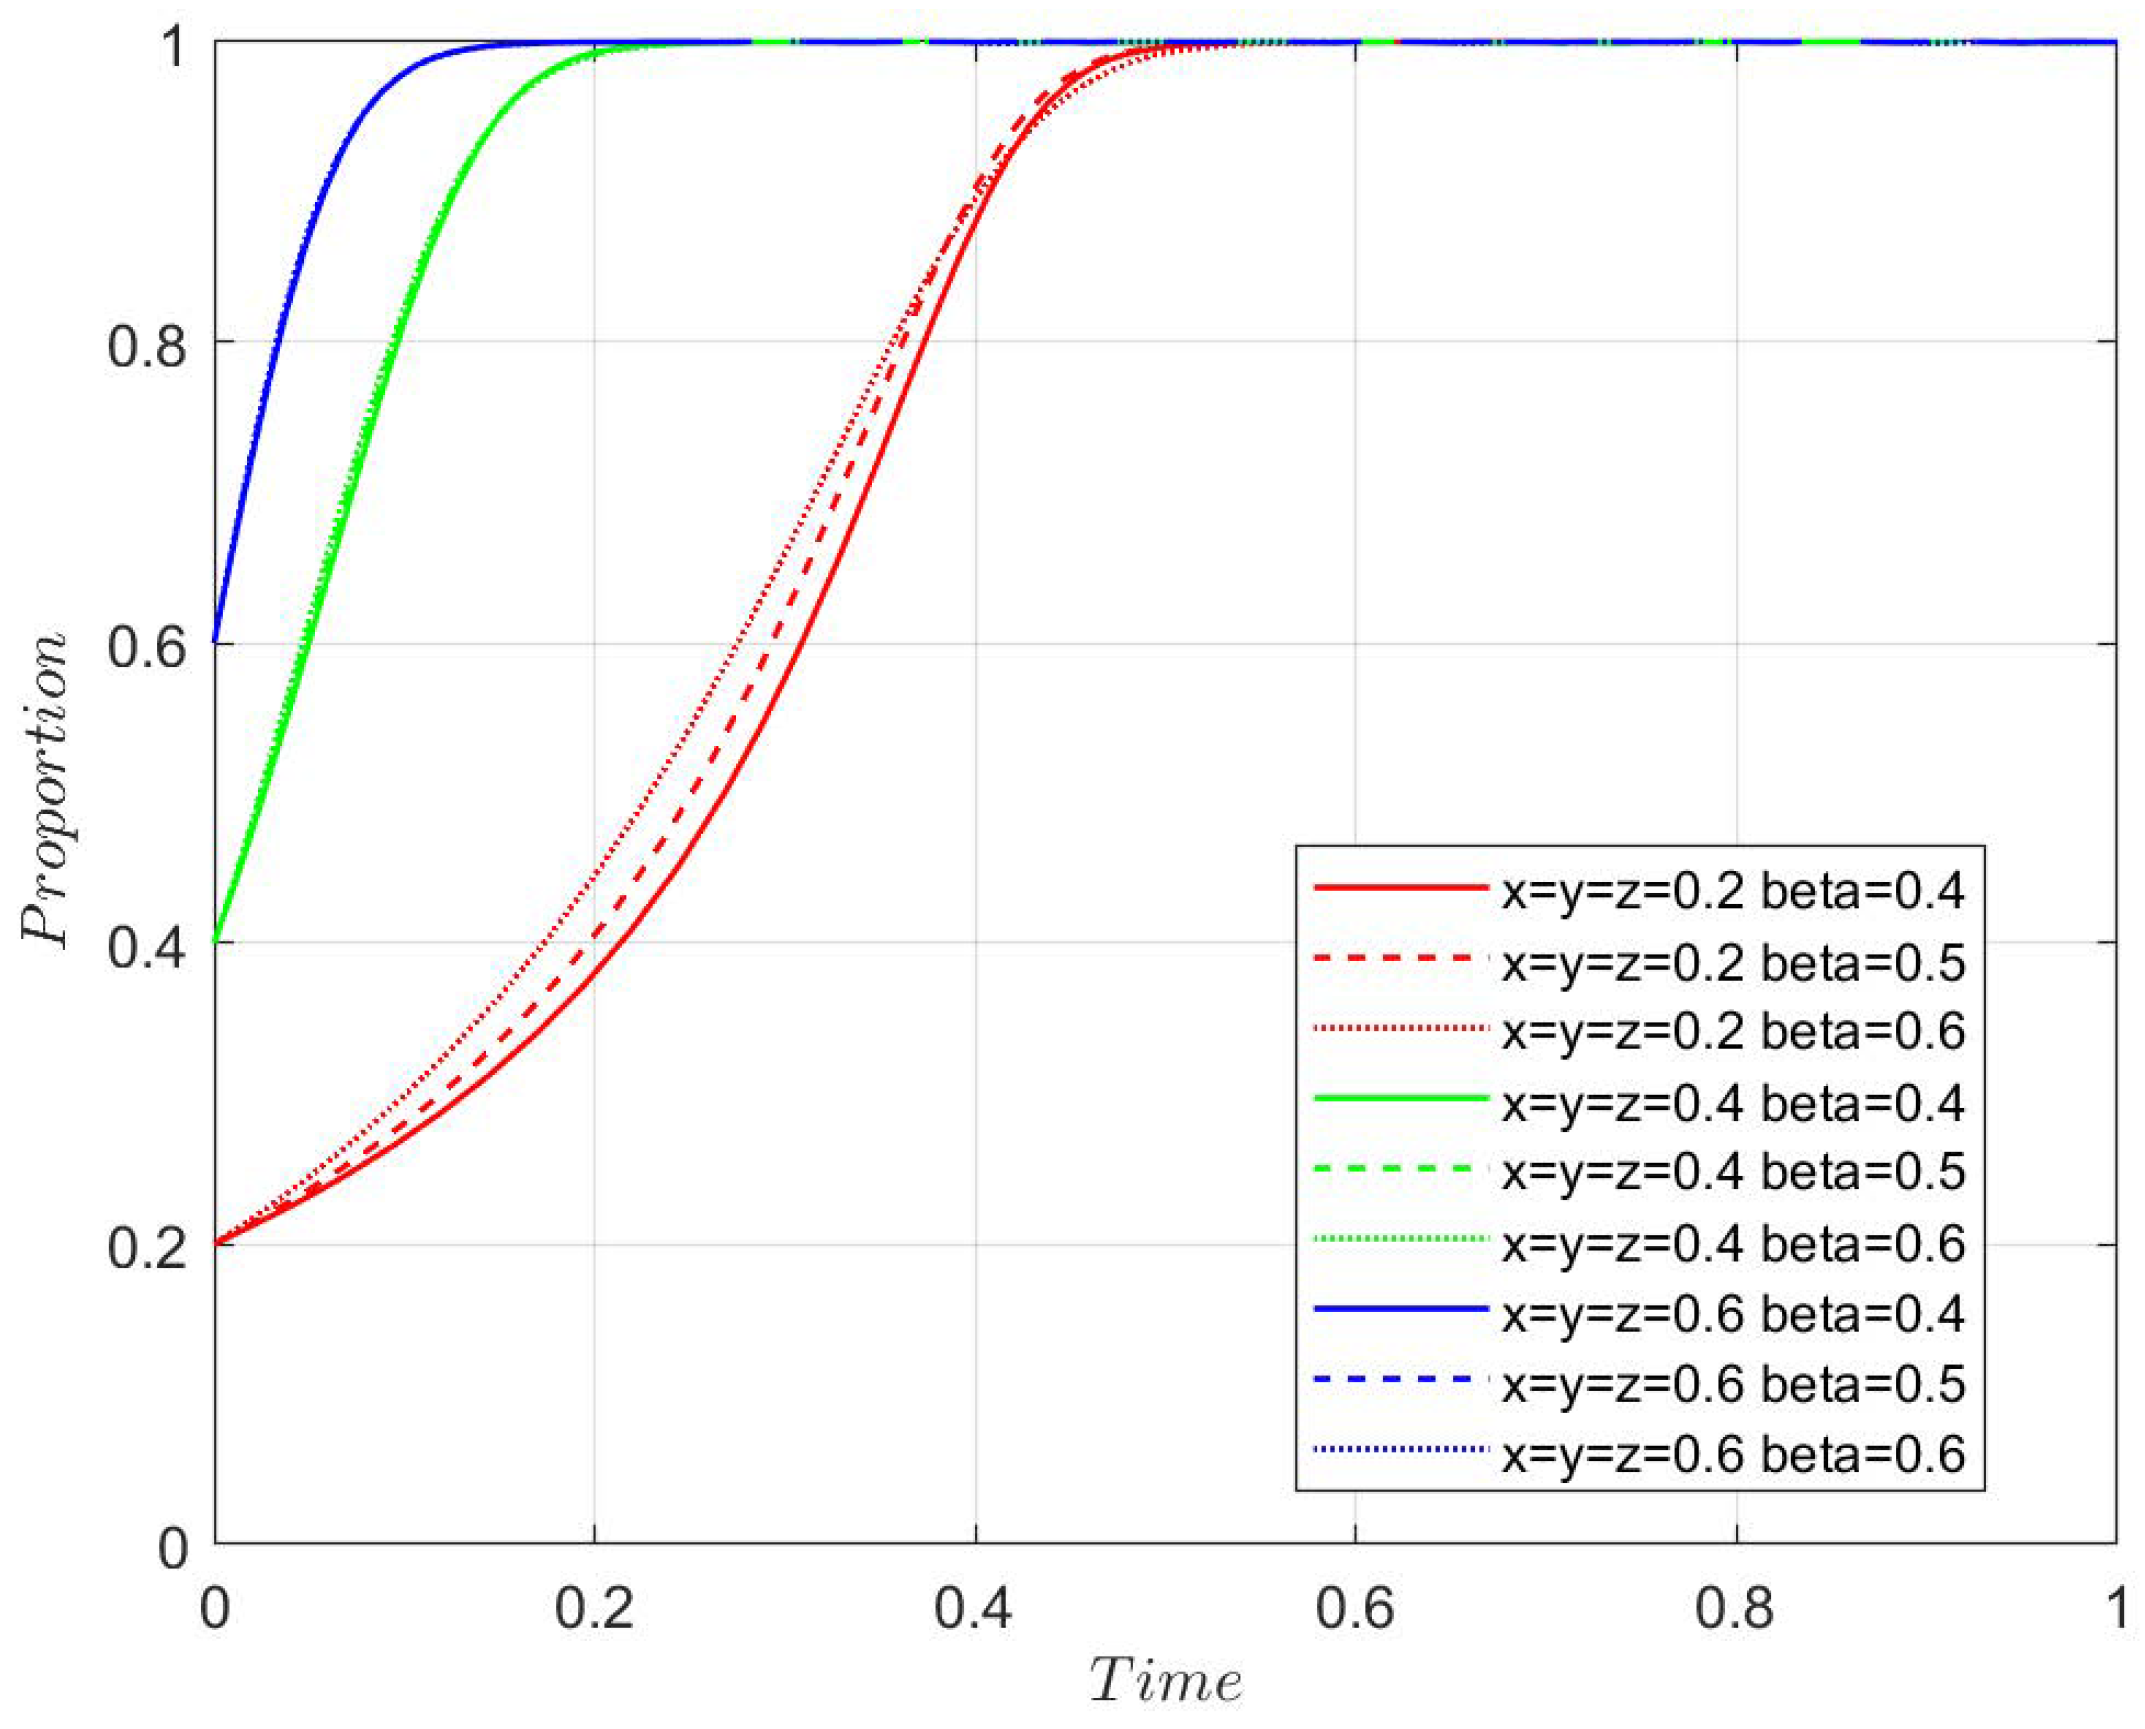
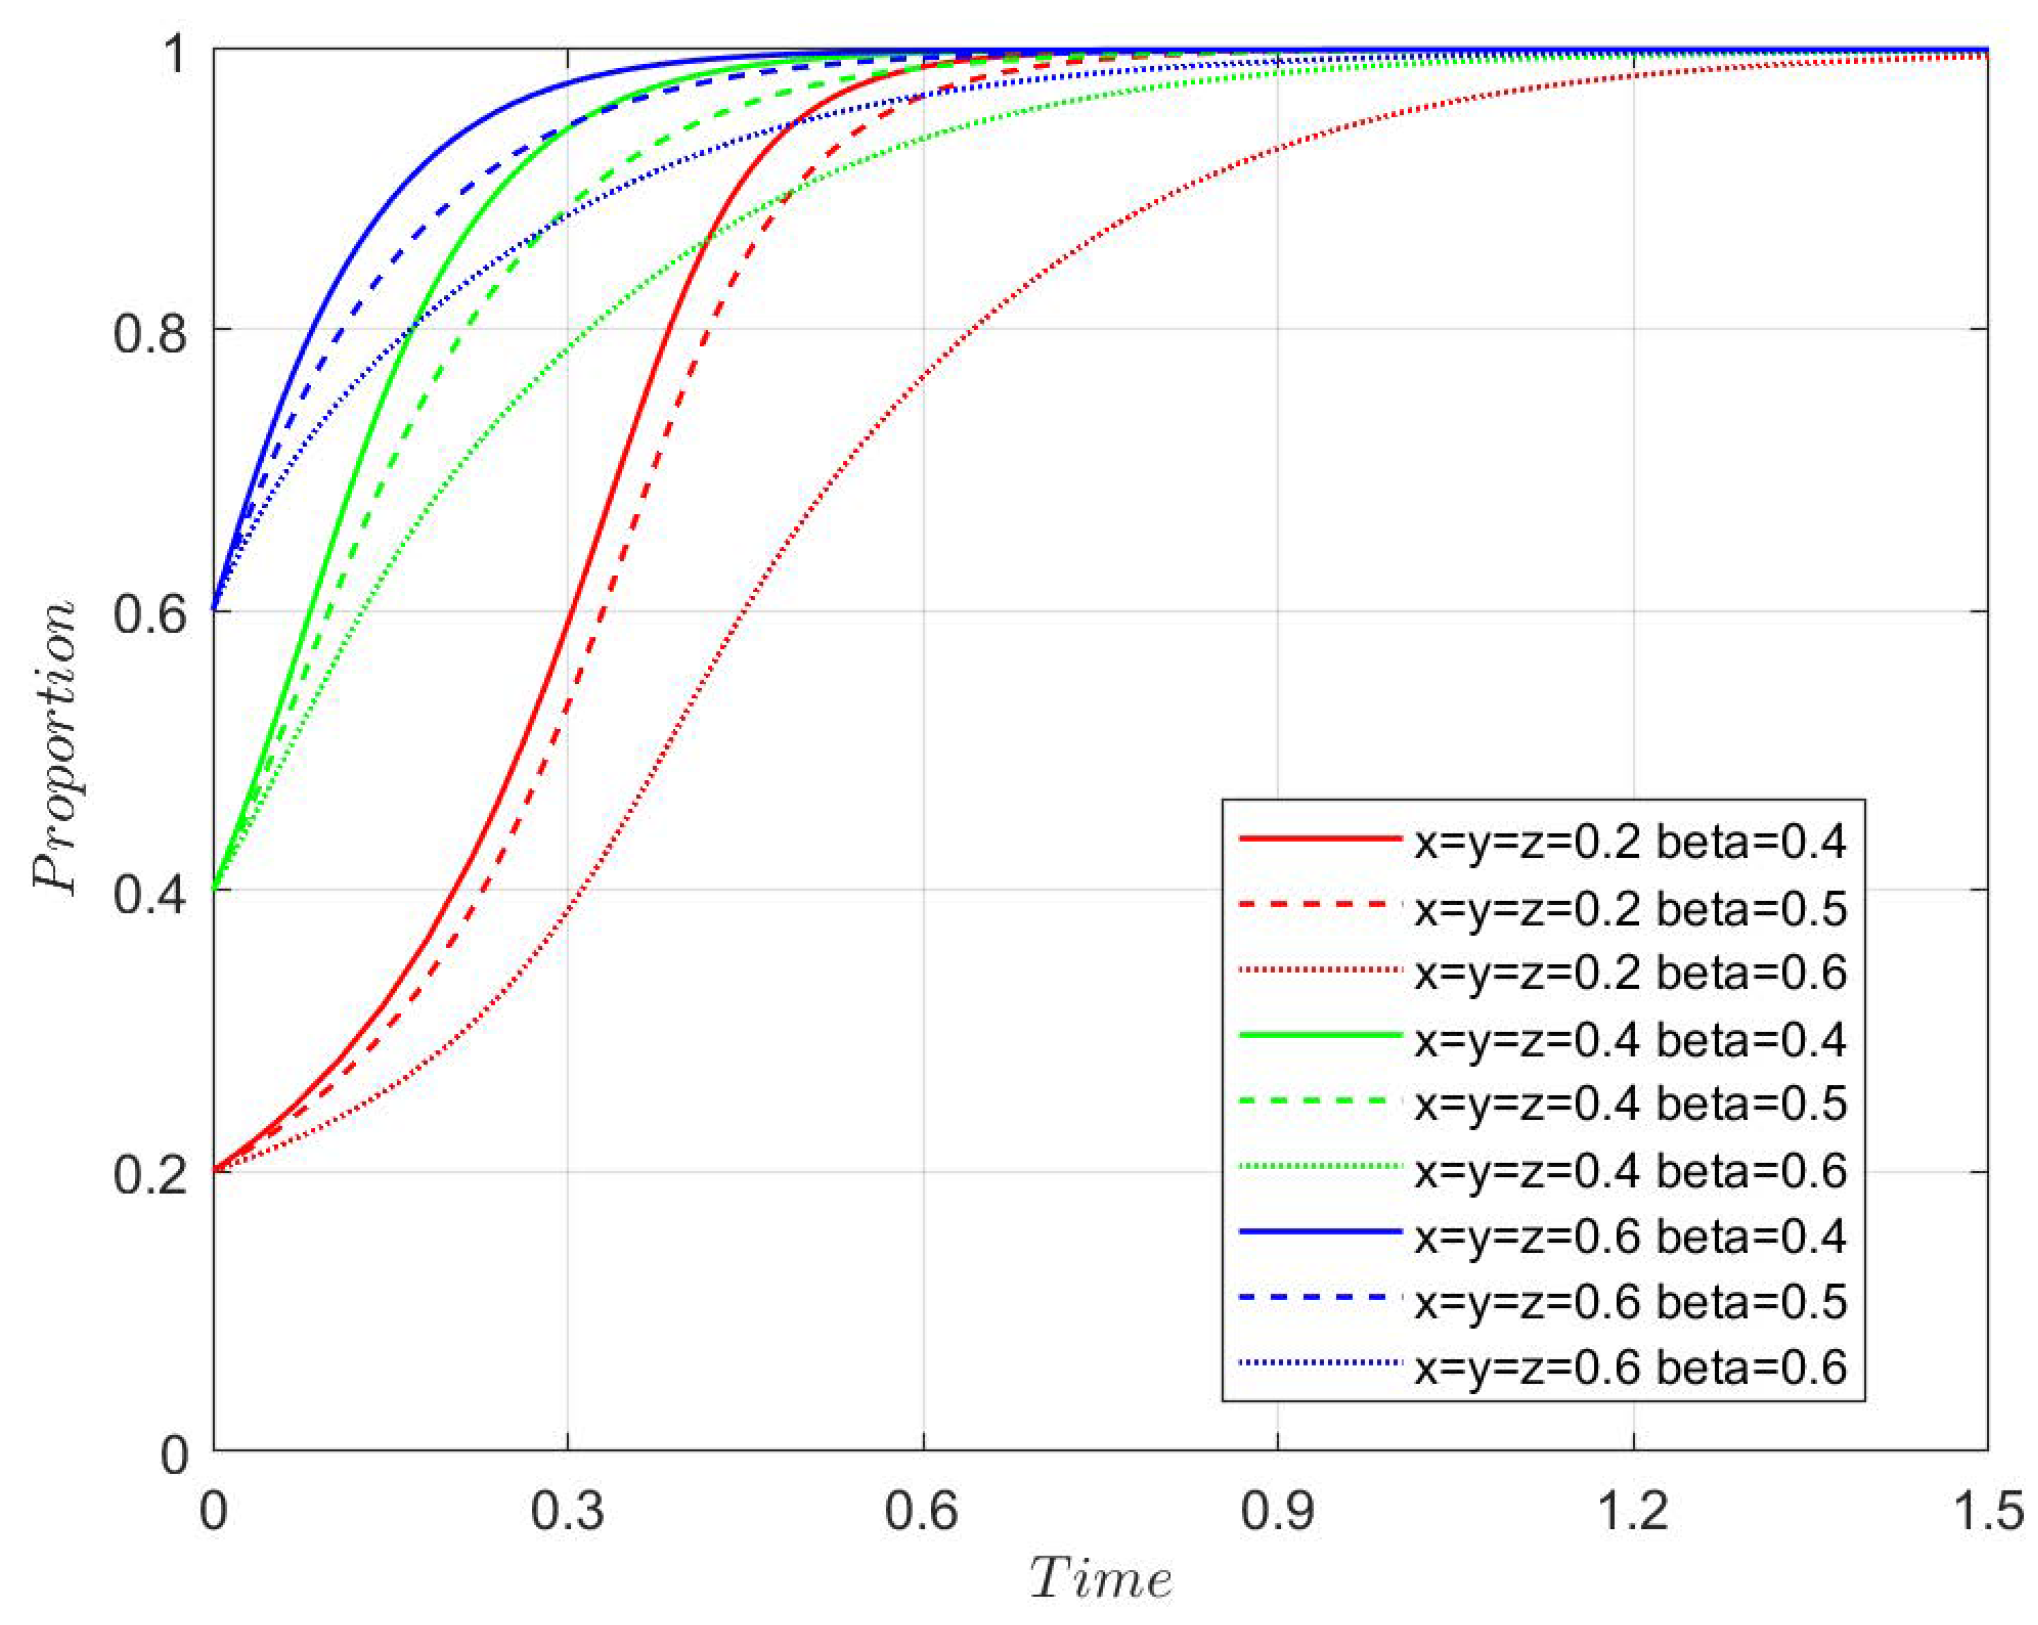
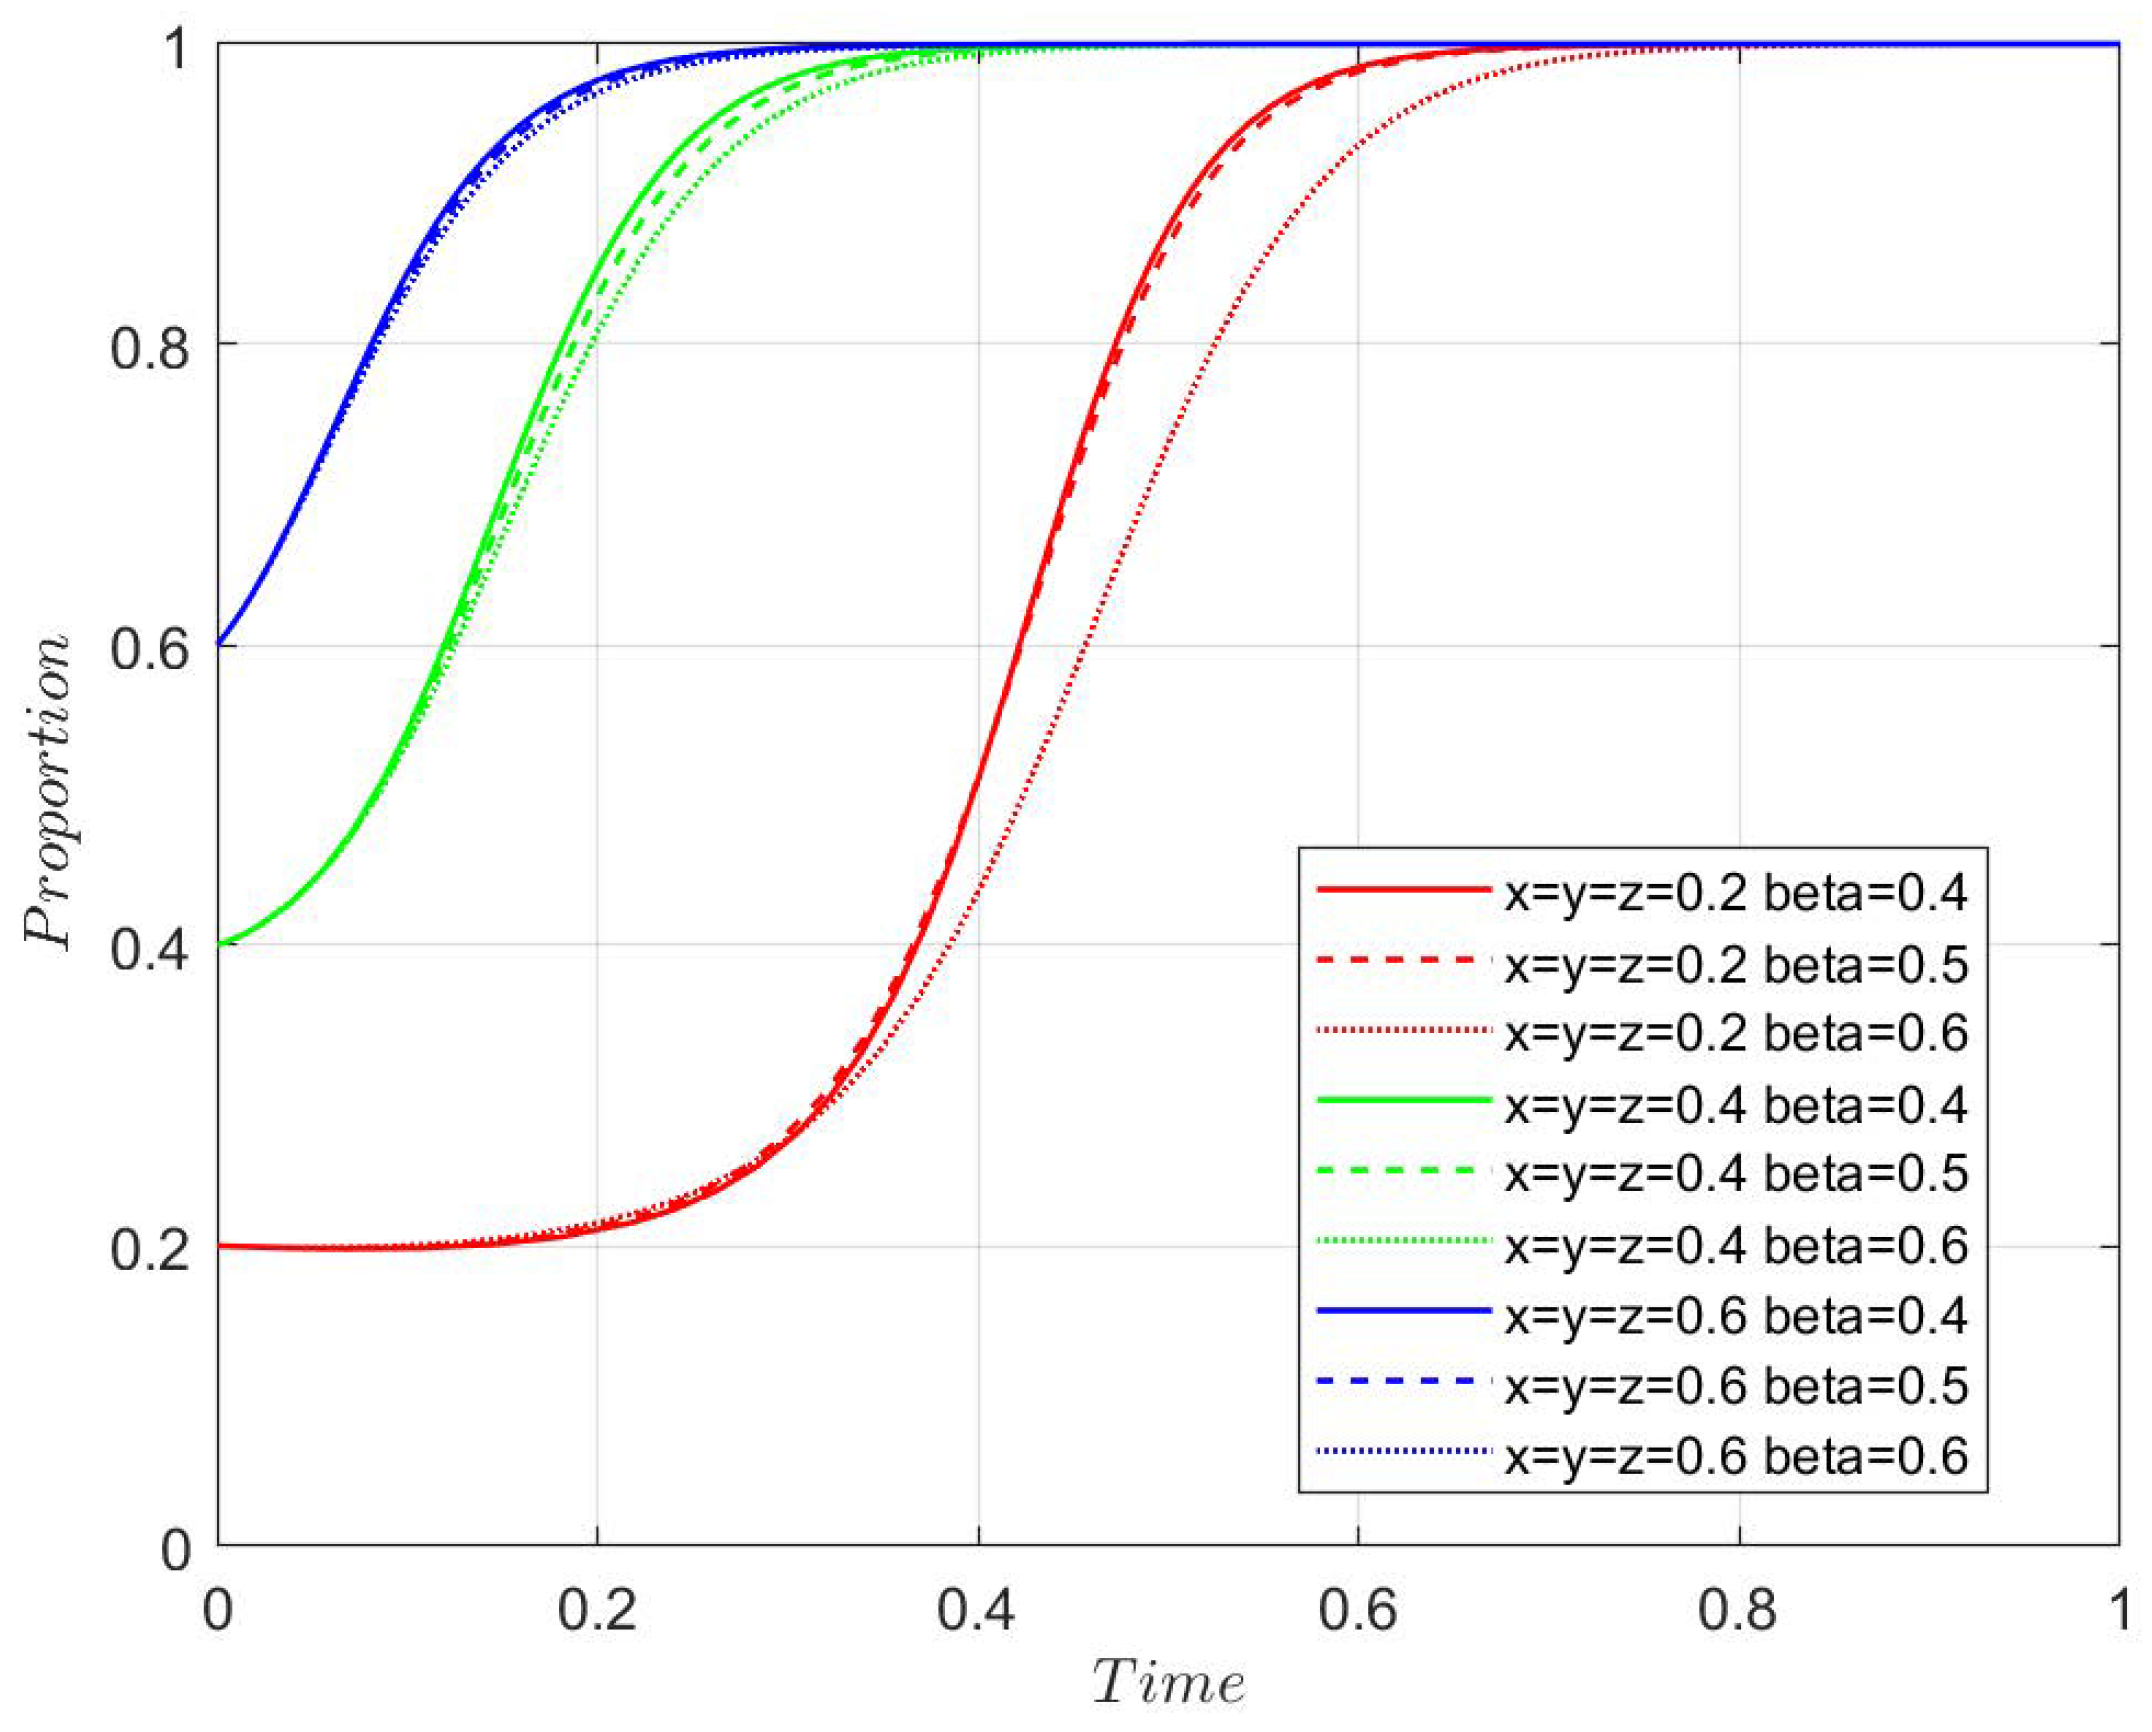
4.3.1. Agricultural Enterprises Assistance Coefficient
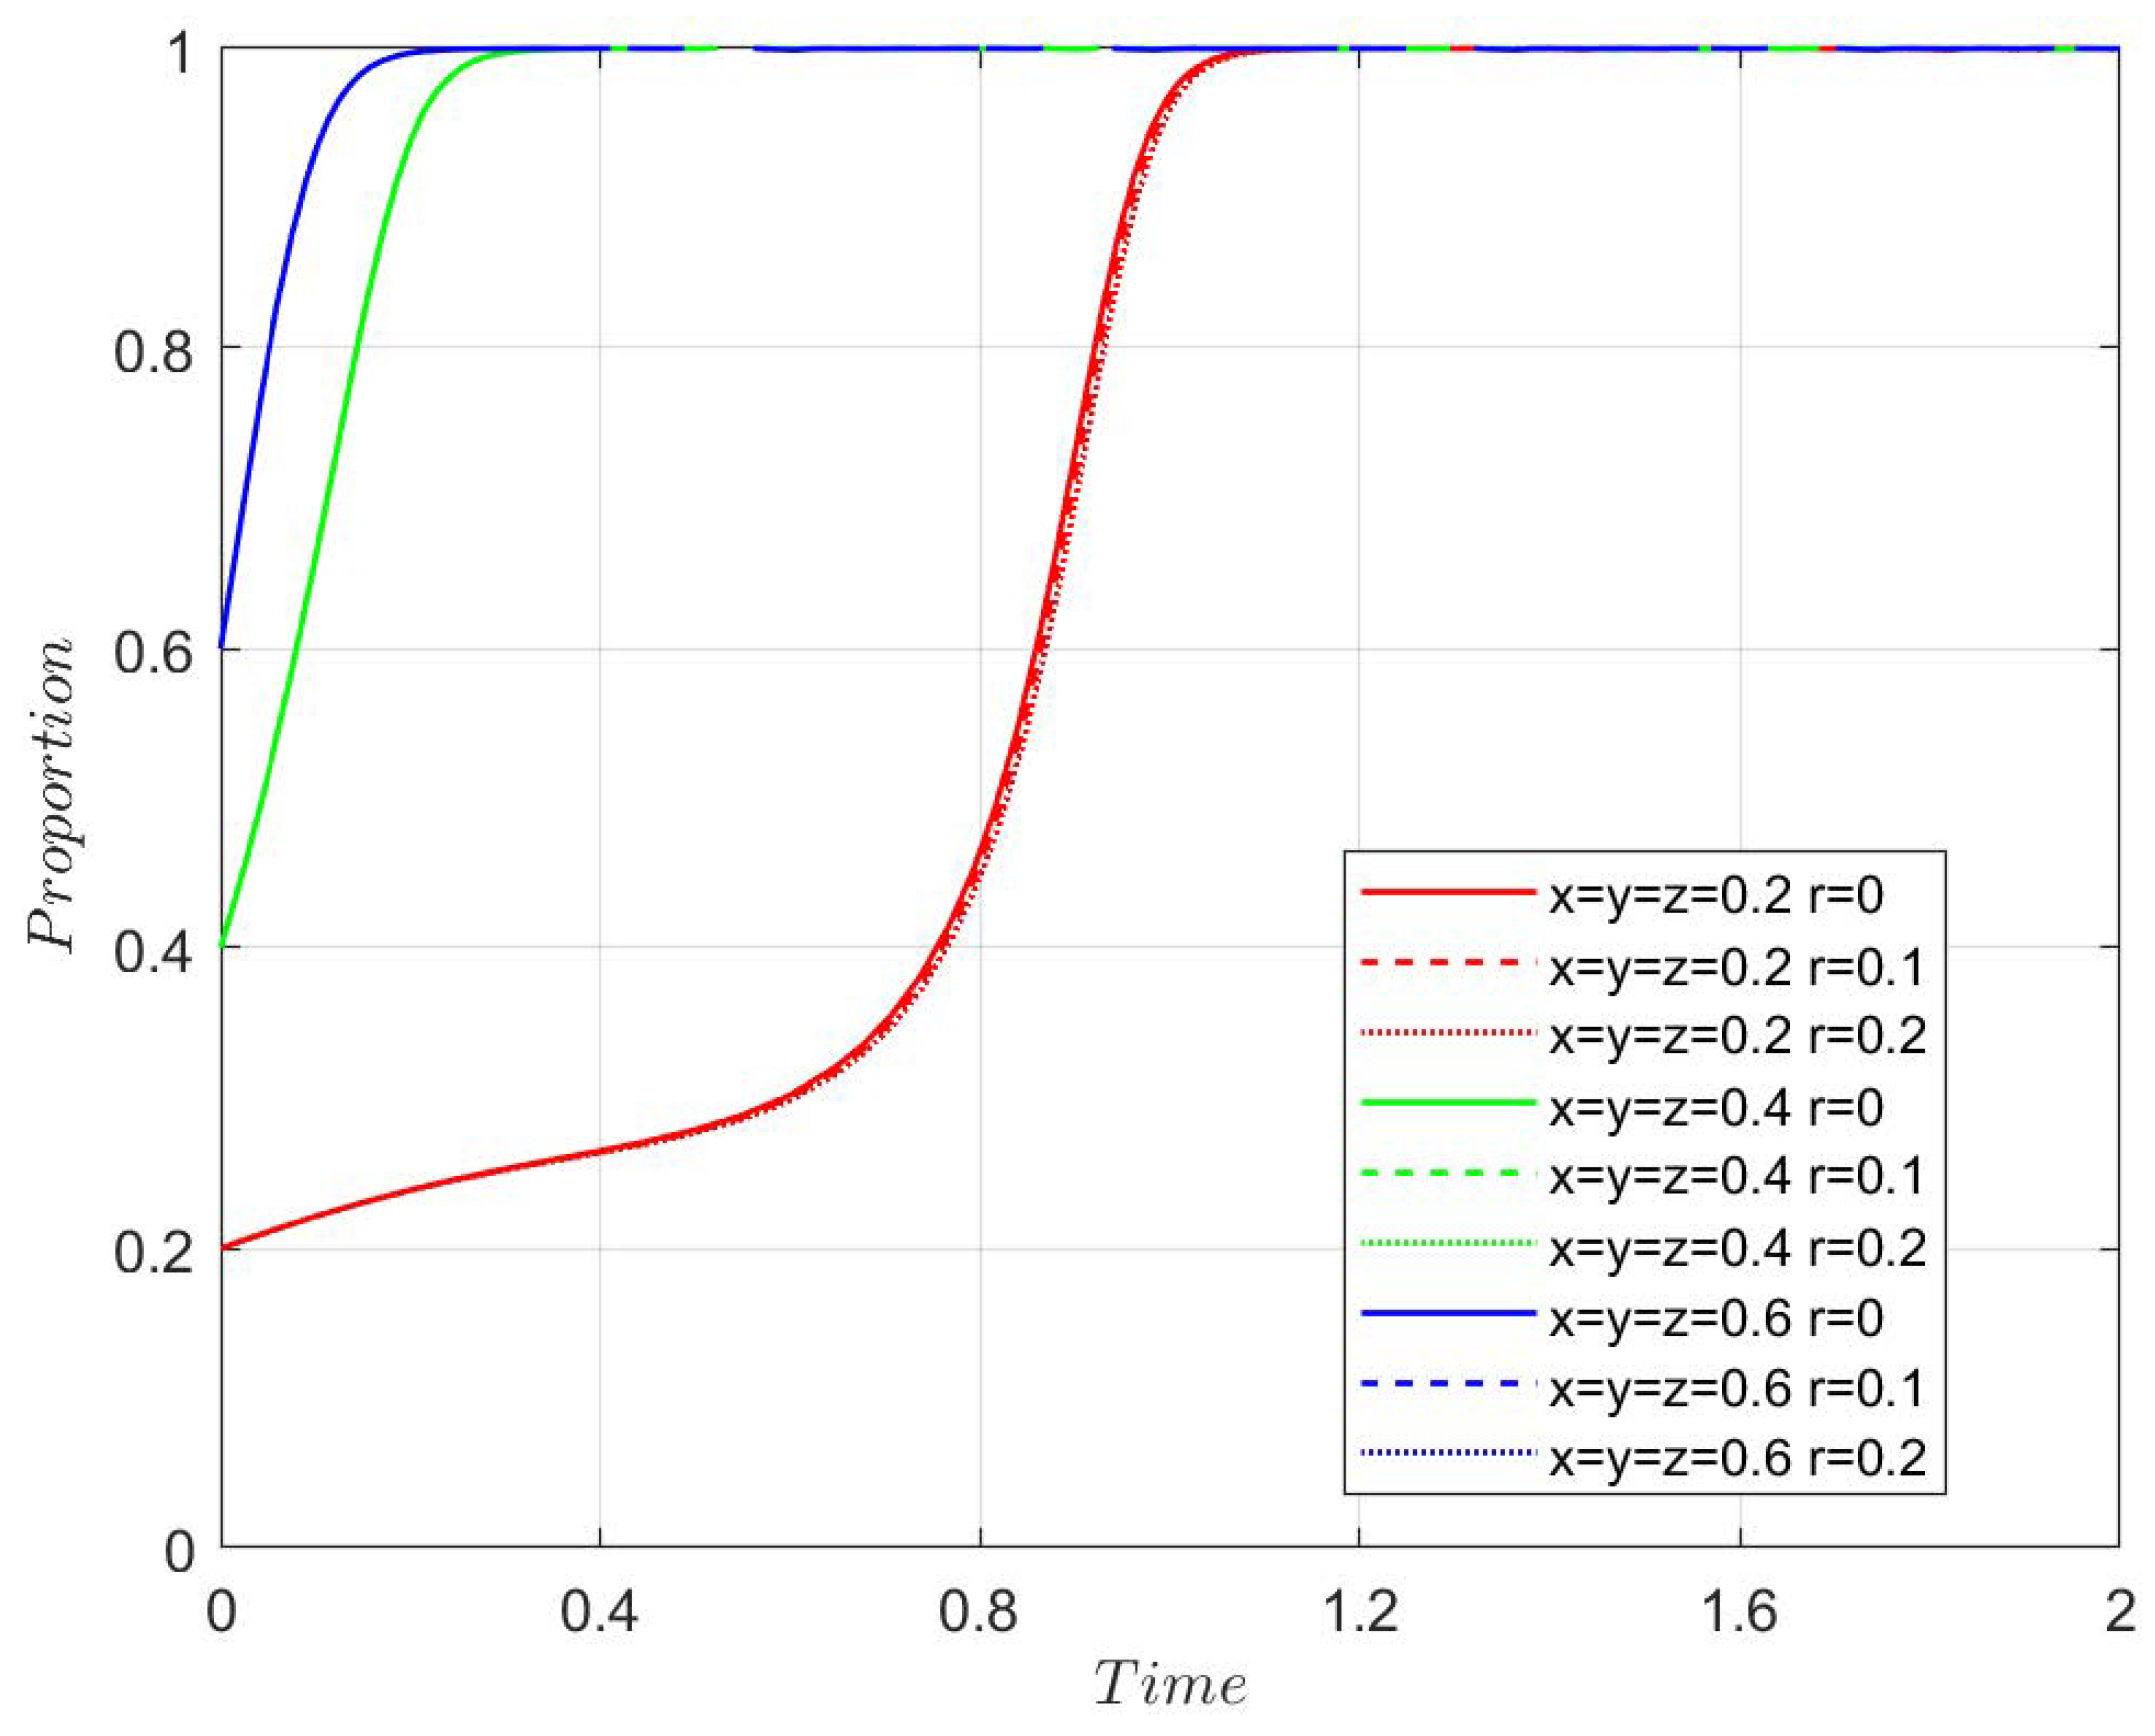
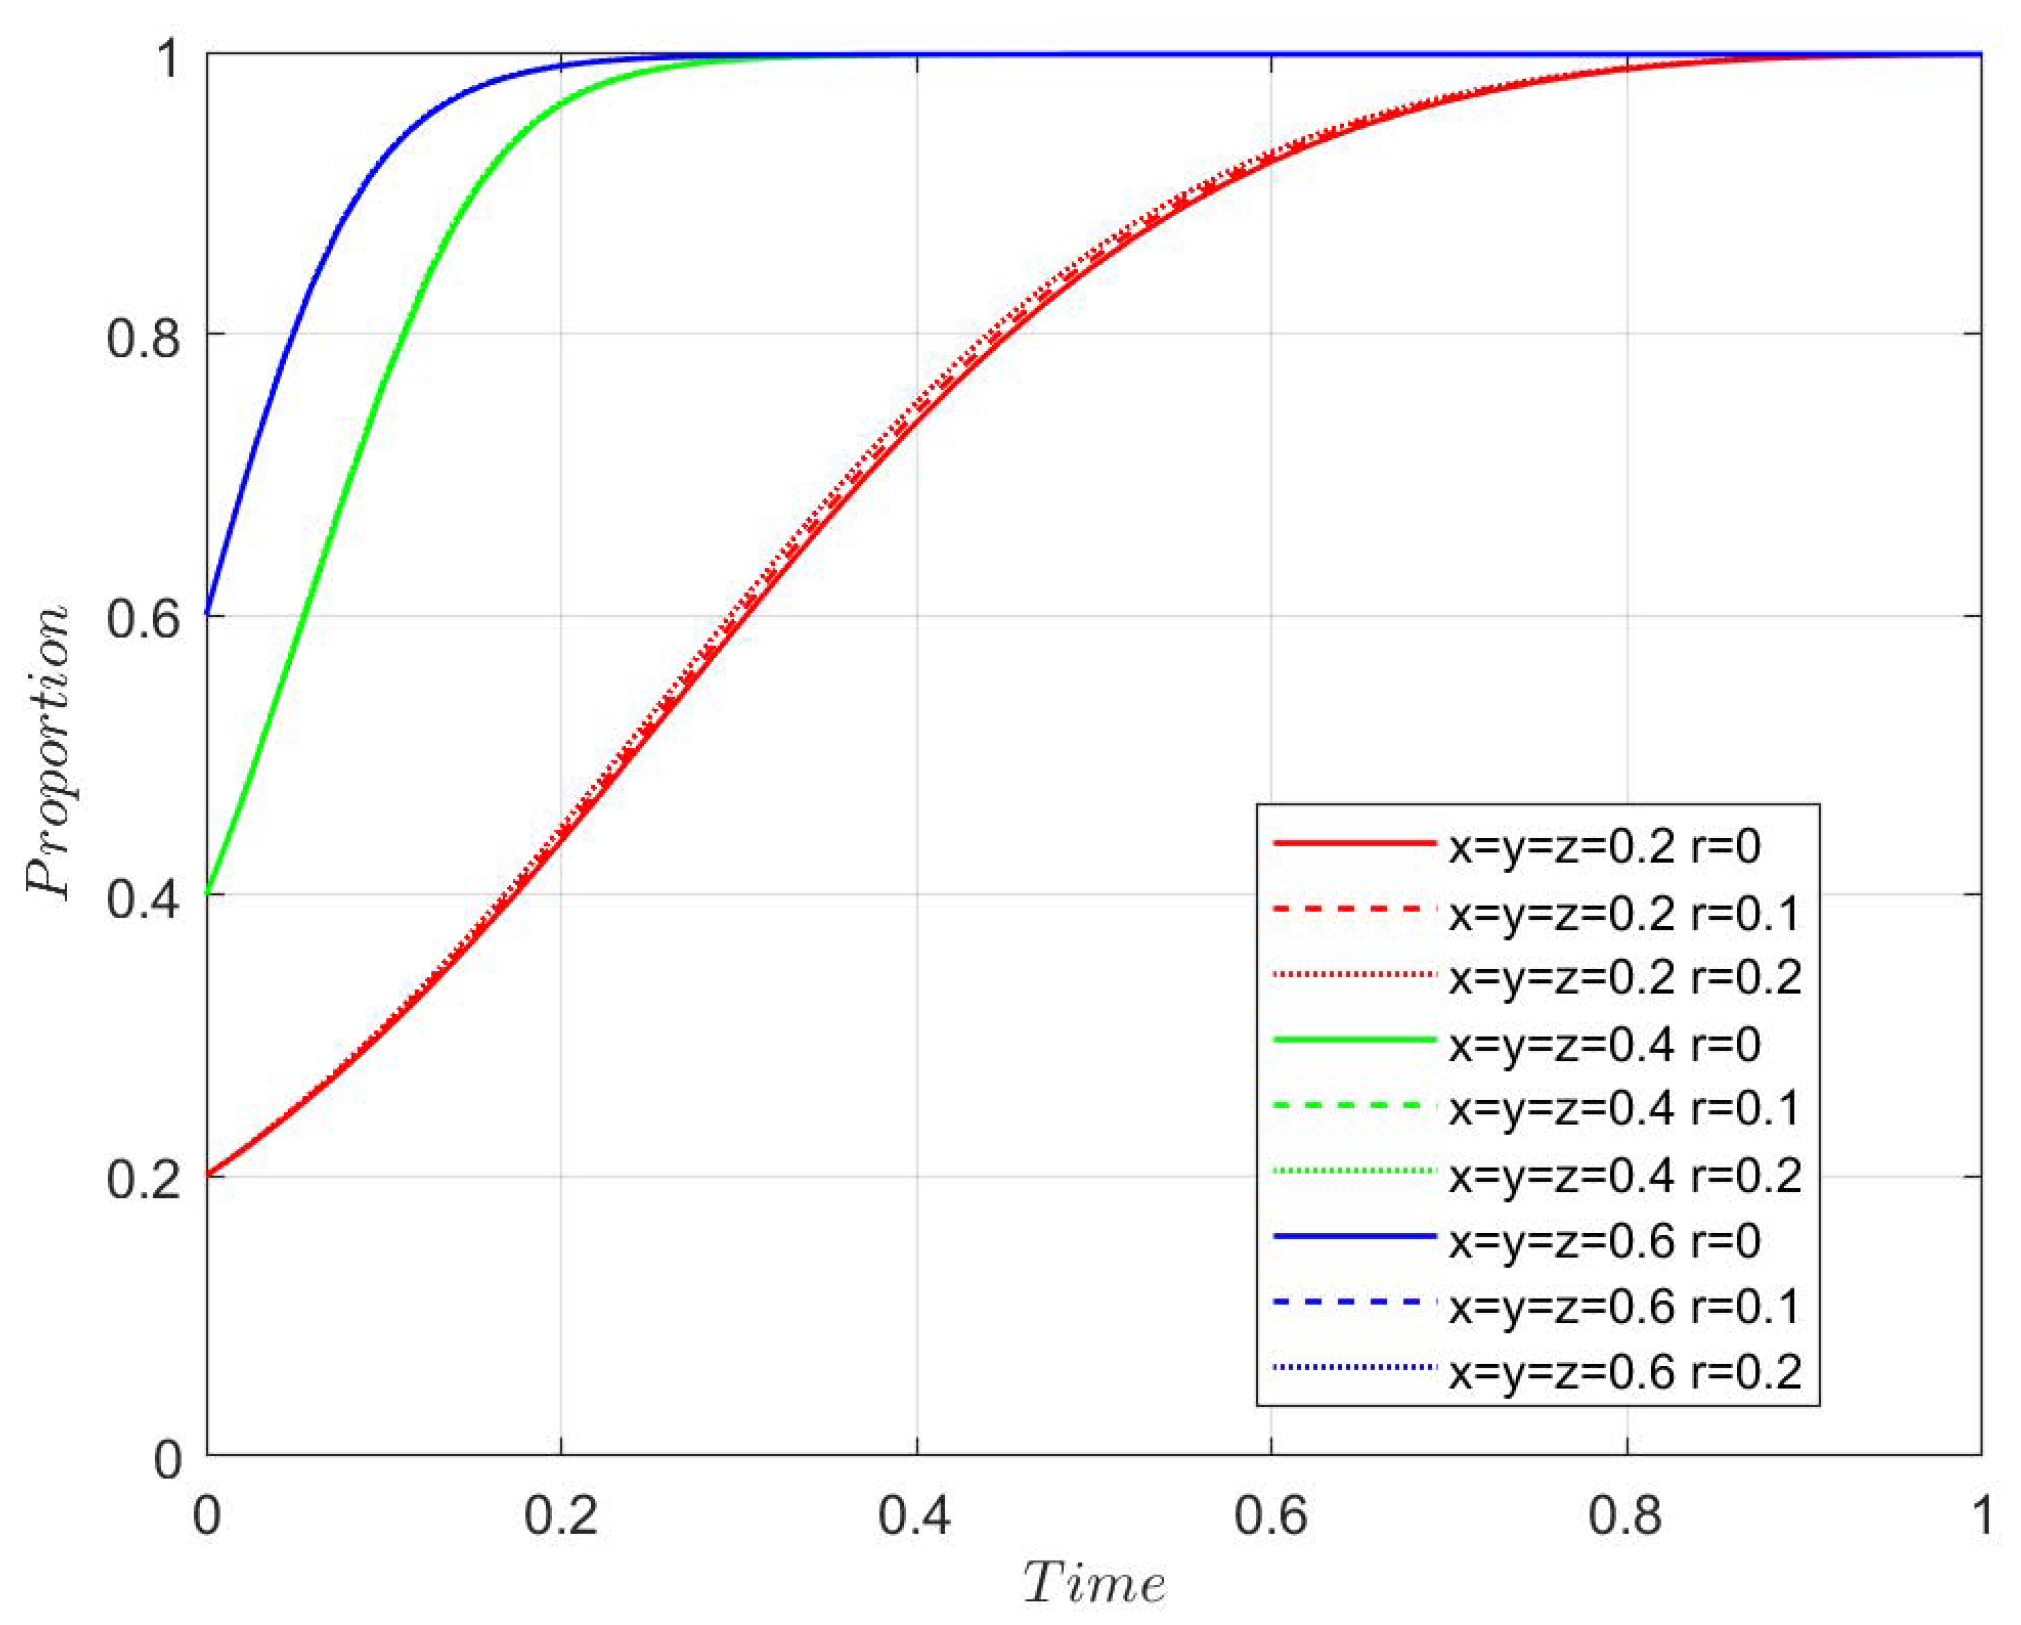
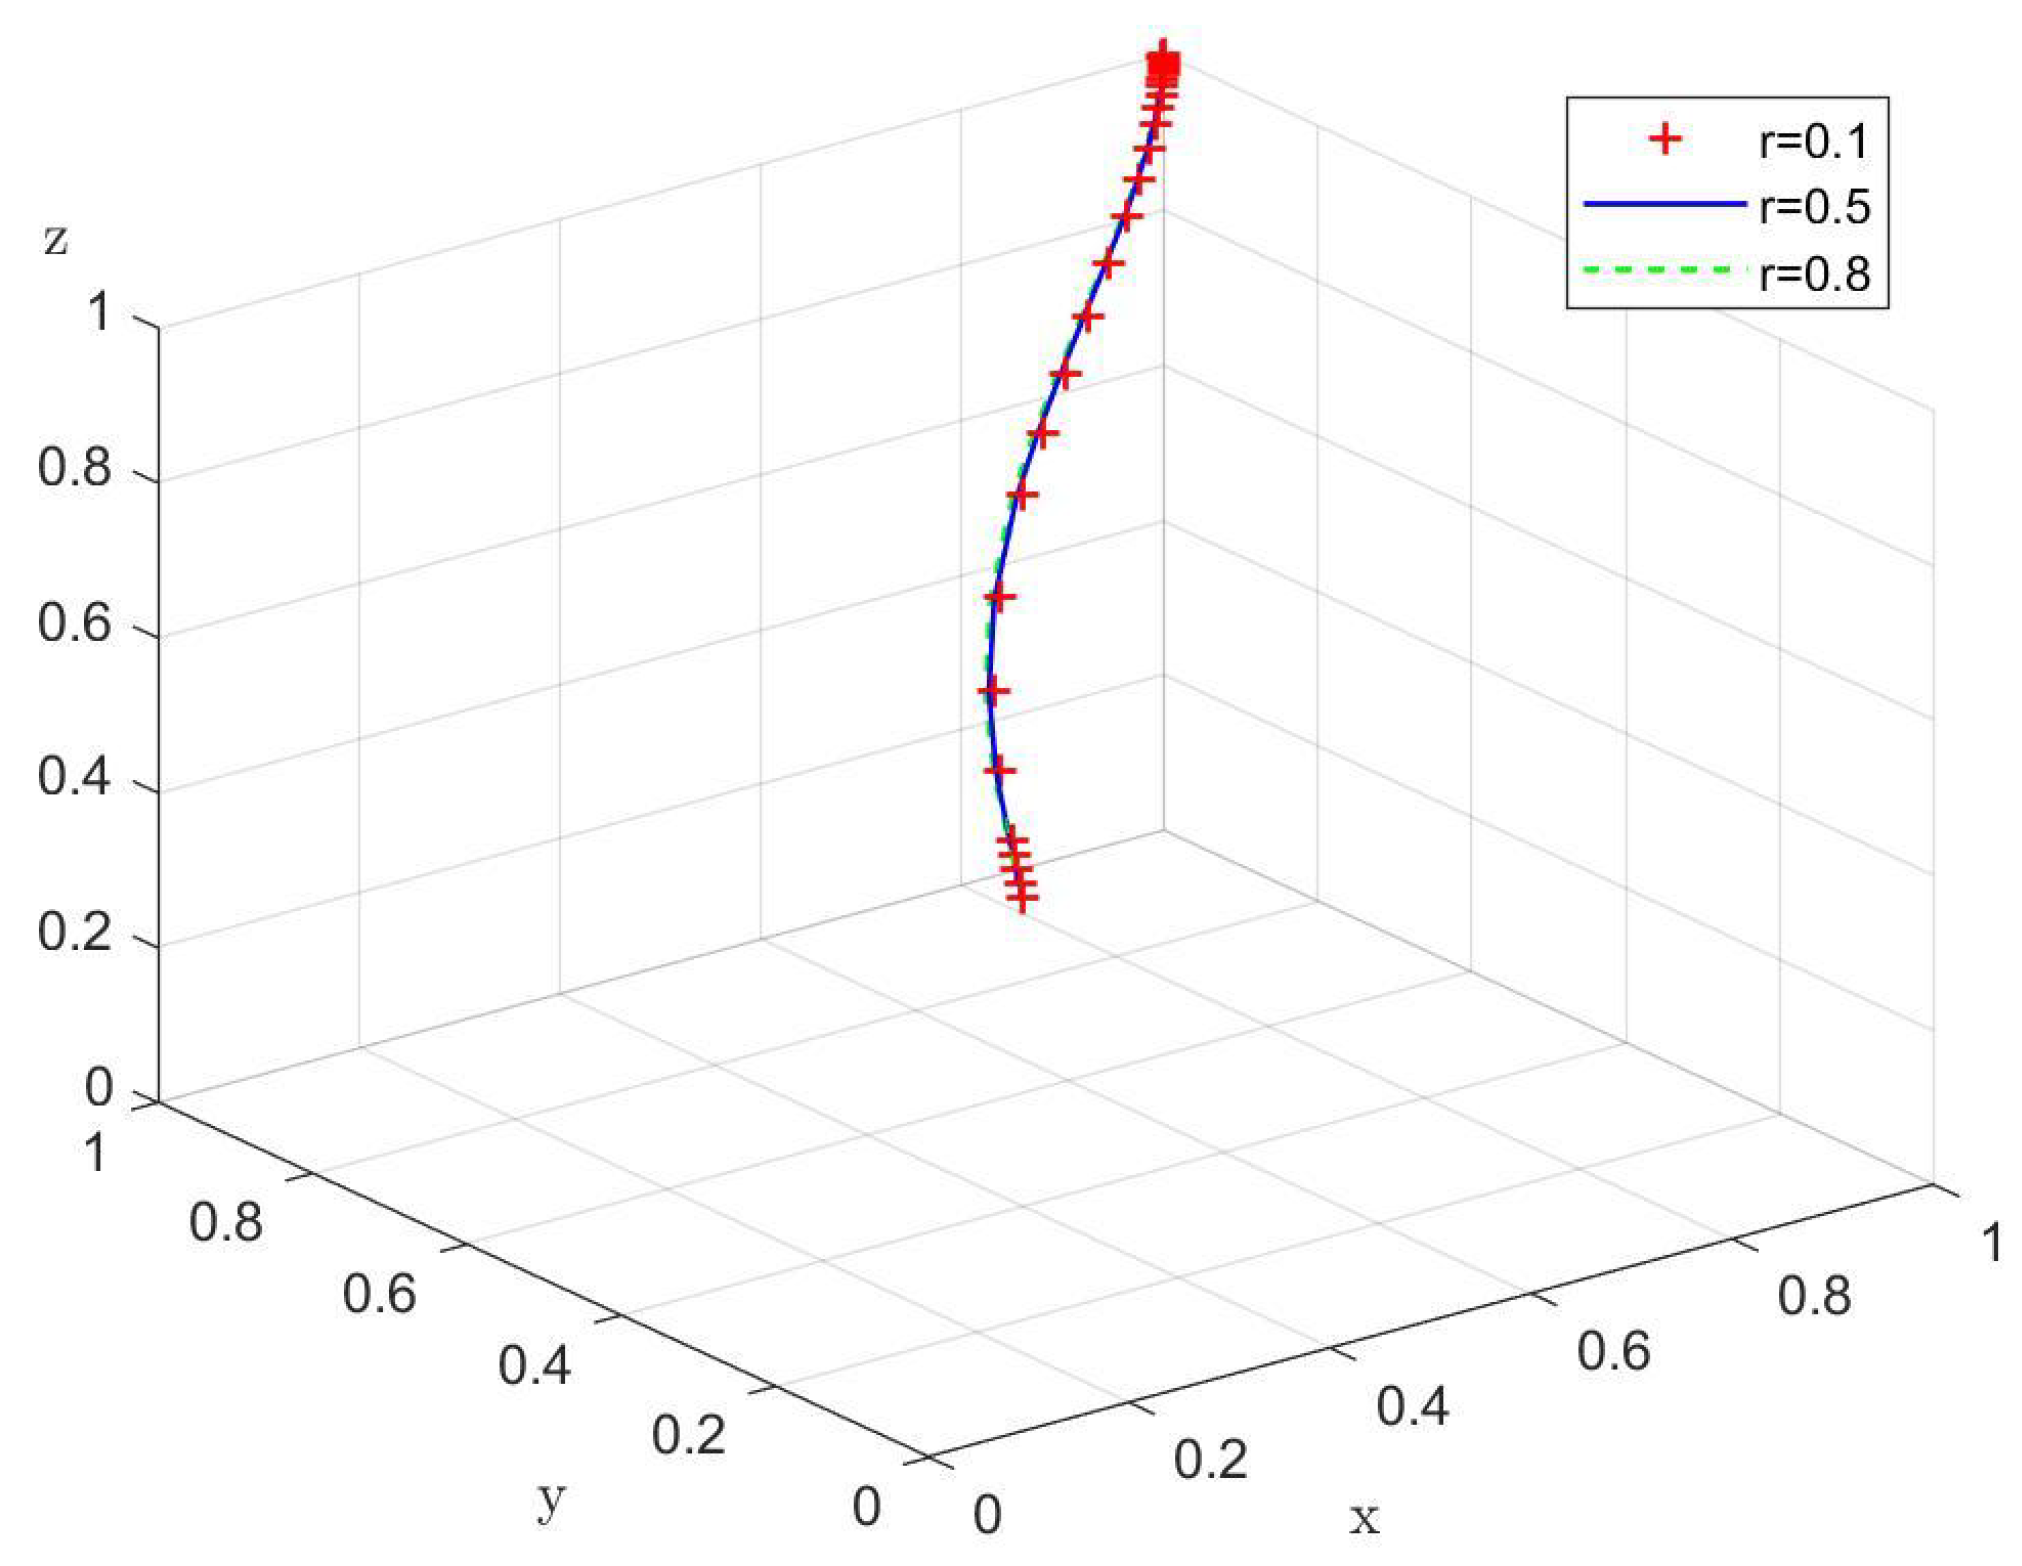
Figure 7,
Figure 8,
Figure 9 and
Figure 10 show the system’s evolution under different values of
r. No matter what the value of r and the initial strategy probability are, the system evolves to the stable point
, where the stable strategy is subsidy, innovative transformation, and new quality production materials. The analysis shows that the extent to which agricultural enterprises assist farmers has a relatively small impact on the evolution process.
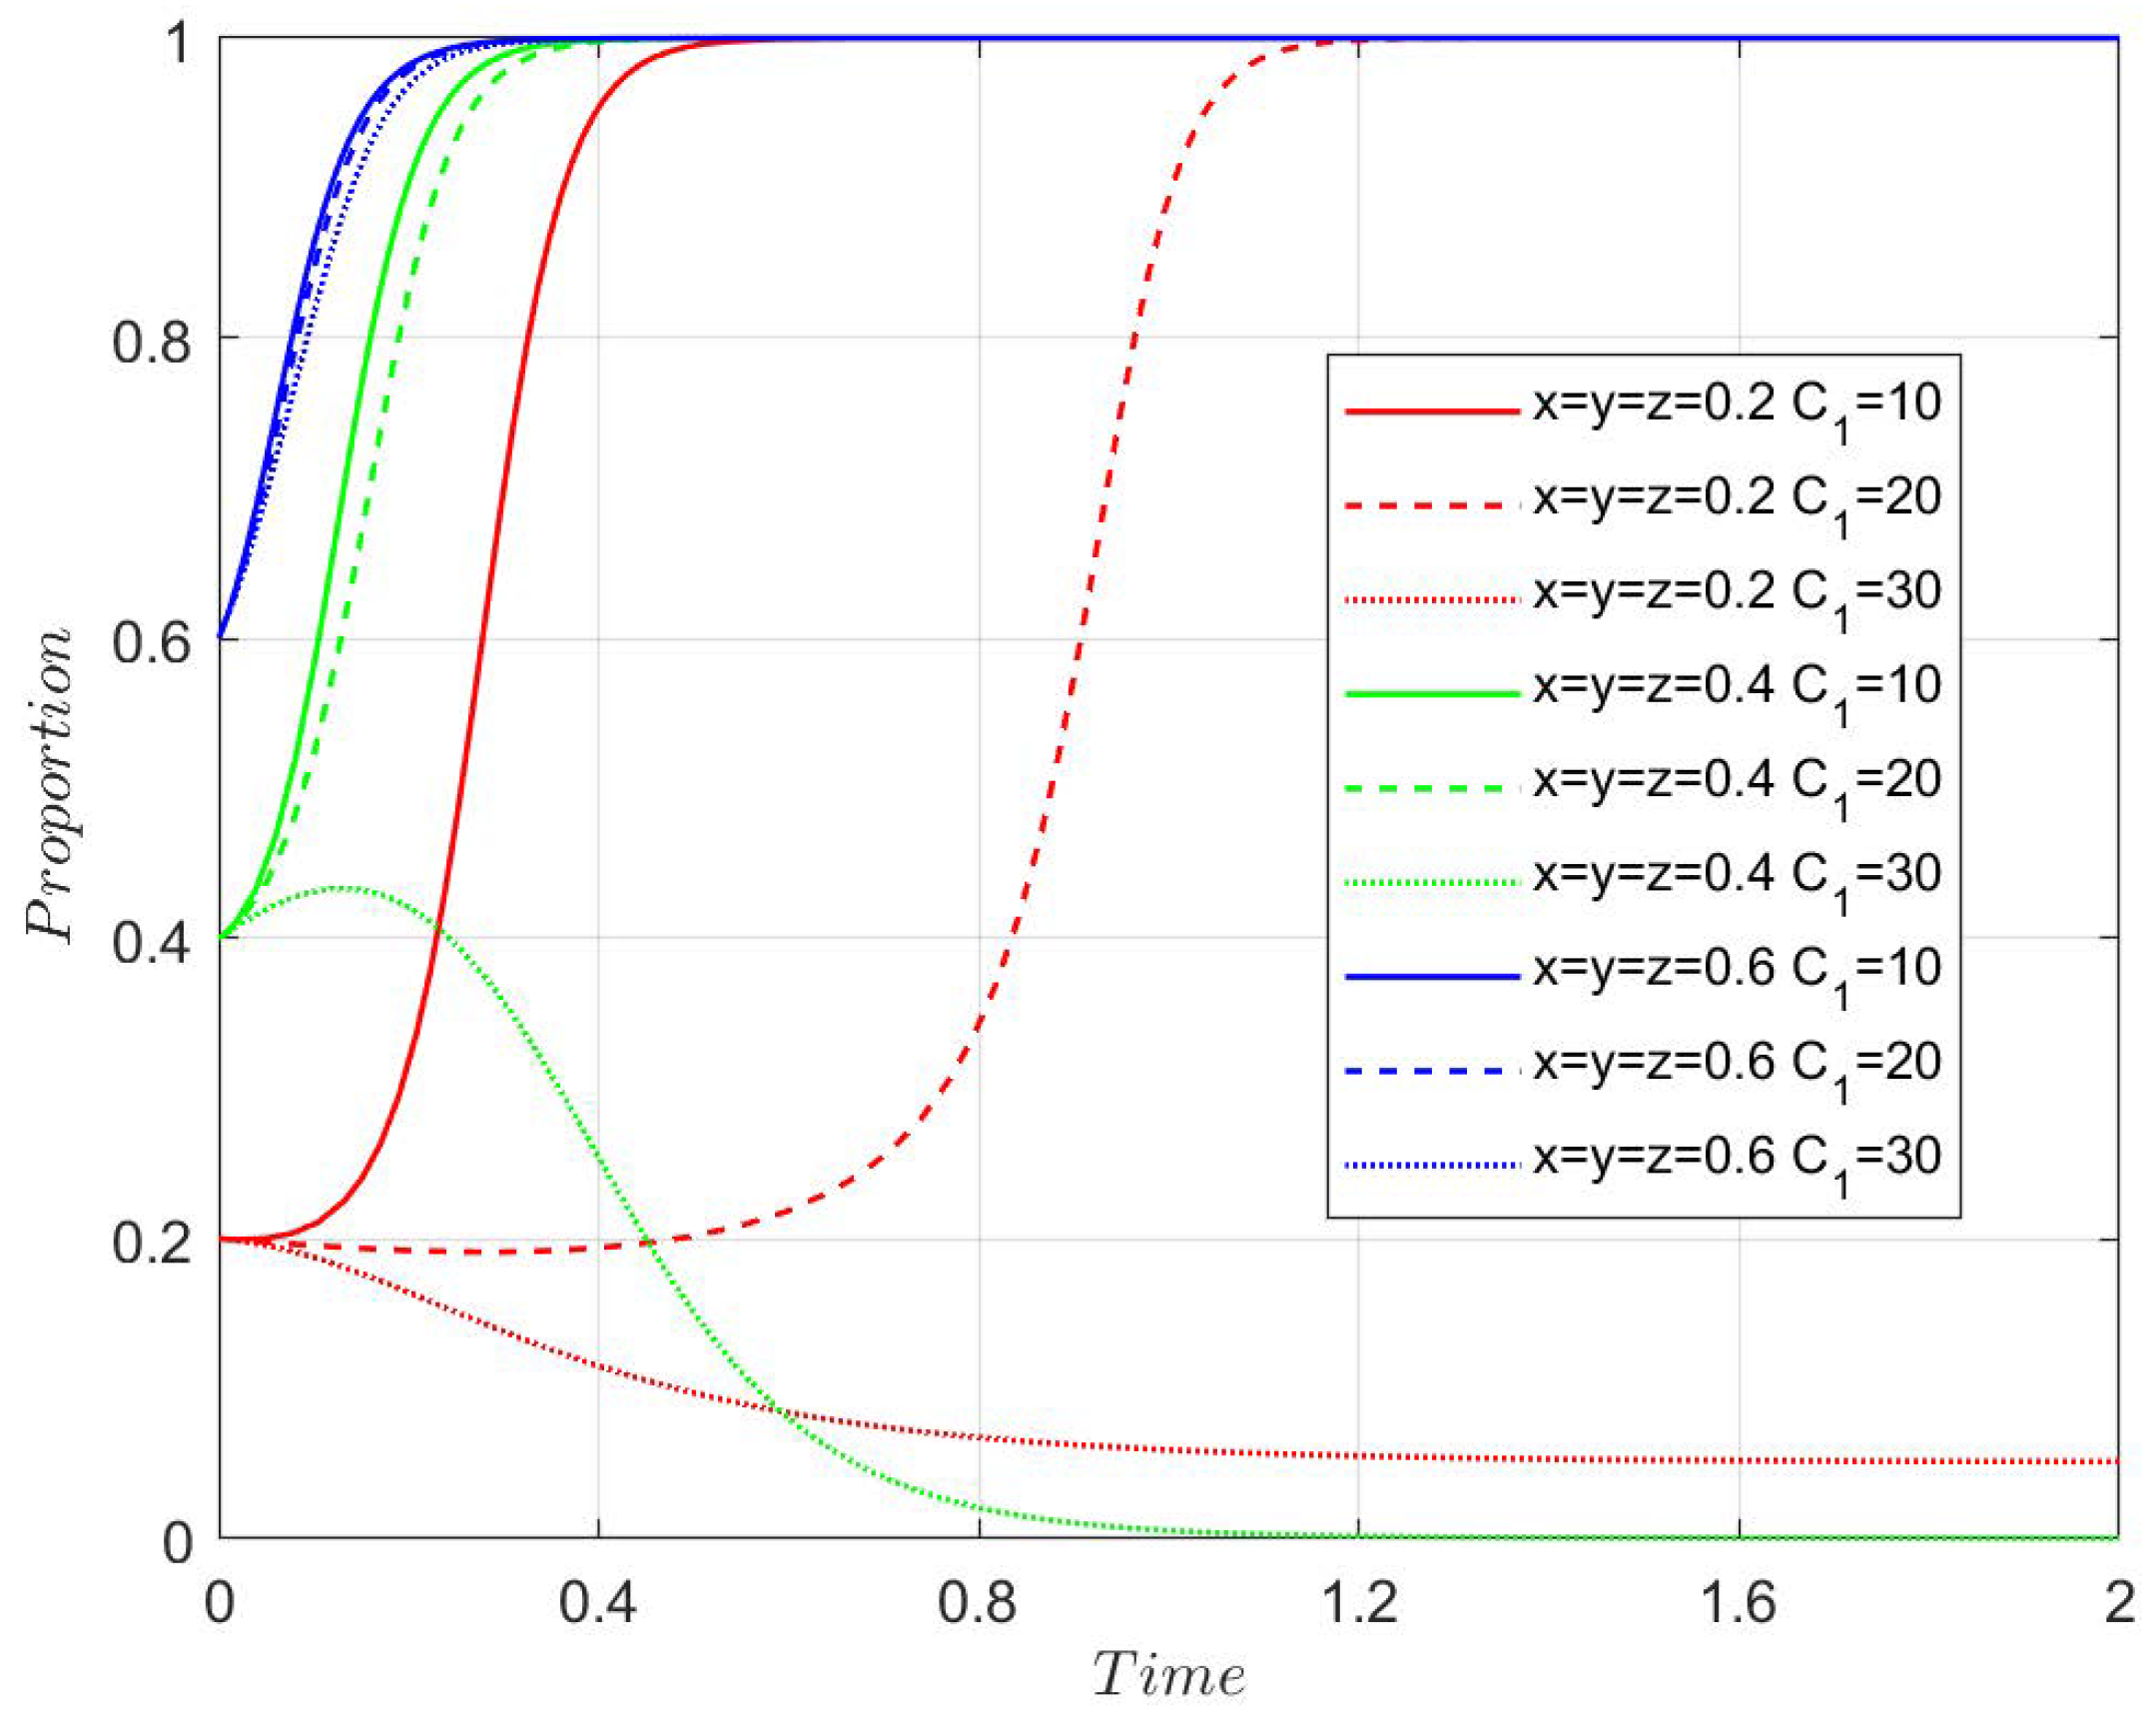
4.3.2. Government Initial Infrastructure Cost
Figure A4,
Figure A5,
Figure A6 and
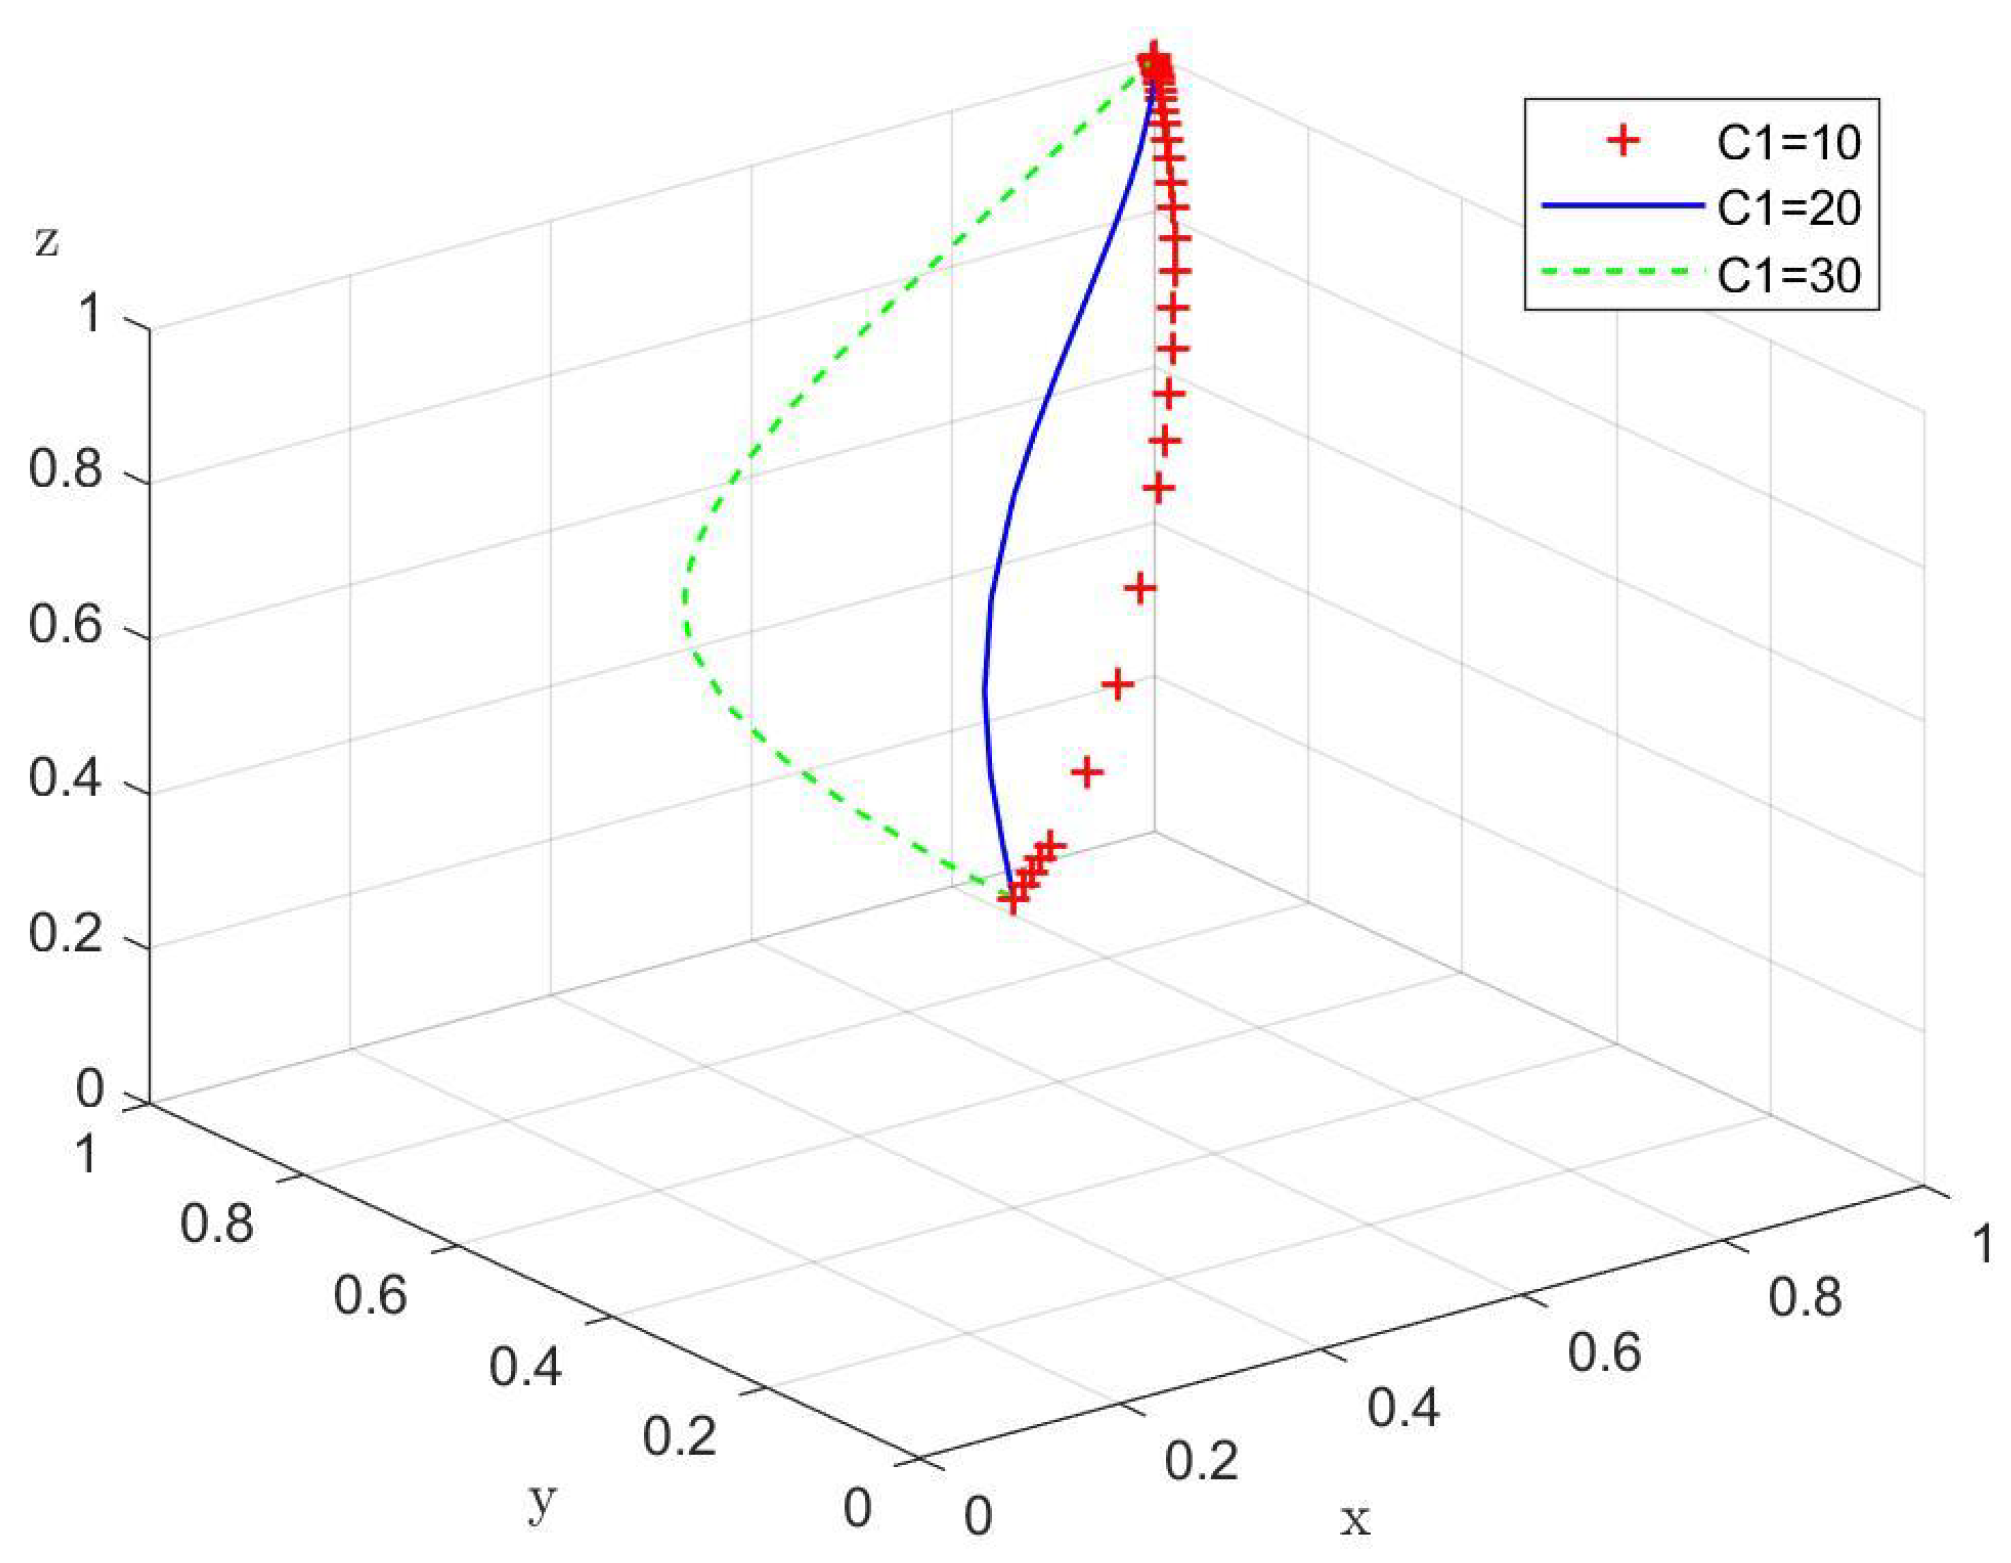
Figure A7 demonstrate how different values of C1 influence the system. When
, the system stabilizes at
, with the strategy being subsidy, innovative transformation, and new-quality materials. The system converges faster with higher initial strategy probabilities. When
, the system evolves towards
, with the strategy being no subsidy, negative transformation, and traditional materials. This suggests that lower infrastructure costs facilitate the adoption of subsidies and new quality materials, while higher infrastructure costs may hinder the transformation process, causing enterprises to stick to traditional methods. The results emphasize the importance of balancing infrastructure investment with the policy’s long-term goals.
4.3.3. Farmers’ Subsidy Coefficient
Figure A8,
Figure A9,
Figure A10 and
Figure A11 analyze the sensitivity of the system to the farmers’ subsidy coefficient
. When
, the system consistently evolves to the stable point
, where the strategy is subsidy, innovative transformation, and new-quality materials. With an initial strategy probability of
, farmers first lean towards traditional production materials, but over time, as government and enterprises become more active, the system eventually stabilizes with new quality materials. The analysis indicates that increasing
accelerates farmers’ adoption of new quality materials and improves the overall stability of the system. The results suggest that governments should provide sufficient subsidies to encourage farmers to transition towards modern agricultural practices.
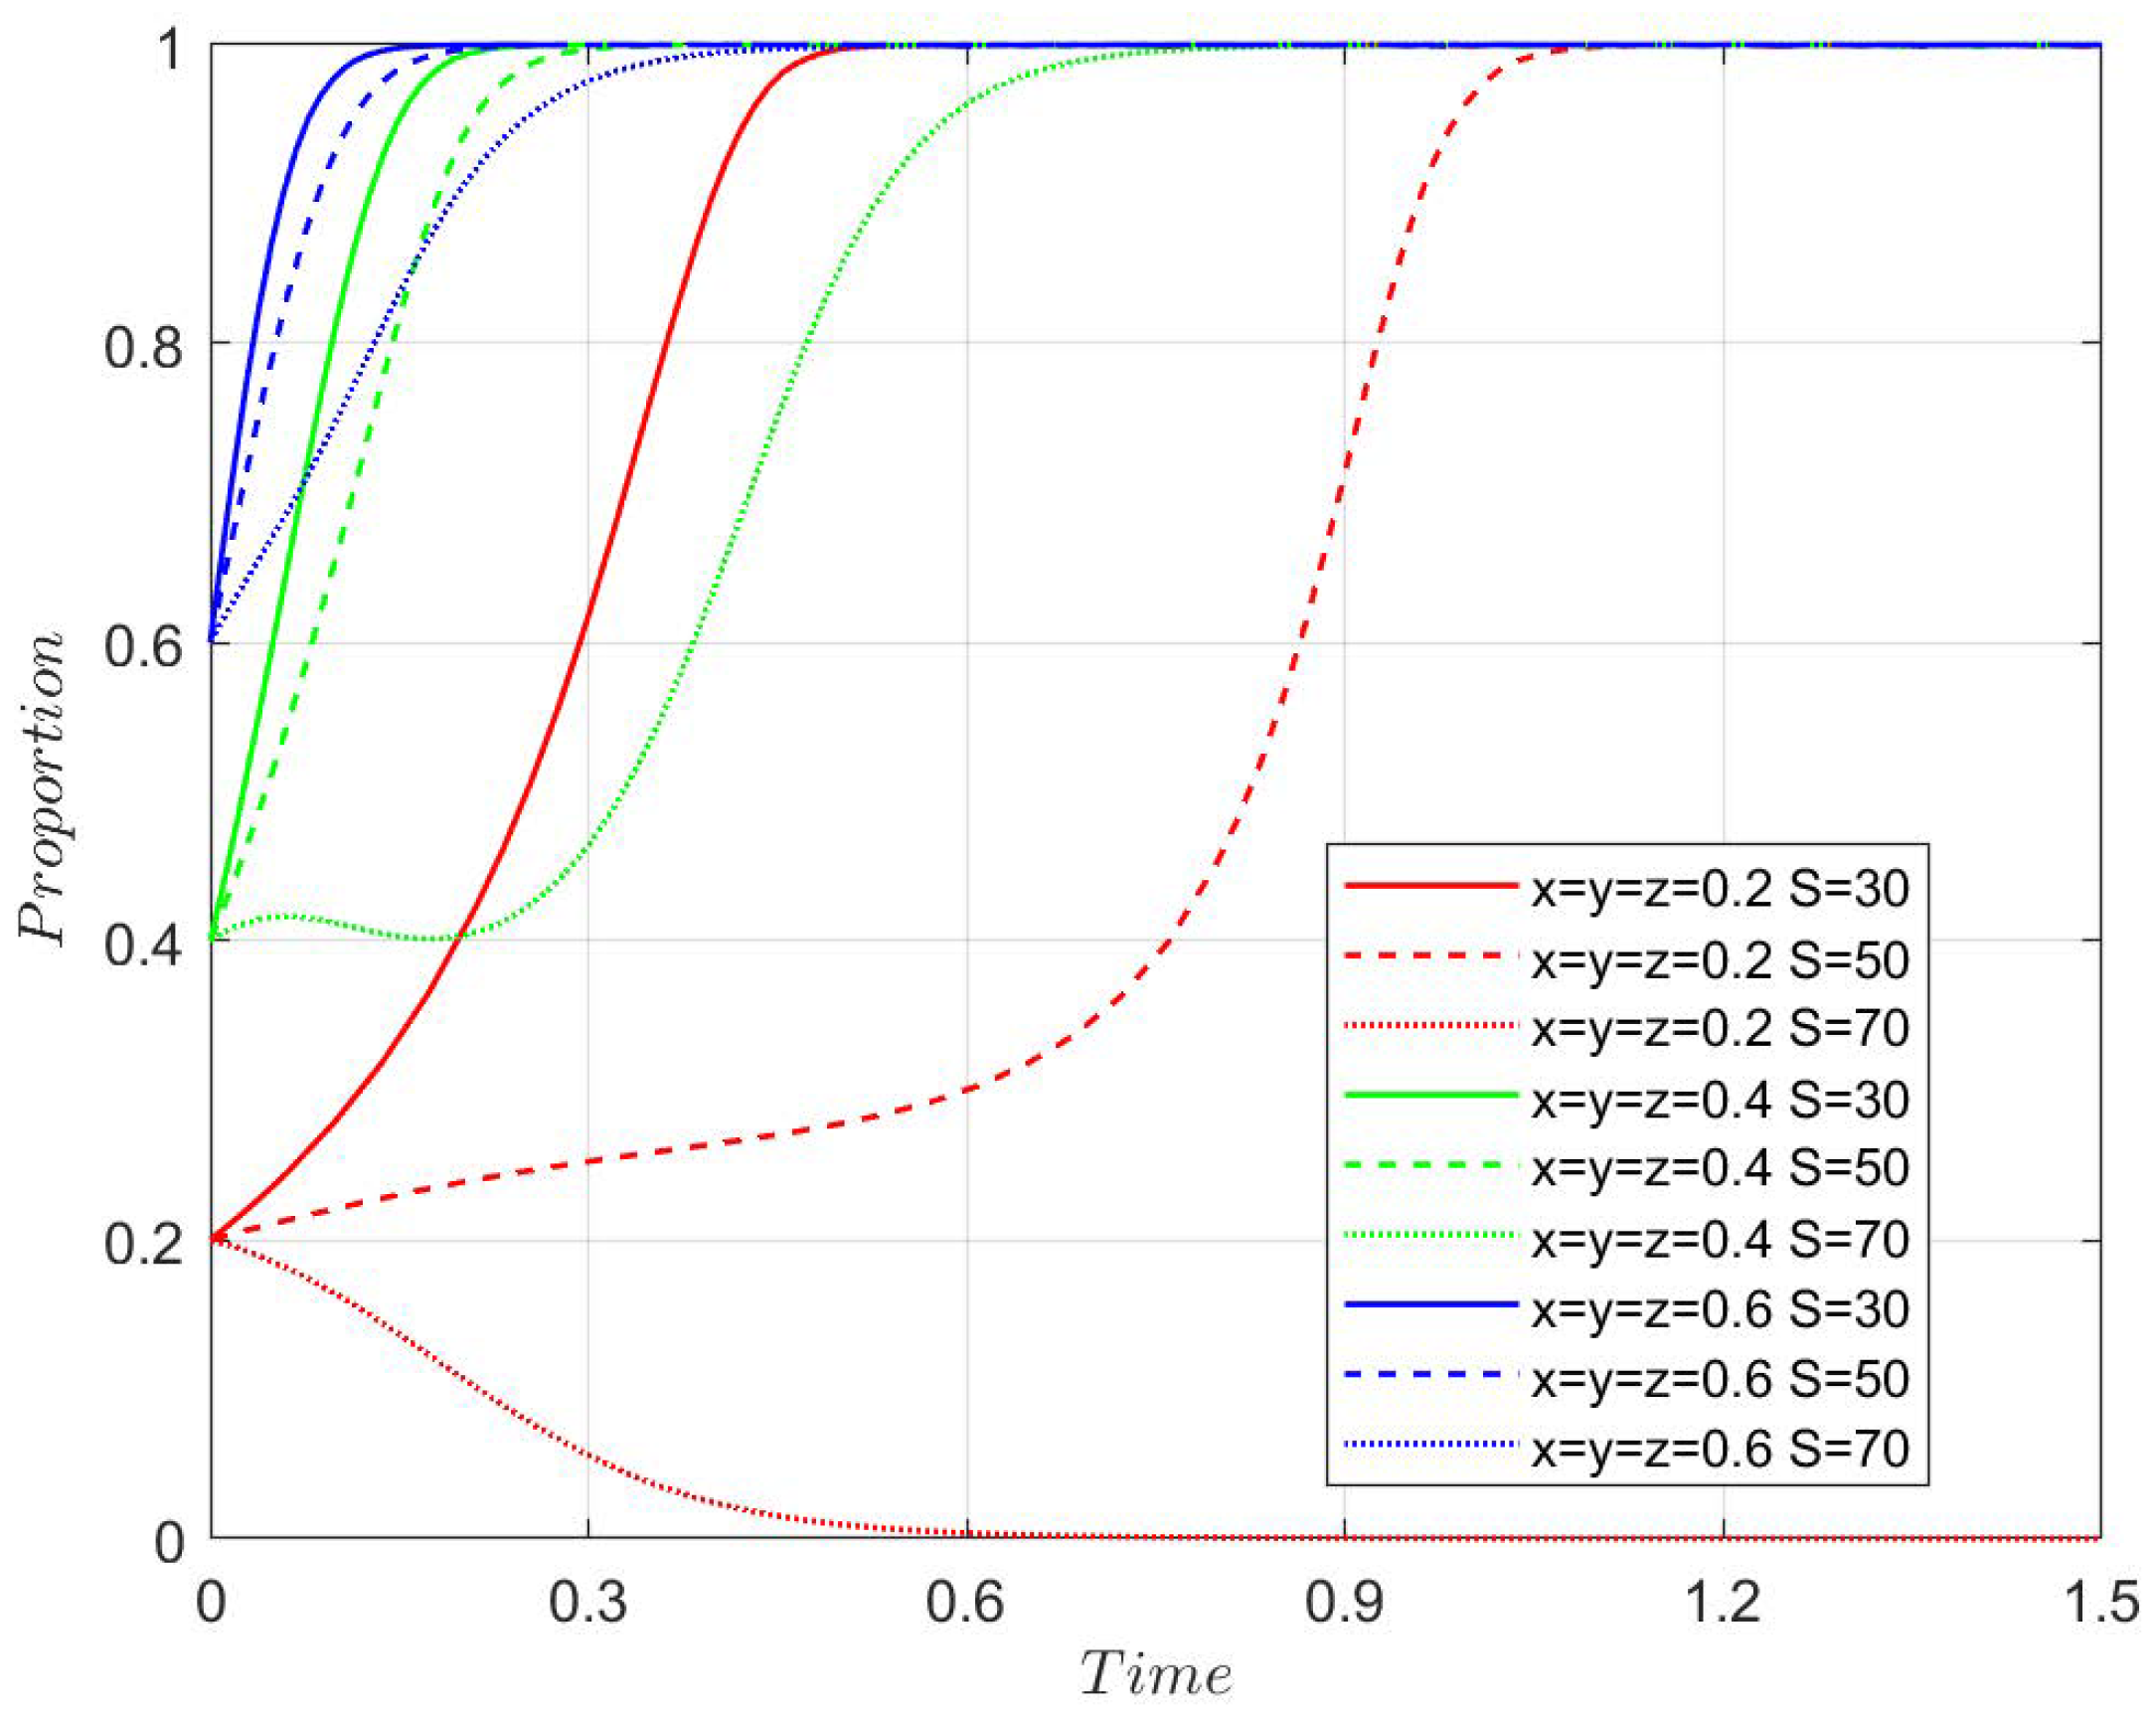
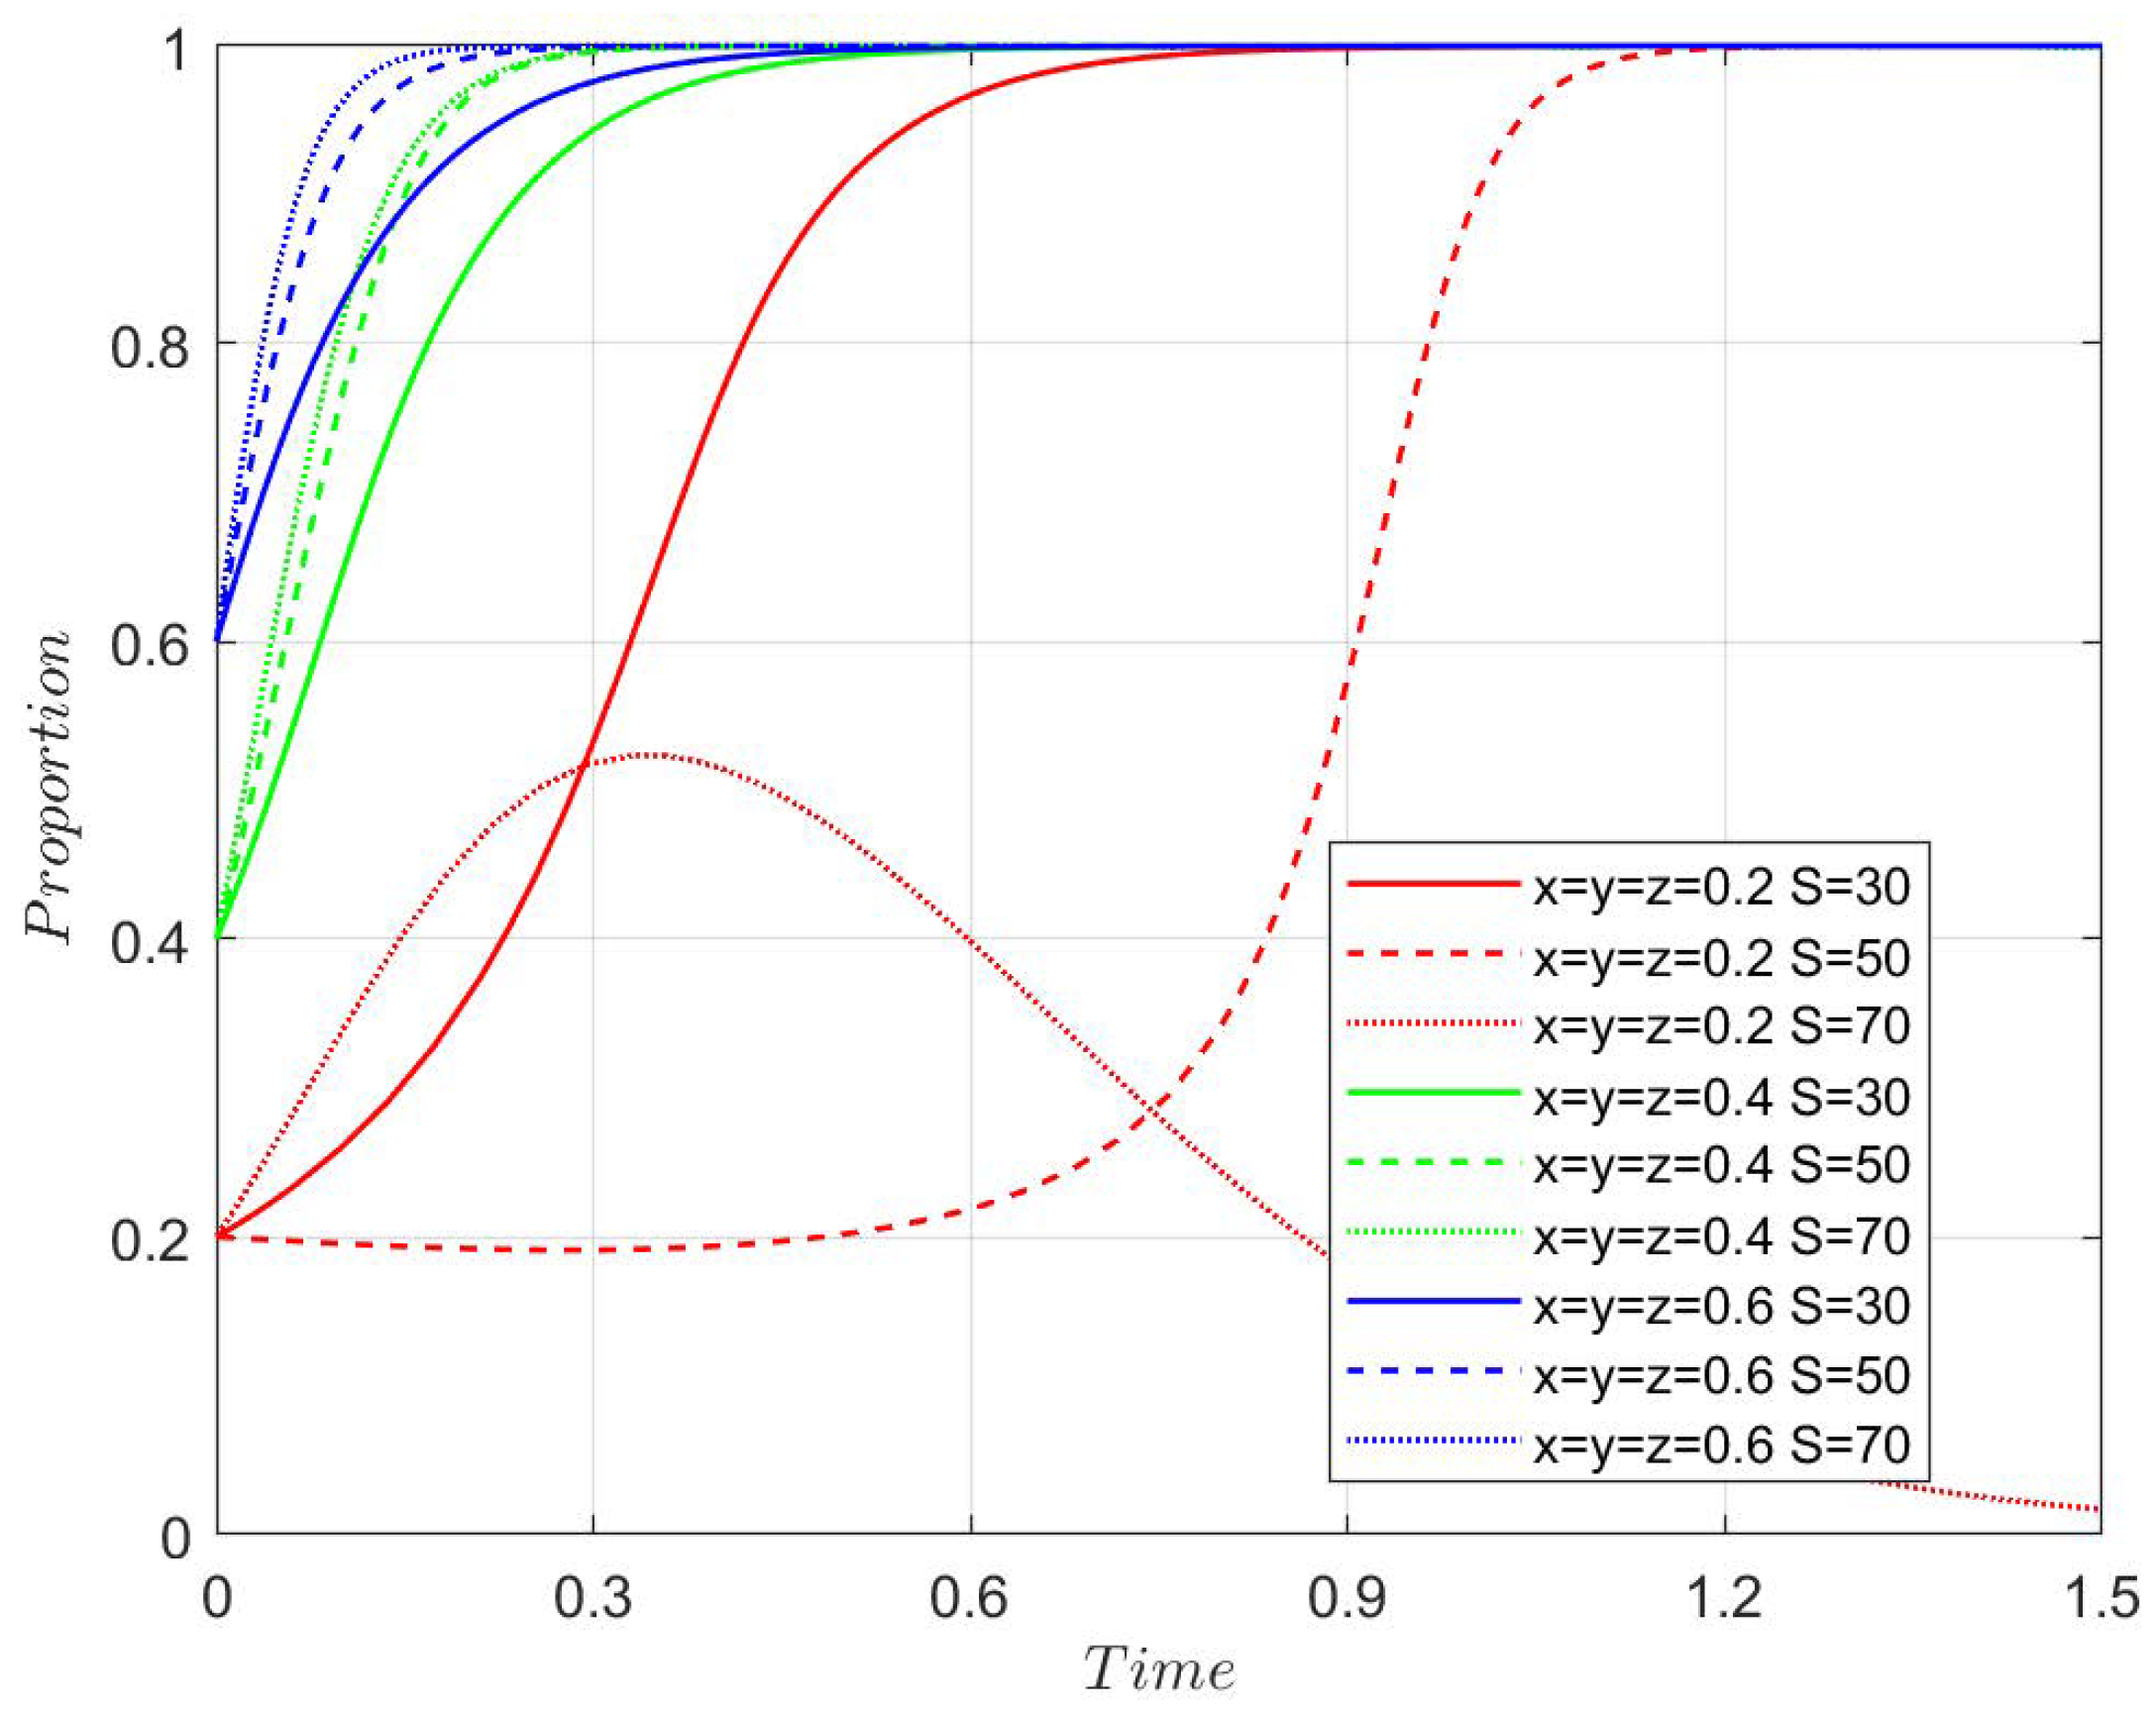
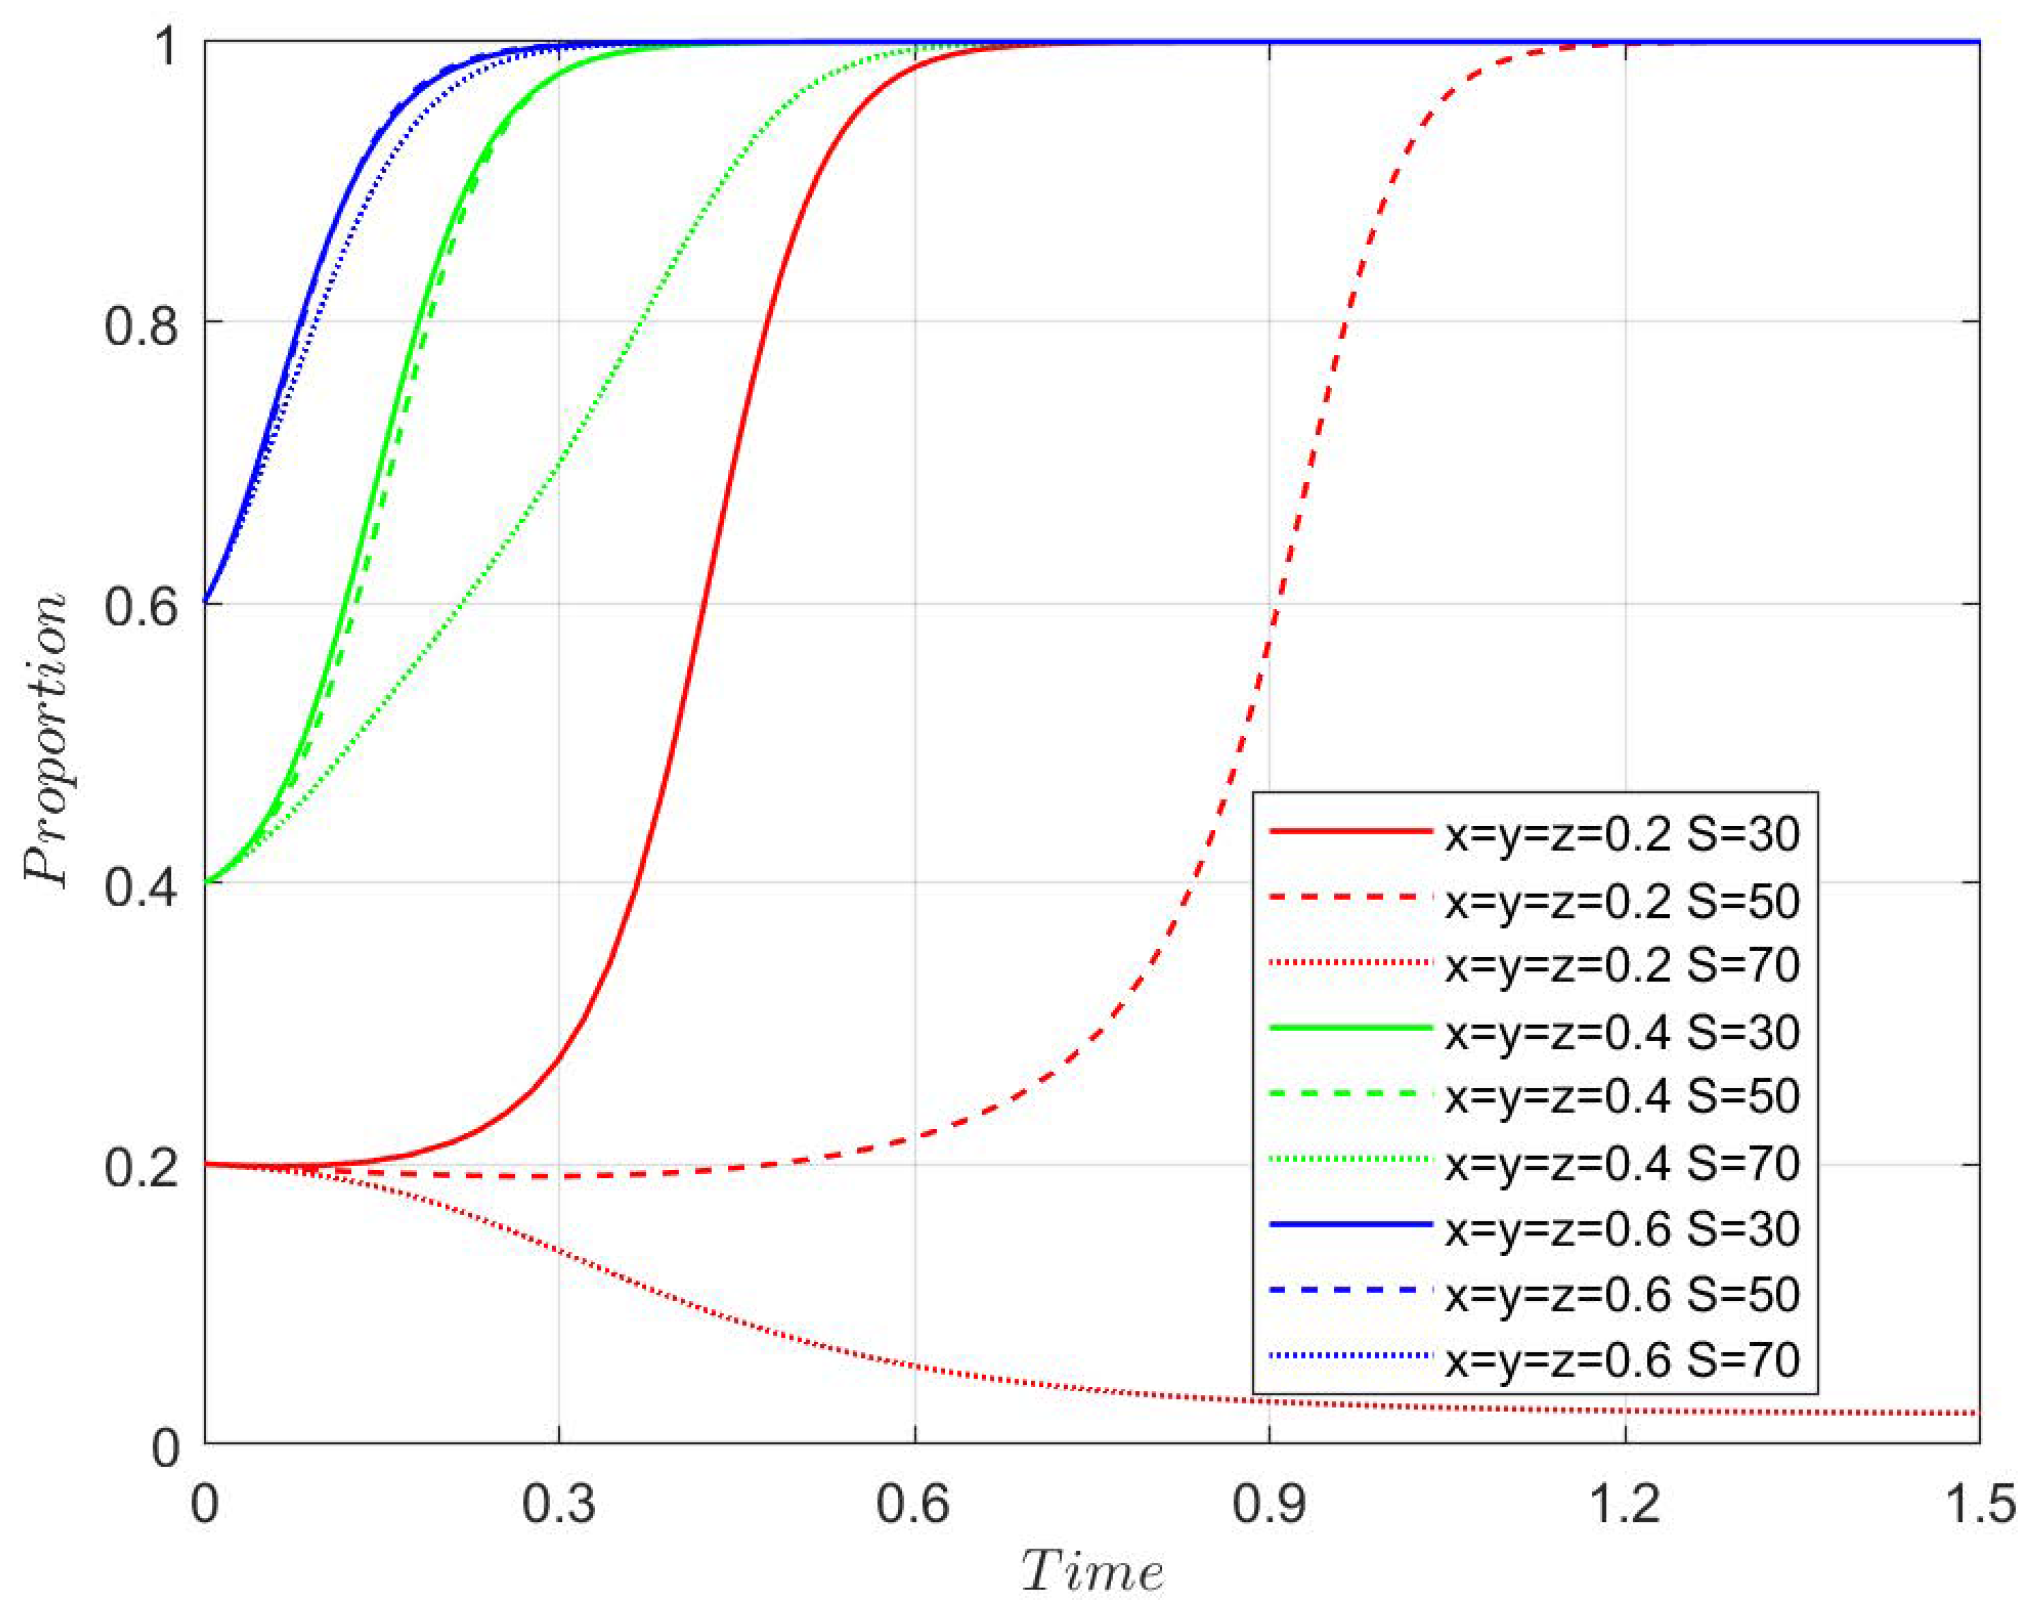
4.3.4. Government Total Subsidy Amount
Figure A12,
Figure A13,
Figure A14 and
Figure A15 show the effects of varying the total subsidy amount
S on the system. When
, the system evolves to the stable point
, with the strategy being subsidy, innovative transformation, and new-quality materials. When
, the system first moves towards
, then gradually shifts to
, and eventually evolves to
, with the strategy being no subsidy, negative transformation, and traditional materials. This analysis highlights that a reasonable distribution of subsidies between agricultural enterprises and farmers is crucial for the system’s long-term stability. The government needs to ensure that the subsidy amount is aligned with the desired transformation of both enterprises and farmers.
5. Conclusions
This paper considers the agricultural new quality productivity policy and its impact on farmers’ benefits, constructing a tripartite evolutionary game model involving the government, agricultural enterprises, and farmers. The paper analyzes the stability of strategy combinations and the influence of various factors. Numerical simulation analysis has been conducted to verify the stability and sensitivity of the system.
The evolutionary game analysis and numerical simulations conducted in this study reveal that the convergence of the system to the desired equilibrium (subsidy, innovative transformation, new-quality production materials) is primarily determined by the cost-benefit structure for the three parties and the presence of positive synergistic effects among their strategies.
Driving Forces of Government Behavior: The government’s strategic choice is driven by a trade-off between the costs of infrastructure construction and the comprehensive benefits it accrues. As established in Proposition 1 and the sensitivity analysis, the government’s willingness to subsidize is stronger when infrastructure costs are lower, or when the objective benefits from enterprises and farmers (e.g., tax revenue, employment, social stability, ecological benefits) are sufficiently high. Conversely, high infrastructure investment becomes a fiscal burden, discouraging subsidy provision. This underscores that the sustainability of the policy is contingent upon the long-term positive externalities it generates.
Decision-Making Logic for Enterprise Transformation: Whether an agricultural enterprise undertakes innovative transformation depends on whether the additional operational and non-operational income can offset the associated R&D and support costs. As shown in Proposition 2, government subsidies act as a crucial catalyst by reducing the effective cost for enterprises. More importantly, while the enterprise assistance coefficient had a relatively modest direct impact in our parameter setup, its mechanism is vital: by lowering the adoption cost for farmers, it indirectly expands the market for new-quality production materials, thereby creating more stable demand for enterprises. This establishes a positive feedback loop: enterprise support for farmers—increased farmer adoption—greater benefits for enterprises.
Critical Factors for Farmer Adoption: Farmers, as risk-averse agents, base their decisions on a straightforward cost-benefit comparison. The motivation to adopt new technologies is strongest when the net income from new-quality production materials significantly exceeds that from traditional methods, and is further bolstered by government subsidies and enterprise technical support. Improvements in rural infrastructure enhance the attractiveness of new-quality materials by boosting overall production efficiency.
The findings and policy recommendations are as follows: Government Subsidies and Infrastructure Investment: The government must carefully consider subsidies and infrastructure investments to ensure that the policy is effective. Excessive subsidies may harm long-term sustainability, while insufficient investment may hinder transformation.
Diverse Subsidy Forms: The government should diversify subsidy forms, moving beyond fixed subsidies to incentivize agricultural technological innovation and talent development. Establishing specific reward programs for technological breakthroughs in agriculture will enhance the innovation capacity of enterprises.
Training New Agricultural Talents: The government should increase investment in the training of new agricultural talents, integrating the cultivation of “new farmers” into the core strategy for agricultural modernization.
Active Transformation by Agricultural Enterprises: Enterprises should embrace the opportunities provided by technological advancements and implement proactive transformation strategies to improve core competitiveness and market influence.
Building Stronger Linkages with Farmers: Enterprises must strengthen the profit linkages with farmers by providing training, technical support, and risk insurance. This will encourage farmers to adopt new quality production materials and improve the sustainability of the agricultural transformation.
6. Discussion
This study constructs a tripartite evolutionary game model to analyze strategic interactions among the government, agricultural enterprises, and farmers under the “New Quality Productive Forces” policy. Simulations identify key determinants of system evolution, revealing that the pathway to full cooperation hinges on balanced subsidy allocation, cost-effective infrastructure, and proactive enterprise support.
The interpretability of these findings, however, is bounded by several methodological considerations. A primary limitation stems from the model’s empirical grounding. As the policy is newly implemented, comprehensive real-world data for precise parameter calibration is not yet available. The parameter values applied in our simulations were thus derived from the analogous literature on agricultural technology adoption [
21,
22,
23] and calibrated to ensure economic plausibility. While this approach is established for theoretical exploration, it underscores that our conclusions are conditional on the chosen parameter set. Future research must prioritize empirical validation through econometric analysis of survey data or case studies once policy outcomes become observable.
A key simplification is our assumption of a perfectly credible government policy. In reality, political cycles and potential policy discontinuity can significantly impact stakeholder expectations. If farmers and enterprises anticipate that subsidies might be canceled by a future administration, their current willingness to adopt new technologies would diminish, potentially preventing the system from reaching the ideal equilibrium (1,1,1) predicted here. Future work should explicitly model policy credibility as a dynamic variable to capture this critical political-economic dimension.
Beyond these areas, extending the model to include more actors or spatial dimensions could capture greater systemic complexity. Despite these potential extensions, this study provides a foundational framework and identifies key leverage points to guide both policy design and future research on agricultural transformation.
