Article

An Elevation-Aware Large-Scale Channel Model for UAV Air-to-Ground Links

1
School of Internet of Things Engineering, Jiangnan University, Wuxi 214122, China
2
School of Communication and Artificial Intelligence, School of Integrated Circuits, Nanjing Institute of Technology, Nanjing 211167, China
*
Author to whom correspondence should be addressed.
Mathematics 2025, 13(21), 3377; https://doi.org/10.3390/math13213377
Submission received: 16 September 2025 / Revised: 16 October 2025 / Accepted: 20 October 2025 / Published: 23 October 2025

Abstract

This paper addresses the issue of existing research that fails adequately capture the spatiotemporal nonstationarity caused by the building of occlusion and flight dynamics in air-to-ground channels from unmanned aerial vehicles (UAVs) in urban scenarios. This study focuses on the angular-altitude correlations of three key metrics: path loss (PL), shadow fading, and the Ricean K-factor. A dynamic path-loss model incorporating the look-down angle is proposed, an exponential decay model for the shadow-fading standard deviation is constructed, and a model for the angle-dependent variation of the Ricean K-factor is established based on line-of-sight probability. Simulations were conducted in two urban-geometry scenarios using WinProp to evaluate the combined effects of flight altitude and elevation angle. The results indicate that path loss decreases and subsequently stabilizes with increasing elevation angle, the shadow-fading standard deviation decreases significantly, and the Ricean K-factor increases with angle and saturates at high angles, in agreement with theoretical predictions. These models are more adaptable to UAV mobility scenarios than traditional fixed exponential models and provide a useful basis for UAV link planning and system optimization in urban environments.

1. Introduction

With the growing demand for flexible, rapidly deployable, and cost-efficient communications infrastructure, unmanned aerial vehicles (UAVs) have attracted widespread attention from both academia and industry as promising aerial communication platforms [1]. Compared with conventional terrestrial base stations, UAVs offer the advantages of three-dimensional mobility, flexible deployment, and adaptive coverage. They can be equipped with wireless transceivers, fly at varying altitudes, and follow predefined or adaptive trajectories according to communication requirements. Additionally, UAVs are capable of establishing reliable line-of-sight (LOS) links with ground terminals due to their elevated positions, which can significantly reduce large-scale path loss and multipath effects. These unique advantages make UAVs highly suitable for a wide range of wireless communication scenarios, including providing emergency communication services in disaster areas, ensuring temporary coverage at large-scale events, and enhancing network capacity in densely populated hotspots where terrestrial infrastructure is either unavailable or overloaded.
Despite these promising advantages, most existing research on UAV communication channels relies on simplified analytical expressions or purely stochastic models [2]. While these models offer mathematical tractability, they often fail to capture the complex propagation characteristics that arise in real-world environments [3]. In particular, they tend to neglect the impact of three-dimensional building distributions, irregular terrain, and dynamic obstacles, all of which introduce significant occlusion and non-line-of-sight (NLOS) conditions. Furthermore, UAV mobility complicates the channel characteristics, as changes in altitude, velocity, and flight trajectory directly affect the received signal quality. As a result, it becomes essential to conduct in-depth investigations of key channel parameters, such as path loss (PL), shadowing attenuation, and the Ricean K-factor, under realistic three-dimensional scenarios. These studies provide a more accurate characterization of the UAV air-to-ground (A2G) channel and offer valuable guidance for the design, optimization, and deployment of future UAV-assisted wireless networks.
This paper addresses the limitations of existing UAV channel models by proposing a novel dynamic path-loss model that incorporates the elevation angle and flight altitude, which are often overlooked in traditional models [4]. Specifically, we focus on the angular-altitude correlations of three key parameters: path loss (PL), shadow fading, and the Ricean K-factor. Our proposed model more accurately captures the nonlinear variations of these parameters in urban environments, where building distributions and dynamic obstacles play a significant role in signal propagation. Additionally, we introduce a model for the elevation angle-dependent variation of the Ricean K-factor based on the line-of-sight (LOS) probability, which significantly enhances the accuracy of channel modeling in UAV A2G links [5]. This work contributes to a more realistic and effective approach for UAV channel modeling, providing insights that can help optimize the deployment and performance of UAV communication systems in urban scenarios.

2. Related Work

UAV communication systems are essential components in the construction of space–air–ground integrated networks (SAGINs) [6,7]. As a key enabler of A2G communications, UAVs are being increasingly deployed in various scenarios, such as traffic monitoring, emergency response, and military operations [8,9]. With the rapid evolution of fifth-generation (5G) and beyond fifth-generation (B5G) technologies, these emerging communication paradigms have been gradually integrated into A2G systems to enhance communication performance and applicability [10]. Against this background, accurate propagation channel modeling has become critical for system design and performance evaluation, as it provides an effective means to characterize the transmission features between transmitters and receivers [11]. Therefore, investigating the channel characteristics of A2G links in UAV environments [12] is of significant importance.
Over the past decade, the widespread adoption of UAVs in communication systems has driven extensive research on reliable UAV channel models. Due to the unique properties of UAV channels, such as the motion of aerial platforms, the ground-level receiving plane, and the highly dynamic link conditions between transceivers, the statistical characteristics of the channel vary over time [13], often resulting in time-varying non-stationarity [14]. To accurately capture the unique characteristics of UAV channels, extensive efforts have been devoted to UAV channel measurements [15,16] and modeling for channel characterization.
In general, UAV channel modeling approaches can be classified into stochastic models [17] and deterministic models [18]. Deterministic models usually rely on precise descriptions of the propagation environment. For instance, ray tracing (RT)-based models require detailed information about the communication scenario and are capable of providing highly accurate channel parameter estimation [19]. RT is an electromagnetic propagation modeling technique based on geometrical optics (GO) and the uniform theory of diffraction (UTD) [20]. Its fundamental principle is to approximate electromagnetic wave propagation as the transmission of geometrical rays. By tracking a large number of rays emitted from the transmitter and following their reflection, transmission, and diffraction paths within the environment, RT can calculate signal strength, delay, path loss, and other channel parameters at the receiver [21]. However, the computational complexity of RT increases exponentially with environmental complexity, which limits its applicability in real-time scenarios. In contrast, stochastic models rely on statistical properties extracted from extensive measurements. With properly defined parameters, they can characterize a wide range of communication scenarios at relatively low complexity [22,23]. In this study, all RT simulations were performed using Altair WinProp 2022; Altair Engineering Inc., Troy, MI, USA),full postal address: 1820 E. Big Beaver Rd., Troy, MI 48083, USA.
A stochastic model characterizes wireless channels based on probability distributions and random processes [24]. Its fundamental concept is to describe the macroscopic behavior of signal propagation using statistical laws rather than detailed physical computations. Unlike deterministic models, which rely on precise physical calculations, stochastic models are more suitable for dynamic, complex, and unpredictable wireless environments [25]. In specific scenarios, such as urban macrocell deployments, the statistical characteristics of the channel (e.g., mean, variance, and correlation) remain stable, thereby supporting the generalization capability of the model [26]. Furthermore, stochastic models can be categorized into non-geometrical stochastic models (NGSMs) and geometry-based stochastic models (GBSMs) [27]. NGSMs represent UAV channels in a fully random manner without assuming any underlying scattering geometry. Some studies have developed NGSMs for UAV channels under the assumption of time-invariant characteristics, neglecting temporal non-stationarity [28,29]. To address this limitation, the authors of [30] proposed an NGSM that incorporates time-varying UAV-related parameters to capture the temporal non-stationarity of the channel.
In recent years, various geometry-based stochastic models have been proposed to characterize UAV A2G communication channels. For example, refs. [31,32] introduced three-dimensional (3D) geometric modeling methods in multiple input–multiple output (MIMO) channel analysis, where cylindrical structures were used to represent the propagation environment between UAVs and mobile receivers (MRs), assuming that propagation paths undergo a single interaction. Further studies reported in [33,34] developed GBSMs with 3D angular parameters to describe the distribution characteristics of complex scatterers. In addition, ref. [35] proposed a 3D elliptical–cylindrical hybrid model to characterize the propagation environment around UAVs and MRs, which can be further applied to the performance evaluation of UAV communication systems. For wideband non-stationary modeling, ref. [36] introduced a 3D single-cylinder ring MIMO stochastic model to capture non-stationary characteristics, while ref. [37] proposed a 3D double-cylinder model for anisotropic UAV-MIMO Ricean fading channels and compared it with deterministic and simulation-based models. Beyond UAV communications, researchers have also explored non-geometrical stochastic models in vehicular communications [38], where time-varying parameters were introduced to account for the dynamic nature of the channel.
To further characterize complex propagation environments, several studies have proposed cluster-based stochastic models. In [39,40,41], multi-cluster structures and angular distributions were introduced, together with exponentially distributed propagation distances, to approximate the scattering characteristics of realistic A2G scenarios. Such models not only capture the non-stationary properties of UAV communications but are also applicable to the performance evaluation of wideband MIMO systems. To support large-scale MIMO and millimeter-wave communications, the authors of [42] developed a UAV channel model that employs the birth–death (BD) process to characterize the reappearance of clusters over time and the evolution of arrays, thereby modeling the spatio-temporal non-stationarity of the channel.
In addition, angle estimation techniques play an important role in UAV channel modeling and system performance analysis. Existing studies have proposed angle estimation algorithms in the spatial, temporal, and frequency domains to reduce the complexity of high-dimensional angular parameter modeling [43,44]. More recently, deep learning-based super-resolution algorithms have been applied to large-scale MIMO channel modeling [45], further improving model accuracy and applicability. Therefore, incorporating low-complexity yet high-accuracy angle estimation algorithms into UAV channel modeling is of great significance.
The GBSM approach simplifies scatterers based on the fundamental laws of wave propagation, which effectively reduces the complexity of the channel modeling process. With the increasing adoption of large-scale MIMO technologies in UAV communications, UAV channels are expected to exhibit pronounced spatio-temporal non-stationarity, meaning that their statistical properties vary across both space and time. Consequently, spatio-temporal non-stationary UAV channel models are essential. Building upon these standard models, UAV channel modeling has become a research hotspot, providing important directions for further investigations.
Although the aforementioned models have contributed to the modeling of UAV channels, there are still some research gaps. Compared to other types of channels, UAVs exhibit high-altitude, fast-moving characteristics, leading to rapidly time-varying and spatially non-stationary channel parameters. Traditional static or quasi-static channel models are no longer applicable. Real-time channel estimation and prediction are required. Therefore, this paper investigates the following topics.
  • Horizontal trajectories and propagation characteristics: By modeling and simulating different UAV flight paths in the horizontal plane, this study investigates their impact on signal propagation in urban environments. Particular attention is given to how various trajectory patterns affect path-loss trends, shadow-fading variations, and the distribution of LOS and NLOS components.
  • Flight altitude and statistical properties: Under different altitude conditions, this work analyzes the effects of flight height on the distribution of path loss, the standard deviation of shadow fading, and the dynamic variations of the Ricean K-factor. By comparing low-altitude and high-altitude scenarios, the modulation of channel statistical and time-varying characteristics by flight altitude is revealed.
  • Non-stationary channel characteristics: Considering both horizontal trajectories and flight altitude variations, this study further explores the temporal non-stationarity of UAV channels. The dynamic evolution of channel parameters, such as root mean square (RMS) delay spread and angle spread, is examined under different trajectory–altitude conditions, thereby providing a basis for accurate A2G channel modeling and system optimization.
Section 2 investigates the impact of the elevation angle on UAV channel modeling and proposes models for path loss, shadow fading, and the Ricean K-factor as functions of the elevation angle, effectively capturing their nonlinear variations. Section 3 validates the accuracy of the proposed models through ray-tracing simulations. Section 4 summarizes the significance and potential applications of the proposed models and provides theoretical support for the optimization of future UAV communication systems.

3. Channel Modeling

In conventional path-loss models, the effect of the elevation (look-down) angle is usually not treated explicitly. However, as UAVs operate at varying altitudes and positions, the elevation angle exerts a significant influence on the propagation path, particularly in dense urban environments where buildings and obstacles cause complex propagation conditions. This motivates the introduction of an elevation angle-dependent path loss model that can more accurately capture the dynamics of UAV A2G channels.

3.1. Path-Loss Model

Existing PL models typically account for the distance-dependent attenuation of the signal. Nevertheless, the modeling accuracy can be further improved by incorporating the elevation angle into the formulation. To this end, we propose a novel dynamic PL model that explicitly includes the impact of the elevation angle, thereby providing a more realistic representation of UAV communication channels.
A standard log-distance PL model for an LOS-dominant A2G link is
P L = P L 0 ( f c ) + 10 n L log 10 d 3 D d 0 + X σ
where P L 0 ( f c ) is the free-space (or reference) loss at distance d 0 , n L is the LOS path-loss exponent, and X σ is the log-normal shadowing term (in dB).
However, urban A2G links exhibit a pronounced angle dependence: as θ increases; blockage probability typically falls; the first-bounce paths shorten; and the composite attenuation tends to decrease, then saturate (once most rooftops are below the LOS). To capture this mechanism while retaining the log-distance structure, we replace the geometric distance by an angle-aware effective distance:
d e f f ( θ , h , d 2 D ) = d 3 D g ( θ )
In the equation, d 3 D = d 2 D 2 + h 2 , and d 2 D = ( x t x r ) 2 + ( y t y r ) 2 , h = | z t z r | , θ = arctan ( h d 2 D )
A parsimonious choice that meets these requirements and is easy to fit is
g ( θ ) = [ 1 c h ( 1 cos θ ) ] b θ , 0 < c h < 1 , b θ ( 0 , 1 ] ,
where c h controls the overall angle gain, while b θ controls the nonlinearity, satisfying 0 < c h < 1 , b θ ( 0 , 1 ] . It is estimated through band-limited least squares on measured or simulated data, and its value can vary with the scene or height stratification. A small-angle expansion shows the intended nonlinearity:
cos θ 1 θ 2 2 g ( θ ) 1 b θ c h 2 θ 2
with a smooth, monotone-decreasing mapping g ( θ ) ( ( 1 c h ) b θ , 1 ] satisfying the following:
  • g ( 0 ) = 1 (zero elevation reduces to the baseline model);
  • g ( π 2 ) = ( 1 c h ) b θ (high elevation saturates);
  • Tunable slope/curvature via two dimensionless parameters.
Therefore, the first meaningful correction is quadratic θ , consistent with gentle PL improvement at low elevation that accelerates before saturating.
P L ( θ , h , d 2 D ) = P L 0 ( f c ) + 10 n L log 10 d e f f ( θ , h , d 2 D ) d 0 + X σ ( θ , h )
d e f f ( θ , h , d 2 D ) = d 3 D [ 1 c h ( 1 cos θ ) ] b θ ( 0 c h < 1 , b ( 0 , 1 ] )
This mapping ensures that the path loss decreases monotonically with the elevation angle and gradually saturates. This model more accurately captures the nonlinear variation of path loss with the elevation angle, aligning with the propagation mechanism of path loss in urban environments.

Practical Implications of Path-Loss Parameters and Deployment Guidance

The c h and b θ parameters in the proposed model can be regarded as the “channel fingerprint” of a specific urban environment, providing a direct decision-making basis for UAV deployment.
  • Environment Classification and Deployment Strategy Selection: The magnitude of the c h parameter (overall angle gain) directly reflects the obstruction density of the environment. In regions with a large c h value, UAVs should prioritize a “high-altitude, steep-elevation-angle” hovering or operation mode to maximize link budget benefits, whereas in open areas with a smaller c h , the requirement for flight altitude can be relaxed.
  • Trajectory Optimization and Ascent Strategy: The b θ parameter (nonlinearity control factor) determines the “efficiency” of performance improvement with angle. A smaller b θ implies that a larger elevation angle is required to achieve significant link improvement. When planning trajectories in complex environments with a small b θ (e.g., those with very tall buildings), UAVs need to perform faster, more decisive climbing maneuvers; conversely, a more gradual ascent can be adopted to save energy.
  • Dynamic Adjustment of Link Budget: Traditional models use a fixed margin, whereas our model achieves dynamic path-loss prediction dependent on the elevation angle ( θ ) through d eff . The communication system can dynamically calculate the current expected path loss based on the real-time elevation angle ( θ ) and stored local parameters ( c h , b θ ), thereby enabling real-time adjustment of transmit power or modulation and coding schemes to improve power efficiency.

3.2. Shadow-Fading Model

Shadow fading is commonly modeled as a log-normal process, where, in the decibel domain, it follows a Gaussian distribution with zero mean and a variance that captures the large-scale fluctuations caused by blockages. Let X σ ( θ , h ) denote the shadow-fading component, which can be expressed as
X σ ( θ , h ) N 0 , σ 2 ( θ , h )
where σ ( θ , h ) is the standard deviation that depends on both the elevation angle ( θ ) and the UAV flight altitude (h).
To derive the form of σ ( θ , h ) , we begin by noting that empirical observations consistently show two key dependencies. First, as the elevation angle ( θ ) increases, the propagation path between the UAV and the ground receiver becomes less obstructed, which reduces the severity of shadowing. This suggests that σ ( θ , h ) should monotonically decay with θ and eventually converge to a lower bound at large elevation angles. Second, as the flight altitude increases, the UAV experiences fewer ground-induced blockages; thus, the shadow-fading variance decreases with h, approaching a stable value beyond a certain reference height ( h ref ).
To mathematically capture these trends, we introduce exponential decay terms with respect to both elevation angle and flight altitude. Specifically, let σ 0 represent the upper limit of the standard deviation at small elevation angles (where shadowing is most severe) and σ denote the asymptotic lower limit as θ becomes large. By applying an exponential decay with an angle characterized by the k θ coefficient and an exponential decay with a height characterized by the k h coefficient, we obtain
σ ( θ , h ) = σ + σ 0 σ e k θ θ β e k h ( h h ref )
In this expression, σ is the lower bound of the standard deviation for large elevation angles, σ 0 is the upper bound for small elevation angles, k θ controls the decay rate with angle, and β > 0 is the curvature index of angular attenuation (dimensionless). It does not change the upper and lower limits but only determines the transition shape of σ from high to low with elevation angle. β is obtained through band-limited nonlinear least-squares estimation. k h describes the sensitivity to altitude, and h ref serves as the reference altitude for normalization. This formulation ensures that σ ( θ , h ) decreases monotonically with both θ and h while naturally saturating at high angles or large altitudes. Consequently, the proposed model can accurately reproduce the variation of shadow fading under different UAV trajectories and environmental conditions, reflecting the reduced occurrence of occlusion events as elevation angle and altitude increase.

Practical Implications of Shadow-Fading Parameters and Resource Allocation

The shadow-fading standard deviation ( σ ( θ , h ) ) and its parameter set provide a quantitative tool for assessing link reliability and conducting robustness design.
  • Dynamic Shadow-Margin Setting: σ ( θ , h ) explicitly gives the fluctuation range of shadow fading under different elevation angles and heights. In link budgeting, it is no longer necessary to set a conservative fixed margin for the entire cell (e.g., 4.0 dB in the 3GPP model). Instead, the shadow margin can be set dynamically based on the UAV’s real-time state ( ( θ , h ) ) and the model parameters. For instance, a large margin near σ 0 can be used under low elevation angles ( θ < 20 ), while a small margin close to σ can be adopted under high elevation angles ( θ > 60 ), thereby achieving efficient resource utilization.
  • Quantitative Trade-off in Altitude Decision: The k h parameter (height decay rate) quantifies the gain of “trading altitude for link stability”. A larger k h means that increasing altitude rapidly reduces shadowing fluctuation. For missions requiring extremely high reliability (e.g., critical control command transmission), a “minimum safe altitude” should be explicitly defined in mission planning based on k h , ensuring the shadow-fading standard deviation always remains below an acceptable threshold.
  • Service-Level Agreement (SLA) Zoning: The k θ and β parameters define the elevation angle boundary where the channel transitions from “unstable” to “stable”. Network operators can use this to demarcate “Premium Service Zones” (e.g., θ > 50 ) and recommend that delay-sensitive or high-throughput services be conducted within this zone, thereby guaranteeing user experience.

3.3. Ricean K-Factor Model

In wireless channel modeling, the Ricean K-factor is a critical parameter that characterizes the statistical properties of the propagation environment. Physically, it represents the power ratio between the LOS component and the NLOS components. A larger K-factor indicates that the LOS component dominates the received signal, whereas a smaller K-factor corresponds to environments where multipath scattering is significant and the LOS component is weaker. Therefore, the K-factor directly reflects the sparsity of the propagation environment and the concentration of received power, making it essential for both channel characterization and performance evaluation. Its fundamental definition is given as
K = P L O S P N L O S
where P L O S and P N L O S denote the received power of the LOS and NLOS components, respectively.
In conventional terrestrial cellular networks, the K-factor is typically modeled as an empirical parameter fixed for a given environment. However, in urban UAV A2G scenarios, the geometric characteristics of the propagation environment exert a strong influence on the K-factor. As the elevation or depression angle ( θ ) increases, the UAV becomes closer to the receiving plane, resulting in a higher LOS probability and a reduced density of effective scatterers. Consequently, the K-factor tends to increase with θ . To quantify this behavior, previous studies have proposed linking the K-factor to the LOS probability, and a widely used modeling approach is expressed as
K ( θ ) = K 0 P L O S ( θ ) 1 P L O S ( θ ) β
where K 0 denotes the reference K-factor representing the baseline value in the absence of obstructions and β is an adjustment coefficient that controls the sensitivity of the K-factor to changes in the LOS probability. Clearly, as P L O S ( θ ) increases, the K-factor grows rapidly, which is consistent with physical propagation mechanisms.
To explicitly model P L O S ( θ ) , a logistic function is commonly employed to capture the relationship between the elevation angle and the LOS probability. The general form is given by
P L O S ( θ ) = 1 1 + e θ θ + b θ
where θ controls the sensitivity of the LOS probability to the elevation angle, with larger values indicating steeper variations, and b θ is the offset term, which ensures that P L O S ( θ ) varies within the range of [ 0 , 1 ] .
In summary, by combining the LOS probability model with the K-factor formulation, the relationship between the K-factor and the elevation angle in UAV A2G channels can be effectively captured. This model not only reflects the monotonic increase of the K-factor with increasing LOS probability but also provides flexibility through the K 0 and β parameters to adapt to different environments and altitude conditions. As such, it offers a more accurate statistical description of UAV channels compared with conventional constant-K approaches.

Practical Implications of K-Factor Parameters and Transmission Technique Selection

The K-factor model links the channel multipath structure to the LOS probability, providing clear thresholds for adaptive transmission technique switching.
  • Adaptive Switching of Transmission Modes: The K-factor is a key indicator for choosing between spatial multiplexing and diversity techniques. A K-factor threshold ( K thres ) can be preset. When the predicted K ( θ ) > K thres (high elevation angle and strong LOS), the system can switch to higher-order modulation and spatial multiplexing mode to increase capacity; when K ( θ ) < K thres (low elevation angle and rich multipath), it can automatically switch to diversity coding mode to enhance reliability.
  • Beamforming Strategy Optimization: In strong-LOS environments (high K-factor), beamforming is the optimal strategy. Our model directly indicates the elevation-angle range of the strong LOS region through P LOS ( θ ) . A UAV base station can use this model to employ wider beams or sector antennas in low-elevation-angle regions to cover multipath areas while enabling high-gain narrow beams in high-elevation-angle regions to precisely point towards ground users, thereby improving spectral efficiency.

4. Results Analysis

To deeply explore the unique propagation characteristics of drone communication channels in complex urban scenarios (such as path loss, multi-path effects, delay spread, etc.), this study uses advanced Altair WinProp 2022 ray-tracing technology-based professional simulation software for high-accuracy modeling and simulation analysis. Specifically, by utilizing the powerful 3D scene construction and electromagnetic wave propagation calculation capabilities of the WinProp software, we precisely established a model of a typical urban microcell environment.
In this simulation model, the transmitter (Tx) represents the drone’s onboard communication unit, with its antenna mounted on the drone platform. The antenna is configured with a transmission power of 40 dBm (10 W) and utilizes a 3 dBi omnidirectional antenna to simulate the communication payload commonly used by drones. The receiver (Rx) represents the ground user equipment, such as handheld devices or fixed receiving stations, with its antenna set at a typical handheld height of 1.5 m above the ground, also employing a 3 dBi omnidirectional antenna.
The simulation environment is based on the urban model constructed in WinProp, as shown in Figure 1. The gray areas in the model represent densely distributed buildings, and the model accounts for the impact of elements of complex urban structures, such as building layout, height, and materials, on wireless channel characteristics. For the simulation, all building materials are defined as concrete, with electromagnetic properties from the EPMC99 material library, including dielectric constant, conductivity, and other relevant parameters. These parameters realistically reflect the effects on microwave signal reflection, transmission, and diffraction.
The focus of the research is on the impact of these complex urban structures on the key parameters of A2G wireless channels for drones, specifically in the microwave communication frequency band (such as the millimeter-wave frequency band, commonly used for drone communication). The drone (Tx) is set to move horizontally at a constant speed to simulate flight dynamics. The horizontal movement is adjusted in WinProp along the flight path, and the vertical flight height (Z coordinate) is modified to simulate realistic drone motion in three-dimensional space. In this scenario, we set 10 different drone flight altitudes to study the impact of altitude on drone channel parameters. Secondly, each altitude drone moves at a constant speed for five moments.
In terms of the simulation settings, the carrier frequency is set to 2.0 GHz, with the transmitter power at 40 dBm. The ray-tracing model in WinProp is configured with the following settings:
  • Maximum Transmission Paths: 3;
  • Maximum Reflections: 2;
  • Maximum Diffractions: 1;
  • Reflection and Diffraction Modeling: Uncorrelated power addition for different rays, consistent with large-scale statistical models;
  • Empirical Loss Models: Applied for transmission, reflection, and diffraction, reflecting realistic path-loss behaviors;
  • Phase and Power Superposition: Uncorrelated superposition, ensuring consistency with large-scale path-loss models.
The WinProp simulation tool is configured to simulate the drone’s communication channel dynamically by adjusting the transmitter’s position and height. This parametric scanning method allows us to analyze how changes in the drone’s position, especially the height, impact channel propagation conditions, such as received signal strength, signal-to-noise ratio (SNR), and multipath components. Through this dynamic modeling, we can gain insights into the significant effects of height and position variation on A2G communication channels.
According to the WinProp simulation scene settings, it is estimated that the total number of ray-tracing calculation points is n = 12,533. The following Table 1 shows the ray-tracing time of different scenes compared with the simulated scene and calculated time. It can be pointed out that as the complexity of the scene increases and the number of set reflection diffraction times increases, the time required for calculation increases exponentially.
The data generated by WinProp is exported into ASCII files, which include essential channel parameters for each propagation path. The exported data contains details such as the path delay, field strength, type of path (deterministic or empirical), number of interactions (e.g., reflections and diffractions), and the coordinates of interaction points along the propagation path. These data also provide key information such as the direction of departure (DoD) and direction of arrival (DoA) in both azimuth and elevation, the Doppler shift, and the phase of each path. By reading the exported files, we can process and analyze the parameters to compute the path loss and analyze the effects of multipath propagation.
These values are essential for the detailed analysis of the propagation characteristics, including identifying multipath components, determining path loss, and understanding the signal’s behavior in complex urban environments. By processing these outputs, we gain insights into the overall performance of the drone communication system, specifically for drone-to-ground (A2G) communication channels.
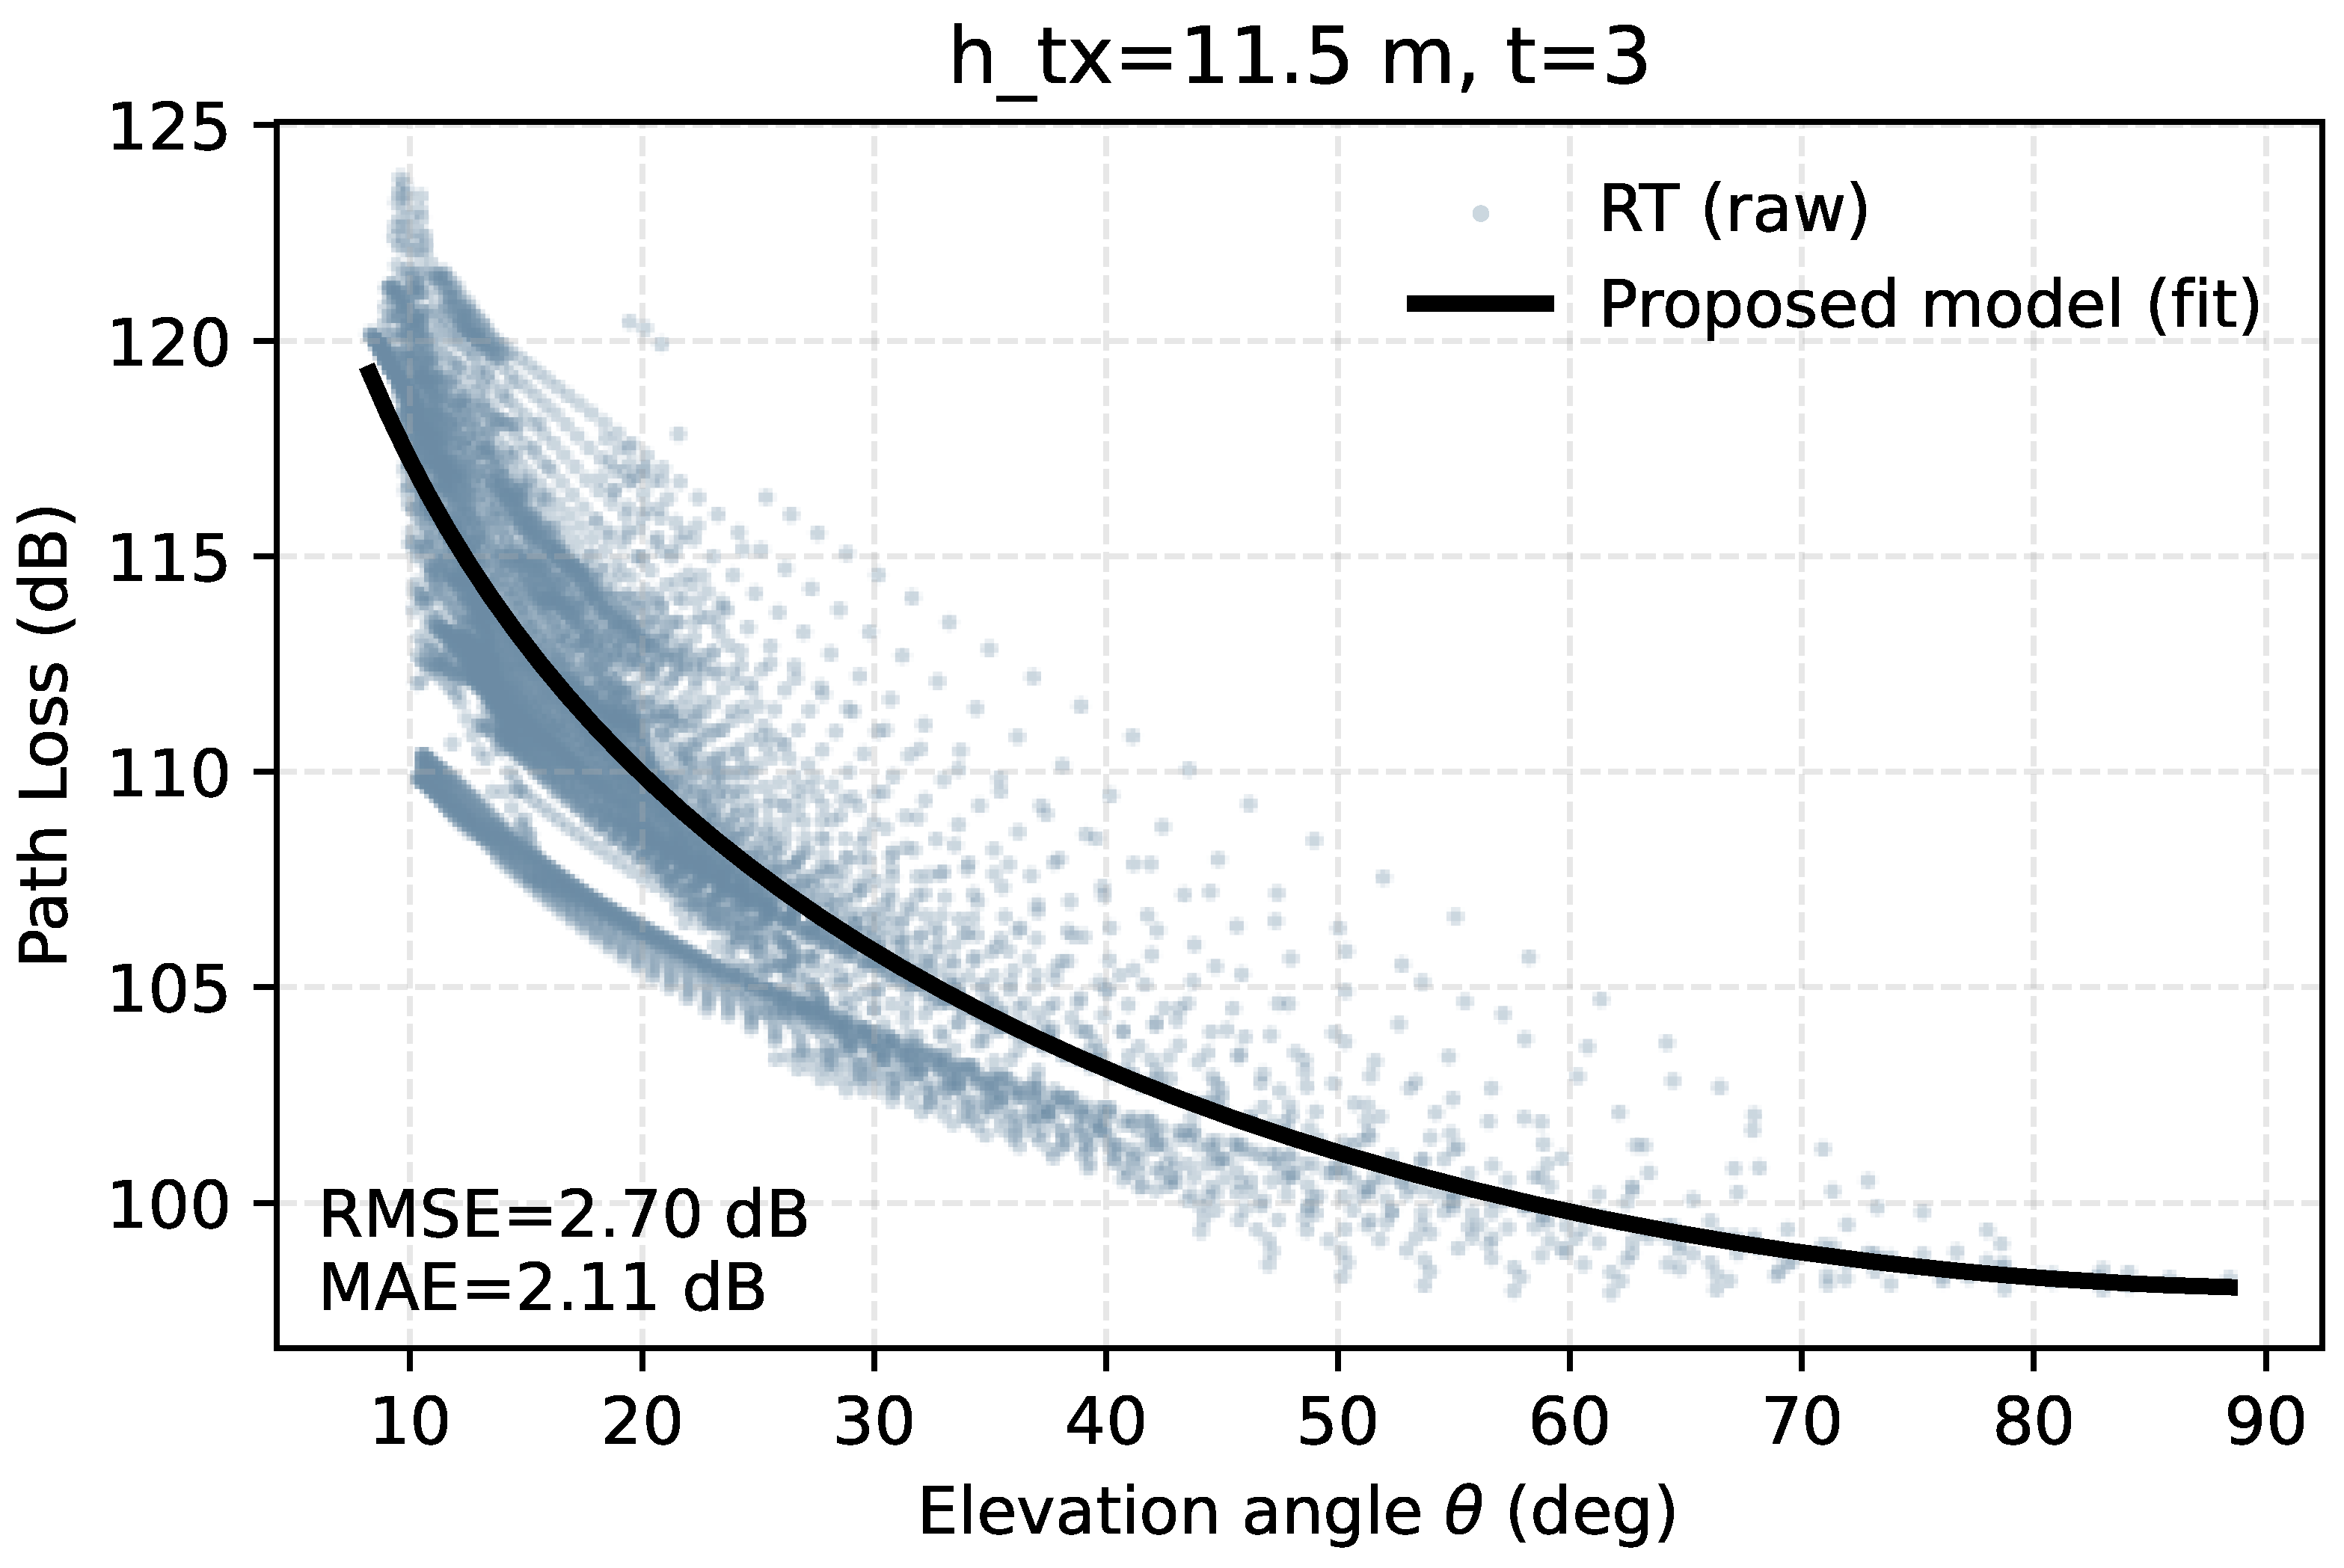
Figure 2 show a comparison of the curve of path loss related to elevation angle. The horizontal axis represents the elevation angle, and the vertical axis represents the path loss. The colored scatter points represent the original samples of ray tracing, and the black dashed line represents the fitting result of the elevation-angle perception model proposed in this paper, with error indicators provided to quantify the fitting accuracy. This figure corresponds to a set of results under a fixed transmission height and is used to demonstrate the monotonic change of the model with elevation angle and the saturation trend in the high-elevation-angle range. The “measured curve” in all subsequent figures in this article is obtained through the same data cleaning and fitting process to ensure comparability and reproducibility under different environments.
For visualization, we apply a per-subset vertical alignment ( Δ P L = m e a n ( P L d a t a P L m o d e l ) ). Where P L m o d e l denotes the predictions of Equation (2) evaluated on the same θ , d 3 D and the global parameters ( n L , c h , b θ ). This plotting-only offset does not affect fitting or metrics.
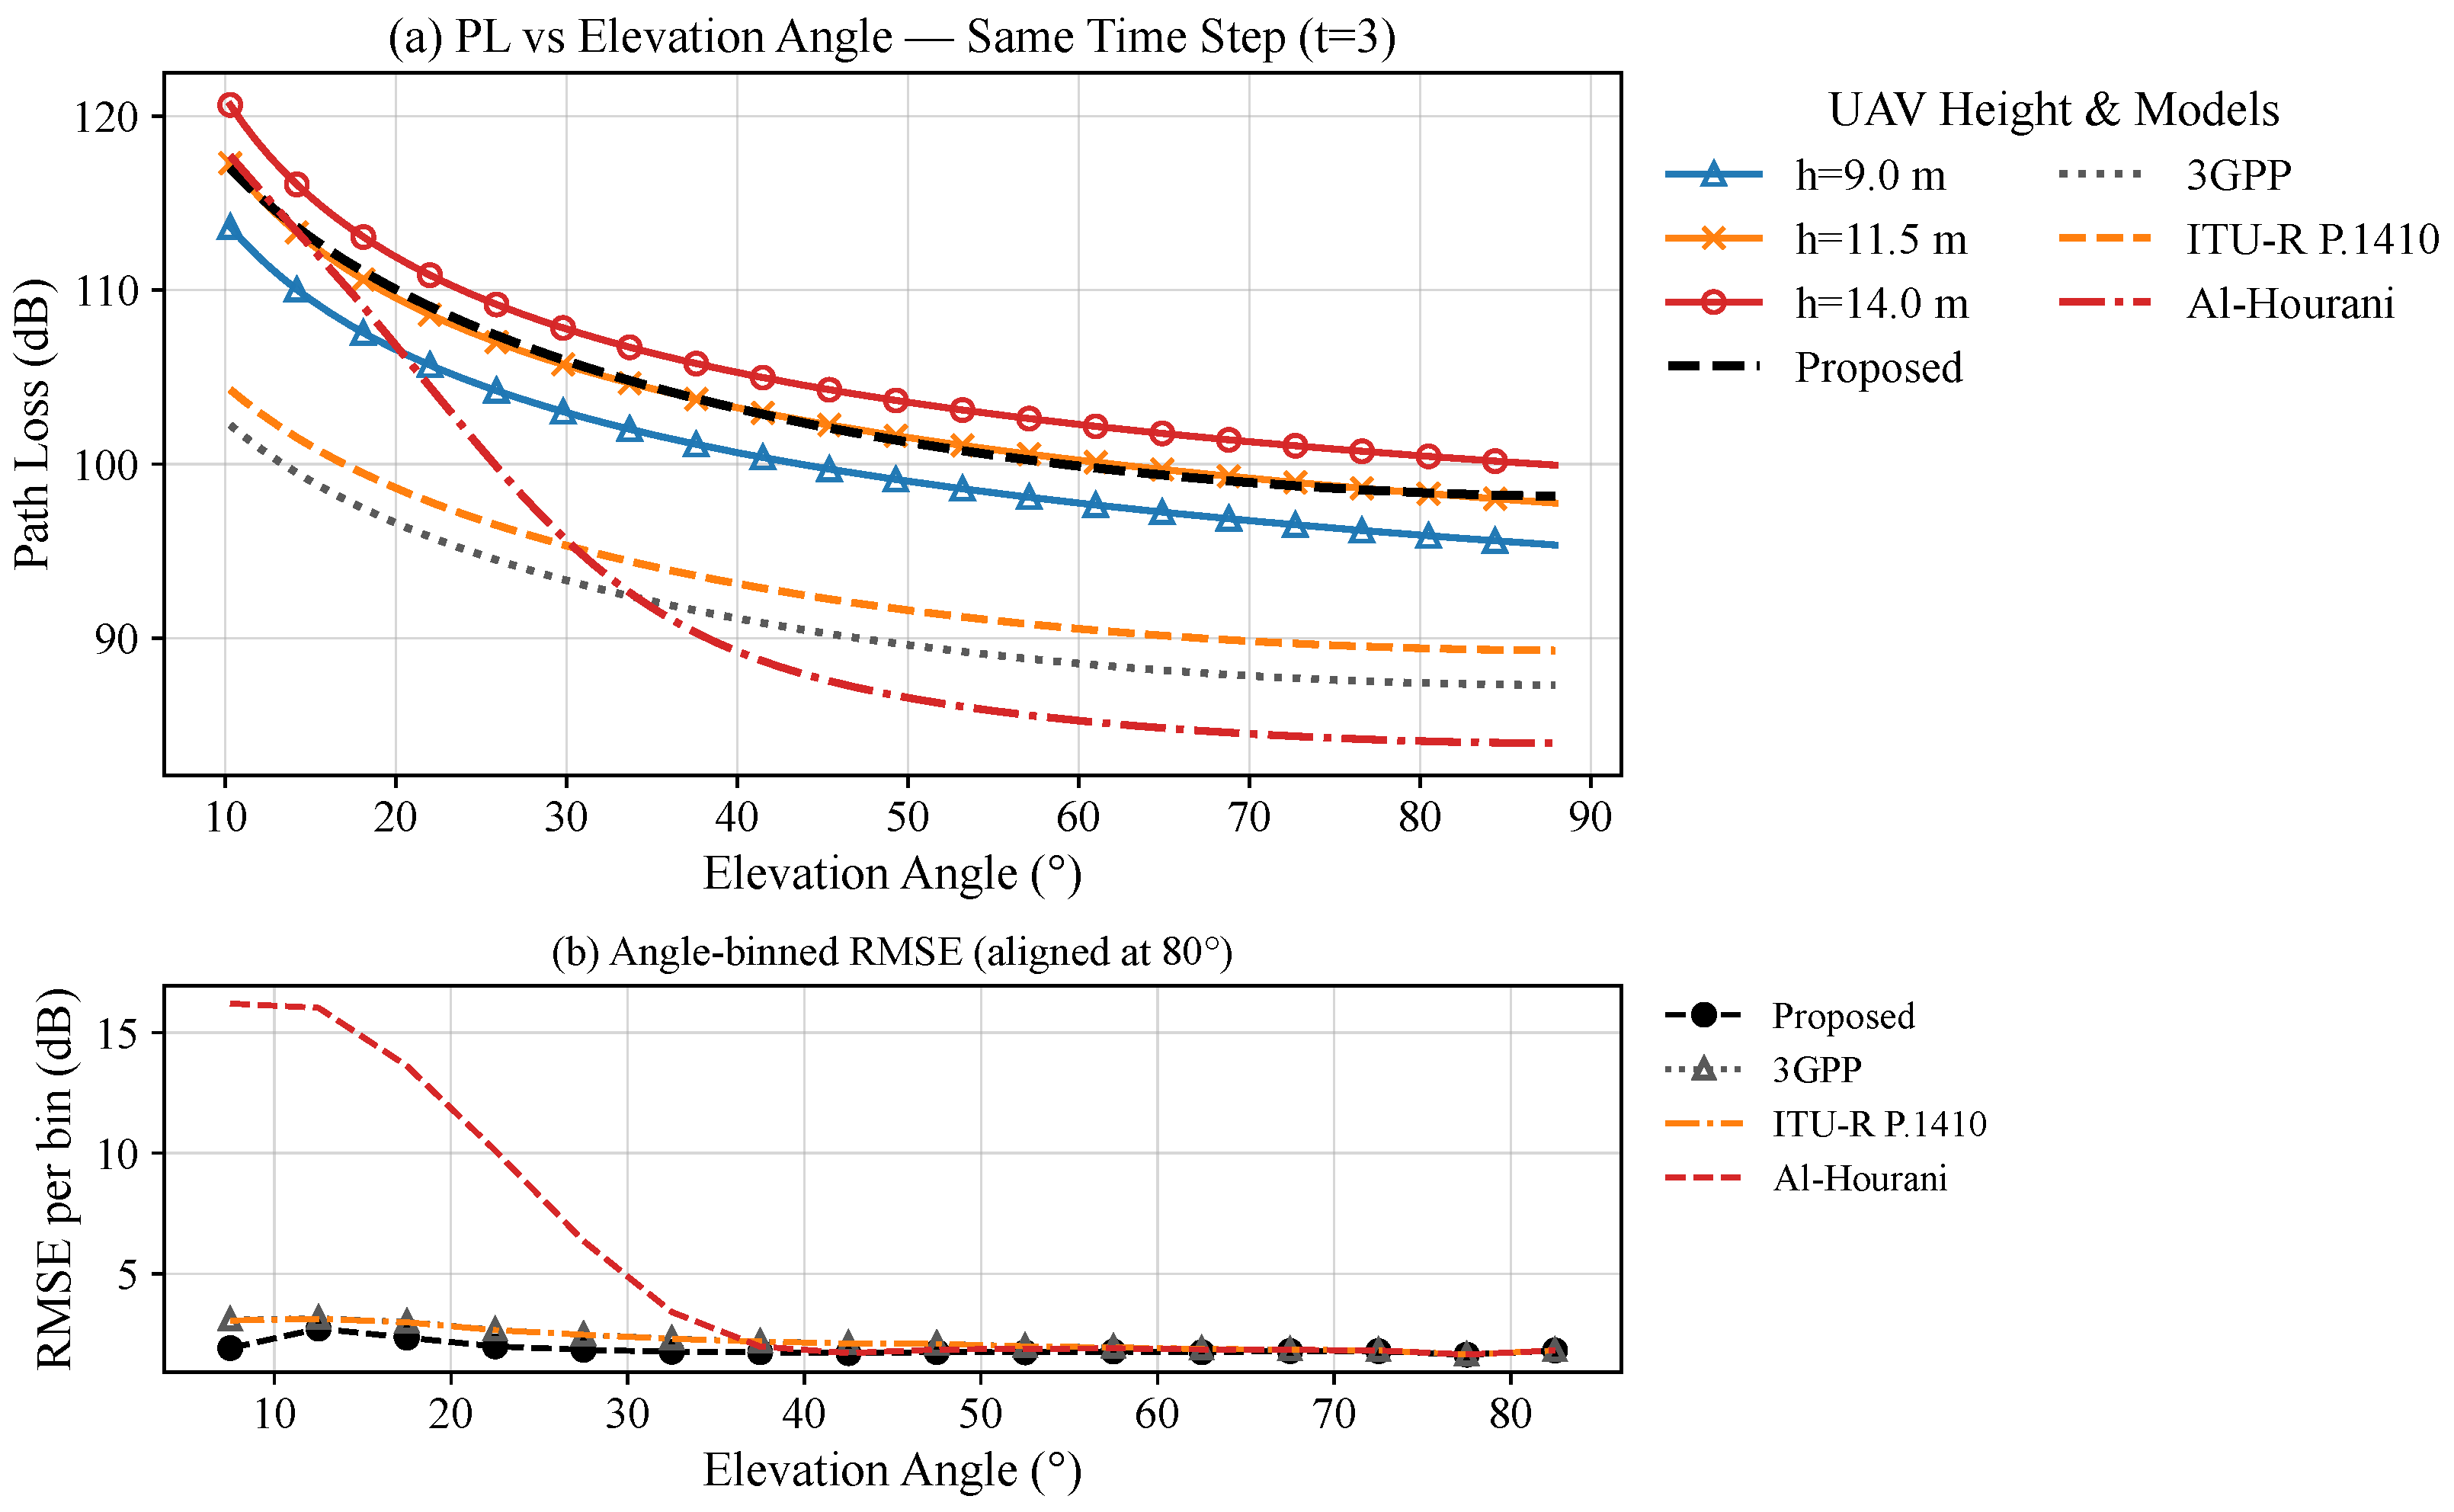
Figure 3 illustrates the variation of path loss with elevation angle at time step t = 3 for three representative UAV heights. In this paper, time is discretized into equally spaced samples with a sampling period of Δ t = 1 s. The UAV moves uniformly in the horizontal direction “specified direction” according to a constant velocity model, with a speed of v = 1 m/s. A label of t = 3 indicates that three sampling periods have elapsed since the original position and the UAV has moved 3 m along the x-direction. With the exception of position, all other simulation parameters remain unchanged to compare the time-varying nature of channel statistics under different time snapshots. A clear trend can be observed: as the elevation angle increases, the path loss decreases significantly. This phenomenon arises because higher elevation angles correspond to shorter three-dimensional link distances and a higher probability of line-of-sight conditions, thereby reducing attenuation.
At the same elevation angle, the path loss is larger for higher UAV heights. This is reasonable, since a higher altitude introduces a larger vertical separation between transmitter and receiver, which increases the effective propagation distance. As a result, the curve corresponding to the highest altitude always lies above that of the lower altitudes.
In addition, the difference between curves is more pronounced at small elevation angles. At low angles, propagation is dominated by longer slant paths and stronger shadowing effects, so changes in UAV height produce noticeable differences in loss. Conversely, at high elevation angles, the curves converge, indicating that the propagation channel becomes less sensitive to height once the UAV approaches a near-vertical link.
Finally, by comparing the path-loss curve plotted based on ray tracing data with the proposed model, it can be observed that the downward trend of the curve is the same, which verifies the accuracy of the proposed model. Compared with 3GPP and the Al Hourani model, the RMSE of the proposed model is lower. It is worth noting that the RMSE images of ITU-R p.1410 and the 3GPP model overlap. In general, the model considering the elevation factor not only ensures high angle accuracy but also considers the sensitivity of low and medium angles to altitude and the scattering environment. It has a lower RMSE and is more suitable for describing the “angle loss” law in dynamic UAV air–ground scenes.
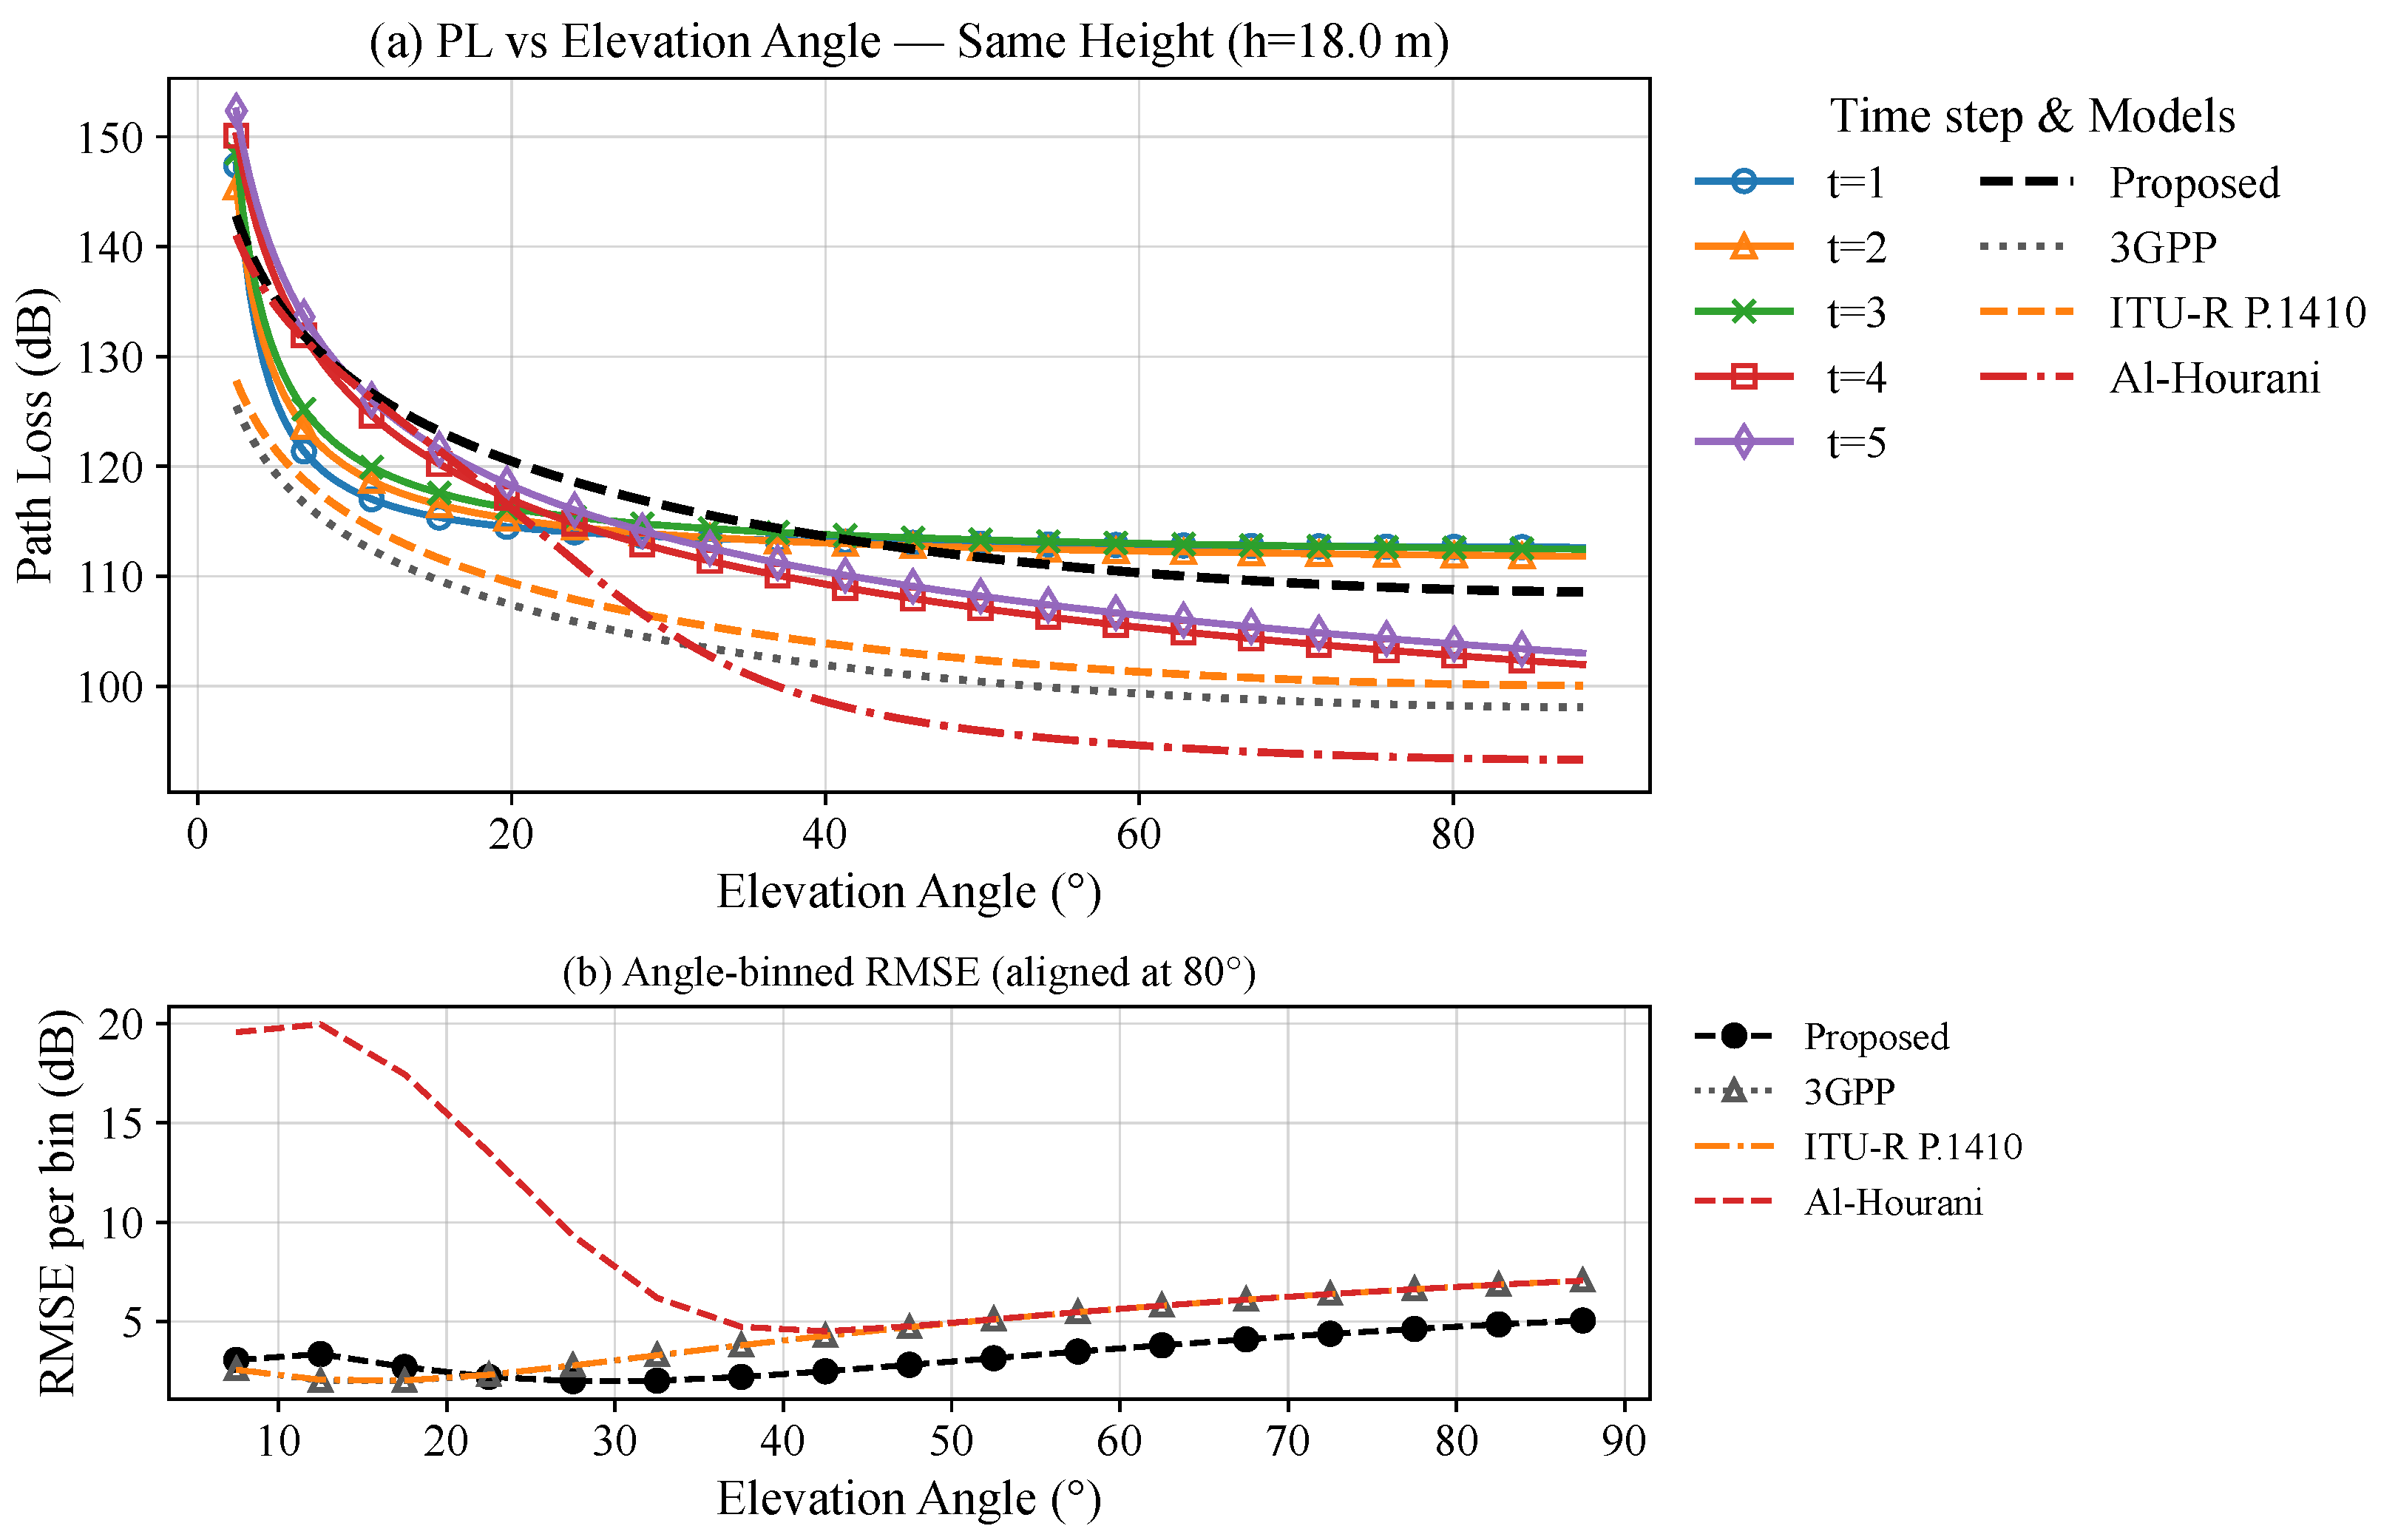
Figure 4 illustrates the relationship between path loss and elevation angle at a fixed drone height of 18.0 m, with data divided into five different time points. In the small angle range (approximately 0°–20°), the separation among the curves at different time points is more pronounced. This indicates that at low elevation angles, the channel is more susceptible to non-line-of-sight propagation and obstacles and that temporal variations or environmental dynamics can exacerbate this uncertainty.
In the elevation-angle range of 20° to 60°, the shapes of the curves at different times are similar and have consistent trends, primarily characterized by ‘approximately parallel overall upward and downward shifts’. This indicates that temporal variations are more reflected in the additive shifts of large-scale gains (such as slight changes in instantaneous path lengths or overall fluctuations in scatter cluster power), while the angle-related fading slopes remain fundamentally stable. In contrast, at higher elevation angles (60°), differences between curves at different times converge significantly. In this segment, the line of sight is dominant, and the effective scattering density decreases, leading to an ‘averaging out’ of temporal changes, thereby reducing the differences across time. This feature provides a quantitative basis for the high-elevation-angle robust region.
In summary, under a fixed height, the functional form of path loss as a function of elevation angle remains largely stable across different moments, while temporal variations mainly manifest as an additive offset in overall gain and an amplification of discreteness in the low-elevation-angle segment, with a clear convergence observed in the high-elevation-angle segment. The proposed model that accounts for height not only maintains the smoothness and monotonicity of curves between different time steps but also explains the significant differences at small angles and the convergence at large angles.
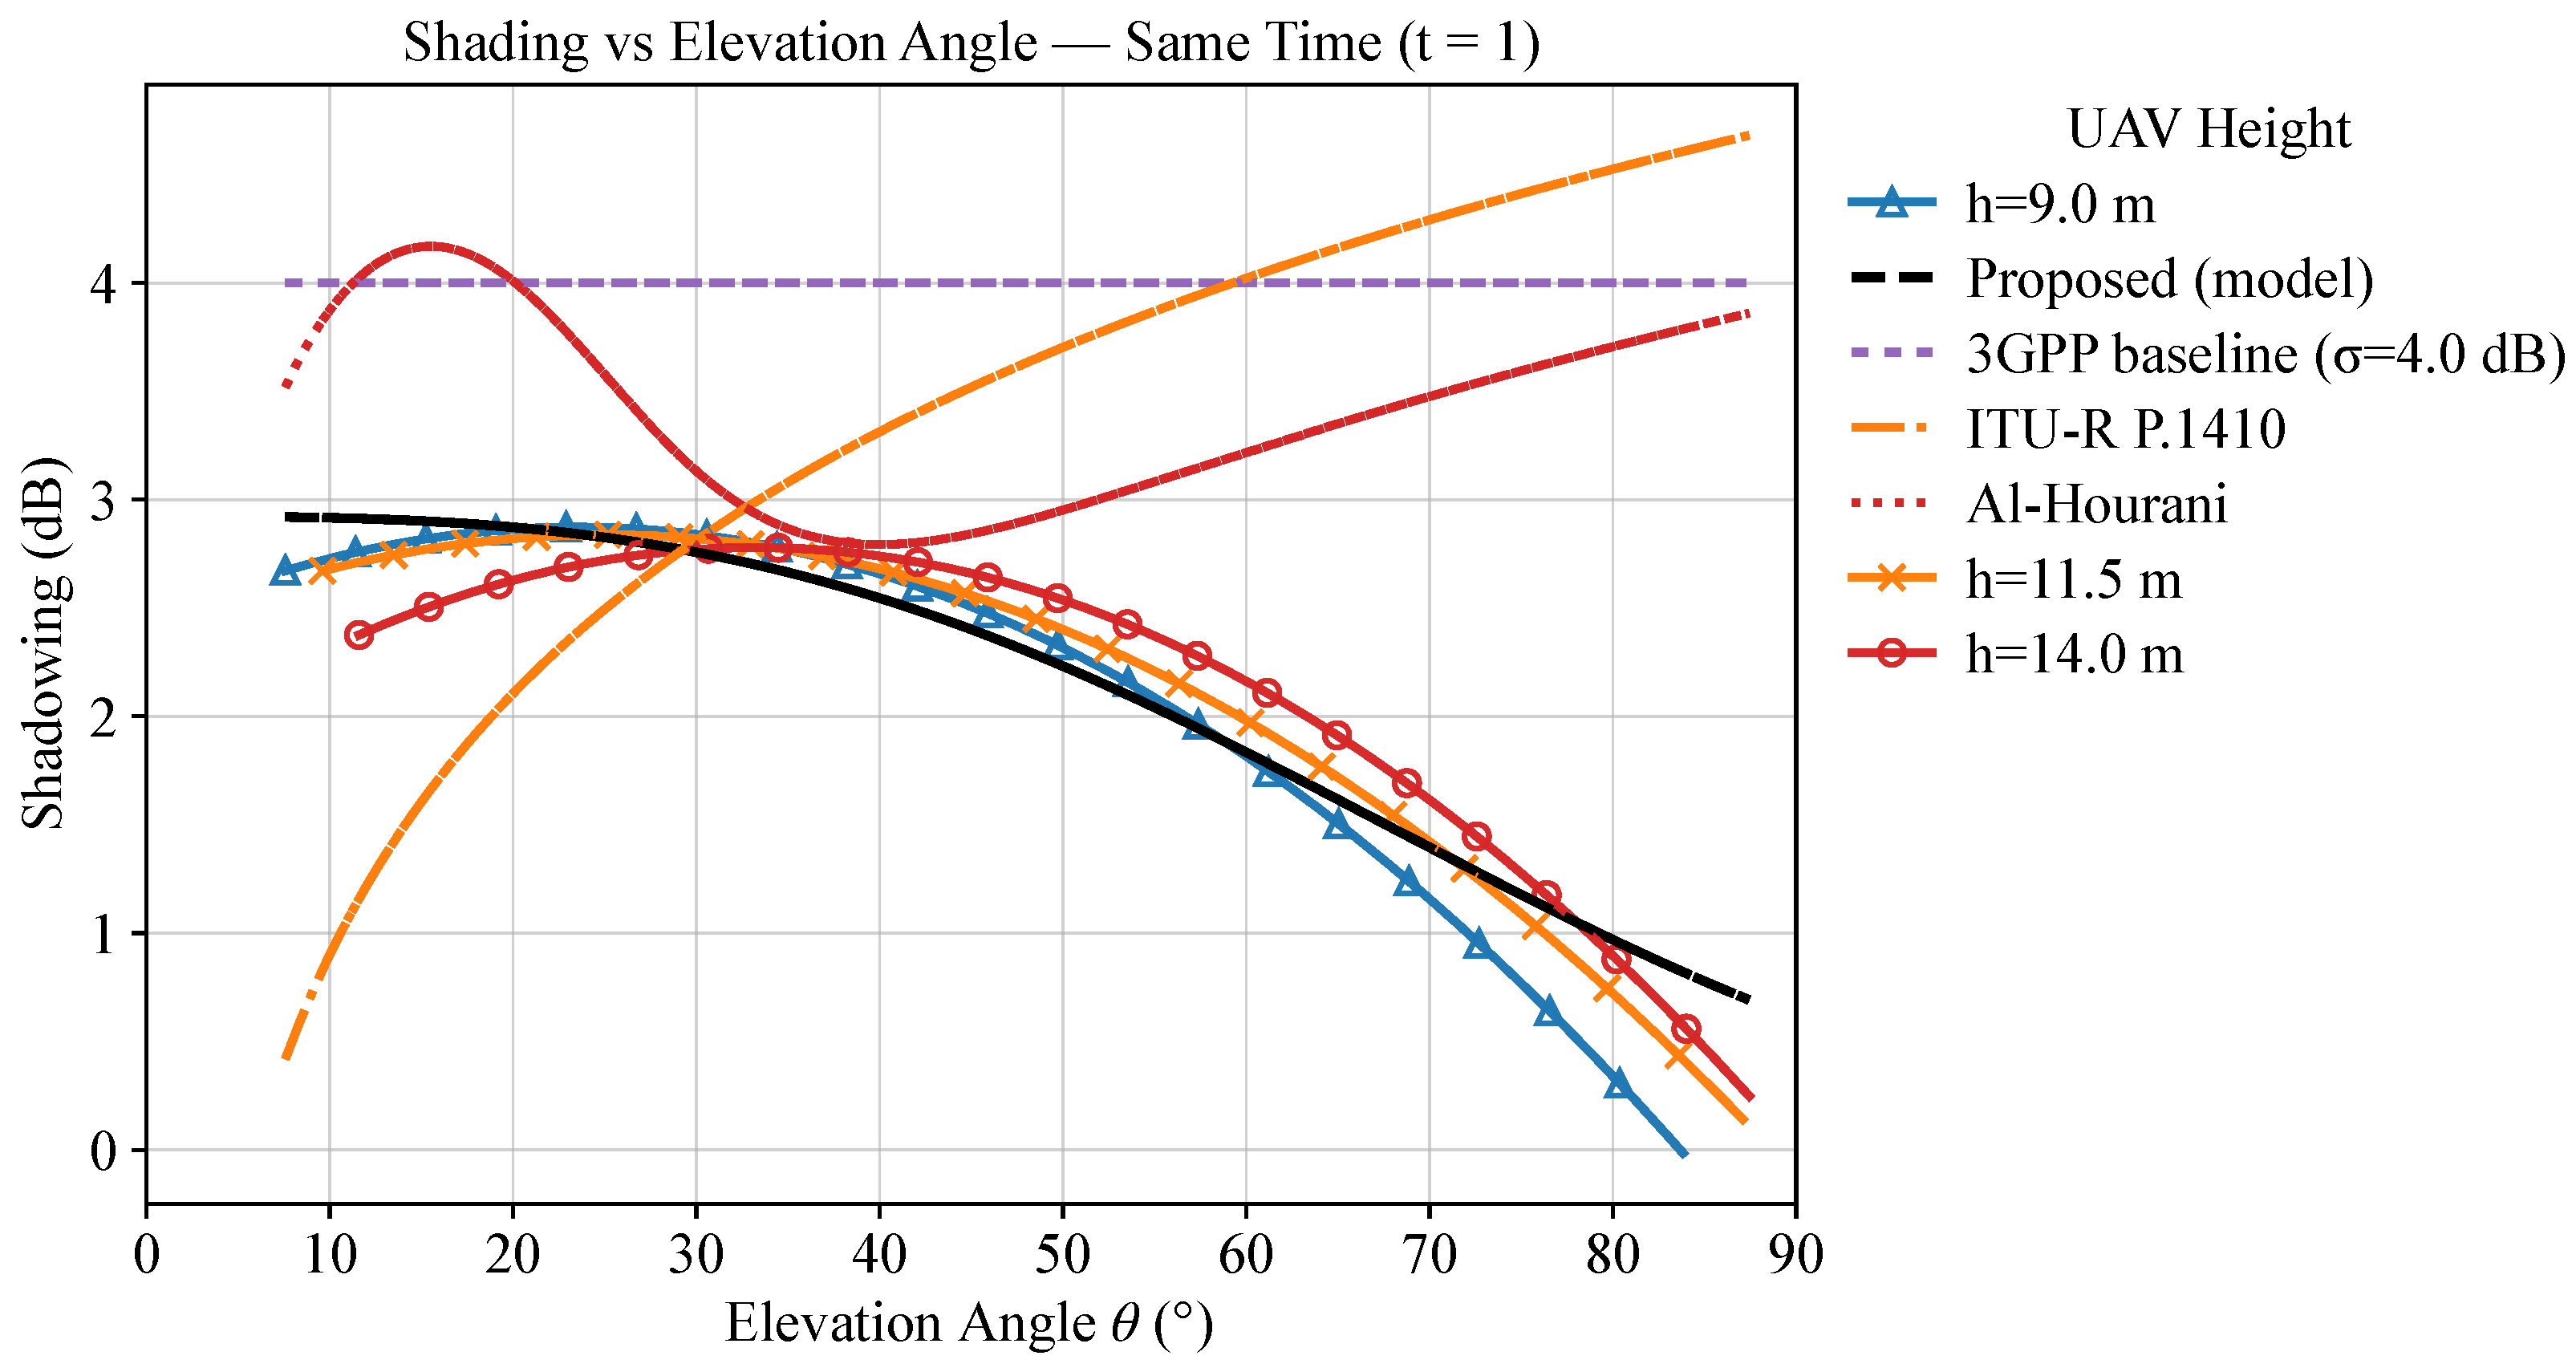
Figure 5 shows the relationship between the standard deviation of shadow fading and the heights of three drones at the same moment. All three curves monotonically decrease with increasing elevation angle and tend to flatten and converge in the high-elevation-angle range: at low elevation angles, the propagation path is more susceptible to blockage and multipath scattering caused by buildings, trees, and other obstacles, resulting in stronger shadow fading, whereas at higher elevation angles, the link approaches line-of-sight conditions, significantly reducing the effects of scattering and blockage, leading to weaker shadow fading. This is consistent with the geometric statistical mechanisms of predominance of line-of-sight, reduction in the number of effective scatterers, and shortening of blocked paths.
In most elevation-angle ranges, higher flight heights correspond to lower levels of shadow fading; at the same time, the shadow fading at higher heights is generally lower than at lower heights. This indicates that increasing height (h) can enhance the stability of LoS and weaken the fluctuations of slow fading, thereby reducing the variance of the shadow component.
At the same elevation angle, the shadow decay levels at different heights are relatively similar, with only minor variations. This indicates that, under the same moment and environmental conditions, the impact of height is secondary, while the elevation angle is the dominant factor. Particularly in the low-elevation-angle region, all three curves exhibit higher shadow decay levels, with noticeable fluctuations. As the elevation angle increases, the curves gradually converge, suggesting that in the high-elevation-angle region, the dependence of shadow decay on height diminishes.
Finally, through comparison, it can be observed that both the ITU-R P.1410 and Al Hourani models have significant shadow fading, which does not decrease with increasing angle. This reminds us to reserve a higher shadow margin in low-elevation-angle segments; the conservativeness can be moderately reduced in high-elevation-angle segments. Key operations should ideally be completed in the high- to mid-elevation-angle range to reduce slow fading uncertainties; if necessary, a higher flight altitude may be employed to achieve lower shadow variance. This stands in contrast to 3GPP models that disregard angle dependence, and it better reflects the propagation characteristics of drone-based air-to-ground communication channels.
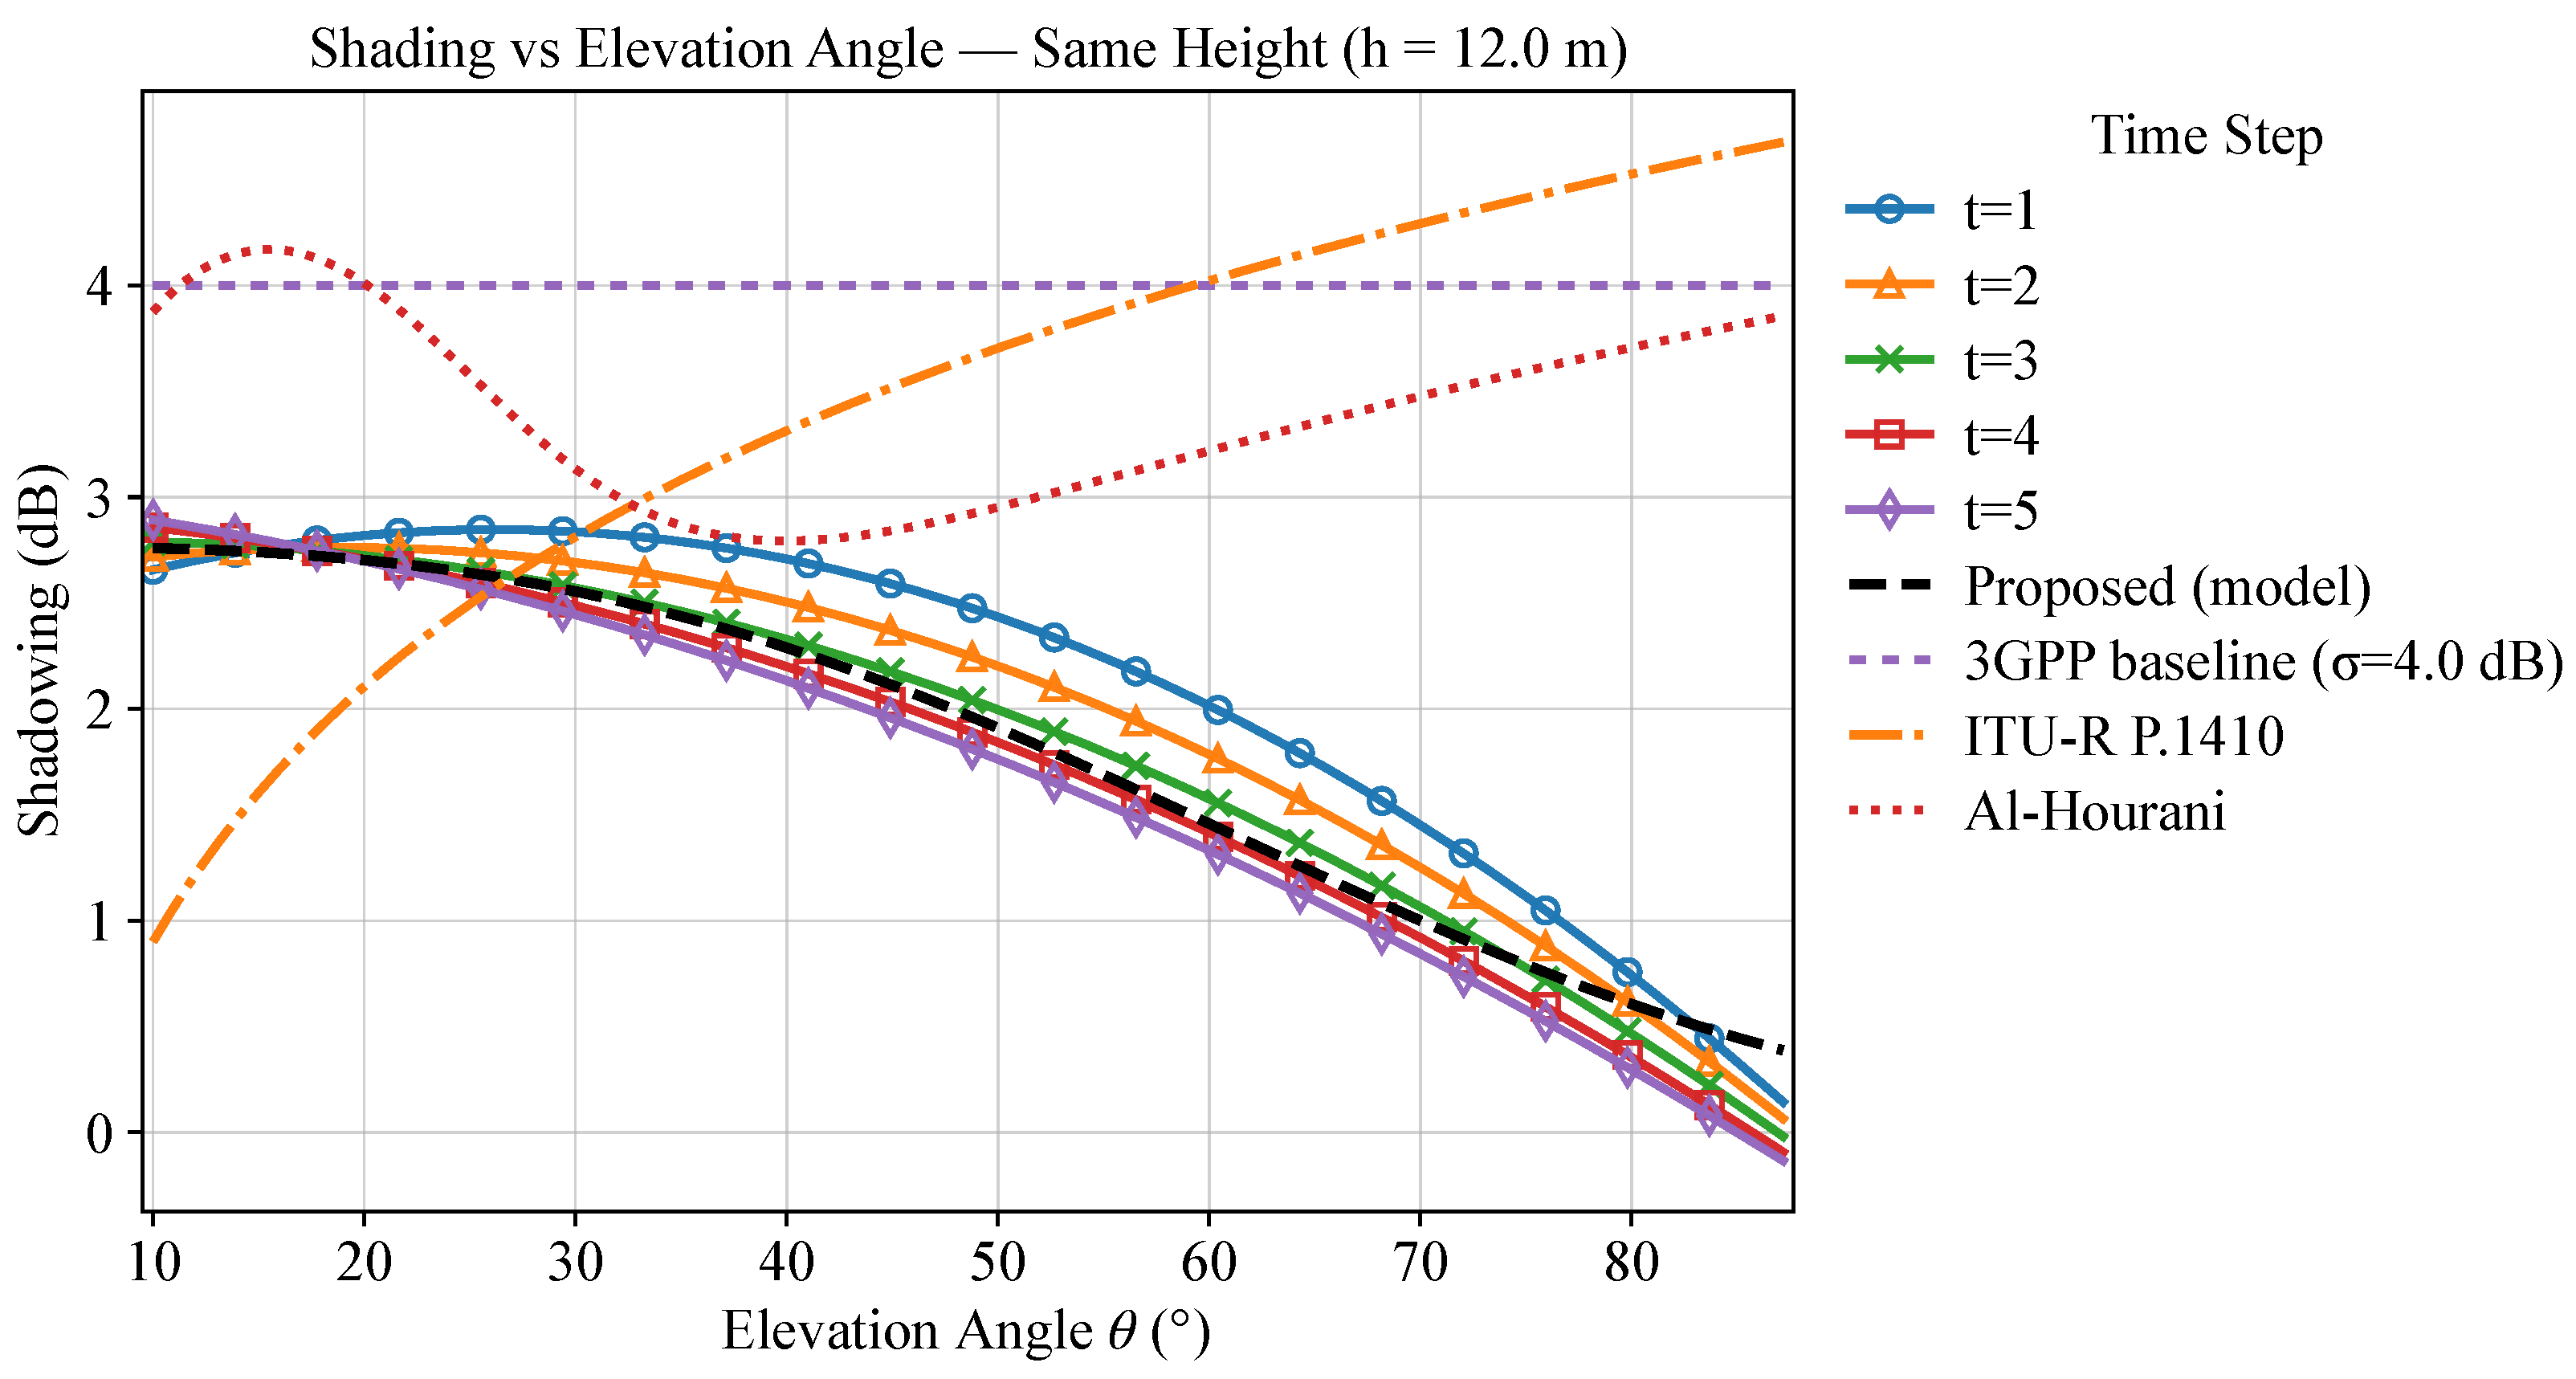
Figure 6 illustrates the variation of the standard deviation of shadow fading with elevation angle when the drone height is fixed at 12.0 m over five time intervals. Upon comparison of different time steps, the curves generally exhibit a similar downward trend, with the differences between time steps being most pronounced at low elevation angles. The curve separation across time steps is more significant in the low-elevation-angle region, indicating that this segment is more sensitive to environmental and trajectory changes over time. Physically, this is related to the lower LoS probability at low elevation angles, the higher proportion of diffraction and scattering components, and the fluctuation in scatterer visibility over time. It is recommended to allocate a higher shadow margin for this angle segment in link budgeting.
In the medium-elevation-angle region, the curve shapes at different moments are approximately parallel, mainly exhibiting an overall up-and-down shift due to “additive offset”; this indicates that the angle-dependent attenuation slope remains basically stable over time at the same height, while the temporal variation is primarily manifested in the offset of large-scale gain terms (such as overall fluctuations in scattering cluster power or short-term geometric distance differences). At high elevation angles, the differences between curves across different moments converge significantly; in this region, LoS (Line-of-Sight) dominates, and the path structure is simpler, with temporal variations being “averaged out”. From a practical perspective, this area can be regarded as a “stable operation zone”, suitable for hosting services that are not sensitive to time variations and do not require stable connectivity.
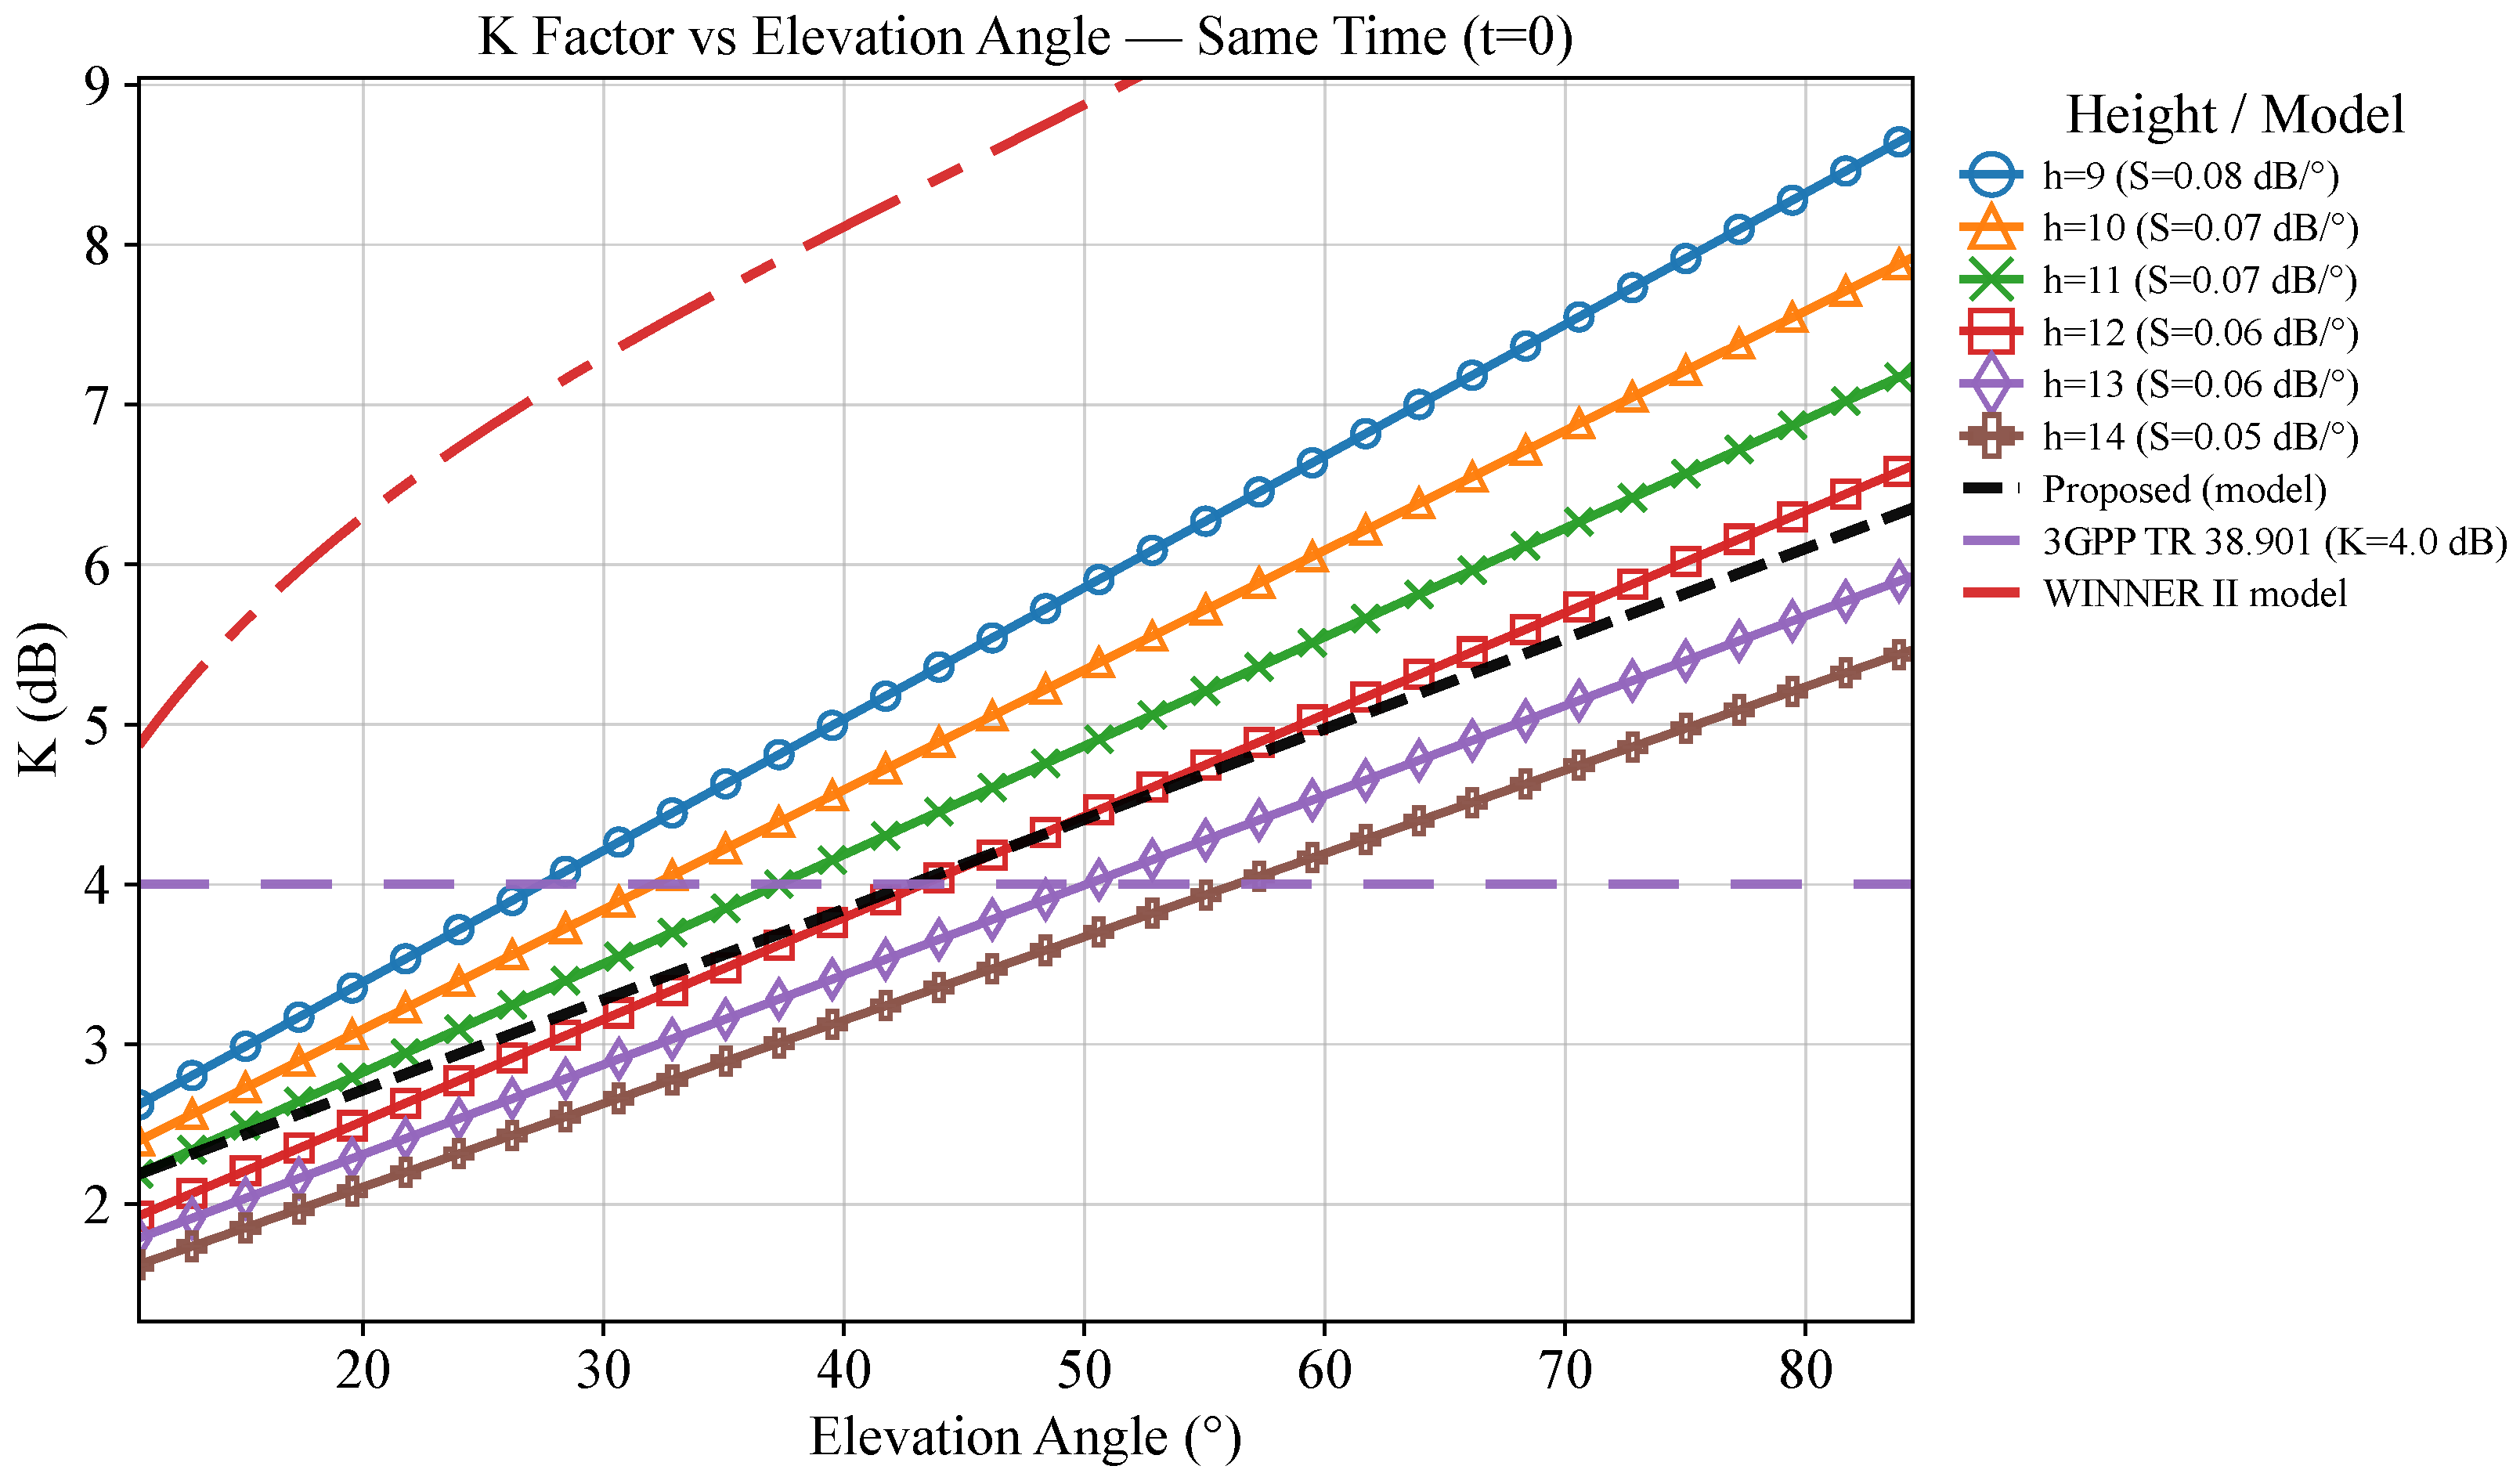
The K-factor represents the ratio of the line-of-sight (LoS) component to the multipath components. It reflects the quality and stability of the communication channel. As shown in Figure 7, at the same elevation angle, as the UAV height increases, the overall trend of k decreases; meanwhile, the sensitivity of k to the elevation angle weakens, meaning the k θ curve becomes flatter. Compared to low-height scenarios, near-ground scatterers are denser, and occlusion and ground reflections are more active. Even small changes in elevation angle can cause significant fluctuations in k. However, at higher altitudes, the propagation geometry and the visibility of scatterers are adjusted, resulting in the suppression of the response of the multipath structure to variations in angle, with the fluctuation amplitude of K significantly reduced with respect to θ .
When the altitude is higher, the trend of k varying with the elevation angle is smaller, making the system more robust to angular fluctuations. Therefore, in dynamic scenarios where elevation angles change rapidly (e.g., maneuvering flights or mission areas with significant environmental disturbances), prioritizing higher flight altitudes helps stabilize link quality and reduce uncertainties caused by large-scale fluctuations. Secondly, the 3GPP TR 38.901 and WINNER II models predict a somewhat higher K-factor at lower UAV heights compared to the proposed model. The curves for these models also show a less pronounced decrease in K-factor sensitivity with increasing elevation angle. This may be because these models do not fully account for the dynamics of UAV height and its effect on multipath visibility at various angles.
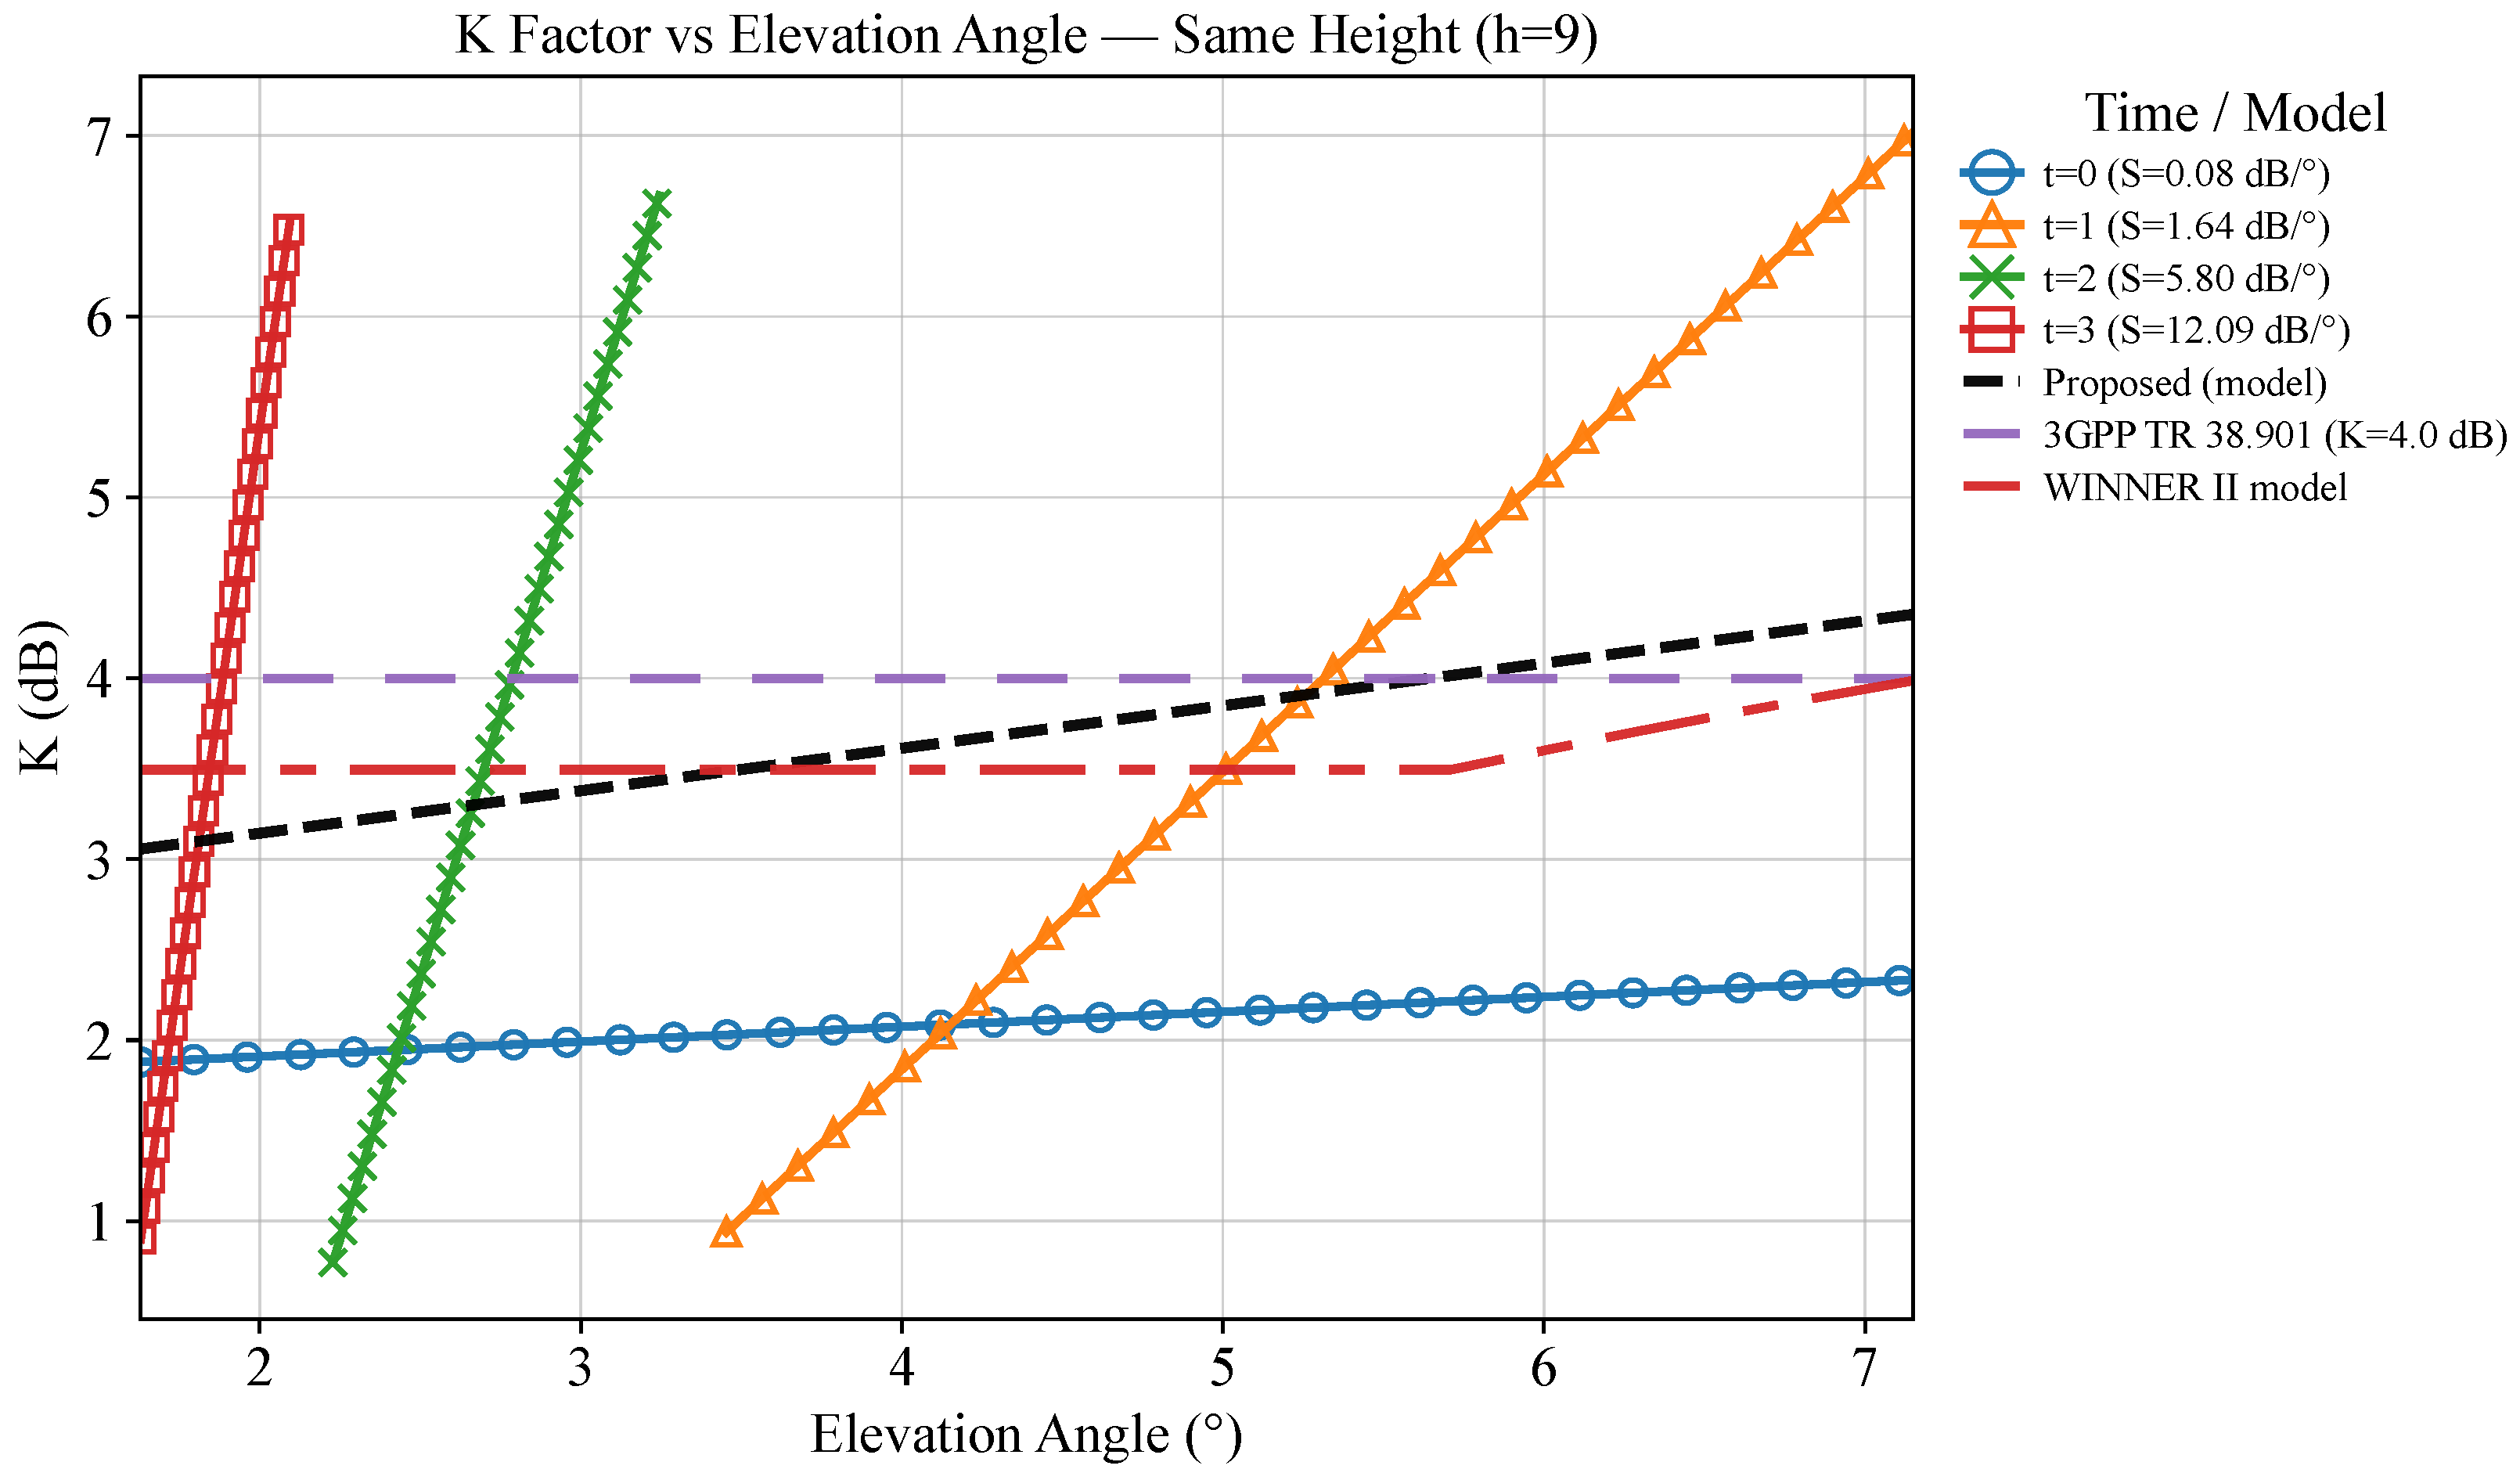
As shown in Figure 8, within the observed elevation range, all curves monotonically increase with angle ( θ ), which is consistent with the law of the air-to-ground channel, that is, a larger angle increases the probability of P LOS ( θ ) and enhances the specular component, thereby increasing the K-factor. The local-angle sensitivity ( S K dB / θ ) is positive at all time steps (t).
Angular sensitivity over time: The fitted slopes exhibit a clear ranking of t = 0 < t = 1 < t = 2 < t = 3 . A smaller S value indicates dominance of scattering or weak line-of-sight (LOS) conditions. A larger S value implies dominance of strong LOS/specular reflection—a slight increase in slope will increase the k factor.
Low-elevation-angle region: The K values at various moments are generally low, but the differences across moments are relatively insignificant; increasing the elevation angle in this region can bring about stable k gains. Medium downward viewing-angle region: The curves begin to separate significantly; moments with larger S values (such as t = 2, 3) are more sensitive to angle changes and yield faster benefits. High-elevation-angle region: The K values are generally higher, and the differences between different moments are further widened; the “strong angle dependence” in this period is particularly prominent at moments with larger S values.
At a fixed height, the relationship between the k factor and the down-looking angle exhibits characteristics of consistent morphology and time-varying sensitivity over time: the main difference at different moments lies in the “speed at which angle increase brings about K gain” rather than the trend direction itself. This result differs from the “height effect”, which focuses on changing the overall level of the curve, emphasizing the regulatory effect of time on the “LOS enhancement rate”.
The measurement and fitting results presented above consistently demonstrate that incorporating elevation angle into channel modeling significantly improves the accuracy and physical interpretability of UAV air-to-ground links. For path loss, the proposed model captures the monotonic decrease with elevation angle and the convergence of curves at high angles while also correctly reflecting that at the same angle, higher UAV altitudes yield larger attenuation. For shadow fading, the model reveals a clear reduction in standard deviation as the elevation angle increases, highlighting that angle is the dominant factor, whereas altitude plays a secondary role. The model successfully characterizes the steady increase in the K-factor with the elevation angle and its saturation at high angles while preserving the altitude dependence at low-to-medium angles.
The RMS Delay Spread (RMS-DS) represents the spread of signal arrival times due to multipath propagation in a wireless channel. It indicates how dispersed the received signal energy is over time. In the Figure 9, the RMS-DS values are primarily distributed within the range of 75–150 ns, exhibiting a statistical characteristic close to a normal distribution. The peak is observed in the range of approximately 100–125 ns, indicating that this delay spread value occurs most frequently in this channel environment. The relatively small RMS-DS values (<175 ns) indicate that the channel’s multipath effect is relatively weak. This distribution characteristic suggests favorable channel conditions, likely corresponding to line-of-sight propagation or an environment with fewer reflecting objects. The concentrated distribution of delay spreads benefits system timing synchronization and equalizer design.
Based on the RMS-DS distribution, the equalizer tap length and algorithm complexity can be optimized. The statistical properties of angular spread provide a basis for antenna spacing design in large-scale MIMO systems. The peak and variance of the distribution data can be used to set channel parameters in link-level simulations. The distribution changes of drones in different locations can be analyzed, and the temporal evolution characteristics of channels can be studied. This can provide guidance for the future development of correlation models between RMS-DS and RMS-AS, as well as simplified channel simulation methods based on statistical distributions.
Compared with other models, the proposed angle-aware formulations produce smoother and more physically consistent curves, eliminate systematic bias at low elevation angles, and provide parameter sets with clear physical meaning. These properties enable both better fitting to the measured data and improved generalization across different UAV heights and time steps. Overall, the results verify that elevation angle is a key parameter governing the statistical behavior of path loss, shadow fading, and the K-factor and that the proposed models provide a unified and effective framework for UAV channel characterization.

5. Conclusions

This paper proposes a dynamic path-loss model based on elevation angle and flight altitude, providing an in-depth analysis of the channel characteristics in UAV communication within urban environments. The study reveals that both elevation angle and flight altitude significantly affect path loss, shadowing, and the Ricean K-factor. Specifically, in urban environments, as the elevation angle increases, path loss and shadowing decrease, while the K-factor increases with the elevation angle. This research presents a more accurate model that effectively describes how wireless channels change with environmental variations during UAV flight, addressing the limitations of traditional models that fail to account for these factors.
Compared to existing models, the proposed model demonstrates higher accuracy and practicality, especially in complex urban environments. Simulation results validate the effectiveness of the theoretical model, providing essential theoretical support for the design and optimization of future UAV communication systems.
Future research can further explore the effects of more complex urban scenarios and dynamic environmental factors (such as tree obstructions, weather changes, etc.) on channel characteristics and conduct broader validation and optimization by incorporating real-world measurement data. Additionally, with the rapid development of 5G and future 6G communication technologies, efficient UAV-based communication systems will play a key role in smart cities, the Internet of Things (IoT), and other fields, further enhancing network reliability and coverage.
In the Table 2, all variables used in Section 3 and Section 4 of this paper are comprehensively defined and listed for reference.

Author Contributions

Conceptualization, N.X.; Methodology, Y.L.; Software, Y.Y.; Validation, N.X., Y.L. and Y.Y.; Formal analysis, N.X.; Investigation, N.X.; Resources, Y.Y.; Data curation, N.X.; Writing—original draft, N.X.; Writing—review & editing, Y.L. and Y.Y.; Visualization, N.X.; Supervision, Y.L.; Project administration, Y.L.; Funding acquisition, Y.L. All authors have read and agreed to the published version of the manuscript.

Funding

This work was supported by the Natural Science Foundation of China (NSFC) under Grant 61960206006, the Natural Science Foundation of China (NSFC) under Grant 62441108, the Key R&D Project of Jiangsu Province (Modern Agriculture) under Grant BE2022322, the “Pilot Plan” Internet of Things special project (China Institute of IoT (Wuxi) and Wuxi Internet of Things Innovation Promotion Center) under Grant 2022SP-T16-B; in part by the open foundation of Key Laboratory of Wireless Sensor Network and Communication, the Shanghai Institute of Microsystem and Information Technology, Chinese Academy of Sciences under Grant 20190917, the EU H2020 RISE TESTBED2 project under Grant 872172 and open foundation of Shaanxi Key Laboratory of Information Communication Network and Security, Xi’an University of Posts & Telecommunications.

Data Availability Statement

The original contributions presented in this study are included in the article. Further inquiries can be directed to the corresponding author.

Conflicts of Interest

The authors declare no conflicts of interest. The funders had no role in the design of the study; in the collection, analysis, or interpretation of data; in the writing of the manuscript; or in the decision to publish the results.

References

  1. Viswanathan, H.; Mogensen, P.E. Communications in the 6G era. IEEE Access 2020, 8, 57063–57074. [Google Scholar] [CrossRef]
  2. Yan, C.; Fu, L.; Zhang, J.; Wang, J. A comprehensive survey on UAV communication channel modeling. IEEE Access 2019, 7, 107769–107792. [Google Scholar] [CrossRef]
  3. Khawaja, W.; Guvenc, I.; Matolak, D.W.; Fiebig, U.C.; Schneckenburger, N. A survey of air-to-ground propagation channel modeling for unmanned aerial vehicles. IEEE Commun. Surv. Tutor. 2019, 21, 2361–2391. [Google Scholar] [CrossRef]
  4. Nikolaidis, V.; Moraitis, N.; Kanatas, A.G. Dual-polarized narrow-band MIMO LMS channel measurements in urban environments. IEEE Trans. Antennas Propag. 2017, 65, 763–774. [Google Scholar] [CrossRef]
  5. Tang, P.; Zhang, J.; Molisch, A.F.; Smith, P.J.; Shafi, M.; Tian, L. Estimation of the K-Factor for temporal fading from single-snapshot wideband measurements. IEEE Trans. Veh. Technol. 2019, 68, 49–63. [Google Scholar] [CrossRef]
  6. Liu, J.; Shi, Y.; Fadlullah, Z.M.; Kato, N. Space-air-ground integrated network: A survey. IEEE Commun. Surv. Tutor. 2018, 20, 2714–2741. [Google Scholar] [CrossRef]
  7. Li, B.; Fei, Z.; Zhang, Y. UAV communications for 5G and beyond: Recent advances and future trends. IEEE Internet Things J. 2019, 6, 2241–2263. [Google Scholar] [CrossRef]
  8. Gupta, L.; Jain, R.; Vaszkun, G. Survey of important issues in UAV communication networks. IEEE Commun. Surv. Tutor. 2016, 18, 1123–1152. [Google Scholar] [CrossRef]
  9. Chang, H.; Bian, J.; Wang, C.-X.; Bai, Z.; Zhou, W.; Aggoune, E.-H.-M. A 3D non-stationary wideband GBSM for low-altitude UAV-to-ground V2V MIMO channels. IEEE Access 2019, 7, 70719–70732. [Google Scholar] [CrossRef]
  10. Wu, S.; Wang, C.-X.; Aggoune, E.-H.-M.; Alwakeel, M.M.; You, X. A general 3-D non-stationary 5G wireless channel model. IEEE Trans. Commun. 2018, 66, 3065–3078. [Google Scholar] [CrossRef]
  11. Jiang, H.; Zhang, Z.; Gui, G. Three-dimensional non-stationary wideband geometry-based UAV channel model for A2G communication environments. IEEE Access 2019, 7, 26116–26122. [Google Scholar] [CrossRef]
  12. Molisch, A. Wireless Communications; Wiley: Hoboken, NJ, USA, 2011. [Google Scholar]
  13. Cheng, X.; Li, Y.; Bai, L. UAV communication channel measurement, modeling, and application. J. Commun. Inf. Netw. 2019, 4, 32–43. [Google Scholar] [CrossRef]
  14. Huang, Z.; Cheng, X. A general 3D space-time-frequency nonstationary model for 6G channels. IEEE Trans. Wirel. Commun. 2021, 20, 535–548. [Google Scholar] [CrossRef]
  15. Romeu, J.; Aguasca, A.; Alonso, J.; Blanch, S.; Martins, R.R. Small UAV radiocommunication channel characterization. In Proceedings of the Fourth European Conference on Antennas and Propagation, Barcelona, Spain, 12–16 April 2010; pp. 1–5. [Google Scholar]
  16. Simunek, M.; Fontan, F.P.; Pechac, P.; Otero, F.J.D. Space diversity gains in urban area low elevation links for surveillance applications. IEEE Trans. Antennas Propag. 2013, 61, 6255–6260. [Google Scholar] [CrossRef]
  17. Matolak, D.W.; Sun, R. Air–ground channel characterization for unmanned aircraft systems—Part I: Methods, measurements, and models for over-water settings. IEEE Trans. Veh. Technol. 2017, 66, 26–44. [Google Scholar] [CrossRef]
  18. Al-Hourani, A.; Kandeepan, S.; Jamalipour, A. Modeling air-to-ground path loss for low altitude platforms in urban environments. In Proceedings of the 2014 IEEE Global Communications Conference, Austin, TX, USA, 8–12 December 2014; pp. 2898–2904. [Google Scholar]
  19. Bai, L.; Huang, Z.; Cheng, X. A Non-Stationary 6G UAV Channel Model with 3D Continuously Arbitrary Trajectory and Self-Rotation. IEEE Trans. Wirel. Commun. 2022, 21, 10592–10606. [Google Scholar] [CrossRef]
  20. Safwat, N.E.-D.; Newagy, F.; Hafez, I.M. Air-to-ground channel model for UAVs in dense urban environments. IET Commun. 2020, 14, 1016–1021. [Google Scholar] [CrossRef]
  21. Seidel, S.Y.; Rappaport, T.S. A ray tracing technique to predict path loss and delay spread inside buildings. In Proceedings of the GLOBECOM’92—Communications for Global Users: IEEE, Orlando, FL, USA, 6–9 December 1992; pp. 649–653. [Google Scholar]
  22. Wang, C.-X.; Cheng, X.; Laurenson, D. Vehicle-to-vehicle channel modeling and measurements: Recent advances and future challenges. IEEE Commun. Mag. 2009, 47, 96–103. [Google Scholar] [CrossRef]
  23. Jiang, H.; Zhang, Z.; Dang, J.; Wu, L. A novel 3-D massive MIMO channel model for vehicle-to-vehicle communication environments. IEEE Trans. Commun. 2018, 66, 79–90. [Google Scholar] [CrossRef]
  24. Semkin, V.; Solomitckii, D.; Naderpour, R.; Andreev, S.; Koucheryavy, Y.; Räisänen, A.V. Characterization of radio links at 60 GHz using simple geometrical and highly accurate 3-D models. IEEE Trans. Veh. Technol. 2017, 66, 4647–4656. [Google Scholar] [CrossRef]
  25. Bithas, P.S.; Nikolaidis, V.; Kanatas, A.G.; Karagiannidis, G.K. UAV-to-ground communications: Channel modeling and UAV selection. IEEE Trans. Commun. 2020, 68, 5135–5144. [Google Scholar] [CrossRef]
  26. Sanchez, S.G.; Mohanti, S.; Jaisinghani, D.; Chowdhury, K.R. Millimeter-wave base stations in the sky: An experimental study of UAV-to-ground communications. IEEE Trans. Mob. Comput. 2022, 21, 644–662. [Google Scholar] [CrossRef]
  27. Wang, C.-X.; Bian, J.; Sun, J.; Zhang, W.; Zhang, M. A survey of 5G channel measurements and models. IEEE Commun. Surv. Tutor. 2018, 20, 3142–3168. [Google Scholar] [CrossRef]
  28. Simunek, M.; Fontán, F.P.; Pechac, P. The UAV low elevation propagation channel in urban areas: Statistical analysis and time-series generator. IEEE Trans. Antennas Propag. 2013, 61, 3850–3858. [Google Scholar] [CrossRef]
  29. Goddemeier, N.; Wietfeld, C. Investigation of air-to-air channel characteristics and a UAV specific extension to the Rice model. In Proceedings of the IEEE Globecom Workshops (GC Wkshps), San Diego, CA, USA, 6–10 December 2015; pp. 1–5. [Google Scholar]
  30. Ding, Y.; Xiao, Y.; Xie, J.; Zhang, T. A time-varying transition channel model for air-ground communication. In Proceedings of the 2017 IEEE/AIAA 36th Digital Avionics Systems Conference, St. Petersburg, FL, USA, 17–21 September 2017; pp. 1–8. [Google Scholar]
  31. Gao, X.; Chen, Z.; Hu, Y. Analysis of unmanned aerial vehicle MIMO channel capacity based on aircraft attitude. WSEAS Trans. Inf. Sci. Appl. 2013, 10, 58–67. [Google Scholar]
  32. Zeng, L.; Cheng, X.; Wang, C.-X.; Yin, X. A 3D geometry-based stochastic channel model for UAV-MIMO channels. In Proceedings of the 2017 IEEE Wireless Communications and Networking Conference (WCNC), San Francisco, CA, USA, 19–22 March 2017; pp. 1–5. [Google Scholar]
  33. Jin, K.; Cheng, X.; Ge, X.; Yin, X. Three dimensional modeling and space-time correlation for UAV channels. In Proceedings of the 2017 IEEE 85th Vehicular Technology Conference (VTC Spring), Sydney, NSW, Australia, 4–7 June 2017; pp. 1–5. [Google Scholar]
  34. Jiang, K.; Chen, X.; Zhu, Q.; Zhong, W.; Wang, Y.; Yu, X.; Chen, B. A geometry-based 3D non-stationary UAV-MIMO channel model allowing 3D arbitrary trajectories. In Proceedings of the 2018 10th International Conference on Wireless Communications and Signal Processing (WCSP), Hangzhou, China, 18–20 October 2018; pp. 1–6. [Google Scholar]
  35. Jiang, H.; Zhang, Z.; Wu, L.; Dang, J. Three-dimensional geometry-based UAV-MIMO channel modeling for A2G communication environments. IEEE Commun. Lett. 2018, 22, 1438–1441. [Google Scholar] [CrossRef]
  36. Cheng, X.; Li, Y. A 3-D geometry-based stochastic model for UAV-MIMO wideband nonstationary channels. IEEE Internet Things J. 2019, 6, 1654–1662. [Google Scholar] [CrossRef]
  37. Zhang, X.; Cheng, X. Three-dimensional non-stationary geometry-based stochastic model for UAV-MIMO Ricean fading channels. IET Commun. 2019, 13, 2617–2627. [Google Scholar] [CrossRef]
  38. Huang, Z.; Zhang, X.; Cheng, X. Non-geometrical stochastic model for non-stationary wideband vehicular communication channels. IET Commun. 2020, 14, 54–62. [Google Scholar] [CrossRef]
  39. Li, Y.; He, R.; Lin, S.; Guan, K.; He, D.; Wang, Q.; Zhong, Z. Cluster-based nonstationary channel modeling for vehicle-to-vehicle communications. IEEE Antennas Wirel. Propag. Lett. 2017, 16, 1419–1422. [Google Scholar] [CrossRef]
  40. Wu, S.; Wang, C.-X.; Aggoune, E.-H.-M.; Alwakeel, M.M.; He, Y. A non-stationary 3-D wideband twin-cluster model for 5G massive MIMO channels. IEEE J. Sel. Areas Commun. 2014, 32, 1207–1218. [Google Scholar] [CrossRef]
  41. Ghazal, A.; Yuan, Y.; Wang, C.X.; Zhang, Y.; Yao, Q.; Zhou, H.; Duan, W. A non-stationary IMT-advanced MIMO channel model for high-mobility wireless communication systems. IEEE Trans. Wirel. Commun. 2017, 16, 2057–2068. [Google Scholar] [CrossRef]
  42. Chang, H.; Wang, C.X.; Liu, Y.; Huang, J.; Sun, J.; Zhang, W.; Gao, X. A novel nonstationary 6G UAV-to-ground wireless channel model with 3-D arbitrary trajectory changes. IEEE Internet Things J. 2021, 8, 9865–9877. [Google Scholar] [CrossRef]
  43. Xiao, C.; Wu, J.; Leong, S.-Y.; Zheng, Y.R.; Letaief, K.B. A discrete-time model for triply selective MIMO Rayleigh fading channels. IEEE Trans. Wirel. Commun. 2004, 3, 1678–1688. [Google Scholar] [CrossRef]
  44. Xiao, C.; Zheng, Y.; Beaulieu, N. Novel sum-of-sinusoids simulation models for Rayleigh and Rician fading channels. IEEE Trans. Wirel. Commun. 2006, 5, 3667–3679. [Google Scholar] [CrossRef]
  45. Liu, B.; Gui, G.; Matsushita, S.; Xu, L. Dimension-reduced direction-of-arrival estimation based on 2,1-norm penalty. IEEE Access 2018, 6, 44433–44444. [Google Scholar] [CrossRef]
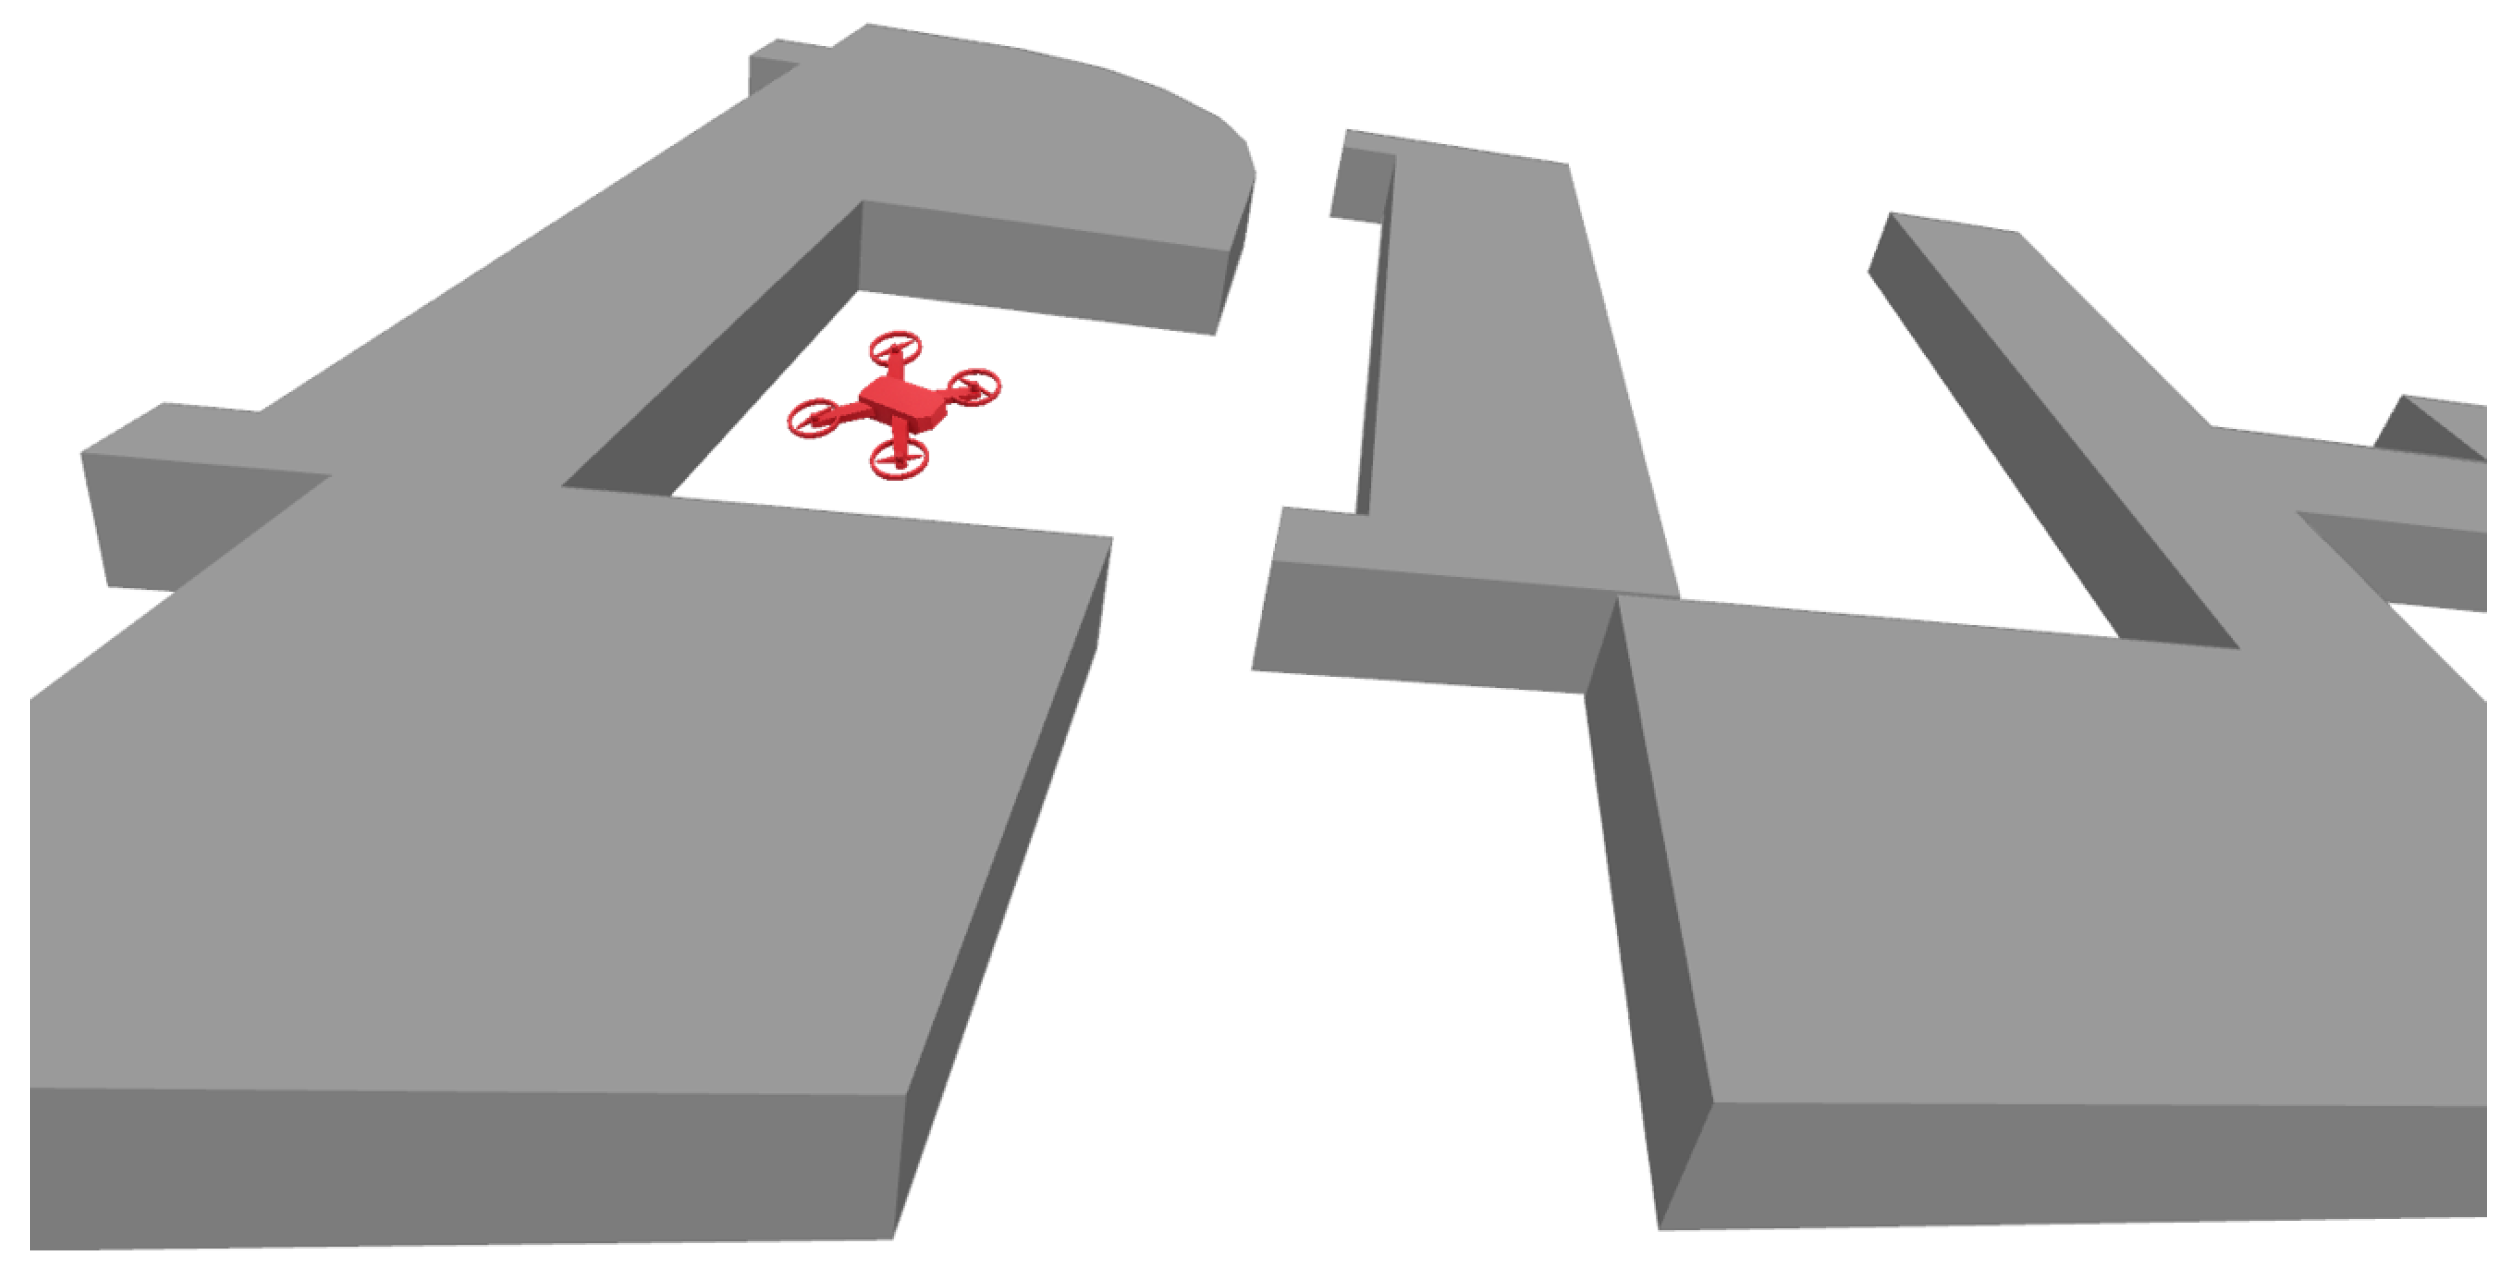
Figure 1. Ray-tracing scenario representation in WinProp, red objects represent drones, gray represents buildings.
Mathematics 13 03377 g001
Figure 2. Raw data points and fitted data.
Mathematics 13 03377 g002
Figure 3. (a) Path loss vs. elevation angle at t = 3 for three UAV heights with baseline model comparison (3GPP, ITU-R P.1410, Al-Hourani). (b) Angle-binned RMSE vs. elevation angle after 80° alignment (Proposed vs. 3GPP, ITU-R P.1410, Al-Hourani). f c = 2000 MHz, d 0 = 1, n L = 2.46, c h = 0.06, b θ = 0.626, Δ P L = 73.
Mathematics 13 03377 g003
Figure 4. (a) Path loss vs. elevation angle at a fixed UAV height (h = 18.0 m) across five time steps (t = 1–5), with baseline model comparison (3GPP, ITU-R P.1410, Al-Hourani). (b) Angle-binned RMSE vs. elevation angle after 80° alignment (Proposed vs. 3GPP, ITU-R P.1410, Al-Hourani). f c = 2000 MHz, d 0 = 1 , n L = 2.1 , c h = 0.3 , b θ = 0.5 , Δ P L = 130 .
Mathematics 13 03377 g004
Figure 5. Shading vs. elevation angle at t = 1 for three UAV heights (h = 9.0, 11.5, and 14.0 m), with baseline model comparison (3GPP σ = 4.0 dB, ITU-RP.1410, Al-Hourani). σ = 5.65 , σ 0 = 2.77 , k θ = 3.0 , β = 0.022 , k h = 1 , h ref = 6.67 .
Mathematics 13 03377 g005
Figure 6. Shading vs. elevation angle at a fixed UAV height (h = 12.0 m) across time steps t = 1–5, with the proposed model and baseline comparisons (3GPP σ = 4.0 dB, ITU-R P.1410, Al-Hourani). σ = 5.65 , σ 0 = 3.88 , k θ = 0.017 , β = 0.022 , k h = 1 , h r e f = 32 .
Mathematics 13 03377 g006
Figure 7. K-factor vs. elevation angle at t = 0 for six UAV heights (9–14 m), with the proposed model and baselines (3GPP TR 38.901, WINNER II). K 0 = 2.38 , β = 0.23 , a θ = 0.23 , b θ = 1.08 , θ m i n = 1.62 , and θ m a x = 7.14 .
Mathematics 13 03377 g007
Figure 8. K-factor vs. elevation angle at a fixed UAV height (h = 9.0 m) across time steps (t = 0–3), with the proposed model and baselines (3GPP TR 38.901, WINNER II). K 0 = 3.0 , β = 0.97 , a θ = 0.012 , b θ = 0.75 , θ min = 10.6 , θ max = 84.4 .
Mathematics 13 03377 g008
Figure 9. Root mean square (RMS) delay spread and angle spread.
Mathematics 13 03377 g009
Table 1. Ray-tracing (RT) runtime examples and our scenario.
ScenarioRT EngineRef-Trans-DiffRx PointsTime
Indoor officeSBR6-4-1500021.5 min
Chicago cityFull 3D RTN/AN/A7 h
COST-231 MunichRTN/AN/Afew min
City scenarioWinProp RT2-3-112,533one min
Elevation-aware modelAnalytical inference2-3-112,5332 s
Note: N/A indicates that the corresponding parameter is not mentioned in the paper.
Table 2. Summary of variables.
VariableDescription
P L Path loss (in dB)
P L 0 ( f c ) Reference path loss at frequency f c
n L Path-loss exponent
hUAV flight altitude
θ Elevation angle
X σ ( θ , h ) Shadow-fading random variable
d 0 Reference distance
d 3 D 3D distance
d 2 D 2D distance
g ( θ ) Function dependent on elevation angle
σ 0 Upper bound for small elevation angles
σ Lower bound for large elevation angles
k θ Decay rate with elevation angle
k h Decay rate with height
β Curvature index of angular attenuation
P L O S ( θ ) Line-of-sight probability dependent on elevation angle
c h Angle gain factor controlling the overall angle gain
b θ Nonlinearity control factor
Δ P L Mean difference between model and data
Disclaimer/Publisher’s Note: The statements, opinions and data contained in all publications are solely those of the individual author(s) and contributor(s) and not of MDPI and/or the editor(s). MDPI and/or the editor(s) disclaim responsibility for any injury to people or property resulting from any ideas, methods, instructions or products referred to in the content.