Abstract
Postpartum haemorrhage is one of the leading causes of maternal morbidity and mortality worldwide. The early identification of bleeding risk in individual women is crucial for enabling timely interventions and improving patient outcomes.This study aims to evaluate various exploratory and classification methodologies, alongside optimisation strategies, for identifying predictors of postpartum haemorrhage. K-means clustering was employed on a retrospective cohort of patients, incorporating demographic, obstetric, and laboratory variables, to delineate patient profiles and select pertinent features. Initially, a classical logistic regression model, implemented without cross-validation, facilitated the identification of six significant predictors for postpartum haemorrhage: lactate dehydrogenase, urea, platelet count, non-O blood group, gestational age, and first-degree lacerations, all of which are variables routinely available in clinical practice. Furthermore, machine learning algorithms—including stepwise logistic regression, ridge logistic regression, and random forest—were utilised, applying cross-validation to optimise predictive performance and enhance generalisability. Among these methodologies, ridge logistic regression emerged as the most effective model, achieving the following metrics: sensitivity 0.857, specificity 0.875, accuracy 0.871, F1-score 0.759, and AUC 0.907. While machine learning techniques demonstrated superior performance, the integration of classical statistical methods with machine learning approaches provides a robust framework for generating reliable predictions and fostering significant clinical insights.
Keywords:
clustering analysis; logistic regression; ridge logistic regression; random forest; machine learning models; postpartum haemorrhage; risk factors MSC:
62P10; 62J12; 62G10; 62H30
1. Introduction
Obstetric haemorrhage is a critical health issue directly responsible for nearly one-third of maternal deaths around the world [1]. Although most of these deaths occur in low-income countries [1], the incidence and morbidity associated with this haemorrhage persists at significant levels even in high-income countries [2,3,4,5,6,7,8,9,10,11,12,13,14,15,16], driven by factors that remain uncertain [9,13,14,17]. Accurately predicting postpartum haemorrhage (PPH) is crucial, as it enables efficient resource allocation for high-risk parturients and allows healthcare providers to implement preventive measures to reduce bleeding [18]. The potential for improvement is significant: up to one-third of obstetric haemorrhage is preventable. In these instances, 80% of the incidents could be avoided or mitigated with the timely identification of haemorrhage and a swift response [19,20,21]. However, clinicians are hindered in their capacity to predict postpartum haemorrhage, limiting their ability to provide the most effective and personalised care [22]. To tackle these challenges, machine learning (ML) algorithms have gained significant traction in recent years [23,24], with numerous risk factors being thoroughly examined and integrated into diverse statistical models, leading to the development of several scoring systems [4,23,25,26,27,28].
In a systematic review focused on identifying predictors of postpartum haemorrhage using machine learning techniques, Ranjbar et al. [29] emphasised the differing levels of accuracy across the four eligible studies, with the area under the curve (AUC) ranging from 0.706 to 0.979. Given the overall low to moderate risk of bias and the substantial sample sizes involved, the authors concluded that machine learning has the potential to make significant contributions. Sinambela et al. [24] highlighted logistic regression, extreme gradient boosting, random forest, and decision trees as the most commonly used machine learning techniques for predicting postpartum haemorrhage, showcasing their promising applicability in this field. Recently, Baeta et al. [23] conducted a literature review of 35 studies. Among these, two studies compared conventional statistical methods to machine learning models, revealing that the latter were superior. However, this advantage comes with drawbacks in real-world applications due to the increased complexity resulting from the large number of features included in the models. Liu et al. [30] investigated the applicability of 27 prediction models in severe postpartum haemorrhage (23 evolving logistic regression and 3 machine learning algorithms). The authors concluded their limited utility due to methodological flaws, especially in model development and validation. In a systematic review that addressed the impact of biomarkers on postpartum haemorrhage, Moreuil et al. [31] emphasised the variability between studies and reported no statistically significant findings for postpartum haemorrhage. Carr et al. [28] reviewed prognostic models and found no model ready for clinical application due to the high risk of bias. They emphasised the need for external validation of the sixteen included studies, all but one of which relied on multivariable logistic regression analysis. Aligned with these conclusions were the findings of another systematic review of prognostic models from Neary et al. [32]. The authors highlighted the considerable risk of bias and the need to develop robust prognostic models for the general obstetric population among the 14 studies included.
A novel approach for feature selection has been proposed, employing demographic, obstetric, and laboratory data in the context of postpartum haemorrhage for both vaginal and caesarean deliveries at a tertiary maternity hospital. To achieve this, a comparative analysis was conducted between classical logistic regression and three machine learning models, thereby evaluating a range of variables that are routinely assessed in clinical practice.
The structure of the paper commences with a descriptive analysis aimed at characterising the cohort of pregnant women involved in the study. This analysis provides a comprehensive overview of their demographic, obstetric, and laboratory characteristics. The results of this characterisation are in Appendix A.
Given the potential correlations among the variables, an unsupervised clustering analysis employing K-means was conducted to identify subgroups of patients with varying levels of predisposition to postpartum haemorrhage. This exploratory step sought to reveal clinically significant patterns, thereby assisting in the determination of whether specific profiles of women are at a higher risk or, conversely, more protected from postpartum haemorrhage, thus underscoring the clinical relevance of these distinctions.
Subsequent to this exploratory phase, the analysis returned to the original variables to identify individual risk factors for postpartum haemorrhage. To achieve this, classical logistic regression and machine learning approaches were employed, including logistic regression, ridge logistic regression, and random forest algorithms. The utilisation of machine learning techniques offers the advantage of capturing complex, potentially nonlinear relationships among predictors, thereby complementing traditional statistical methods and enhancing the robustness of the findings. The advancement in these statistical tools, alongside the largely preventable nature of obstetric haemorrhage, emphasises the significance of machine learning models as research targets aimed at mitigating the global burden of postpartum haemorrhage.
2. Recent Advances in Postpartum Haemorrhage Research
Several studies have explored the most effective models for analysing data to predict postpartum haemorrhage. Although there is still no consensus on the best method to achieve this goal, it is recognised that the number of features in a model is not directly correlated with its accuracy [23]. Simpler models may perform well and have greater applicability in real-world settings. The advantages of logistic regression models include their simplicity, transparency, and explainability for healthcare providers, and their ease of implementation [33]. In contrast, machine learning techniques excel at handling nonlinearity and can incorporate more complex data [33]. The lack of robust external validation remains the most significant barrier to the practical use of postpartum haemorrhage prediction models in everyday settings [34,35], where clinicians struggle with their limited ability to predict postpartum haemorrhage [22].
Table 1 presents a literature review with the main approaches and contributions to this issue.

Table 1.
Overview of recent studies applying machine learning techniques to predict postpartum haemorrhage.
3. Materials and Methods
3.1. Study Population
This study was a retrospective cohort analysis of all consecutive deliveries that occurred at Santa Maria University Hospital in Lisbon from February to July 2023. The study included participants aged 18 and older with a gestational age of more than 37 weeks who provided written informed consent for additional coagulation assays alongside standard blood tests. Conversely, patients admitted outside the laboratory operating hours were excluded, as specialised equipment and technicians were necessary to perform some of the tests in accordance with best practices. The study design and reporting adhered to the Strengthening the Reporting of Observational Studies in Epidemiology (STROBE) guidelines [43]. It was conducted in accordance with the Declaration of Helsinki and received approval from the Ethics Committee of the Lisbon Academic Medical Centre (protocol code 49/23).
3.2. Potential Risk Factors
The candidate predictors included both antepartum and intrapartum risk factors, along with a comprehensive screening of haemostatic variables available upon the patient’s arrival in the labour ward. The antepartum predictors included maternal age, body mass index (BMI) at delivery, the number of previous vaginal and/or caesarean deliveries, and total number of pregnancies and multiple pregnancies. Additionally, maternal ethnicity; existing medical conditions; medications; and any history of postpartum haemorrhage, placental disorder, coagulopathy, and anaemia were recorded. During the intrapartum period, mode of delivery was categorised in vaginal delivery, instrumental vaginal delivery, and caesarean section. Birthweight, lacerations (grade I, II, III, and IV), and episiotomy were also documented, along with obstetric haemorrhage.
Considering the haemostatic predictors, blood samples were collected from intravenous cannulae or by direct venipuncture at the time of patient’s admission to the labour ward (T0). The following laboratory tests were performed: complete blood count, standard coagulation tests (including fibrinogen, activated partial thromboplastin time (APTT), and pro-thrombin time), D-dimers, coagulation factor XIII (FXIII), fibrin monomers, alanine aminotransferase, creatinine, urea, C-reactive protein (CRP), and lactate dehydrogenase (LDH). Data reliability was ensured through a programme implemented in the labour ward, which involved accurate data collection by anaesthesiologists, obstetricians, and midwives regarding postpartum haemorrhage risk factors and intrapartum variables. Instead of relying on a subjective assessment of blood loss, which was also recorded and detailed in the Appendix A, this study utilised the change in haemoglobin concentration over 24 h after birth as an objective metric for quantifying haemorrhage.
3.3. Statistical Analysis
For this study, a retrospective database consisting of 147 pregnant women from Santa Maria University Hospital in Lisbon was utilised. This database encompasses demographic, obstetric, and laboratory variables, thereby enabling the identification of risk factors associated with postpartum haemorrhage. Given the presence of missing data, particularly in laboratory variables, imputation methods, specifically multiple imputation by chained equations (MICE), were employed.
To conduct an exploratory analysis, K-means clustering was applied as an unsupervised classification method to identify potential groups of related variables. After forming these groups, differences in mean haemoglobin levels were evaluated among the identified clusters. This step is valuable as it helps discern groups of women who may have a higher or lower risk of bleeding.
The primary objective of this study is to identify risk factors associated with postpartum haemorrhage. To this end, haemoglobin levels were assessed at two time points: before delivery (T0) and 24 h after delivery (T1), and the variation in haemoglobin levels (T1–T0) was calculated. This variation was subsequently categorised as a binary variable, with a difference of 2 g/dL deemed indicative of postpartum haemorrhage [44].
To identify factors that may predict postpartum haemorrhage, a standard multivariable logistic regression model was initially fitted to the complete dataset without utilising cross-validation. The stepwise selection method was used for variable selection. This classical model primarily served to interpret the coefficients and identify variables significantly associated with postpartum haemorrhage, thereby providing insights into the relative importance of these predictors.
Subsequently, machine learning models, including logistic regression, ridge logistic regression, and random forest, were trained and evaluated using 5-fold cross-validation to optimise predictive performance and mitigate overfitting. The variables identified in the classical model were retained to ensure consistency with the original model. Binary classification thresholds were optimised using Youden’s index, as it provides a clinically interpretable balance between sensitivity and specificity, particularly suited for clinical data where balanced sensitivity and specificity are desired, even under varying outcome prevalences [45].
To address class imbalance resulting from the low prevalence of postpartum haemorrhage, a comparison was performed between the ML models trained on the original dataset and those trained using random oversampling to preform random replications of the minority class [46]. Performance metrics, including AUC, sensitivity, specificity, and F1-score, were calculated to evaluate predictive ability and assess the effects of oversampling. A more detailed description of the methodologies employed throughout this research is provided below.
The statistical analysis was conducted using R software version 4.2.3. All the results were considered statistically significant at a 5% significance level.
3.3.1. Multiple Imputation by Chained Equations
The proportion of missing data varied between 0% to 9.5% across the analysed variables. To address this issue, MICE was employed, adhering to the missing at random (MAR) approach. This approach was chosen to mitigate the potential underestimation of standard errors often associated with simple mean imputation, thereby enhancing the reliability of the statistical inferences derived from the data [47].
Multiple imputation is a statistical technique for handling missing data that by using the distribution of the observed data results in the creation of multiple complete datasets in which the missing values are filled with the most plausible values.
MICE is a specific method of multiple imputation that runs through an iterative procedure. Initially, the available complete data is used to estimate the imputation model for the variable with the least missing values. Then, the variable with the second least missing values is imputed using both the complete data and the values imputed in the previous interaction. This process continues for all variables and the final iteration constitutes in one imputed dataset [48].
To assess the potential impact of imputation on model estimates, a sensitivity analysis was conducted. This involved comparing the classical logistic regression model fitted to the imputed dataset with the same model fitted only to the complete cases.
3.3.2. K-Means
Considering the number of variables and the clinical significance of identifying patterns that may elucidate varying predispositions to bleeding, K-means clustering was employed as a component of the exploratory analysis.
This methodology was applied before classifying the haemoglobin difference ≥ 2 g/dL as postpartum haemorrhage. This continuous variable was not used in the clustering process, allowing an assessment of whether significant differences existed in the mean haemoglobin difference between the generated clusters.
K-means is one of the most known and used unsupervised machine learning non-hierarchical clustering algorithm. Its implementation starts with initialising cluster centroids k randomly selected from the dataset and assigning each data point to the nearest centroid based on a distance metric. Once all the data points have been assigned, the clusters are updated by recalculating the centroids as the average of all the points in the respective clusters, and each point is reassigned to the new nearest centroid. This process is repeated iteratively until the centroids stabilise between successive iterations [49,50].
To compute the Euclidean distance, two distinct data points from the dataset, denoted x and y, are considered. These points represent individual observations that may differ across multiple specific features or variables. Assuming that each data point is characterised by n different variables, the vectors can be represented as and in a n-dimensional space, where the Euclidean distance is commonly used as a standard metric to quantify the dissimilarity between two points, such as x and y, and can be obtained with Equation (1) [50]. This distance metric assumes that all variables are continuous and equally scaled, which is why the variables should be standardised before applying this method.
To evaluate the quality of the clusters generated by the K-means algorithm, a silhouette analysis was performed. This method assesses how well each observation fits within its assigned cluster compared with other clusters. Higher values indicate that objects are close to their own cluster and well separated from other clusters. The number of clusters with the highest average silhouette score is considered optimal [51].
In order to effectively illustrate the outcomes of the K-means clustering analysis, a PCA was performed, resulting in a two-dimensional scatter plot representation of the data.
3.3.3. Classical Binary Logistic Regression
By categorizing the postpartum haemorrhage as a binary outcome (0—haemoglobin difference < 2 g/dL; 1—haemoglobin difference ≥ 2 g/dL), logistic regression was applied to assess which factors were predictive of postpartum haemorrhage. A haemoglobin difference of ≥2 g/dL was classified as postpartum haemorrhage and considered the outcome category [44].
In this way, the probability that a patient will present a haemoglobin difference ≥ 2 g/dL, can be given by the following:
where
- is the probability that the i-th observation has haemoglobin difference ≥ 2 g/dL;
- is the intercept;
- are the regression coefficients;
- are the values of the independent variables for observation i.
Stepwise selection method was applied and the parameters were estimated using the maximum likelihood method. The statistical significance of each predictor was assessed using the Wald test.
3.3.4. Machine Learning Approaches
Machine learning models have gained significant traction in predicting postpartum haemorrhage. These models utilise extensive clinical datasets to generate haemorrhage predictions based on various input indicators. The primary advantages of machine learning include its ability to process non-additive relationships and account for complex interactions among indicators without the need to pre-specify these relationships [52]. In this subsection, the application of logistic regression, ridge logistic regression, and random forest models within a machine learning framework for the prediction of postpartum haemorrhage will be examined. In the context of logistic regression applied through machine learning techniques, the formulation of the model remains consistent with previous discussions; however, cross-validation and parameter optimisation are employed to prioritise predictive performance over interpretability. This approach facilitates a more robust evaluation of the model’s capacity to accurately forecast occurrences of postpartum haemorrhage.
- Ridge logistic regression model
Ridge logistic regression extends standard logistic regression by incorporating an L2 penalty to address overfitting and multicollinearity among explanatory variables [53]. This shrinkage technique can yield more stable coefficient estimates and enhance predictive performance, thereby justifying its selection for the present study. The estimation of coefficients is achieved through the minimisation of the penalised negative log-likelihood function:
where is the predicted probability for observation i, is the vector of coefficients for the p covariates, n is the number of observations, and is the ridge penalty parameter controlling the degree of shrinkage. The value of can range from 0 to ∞; when , ridge logistic regression reduces to standard logistic regression since no penalty is applied [54]. In this case, the penalty parameter was selected via cross-validation over a predefined grid to balance bias and variance.
- Random forest
Random forest models have consistently demonstrated robust performance in predicting postpartum haemorrhage, often surpassing other machine learning algorithms. Gong et al. [55] reported superior outcomes in comparison to extreme gradient boosting, classification and regression trees, and artificial neural networks, achieving an AUC of 0.893. Similarly, Holcroft et al. [40] identified the random forest model as the most effective classifier, attaining a specificity of 71.3%. Furthermore, Wang et al. [38] observed that the random forest model yielded the best predictive performance for the overall population, with an AUC of 0.84, and an even higher AUC of 0.95 specifically for caesarean deliveries.
Having this in consideration, random forest was implemented as a comparative method alongside standard and ridge logistic regression to evaluate which approach provides greater predictive performance in this study.
This type of ensemble learning method is widely used for both classification and regression tasks in machine learning. During training, random forest produces multiple decision trees and combines their outputs in order to get more stable and accurate predictions. Each tree is trained on a randomly selected subset of the training data (with replacement) and as a result some data may be used multiple times within a single tree’s training set, while others might never be used. In the end, the decision forest selects, as the predicted outcome, the classification that receives the highest number of votes (most frequent value) across all the trees [56]. This type of classifier requires the specification of two parameters to construct a predictive model: the number of decision trees to be generated (k), and the number of predictor variables (m) randomly selected at each node to make the tree grow. The dataset is classified using a constant number of m random predictive variables and each instance in the dataset is evaluated by the k trees. Regarding the selection of m, a good default value is given by the following:
- For classification: ;
- For regression: .
where p is the number of input variables [57].
A range of values for k and m was explored, including the default values. Each combination was systematically evaluated using cross-validation, and the configuration yielding the highest predictive performance was selected as optimal.
An additional benefit of the random forest is that it is able to access the relative importance of the different features or variables during the classification, which allows the user to understand how each predictive variable influences the classification model. To measure the importance of each feature, the values of a single predictor variable are randomly modified while all the other variables are kept constant, and the model determines the decrease in accuracy [58].
4. Results & Discussion
A total of 147 parturients were included, with the summary statistics presented in Table A1 for all the variables under analysis.
4.1. K-Means
Considering the presence of some moderate to strong correlations among the variables shown in Figure 1, the K-means clustering method was applied as part of the exploratory analysis in order to visualize how the sample could be organised in separate clusters in terms of this set of variables to understand which influence in a greater scale each cluster. Given that haemoglobin difference after delivery was not used in cluster generation, this methodology also provided valuable information on how the resulting clusters differ with respect to this variable.
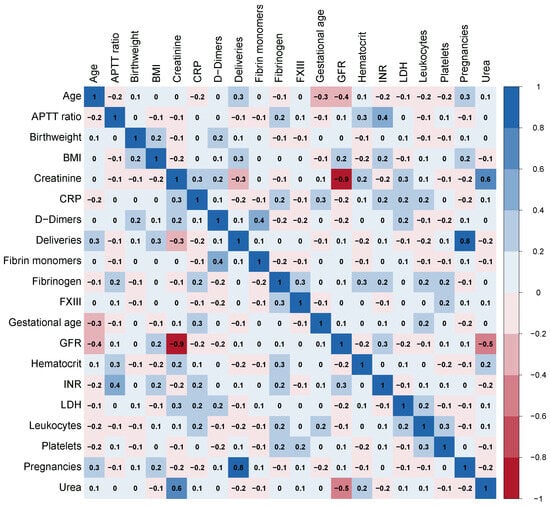
Figure 1.
Correlation matrix heat map. INR: international normalised ratio; APTTratio: activated partial thromboplastin time ratio; BMI: body mass index; FXIII: coagulation factor XIII; GFR: glomerular filtration rate; CRP: C-reactive protein; LDH: lactate dehydrogenase.
The highest average silhouette score was observed with k = 3, indicating that three clusters provide the best balance between intra-cluster compactness and inter-cluster separation, so consistently with this method, three clusters were created.
Cluster 1 included 41 patients with the lowest mean haemoglobin difference at 0.815 g/dL, cluster 2 contained 51 patients and showed the highest mean haemoglobin difference at 1.592 g/dL, and cluster 3 was composed of 55 patients with a mean haemoglobin difference of 1.484 g/dL, suggesting varying patterns of haemoglobin difference between the patient’s admission to the labour ward (T0) and twenty-four hours after delivery (T1). By performing an analysis of variance using the ANOVA table (p-value = 0.0003) and the post-hoc Tukey test, cluster 1 was found to present a haemoglobin difference significantly different from the others.
In Figure 2, the arrows illustrate the original variables projected into a two-dimensional Principal Component Analysis space. The positioning of the clusters in relation to these arrows offers insights into which variables may be the most influential in determining the distribution of the three clusters. Clusters aligned with a specific arrow typically have higher values for that variable, while clusters pointed in the opposite direction tend to have lower values. As previously mentioned, cluster 1 exhibits the lowest value for haemoglobin difference. Therefore, it is crucial to understand how this cluster differs from the others and to identify the most influential variables contributing to its characteristics.
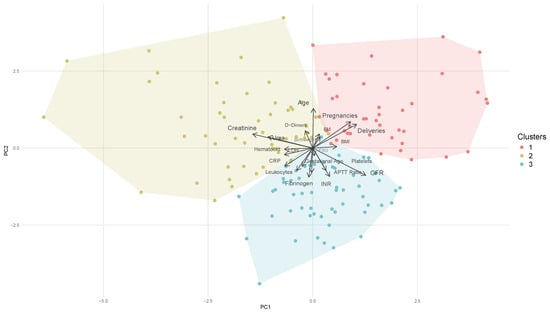
Figure 2.
PCA plot showing K-means clusters. Points are colored by cluster, and arrows indicate variable contributions. INR: international normalised ratio; APTTratio: activated partial thromboplastin time ratio; BMI: body mass index; FXIII: coagulation factor XIII; GFR: glomerular filtration rate; CRP: C-reactive protein; LDH: lactate dehydrogenase. FM: FM.
Analysing the direction of the arrows in relation to the position of the cluster (Figure 2) alongside the mean values per cluster presented in Table A2 indicates that cluster 1 is characterised by multiparous women (mean = 3.488 deliveries) with a lower gestational age (38.955 weeks). This cluster exhibits reduced levels of inflammatory biomarkers, as evidenced by low concentrations of C-reactive protein, leukocytes, and fibrinogen, which is both an acute phase protein and a coagulation factor. Additionally, this group demonstrates an increased pro-thrombotic state compared to the other clusters, as indicated by elevated levels of D-dimer and fibrin monomers. Other two biomarkers are comparatively lower: lactate dehydrogenase, which is associated with cellular necrosis, and urea. Lactate dehydrogenase levels rise in conditions characterised by cell death, whereas urea concentrations elevate due to renal impairment. Furthermore, cluster 1 displays the lowest difference in haemoglobin levels, suggesting that the interplay of multiparity, diminished inflammatory activity, and a pro-thrombotic state may contribute to a protective profile associated with reduced risk of bleeding.
4.2. Classification
In our cohort of 147 patients, 35 women experienced postpartum haemorrhage, which represents 23.8% of the total population. Of these, 22 women had vaginal deliveries and 13 underwent caesarean section. Significant differences were observed between the deliveries with postpartum haemorrhage and those without in several factors, including haematocrit, creatinine, lactate dehydrogenase, first-degree lacerations, and non-O blood type (Table 2). The results indicated a significantly lower number of first-degree lacerations in the postpartum haemorrhage group (p = 0.036) compared to what would be expected if the factors were independent. Additionally, individuals with postpartum haemorrhage exhibited a significantly higher prevalence of blood type O (p = 0.003).
Table 2.
Characterisation of patients with postpartum haemorrhage.
Among the variables approaching statistical significance, gestational age, fibrinogen, fibrin monomers, and urea are noteworthy. These findings align with the results obtained through the K-means clustering analysis. Maternal age is a significant factor to consider, as women in the non-postpartum haemorrhage group tend to be older. This correlation may be linked to the number of previous deliveries, which serves as a protective factor against postpartum haemorrhage. Furthermore, while second-degree lacerations are relevant, they do not achieve statistical significance as a risk factor for postpartum haemorrhage. Specifically, these lacerations occurred in 8 out of 22 vaginal deliveries that experienced postpartum haemorrhage, in comparison to 9 out of 63 vaginal deliveries in the non-postpartum haemorrhage group.
4.2.1. Multivariable Classical Logistic Regression
The results of the multivariable classical logistic regression analysis (Table 3) identified significant features associated with a higher risk for postpartum haemorrhage. Lactate dehydrogenase is an intracellular enzyme whose serum levels increase in conditions associated with cellular death [59]. Currently, lactate dehydrogenase is being explored as a potential biomarker for the severity of preeclampsia, a common hypertensive disorder during pregnancy and a known risk factor for postpartum haemorrhage [60,61,62,63]. Urea, on the other hand, serves as a marker for renal impairment and has been found to increase in cases of pregnancy induced hypertensive disorders [64,65] and in postpartum bleeding [66]. In our study population, although both variables were within the normal range [67], elevated levels were linked to a higher likelihood of bleeding. This raises the question of whether elevated values that remain within the reference range could indicate trends or signal underlying subclinical conditions. Prepartum platelet counts were positively associated with haemorrhage, which is somewhat unexpected, as lower platelet counts typically indicate a higher risk. However, all our population values exceed the established threshold of , which is a known risk factor for postpartum haemorrhage [62,68,69]. An extensive literature review by Moureuil et al. [31] on biomarkers for postpartum haemorrhage found that platelet counts do not have a statistically significant association with postpartum haemorrhage. However, on average, platelet were lower in women who experienced severe postpartum haemorrhage. In a subsequent study, the same research group observed statistical significance in the postpartum haemorrhage cohort, which showed lower platelet levels, although these values remained within the normal reference range [70].
Table 3.
Multivariable classical logistic model for postpartum haemorrhage.
Gestational age at delivery is increasingly recognised as an important risk factor contributing to the likelihood of bleeding (OR 1.545, 95% CI 1.071–2.298), which supports our findings [71,72]. The model includes two protective factors: non-O blood group (A, B, or AB) and first-degree laceration. The odds of a postpartum haemorrhage in pregnant women with non-O blood group is 0.182 (95% CI 0.067–0.453) compared to those with blood group O. While there is some controversy surrounding the influence of blood type on haemorrhage [73,74], several studies support this finding [75,76,77,78]. Perineal trauma is a frequent condition during vaginal delivery, affecting up to 90% of parturients [79]. A first-degree laceration is a mild type of perineal tear that affects only the skin [79]. Women who experience a first-degree laceration are nearly eight times less likely to have postpartum haemorrhage (OR 0.163, 95% CI 0.031–0.622) because the associated bleeding is minimal. In contrast, a second-degree laceration involves both the skin and the perineal muscles [79]. In our sample, 47% of women with second-degree laceration experienced postpartum haemorrhage, which exceeds the rates found in the existing literature [80,81,82]. No third- or fourth-degree lacerations were observed, as these are classified as the least common and most severe types.
This multivariable logistic regression model showed no evidence of multicollinearity (all VIFs < 2) and demonstrated adequate fit according to the Hosmer–Lemeshow test (p = 0.169). The model achieved good discrimination, with an AUC of 0.810 (95% CI: 0.723–0.896) (Figure 3). The overall accuracy of the model was 80.27%, with a sensitivity of 65.71% and specificity of 84.82%. These figures suggest that the model is proficient at distinguishing between different outcome categories. However, it demonstrated a greater effectiveness in identifying negative cases compared to positive ones.
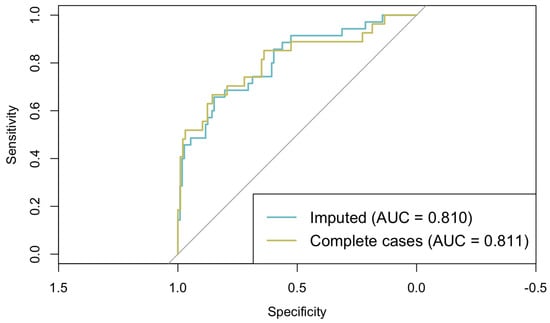
Figure 3.
ROC curves from classical logistic regression models fitted on imputed and complete-case datasets.
To assess the potential impact of imputation on model estimates, a sensitivity analysis was conducted by comparing this logistic regression model fitted on the imputed dataset with the same model fitted on complete cases only. As shown in Figure 3, the models are very similar (AUCimputed = 0.810; AUCcomplete = 0.811), and the regression coefficients differed by less than 0.05 across all the predictors, indicating that the imputation procedure did not introduce substantial bias and that the model estimates are robust.
4.2.2. Machine Learning Approaches
This section discusses the predictive performance of three models: logistic regression, ridge logistic regression, and random forest. Consistent with the previous section, the logistic stepwise model was developed using the predictors outlined in Table 2 while excluding variables with high correlations to prevent multicollinearity. The random forest model was trained using the same six final predictors, which were also identified as the most influential features when the model was previously tested with the full set of initial variables. In contrast, the ridge logistic regression model employed the complete set of initial variables, as this approach can accommodate a greater number of correlated variables through coefficient penalisation, thus controlling for multicollinearity while retaining more information. Both standard training and oversampling of the minority class were considered to evaluate their impact on model performance. Key metrics, including accuracy, sensitivity, specificity, F1-score, and AUC, are reported in Table 4 and in Figure 4, providing a comparative analysis of the models and their respective training strategies.
Table 4.
Performance metrics for different models with and without oversampling.
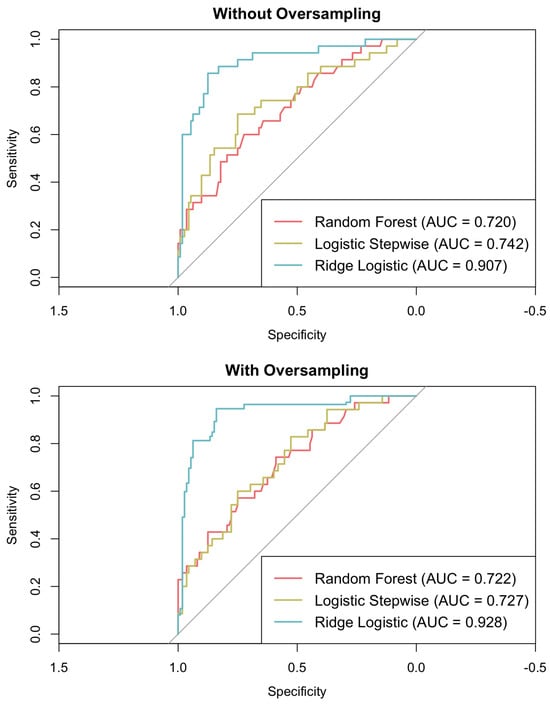
Figure 4.
ROC curves for logistic (stepwise and ridge) regression and random forest models.
Without the application of oversampling, ridge logistic regression attained the highest accuracy (0.871), F1-score (0.759), and AUC (0.907), thereby outperforming both logistic regression and random forest methods. Upon the implementation of oversampling, ridge logistic regression further enhanced its performance, achieving an accuracy of 0.893, an F1-score of 0.898, and an AUC of 0.928. Conversely, the application of oversampling resulted in a decline in accuracy for both random forest (dropping from 0.748 to 0.558) and logistic regression (decreasing from 0.735 to 0.599). While oversampling did increase the sensitivity of all the models, this effect was more pronounced in the random forest and logistic regression models, which demonstrated reduced specificity and F1-scores compared to ridge logistic regression.
Ridge logistic regression consistently demonstrated superior performance compared to both standard logistic regression and random forest across all the methodologies. It attained the highest accuracy, F1-score, and AUC, even in the absence of oversampling techniques. This robust performance can be attributed primarily to L2 regularisation, which allows the model to retain a greater number of predictive variables while effectively mitigating the risk of overfitting.
The diminished performance of logistic regression and random forest models when applied with oversampling techniques may be attributed to the introduction of synthetic samples. Although these samples can enhance sensitivity, they simultaneously introduce noise, decrease specificity, and alter feature distributions. Consistent with previous research, it appears that the random forest method is particularly adversely affected; this is likely due to the predominantly linear relationships between predictors and outcomes, which undermines the efficacy of tree-based models. Furthermore, oversampling may result in overfitting to these synthetic positive cases, leading to miscalibration and a reduction in predictive performance in comparison to models trained on the original dataset [83].
5. Conclusions
A considerable number of women who experience postpartum haemorrhage are inaccurately classified as low-risk due to a variety of factors [39,84,85]. Consequently, it is imperative to develop a statistical tool that accurately identifies individuals within this group who are unlikely to experience significant bleeding [32].
The primary objective of this study was to identify a limited selection of features from demographic, obstetric, and biomarker data in order to develop a model with enhanced predictive capabilities. This was achieved through the application of both classical statistical methods and machine learning techniques. The classical methods employed included logistic regression, whereas the machine learning approaches encompassed logistic regression, ridge logistic regression, and random forest algorithms. It is also important to highlight that K-means clustering has emerged as a valuable exploratory method for identifying distinct clinical profiles within the sample population. This approach facilitated the differentiation of subgroups exhibiting unique characteristics and enabled the identification of potentially influential variables for subsequent analyses.
Initially, a classical logistic regression model without cross-validation was employed to evaluate the model coefficients and to analyse the performance of MICE. This preliminary approach provided valuable insights into potential predictors and the relative importance of various variables. Subsequently, logistic regression with stepwise selection, ridge logistic regression, and random forest algorithms were implemented using cross-validation, yielding more robust estimates of predictive performance and generalisability.
While ridge logistic regression exhibited superior predictive capability, the classical logistic regression model, even in the absence of cross-validation, remains a valuable tool. Its computational accessibility and straightforward interpretability enhance our understanding of the effects of individual risk factors.
By employing this methodology, three biomarkers, one demographic factor, and two obstetric factors were found to influence postpartum haemorrhage significantly. The biomarkers identified include lactate dehydrogenase, urea, and platelet count. The demographic factor pertains to the non-O blood group (A, B, or AB), while the obstetric factors encompass gestational age and first-degree lacerations. These parameters are routinely collected, making these significant variables highly applicable in everyday practice.
The high preventability rate of postpartum haemorrhage underscores the importance of such a tool in clinical practice. As highlighted by research from Wolfson et al. and Lawton et al. [20,86], up to 30% of major blood loss cases can be prevented if additional measures are implemented during the peripartum period to prevent or mitigate excessive bleeding. Interventions such as ensuring the availability of a more experienced multidisciplinary team with senior staff, administration of tranexamic acid, and transferring patients to a higher level of care when necessary can significantly improve outcomes [18,87,88].
Our study has several strengths. It includes both vaginal and caesarean deliveries at a single tertiary centre, employing standardised protocols and bundles to address postpartum haemorrhage. Although small, our population consists of a diverse range of ethnicities from Europe, Africa, and South America. This diversity enhances the external validation of this model, as outcomes of postpartum bleeding are linked to race [2,89]. Postpartum haemorrhage was classified as a drop in haemoglobin of 2 g/dL or more within the first 24 h after delivery [44,90,91]. This approach improves the accuracy of postpartum haemorrhage diagnosis, which is often low when relying on visual estimation or even quantitative methods [44,90,92,93,94,95]. By measuring haemoglobin drop, improved comparability across trials is facilitated, as this method provides an objective metric for assessing blood loss. The incidence of postpartum haemorrhage in our population was 23.8%. This finding aligns with other studies [10,11,96,97] that follow the definition of postpartum haemorrhage which considers a blood loss of 500ml or more as the threshold [88], corresponding to a 2 g/dL drop in haemoglobin levels after delivery [44].
However, limitations can be found in this study, including its retrospective design and relatively small sample population from a single centre. While the vast majority of the established risk factors for postpartum haemorrhage [4,27,28,93] were accounted, the limited sample size may lead to overlooking some of them, potentially resulting in residual confounding. However, in comparison to other exploratory studies that examined maternal plasma biomarkers for postpartum haemorrhage—such as cytokines [98,99] and proteins [100]—our study considers a similar number of patients.
Future research could explore alternative machine learning methodologies, such as gradient boosting machines, which may more effectively capture complex relationships. Furthermore, conducting external validation on independent cohorts is essential to ascertain the model’s generalisability and applicability across diverse populations.
In summary, ridge logistic regression with cross-validation constitutes a robust predictive tool for postpartum haemorrhage, effectively balancing generalisation and variable retention. Conversely, classical logistic regression without cross-validation remains vital for interpreting coefficients and identifying potential predictors. The integration of these complementary approaches can yield both reliable predictions and significant clinical insights.
Author Contributions
Conceptualization, M.L.-C., R.M.-S., A.R., T.D.-D., F.L. and A.V.C.; methodology, M.L.-C., R.M.-S., A.R., T.D.-D., F.L. and A.V.C.; software, R.M.-S. and T.D.-D.; validation, M.L.-C., R.M.-S., A.R., T.D.-D., F.L. and A.V.C.; investigation, M.L.-C., R.M.-S., A.R., T.D.-D., F.L. and A.V.C.; writing—original draft preparation, M.L.-C., R.M.-S., A.R., T.D.-D., F.L. and A.V.C.; writing—review and editing, M.L.-C., R.M.-S., A.R., T.D.-D., F.L. and A.V.C. All authors have read and agreed to the published version of the manuscript.
Funding
This work is partially funded by national funds through the FCT—Fundação para a Ciência e a Tecnologia—under the project UID/00006/2023 (CEAUL—Centro de Estatística e Aplicações).
Institutional Review Board Statement
The study was conducted in accordance with the Declaration of Helsinki and approved by the Ethics Committee of Lisbon Academic Medical Center (protocol code 49/23, 18 October 2023).
Informed Consent Statement
Written informed consent was obtained from all the subjects involved in the study.
Data Availability Statement
The original contributions presented in this study are included in the article. Further inquiries can be directed to the corresponding author.
Acknowledgments
The authors gratefully acknowledge the dedication and assistance of the Maternity Ward team, whose collaboration made this work possible. Special thanks are extended to Mafalda Teodoro for conducting the laboratory tests, and to Paula Mendes and Werfen Portugal for supplying the reagent kits used to measure fibrin monomer levels and for performing the analyses.
Conflicts of Interest
The authors declare no conflicts of interest.
Appendix A
Appendix A.1. Sample Characteristics
Table A1.
Summary statistics for all variables under analysis.
Table A1.
Summary statistics for all variables under analysis.
| Parameter | Total Sample |
|---|---|
| Maternal age (years) | 31.40 ± 6.23 |
| Body mass index () | 29.76 (26.74–33.34) |
| Gestational age (weeks) | 39.40 ± 1.20 |
| Deliveries (n) | 0.00 (0.00–1.00) |
| Birthweight (g) | 3285.00 (2985.00–3515.00) |
| Blood type, n (%) | |
| O | 55 (37.4%) |
| Other | 92 (62.6%) |
| Ethnicity | |
| Caucasian | 96 (65.3%) |
| Other | 51 (34.7%) |
| Haematocrit (%) | 35 (33–37) |
| Leukocytes (count) | 11,400 (8750–14,700) |
| Platelets ( L) | 224.21 ± 64.65 |
| International normalised ratio (n) | 0.92 (0.90–0.97) |
| APTT ratio (n) | 0.90 (0.86–0.93) |
| D-dimers (µg/mL) | 1.98 (1.46–2.68) |
| Factor XIII (%) | 0.73 ± 0.15 |
| Fibrin monomers (µg/mL) | 5.25 (4.11–10.05) |
| Fibrinogen (mg/dL) | 467.73 ± 76.31 |
| Creatinine (mg/dL) | 0.55 (0.48–0.65) |
| Urea (mg/dL) | 18.00 (15.00–22.00) |
| Glomerular filtration rate (mL/min) | 127.00 (119.00–133.00) |
| C-reactive protein (mg/dL) | 0.68 (0.35–1.58) |
| Lactate dehydrogenase (uni/L) | 192.00 (171.00–214.00) |
| Type of delivery, n (%) | |
| Unassisted vaginal delivery | 55 (37.4%) |
| Instrumental vaginal delivery | 30 (20.4%) |
| Caesarean delivery | 62 (42.2%) |
| First-degree laceration, n (%) | 29 (34.1%) |
| Second-degree laceration, n (%) | 17 (20.0%) |
| Episiotomy, n (%) | 11 (12.9%) |
| Gestational hypertension, n (%) | 8 (5.4%) |
| Preeclampsia, n (%) | 4 (2.7%) |
| Gestational diabetes, n (%) | 19 (12.9%) |
| Hypothiroidism, n (%) | 11 (7.5%) |
| Previous uterine incision, n (%) | 23 (15.6%) |
| Multiple pregnancy, n (%) | 4 (2.7%) |
| >4 Previous vaginal deliveries, n (%) | 1 (0.7%) |
| History of coagulopathy, n (%) | 3 (2.0%) |
| History of postpartum haemorrhage, n (%) | 4 (2.7%) |
| Uterine fibroids, n (%) | 6 (4.1%) |
| Chorioamnionitis, n (%) | 4 (2.7%) |
| Placenta previa, n (%) | 5 (3.4%) |
| Low-lying placenta, n (%) | 1 (0.7%) |
| Placenta accreta, n (%) | 1 (0.7%) |
| Hemoglobin < 10 g/dL, n (%) | 11 (7.5%) |
| Platelets < 100,000/, n (%) | 1 (0.7%) |
| Haemorrhage on admission, n (%) | 1 (0.7%) |
| History of fetal death, n (%) | 3 (2.0%) |
| Estimated neonatal weight > 4 kg, n (%) | 2 (1.4%) |
| In vitro fertilization, n (%) | 10 (6.8%) |
| Smoker, n (%) | 16 (10.9%) |
For normally distributed variables, mean ± standard deviation is reported, otherwise median and interquartile range (IQR) are shown. Lacerations (first and second degree) and episiotomy were registered only in the 85 vaginal and instrumental deliveries. APTTratio: activated partial thromboplastin time ratio.
Appendix A.2. Characterization of Clusters (Mean Values)
Table A2.
Mean values of clusters according to variables used in clustering process.
Table A2.
Mean values of clusters according to variables used in clustering process.
| Cluster | Gestational Age (Weeks) | Deliveries (n) | Leukocytes (n) | Birthweight (g) | |
|---|---|---|---|---|---|
| 1 | 38.955 | 1.683 | 9870.732 | 3345.732 | |
| 2 | 39.515 | 0.275 | 11,872.549 | 3341.667 | |
| 3 | 39.629 | 0.255 | 13,578.182 | 3215.091 | |
| Cluster | Haematocrit (%) | LDH (U/L) | Fibrin Monomers (µg/mL) | Platelets ( L) | |
| 1 | 33.468 | 185.049 | 28.489 | 226.756 | |
| 2 | 36.208 | 206.588 | 15.740 | 192.745 | |
| 3 | 34.996 | 193.455 | 12.366 | 251.491 | |
| Cluster | INR (n) | APTT Ratio (n) | Fibrinogen (mg/dL) | D-Dimers (µg/mL) | Pregnancies (n) |
| 1 | 0.937 | 0.885 | 424.756 | 3.122 | 3.488 |
| 2 | 0.894 | 0.884 | 464.431 | 2.673 | 1.706 |
| 3 | 0.962 | 0.912 | 502.836 | 1.969 | 1.455 |
| Cluster | Factor XIII (%) | Creatinine (mg/dL) | Urea (mg/dL) | CRP (mg/dL) | GFR (mL/min) |
| 1 | 71.122 | 0.501 | 15.585 | 0.650 | 128.366 |
| 2 | 71.667 | 0.698 | 24.431 | 1.222 | 112.255 |
| 3 | 74.945 | 0.532 | 17.745 | 1.311 | 132.891 |
Appendix A.3. Laboratory Procedures
The blood samples were collected in citrate tubes (3.2% trisodium citrate) for coagulation assays and processed in our laboratory within 20 minutes of collection. An exception was made for fibrin monomer tests due to equipment limitations; the plasma samples were processed and stored at −80 °C for up to two months prior to analysis. For haematology tests, tubes containing ethylenediaminetetraacetic acid (1.6 mg EDTA per mL of blood) were used, while tubes with silicate were utilised for clinical chemistry analysis.
Appendix A.4. Quantification of Maternal Blood Loss
In vaginal delivery, blood was collected in a plastic bag placed under the parturient, with the volume being registered after subtracting the amniotic fluid and other liquids. Blood loss during a caesarean section was measured by weighing the blood-soaked surgical drapes on a scale. This involved subtracting the weight of the non-soiled drapes and adding the volume of blood collected in the suction container. Additionally, the amniotic fluid present on the drapes and in the suction container was calculated and deducted from the final blood loss value.
References
- Say, L.; Chou, D.; Gemmill, A.; Tunçalp, O.; Moller, A.B.; Daniels, J.; Gülmezoglu, A.M.; Temmerman, M.; Alkema, L. Global causes of maternal death: A WHO systematic analysis. Lancet Glob. Health 2014, 2, e323–e333. [Google Scholar] [CrossRef]
- Samayamuthu, M.J.; Kravchenko, O.; Lo-Ciganic, W.H.; Sadhu, E.M.; Yang, S.; Visweswaran, S.; Gopalakrishnan, V. Trends in Postpartum Hemorrhage Prevalence and Comorbidity Burden: Insights from the ENACT Network Aggregated Electronic Health Record Data. Res. Sq. 2024. [Google Scholar] [CrossRef]
- Sangara, R.N.; Matsushima, K.; Matsuzaki, S.; Yao, J.A.; Yu, E.; Mandelbaum, R.S.; Grubbs, B.H.; Incerpi, M.H.; Ouzounian, J.G.; Matsuo, K. Temporal trends of obstetric hemorrhage and product-specific blood transfusion at time of delivery. Am. J. Obstet. Gynecol. 2024, 231, e139–e145. [Google Scholar] [CrossRef]
- Huang, C.; Xue, B.; Gao, Y.; Yue, S.; Redding, S.R.; Wang, R.; Ouyang, Y. Incidence and risk factors for postpartum hemorrhage after vaginal delivery: A systematic review and meta-analysis. J. Obstet. Gynaecol. Res. 2023, 49, 1663–1676. [Google Scholar] [CrossRef] [PubMed]
- Corbetta-Rastelli, C.M.; Friedman, A.M.; Sobhani, N.C.; Arditi, B.; Goffman, D.; Wen, T. Postpartum Hemorrhage Trends and Outcomes in the United States, 2000–2019. Obstet. Gynecol. 2023, 141, 152–161. [Google Scholar] [CrossRef]
- Fitzgerald, I.; Corcoran, P.; McKernan, J.; Connell, R.O.; Greene, R.A. Trends, causes and factors associated with primary Postpartum Haemorrhage (PPH) in Ireland: A review of one million hospital childbirths. Eur. J. Obstet. Gynecol. Reprod. Biol. 2024, 301, 258–263. [Google Scholar] [CrossRef]
- Pettersen, S.; Falk, R.S.; Vangen, S.; Nyfløt, L.T. Exploring trends of severe postpartum haemorrhage: A hospital-based study. BMC Pregnancy Childbirth 2023, 23, 363. [Google Scholar] [CrossRef] [PubMed]
- Ueda, A.; Nakakita, B.; Chigusa, Y.; Mogami, H.; Ohtera, S.; Kato, G.; Mandai, M.; Kondoh, E. Impact of efforts to prevent maternal deaths due to obstetric hemorrhage on trends in epidemiology and management of severe postpartum hemorrhage in Japan: A nationwide retrospective study. BMC Pregnancy Childbirth 2022, 22, 496. [Google Scholar] [CrossRef]
- Ladfors, L.; Muraca, G.; Zetterqvist, J.; Butwick, A.; Stephansson, O. Postpartum haemorrhage trends in Sweden using the Robson ten group classification system: A population-based cohort study. BJOG Int. J. Obstet. Gynaecol. 2022, 129, 562–571. [Google Scholar] [CrossRef]
- Bell, S.F.; Watkins, A.; John, M.; Macgillivray, E.; Kitchen, T.L.; James, D.; Scarr, C.; Bailey, C.M.; Kelly, K.P.; James, K.; et al. Incidence of postpartum haemorrhage defined by quantitative blood loss measurement: A national cohort. BMC Pregnancy Childbirth 2020, 20, 271. [Google Scholar] [CrossRef]
- Flood, M.; McDonald, S.J.; Pollock, W.; Cullinane, F.; Davey, M. Incidence, trends and severity of primary postpartum haemorrhage in Australia: A population-based study using Victorian Perinatal Data Collection data for 764 244 births. Aust. N. Z. J. Obstet. Gynaecol. 2019, 59, 228–234. [Google Scholar] [CrossRef]
- Morau, E.; Ducloy, J.; Le Roux, S.; Weber, P.; Dreyfus, M. Mortalité maternelle par hémorragie, résultats de l’ENCMM, France 2010–2012. Gynécologie Obs. Fertil. Sénologie 2017, 45, S24–S30. [Google Scholar] [CrossRef]
- Van Stralen, G.; Von Schmidt Auf Altenstadt, J.F.; Bloemenkamp, K.W.; Van Roosmalen, J.; Hukkelhoven, C.W. Increasing incidence of postpartum hemorrhage: The Dutch piece of the puzzle. Acta Obstet. Gynecol. Scand. 2016, 95, 1104–1110. [Google Scholar] [CrossRef]
- Prick, B.W.; Auf Altenstadt, J.F.V.S.; Hukkelhoven, C.W.; Bonsel, G.J.; Steegers, E.A.; Mol, B.W.; Schutte, J.M.; Bloemenkamp, K.W.; Duvekot, J.J. Regional differences in severe postpartum hemorrhage: A nationwide comparative study of 1.6 million deliveries. BMC Pregnancy Childbirth 2015, 15, 43. [Google Scholar] [CrossRef] [PubMed]
- Mehrabadi, A.; Liu, S.; Bartholomew, S.; Hutcheon, J.A.; Kramer, M.S.; Liston, R.M.; Joseph, K. Temporal Trends in Postpartum Hemorrhage and Severe Postpartum Hemorrhage in Canada From 2003 to 2010. J. Obstet. Gynaecol. Can. 2014, 36, 21–33. [Google Scholar] [CrossRef]
- Briley, A.; Seed, P.; Tydeman, G.; Ballard, H.; Waterstone, M.; Sandall, J.; Poston, L.; Tribe, R.; Bewley, S. Reporting errors, incidence and risk factors for postpartum haemorrhage and progression to severe PPH: A prospective observational study. BJOG Int. J. Obstet. Gynaecol. 2014, 121, 876–888. [Google Scholar] [CrossRef]
- Reale, S.C.; Easter, S.R.; Xu, X.; Bateman, B.T.; Farber, M.K. Trends in Postpartum Hemorrhage in the United States From 2010 to 2014. Anesth. Analg. 2020, 130, e119–e122. [Google Scholar] [CrossRef]
- Bienstock, J.L.; Eke, A.C.; Hueppchen, N.A. Postpartum Hemorrhage. N. Engl. J. Med. 2021, 384, 1635–1645. [Google Scholar] [CrossRef] [PubMed]
- Wolfson, C.; Angelson, J.T.; Atlas, R.; Burd, I.; Chin, P.; Downey, C.; Fahey, J.; Hoffman, S.; Johnson, C.T.; Jones, M.B.; et al. Severe maternal morbidity contributed by obstetric hemorrhage: Maryland, 2020-2022. Am. J. Obstet. Gynecol. MFM 2025, 7, 101589. [Google Scholar] [CrossRef]
- Wolfson, C.; Qian, J.; Chin, P.; Downey, C.; Mattingly, K.J.; Jones-Beatty, K.; Olaku, J.; Qureshi, S.; Rhule, J.; Silldorff, D.; et al. Findings from severe maternal morbidity surveillance and review in Maryland. JAMA Netw. Open 2022, 5, e2244077. [Google Scholar] [CrossRef]
- Petersen, E.E.; Davis, N.L.; Goodman, D.; Cox, S.; Mayes, N.; Johnston, E.; Syverson, C.; Seed, K.; Shapiro-Mendoza, C.K.; Callaghan, W.M.; et al. Vital Signs: Pregnancy-Related Deaths, United States, 2011–2015, Strategies Prevention, 13 States, 2013–2017. MMWR. Morb. Mortal. Wkly. Rep. 2019, 68, 423–429. [Google Scholar] [CrossRef]
- Lewis, A.N.; Villela-Franyutti, D.; Domenico, H.J.; Byrne, D.W.; Farber, M.K.; Ende, H.B. Quantifying the accuracy of clinician risk assessment for postpartum hemorrhage. Matern.-Fetal Med. 2024, 6, 211–214. [Google Scholar] [CrossRef] [PubMed]
- Baeta, T.; Rocha, A.L.L.; Oliveira, J.A.; da Silva, A.P.C.; Reis, Z.S.N. Accuracy of machine learning and traditional statistical models in the prediction of postpartum haemorrhage: A systematic review. BMJ Open 2025, 15, e094455. [Google Scholar] [CrossRef] [PubMed]
- Sinambela, D.P.; Rahmatullah, B.; Che Lah, N.H.; Selamat, A.W. Machine learning approaches for predicting postpartum hemorrhage: A comprehensive systematic literature review. Indones. J. Electr. Eng. Comput. Sci. 2024, 34, 2087. [Google Scholar] [CrossRef]
- Omotayo, M.O.; Abioye, A.I.; Kuyebi, M.; Eke, A.C. Prenatal anemia and postpartum hemorrhage risk: A systematic review and meta-analysis. J. Obstet. Gynaecol. Res. 2021, 47, 2565–2576. [Google Scholar] [CrossRef]
- Korst, L.M.; Gregory, K.D.; Nicholas, L.A.; Saeb, S.; Reynen, D.J.; Troyan, J.L.; Greene, N.; Fridman, M. A scoping review of severe maternal morbidity: Describing risk factors and methodological approaches to inform population-based surveillance. Matern. Heal. Neonatol. Perinatol. 2021, 7, 3. [Google Scholar] [CrossRef]
- Stachetti, T.; Spodenkiewicz, M.; Winer, A.; Boukerrou, M.; Jesson, J.; Gérardin, P. Factors associated with severe postpartum haemorrhage: Systematic review using Bradford Hill’s causality framework. J. Glob. Health Rep. 2019, 3, e2019085. [Google Scholar] [CrossRef]
- Carr, B.L.; Jahangirifar, M.; Nicholson, A.E.; Li, W.; Mol, B.W.; Licqurish, S. Predicting postpartum haemorrhage: A systematic review of prognostic models. Aust. New Zealand J. Obstet. Gynaecol. 2022, 62, 813–825. [Google Scholar] [CrossRef] [PubMed]
- Ranjbar, A.; Rezaei Ghamsari, S.; Boujarzadeh, B.; Mehrnoush, V.; Darsareh, F. Predicting risk of postpartum hemorrhage using machine learning approach: A systematic review. Gynecol. Obstet. Clin. Med. 2023, 3, 170–174. [Google Scholar] [CrossRef]
- Liu, C.; Xiong, Y.; Zhao, P.; Chen, M.; Wei, W.; Sun, X.; Liu, X.; Tan, J. The suboptimal clinical applicability of prognostic prediction models for severe postpartum hemorrhage: A meta-epidemiological study. J. Clin. Epidemiol. 2024, 173, 111424. [Google Scholar] [CrossRef]
- De Moreuil, C.; Mehic, D.; Nopp, S.; Kraemmer, D.; Gebhart, J.; Schramm, T.; Couturaud, F.; Ay, C.; Pabinger, I. Hemostatic biomarkers associated with postpartum hemorrhage: A systematic review and meta-analysis. Blood Adv. 2023, 7, 5954–5967. [Google Scholar] [CrossRef]
- Neary, C.; Naheed, S.; McLernon, D.; Black, M. Predicting risk of postpartum haemorrhage: A systematic review. BJOG Int. J. Obstet. Gynaecol. 2021, 128, 46–53. [Google Scholar] [CrossRef] [PubMed]
- Wakefield, B.M.; Zapf, M.A.; Ende, H.B. Artificial intelligence in prediction of postpartum hemorrhage: A primer and review. Int. J. Obstet. Anesth. 2025, 63, 104694. [Google Scholar] [CrossRef]
- Mathewlynn, S.J.; Soltaninejad, M.; Collins, S.L. Artificial Intelligence and Postpartum Hemorrhage. Matern. Fetal Med. 2025, 7, 22–28. [Google Scholar] [CrossRef] [PubMed]
- Wen, T. Interpretable machine learning predicts postpartum hemorrhage at time of admission. Am. J. Obstet. Gynecol. MFM 2024, 6, 101355. [Google Scholar] [CrossRef] [PubMed]
- Song, Z.; Lin, H.; Shao, M.; Wang, X.; Chen, X.; Zhou, Y.; Zhang, D. Integrating SHAP analysis with machine learning to predict postpartum hemorrhage in vaginal births. BMC Pregnancy Childbirth 2025, 25, 529. [Google Scholar] [CrossRef]
- Clapp, M.A.; Li, S.; James, K.E.; Bernstein, S.N.; Kaimal, A.J.; Perlis, R.H. Predicting Postpartum Hemorrhage Risk with Second-Trimester Data. O&G Open 2025, 2, e091. [Google Scholar] [CrossRef]
- Wang, W.; Liao, C.; Zhang, H.; Hu, Y. Postpartum haemorrhage risk prediction model developed by machine learning algorithms: A single-centre retrospective analysis of clinical data. Clin. Exp. Obstet. Gynecol. 2024, 51, 60. [Google Scholar] [CrossRef]
- Lengerich, B.J.; Caruana, R.; Painter, I.; Weeks, W.B.; Sitcov, K.; Souter, V. Interpretable machine learning predicts postpartum hemorrhage with severe maternal morbidity in a lower-risk laboring obstetric population. Am. J. Obstet. Gynecol. MFM 2024, 6, 101391. [Google Scholar] [CrossRef]
- Holcroft, S.; Karangwa, I.; Little, F.; Behoor, J.; Bazirete, O. Predictive Modelling of Postpartum Haemorrhage Using Early Risk Factors: A Comparative Analysis of Statistical and Machine Learning Models. Int. J. Environ. Res. Public Health 2024, 21, 600. [Google Scholar] [CrossRef]
- Ahmadzia, H.K.; Dzienny, A.C.; Bopf, M.; Phillips, J.M.; Federspiel, J.J.; Amdur, R.; Rice, M.M.; Rodriguez, L. Machine Learning Models for Prediction of Maternal Hemorrhage and Transfusion: Model Development Study. JMIR Bioinform. Biotechnol. 2024, 5, e52059. [Google Scholar] [CrossRef] [PubMed]
- Susanu, C.; Hărăbor, A.; Vasilache, I.A.; Harabor, V.; Călin, A.M. Predicting intra-and postpartum hemorrhage through artificial intelligence. Medicina 2024, 60, 1604. [Google Scholar] [CrossRef]
- Vandenbroucke, J.P.; Von Elm, E.; Altman, D.G.; Gøtzsche, P.C.; Mulrow, C.D.; Pocock, S.J.; Poole, C.; Schlesselman, J.J.; Egger, M.; Initiative, S.; et al. Strengthening the Reporting of Observational Studies in Epidemiology (STROBE): Explanation and elaboration. Int. J. Surg. 2014, 12, 1500–1524. [Google Scholar] [CrossRef]
- Yefet, E.; Yossef, A.; Suleiman, A.; Hatokay, A.; Nachum, Z. Hemoglobin drop following postpartum hemorrhage. Sci. Rep. 2020, 10, 21546. [Google Scholar] [CrossRef]
- Hassanzad, M.; Hajian-Tilaki, K. Methods of determining optimal cut-point of diagnostic biomarkers with application of clinical data in ROC analysis: An update review. BMC Med Res. Methodol. 2024, 24, 84. [Google Scholar] [CrossRef]
- Wongvorachan, T.; He, S.; Bulut, O. A Comparison of Undersampling, Oversampling, and SMOTE Methods for Dealing with Imbalanced Classification in Educational Data Mining. Information 2023, 14, 54. [Google Scholar] [CrossRef]
- Joel, L.O.; Doorsamy, W.; Paul, B.S. A comparative study of imputation techniques for missing values in healthcare diagnostic datasets. Int. J. Data Sci. Anal. 2025, 20, 6357–6373. [Google Scholar] [CrossRef]
- Wulff, J.N.; Jeppesen, L.E. Multiple Imputation by Chained Equations in Praxis: Guidelines and Review. Electron. J. Bus. Res. Methods 2017, 15, 41–56. [Google Scholar]
- Pérez-Ortega, J.; Almanza-Ortega, N.N.; Vega-Villalobos, A.; Pazos-Rangel, R.; Zavala-Díaz, C.; Martínez-Rebollar, A. The K-Means Algorithm Evolution. In Introduction to Data Science and Machine Learning; Sud, K., Erdogmus, P., Kadry, S., Eds.; IntechOpen: London, UK, 2019. [Google Scholar] [CrossRef]
- Çelik, S.; Doğanlı, B.; Şaşmaz, M.Ü.; Akkucuk, U. Accuracy Comparison of Machine Learning Algorithms on World Happiness Index Data. Mathematics 2025, 13, 1176. [Google Scholar] [CrossRef]
- Januzaj, Y.; Beqiri, E.; Luma, A. Determining the Optimal Number of Clusters using Silhouette Score as a Data Mining Technique. Int. J. Online Biomed. Eng. (iJOE) 2023, 19, 174–182. [Google Scholar] [CrossRef]
- Wang, M.; Yi, G.; Zhang, Y.; Li, M.; Zhang, J. Quantitative prediction of postpartum hemorrhage in cesarean section on machine learning. BMC Med. Inform. Decis. Mak. 2024, 24, 166. [Google Scholar] [CrossRef]
- Venkatesh, K.; Mishra, D.; Manimozhi, T. Model Selection and Regularization. In Statistical Modeling in Machine Learning: Concepts and Applications; Goswami, T., Sinha, G., Eds.; Elsevier: Amsterdam, The Netherlands, 2023; pp. 159–178. [Google Scholar]
- Rhys, H.I. Machine Learning with R, the tidyverse, and mlr; Manning Publications: Shelter Island, NY, USA, 2020. [Google Scholar]
- Gong, J.; Chen, Z.; Zhang, Y.; Liu, Y.y.; Pu, J.c.; Xiong, C.y.; Gui, S.w.; He, X.l.; Wang, H.l.; Zhong, X.g. Risk-factor model for postpartum hemorrhage after cesarean delivery: A retrospective study based on 3498 patients. Sci. Rep. 2022, 12, 22100. [Google Scholar] [CrossRef]
- Azar, A.T.; Elshazly, H.I.; Hassanien, A.E.; Elkorany, A.M. A Random Forest Classifier for Lymph Diseases. Comput. Methods Prog. Biomed. 2014, 113, 465–473. [Google Scholar] [CrossRef] [PubMed]
- Brownlee, J. Master Machine Learning Algorithms; Machine Learning Mastery: Shelter Island, NY, USA, 2016. [Google Scholar]
- Rodriguez-Galiano, V.F.; Ghimire, B.; Rogan, J.; Chica-Olmo, M.; Rigol-Sanchez, J.P. An Assessment of the Effectiveness of a Random Forest Classifier for Land-Cover Classification. ISPRS J. Photogramm. Remote Sens. 2012, 67, 93–104. [Google Scholar] [CrossRef]
- Teklemariam, A.B.; Abebe, E.C.; Agidew, M.M.; Ayenew, A.A.; Mengistie, M.A.; Baye, N.D.; Muche, Z.T. Diagnostic performance of lactate dehydrogenase as a potential biomarker in predicting preeclampsia and associated factors. Front. Med. 2024, 11, 1240848. [Google Scholar] [CrossRef]
- Koopmans, C.M.; Van der Tuuk, K.; Groen, H.; Doornbos, J.P.; De Graaf, I.M.; Van Der Salm, P.C.; Porath, M.M.; Kuppens, S.M.; Wijnen, E.J.; Aardenburg, R.; et al. Prediction of postpartum hemorrhage in women with gestational hypertension or mild preeclampsia at term. Acta Obstet. Gynecol. Scand. 2014, 93, 399–407. [Google Scholar] [CrossRef] [PubMed]
- Burwick, R.M.; Rincon, M.; Beeraka, S.S.; Gupta, M.; Feinberg, B.B. Evaluation of hemolysis as a severe feature of preeclampsia. Hypertension 2018, 72, 460–465. [Google Scholar] [CrossRef] [PubMed]
- Salomon, C.; De Moreuil, C.; Hannigsberg, J.; Trémouilhac, C.; Drugmanne, G.; Gatineau, F.; Nowak, E.; Anouilh, F.; Briend, D.; Moigne, E.L.; et al. Haematological parameters associated with postpartum haemorrhage after vaginal delivery: Results from a French cohort study. J. Gynecol. Obstet. Hum. Reprod. 2021, 50, 102168. [Google Scholar] [CrossRef]
- Nasir, S.K.; Khalil, R.Y.; Mahmood, M.B.; Dawd, A.S. Serum lactate dehydrogenase level in preeclampsia and its correlation with disease severity, maternal and perinatal outcomes. BMC Women’s Health 2025, 25, 108. [Google Scholar] [CrossRef]
- Vázquez, S.; Pascual, J.; Durán-Jordà, X.; Hernández, J.L.; Crespo, M.; Oliveras, A. Predictors of preeclampsia in the first trimester in normotensive and chronic hypertensive pregnant women. J. Clin. Med. 2023, 12, 579. [Google Scholar] [CrossRef]
- Kaihara, J.N.; de Moraes, F.R.; Nunes, P.R.; Alves, M.G.; Cavalli, R.C.; Tasic, L.; Sandrim, V.C. Plasma metabolic profile reveals signatures of maternal health during gestational hypertension and preeclampsia without and with severe features. PLoS ONE 2024, 19, e0314053. [Google Scholar] [CrossRef]
- Owiredu, W.K.B.A.; Osakunor, D.N.M.; Turpin, C.A.; Owusu-Afriyie, O. Laboratory prediction of primary postpartum haemorrhage: A comparative cohort study. BMC Pregnancy Childbirth 2016, 16, 17. [Google Scholar] [CrossRef]
- Abbassi-Ghanavati, M.; Greer, L.G.; Cunningham, F.G. Pregnancy and laboratory studies: A reference table for clinicians. Obstet. Gynecol. 2009, 114, 1326–1331. [Google Scholar] [CrossRef]
- Arcudi, S.; Ronchi, A.; Capecchi, M.; Iurlaro, E.; Ossola, M.W.; Mancini, I.; Schivardi, G.; Marconi, A.M.; Podda, G.M.; Artoni, A. Assessment of post-partum haemorrhage risk among women with moderate thrombocytopenia. Br. J. Haematol. 2022, 197, 482–488. [Google Scholar] [CrossRef] [PubMed]
- van Dijk, W.E.; Nijdam, J.S.; Haitjema, S.; de Groot, M.C.; Huisman, A.; Punt, M.C.; Evers, A.C.; Schutgens, R.E.; Lely, A.T.; van Galen, K.P. Platelet count and indices as postpartum hemorrhage risk factors: A retrospective cohort study. J. Thromb. Haemost. 2021, 19, 2873–2883. [Google Scholar] [CrossRef] [PubMed]
- de Moreuil, C.; Pan-Petesch, B.; Mehic, D.; Kraemmer, D.; Schramm, T.; Albert, C.; Trémouilhac, C.; Lucier, S.; Galinat, H.; Le Roux, L.; et al. Predelivery haemostatic biomarkers in women with non-severe postpartum haemorrhage. J. Clin. Med. 2024, 13, 4231. [Google Scholar] [CrossRef]
- Butwick, A.J.; Liu, C.; Guo, N.; Bentley, J.; Main, E.K.; Mayo, J.A.; Shaw, G.M.; Stephansson, O. Association of gestational age with postpartum hemorrhage: An international cohort study. Anesthesiology 2021, 134, 874–886. [Google Scholar] [CrossRef]
- Aghajanian, S.; Jafarabady, K.; Abbasi, M.; Mohammadifard, F.; Bakhshali Bakhtiari, M.; Shokouhi, N.; Saleh Gargari, S.; Bakhtiyari, M. Prediction of post-delivery hemoglobin levels with machine learning algorithms. Sci. Rep. 2024, 14, 13953. [Google Scholar] [CrossRef]
- Ali-Saleh, M.; Lavie, O.; Abramov, Y. Evaluation of blood type as a potential risk factor for early postpartum hemorrhage. PLoS ONE 2019, 14, e0214840. [Google Scholar] [CrossRef]
- Swartz, S.R.; Steffen, H.A.; Wendt, L.H.; Kenne, K.A.; Rysavy, M.B.; Jackson, J.B. ABO and Rh blood group association with maternal and neonatal outcomes. Glob. J. Transfus. Med. 2024, 9, 17–21. [Google Scholar] [CrossRef]
- Drukker, L.; Srebnik, N.; Elstein, D.; Levitt, L.; Samueloff, A.; Farkash, R.; Grisaru-Granovsky, S.; Sela, H.Y. The association between ABO blood group and obstetric hemorrhage. J. Thromb. Thrombolysis 2016, 42, 340–345. [Google Scholar] [CrossRef] [PubMed]
- Kahr, M.; Franke, D.; Brun, R.; Wisser, J.; Zimmermann, R.; Haslinger, C. Blood group O: A novel risk factor for increased postpartum blood loss? Haemophilia 2018, 24, e207–e212. [Google Scholar] [CrossRef]
- Bade, N.A.; Kazma, J.M.; Amdur, R.L.; Ellis-Kahana, J.; Ahmadzia, H.K. Blood type association with bleeding outcomes at delivery in a large multi-center study. J. Thromb. Thrombolysis 2020, 50, 439–445. [Google Scholar] [CrossRef] [PubMed]
- Burd, J.E.; Quist-Nelson, J.A.; Edwards, S.E.; Suhag, A.; Berghella, V.P.; Nijjar, J.B. Blood type and postpartum hemorrhage by mode of delivery: A retrospective cohort study. Eur. J. Obstet. Gynecol. Reprod. Biol. 2021, 256, 348–353. [Google Scholar] [CrossRef]
- Schmidt, P.C.; Fenner, D.E. Repair of episiotomy and obstetrical perineal lacerations (first–fourth). Am. J. Obstet. Gynecol. 2024, 230, S1005–S1013. [Google Scholar] [CrossRef]
- Biguzzi, E.; Franchi, F.; Ambrogi, F.; Ibrahim, B.; Bucciarelli, P.; Acaia, B.; Radaelli, T.; Biganzoli, E.; Mannucci, P.M. Risk factors for postpartum hemorrhage in a cohort of 6011 Italian women. Thromb. Res. 2012, 129, e1–e7. [Google Scholar] [CrossRef]
- Fukami, T.; Koga, H.; Goto, M.; Ando, M.; Matsuoka, S.; Tohyama, A.; Yamamoto, H.; Nakamura, S.; Koyanagi, T.; To, Y.; et al. Incidence and risk factors for postpartum hemorrhage among transvaginal deliveries at a tertiary perinatal medical facility in Japan. PLoS ONE 2019, 14, e0208873. [Google Scholar] [CrossRef]
- Widmer, M.; Piaggio, G.; Hofmeyr, G.; Carroli, G.; Coomarasamy, A.; Gallos, I.; Goudar, S.; Gülmezoglu, A.; Lin, S.; Lumbiganon, P.; et al. Maternal characteristics and causes associated with refractory postpartum haemorrhage after vaginal birth: A secondary analysis of the WHO CHAMPION trial data. BJOG Int. J. Obstet. Gynaecol. 2020, 127, 628–634. [Google Scholar] [CrossRef]
- Yang, C.; Fridgeirsson, E.A.; Kors, J.A.; Reps, J.M.; Rijnbeek, P.R. Impact of random oversampling and random undersampling on the performance of prediction models developed using observational health data. BMC Med. Inform. Decis. Mak. 2023, 23, 1–12. [Google Scholar] [CrossRef]
- Ruppel, H.; Liu, V.X.; Gupta, N.R.; Soltesz, L.; Escobar, G.J. Validation of Postpartum Hemorrhage Admission Risk Factor Stratification in a Large Obstetrics Population. Am. J. Perinatol. 2021, 38, 1192–1200. [Google Scholar] [CrossRef]
- Hussain, S.A.; Guarini, C.B.; Blosser, C.; Poole, A.T. Obstetric Hemorrhage Outcomes by Intrapartum Risk Stratification at a Single Tertiary Care Center. Cureus 2019, 11, e6456. [Google Scholar] [CrossRef]
- Lawton, B.A.; Jane MacDonald, E.; Stanley, J.; Daniells, K.; Geller, S.E. Preventability review of severe maternal morbidity. Acta Obstet. Gynecol. Scand. 2019, 98, 515–522. [Google Scholar] [CrossRef] [PubMed]
- Weeks, A.D. Reducing maternal deaths from haemorrhage: Seeking the low-hanging fruit. BJOG Int. J. Obstet. Gynaecol. 2024, 131, 1025–1028. [Google Scholar] [CrossRef]
- de Vries, P.L.; Deneux-Tharaux, C.; Baud, D.; Chen, K.K.; Donati, S.; Goffinet, F.; Knight, M.; D’Souzah, R.; Sueters, M.; van den Akker, T. Postpartum haemorrhage in high-resource settings: Variations in clinical management and future research directions based on a comparative study of national guidelines. BJOG Int. J. Obstet. Gynaecol. 2023, 130, 1639–1652. [Google Scholar] [CrossRef]
- Gyamfi-Bannerman, C.; Srinivas, S.K.; Wright, J.D.; Goffman, D.; Siddiq, Z.; D’Alton, M.E.; Friedman, A.M. Postpartum hemorrhage outcomes and race. Am. J. Obstet. Gynecol. 2018, 219, 185.e1–185.e10. [Google Scholar] [CrossRef]
- Girault, A.; Deneux-Tharaux, C.; Sentilhes, L.; Maillard, F.; Goffinet, F. Undiagnosed abnormal postpartum blood loss: Incidence and risk factors. PLoS ONE 2018, 13, e0190845. [Google Scholar] [CrossRef]
- Deneux-Tharaux, C.; Dupont, C.; Colin, C.; Rabilloud, M.; Touzet, S.; Lansac, J.; Harvey, T.; Tessier, V.; Chauleur, C.; Pennehouat, G.; et al. Multifaceted intervention to decrease the rate of severe postpartum haemorrhage: The PITHAGORE6 cluster-randomised controlled trial. BJOG Int. J. Obstet. Gynaecol. 2010, 117, 1278–1287. [Google Scholar] [CrossRef]
- Khan, B.A.; Weston, A.; Jaeger, A.; Shevatekar, G.; Wang, Y.; Smith, L.; Wynn, K.E. Quantitative blood loss values reveal high rates of undiagnosed postpartum hemorrhage. Int. J. Gynecol. Obstet. 2025, 170, 614–620. [Google Scholar] [CrossRef] [PubMed]
- Yunas, I.; Gallos, I.D.; Devall, A.J.; Podesek, M.; Allotey, J.; Takwoingi, Y.; Coomarasamy, A. Tests for diagnosis of postpartum haemorrhage at vaginal birth. Cochrane Database Syst. Rev. 2025, CD016134. [Google Scholar] [CrossRef] [PubMed]
- Madar, H.; Sentilhes, L.; Goffinet, F.; Bonnet, M.P.; Rozenberg, P.; Deneux-Tharaux, C. Comparison of quantitative and calculated postpartum blood loss after vaginal delivery. Am. J. Obstet. Gynecol. MFM 2023, 5, 101065. [Google Scholar] [CrossRef]
- Bhatt, A.; Hughes-Hogan, L.; Mitchell, T.; Nair, S.; Chuang, M.; Chen, S.L.; Reddy, S. Impact of measuring quantification of blood loss versus estimation of blood loss during cesarean deliveries. Int. J. Gynecol. Obstet. 2023, 160, 670–677. [Google Scholar] [CrossRef] [PubMed]
- Calvert, C.; Thomas, S.L.; Ronsmans, C.; Wagner, K.S.; Adler, A.J.; Filippi, V. Identifying Regional Variation in the Prevalence of Postpartum Haemorrhage: A Systematic Review and Meta-Analysis. PLoS ONE 2012, 7, e41114. [Google Scholar] [CrossRef] [PubMed]
- Bais, J.M.; Eskes, M.; Pel, M.; Bonsel, G.J.; Bleker, O.P. Postpartum haemorrhage in nulliparous women: Incidence and risk factors in low and high risk women: A Dutch population-based cohort study on standard (≥ 500 ml) and severe (≥ 1000 ml) postpartum haemorrhage. Eur. J. Obstet. Gynecol. Reprod. Biol. 2004, 115, 166–172. [Google Scholar] [CrossRef] [PubMed]
- Zhang, P.; Jia, Y.; Song, H.; Fan, Y.; Lv, Y.; Geng, H.; Zhao, Y.; Cui, H.; Chen, X. Novel biomarkers for prediction of atonic postpartum hemorrhage among ‘low-risk’women in labor. Front. Immunol. 2024, 15, 1416990. [Google Scholar] [CrossRef]
- Gallo, D.M.; Romero, R.; Bosco, M.; Chaiworapongsa, T.; Gomez-Lopez, N.; Arenas-Hernandez, M.; Jung, E.; Suksai, M.; Gotsch, F.; Erez, O.; et al. Maternal plasma cytokines and the subsequent risk of uterine atony and postpartum hemorrhage. J. Perinat. Med. 2023, 51, 219–232. [Google Scholar] [CrossRef]
- Reitsma, S.E.; Barsoum, J.R.; Hansen, K.C.; Sassin, A.M.; Dzieciatkowska, M.; James, A.H.; Aagaard, K.M.; Ahmadzia, H.K.; Wolberg, A.S. Agnostic identification of plasma biomarkers for postpartum hemorrhage risk. Am. J. Obstet. Gynecol. 2025, 232, 220.e1–220.e18. [Google Scholar] [CrossRef]


Disclaimer/Publisher’s Note: The statements, opinions and data contained in all publications are solely those of the individual author(s) and contributor(s) and not of MDPI and/or the editor(s). MDPI and/or the editor(s) disclaim responsibility for any injury to people or property resulting from any ideas, methods, instructions or products referred to in the content. |
© 2025 by the authors. Licensee MDPI, Basel, Switzerland. This article is an open access article distributed under the terms and conditions of the Creative Commons Attribution (CC BY) license (https://creativecommons.org/licenses/by/4.0/).