Abstract
The issue of modeling the personal innovativeness of project team members is determined in this study. Findings from prior research on social capital associated with innovations and innovative activities reveal that social capital factors such as trust, social networks and connections, and social values determine a person’s attitude to innovations. Different connections involved in bridging (external) and bonding (internal) social capital can create conflict between project team members in different ways. To stimulate innovation in a conflict environment, a specially configured conflict management system is required that is capable of regulating the strength and intensity of the relationship between project team members. This paper analyzes the relationship between three constructs—innovativeness, social capital, and conflict. The existence of these latent constructs, which are formed by observable indicators of employees, is proven using confirmatory factor analysis (CFA). The construct of innovativeness depends on indicators such as creativity, risk propensity, and strategicity. Social capital includes observable indicators such as trust, social networks and connections, and social norms and values. Conflict consists of observable indicators of conflict between tasks, processes, and relationships. Using structural equation modeling (SEM), the causal relationship between social capital and innovativeness is substantiated with the mediating role of conflict in project groups between its participants—innovators and adaptors. The developed sociodynamic model for measuring conflict between innovators and adapters examines the required values of the controlled parameters of intra-group and inter-group connections between innovators and adapters in order to achieve equilibrium conflict dynamics, resulting in cooperation between them. This study was conducted using data from a survey of employees of a research organization. All model constructs were tested on a sample of employees as a whole, as well as for groups of innovators and adaptors separately.
Keywords:
personal innovativeness; social capital; social conflict; structural equation modeling; causal inference; sociodynamic modeling MSC:
62H25; 37N40
1. Introduction
Individual innovativeness is a personal resource, providing the subject with the ability to appear, perceive, and implement new ideas. Innovativeness is the most important factor determining one’s ability to think innovatively, along with the ability to produce new ideas and apply them in practice. Analysis of the factors of individual innovativeness has revealed two groups of factors—psychological and organizational factors [1,2,3,4,5,6,7]. Psychological factors contributing to individual innovativeness include personal qualities—self-efficacy, thinking styles, internal motivation and attitudes, and orientation towards achieving the goal. Organizational factors contributing to innovativeness include organizational leadership, structure, strategy, resources, and organizational culture and climate [4,5,6,7].
Other factors contributing to individual innovativeness include social networks and connections, which provide additional information that can be extracted. Therefore, the study of the social capital of an individual as a factor influencing innovativeness has become a new and relevant research task. Social capital is a set of resources that individuals and social groups possess and use for their own interest, taking the form of social networks, trust, and social norms and values [8,9,10].
Social capital factors—trust, social networks and connections, and social values—determine a person’s attitude to innovation. Different densities and directions of bridging (external) and bonding (internal) social capital affect conflict intensity. Therefore, to solve the problem of effective development and implementation of innovations, it is necessary to take into account the direct and indirect influence of conflict on individual innovativeness.
The purpose of the investigation of individual innovativeness is to study its prerequisites (factors, indicators) and apply the acquired knowledge to develop and stimulate the innovative activity of project team members engaged in innovative activities. Knowledge of innovativeness should ensure its implementation.
The relationship of three constructs is analyzed in this study—innovativeness, social capital, and conflict. Innovativeness depends on such indicators as creativity, risk propensity, and strategicity. Social capital includes observable indicators such as trust, social networks and connections, and norms and values. Conflict consists of observable indicators of conflict in tasks, processes, and relationships.
This article is organized as follows. The Section 2 provides a literature review, reflecting theoretical and empirical studies on the influence of social capital on individual innovativeness; the connection between the architecture of the social capital of a project team and its innovations is analyzed in detail, the role of conflict in this process is assessed, and a typology of participants in social conflict within the project teams is provided. The Section 3 describes the methodology and model of this study. The Section 4 presents the results of testing the proposed model and discusses the effects of its use. The conclusion summarizes the results and shows further directions for research.
2. Literature Review
2.1. The Impact of Social Capital on Innovation
Research on management and organizational behavior examines issues related to innovativeness, studies employees’ attitudes toward organizational changes [11], analyzes the relationship between employees’ innovativeness and the density of their contacts [12], and diagnoses the impact of managers’ innovativeness on organizational efficiency [13]. It has also been established that social capital factors influence the formation of innovations, affect creative and critical thinking, and contribute to the development of individual innovativeness. Creativity promotes the development of abilities to develop new ideas and find non-standard solutions to complex problems. A number of studies have shown the impact of socio-cultural characteristics on an individual’s creative behavior [14,15] and have examined intercultural sensitivity (tolerance, attention to other people) [16]. One study [17] identified personality traits that are significantly associated with successful innovations in households. The five-factor model of personality was used, consisting of five main personality traits: openness, extroversion, conscientiousness, agreeableness, and neuroticism. Possible ways to increase successful innovation were proposed, and the choice of components represents a spectrum from technological to hidden innovations and social innovations. The fundamental relationship between social capital and innovation was proposed by R. Putnam [18], who argued “trust promotes cooperation”, clearly defining the importance of trust as a factor in cooperation. In the study by V. Tsai [19], a significant positive relationship was found between the social capital of companies and their ability to create innovations. M. Dahli [20] empirically confirmed the important role of trust as a driving force for innovation. By facilitating exchange and reducing the need for time-consuming and expensive monitoring, trust promotes broader and seamless cooperation and a freer exchange of information, which can ultimately lead to more activities and inventions related to innovation. R. Landry [21] also considered social capital to be the most important and influential factor in deciding to implement innovations. In addition, social capital can be considered as a decisive factor in the desire of an organization to become more innovative. The concept of trust, which is important for innovation, is studied in [22,23], which argue that “collaboration generates trust”.
Based on a deep analysis of sources on the topic of social capital associated with the innovative activity of the subject, we assume that social capital factors such as trust, social networks and connections, and social values shape a person’s attitude towards innovations [13,15,18,24,25,26]; moreover, individual innovativeness is determined by factors such as creativity, or the ability to produce new ideas and concepts, a propensity to take risks in the development and implementation of innovations, and strategicity, which is the ability of an individual to set and orient their behavior towards achieving long-term goals [27,28,29,30].
2.2. The Relationship Between the Architecture of Social Capital of a Project Team and Its Innovations: The Role and Impact of Conflict
A number of recent scientific papers have shown that the social capital of an organization or its project teams, based on factors such as social networks, values, and trust, can be a catalyst for team innovation. The evidence for such connections is based on the models and structures of social relations and their impact on the innovations in project teams. The construct of the social capital of a project team is formed by the resources available to the group through social relations. There are two types of social capital: bridging, which is outwardly oriented and unites members of different teams, and bonding, which emphasizes connections within one team.
The relationship between a project team’s social network architecture and its innovations is discussed in the literature. There are different opinions and approaches to explaining how and when a team’s social capital influences its innovativeness, as well as what is the nature of the connection between the team’s social network and the innovations it generates. It has been shown that bridging and bonding social capital do not directly affect the creativity and innovativeness of a project team [31,32] or can even harm the generation of innovative ideas [33,34]. This paper provides a logical explanation for these patterns.
The first mechanism of the influence of bridging social capital (through social networks and connections) on innovation through conflict mediation is as follows. The positive effects of bridging social capital on the generation of innovation within a project team can be reversed due to conflict within the team, which arises in response to information brought by group members from external sources. Thus, bridging (inter-group) social capital can increase the likelihood that group members will propose new rules for establishing intra-team relationships or new, better ways to distribute project tasks, processes, and resources. These new rules may differ from those already existing in the team and may provoke conflicts. A conflict over establishing the order of implementing business processes may develop into a conflict of intra-team relations between its members or even develop into interpersonal hostility. Such conflict in business processes and interpersonal relationships can distract team members from completing work tasks, hinder the processing and exchange of information within the group, hinder effective creative work, and ultimately suppress the cognitive functions of team members.
A destructive conflict arises. The purpose of such conflict is to cause damage or, harm to the opposite (conflicting) party, because of which team members enter into open confrontation with each other, strive to destroy relationships, worsen the psychological well-being of participants, reduce the self-esteem of group members, spread aggression, and contribute to the isolation of individual group members. All this inevitably reduces the productivity and efficiency of research and development processes.
The second mechanism of the influence of binding social capital (through trust in the group) on innovation through conflict mediation is as follows. Project teams with a high level of bonding (intra-group) social capital have a high level of trust between team members and have approximately equal access to information. Such teams are less prone to intra-team conflict relations, as they are considered inappropriate. At the same time, informal hierarchies and structures in relation to the implementation of project tasks and business processes can be established in such teams. The nature of research and development processes implies differentiation of the roles of team members, their responsibilities, and resources in relation to the implementation of project tasks. This is clearly manifested in the implementation of two types of tasks, the first of which are directly related to creative activity (performed by innovators), and the second are aimed at implementing already-developed ideas and concepts (performed by adapters). A constructive, productive conflict arises. The purpose of such conflict is to improve the situation and develop new ideas. Participants strive for cooperation and mutual understanding, and the relationships between them develop, which contributes to the growth of their productivity.
If there are effective processes of knowledge exchange and information integration within the project group, then the total information resource of the group, corresponding to its social capital, will have a positive effect on the team’s innovativeness. Disagreements, discussions, and disputes between group members related to the tasks can bring about the formation of new alternatives for their resolution, encourage the team to re-evaluate the task, identify its non-obvious parameters and factors, and contribute to the generation of new ideas.
Conflict is also useful at the stage of idea implementation if constructive disagreements arise about how to implement creative ideas in practice. Constructive conflict can be useful for innovation for two reasons. Firstly, it can contribute to a psychologically safe environment in which critical thinking, diversity of opinions, creative thinking, and risk-taking are encouraged, and team members are not afraid of a negative reaction to their bold ideas. Secondly, the positive effect of conflict on innovation is realized through constructive disputes and open discussion of opposing points of view, and then, constructive conflict acts as a catalyst for change and innovation.
2.3. Types of Participants in Social Conflict in Project Teams
In cognitive psychology, it is shown that all people can be divided into creative and non-creative (or reproductive personalities) [35]. In [36], an adaptation–innovation theory is proposed, which distinguishes two behavioral (creative) styles of individuals depending on the propensity for innovation—innovators and adapters. The value of such differentiation of behavioral types, depending on the complexity and type of tasks being solved, is that it allows for the formation of balanced project teams taking into account the features of behavioral styles:
- Project team members with an adaptive behavioral style (adapters) cope better with current, operational tasks and contribute to maintaining the short-term sustainability of the enterprise; project team members with an innovative style (innovators) contribute to the formation of new ideas, and projects, solutions that determine the strategic development of the enterprise;
- Current, regular tasks are best solved by participants–adapters; for solving tasks with a high-risk component or in crisis conditions, participants–innovators are the most effective;
- Participants–adapters always form solutions to a problem situation that are adequate to external conditions and factors and also acceptable from the standpoint of different efficiency criteria; participants–innovators can offer solutions that are not always obvious or relevant to current conditions and may not directly produce the desired effects in the short term;
- Participants with different innovative thinking styles use available information differently when solving problems. Having received new data, adapters implement them into existing data structures or the existing context of the problem being solved. Innovators extract knowledge from new data, based on which they change the existing data structure, forming new paradigms.
The listed features of different innovative styles of participants in the innovation process also determine the differences in their mutual perception of each other. Innovators characterize adapters as employees who are not inclined to take risks, they are not flexible conformists, and their behavior is easy to calculate (predict). Adapters characterize innovators as risky, ready to break any trends. An adapter worker, finding himself in a project team, the participants of which are mainly innovators, can copy the behavioral style of most participants for the purpose of adaptation, but in the short term, changing the behavioral style is impossible. Therefore, the presence of workers with antagonistic behavioral styles in one project group can not only provoke psychological discomfort but also lead to conflict situations, and as a consequence, to a decrease in worker productivity.
At the same time, for the effectiveness of innovative projects, it is necessary to involve employees of both behavioral styles—innovators and adapters. The more homogeneous the team is in terms of creative styles, the less conflict can arise between its members. At the same time, the diversity of project tasks to be solved requires a project group that is more heterogeneous in its behavioral profile, which, in turn, increases the likelihood of conflict situations and increases the complexity of management decisions.
3. Research Methodology
3.1. Hypotheses and Research Model
Based on the analysis of theoretical positions and the scientific literature regarding the role of conflict in the processes of transformation of social capital into innovation, the following conceptual model is proposed, as shown in Figure 1.
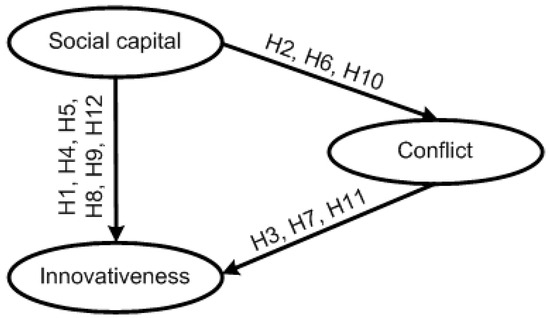
Figure 1.
Conceptual model of the study.
When formulating hypotheses, we distinguish bridging social capital (which facilitates inter-group communication) of group members and bonding social capital (which facilitates intra-group connections and communication) of group members.
If bridging social capital exceeds a group’s bonding social capital, then it can be assumed that conflict will have a negative, destructive impact on the group’s innovativeness for members of that group. This may be typical for adaptors, who are susceptible to external influence from members of another group.
If bridging social capital is lower than bonding social capital, then conflict will obviously have a positive and constructive impact on the group’s innovativeness. This situation may characterize innovators, who are less susceptible to external influence.
If bonding social capital is high for members of one group, then social capital will have a positive impact on the level of conflict within that group. This situation may be typical for adaptors. This is due to the close interactions between group members and the potential for disputes and discussions in conflicting processes, tasks, and relationships.
If bonding social capital is low, then conflict in such a group may decrease as social capital increases, which may be characteristic of innovators. We also assume that social capital positively influences team innovation regardless of the magnitude and ratio of bonding and bridging social capital.
The main hypotheses tested are as follows:
H1:
Social capital has a direct positive effect on innovativeness.
H2:
Social capital has a direct positive effect on conflict.
H3:
Conflict has a direct positive effect on innovativeness.
H4:
Conflict mediates the relationship between social capital and innovativeness.
H5:
Innovators’ social capital has a direct positive effect on innovators’ innovativeness.
H6:
Innovators’ social capital has a direct positive effect on innovators’ conflict with adapters.
H7:
Innovators’ conflict with adapters has a direct negative effect on innovators’ innovativeness.
H8:
Innovators’ conflict with adapters mediates the relationship between social capital and innovativeness.
H9:
Adapters’ social capital has a direct positive effect on adapters’ innovativeness.
H10:
Adapters’ social capital has a direct negative effect on innovators’ conflict with adapters.
H11:
Innovator–adaptor conflict has a negative positive effect on adaptor innovativeness.
H12:
Innovator–adaptor conflict mediates the relationship between social capital and innovativeness.
Structural equation modeling (SEM) methods are approaches and algorithms that allow for testing multivariate models. SEM is a hybrid of factor and path analysis, its goal is similar to the goal of factor analysis, and it consists in substantiating the relationships between observed characteristics of the object of study. Like path analysis, SEM is used to test the hypothesized relationships between constructs.
Three model constructs are proposed, as shown in Figure 2. Table 1 presents descriptions of the construct components.
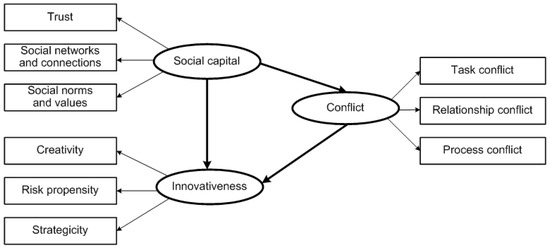
Figure 2.
Proposed structural model.

Table 1.
Constructs, indicators, and studies.
3.2. Measurement and Analysis Methods
The study used confirmatory factor analysis (CFA) and structural equation modeling (SEM) to examine the relationships between three constructs: social capital, innovativeness, and conflict. The observed variables included three indicators representing SC, three indicators related to INN, and three indicators related to K (see Table 1 for a description of each indicator). The selected multi-item scales for each construct were as follows.
Social Capital (SC). This construct is measured using the scales used in the studies [9,36]. The scales include 7 questions on indicator SC1: trust; 5 questions on indicator SC 2: social networks and connections; and 5 questions on indicator SC3: social norms and values.
Innovativeness (INN). This construct is measured using the scales used in the study [9]. The scales include 4 questions on indicator INN1: creativity; 2 questions on indicator INN2: risk propensity; and 4 questions on the INN indicator 3: strategicity.
Conflict (K). This construct is measured using the scales proposed in the studies [49]. The scales include 2 questions for each indicator, i.e., K1: task conflict, K2: relationship conflict, and K3: process conflict.
Obviously, different versions of scales and questions can be used for each construct. However, this study used the scales that were substantiated and used in [8,9,49]. A sample of 268 employees from a research institute is used for the study. A five-point Likert scale is adopted for the questionnaire in this study [50]. A fragment of the questionnaire is presented in Table 2.
Table 2.
Rating scales. Please express your opinion on social capital (SC), innovativeness (INN), and conflict (K) over the past year. Five-point Likert scale: (1) strongly disagree; (2) moderately disagree; (3) neither agree nor disagree; (4) moderately agree; (5) strongly agree.
Then, all variable values were normalized to the interval from 0 to 1. In this study, the measurement models are first assessed using reliability and validity tests. Then, CFA and SEM methods are used to test the hypotheses proposed in the theoretical model. SEM uses different types of models to map the relationships between observed variables grouped into constructs (latent variables) and substantiates causal relationships between these constructs based on quantitative tests of the proposed theoretical model. Different theoretical models can be tested based on SEM, which hypothesizes how sets of variables define constructs and how these constructs are related to each other.
The observed variables, or indicators, are variables related to social capital, innovativeness, and conflict. First, confirmatory factor analysis (CFA) is used to test the factor structure of the set of observed variables. Then, SEM is used to test the hypotheses.
3.3. Sociodynamic Model of the Conflict Between Innovators and Adaptors
The conflict between two groups is considered. The first group includes innovators as developers of innovations; the second group includes adapters as executors, implementers of ready innovations. A conflict may arise between these two groups of participants, since they have opposite goals and objectives. The behavior of participants in these groups in a conflict is described, taking into account their individual attitude, or preference, for choosing methods for resolving the conflict. The average value of such preferences for group n is designated by a discrete variable , which can take values corresponding to behavioral styles in the conflict. Each group of participants forms its own behavioral trajectory, choosing at each moment in time one of the presented behavioral styles.
To characterize the behavioral style, the variable is introduced; for innovators, this variable varies in the range from to : , where negative values indicate the interaction style of cooperation, collaboration, and a tendency to negotiate, while positive values describe the style of rivalry, competition, and a tendency to protracted conflict. For adapters, the style of interaction in conflict is described by the variable , the values of which are defined in the same way as for innovators. This reflects the desire of the conflicting participants to compromise. The characteristic , reflecting the average preference of the participants in the conflict for a certain method of conflict behavior, is called as involvement in the conflict, as a preference for choosing one of the styles of conflict behavior.
During the conflict, each group member interacts with both members of his or her group and members of the opposing group. To characterize these interactions, variables of intra-group interactions and , as well as inter-group interactions and , are introduced. reflects the intensity of inter-group interactions of group 1 members on group 2 members. Similarly, shows the intensity of the impact of group 2 members on group 1 members. Intensities vary between 0 and 1, which shows low and high levels of interactions between participants.
When forming their own position in the conflict, members of both groups take into account the positions of the opposing side. At time t, the average preferences take on the value , where n is the group number, n = 1.2. These average preferences are defined as the weighted average values of the preferences of group members. Note that the values and differ, in that reflects the average preference for the method of resolving the conflict of group members, provided that there are no interactions between members within and between groups. When such interactions occur, preferences change and are characterized as average group preferences, .
We use the general theory of magnetism and the theory of paramagnetism by P. Langevin and L. Brillouin [51] to assess magnetization, associating it with the degree of inclination (preference) and the level of involvement of participants in a particular group in the method of conflict resolution (from extreme competition to close cooperation). Let us formulate a model that describes the dynamics of style preferences in conflict interactions between groups, taking into account the delay factor associated with the informational reflection of the interaction between innovators and adapters. The average values , of style preferences of conflict interactions and participants of groups of innovators and adapters are formed on the basis of exponential intensities of interactions of innovators and adapters within their groups and between opposing groups:
Using the Brillouin function, we replace Formula (1):
where
By placing Expression (3) into Equation (2), we obtain:
The resulting map (4) describes the dynamics of the average group preferences of innovators and adapters for the style method of interaction in a conflict, taking into account the parameters of intra-group and inter-group communications.
4. Empirical Results and Discussion
4.1. Estimation of Descriptive Statistics
Based on the survey results, all employees were divided into two groups based on all the characteristics studied (trust, social networks and connections, social norms and values, creativity, risk propensity, strategic approach, conflict of tasks, processes, and relationships)—innovators and adapters. Descriptive statistics for the sample as a whole, as well as for the innovators and adapters groups, are presented in Table 3.
Table 3.
Descriptive statistics of the studied indicators by groups.
The innovator group included 42% of the surveyed employees, or 112 people, and the adapter group included 58% (156 people). The descriptive statistical characteristics of the innovator and adapter groups show that these two groups are statistically homogeneous in almost all indicators; the variation coefficients for them do not exceed 33%. The average level of innovativeness among members of the innovator group is 1.75 versus 1.6 among adapters, while the innovator group can be characterized as more conflict-prone; the average level of conflict among members of this group is 58% higher than the average level of conflict among members of the adapter group. It should be noted that the average level of social capital among group members is comparable: 2.11 among innovators and 2.07 among adapters. In general, the innovator group can be characterized as quite creative, with members prone to risk; however, the levels of trust, social norms, and social connections do not differ significantly among these groups.
4.2. Measurement Model: Confirmatory Factor Analysis, CFA
Confirmatory factor analysis (CFA) as a form of factor analysis is an approach to testing hypotheses about the relationship of items with specific factors, using structural element modeling (SEM) to test a measurement model in which factor loadings estimate the relationships between observed and latent variables. CFA is most often used to test the fit of indicators of a particular construct (latent variable) to explore the nature of that construct. The purpose of CFA is to test the fit of the data to some hypothetical measurement model.
In CFA, a hypothesis is first formed about what factors underlie the measures (constructs) used, and some constraints are imposed on the model based on these a priori hypotheses. If the constraints do not match the sample data, the results of statistical tests of model fit will indicate poor fit and the model will be rejected. If the fit is poor, this may be due to the fact that some items measure multiple factors. SEM is used to perform confirmatory factor analysis, and hypotheses are determined about the relationship between the observed indicators and their supposed primary latent factors (constructs).
The measurement model is assessed based on a series of reliability and validity tests. The measurement model for each indicator is represented by the factor loading values, as shown in Table 4, Table 5 and Table 6. The loading values for all indicators are acceptable as they are greater than 0.7. The composite reliability (CR) values are also acceptable as they are greater than 0.7. Similarly, the convergent validity is also confirmed as the average variance extracted for all latent variables (AVE) is greater than 0.5. In addition, the square root of AVE of each construct is greater than the correlations between constructs, indicating satisfactory validity, as shown in Table 7, Table 8 and Table 9.
Table 4.
Reliability, internal consistency, and convergent validity for the total sample (n = 268).
Table 5.
Reliability, internal consistency, and convergent validity for a sample of adapters (n = 156).
Table 6.
Reliability, internal consistency, and convergent validity for a sample of innovators (n = 112).
Table 7.
Construct correlation matrix for the adapter group (n = 156).
Table 8.
Construct correlation matrix for the group of innovators (n = 112).
Table 9.
Construct correlation matrix for total sample (n = 268).
The model fit to the empirical data is determined based on the calculation of the following statistical tests and indices [52]:
- The chi-squared test (χ2) shows the difference between the observed and expected covariance matrices. Values close to zero indicate a better fit of the model to the empirical data. The disadvantage of this test is that an inappropriate model may not be rejected on small samples and that a suitable model may be rejected on large samples;
- The Goodness-of-Fit Index to the degrees of freedom (χ2/df) should be less than 2 for high-quality models;
- The Root Mean Square Error of Approximation (RMSEA) avoids problems with sample size; RMSEA ranges from 0 to 1, where lower values indicate a better fit of the model. A value of 0.06 or less indicates an acceptable fit of the model to the empirical data;
- The Comparative Fit Index (CFI) analyzes the fit of the model by examining the discrepancy between the data and the hypothesized model, adjusting for sample size issues inherent in the chi-square criterion. CFI values range from 0 to 1, with larger values indicating better fit. CFI values of 0.95 and above are accepted as an indicator of good fit;
- The Goodness-of-Fit Index (GFI) is a measure of the fit between the hypothesized model and the observed covariance matrix. GFI values can range from 0 to 1, and for a quality model, it should be greater than 0.9.
CFA conducted on the collected data showed that the measurement models for all constructs—SC, INN, K—correspond to the hypotheses, and these constructs can be measured based on the described indicators, as shown in Table 10.
Table 10.
Results of the measurement model analysis.
Both for the sample of employees as a whole and for the groups of innovators and adapters, the model constructs showed high results for all quality criteria, and their calculated values correspond to the reference ones. Therefore, the proposed constructs of social capital, innovativeness, and conflict can be used to assess its causal relationships.
4.3. Structural Model: Structural Equation Modeling, SEM
Once the reliability and validity of the measurement models were established, the hypothesized causal relationships within the model were assessed using SEM. The results of the study are presented in Table 11.
Table 11.
Results of the structural model analysis (direct effects), total sample, n = 268.
Hypothesis H1, which assumed that there is a positive relationship between social capital and innovativeness in the overall sample of industrial enterprise employees, was not confirmed (the standardized coefficient is 0.047, p < 0.05). It was also found that SC has a positive, but statistically insignificant, effect on K (the standardized coefficient is 0.019), that is, hypothesis H2 is also rejected. However, in the overall sample of employees, conflict has a statistically significant effect on innovativeness, so hypothesis H3 is supported.
The results of the analysis showed that the causal relationship between SC and INN is as follows. In general, employees demonstrated a positive role of social capital in the growth of innovativeness. In conditions of conflict, this relationship generally tends to increase due to the constructive impact of conflict on innovativeness.
The indirect effect of the relationship between social capital and innovativeness through the mediation of conflict SC → K → INN can be determined as 0.019 * 0.884 = 0.017. To assess the significance of the mediation effect, we used the bootstrapping procedure and estimated this effect based on confidence intervals. We used 1000 bootstrapped samples and formed a 95% confidence interval. The results showed significant full mediation: the point value of the regression coefficient was 0.02, and the 95% confidence interval was [0.012; 0.035]. Hypothesis H4 is accepted. The results of the analysis of the mediating role of conflict in establishing the relationship between social capital and innovativeness, measured using a system of special indicators, are summarized in Table 12. The total effect, taking into account both direct and indirect influence, is 0.067 (0.02 + 0.047).
Table 12.
Characterization of mediation analysis results.
As can be seen from Table 3 and Table 4, the direct effect of SC to INN is 0.047, but it is statistically insignificant, while the indirect effect of SC to INN is 0.02 with significance at the level of p < 0.05. This result can be characterized as follows. The insignificant direct relationship between social capital and innovativeness is mediated by conflict between employees, increasing conflict for teams with higher levels of social capital. The mediating role of conflict in establishing the relationship between social capital and innovativeness is significant, and the insignificant relationship between social capital and innovativeness is mediated by conflict between employees. Therefore, when designing management decisions in the field of social communications of employees, increasing the level of their intra-group and institutional trust, and forming a conflict-free working environment, it is necessary to take into account the positive and significant relationship between the growth of conflict and innovativeness in a team, which can subsequently ensure the growth of innovativeness due to the positive mediating role of conflict in the formation of innovativeness.
The analysis of the relationships between social capital and innovativeness, testing hypotheses H4–H12, for groups of innovators and adapters showed the following results, as shown in Table 13, Table 14, Table 15 and Table 16.
Table 13.
Results of structural model analysis (direct effects), adapters group, n = 156.
Table 14.
Characteristics of the analysis of the mediating influence of the conflict, adapters group.
Table 15.
Results of structural model analysis (direct effects), innovators group, n = 112.
Table 16.
Characteristics of the analysis of the mediating influence of conflict, innovators group.
The indirect effect of the relationship between social capital and innovativeness for the sample of adapters through the mediation of the conflict SC → K → INN can be determined as 0.067 * (−0.368) = −0.025. To assess the significance of this mediation effect, we also used the bootstrapping procedure. The results showed significant full mediation: the point value of the regression coefficient was −0.026, and the 95% confidence interval was [−0.023; −0.030]. Hypothesis H8 is accepted.
The indirect effect of the relationship between social capital and innovativeness for the sample of innovators through the mediation of conflict SC → K → INN can be determined as (−0.004) * (−2.774) = 0.011. The results of applying the bootstrapping procedure showed significant mediation: the point value of the regression coefficient was 0.013, and the 95% confidence interval was [0.009; 0.016]. Hypothesis H12 is accepted.
For the adapter group, a direct relationship between social capital and innovativeness has not been proven (it is statistically insignificant), which does not exclude the presence of significant conflict mediation. In general, social capital has a low, but positive, impact on the innovativeness of adapters. Including a conflict in the system of this relationship disrupts its direction, changing the sign of influence to negative. In such a design, the conflict forms a destructive context. With an increase in the frequency and depth of interactions between employees, conflict in the team among adapters can increase. This conclusion is consistent with previous studies.
The indirect effect of the relationship between social capital and innovativeness through conflict mediation for innovators is 0.013, and the combined effect, taking into account both direct and indirect influence, is 0.139, which indicates an increase in the innovativeness of innovative employees when conflicts arise during the performance of work processes and tasks. This demonstrates the constructive role of conflict for the creative part of employees—innovators. It should also be noted that all regression models reflecting direct dependencies of social capital, innovativeness, and conflict are statistically significant, since R2 for all of them exceeds 0.26, while the Fisher F-criterion is greater than 12.
Thus, a stable and statistically significant influence of social capital on innovativeness has been proven, both for the team as a whole and for its most creative group of innovators. For innovators, a constructive role of conflict in the growth of innovativeness of innovator employees has been established. At the same time, due to a decrease in the level of conflict with the growth of social capital, a mediating negative role of conflict in the causal relationships of social capital and innovativeness has been proven for adapters, which can contribute to a decrease in the overall level of innovativeness in conditions of conflict. A significant relationship between the growth of social capital and conflict has been shown for the team as a whole and for the group of adapters. In order to increase the innovativeness of employees, when managing teams, it is necessary to pay special attention to intra-group and inter-group interactions between innovators and adaptors, and changing the relationships between these parameters can ensure the smoothing of destructive conflicts and the moderation of constructive conflicts.
This problem of regulating the ratio of inter-group and intra-group relations of innovators and adapters for the purpose of conflict resolution is solved in the works of the author [52,53] and is briefly presented below.
4.4. Modeling Conflict Dynamics
In the next stage, in order to substantiate the values of the parameters of intra-group and inter-group connections of the studied groups, we additionally evaluate the influence of factors that make up the social capital of group members—trust, social networks and connections, and social norms and values, as well as factors that form innovativeness—creativity, risk propensity, and strategicity. The matrices of paired correlations of all these factors by groups are given in Table 17 and Table 18.
Table 17.
Matrix of paired correlation coefficients of social capital and innovativeness for innovators group.
Table 18.
Matrix of paired correlation coefficients of social capital and innovativeness for adapters group.
A series of experiments were conducted analyzing a variety of possible conflict dynamics for various combinations of controllable parameters of intra- and inter-group connections between innovators and adaptors [52]. It was shown that for values of intra- and inter-group connections between innovators and adaptors at levels greater than 0.5, no change in the nature of the conflict dynamics is observed, and the pattern of conflict development remains unchanged. Therefore, we use a range of values for these parameters from 0 to 0.5. To correlate the levels of social capital indicators—trust and social norms and values that form bonding social capital—with the levels of social networks and connections that form bridging social capital, we transform their average values to the interval (0; 0.5). We also consider the sign of the correlations between the social networks and connections indicator and innovativeness.
We set the values j and k of intra- and inter-group connections for groups based on the following considerations. The values range from 0 to 0.5, with low values corresponding to weak ties and high values to strong ties. We associate the parameters of intra-group connections with the level of trust within groups and the level of social norms and values, while the parameters of inter-group connections associated with the social networks and connections indicator, as well as the sign of this indicator’s correlation with the innovativeness of the corresponding group.
Table 17 and Table 18 show that for innovators, the social networks and connections indicator has a positive effect on innovativeness (0.242), while for adaptors, this same correlation is negative (−0.231). The average levels of trust and social norms and values for members of both groups are similar, as shown in Table 3. The values of the normalized level of trust indicator can vary from 0 to 1, and for members of the studied groups, they range from 0.8 to 0.9. Based on these considerations and transforming these values to the interval from 0 to 0.5, we assume the same values for the intra-group cohesion (intra-group communication) parameters for adapters and innovators: .
To diagnose the inter-group communication parameters, we will make a number of introductory remarks. The inter-group communication parameter is considered positive if the impact of one group on the opposing group is symmetrical in response to the group’s actions . For example, if members of a group of innovators behave oppositionally and hostilely, then the adapter group adopts a copying strategy and reacts symmetrically, escalating the conflict. If members of one group behave hostilely but, in response, the opposing group attempts to smooth over the conflict, then such behavior is characterized as conciliatory and asymmetrical. In this case, the parameter . Based on this and taking into account the average level of the “social networks and connections” indicator (Table 3) as well as the signs of the correlations between this indicator and innovativeness for each group of innovators and adapters (Table 17 and Table 18), taking into account the transformation of the average level of the indicator into the interval from 0 to 0.5, we have , which shows that the members of the innovator group are intolerant of the criticism of the adapters; and , which means that the adapters smooth out the actions of the innovators or simply ignore their criticism.
At the next step, the conflict dynamics of groups were modeled, as shown in Figure 3a. The initial conditions were set as opposite for group members, that is, . Scenario experiments were conducted with variations in the parameters of intra-group and inter-group communications, and the conditions for the convergence of group positions, that is, conflict smoothing, were shown. In the situation shown in Figure 3b, a compromise between the conflicting parties can be reached if the innovators adopt a more conciliatory position. At the same time, such a compromise cannot ensure a complete resolution of the conflict between the parties. If we strengthen the intra-group connections of innovators and adapters, Figure 3e, and simultaneously strengthen the conciliatory power of both parties, Figure 3c, then, in this case, a compromise is not reached, and the contradictions of the parties only increase over time. The conflict is resolved only by increasing the intra-group cohesion of the innovators, Figure 3d. In this case, over time, the conflicting parties make concessions to each other, and this leads to their cooperation, which, in turn, leads to an increase in the innovativeness of group members.
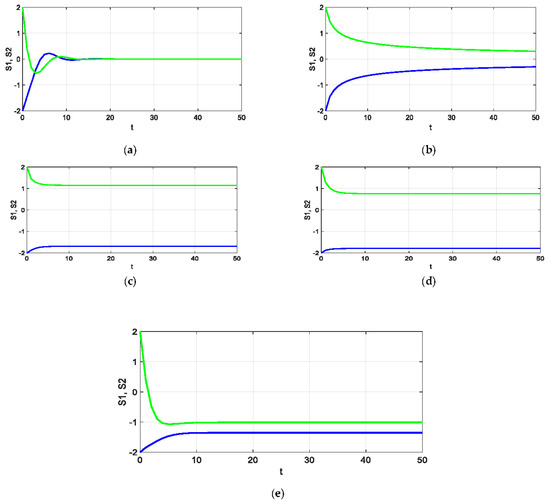
Figure 3.
Dynamics of interaction system of two groups, with the following initial conditions: : (a) ; ; (b) ; ; (c) ; ; (d) ; ; (e) ; .
Thus, based on model experiments, the types of interactions between innovators and adapters are considered, and it is established that a conflict may arise between these two groups, and the possible consequences of its development are demonstrated. It is shown that in various situations, differing in the strength and direction of intra-group and inter-group communications, various scenarios of conflict development are realized. In real situations, the conflict dynamics of groups can be characterized as convergence (cooperation), polarization (competition), or oscillatory mode (unstable mode).
Specific mechanisms for human capital development and its justification in the form of factors of cause-and-effect relationships are developed in the works [53,54].
5. Conclusions
This paper has constructively solved the problem of modeling and managing the personal innovativeness of employees in project teams in research and development business processes. We have investigated the innovativeness of the subject as a resource as the ability to think innovatively, to produce new ideas, and to apply them in practice. We have assumed that social capital can be a hidden resource of social networks and connections for obtaining information that will help to enhance the innovativeness of the subject. At the same time, we take into account the mediating role of conflict in the process of such a transformation of social capital into innovativeness.
Based on the SEM methods, the constructs of social capital, innovativeness, and conflict, which depend on a number of observable characteristics of employees, have been proven. We investigated three constructs—personal innovativeness, social capital of the individual, and conflict in the project team—in research and development business processes. Personal innovativeness as a construct includes indicators of creativity, risk propensity, and strategicity. The social capital construct includes such observable indicators as trust, social networks and connections, and norms and values. The conflict construct consists of observable indicators of conflict of tasks, processes, and relationships. The study was conducted using data from a survey of scientific organization employees. For a more detailed analysis, the employees were divided into groups of innovators and adapters, and all model constructs were tested for the sample of employees as a whole, as well as for subsamples of innovators and adapters. A stable and statistically significant influence of social capital on innovativeness has been proven, both for the team as a whole and for its most creative group of innovators.
The mediating role of conflict arising in project groups during innovation was analyzed. It was shown that, unlike the group of innovators, for the group of adapters, neither a direct nor indirect effect of the influence of social capital and innovativeness was observed when mediating conflict. For innovators, a constructive role of conflict in the growth of innovativeness of innovative employees was established. At the same time, due to the decrease in the level of conflict with the growth of social capital, the mediating destructive role of conflict in the causal relationships of social capital and innovativeness has been proven for innovators, which can contribute to a decrease in the overall level of innovativeness in a conflict situation. For the team as a whole and for the group of adapters, a significant relationship between the growth of social capital and conflict has been shown.
In order to increase the innovativeness of employees, it is necessary to pay special attention to intra-group and inter-group interactions between innovators and adapters, and changing the relationships between these parameters can ensure the smoothing of destructive conflicts and the moderation of constructive conflicts. This problem is solved on the basis of the sociodynamics model, which allows us to substantiate the values of the controlled parameters of intra-group and inter-group interactions of project groups, ensuring the achievement of equilibrium in the form of a strategy for cooperation between the parties to the conflict. In practice, the results of such studies can be applied to promote innovation in project groups and differentiated by areas that are characterized by different strengths, focuses, and combinations of intra- and inter-group connections of group members.
Funding
This research received no external funding.
Data Availability Statement
The data presented in this study are available on request from the corresponding author due to data privacy.
Conflicts of Interest
The authors declare no conflicts of interest.
References
- Midgley, C.; Kaplan, A.; Middleton, M.; Maehr, M.L.; Urdan, T.; Anderman, L.H. The development and validation of scales assessing students’ achievement goal orientations. Contemp. Educ. Psychol. 1998, 23, 113–131. [Google Scholar] [CrossRef]
- Linnenbrink, E.A.; Pintrich, P.R. Motivation as an enabler for academic success. Sch. Psychol. Rev. 2002, 31, 313–327. Available online: https://psycnet.apa.org/record/2002-18945-003 (accessed on 1 August 2025). [CrossRef]
- Patterson, F.; Kerrin, M.; Gatto-Roissard, G. Characteristics & Behaviours of Innovative People in Organisations; Literature Review Prepared for the NESTA Policy & Research Unit; NESTA: London, UK, 2009. [Google Scholar]
- Anderson, N.; Potocnik, K.; Zhou, J. Innovation and creativity in organizations. J. Manag. 2014, 40, 1297–1333. [Google Scholar] [CrossRef]
- Wisdom, J.P.; Chor, K.H.B.; Hoagwood, K.E.; Horwitz, S.M. Innovation adoption: A review of theories and constructs. Adm. Policy Ment. Health Ment. Health Serv. Res. 2014, 41, 480–502. [Google Scholar] [CrossRef]
- Cai, Y. From an analytical framework for understanding the innovation process in higher education to an emerging research field of innovations in higher education. Rev. High. Educ. 2014, 40, 585–616. [Google Scholar] [CrossRef]
- Aldahdouh, T.; Korhonen, V.; Nokelainen, P. What contributes to the individual innovativeness? A multilevel perspective. Int. J. Innov. Stud. 2019, 3, 23–39. [Google Scholar] [CrossRef]
- Orlova, E.V. Methodology and Statistical Modeling of Social Capital Influence on Employees’ Individual Innovativeness in a Company. Mathematics 2022, 10, 1809. [Google Scholar] [CrossRef]
- Orlova, E.V. Design Technology and AI-Based Decision Making Model for Digital Twin Engineering. Future Internet 2022, 14, 248. [Google Scholar] [CrossRef]
- Orlova, E.V. Design of Personal Trajectories for Employees’ Professional Development in the Knowledge Society under Industry 5.0. Soc. Sci. 2021, 10, 427. [Google Scholar] [CrossRef]
- Christensen, K.S. Losing innovativeness: The challenge of being acquired. Manag. Decis. 2006, 44, 1161–1182. [Google Scholar] [CrossRef]
- Rodan, S. Innovation and heterogeneous knowledge in managerial contact networks. J. Knowl. Manag. 2002, 6, 2. [Google Scholar] [CrossRef]
- Belkin, V.N.; Belkina, N.A.; Antonova, O.A.; Bochkaeva, I.V. Theory of social capital of an organization. Soc. Power 2012, 36, 4. [Google Scholar]
- Arieti, S. Creativity: The Magic Synthesis; Basic Books: New York, NY, USA, 1976. [Google Scholar]
- Bykov, A.V.; Nastina, E.A. Relationships between value attitudes and career achievements (according to youth research). Sociol. Res. 2020, 8, 67–77. [Google Scholar] [CrossRef]
- Cukier, W.; Hodson, J.; Omar, A. Soft’ Skills Are Hard: A Review of the Literature; Ryerson University: Toronto, Canada, 2015; Available online: https://www.ryerson.ca/content/dam/diversity/reports/KSG2015_SoftSkills_FullReport.pdf (accessed on 1 August 2025).
- Hippel, E. Personality Traits of Successful Free Innovators. In Free Innovation; MIT Press: Cambridge, MA, USA, 2017. [Google Scholar] [CrossRef]
- Putnam, R. The prosperous Community. Social capital and Public Life. Am. Prospect. 1993, 4, 13. [Google Scholar]
- Tsai, W.; Ghoshal, S. Social capital and value creation: The role of intrafirm networks. Acad. Manag. J. 1998, 41, 464–476. [Google Scholar] [CrossRef]
- Dakhli, M.; De Clercq, D. Human Capital, Social Capital and Innovation: A Multi-Country Study; Vlerick Leuven Gent Management School Working Paper Series; Vlerick Leuven Gent Management School: Brussels, Belgium, 2003; p. 16. [Google Scholar] [CrossRef]
- Landry, R.; Amara, N.; Lamari, M. Does social capital determine innovation? To what extent? Technol. Forecast. Soc. Change 2002, 69, 681–701. [Google Scholar] [CrossRef]
- Beugelsdijk, S.; Van Schaik, T. Differences in social capital between 54 Western European regions. Reg. Stud. 2005, 39, 1053–1064. [Google Scholar] [CrossRef]
- Murphy, L.J. Social Capital and Innovation: A Theoretical Perspective. In Innovation and Social Capital in Organizational Ecosystems; Brychan, C.T., Lyndon, J.M., Eds.; IGI Global: London, UK, 2019; pp. 1–22. [Google Scholar] [CrossRef]
- Coleman, J.S. Social capital in the creation of human capital. Am. J. Sociol. 1988, 94, 94–120. [Google Scholar] [CrossRef]
- Yip, W.; Subramanian, S.V.; Mitchell, A.D.; Lee, D.T.; Wang, J.; Kawachi, I. Does social capital enhance health and well-being? Evidence from rural China. Soc. Sci. Med. 2007, 64, 35–49. [Google Scholar] [CrossRef]
- Siegler, V. Measuring Social Capital; Office for National Statistics: London, UK, 2014.
- Styhre, A.; Borjesson, S. Innovativeness and Creativity in Bureaucratic Organizations: Evidence from the Pharmaceutical and the Automotive Industry. In Proceedings of the OLKC 2006 Conference at the University of Warwick, Warwick, UK, 20–22 March 2006. [Google Scholar]
- Goleman, D.; Boyatzis, R. Social intelligence and the biology of leadership. Harv. Bus. Rev. 2008, 86, 74–81. Available online: https://hbr.org/2008/09/social-intelligence-and-the-biology-of-leadership (accessed on 1 August 2025). [PubMed]
- Gkonou, C.; Mercer, S. Understanding Emotional and Social Intelligence Among English Language Teachers; British Council: London, UK, 2017. [Google Scholar]
- Lebedeva, N.M.; Bushina, E.V.; Cherkasova, L.L. Values, social capital and attitude towards innovations. Soc. Sci. Mod. 2013, 4, 28–41. [Google Scholar]
- Lee, J. Heterogeneity, brokerage, and innovative performance: Endogenous formation of collaborative inventor networks. Organ. Sci. 2010, 21, 804–822. [Google Scholar] [CrossRef]
- Han, J. Team-bonding and team-bridging social capital: Conceptualization and implications. Team Perform. Manag. Int. J. 2018, 24, 17–42. [Google Scholar] [CrossRef]
- Dokko, G.; Kane, A.A.; Tortoriello, M. One of us or one of my friends: How social identity and tie strength shape the creative generativity of boundary-spanning ties. Organ. Stud. 2014, 35, 703–726. [Google Scholar] [CrossRef]
- Carnabuci, G.; Diószegi, B. Social networks, cognitive style, and innovative performance: A contingency perspective. Acad. Manag. J. 2015, 58, 881–905. [Google Scholar] [CrossRef]
- Voronin, A.N. Intellectual activity: Manifestation of intelligence and creativity in real interaction. Psychol. HSE J. 2006, 3, 35–58. [Google Scholar]
- Bourdieu, P. Forms of social capital. In Handbook of Theory and Research for the Sociology of Education; Richards, J.C., Ed.; Greenwood Press: New York, NY, USA, 1983. [Google Scholar]
- Olson, M. The Rise and Decline of Nations; Yale University Press: New Haven, CT, USA, 1982. [Google Scholar]
- Fukuyama, F. Trust: The Social Virtues and the Creation of Prosperity; Free Press: New York, NY, USA, 1995. [Google Scholar]
- Ponzetto, G.A.M.; Troiano, U. Social Capital, Government Expenditures, and Growth. J. Eur. Econ. Assoc. 2018, 23, 632–681. [Google Scholar] [CrossRef]
- Ma, L.; Zhang, X.; Wang, G.; Zhang, G. How to build employees’ relationship capital through different enterprise social media platform use: The moderating role of innovation culture. Internet Res. 2021, 31, 1823–1848. [Google Scholar] [CrossRef]
- Lizardo, O. Improving Cultural Analysis: Considering Personal Culture in its Declarative and Nondeclarative Modes. Am. Sociol. Rev. 2017, 82, 88–115. [Google Scholar] [CrossRef]
- Barton, H.; Thorpe, J.; Dufur, M. Social Capital and Prosocial Behavior among German Children. Soc. Sci. 2020, 9, 215. [Google Scholar] [CrossRef]
- Chursin, A.A.; Yudin, A.V.; Grosheva, P.Y. Intellectual Capital of Technological Transformation of Economy of Industrial Region. J. Appl. Econ. Res. 2021, 20, 641–665. [Google Scholar] [CrossRef]
- De Dreu, C. When too little or too much hurts: Evidence for a curvilinear relationship between task conflict and innovation in teams. J. Manag. 2006, 32, 83–107. [Google Scholar] [CrossRef]
- Jehn, K.; Greer, L.; Levine, S. The effects of conflict types, dimensions, and emergent states on group outcomes. Group Decis. Negot. 2008, 17, 465–495. [Google Scholar] [CrossRef]
- O’Neill, T.A.; McLarnon, M.J.W.; Hoffart, G. The multilevel nomological net of team conflict profiles. Int. J. Confl. Manag. 2018, 29, 24–46. [Google Scholar] [CrossRef]
- Behfar, K.J.; Mannix, E.A.; Peterson, R.S. Conflict in small groups: The meaning and consequences of process conflict. Small Group Res. 2011, 42, 127–176. [Google Scholar] [CrossRef]
- Kirton, M.J. Adaptors and Innovators: A Description and Measure. In Creativity Assessment: Readings and Resources; Puccio, G.J., Murdock, M.C., Eds.; Creative Education Foundation Press: Buffalo, NY, USA, 1999; 197p. [Google Scholar]
- Stollberger, J.; Ali Al-Atwi, A.; De Cremer, D. Untangling the team social capital–team innovation link: The role of proportional task conflict as well as group- and differentiated individual-focused transformational leadership. Hum. Relations 2022, 76, 871–900. [Google Scholar] [CrossRef]
- Likert, R. A Technique for the Measurement of Attitudes; The Science Press: New York, NY, USA, 1932. [Google Scholar]
- Orlova, E.V. A Novel Brillouin and Langevin Functions Dynamic Model for Two Conflicting Social Groups: Study of R&D Processes. Mathematics 2024, 12, 2788. [Google Scholar] [CrossRef]
- Kline, R.B. Principles and Practice of Structural Equation Modeling, 3rd ed.; Guilford Press: New York, NY, USA, 2010. [Google Scholar]
- Orlova, E.V. Dynamic Regimes for Corporate Human Capital Development Used Reinforcement Learning Methods. Mathematics 2023, 11, 3916. [Google Scholar] [CrossRef]
- Orlova, E.V. Inference of Factors for Labor Productivity Growth Used Randomized Experiment and Statistical Causality. Mathematics 2023, 11, 863. [Google Scholar] [CrossRef]
Disclaimer/Publisher’s Note: The statements, opinions and data contained in all publications are solely those of the individual author(s) and contributor(s) and not of MDPI and/or the editor(s). MDPI and/or the editor(s) disclaim responsibility for any injury to people or property resulting from any ideas, methods, instructions or products referred to in the content. |
© 2025 by the author. Licensee MDPI, Basel, Switzerland. This article is an open access article distributed under the terms and conditions of the Creative Commons Attribution (CC BY) license (https://creativecommons.org/licenses/by/4.0/).