A Nonparametric Double Homogeneously Weighted Moving Average Signed-Rank Control Chart for Monitoring Location Parameter
Abstract
1. Introduction
2. Design Structure of Nonparametric Signed-Rank Control Charts
2.1. The Signed-Rank Statistic
2.2. The EWMA-SR Control Chart
2.3. The DEWMA-SR Control Chart
2.4. The HWMA-SR Control Chart
3. The DHWMA-SR Control Chart
4. Performance Analysis for the Zero-State Scenario
4.1. Design and Implementation
- Step 1:
- For a specified value of and a shift , generate 10,000 random variables from any continuous and symmetric distribution.
- Step 2:
- For a desired value of ARL0, specify the design parameters and .
- Step 3:
- Compute the and statistics using Equations (1) and (2), respectively.
- Step 4:
- Compute the control limits of the DHWMA-SR chart using Equation (4).
- Step 5:
- Compare each charting statistic with the corresponding control limits. The DHWMA-SR chart gives a signal if any plots beyond the control limits.
- Step 6:
- Repeat Steps 1 to 5 for 50,000 times and compute the run-length characteristics from the above values.
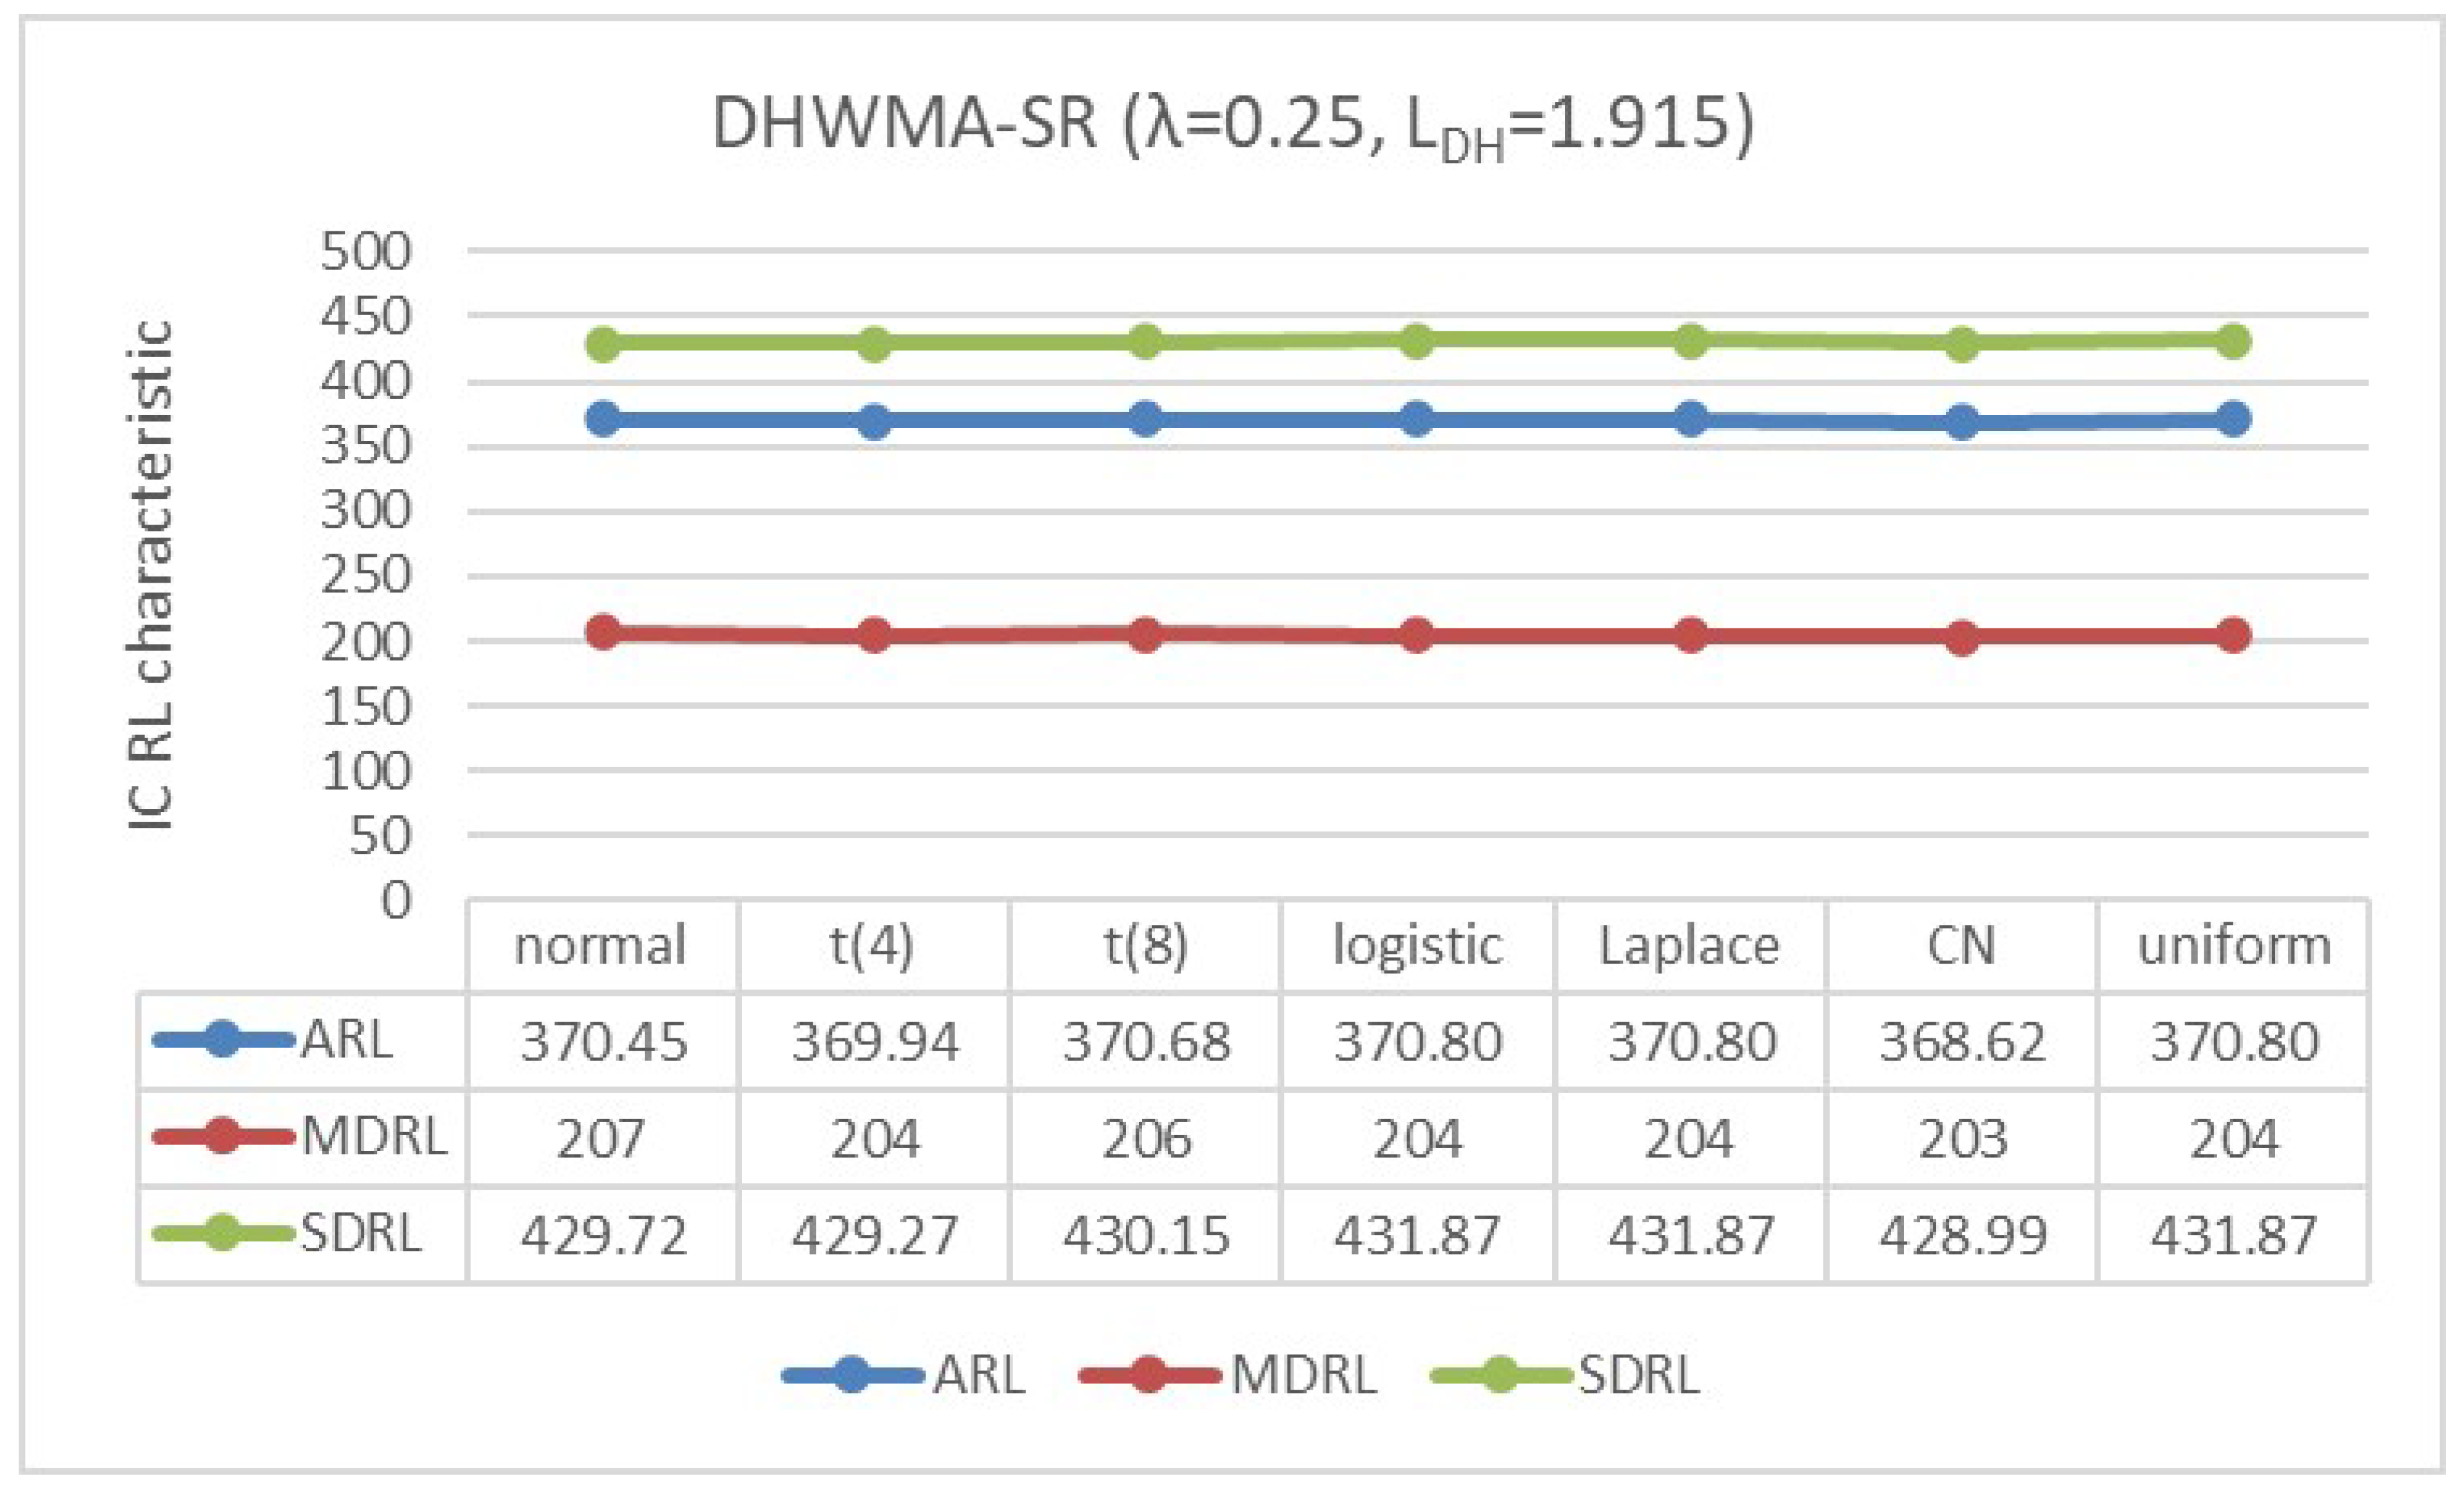
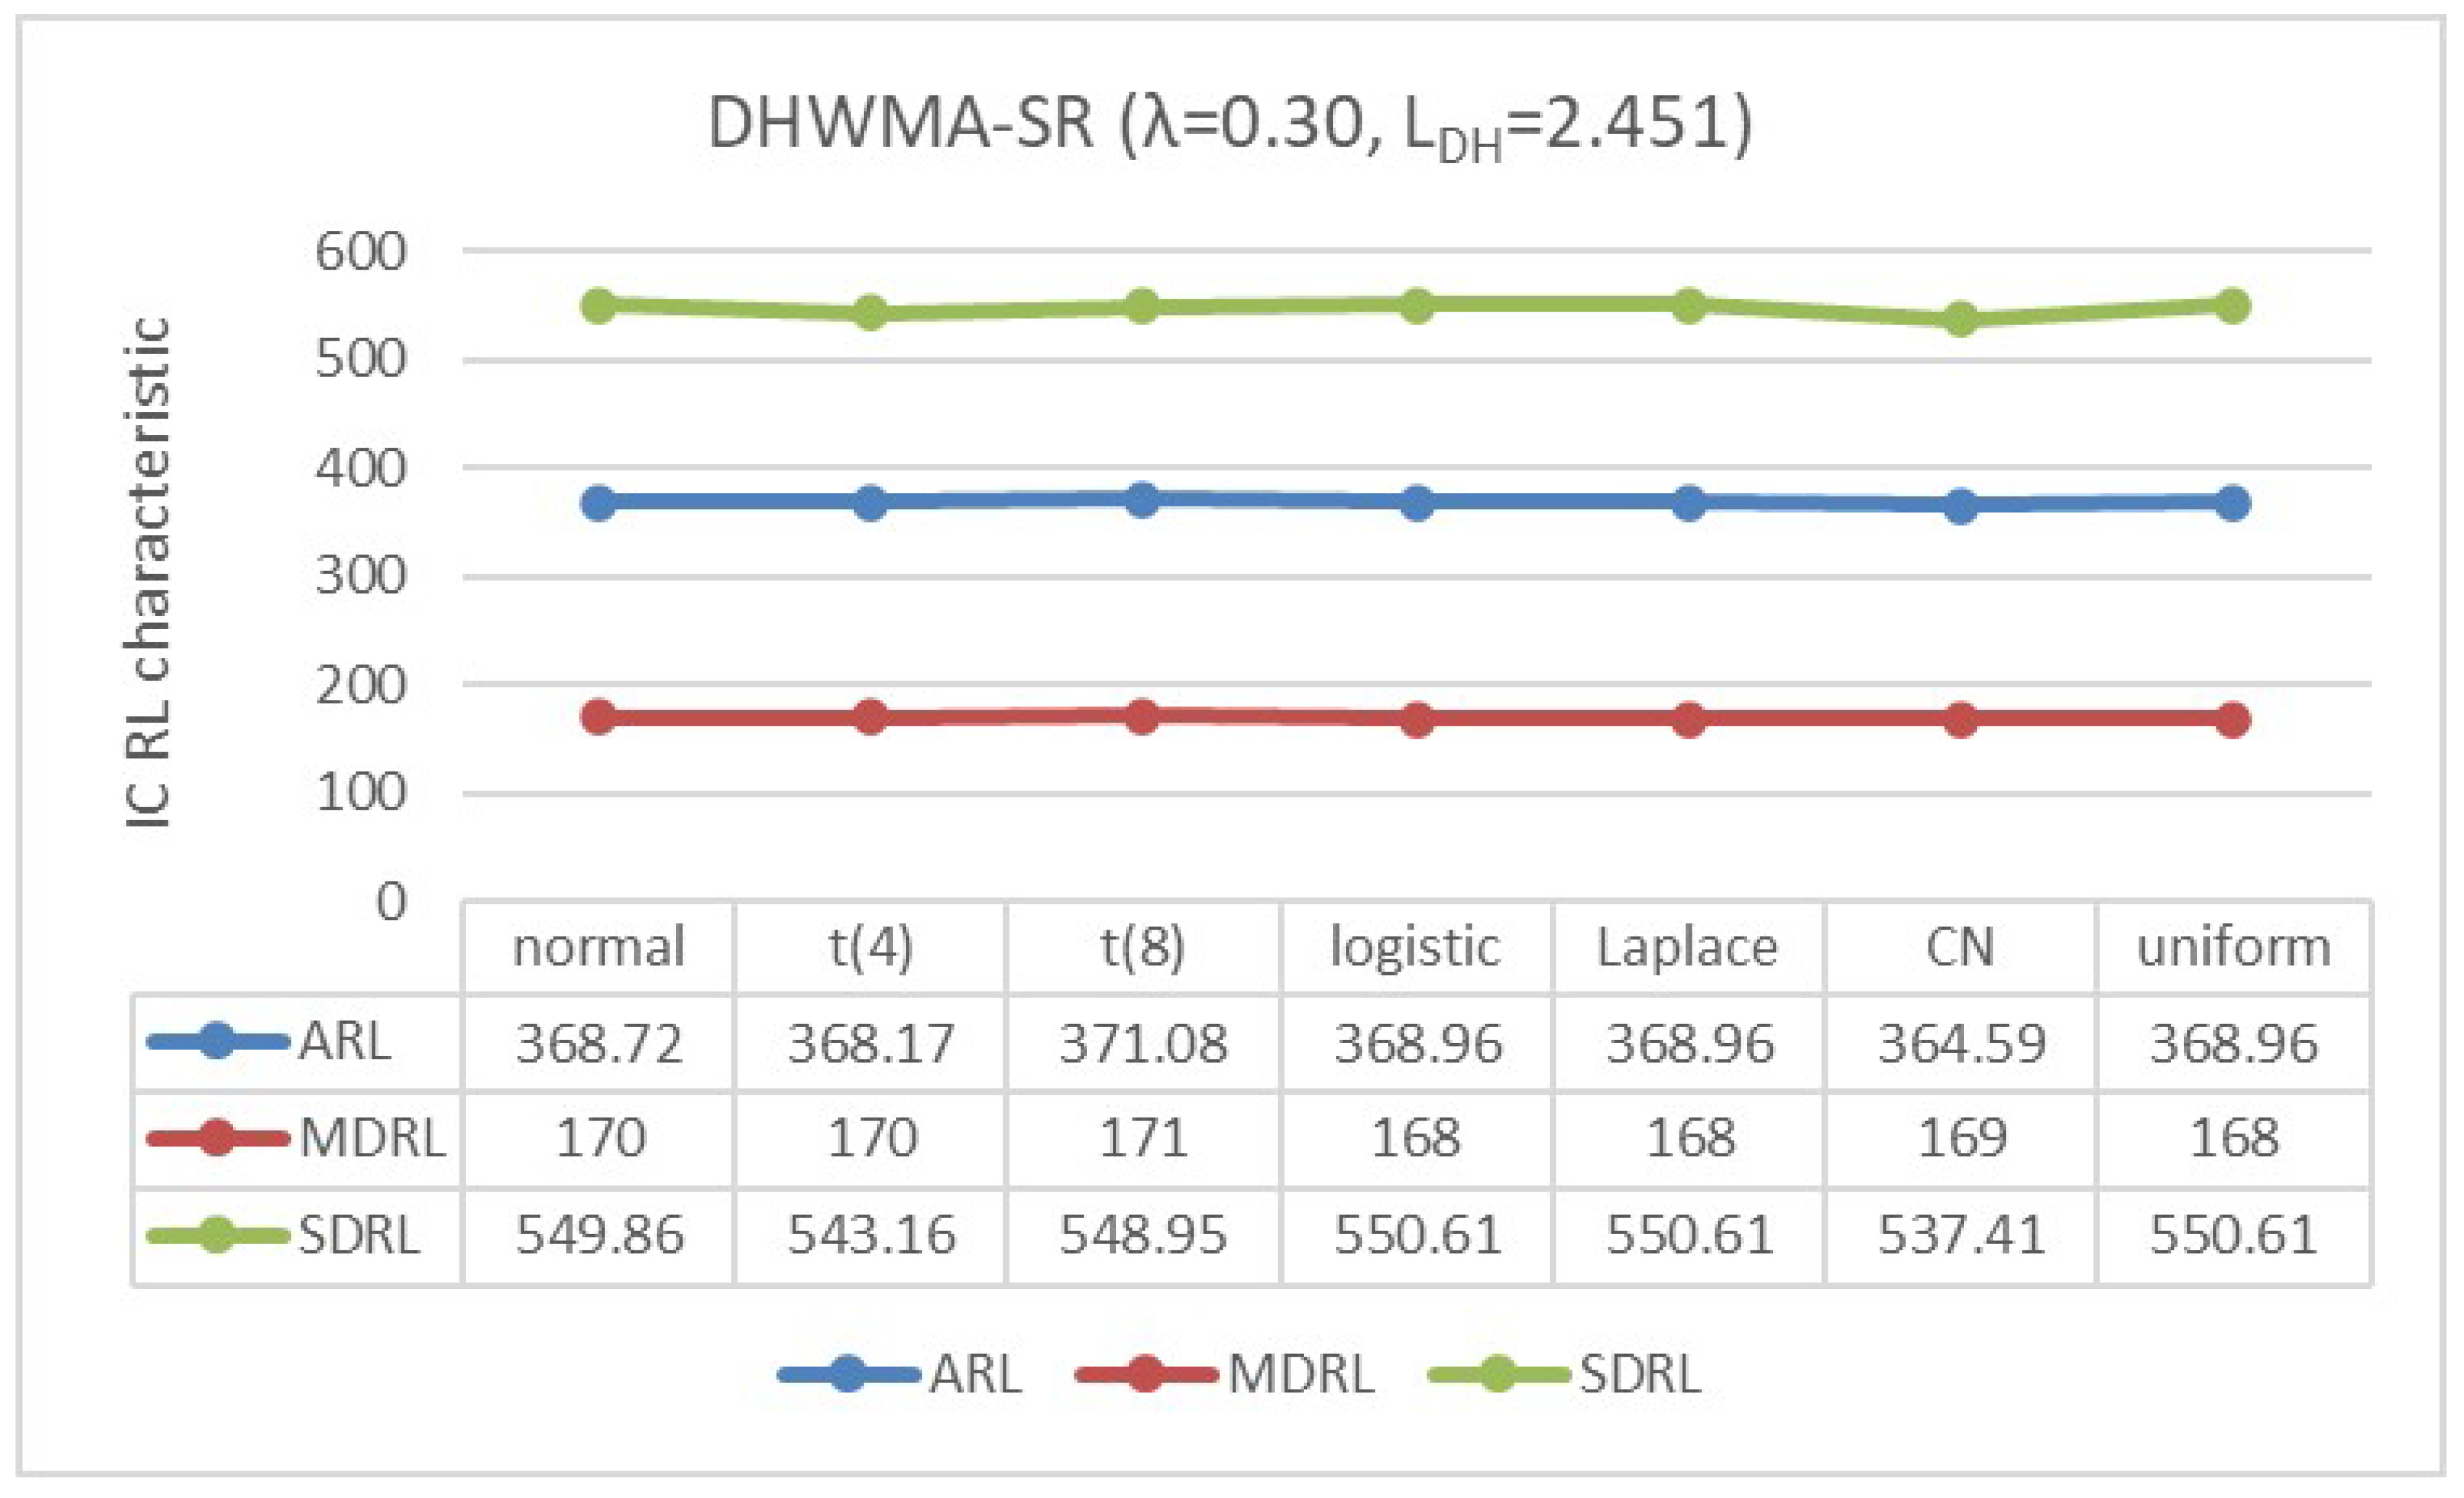
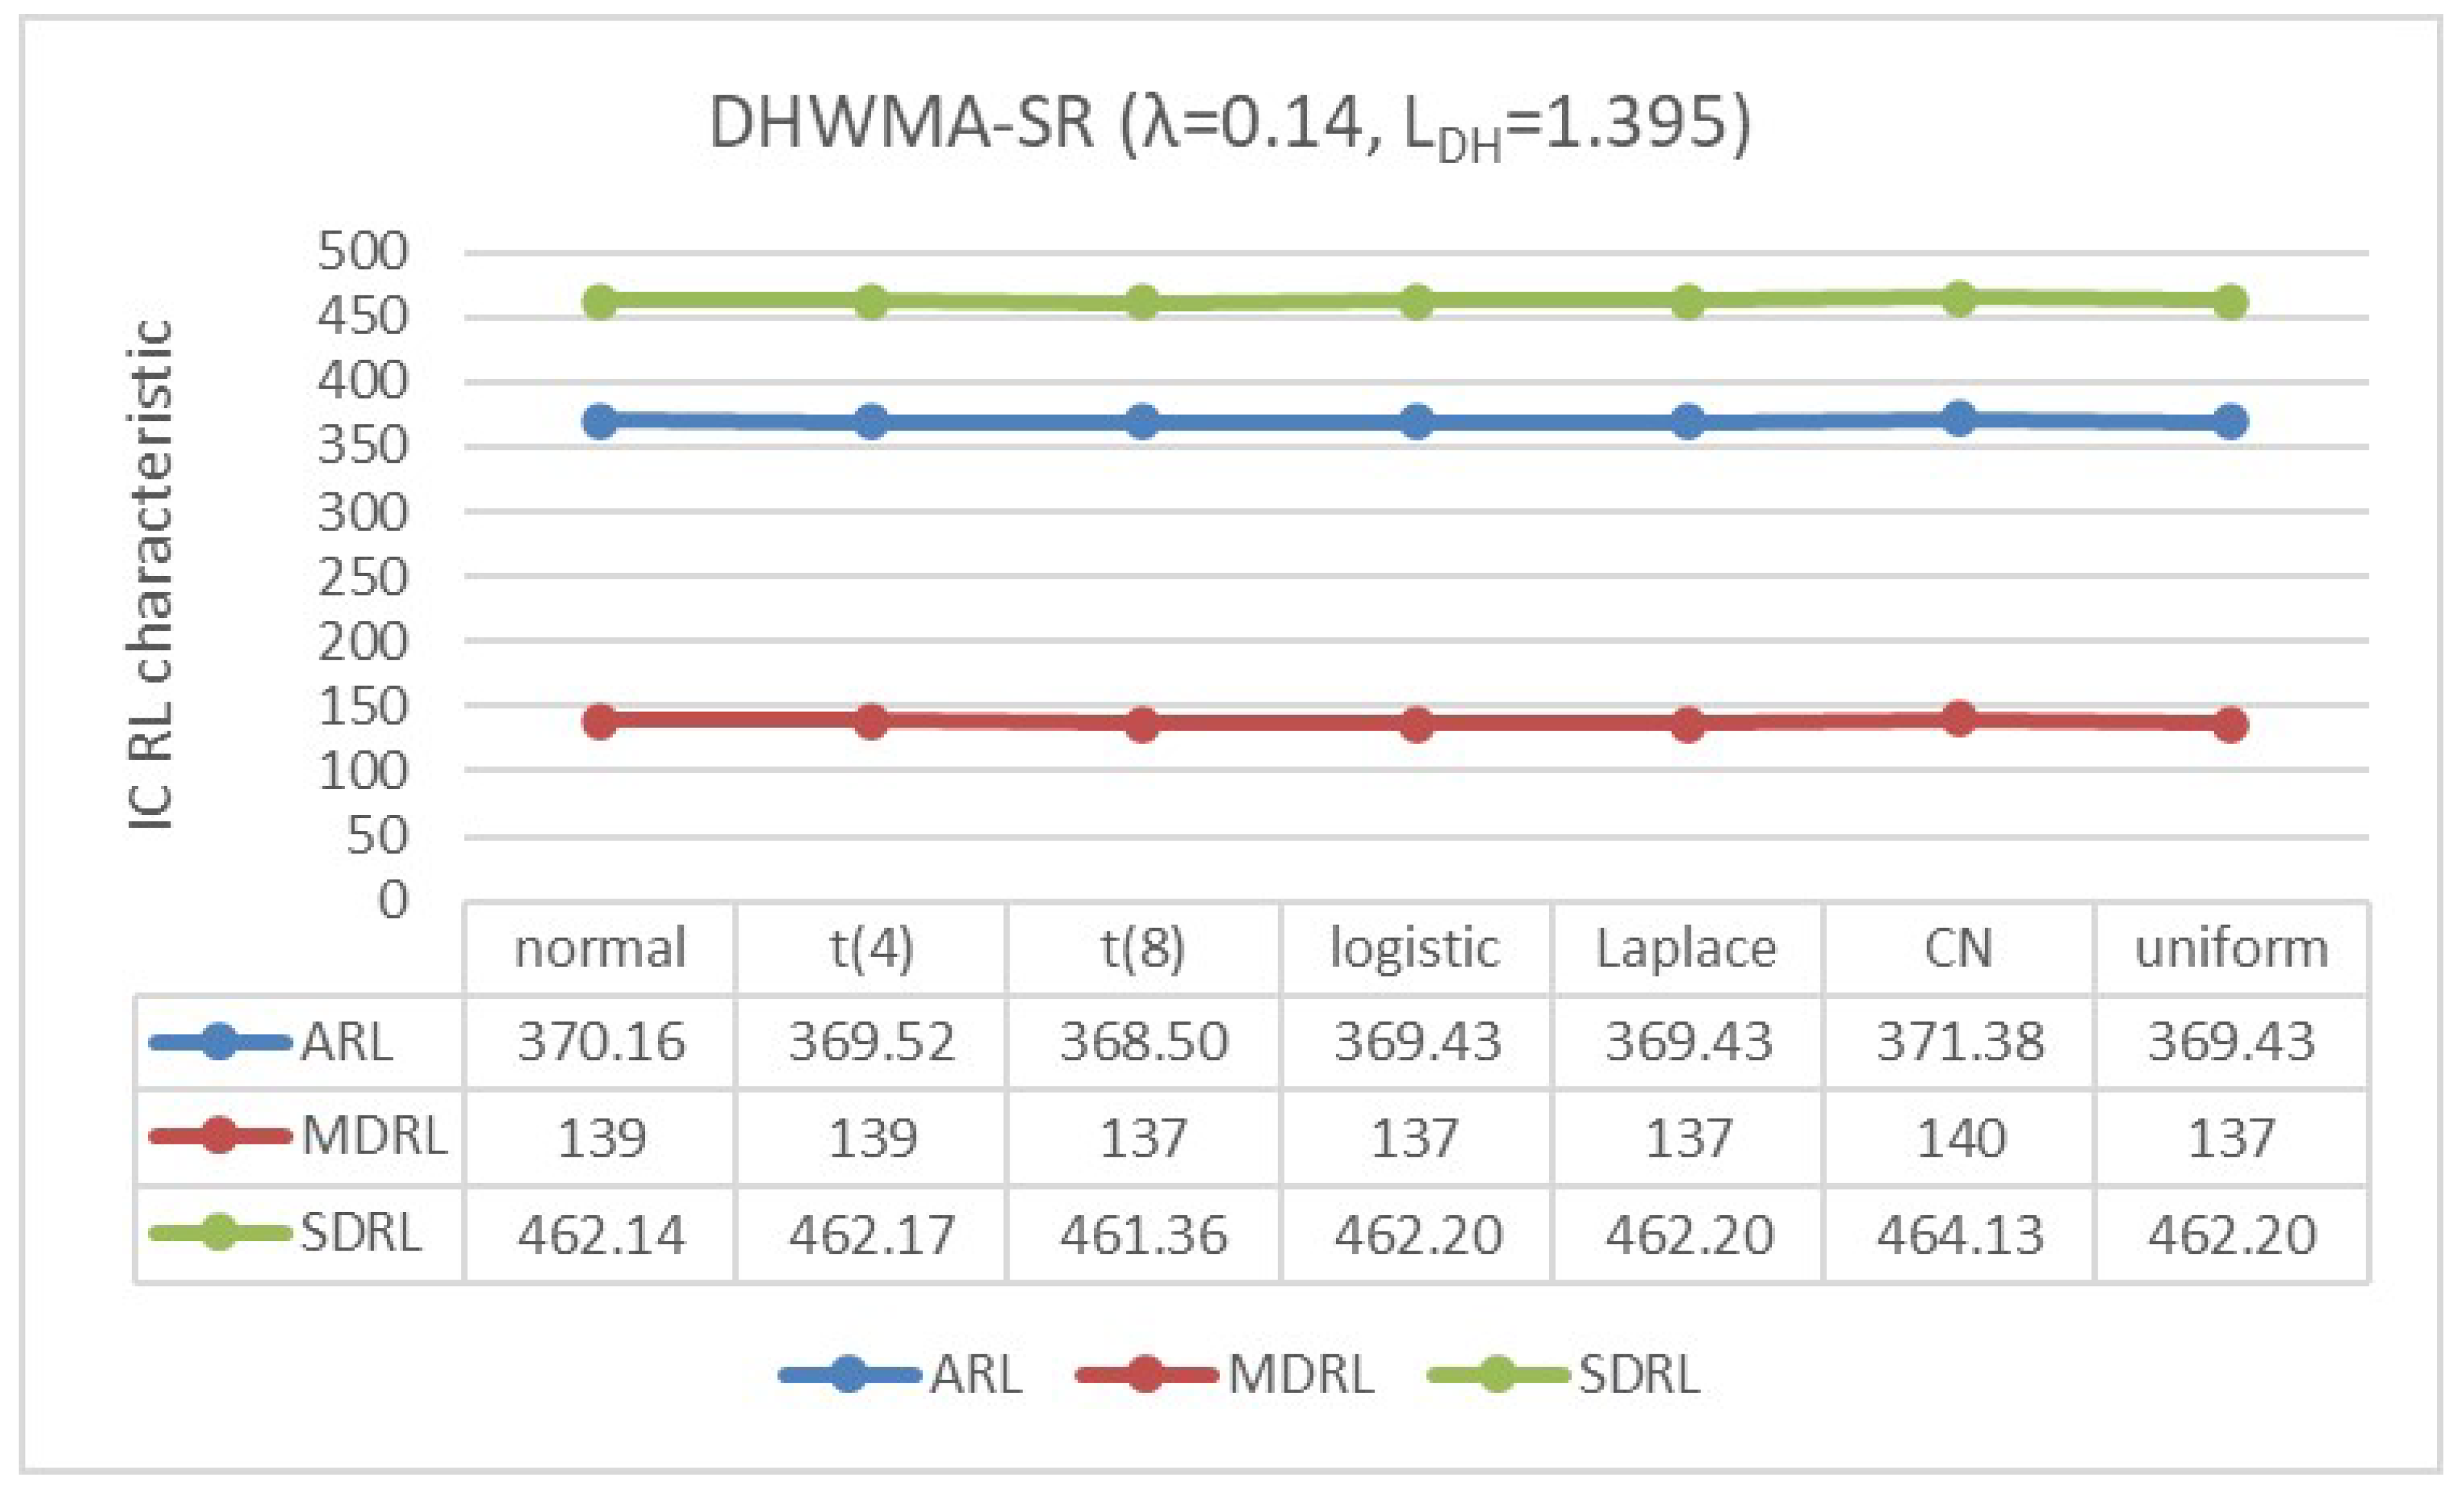
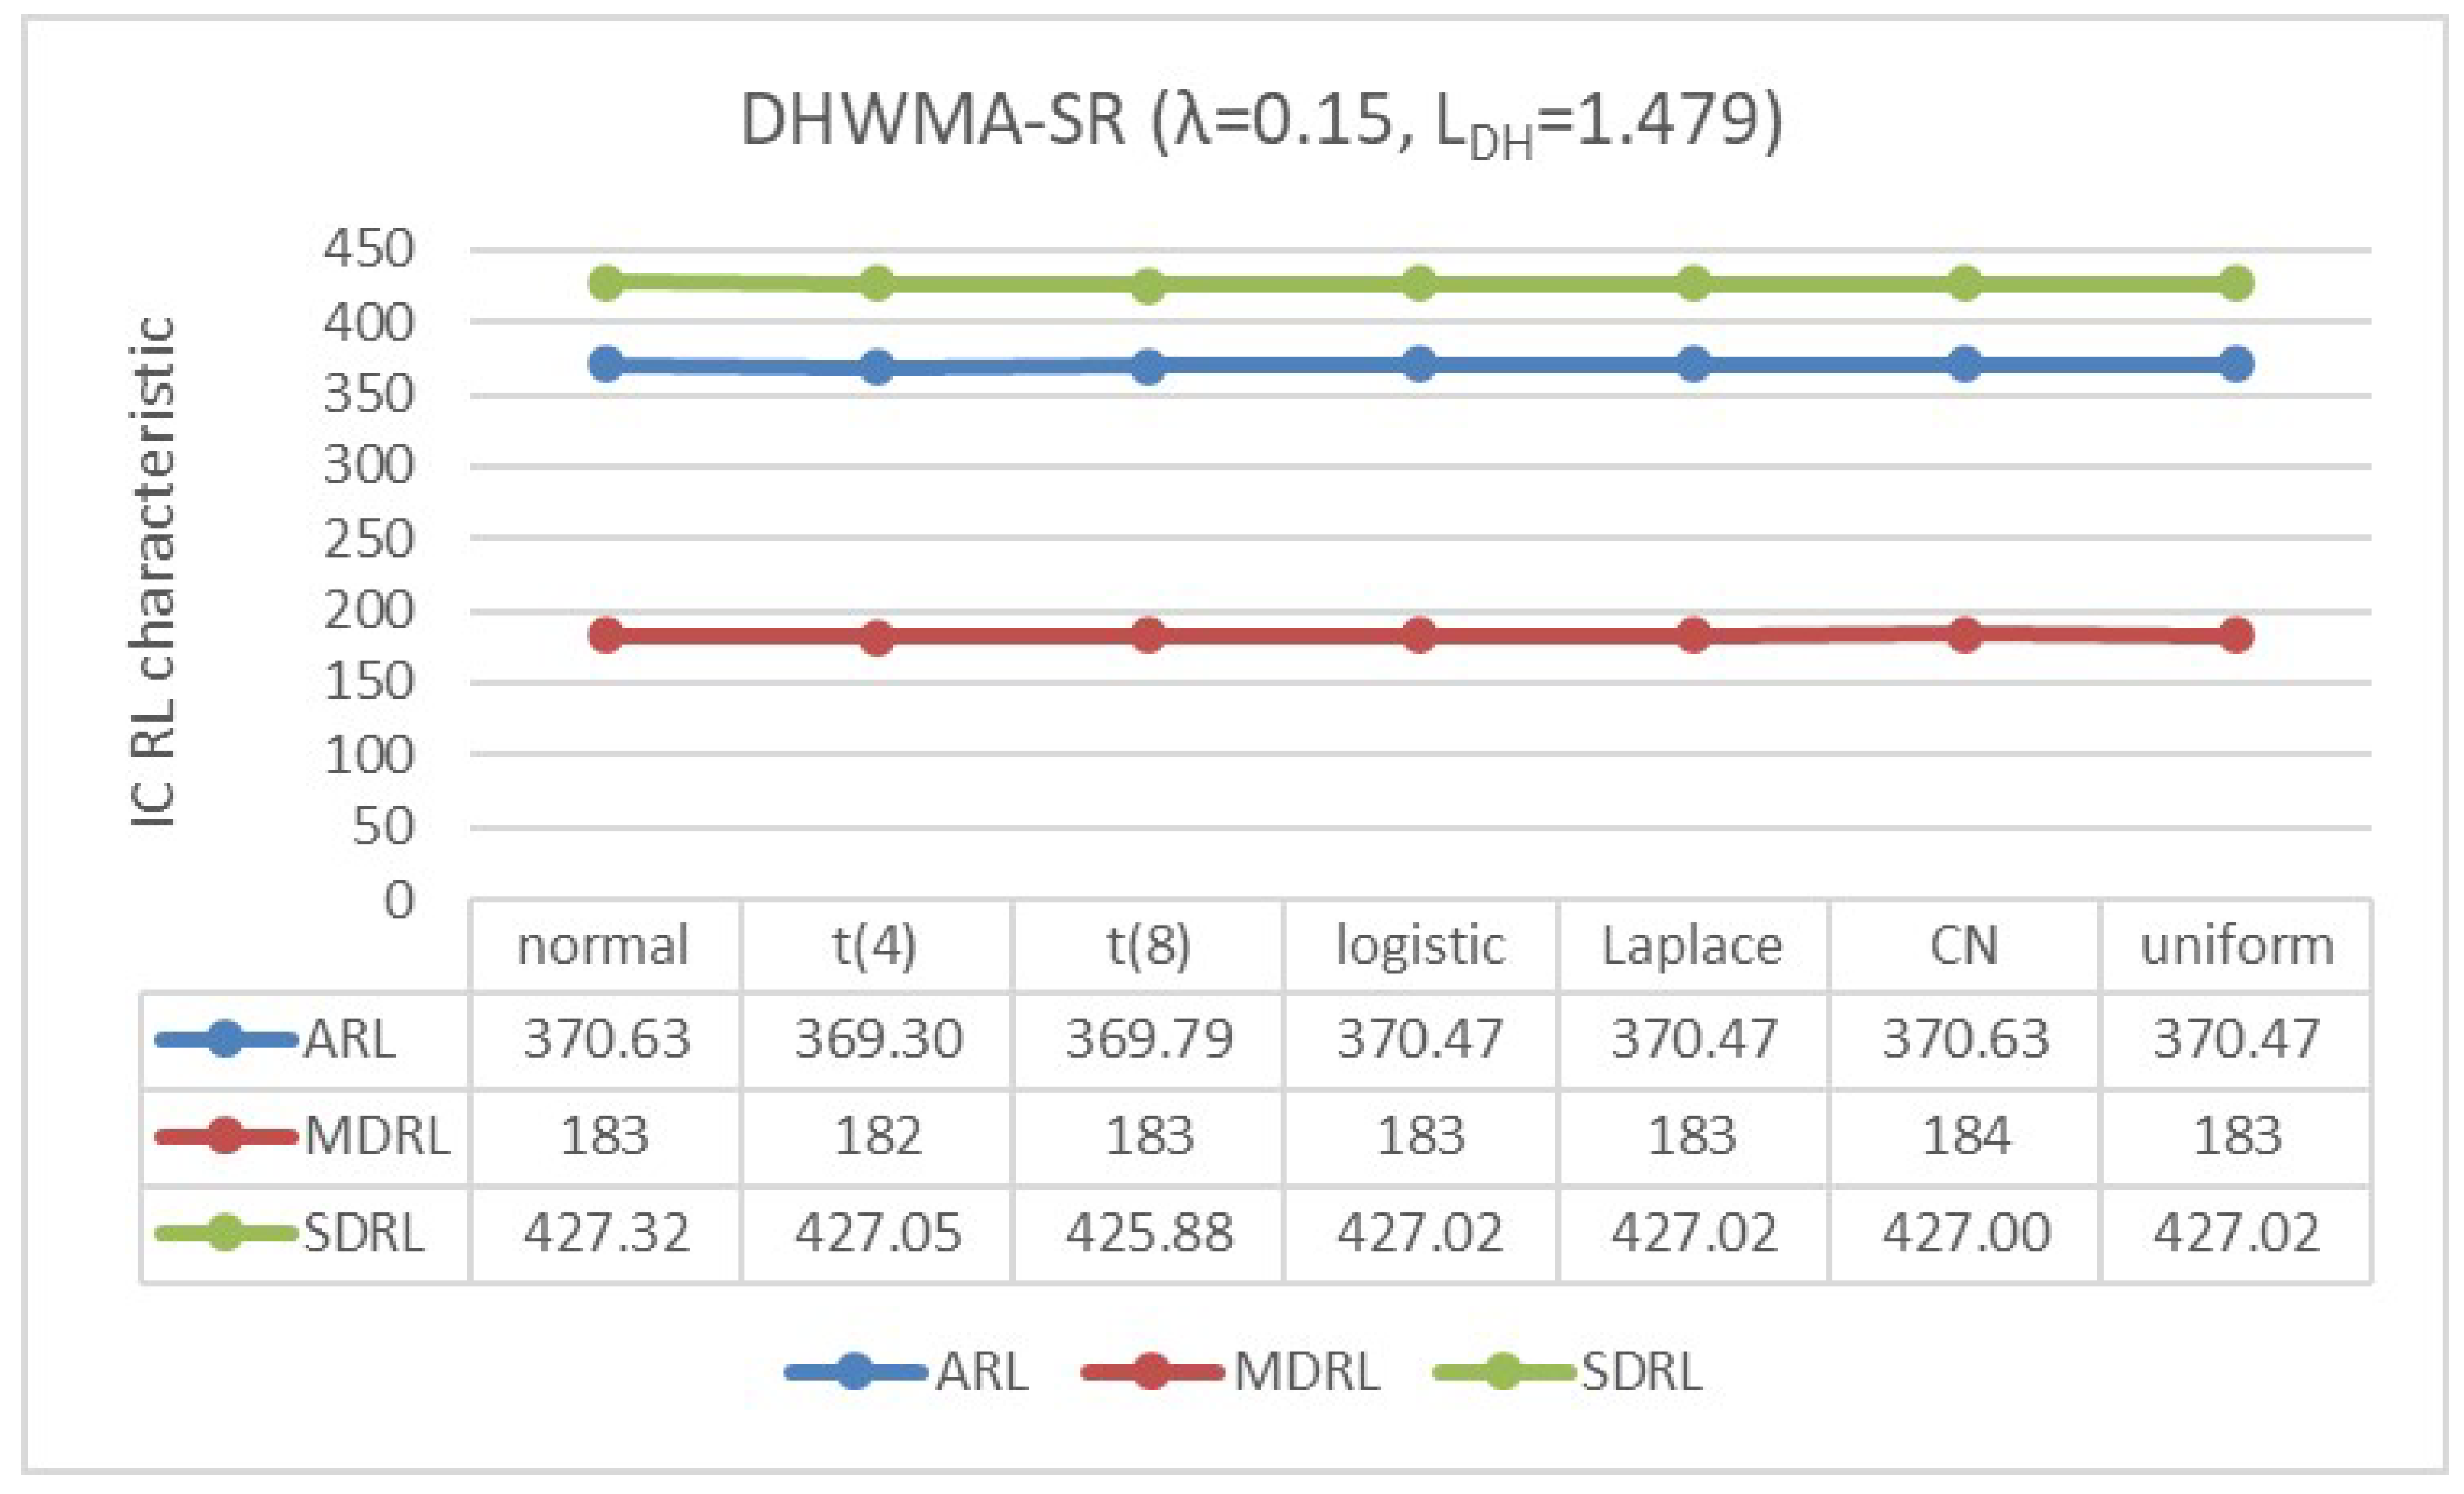
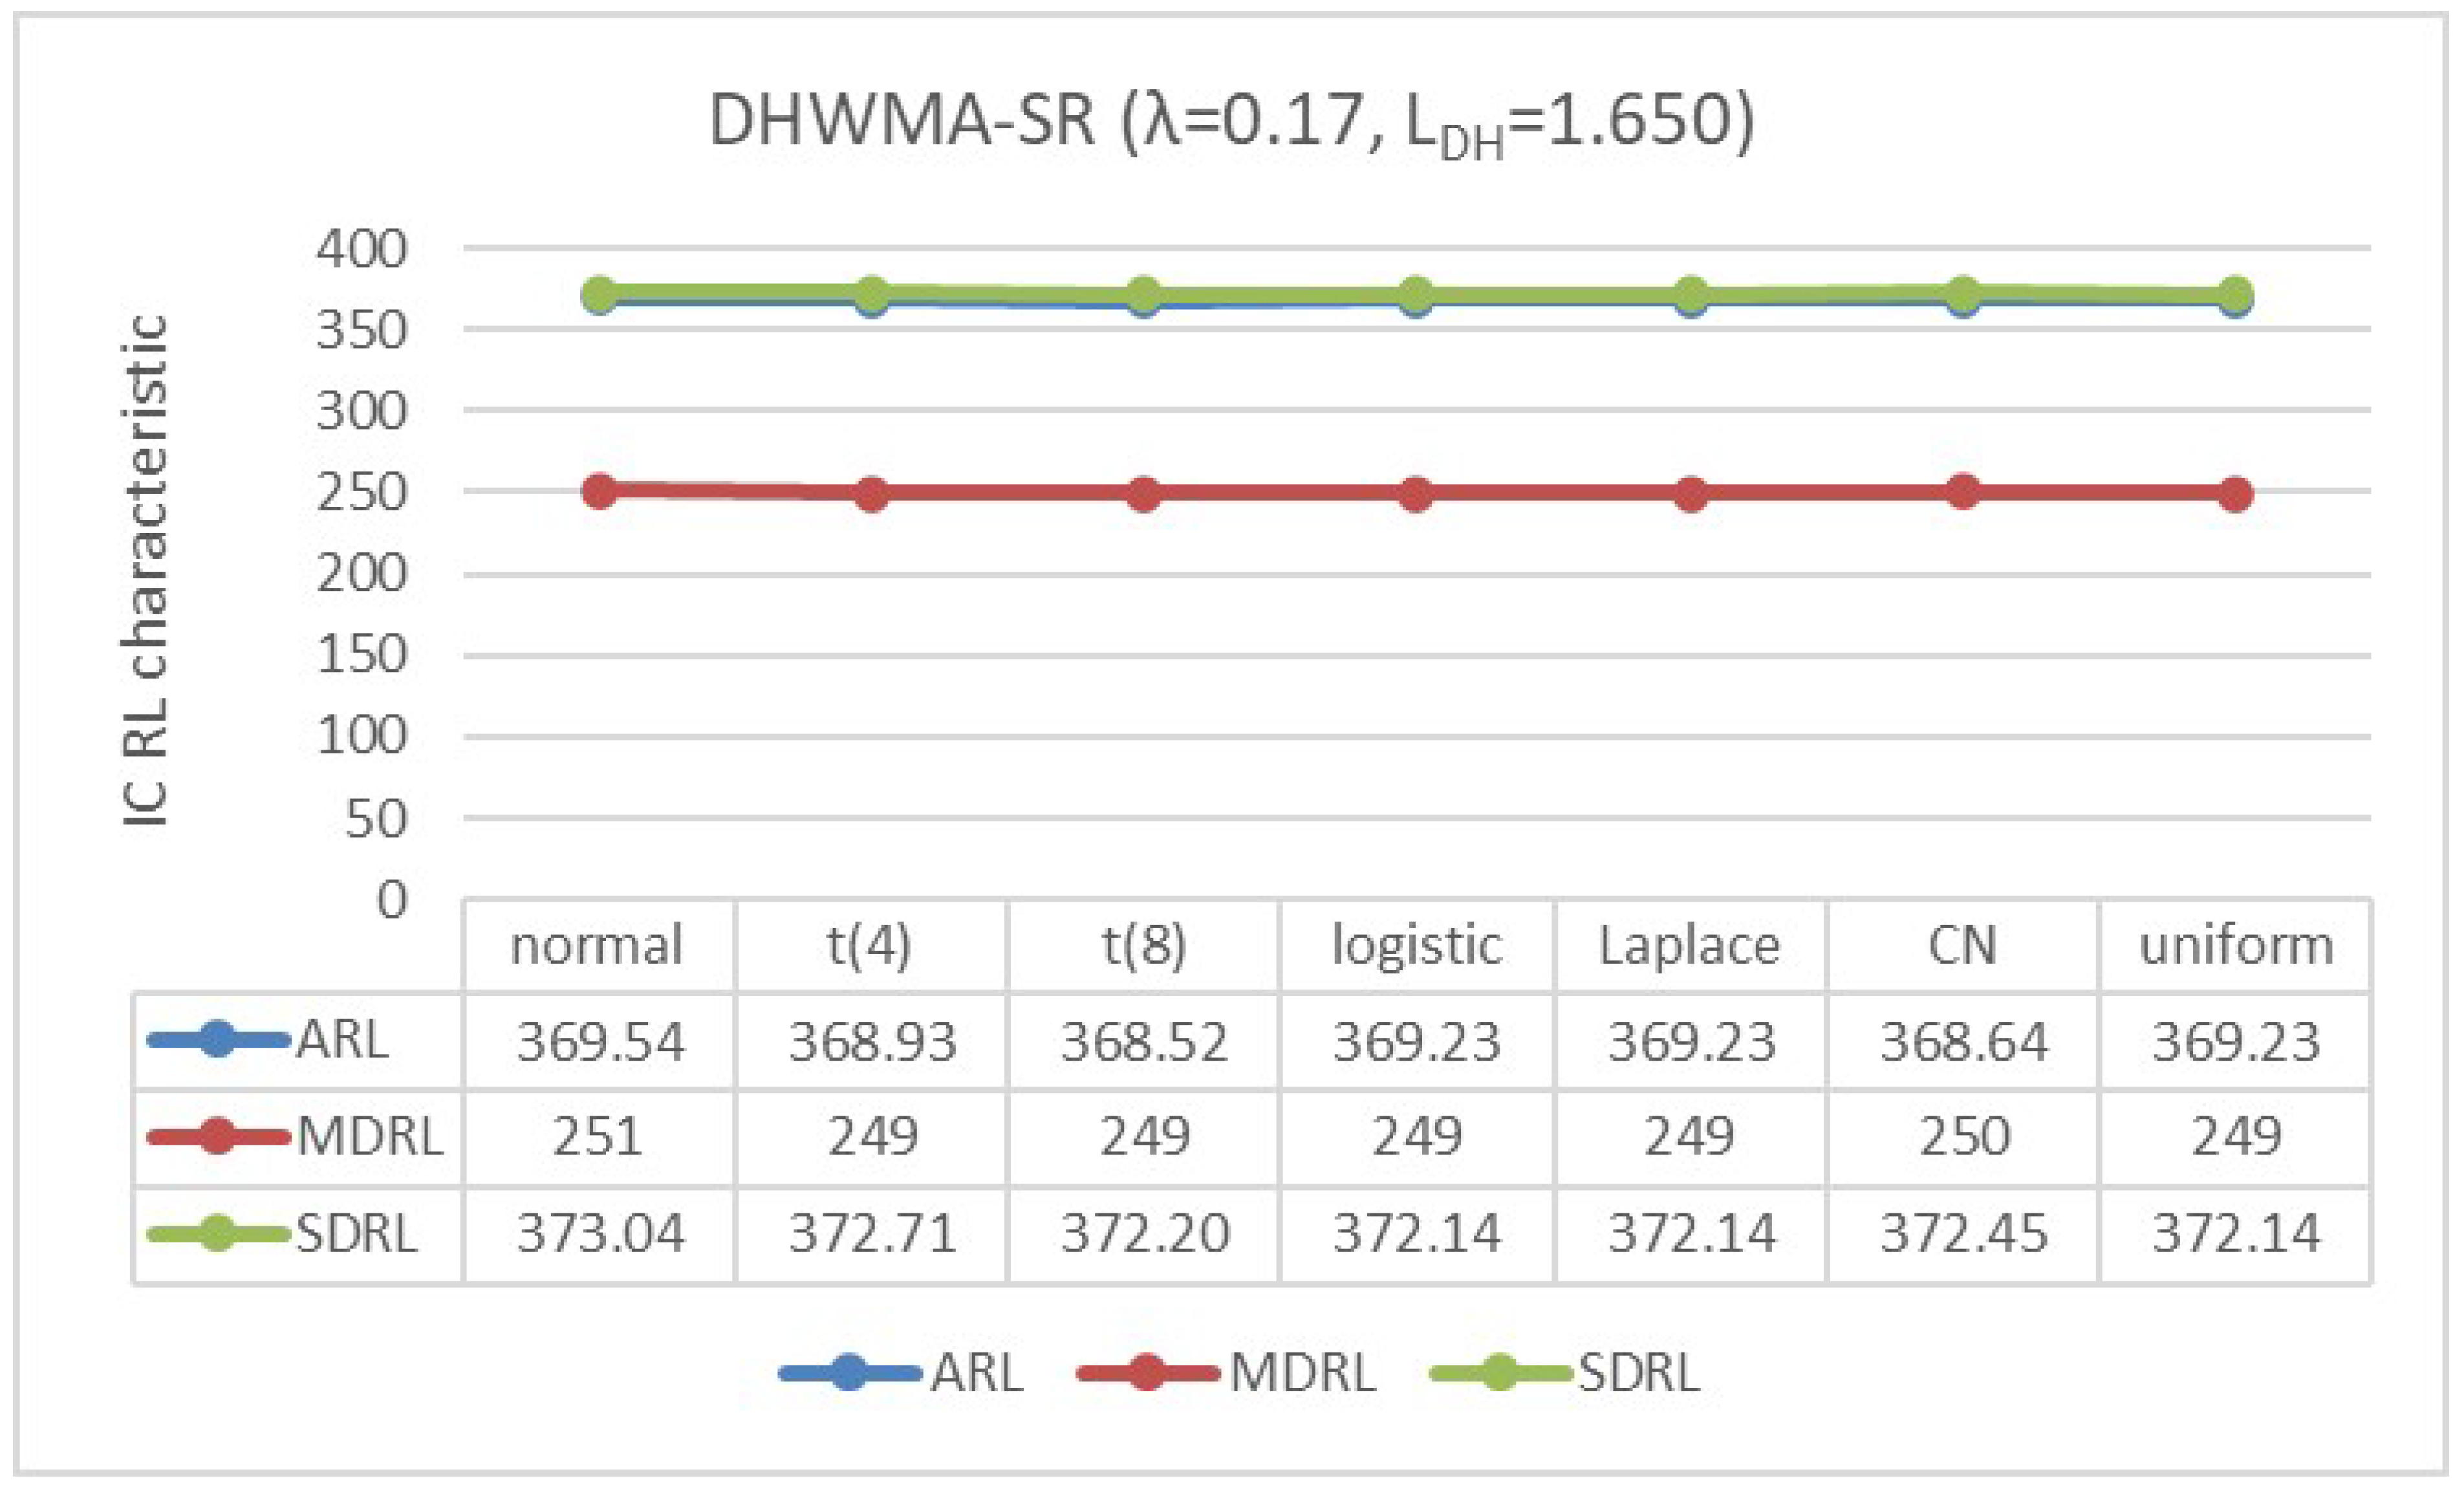
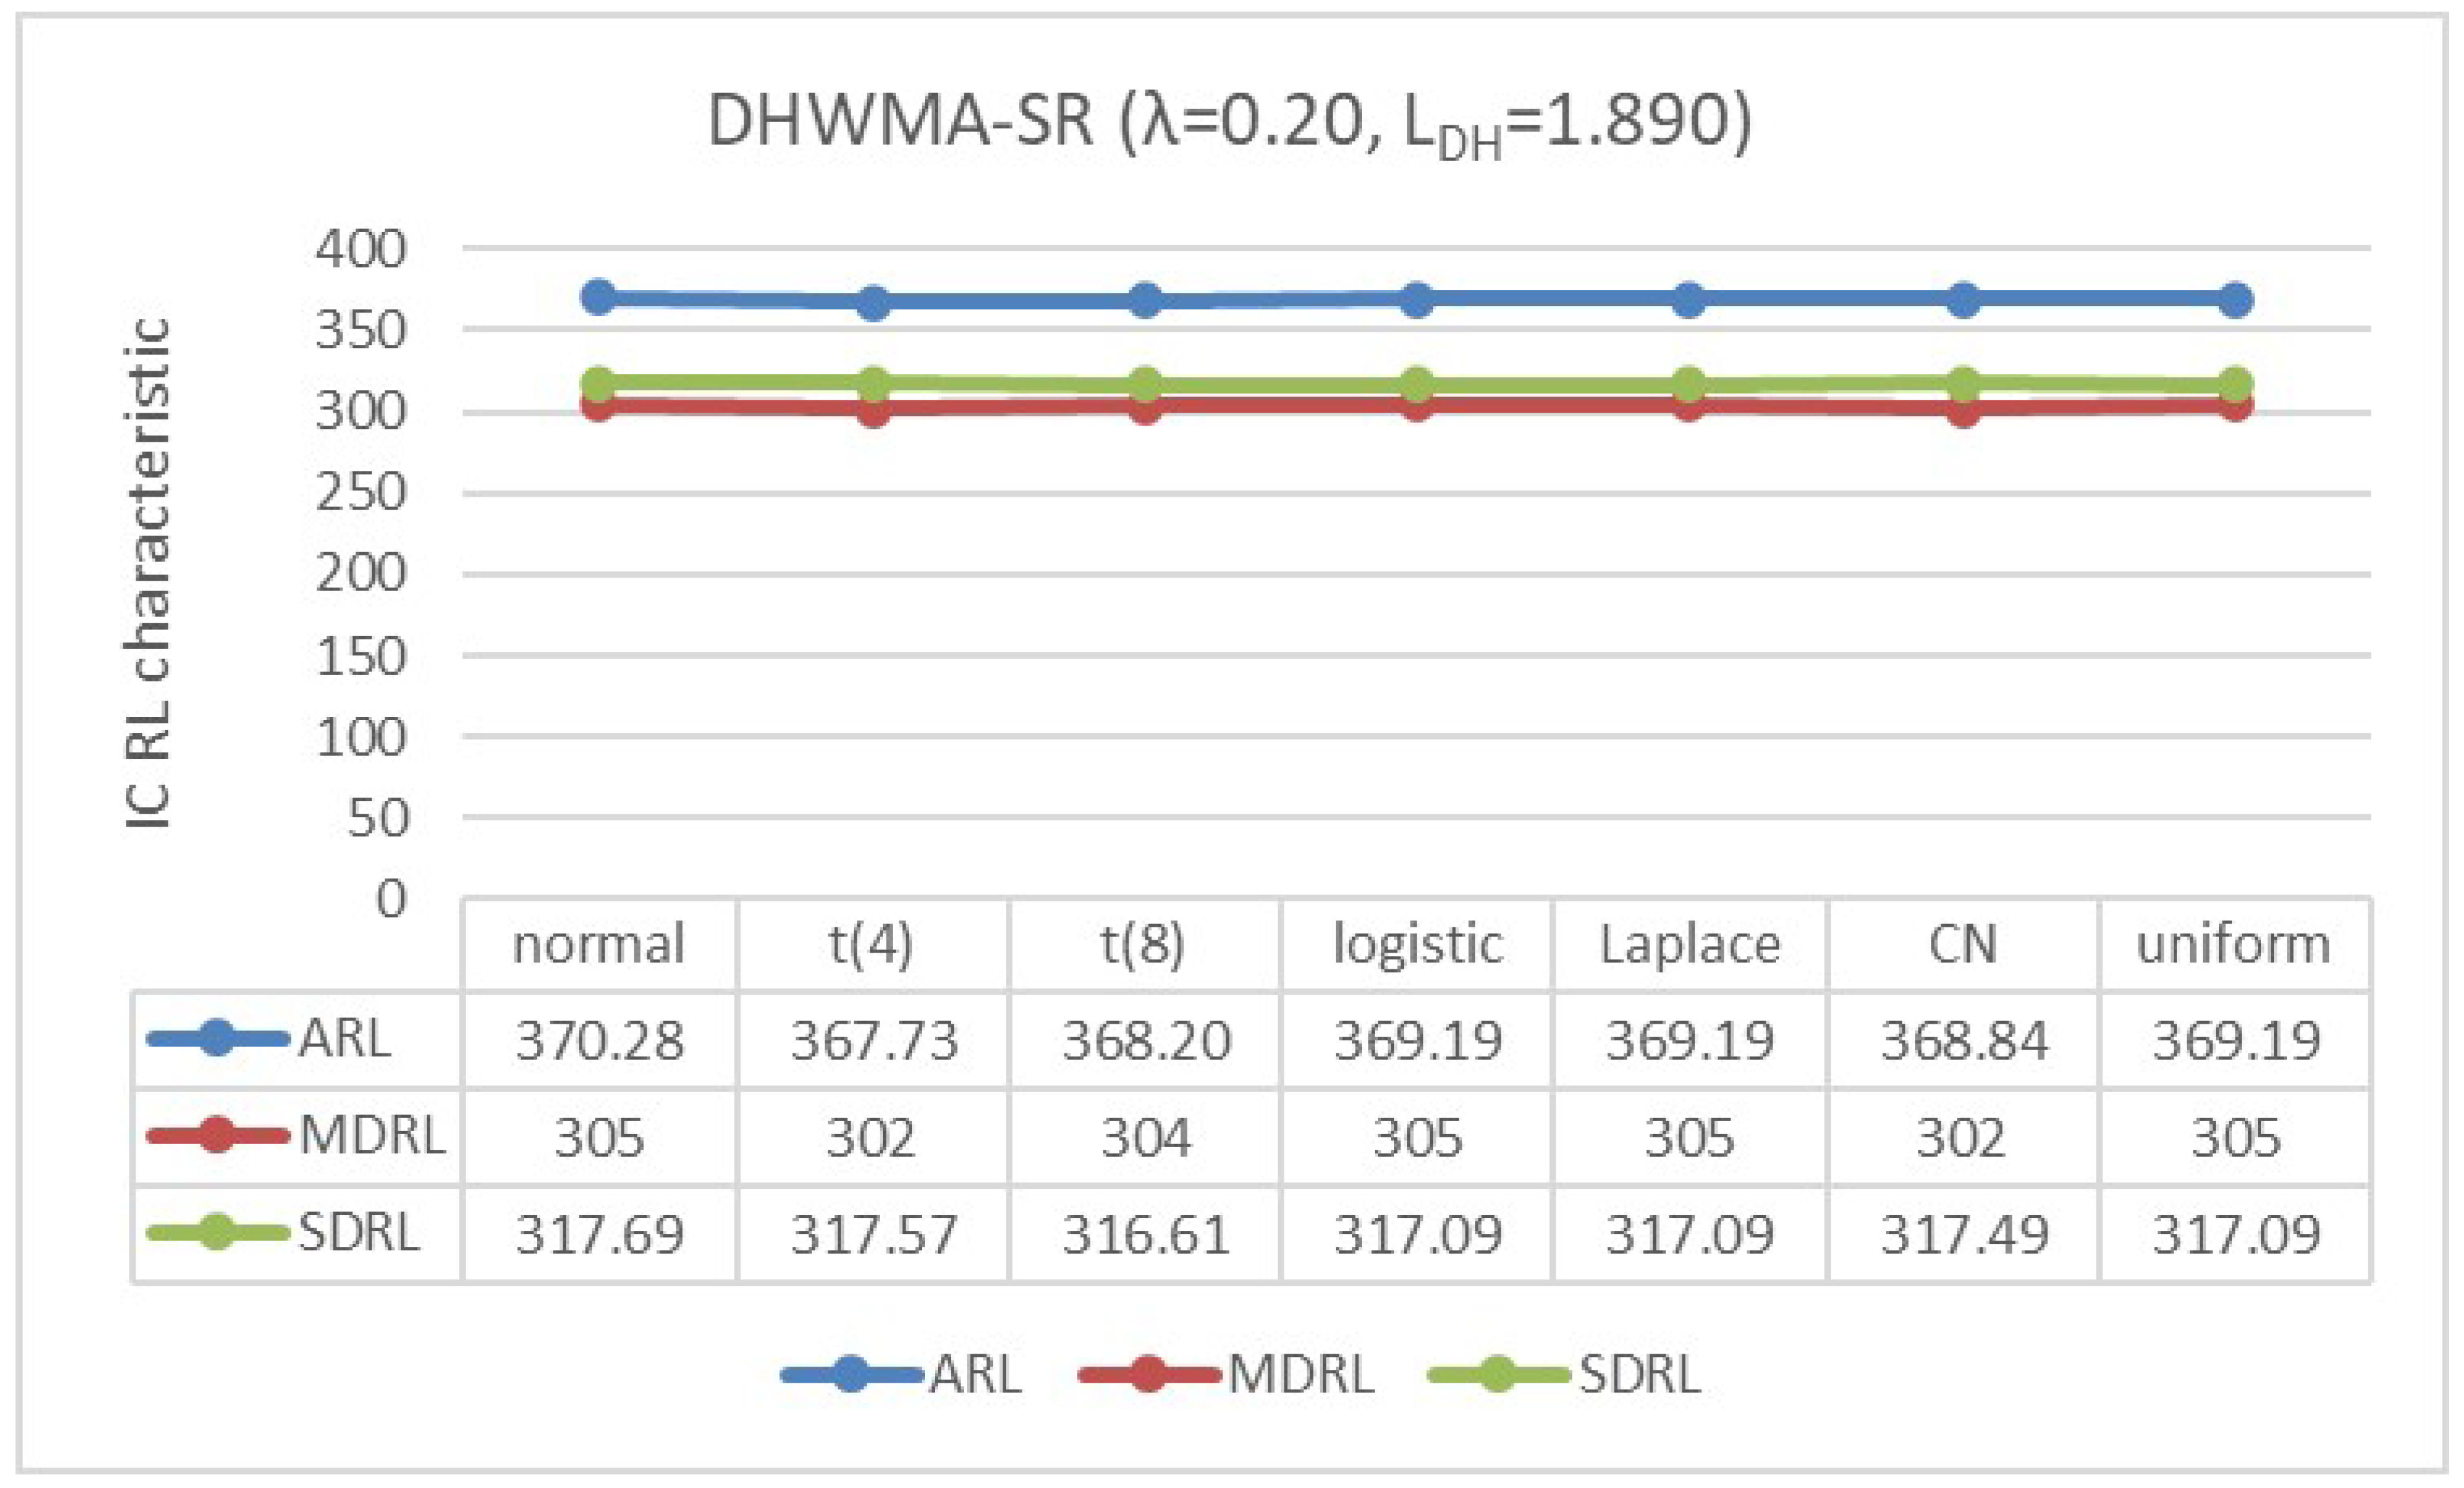
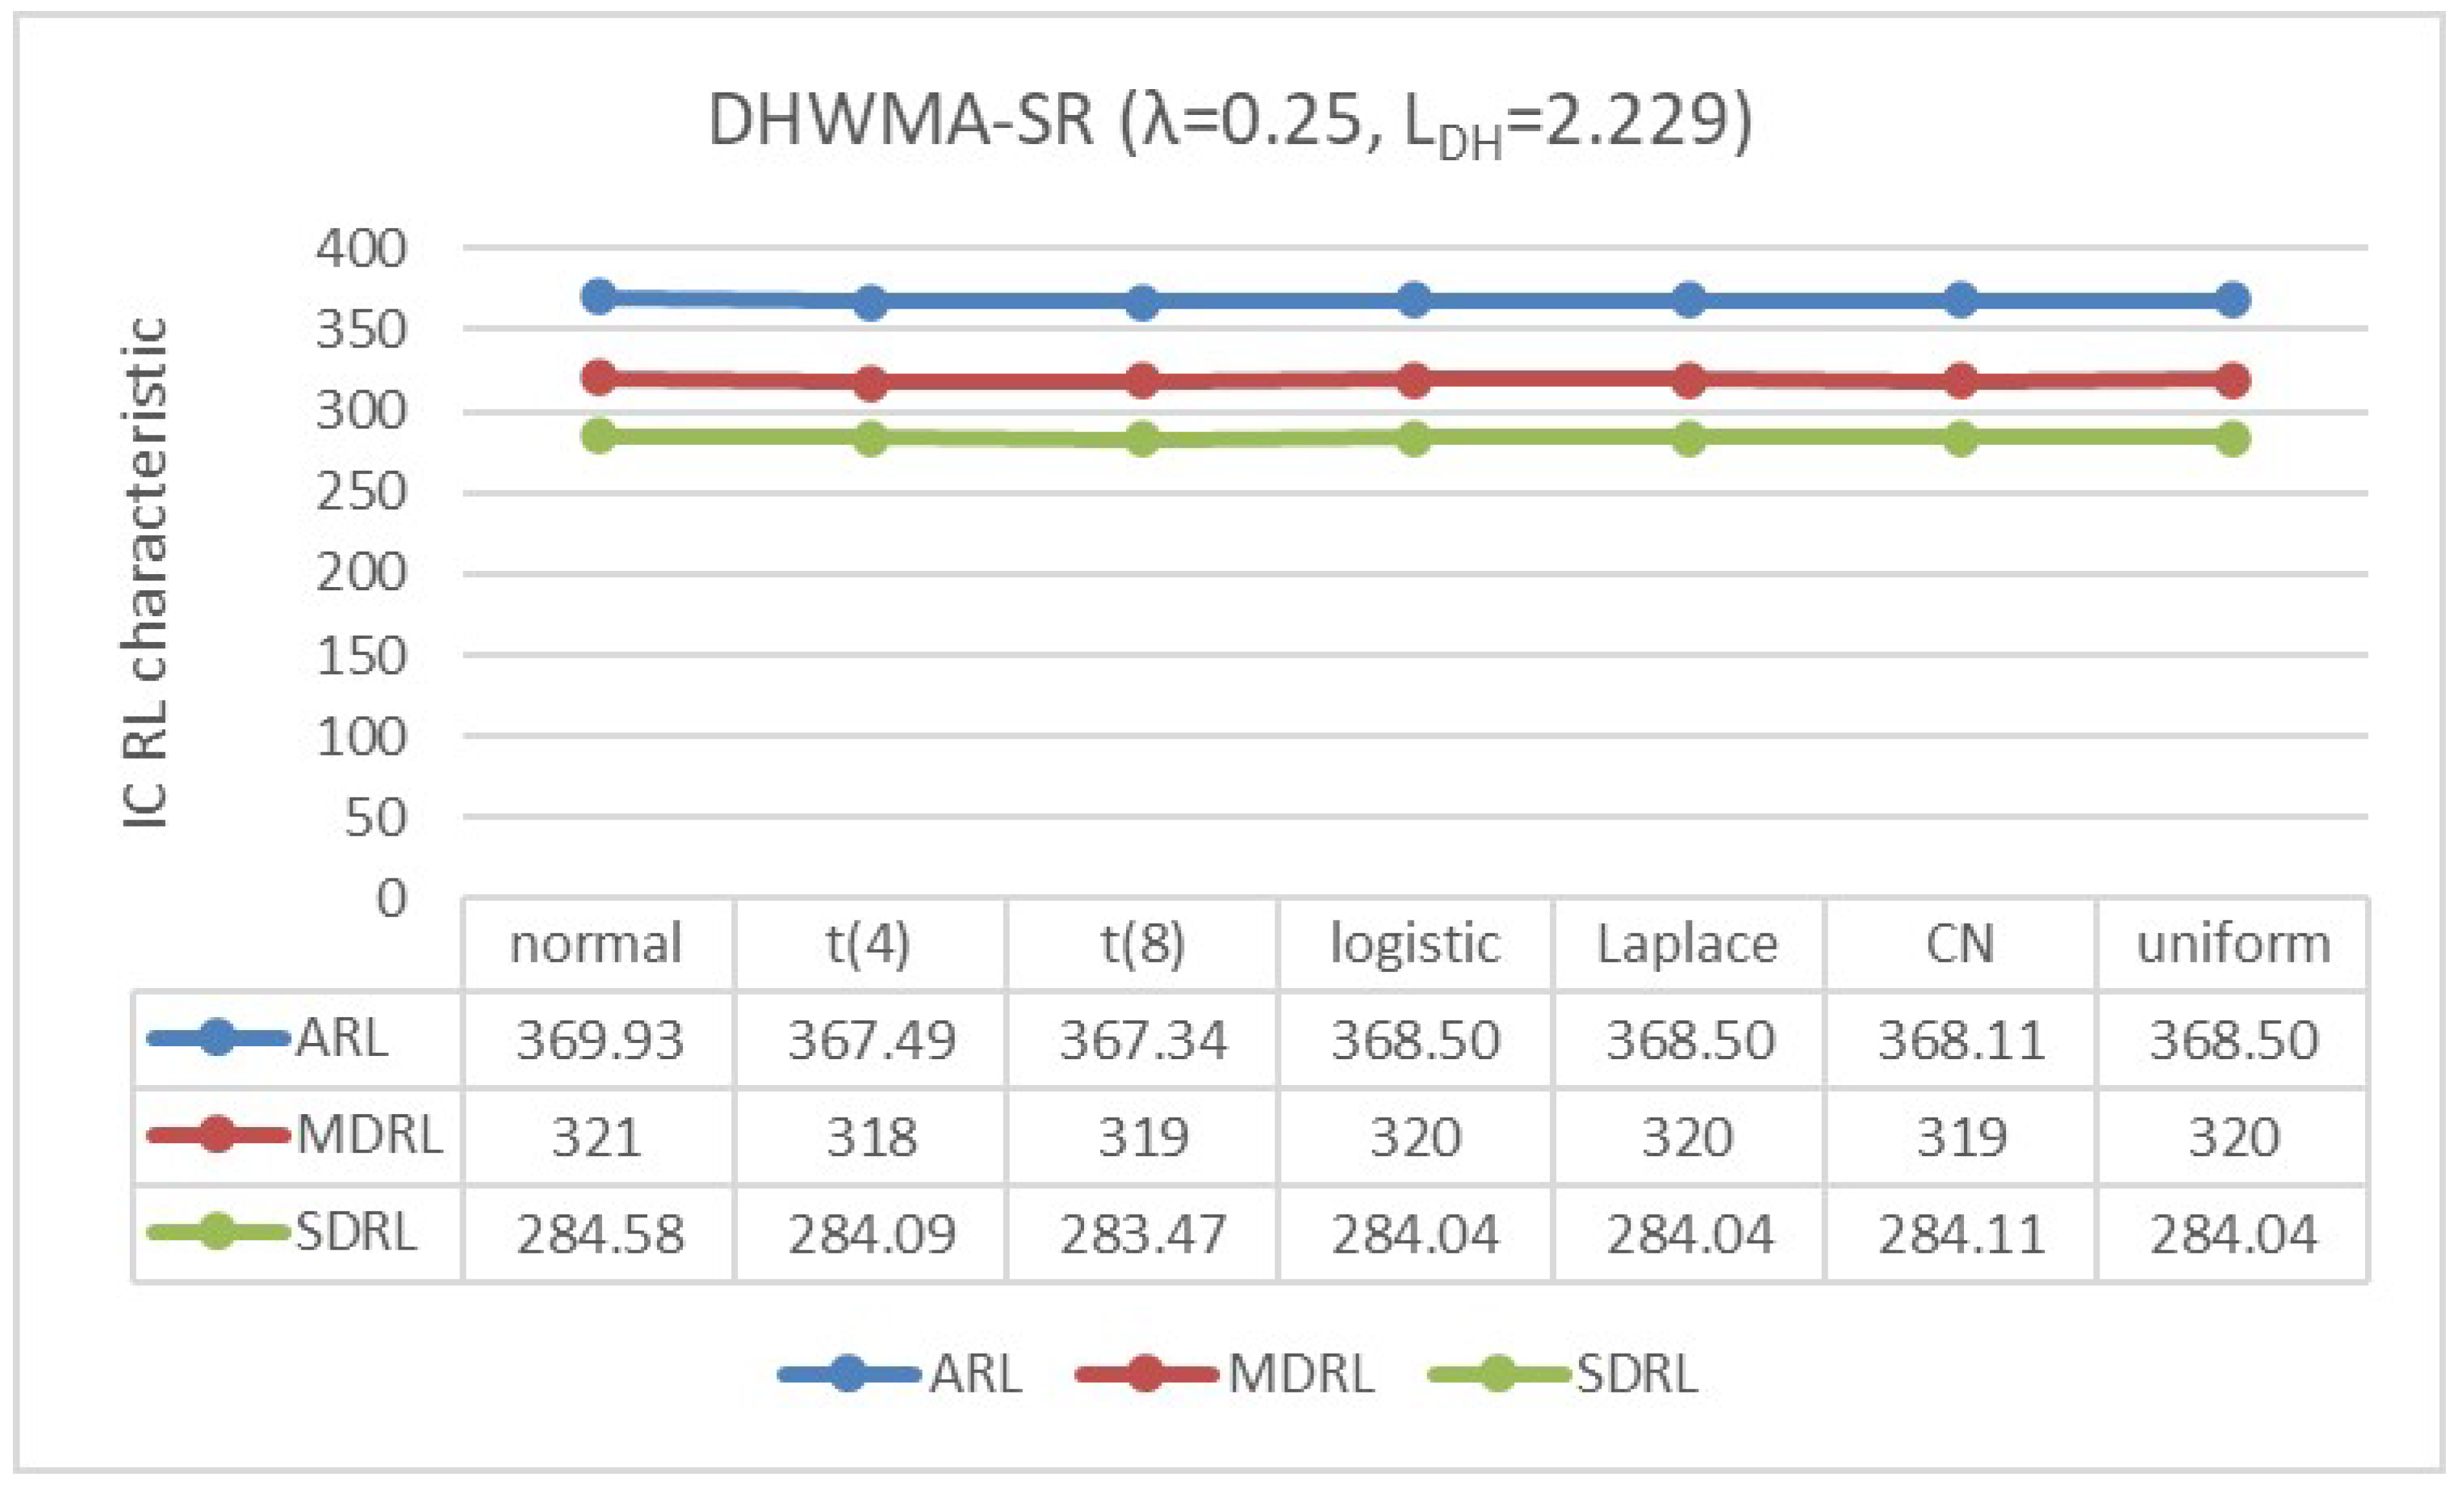
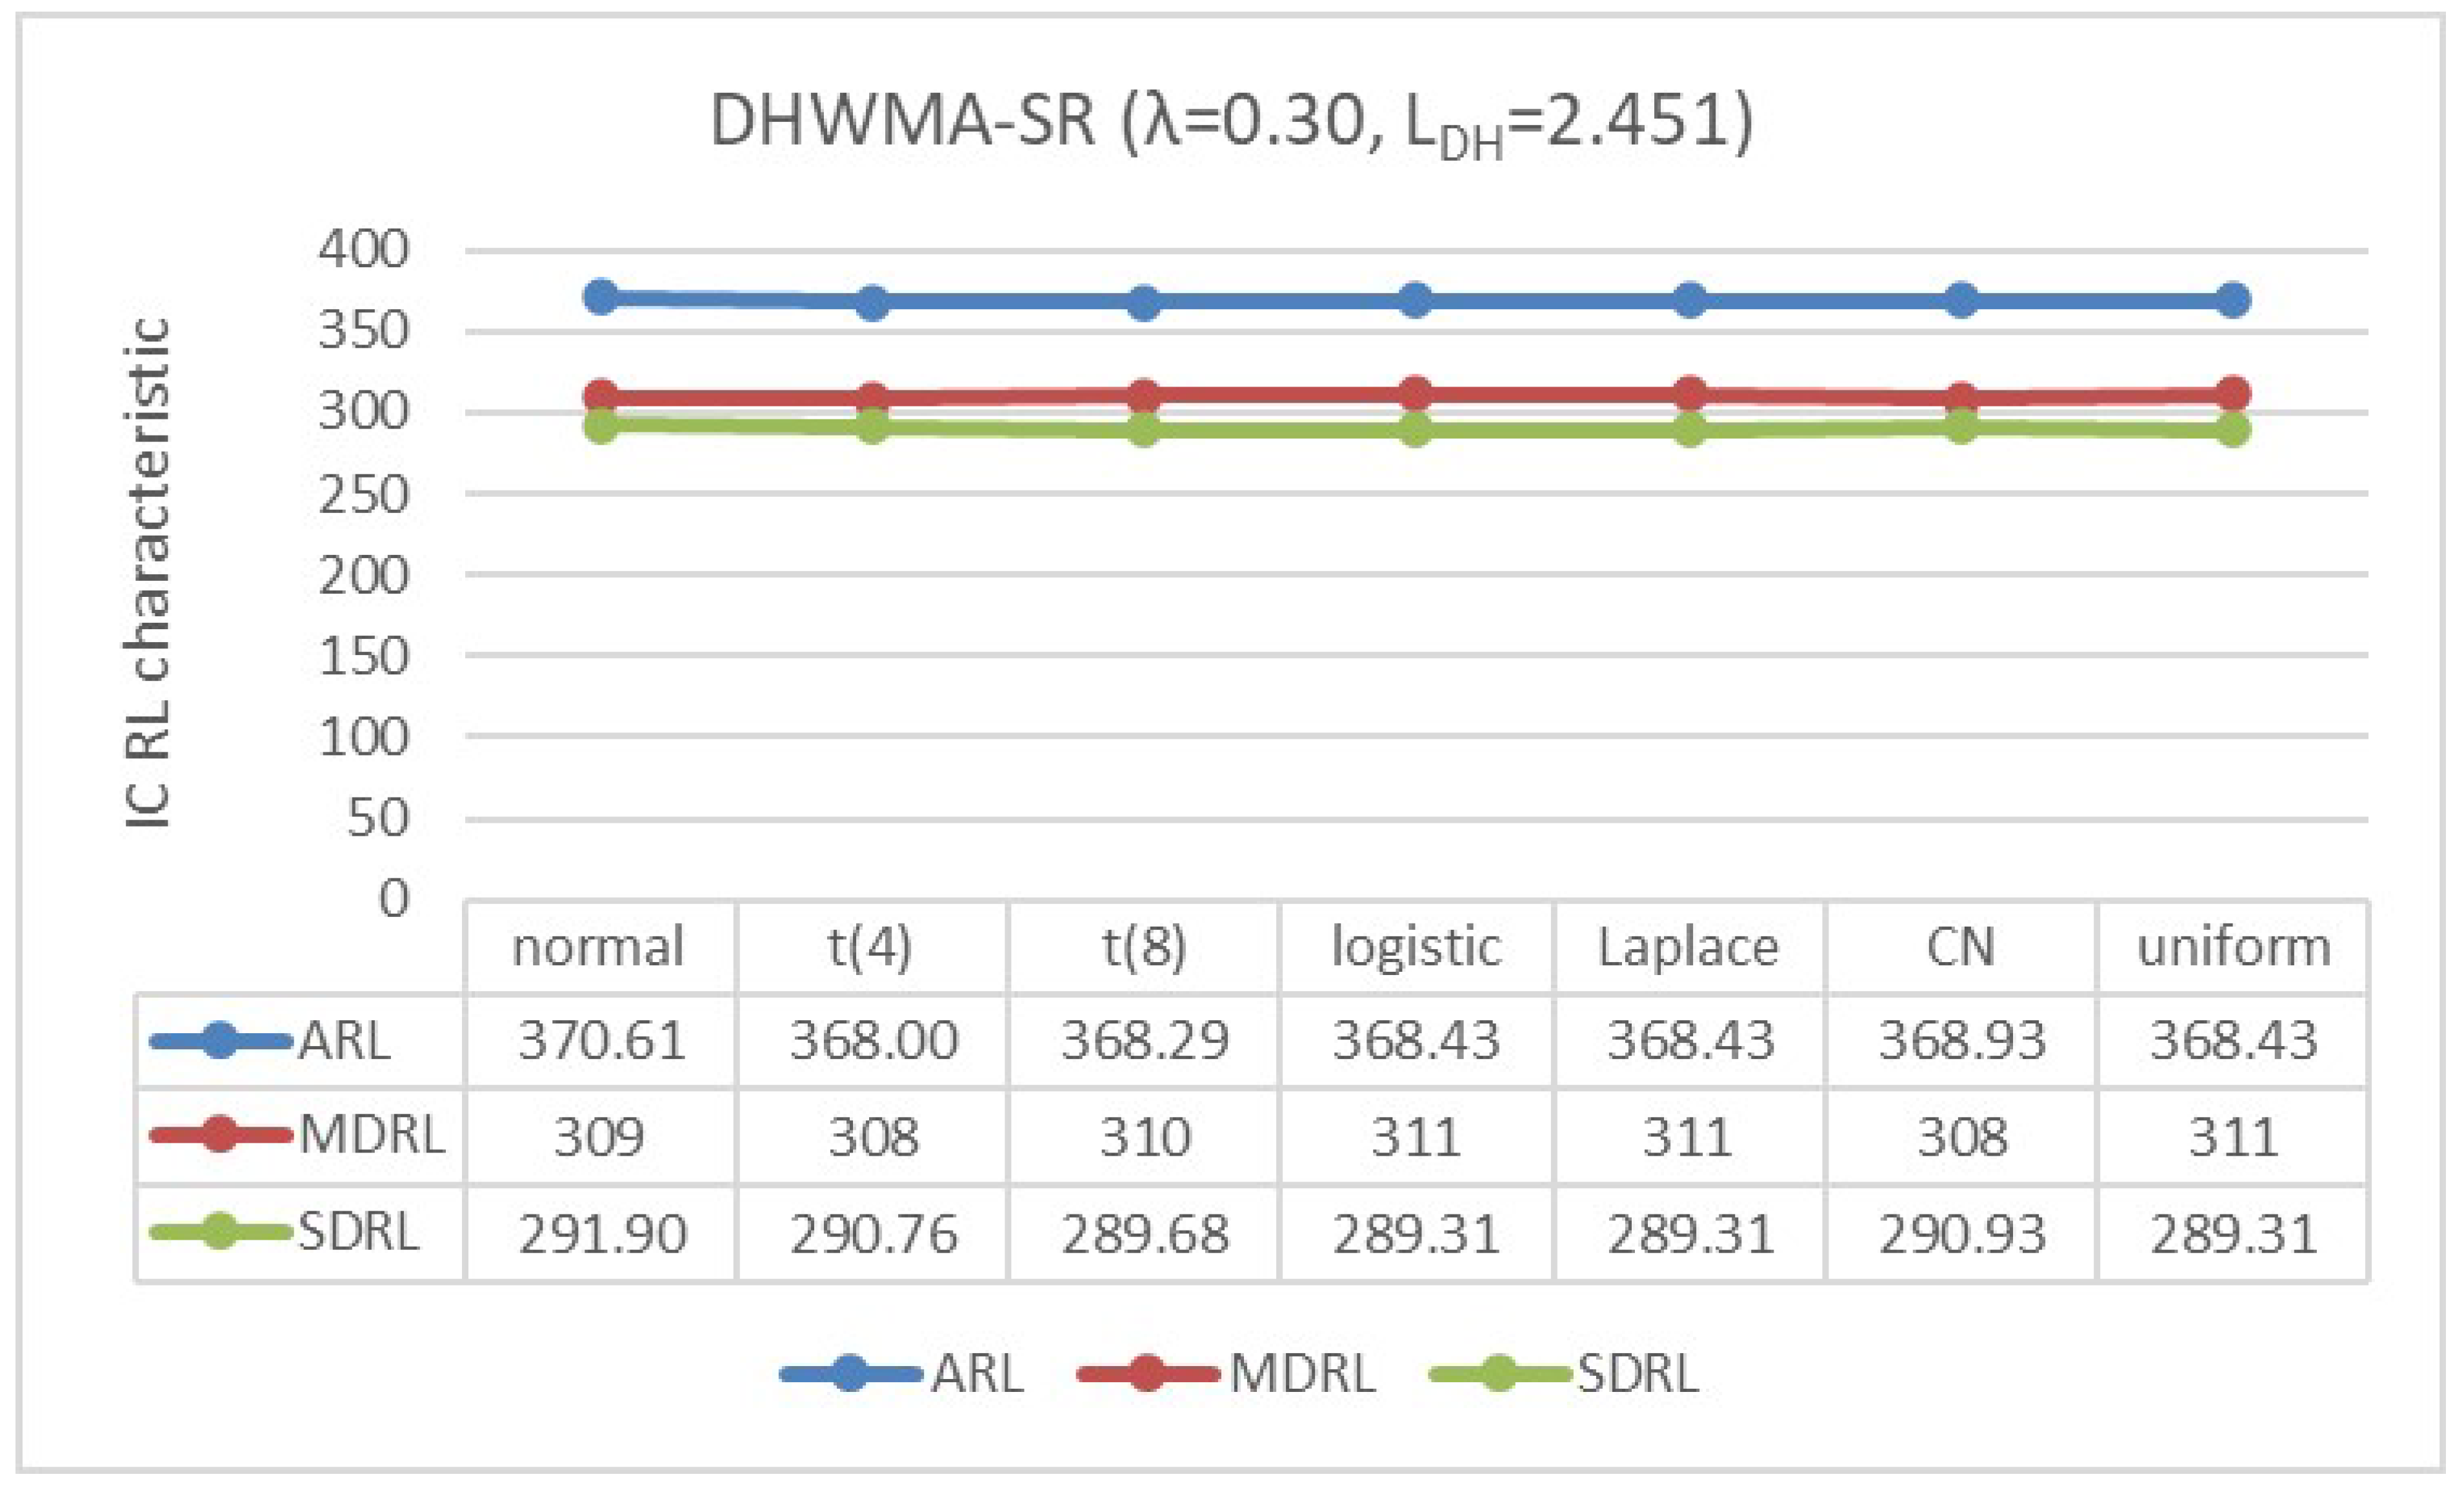
4.2. IC Robustness
- The standard normal distribution, ;
- The scaled Student’s t-distribution, with degrees of freedom and 8;
- The logistic distribution, ;
- The double exponential or Laplace distribution, ;
- The contaminated normal (CN) distribution, which is a mixture of and , represented by with and level of contamination ;
- The uniform distribution, .
4.3. OOC Performance
- The DHWMA-SR chart performs better as the value of n increases. For example, when and , the ARL1 value of the proposed chart is equal to 40.59 at under the distribution, while the corresponding value is equal to 27.77 for .
- The detection ability of the proposed chart is better as the value of decreases. For example, when and , the ARL1 values of the DHWMA-SR chart under the distribution are equal to 66.86, 96.72, 103.71, 114.66, 127.97, 138.24 and 140.16 for and 0.30, respectively. However, we remind that this superiority of the DHWMA-SR chart is accompanied by a larger value of SDRL0.
- For small to moderate shifts (), the proposed chart performs better when the underlying distribution is the , while for larger shifts (), it performs better when the underlying distribution is the . On the other hand, the worst performance is observed under the for and under the for .
- Similar to the IC run-length distribution, the OOC run-length distribution is also positively skewed as .
5. Performance Analysis for the Steady-State Scenario
6. Comparison Study
6.1. DHWMA-SR Versus EWMA-SR, DEWMA-SR and HWMA-SR
6.2. DHWMA-SR Versus DHWMA Sign and DHWMA-
- The nonparametric DHWMA charts are IC robust for all considered distributions, while the ARL0 values of the DHWMA- chart change when the underlying distribution also changes because it is designed for the normal distribution. For example, the ARL0 of the DHWMA- chart is 370.51 under the distribution and ranges from 295 to 415 for the non-normal distributions.
- The DHWMA-SR chart outperforms the DHWMA sign chart for small to moderate shifts () and performs a slightly better for larger shifts under all considered distributions except for the Laplace distribution where, in this case, the DHWMA sign chart is more effective only for .
- In the case of normal distribution, it is seen that the DHWMA-SR chart performs slightly better than the DHWMA- chart for and vice versa for the rest of the range of shifts.
- The ARL1 values of the DHWMA- chart are approximately similar for all distributions. For example, when , the ARL1 values of the DHWMA- chart are 38.33, 38.64, 37.94, 38.27, 38.41, 38.70 and 38.55 under the normal, , , logistic, Laplace, CN and uniform distributions, respectively.
- Although the ARL0 values of the DHWMA- chart are smaller than 370 under the Student’s t, logistic and Laplace distributions, the ARL1 values of the DHWMA-SR chart are smaller than those of the DHWMA- chart, especially for , while their performance is similar for larger shifts.
- In the case of CN distribution where the ARL0 of the DHWMA- chart is equal to 414.71, the DHWMA-SR chart is more effective than the DHWMA- chart for , while the latter chart performs slightly better for larger shifts.
- In the case of uniform distribution where the ARL0 of the DHWMA- chart is equal to 386.46, the ARL1 values of the DHWMA- chart are smaller than those of the DHWMA-SR chart over the entire range of shifts.
- The gamma distribution, with parameters and ;
- The lognormal distribution with parameters and ;
- The Weibull distribution with parameters and .
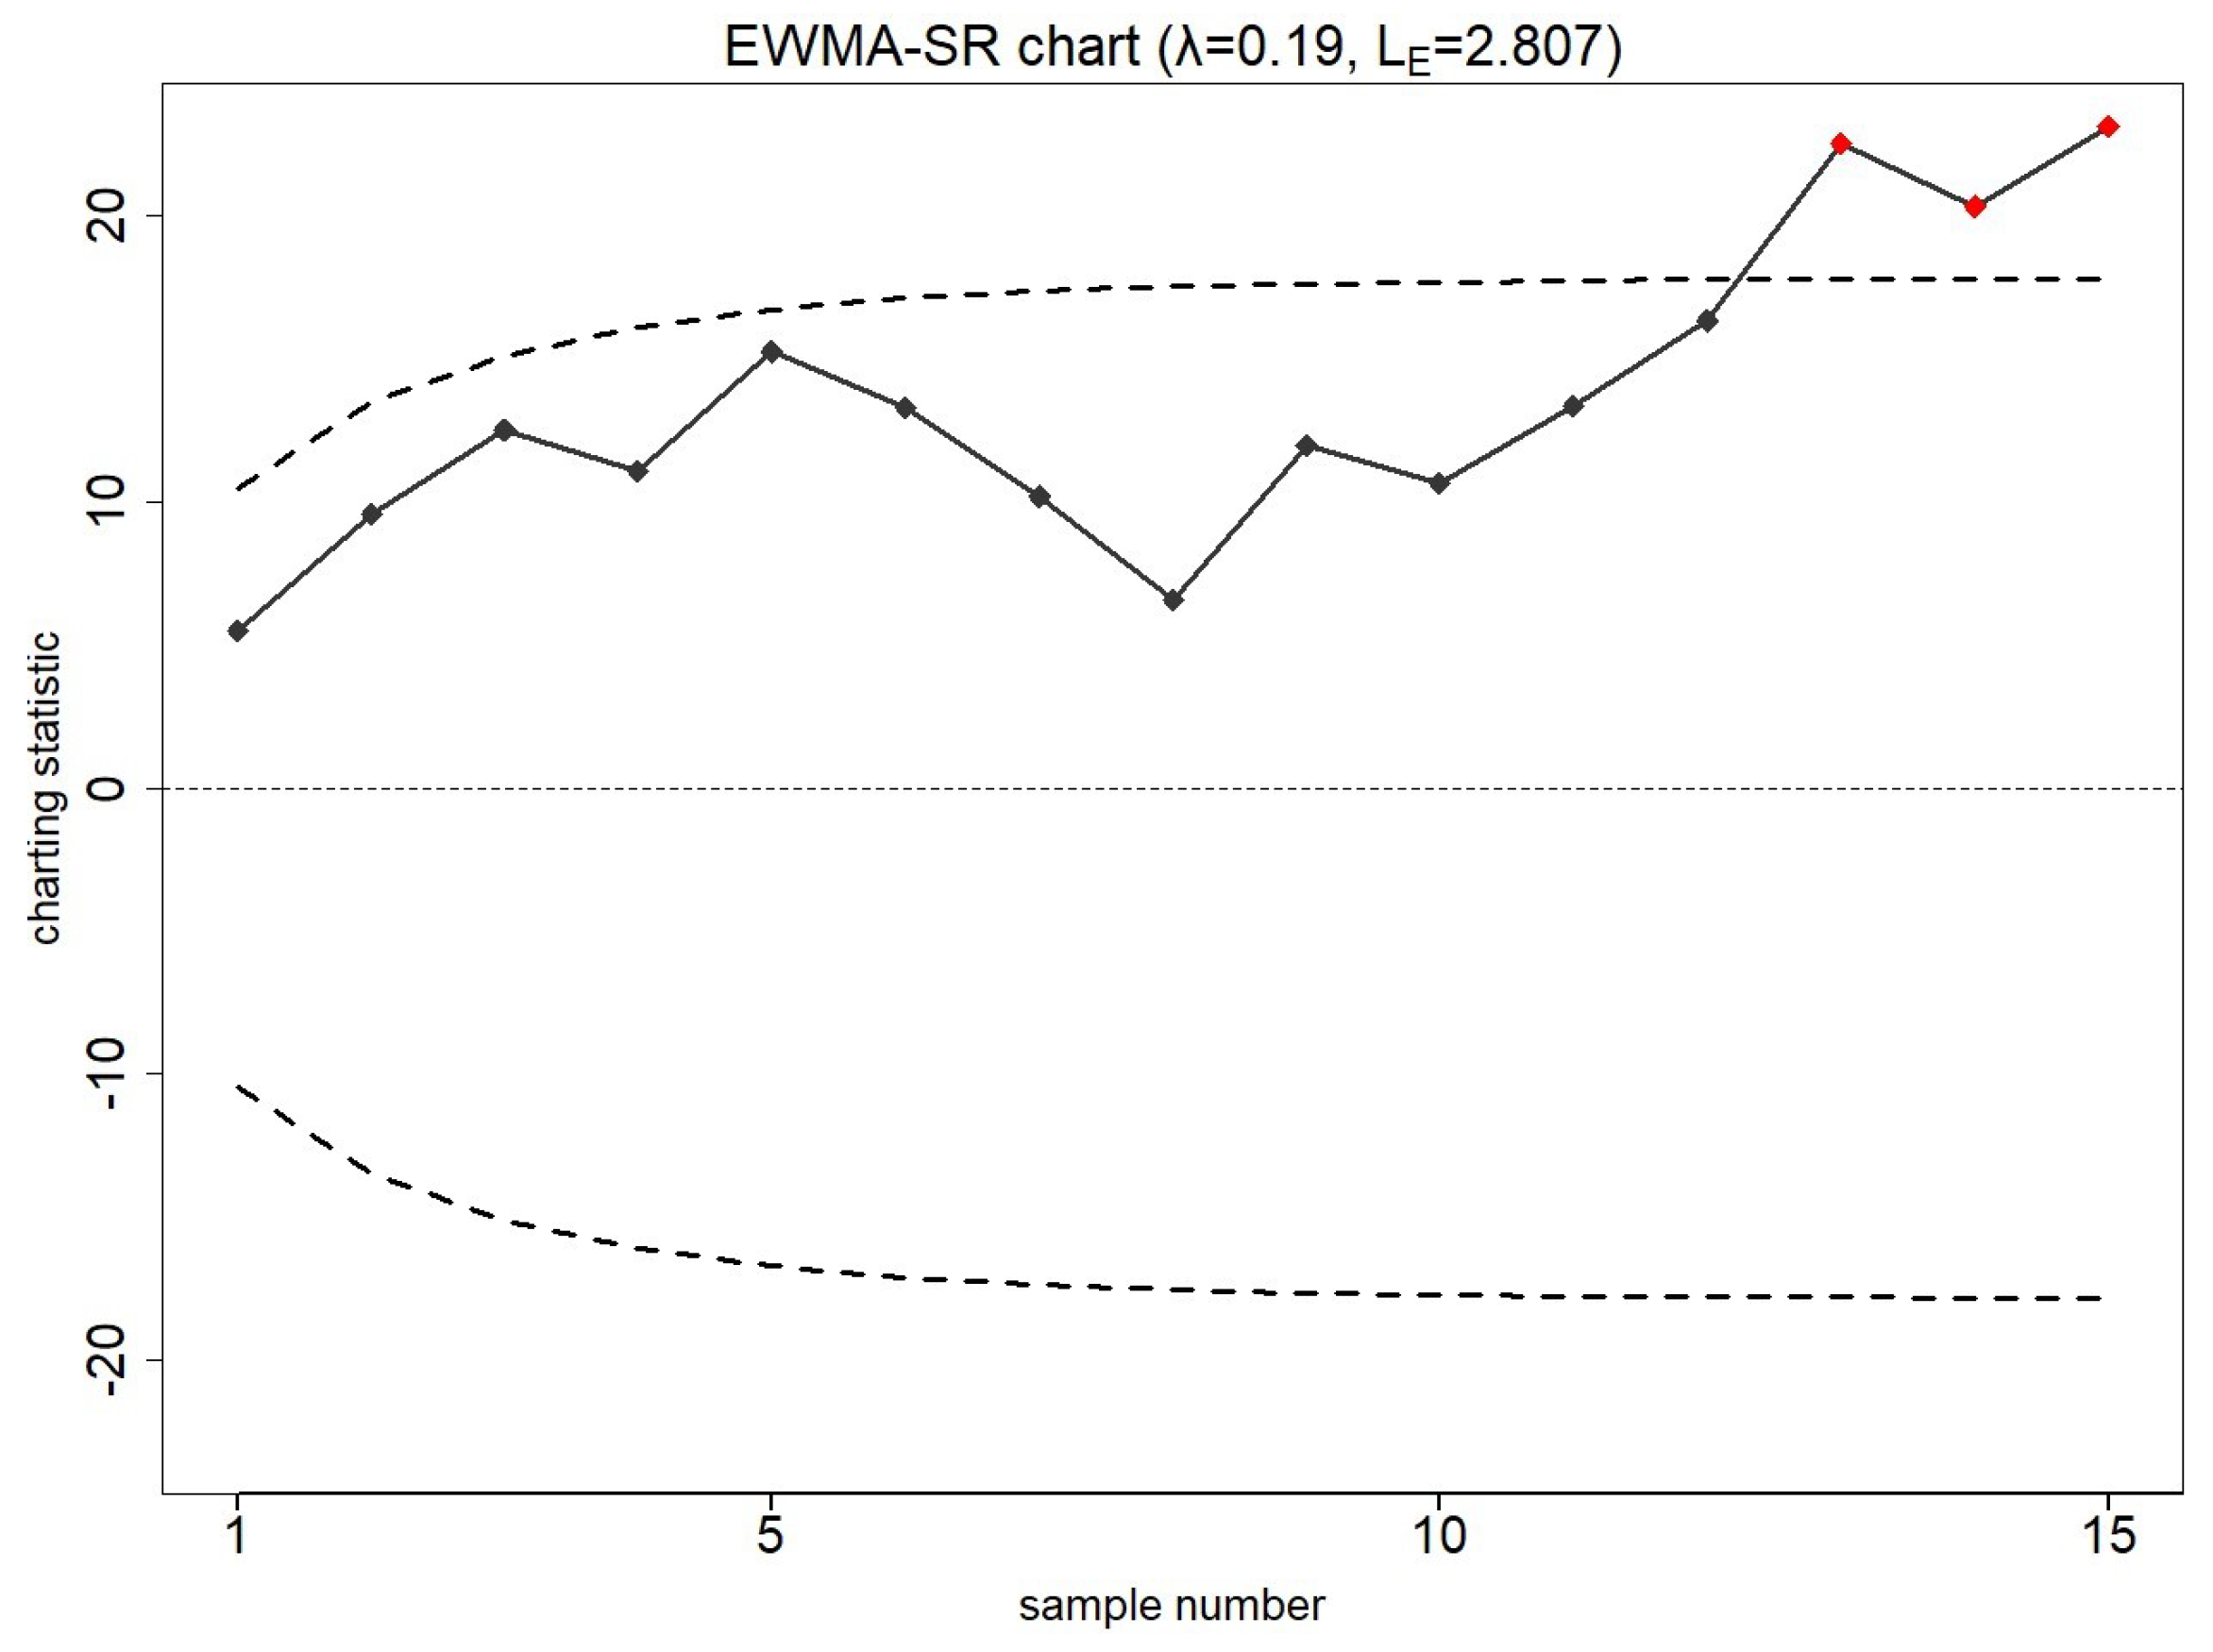
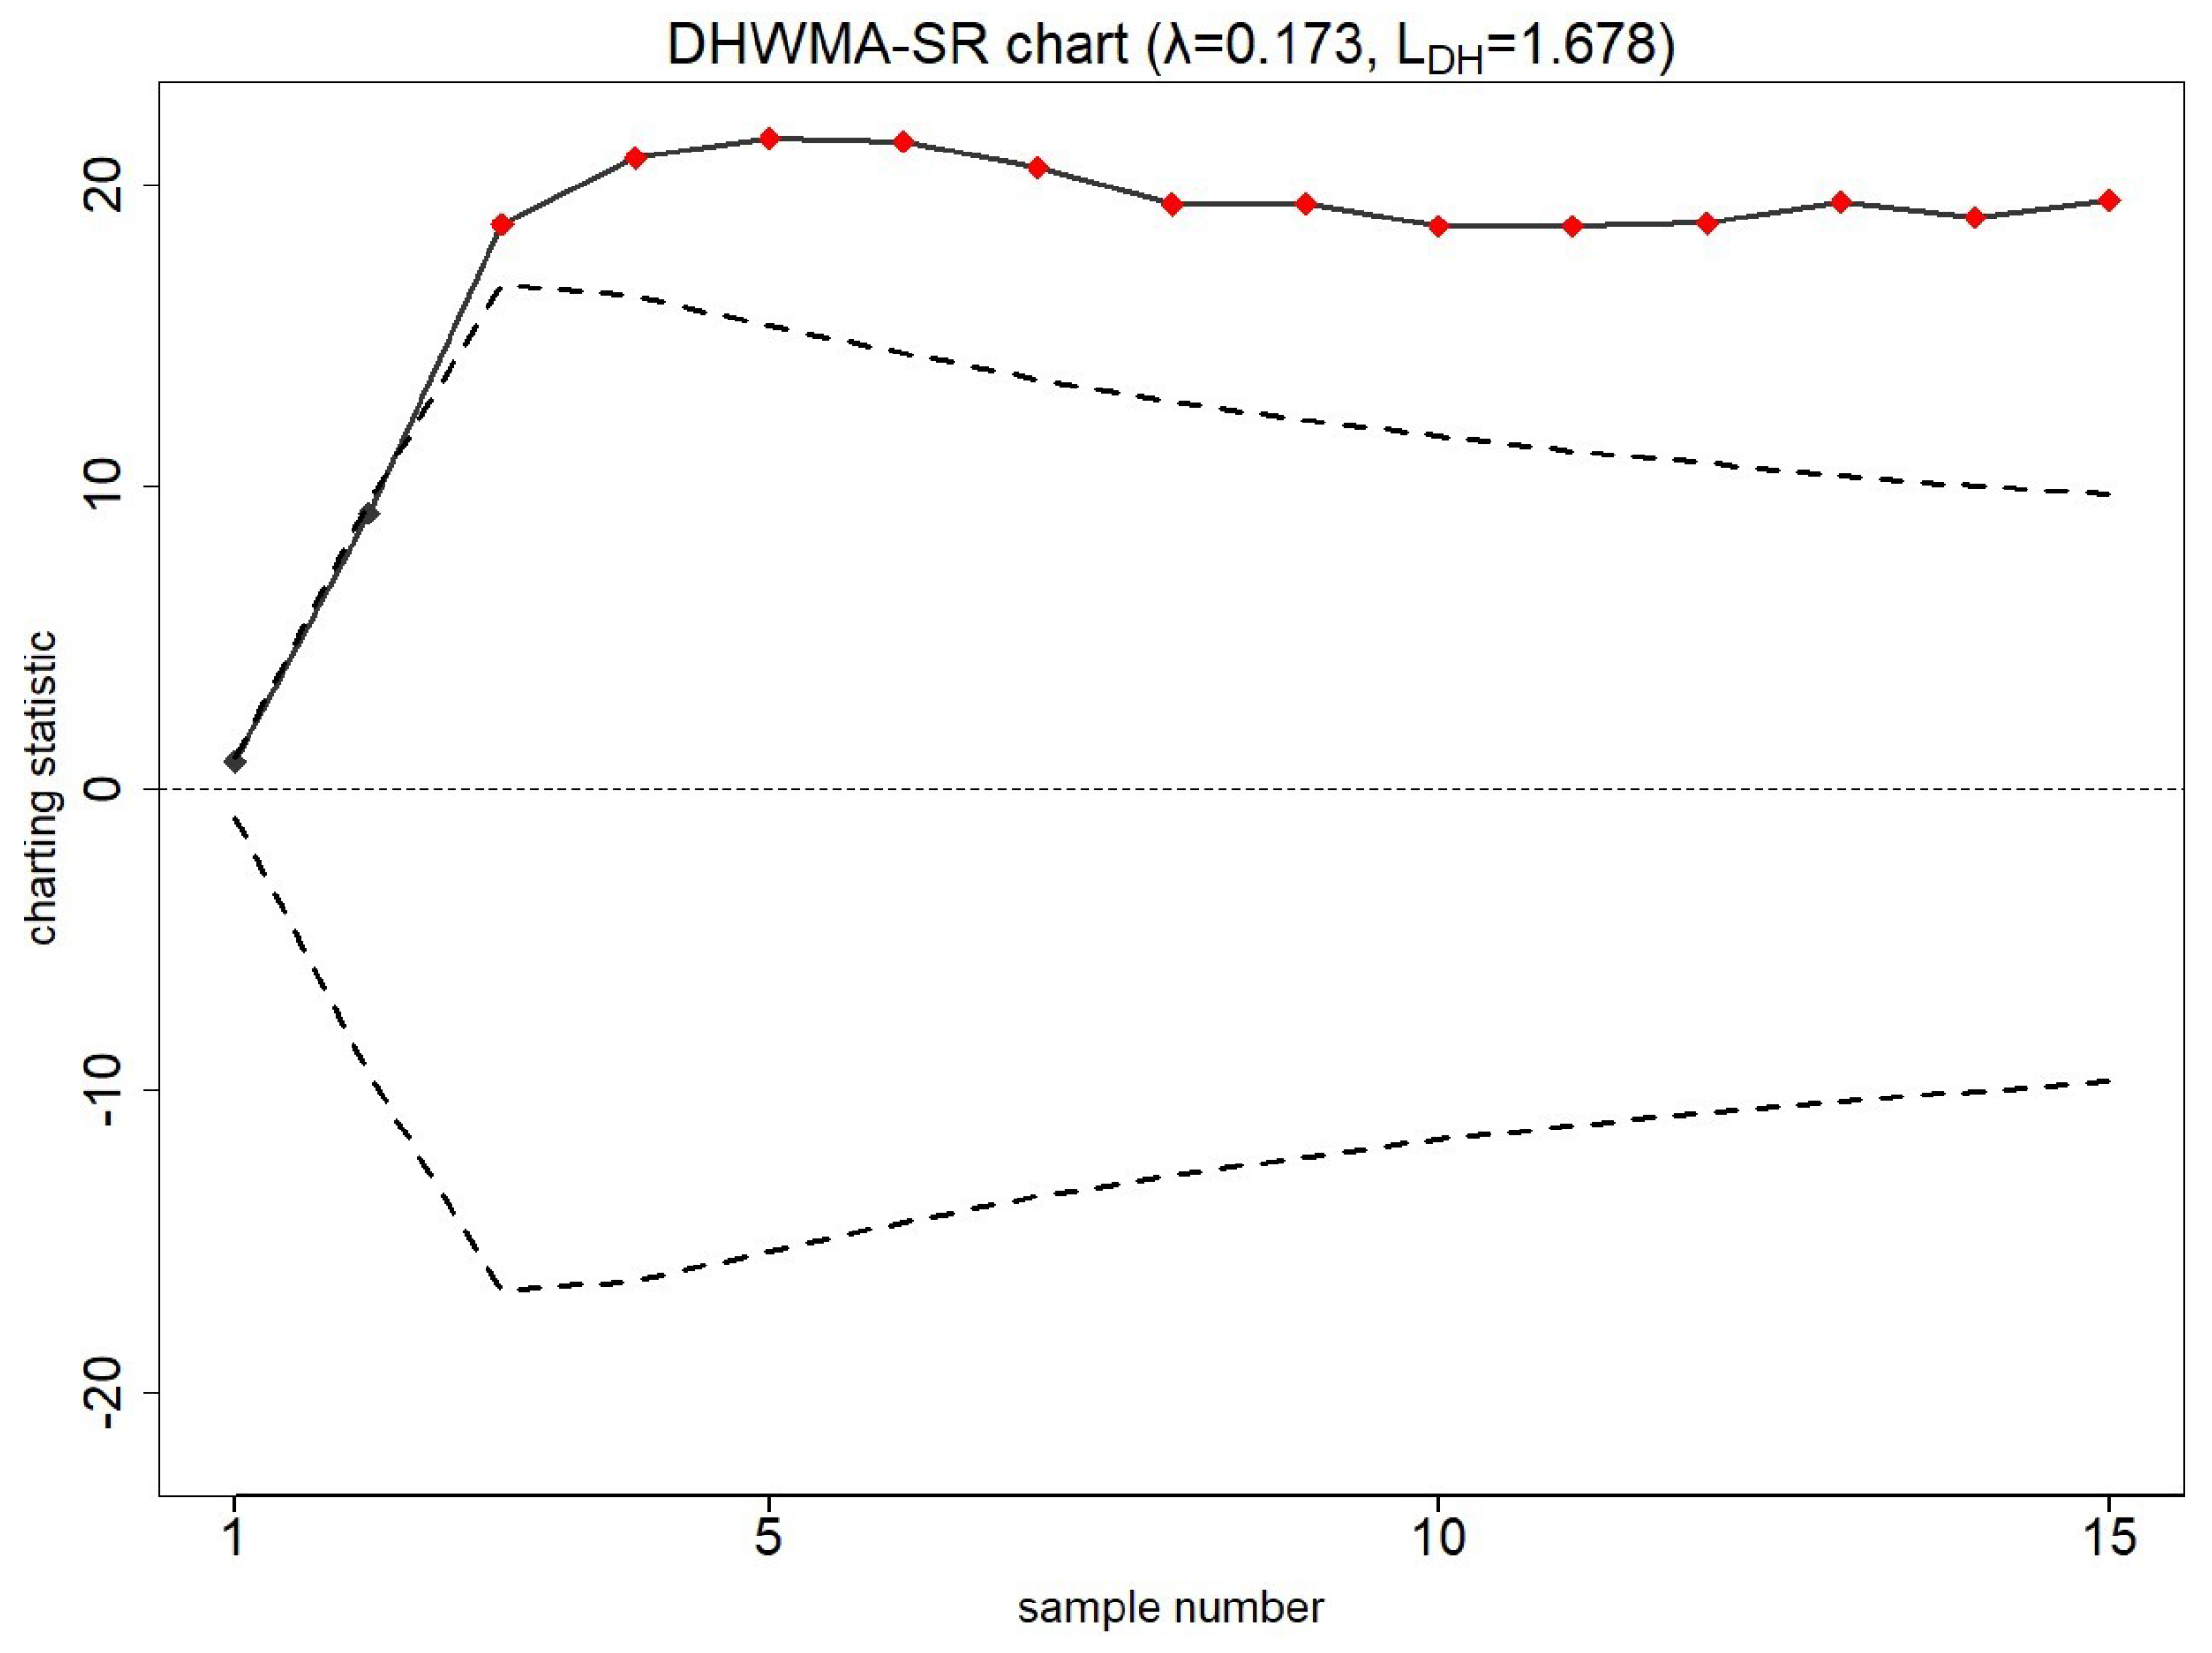
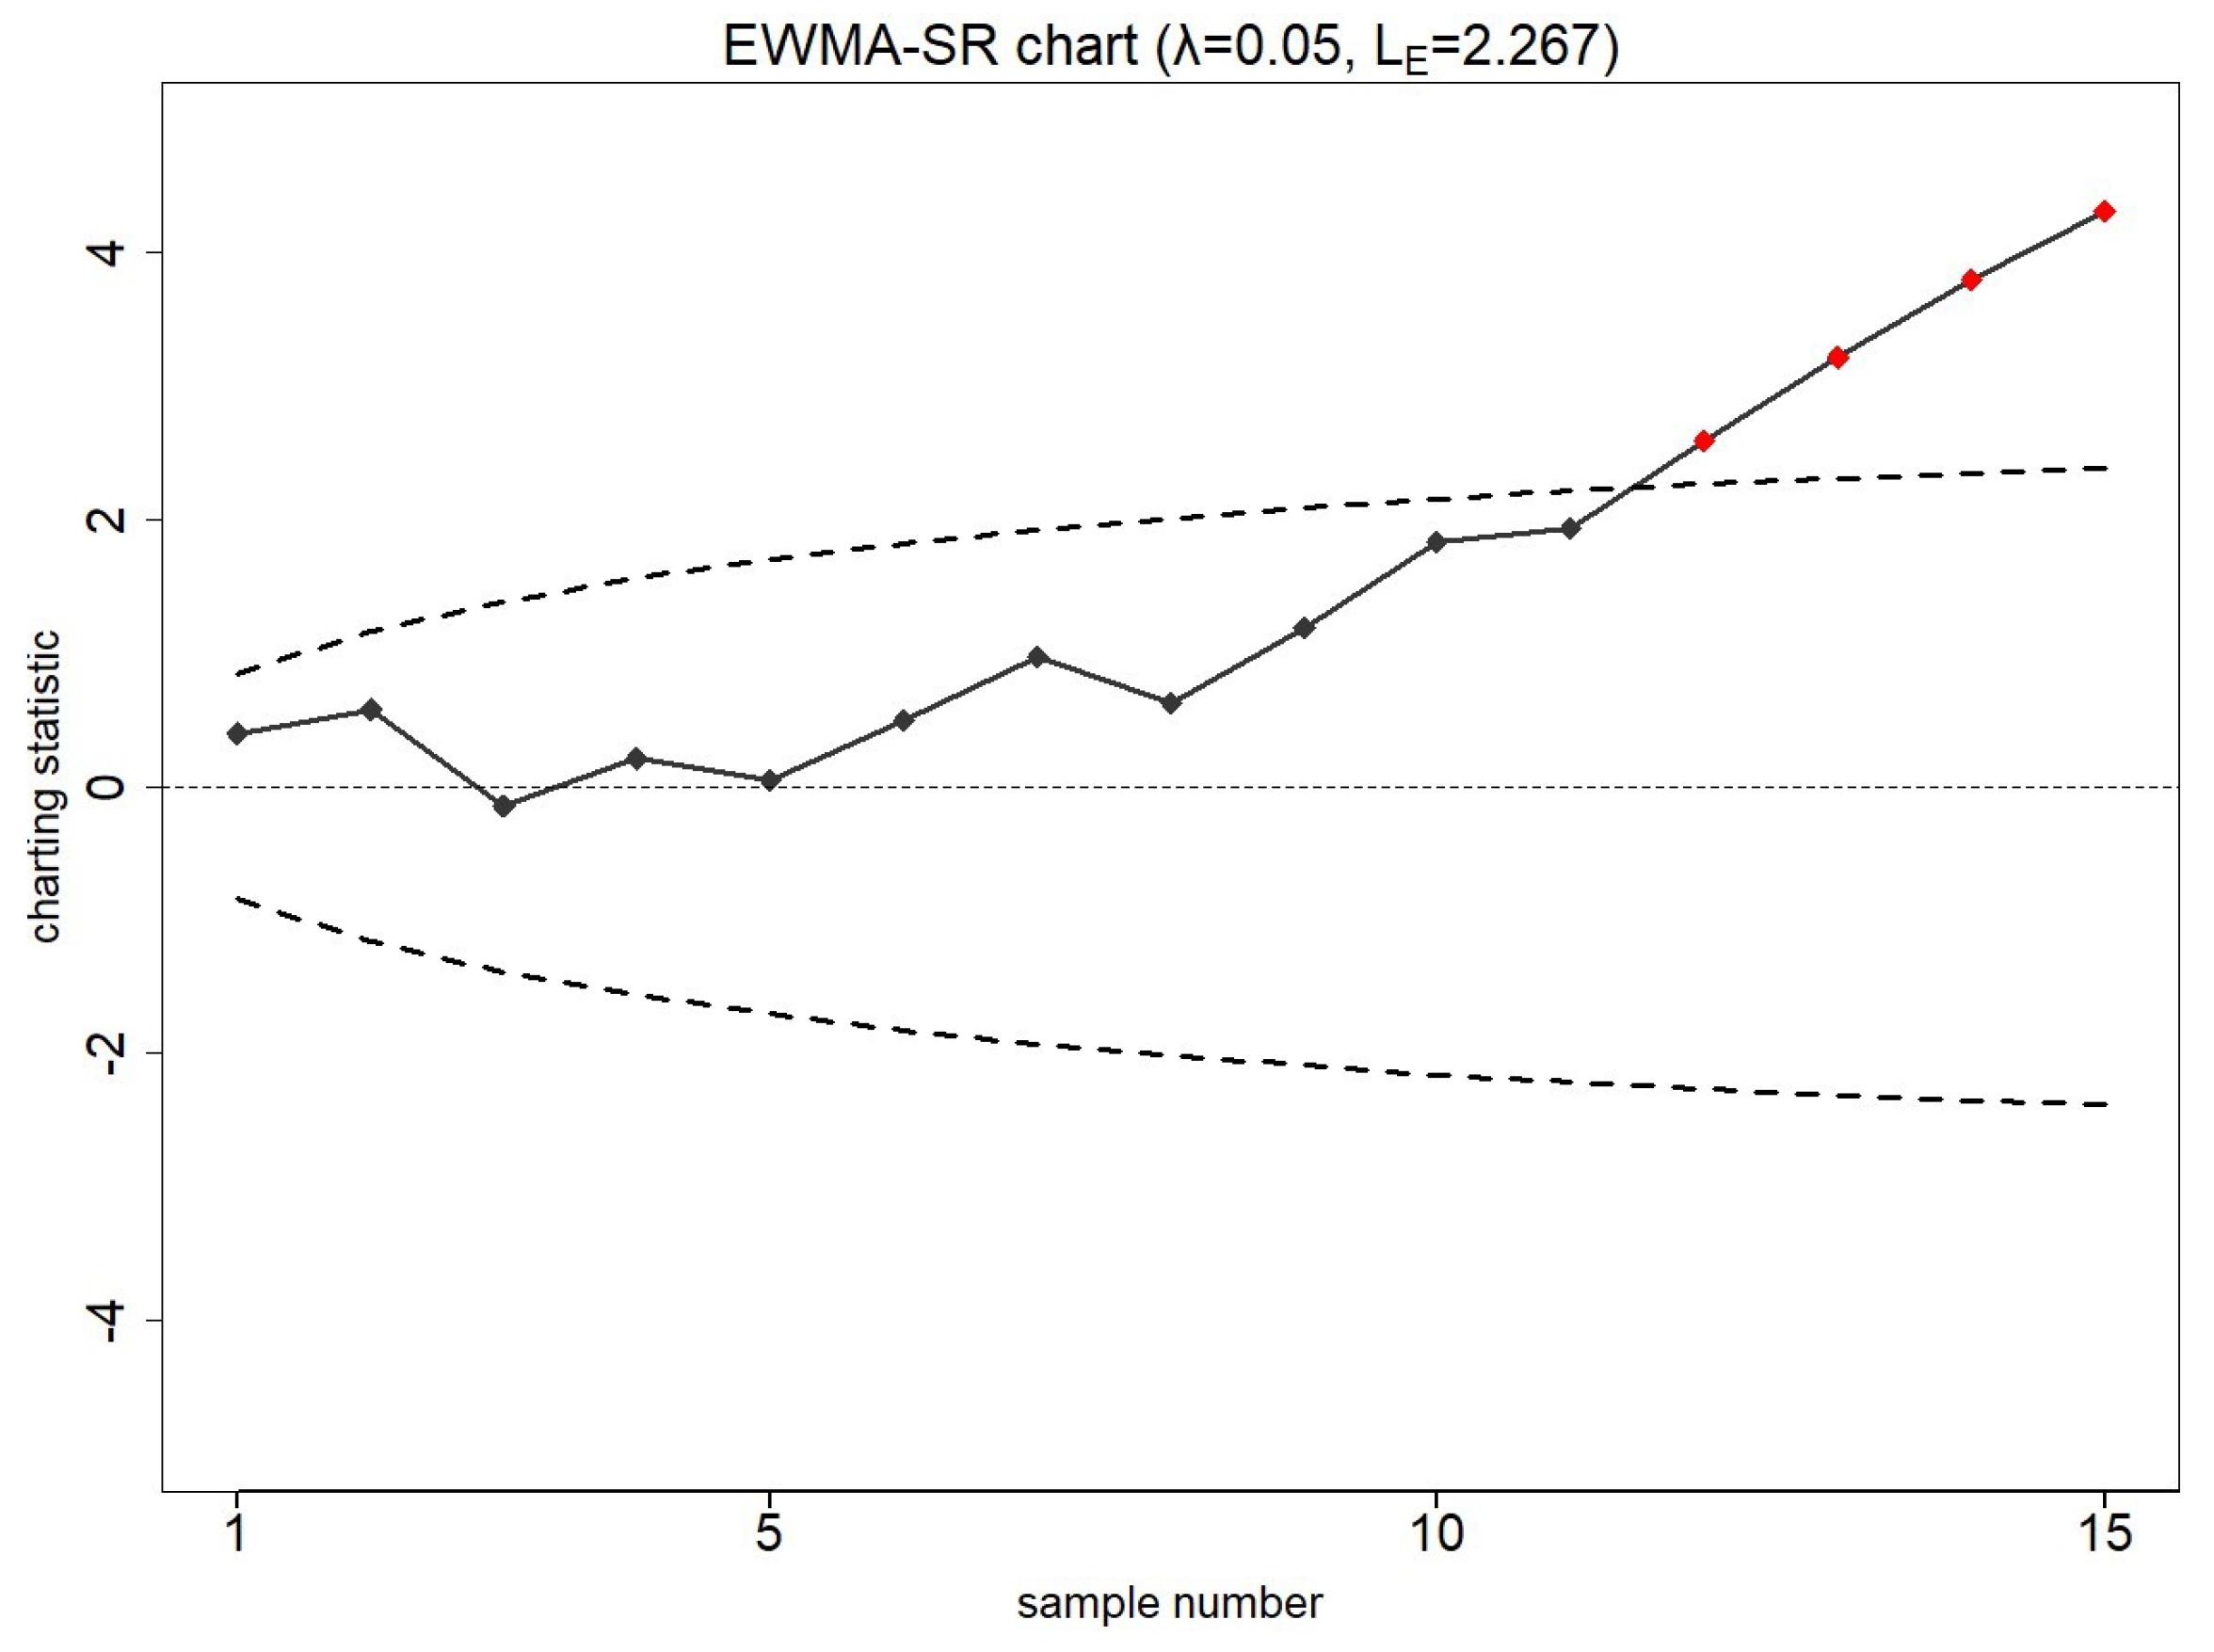
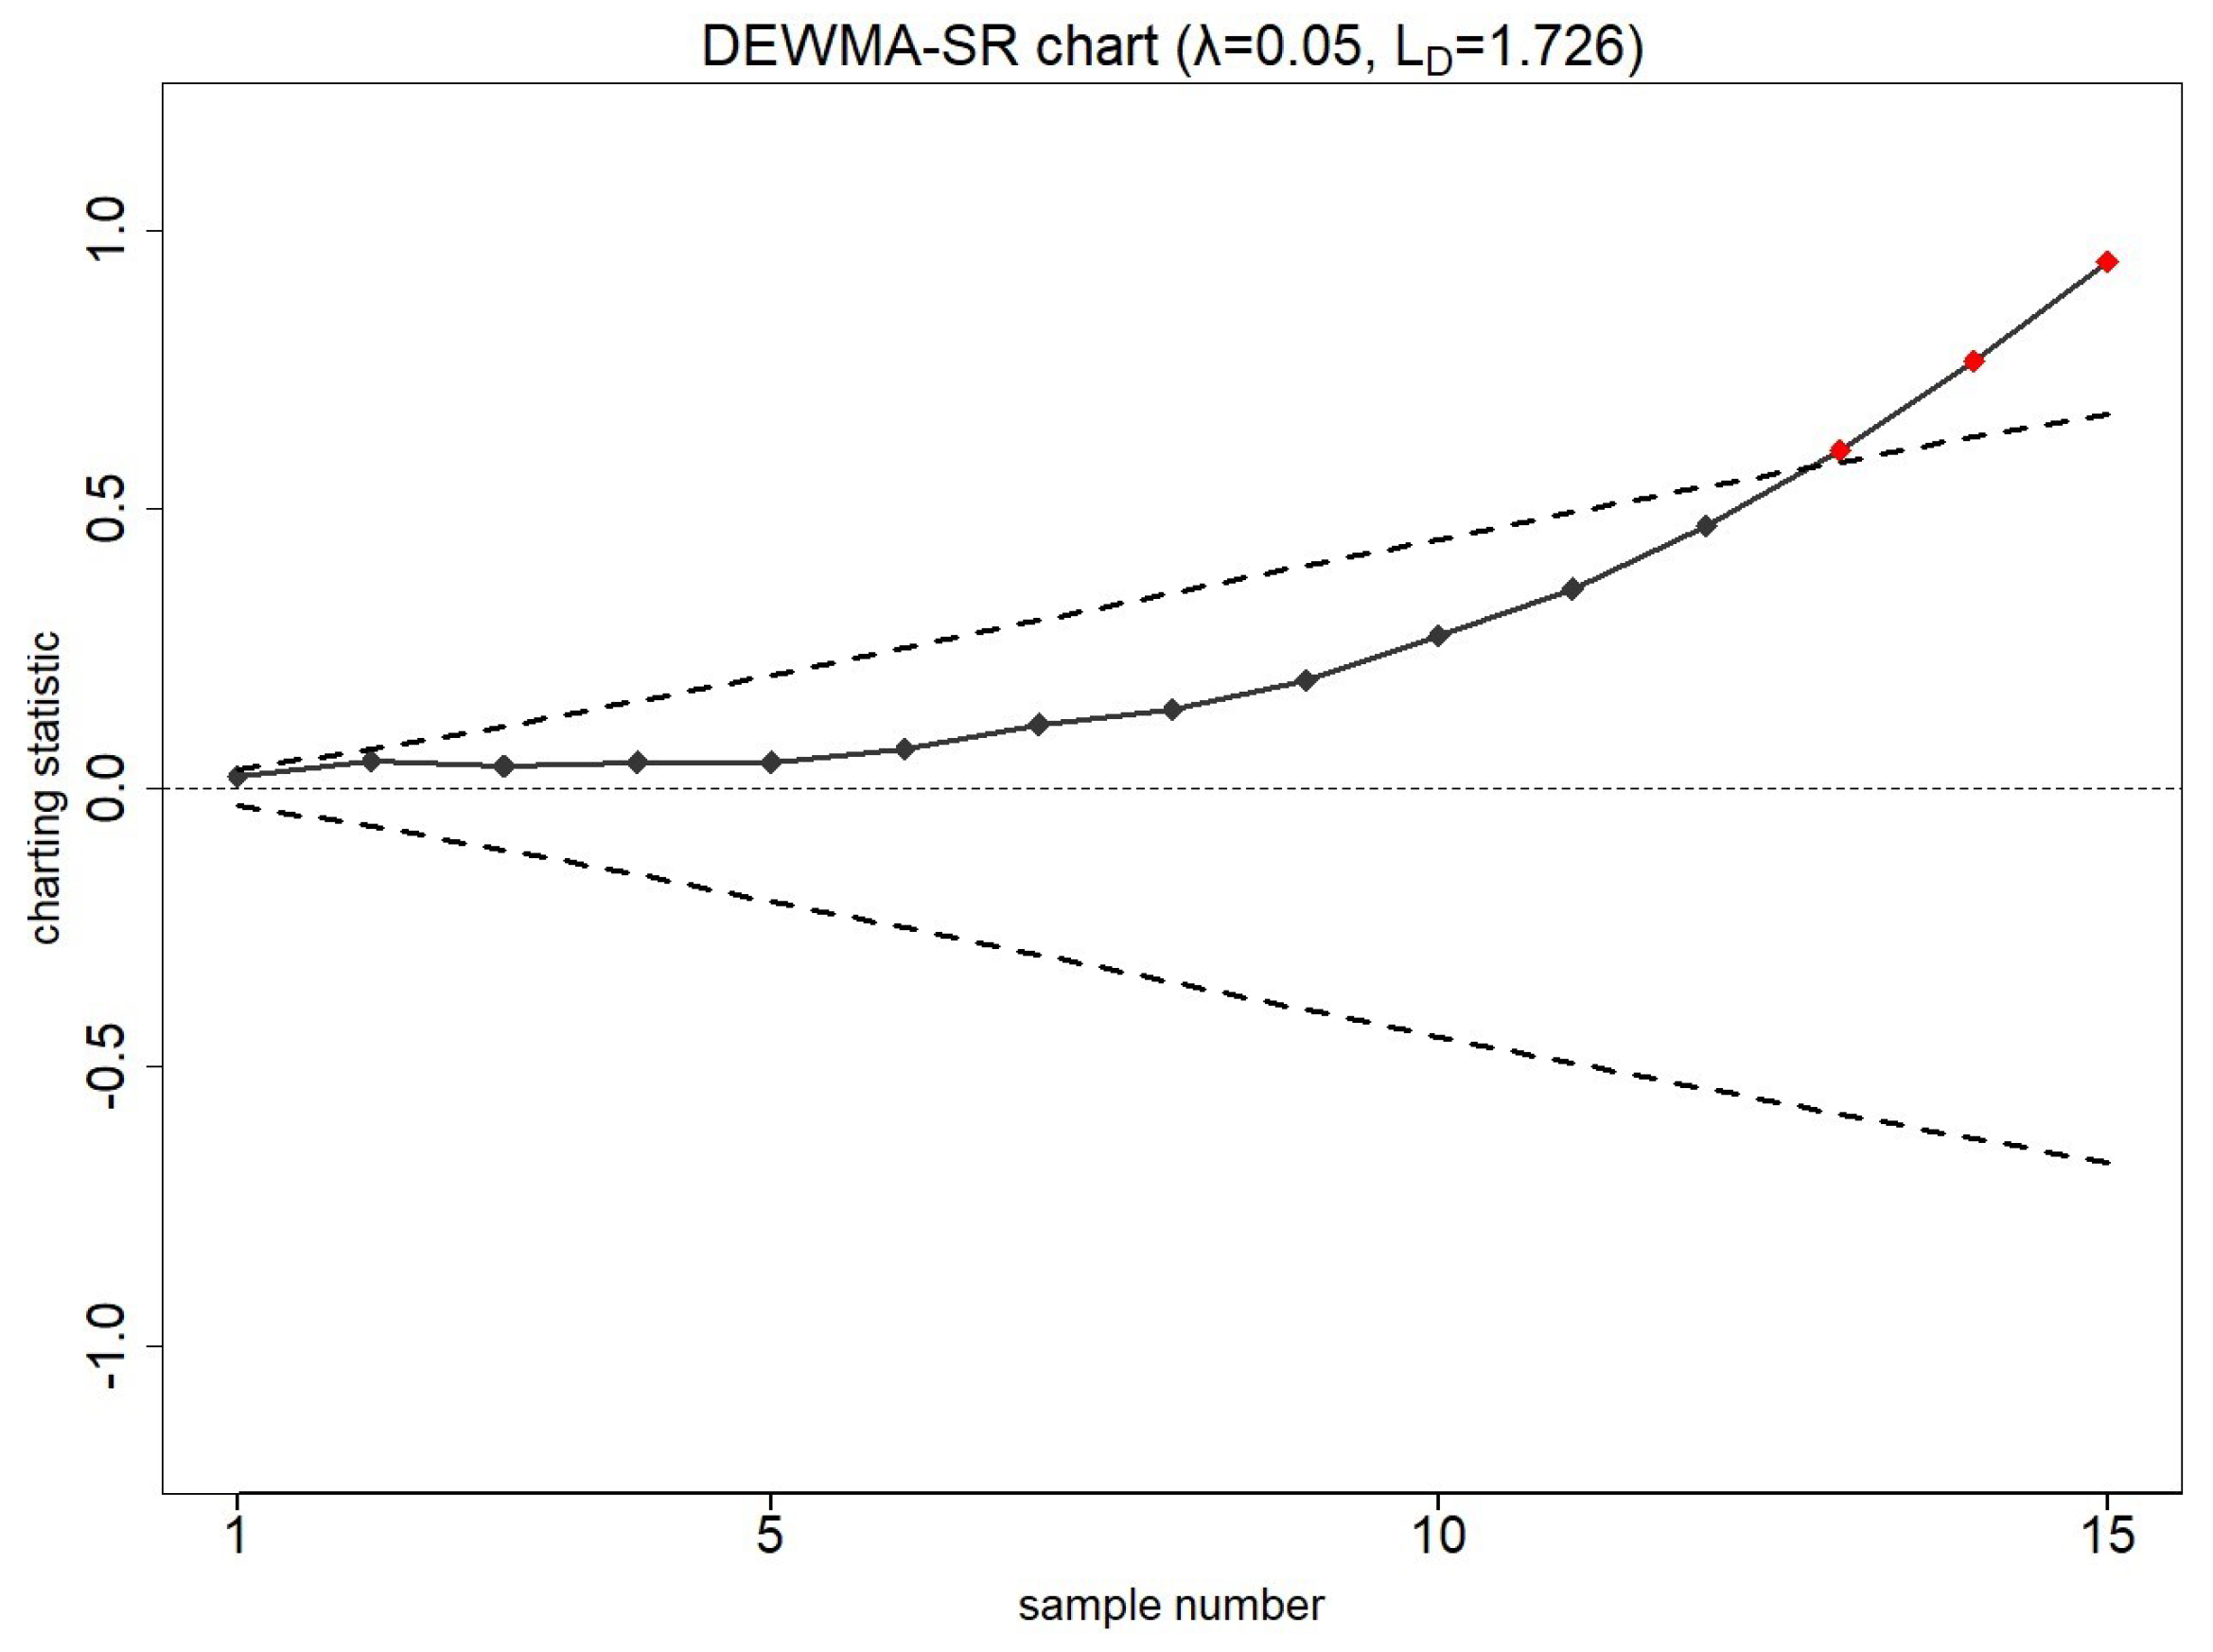
7. Illustrative Examples
7.1. Smartphone Accelerometer Dataset
7.2. Piston Rings Dataset
8. Conclusions and Recommendations
Funding
Data Availability Statement
Conflicts of Interest
Appendix A
| Characteristic | 100 | 200 | 500 | 1000 | 100 | 200 | 500 | 1000 | |||||
|---|---|---|---|---|---|---|---|---|---|---|---|---|---|
| 0.05 | 2.070 | ARL | 370.48 | 393.87 | 382.08 | 363.12 | 345.08 | 2.308 | 370.74 | 345.11 | 300.33 | 202.37 | 124.89 |
| MDRL | 188 | 205 | 181 | 122 | 66 | 295 | 274 | 223 | 121 | 68 | |||
| SDRL | 525.06 | 542.16 | 557.24 | 590.75 | 629.56 | 322.32 | 303.07 | 285.06 | 221.42 | 148.02 | |||
| 0.10 | 2.165 | ARL | 368.91 | 553.66 | 678.70 | 1119.37 | 1915.95 | 2.588 | 370.18 | 334.65 | 303.40 | 252.76 | 222.43 |
| MDRL | 127 | 116 | 111 | 119 | 182 | 282 | 246 | 211 | 165 | 145 | |||
| SDRL | 809.00 | 1628.41 | 1897.00 | 2593.39 | 3435.38 | 329.79 | 320.81 | 304.82 | 264.76 | 234.81 | |||
| 0.25 | 2.113 | ARL | 370.09 | 1387.79 | 2380.22 | 5626.89 | 9952.47 | 2.701 | 372.13 | 374.90 | 370.40 | 366.23 | 362.50 |
| MDRL | 50 | 57 | 70 | 186 | 2603 | 256 | 261 | 101 | 254 | 253 | |||
| SDRL | 1588.98 | 4798.64 | 6219.96 | 8771.89 | 9829.65 | 377.96 | 376.66 | 372.54 | 364.23 | 359.17 | |||
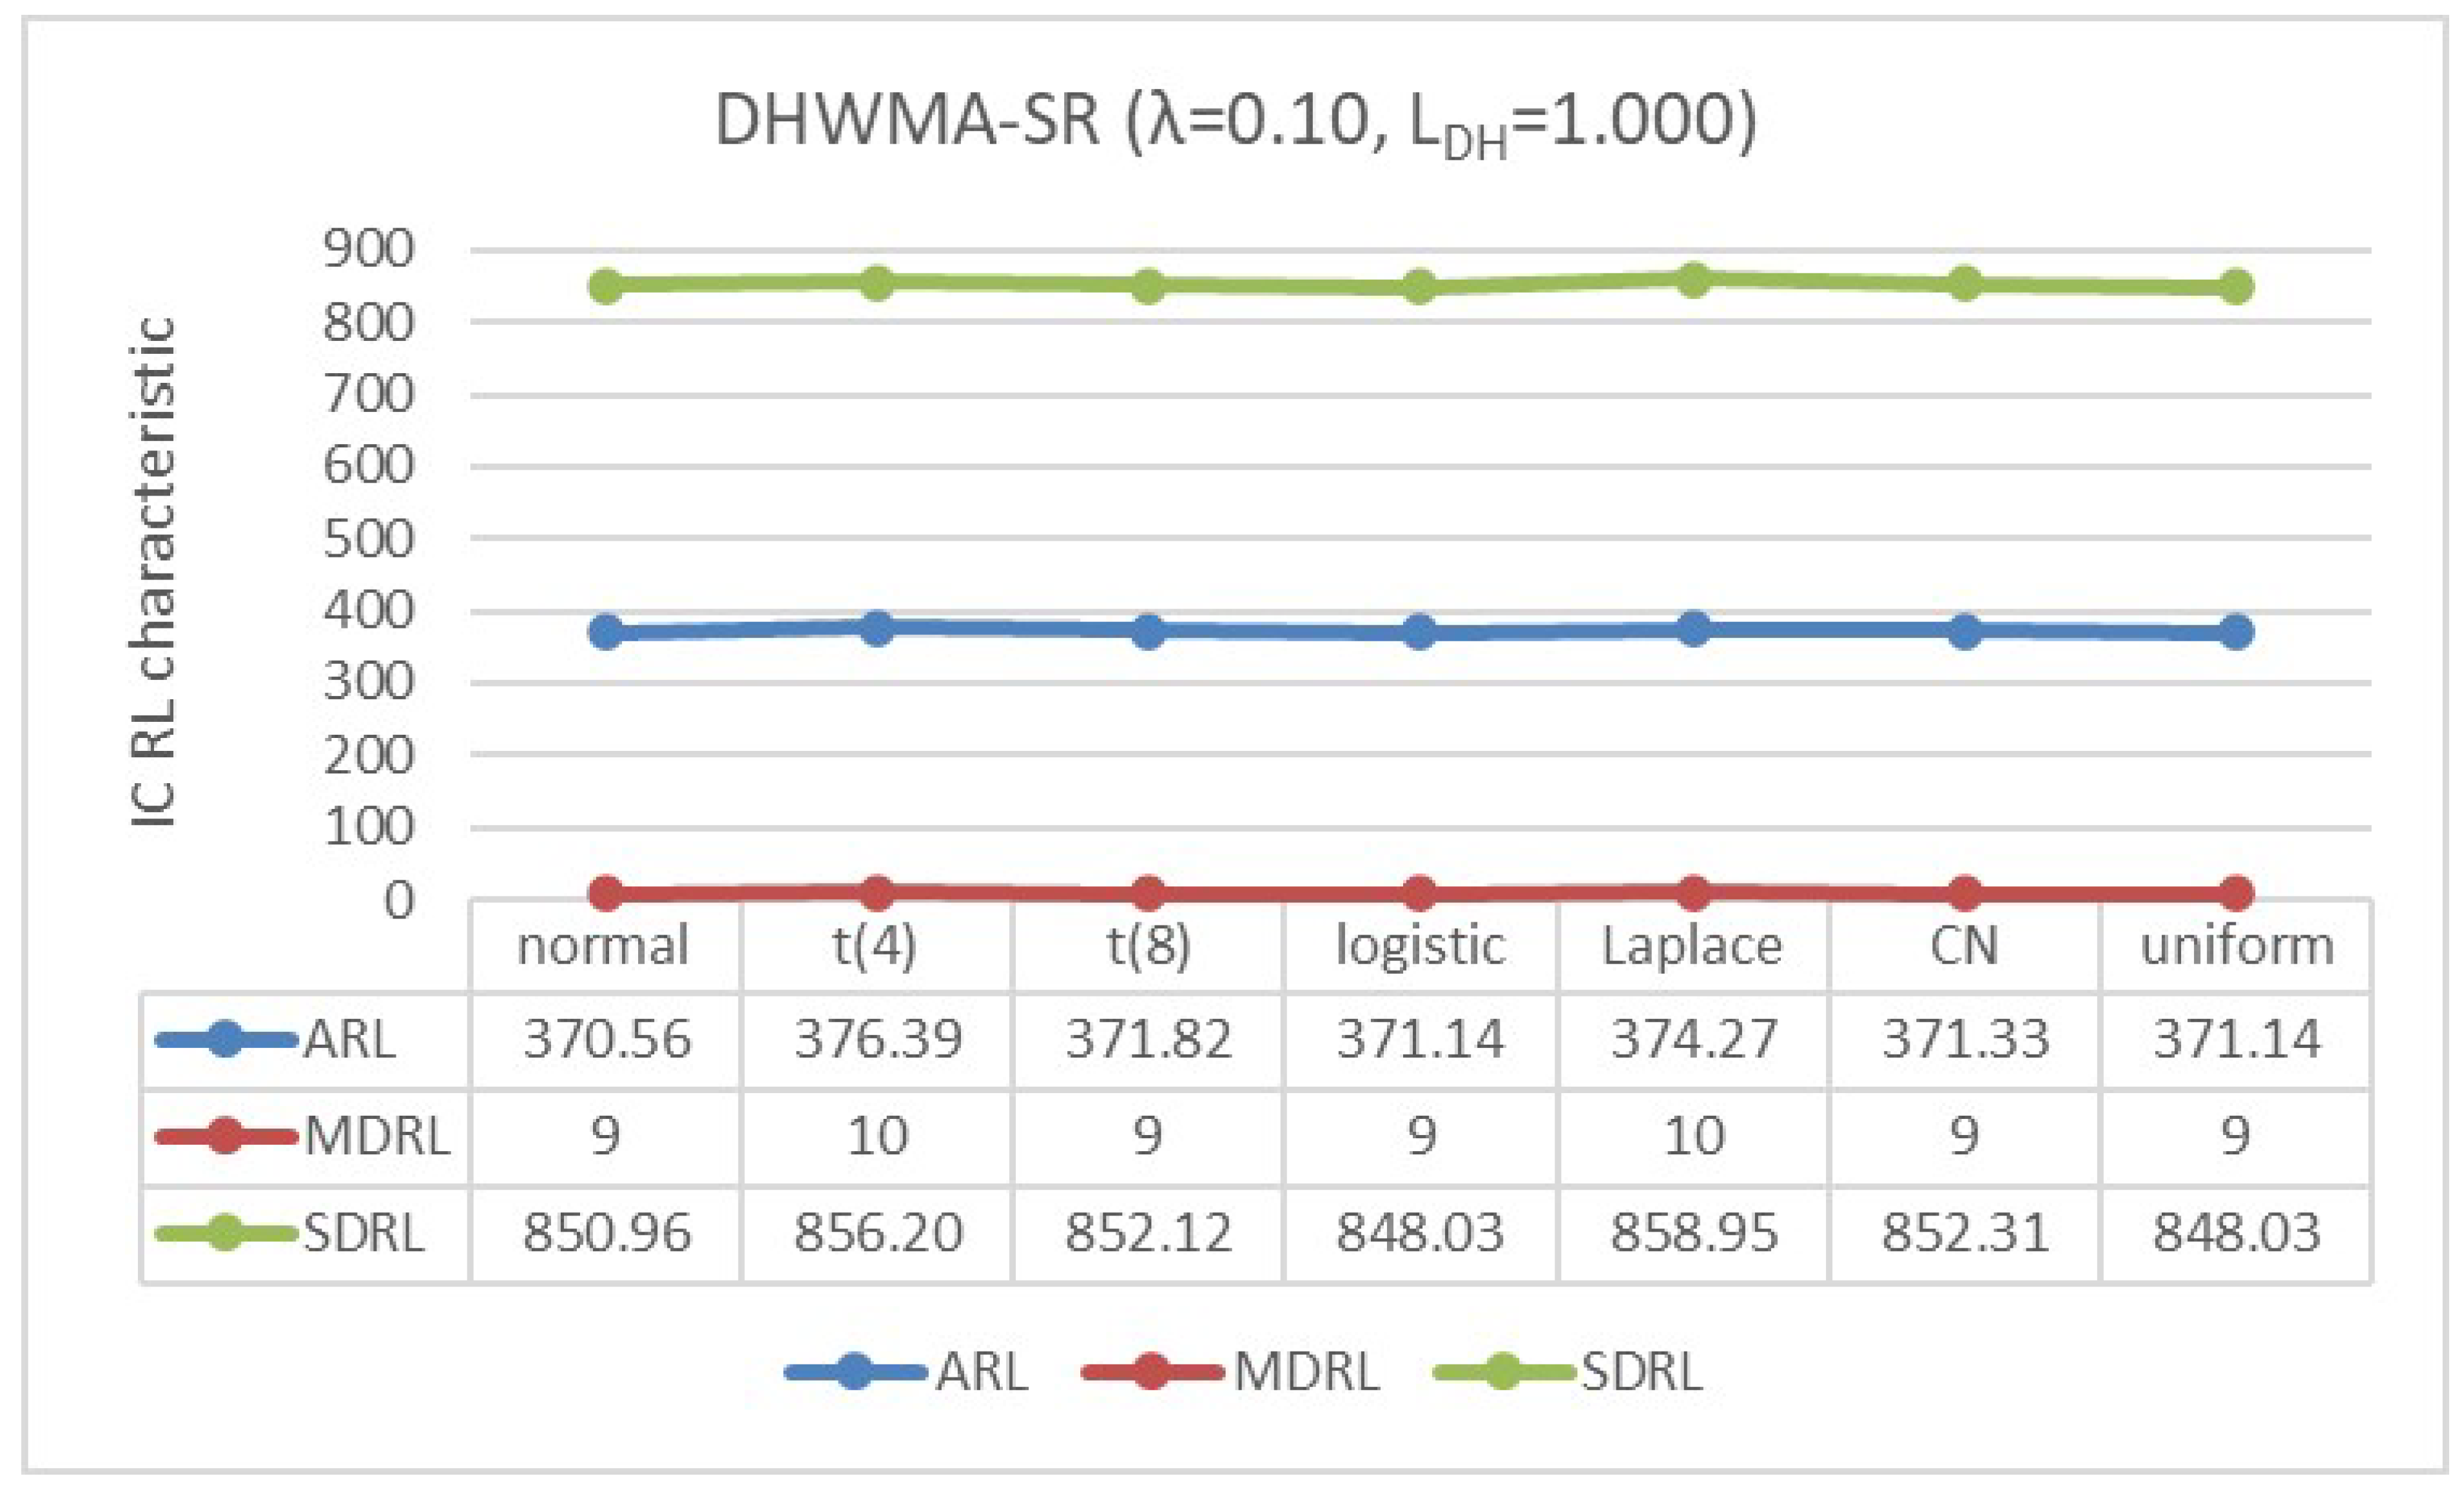
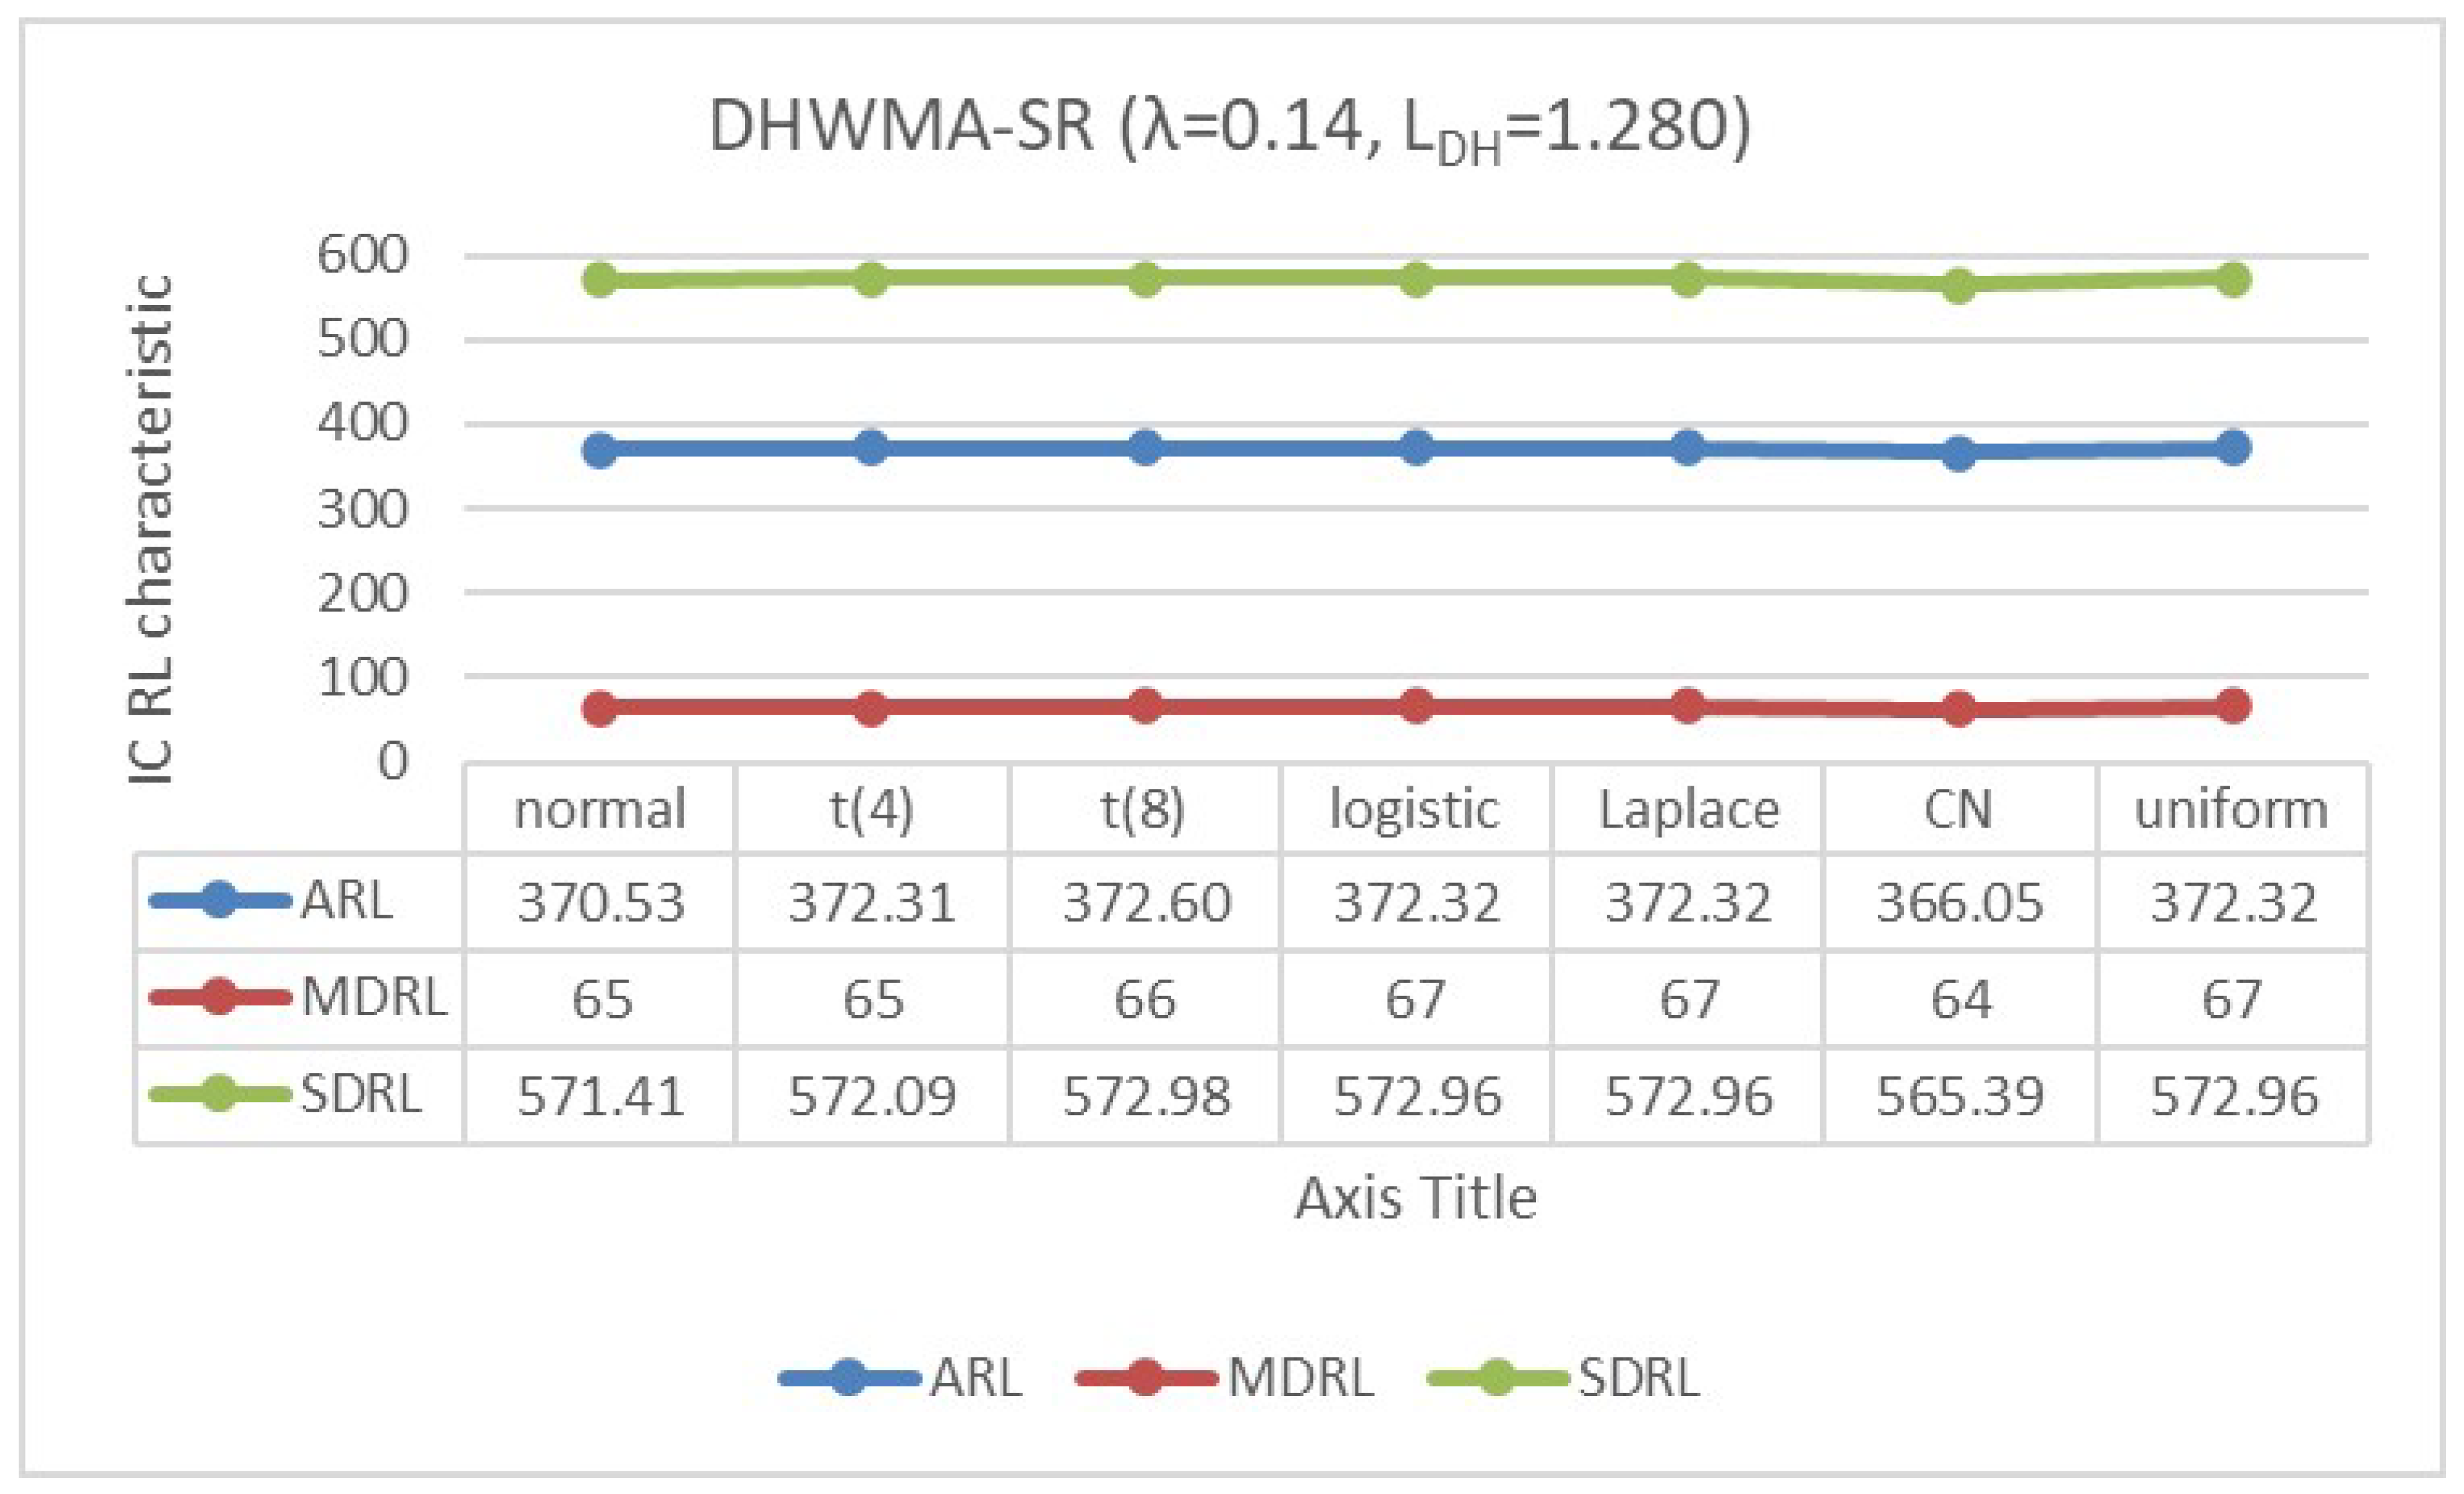
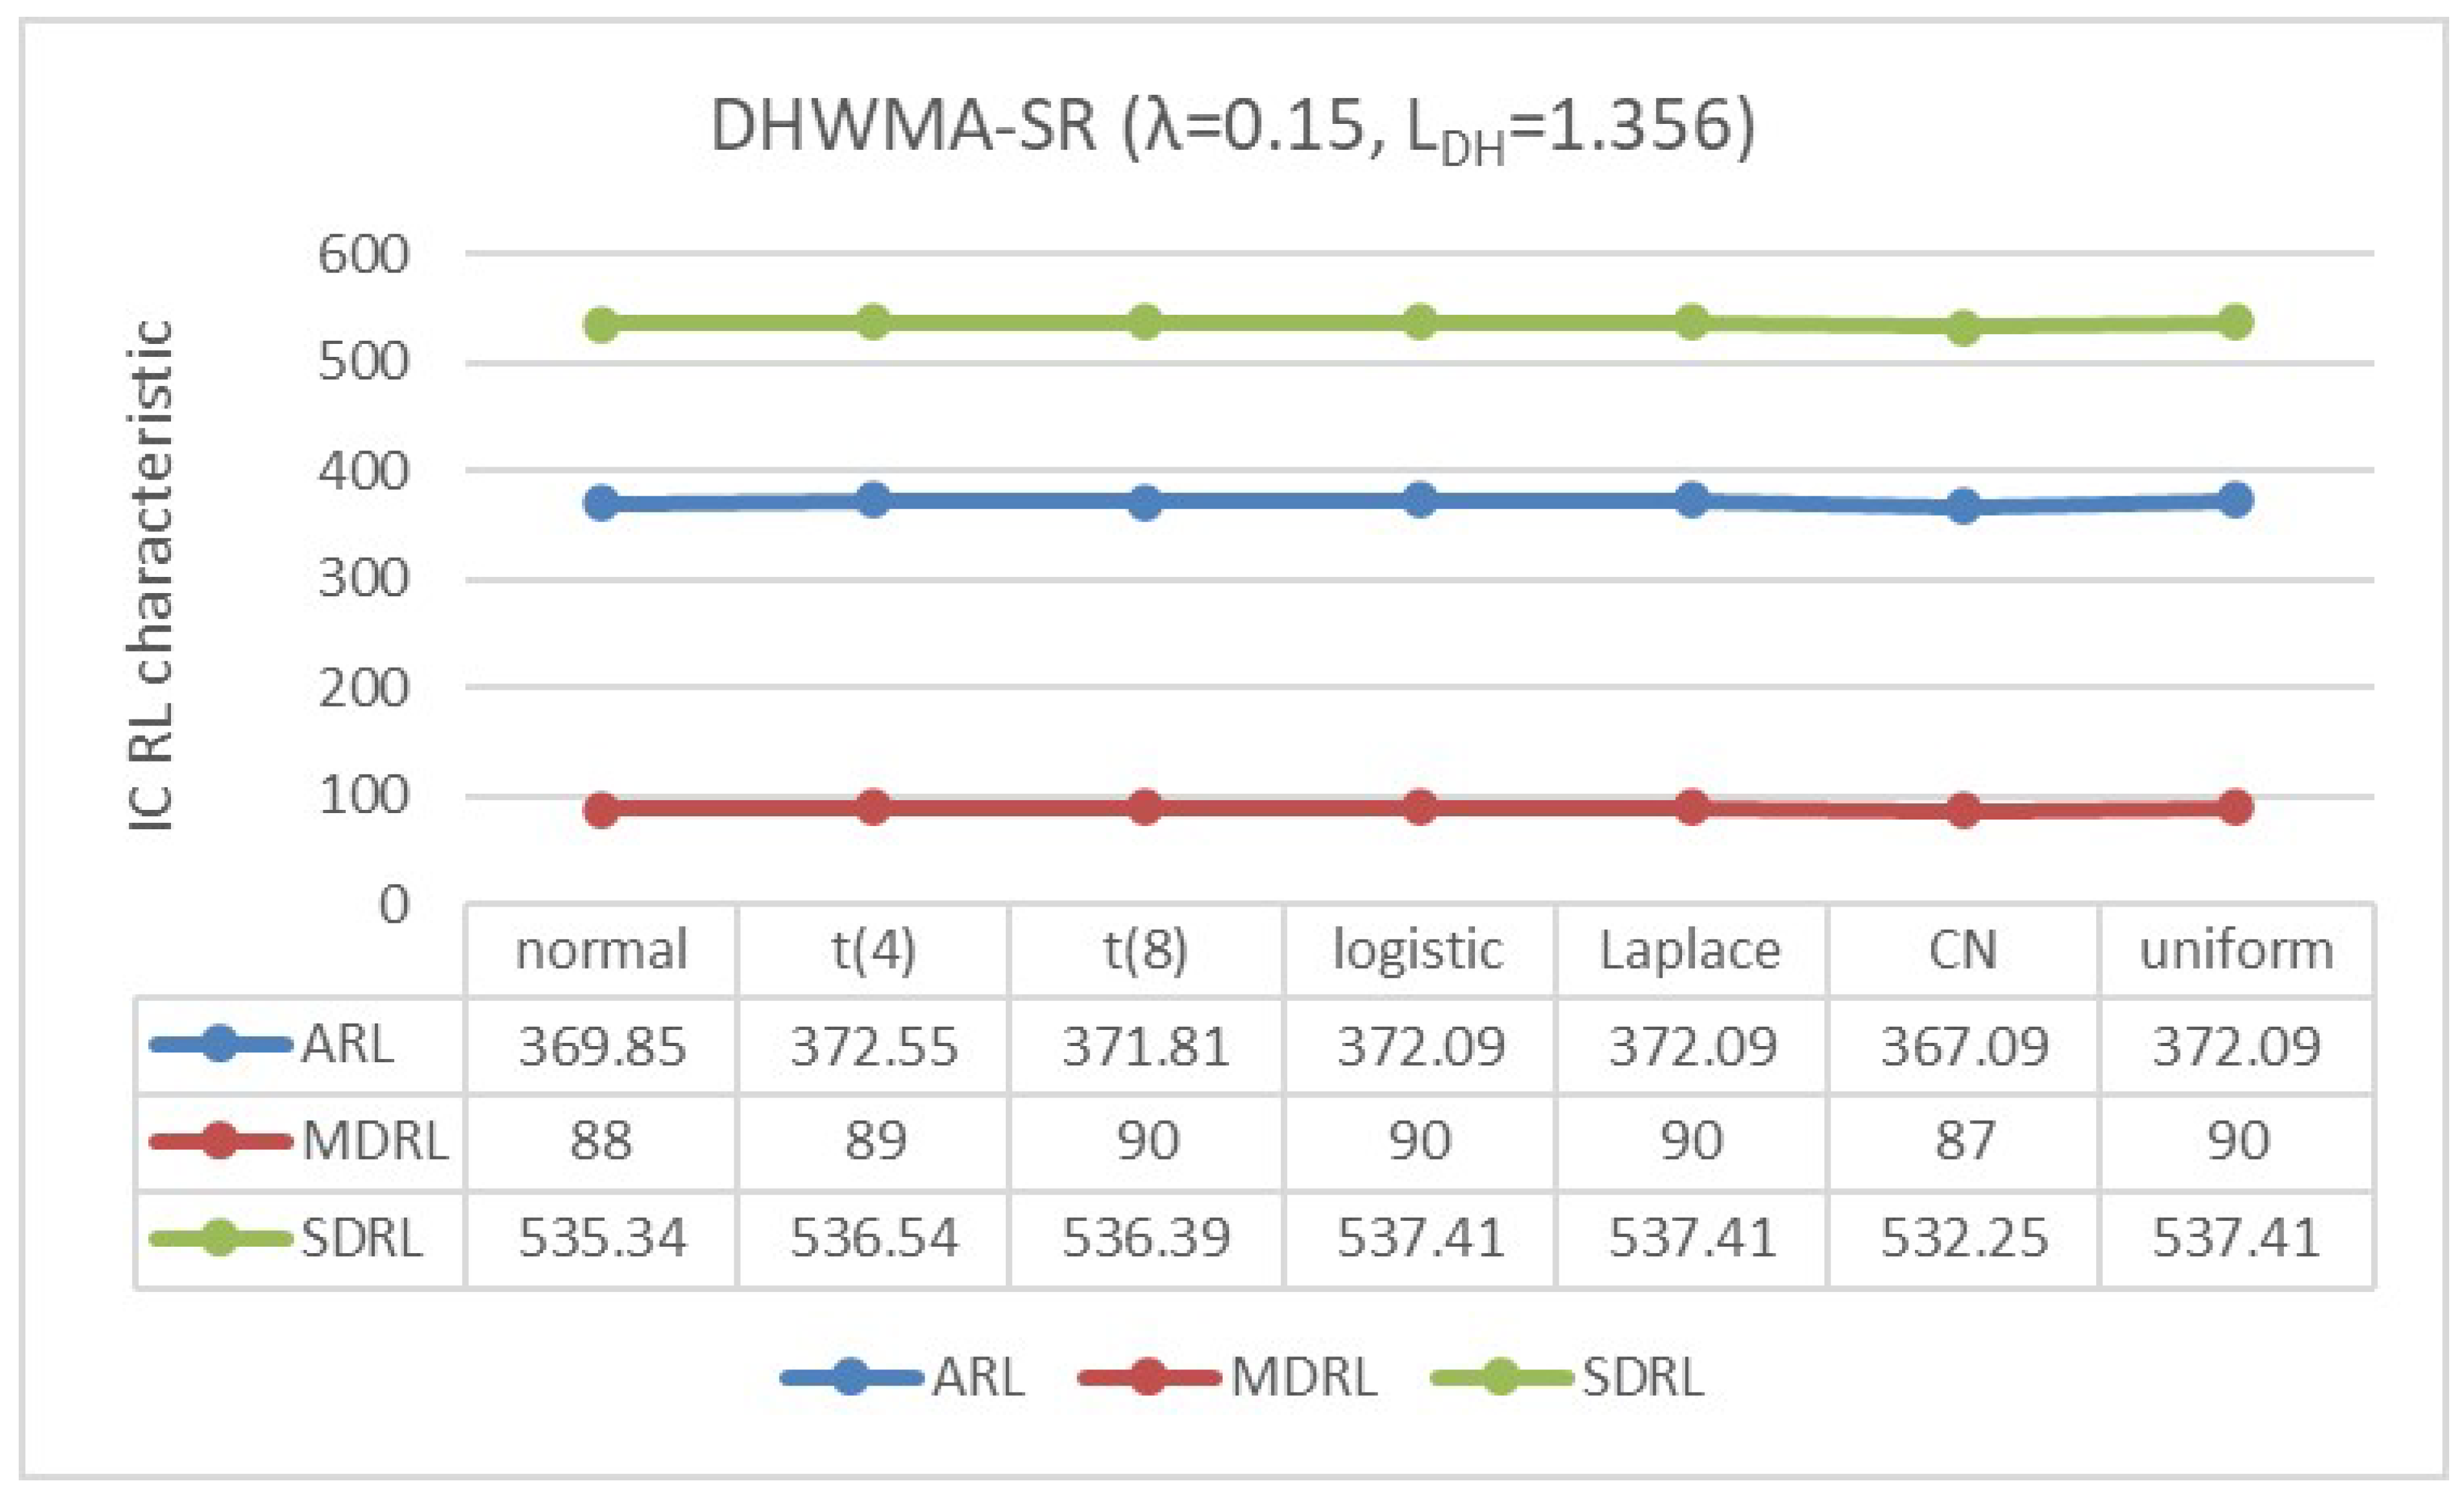
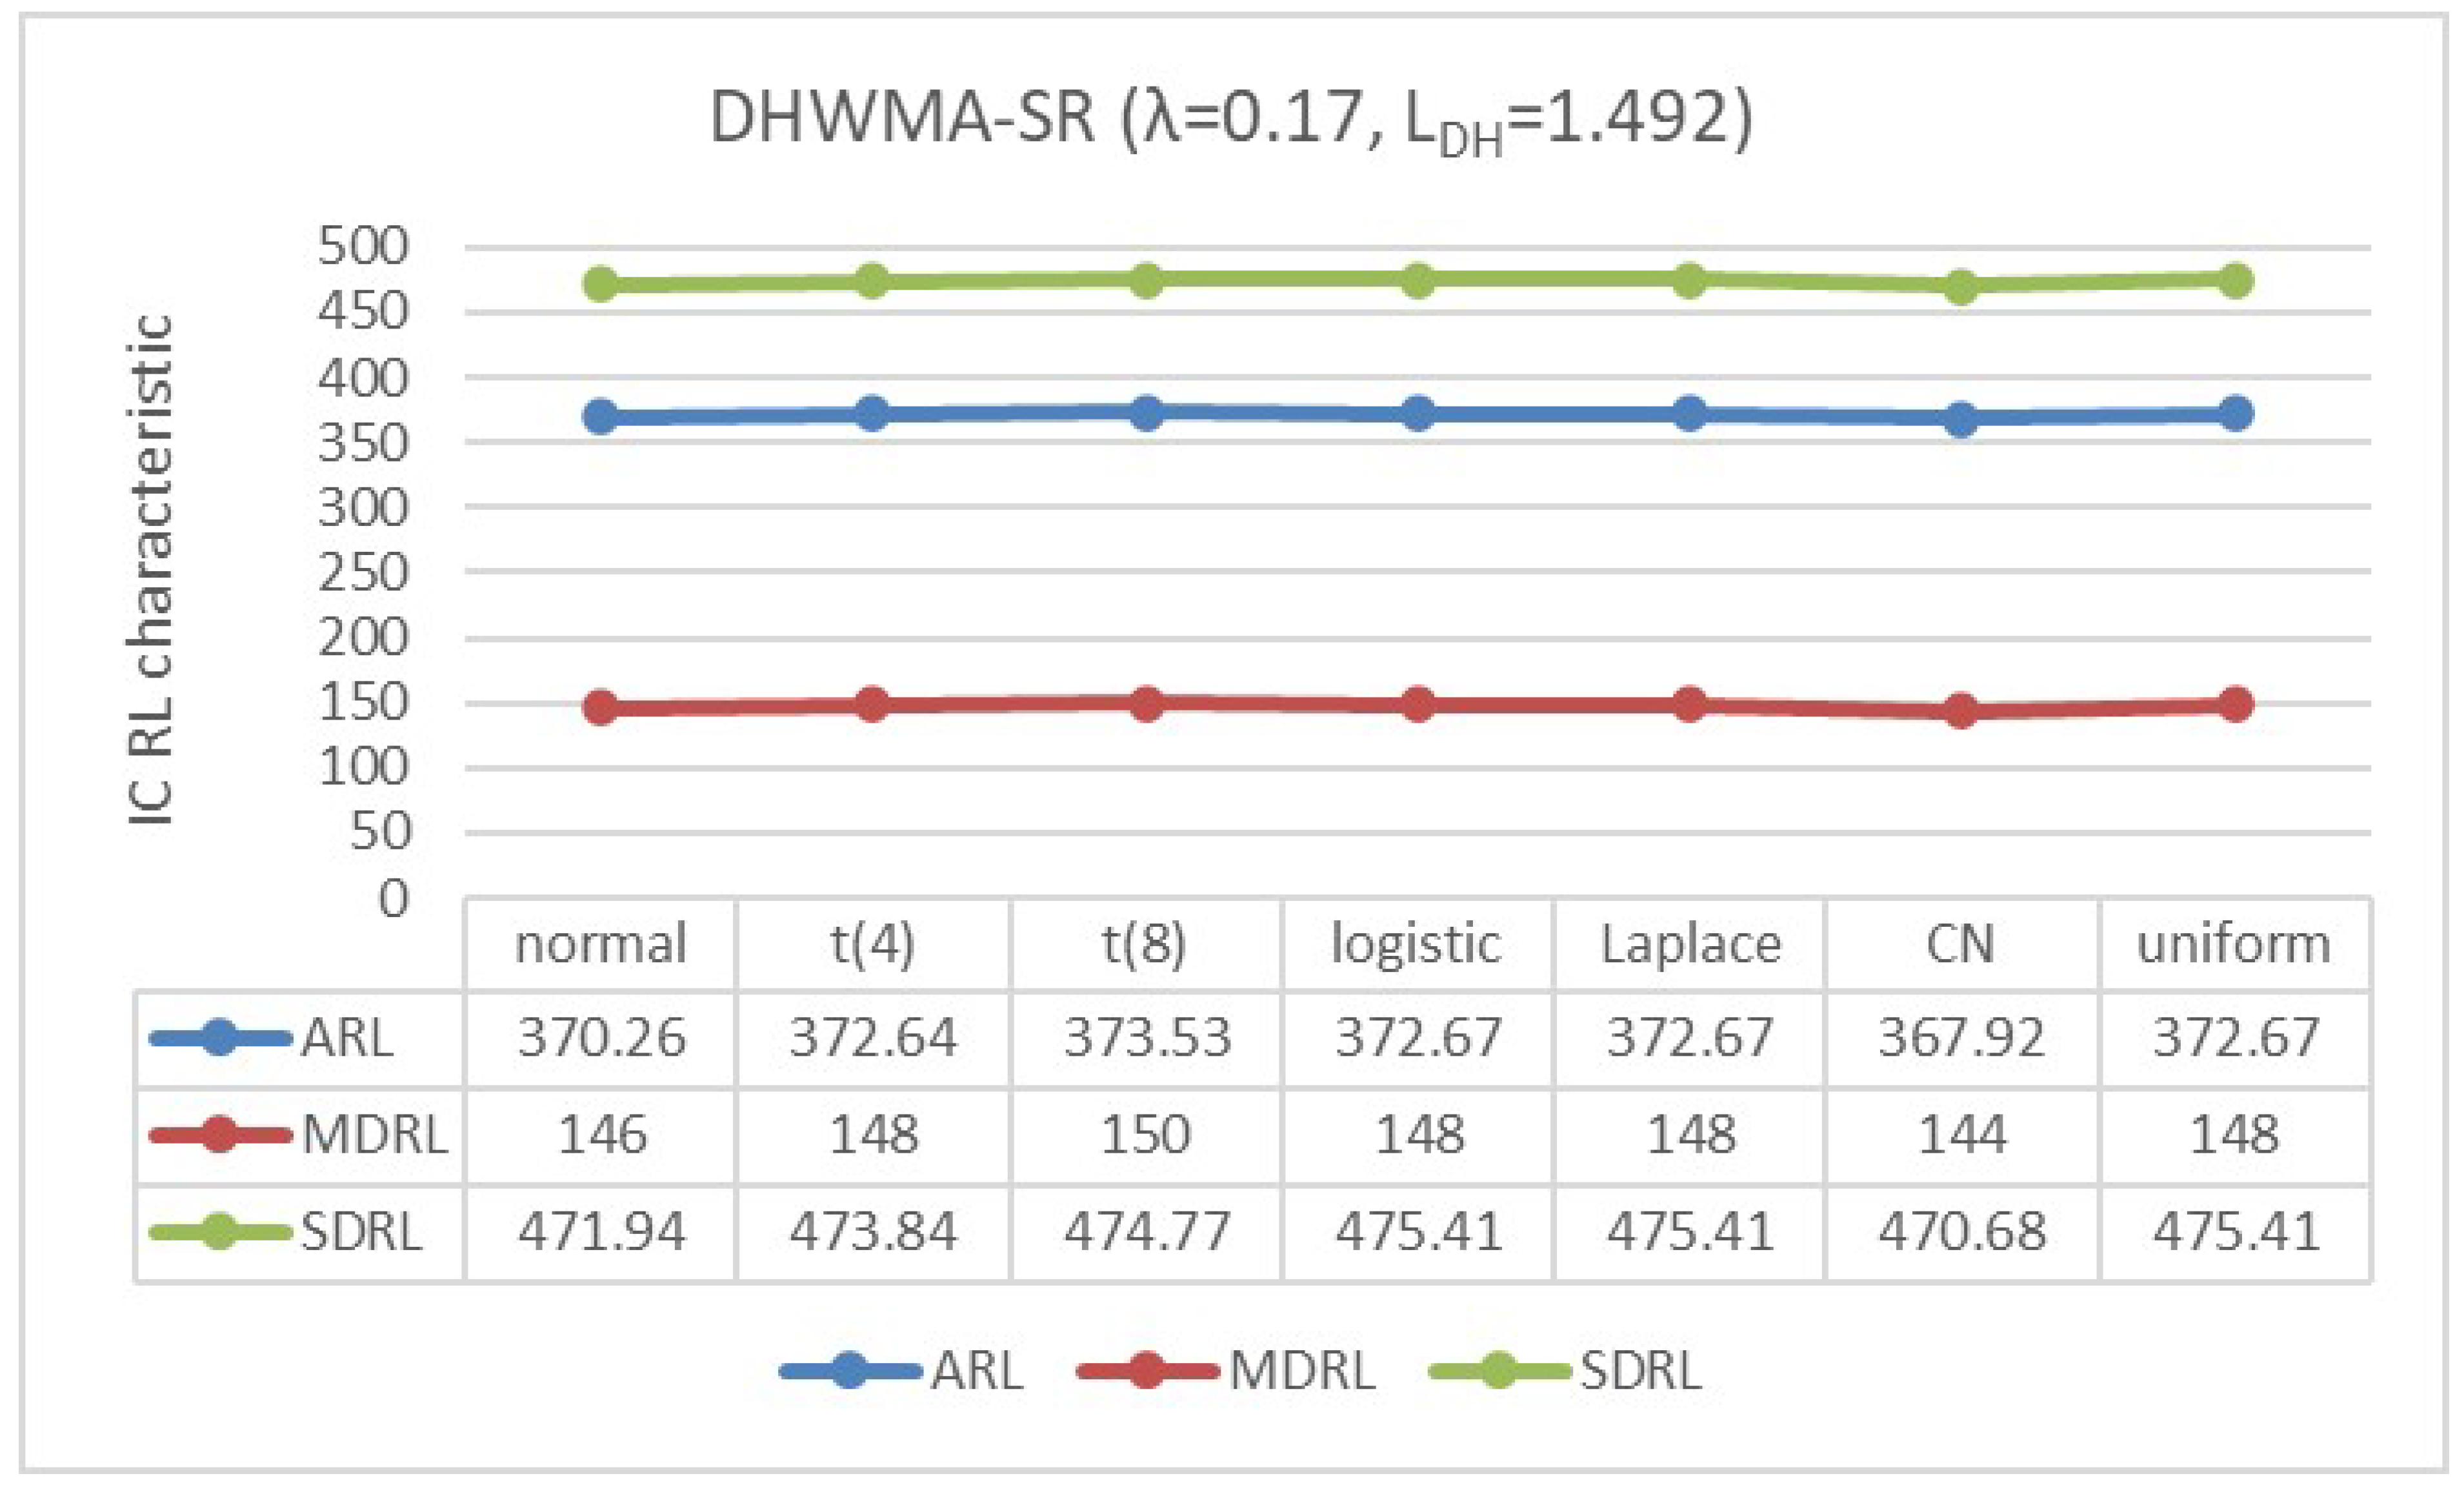
Appendix B. Robustness of the DHWMA-SR Chart When n = 5 and 10 for an ARL0 ≈370 Under Different Symmetric Distributions


References
- Shewhart, W.A. Quality control charts. Bell Syst. Tech. J. 1926, 5, 593–603. [Google Scholar] [CrossRef]
- Page, E.S. Continuous inspection schemes. Biometrika 1954, 41, 100–115. [Google Scholar] [CrossRef]
- Roberts, S.W. Control chart tests based on geometric moving averages. Technometrics 1959, 1, 239–250. [Google Scholar] [CrossRef]
- Chakraborti, S.; Graham, M.A. Nonparametric Statistical Process Control; John Wiley & Sons Ltd.: Hoboken, NJ, USA, 2019. [Google Scholar]
- Chakraborti, S.; Graham, M.A. Nonparametric (distribution-free) control charts: An updated overview and some results. Qual. Eng. 2019, 31, 523–544. [Google Scholar] [CrossRef]
- Raza, M.A.; Nawaz, T.; Aslam, M.; Bhatti, S.H.; Sherwani, R.A.K. A new nonparametric double exponentially weighted moving average control chart. Qual. Reliab. Eng. Int. 2020, 36, 68–87. [Google Scholar] [CrossRef]
- Alevizakos, V.; Chatterjee, K.; Koukouvinos, C. A nonparametric double generally weighted moving average signed-rank control chart for monitoring process location. Qual. Reliab. Eng. Int. 2020, 36, 2441–2458. [Google Scholar] [CrossRef]
- Raza, M.A.; Nawaz, T.; Han, D. On designing distribution-free homogeneously weighted moving average control charts. J. Test. Eval. 2020, 48, 3154–3171. [Google Scholar] [CrossRef]
- Perdikis, T.; Psarakis, S.; Castagliola, P.; Celano, G. An EWMA-type chart based on signed ranks with exact run length properties. J. Stat. Comput. Simul. 2021, 91, 732–751. [Google Scholar] [CrossRef]
- Perdikis, T.; Psarakis, S.; Castagliola, P.; Maravelakis, P.E. An EWMA signed ranks control chart with reliable run length performances. Qual. Reliab. Eng. Int. 2021, 37, 1266–1284. [Google Scholar] [CrossRef]
- Alevizakos, V.; Chatterjee, K.; Koukouvinos, C. Nonparametric triple exponentially weighted moving average signed-rank control chart for monitoring shifts in the process location. Qual. Reliab. Eng. Int. 2021, 37, 2622–2645. [Google Scholar] [CrossRef]
- Tang, A.; Ma, Y.; Hu, X.; Huang, W. The exact statistical properties of a signed-rank-based adaptive exponential weighted moving average chart. Qual. Reliab. Eng. Int. 2022, 38, 2781–2794. [Google Scholar] [CrossRef]
- Castagliola, P.; Tran, K.P.; Celano, G.; Rakitzis, A.C.; Maravelakis, P.E. An EWMA-type sign chart with exact run length properties. J. Qual. Technol. 2019, 51, 51–63. [Google Scholar] [CrossRef]
- Tang, A.; Sun, J.; Hu, X.; Castagliola, P. A new nonparametric adaptive EWMA control chart with exact run length properties. Comput. Ind. Eng. 2019, 130, 404–419. [Google Scholar] [CrossRef]
- Alevizakos, V.; Chatterjee, K.; Koukouvinos, C. A nonparametric triple exponentially weighted moving average sign control chart. Qual. Reliab. Eng. Int. 2021, 37, 1504–1523. [Google Scholar] [CrossRef]
- Qiu, P. Introduction to Statistical Process Control; CRC Press: Boca Raton, FL, USA, 2014. [Google Scholar] [CrossRef]
- Koutras, M.V.; Triantafyllou, I.S. Distribution-Free Methods for Statistical Process Monitoring and Control; Springer: Cham, Switzerland, 2020. [Google Scholar] [CrossRef]
- Triantafyllou, I.S.; Ram, M. Nonparametric EWMA-type control charts for monitoring industrial processes: An overview. Int. J. Math. Eng. Manag. Sci. 2021, 6, 708–751. [Google Scholar] [CrossRef]
- Qiu, P. Some perspectives on nonparametric statistical process control. J. Qual. Technol. 2018, 50, 49–65. [Google Scholar] [CrossRef]
- Abid, M.; Shabbir, A.; Nazir, H.Z.; Sherwani, R.A.K.; Riaz, M. A double homogeneously weighted moving average control chart for monitoring of the process mean. Qual. Reliab. Eng. Int. 2020, 36, 1513–1527. [Google Scholar] [CrossRef]
- Riaz, M.; Abbas, Z.; Nazir, H.Z.; Abid, M. On the development of triple homogeneously weighted moving average control chart. Symmetry 2021, 13, 360. [Google Scholar] [CrossRef]
- Alevizakos, V.; Chatterjee, K.; Koukouvinos, C. The extended homogeneously weighted moving average control chart. Qual. Reliab. Eng. Int. 2021, 37, 2134–2155. [Google Scholar] [CrossRef]
- Knoth, S.; Tercero-Gómez, V.G.; Khakifirooz, M.; Woodall, W.H. The impracticality of homogeneously weighted moving average and progressive mean control chart approaches. Qual. Reliab. Eng. Int. 2021, 37, 3779–3794. [Google Scholar] [CrossRef]
- Riaz, M.; Adid, M.; Shabbir, A.; Nazir, H.Z.; Abbas, Z.; Abbasi, S.A. A non-parametric double homogeneously weighted moving average control chart under sign statistic. Qual. Reliab. Eng. Int. 2021, 37, 1544–1560. [Google Scholar] [CrossRef]
- Zhang, H.; Rasheed, Z.; Khan, M.; Namangale, J.J.; Anwar, S.M.; Hamid, A. A distribution-free THWMA control chart under ranked set sampling. Math. Probl. Eng. 2022, 6, 3823013. [Google Scholar] [CrossRef]
- Abbas, N. Homogeneously weighted moving average control chart with an application in substrate manufacturing process. Comput. Ind. Eng. 2018, 120, 460–470. [Google Scholar] [CrossRef]
- Adeoti, O.A.; Koleoso, S.O. A hybrid homogeneously weighted moving average control chart for process monitoring. Qual. Reliab. Eng. Int. 2021, 36, 2170–2186. [Google Scholar] [CrossRef]
- Malela-Majika, J.-C.; Shongwe, S.C.; Adeoti, O.A. A hybrid homogeneously weighted moving average control chart for process monitoring: Discussion. Qual. Reliab. Eng. Int. 2021, 37, 3314–3322. [Google Scholar] [CrossRef]
- Letshedi, T.I.; Malela-Majika, J.-C.; Shongwe, S.C. New extended distribution free homogeneously weighted monitoring schemes for monitoring abrupt shifts in the location parameter. PLoS ONE 2022, 17, e0261217. [Google Scholar] [CrossRef]
- Alevizakos, V.; Chatterjee, K.; Koukouvinos, C. An extended nonparametric homogeneously weighted moving average sign control chart. Qual. Reliab. Eng. Int. 2021, 37, 3395–3416. [Google Scholar] [CrossRef]
- Bennett, B. On the non-null distribution of Wilcoxon’s signed rank test. Metrika 1972, 19, 36–38. [Google Scholar] [CrossRef]
- Montgomery, D.C. Introduction to Statistical Quality Control, 8th ed.; John Wiley & Sons: Hoboken, NJ, USA, 2020. [Google Scholar]
- Chan, L.K.; Zhang, J. Some issues in the design of EWMA charts. Commun. Stat. Simul. Comput. 2020, 29, 201–217. [Google Scholar] [CrossRef]
- Riaz, M.; Ahmad, S.; Mahmoood, T.; Abbas, N. On reassessment of the HWMA chart for process monitoring. Processes 2022, 10, 1129. [Google Scholar] [CrossRef]
- Riaz, M.; Khaliq, Q.U.A.; Gul, S. Mixed Tukey EWMA-CUSUM control chart and its applications. Qual Technol Quant Manag 2017, 14, 378–411. [Google Scholar] [CrossRef]
- Alevizakos, V.; Chatterjee, K.; Koukouvinos, C. On the performance and comparison of various memory-type control charts. Commun. Stat. Simul. Comput. 2025, 54, 2089–2109. [Google Scholar] [CrossRef]


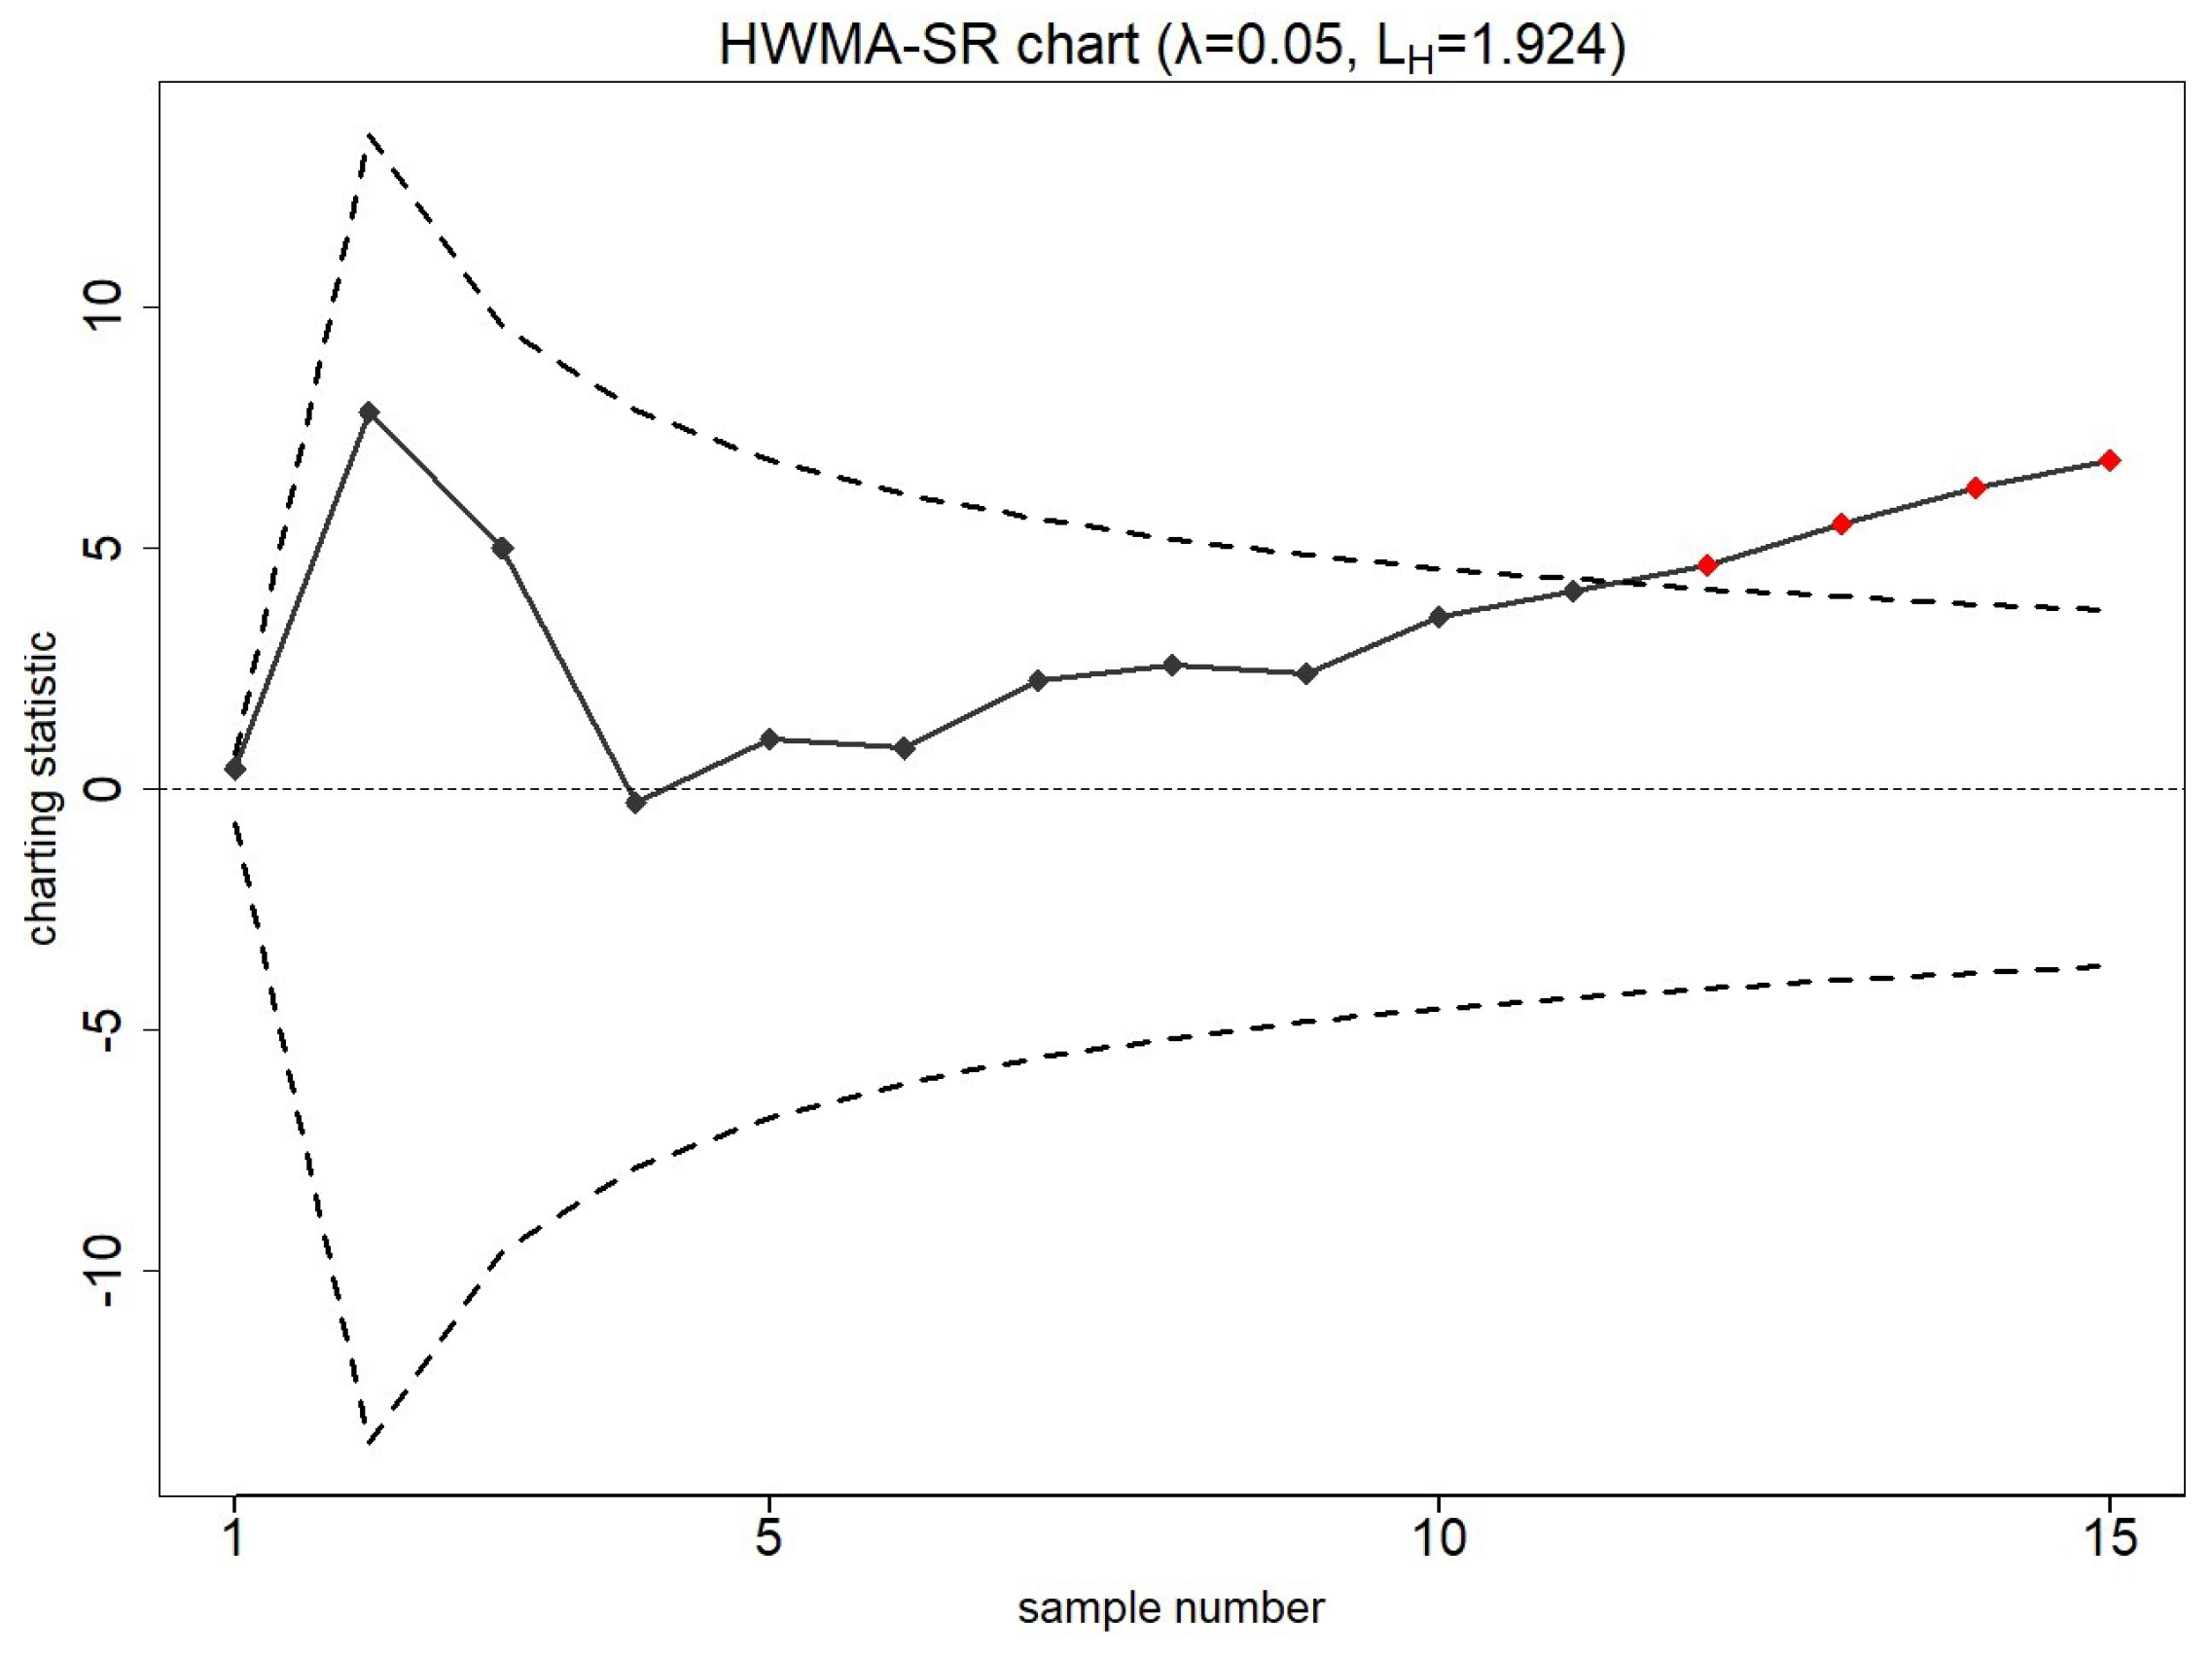
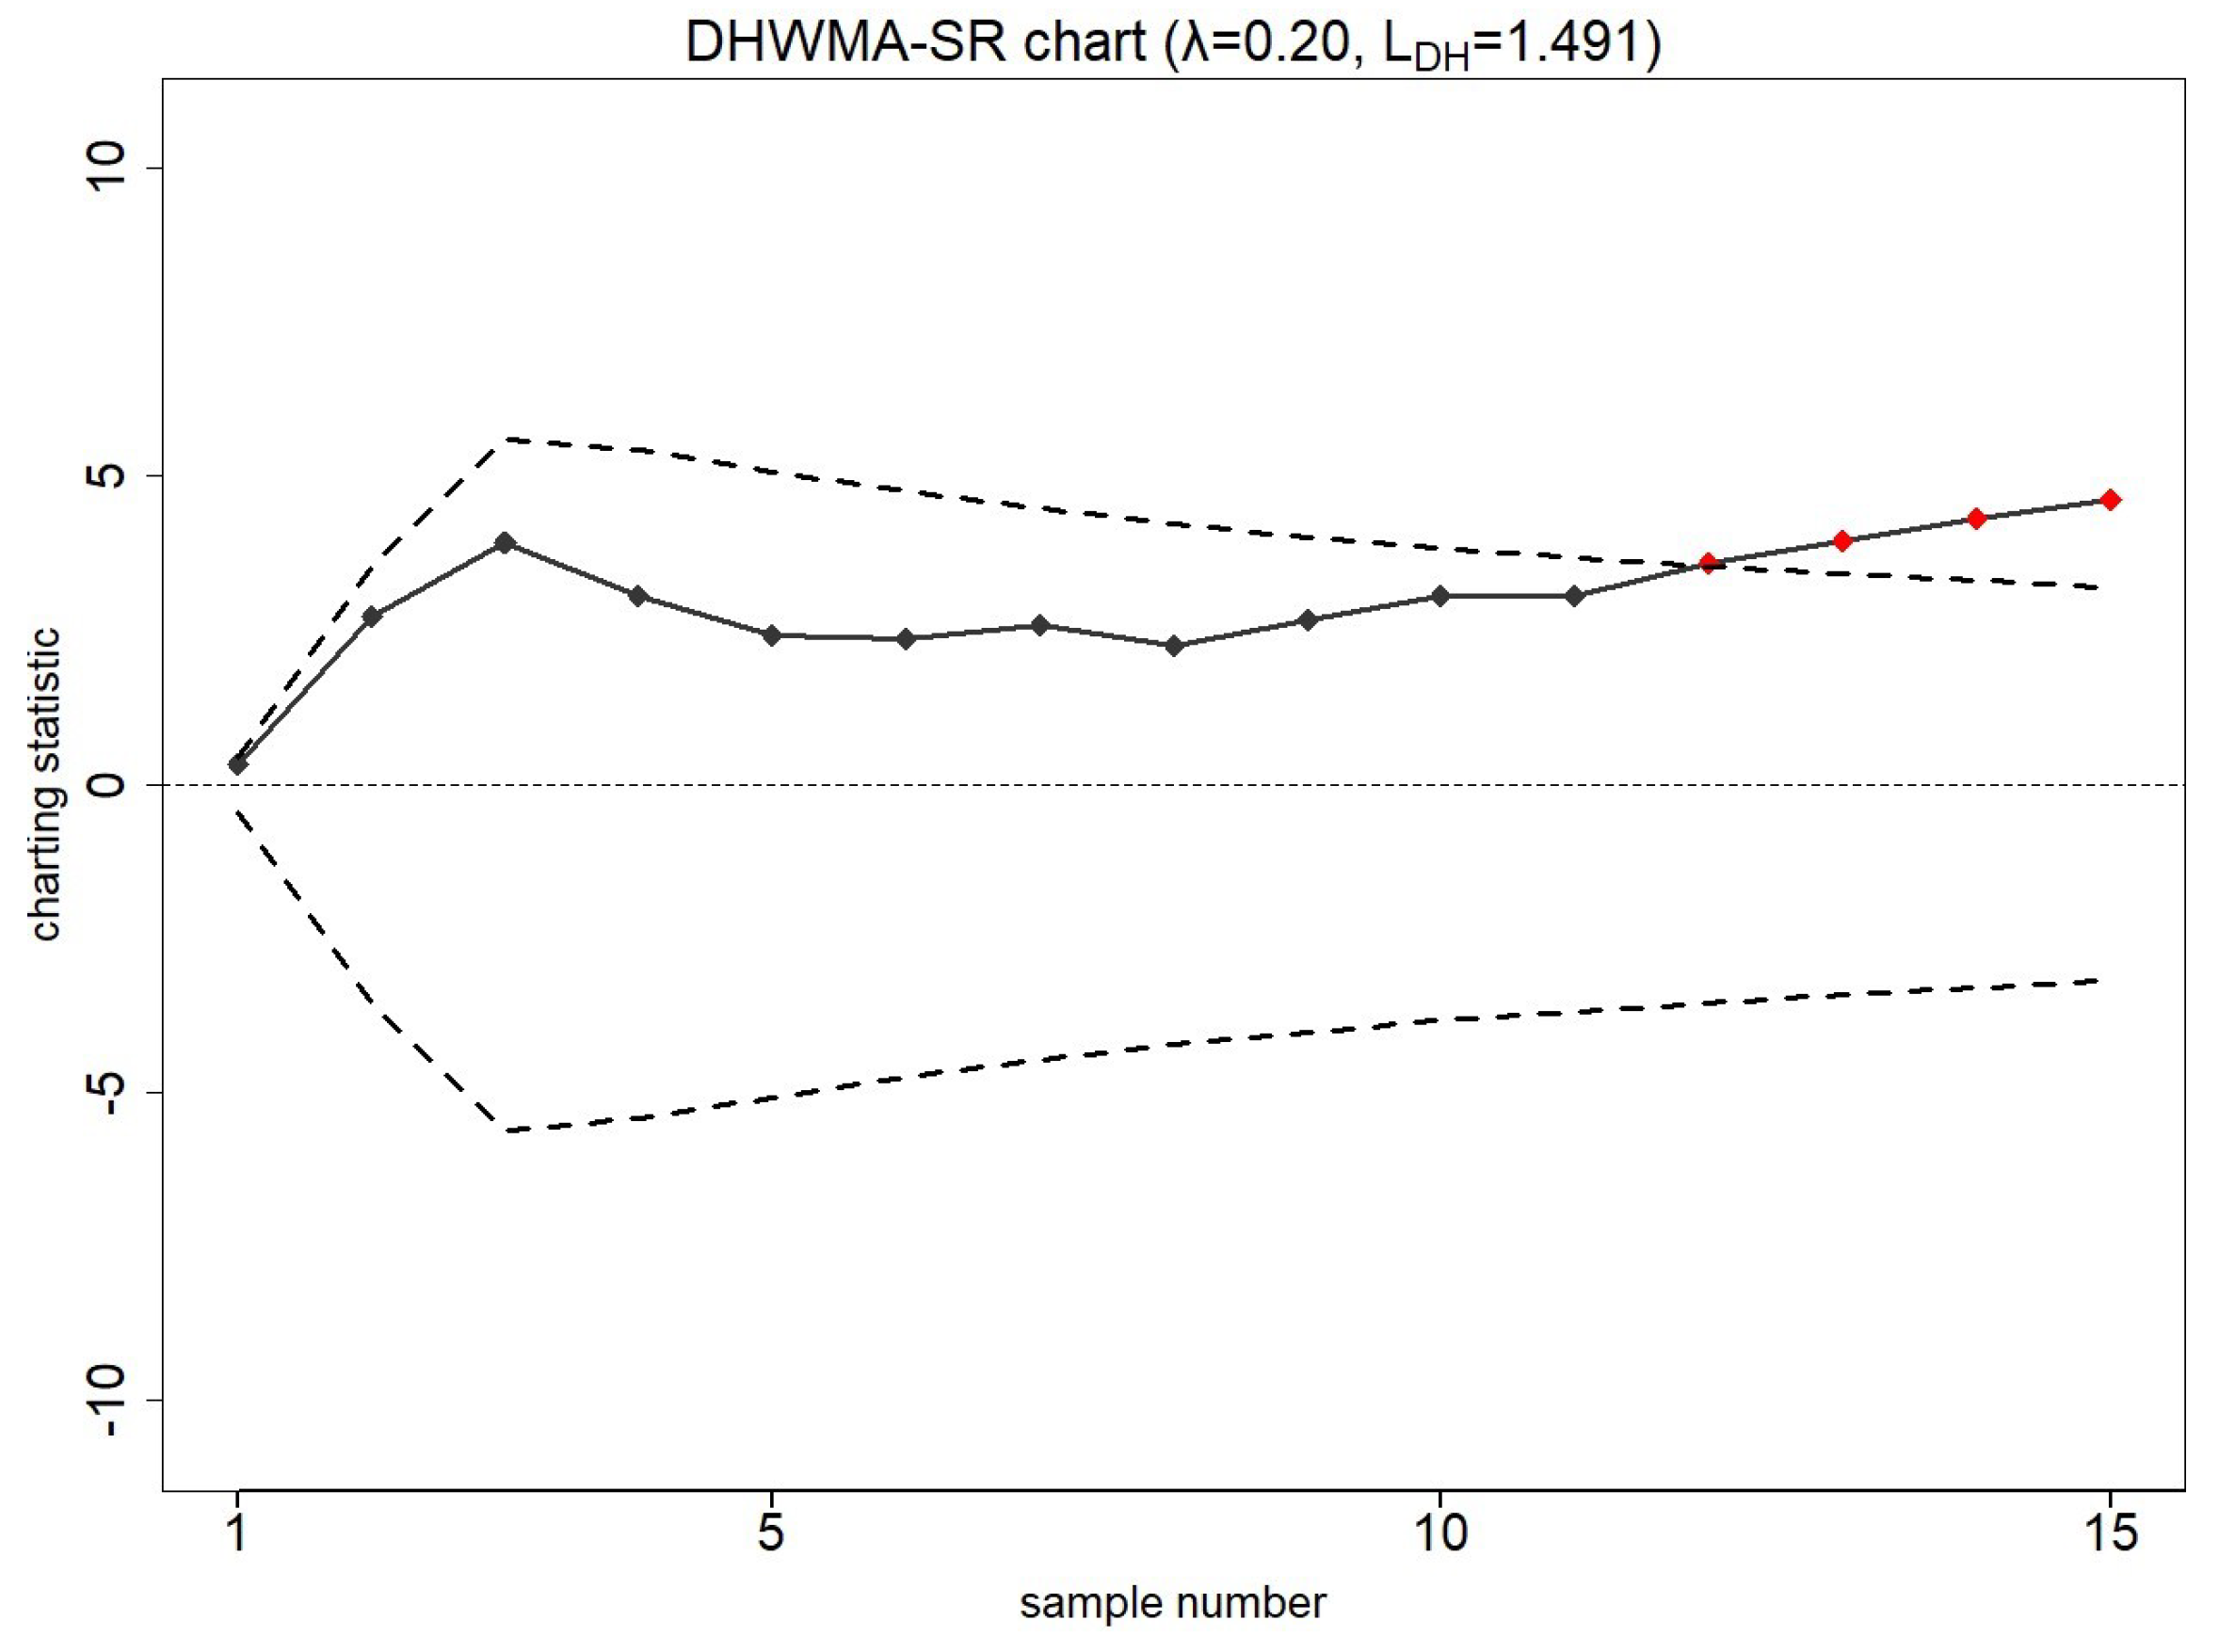
| ARL0 | ARL0 | ||||||||||
|---|---|---|---|---|---|---|---|---|---|---|---|
| 200 | 300 | 370 | 500 | 200 | 300 | 370 | 500 | ||||
| 5 | 0.10 | 0.897 | 0.955 | 1.000 | 1.067 | 10 | 0.10 | 0.931 | 1.023 | 1.071 | 1.153 |
| 0.14 | 1.135 | 1.221 | 1.280 | 1.368 | 0.14 | 1.195 | 1.324 | 1.395 | 1.506 | ||
| 0.15 | 1.204 | 1.293 | 1.356 | 1.448 | 0.15 | 1.269 | 1.403 | 1.479 | 1.598 | ||
| 0.17 | 1.310 | 1.437 | 1.492 | 1.583 | 0.17 | 1.404 | 1.567 | 1.650 | 1.782 | ||
| 0.20 | 1.491 | 1.622 | 1.688 | 1.766 | 0.20 | 1.617 | 1.795 | 1.890 | 2.033 | ||
| 0.25 | 1.756 | 1.867 | 1.915 | 1.971 | 0.25 | 1.944 | 2.134 | 2.229 | 2.363 | ||
| 0.30 | 1.939 | 2.007 | 2.027 | 2.052 | 0.30 | 2.199 | 2.369 | 2.451 | 2.555 | ||
| 15 | 0.10 | 0.941 | 1.035 | 1.085 | 1.173 | 20 | 0.10 | 0.948 | 1.043 | 1.094 | 1.178 |
| 0.14 | 1.207 | 1.342 | 1.420 | 1.534 | 0.14 | 1.216 | 1.352 | 1.432 | 1.553 | ||
| 0.15 | 1.279 | 1.422 | 1.504 | 1.631 | 0.15 | 1.285 | 1.435 | 1.521 | 1.650 | ||
| 0.17 | 1.419 | 1.590 | 1.679 | 1.820 | 0.17 | 1.431 | 1.603 | 1.700 | 1.843 | ||
| 0.20 | 1.641 | 1.831 | 1.936 | 2.090 | 0.20 | 2.652 | 1.850 | 1.958 | 2.118 | ||
| 0.25 | 1.980 | 2.185 | 2.296 | 2.442 | 0.25 | 1.998 | 2.212 | 2.325 | 2.481 | ||
| 0.30 | 2.243 | 2.438 | 2.531 | 2.654 | 0.30 | 2.269 | 2.470 | 2.570 | 2.699 | ||
| Distribution | Characteristic | 0 | 0.05 | 0.10 | 0.25 | 0.50 | 0.75 | 1.00 | 1.25 | 1.50 | ||
|---|---|---|---|---|---|---|---|---|---|---|---|---|
| 0.10 | 1.000 | ARL | 370.56 | 91.48 | 35.62 | 9.13 | 3.37 | 1.95 | 1.36 | 1.12 | 1.03 | |
| MDRL | 9 | 8 | 7 | 4 | 1 | 1 | 1 | 1 | 1 | |||
| SDRL | 850.96 | 179.61 | 60.58 | 12.16 | 3.53 | 1.78 | 1.02 | 0.55 | 0.27 | |||
| ARL | 376.39 | 69.10 | 26.26 | 6.81 | 2.67 | 1.66 | 1.28 | 1.13 | 1.06 | |||
| MDRL | 10 | 8 | 7 | 4 | 1 | 1 | 1 | 1 | 1 | |||
| SDRL | 856.20 | 129.31 | 42.47 | 8.44 | 2.63 | 1.41 | 0.85 | 0.54 | 0.36 | |||
| ARL | 371.82 | 82.46 | 32.05 | 8.28 | 3.14 | 1.85 | 1.34 | 1.13 | 1.05 | |||
| MDRL | 9 | 8 | 7 | 4 | 1 | 1 | 1 | 1 | 1 | |||
| SDRL | 852.12 | 159.24 | 53.73 | 10.81 | 3.21 | 1.65 | 0.95 | 0.56 | 0.33 | |||
| ARL | 371.14 | 80.66 | 31.58 | 8.14 | 3.08 | 1.84 | 1.34 | 1.13 | 1.05 | |||
| MDRL | 9 | 8 | 7 | 4 | 1 | 1 | 1 | 1 | 1 | |||
| SDRL | 848.03 | 155.58 | 52.77 | 10.55 | 3.17 | 1.64 | 0.96 | 0.56 | 0.33 | |||
| ARL | 374.27 | 60.82 | 23.18 | 6.40 | 2.69 | 1.73 | 1.33 | 1.15 | 1.07 | |||
| MDRL | 10 | 8 | 6 | 4 | 1 | 1 | 1 | 1 | 1 | |||
| SDRL | 858.95 | 110.50 | 36.85 | 7.71 | 2.61 | 1.47 | 0.93 | 0.59 | 0.39 | |||
| ARL | 371.33 | 88.43 | 34.20 | 8.76 | 3.25 | 1.88 | 1.32 | 1.10 | 1.03 | |||
| MDRL | 9 | 9 | 7 | 4 | 1 | 1 | 1 | 1 | 1 | |||
| SDRL | 852.31 | 170.91 | 58.14 | 11.57 | 3.36 | 1.70 | 0.94 | 0.50 | 0.25 | |||
| ARL | 371.14 | 97.62 | 39.40 | 10.44 | 3.85 | 2.21 | 1.48 | 1.14 | 1.01 | |||
| MDRL | 9 | 9 | 7 | 4 | 1 | 1 | 1 | 1 | 1 | |||
| SDRL | 848.03 | 193.14 | 68.72 | 14.51 | 4.31 | 2.16 | 1.23 | 0.62 | 0.19 | |||
| 0.14 | 1.280 | ARL | 370.53 | 127.75 | 52.40 | 12.87 | 4.35 | 2.39 | 1.60 | 1.25 | 1.09 | |
| MDRL | 65 | 41 | 23 | 7 | 3 | 1 | 1 | 1 | 1 | |||
| SDRL | 571.41 | 187.26 | 69.99 | 14.73 | 4.16 | 2.05 | 1.21 | 0.73 | 0.41 | |||
| ARL | 372.31 | 98.82 | 38.19 | 9.21 | 3.31 | 1.96 | 1.45 | 1.23 | 1.12 | |||
| MDRL | 65 | 36 | 18 | 6 | 2 | 1 | 1 | 1 | 1 | |||
| SDRL | 572.09 | 140.50 | 49.38 | 10.00 | 3.03 | 1.63 | 1.04 | 0.72 | 0.52 | |||
| ARL | 372.60 | 116.32 | 46.46 | 11.32 | 3.91 | 2.22 | 1.55 | 1.25 | 1.11 | |||
| MDRL | 66 | 39 | 21 | 7 | 3 | 1 | 1 | 1 | 1 | |||
| SDRL | 572.98 | 169.02 | 61.60 | 12.69 | 3.66 | 1.90 | 1.17 | 0.75 | 0.49 | |||
| ARL | 372.32 | 117.18 | 46.21 | 11.32 | 3.92 | 2.22 | 1.56 | 1.25 | 1.11 | |||
| MDRL | 67 | 40 | 21 | 7 | 3 | 1 | 1 | 1 | 1 | |||
| SDRL | 572.96 | 169.10 | 60.91 | 12.59 | 3.66 | 1.88 | 1.16 | 0.75 | 0.48 | |||
| ARL | 372.32 | 87.54 | 33.71 | 8.59 | 3.32 | 2.05 | 1.52 | 1.26 | 1.14 | |||
| MDRL | 67 | 33 | 16 | 5 | 2 | 1 | 1 | 1 | 1 | |||
| SDRL | 572.96 | 121.85 | 42.89 | 9.15 | 3.02 | 1.71 | 1.13 | 0.78 | 0.55 | |||
| ARL | 366.05 | 124.46 | 50.14 | 12.14 | 4.12 | 2.28 | 1.55 | 1.22 | 1.08 | |||
| MDRL | 64 | 41 | 22 | 7 | 3 | 1 | 1 | 1 | 1 | |||
| SDRL | 565.39 | 180.90 | 66.80 | 13.72 | 3.89 | 1.95 | 1.15 | 0.67 | 0.37 | |||
| ARL | 372.32 | 139.37 | 58.13 | 14.85 | 5.11 | 2.77 | 1.78 | 1.28 | 1.05 | |||
| MDRL | 67 | 44 | 24 | 8 | 4 | 2 | 1 | 1 | 1 | |||
| SDRL | 572.96 | 205.38 | 78.34 | 17.30 | 5.06 | 2.47 | 1.43 | 0.78 | 0.30 | |||
| 0.15 | 1.356 | ARL | 369.85 | 134.33 | 55.66 | 13.64 | 4.56 | 2.49 | 1.65 | 1.27 | 1.10 | |
| MDRL | 88 | 51 | 27 | 8 | 3 | 1 | 1 | 1 | 1 | |||
| SDRL | 535.34 | 187.12 | 71.12 | 15.18 | 4.29 | 2.13 | 1.27 | 0.77 | 0.43 | |||
| ARL | 372.55 | 104.13 | 40.59 | 9.73 | 3.45 | 2.02 | 1.48 | 1.24 | 1.12 | |||
| MDRL | 89 | 44 | 21 | 6 | 2 | 1 | 1 | 1 | 1 | |||
| SDRL | 536.54 | 141.08 | 50.33 | 10.32 | 3.12 | 1.69 | 1.08 | 0.74 | 0.53 | |||
| ARL | 371.81 | 122.31 | 49.36 | 11.97 | 4.09 | 2.30 | 1.59 | 1.26 | 1.12 | |||
| MDRL | 90 | 48 | 24 | 7 | 3 | 1 | 1 | 1 | 1 | |||
| SDRL | 536.39 | 169.13 | 62.79 | 13.10 | 3.78 | 1.96 | 1.22 | 0.78 | 0.50 | |||
| ARL | 372.09 | 123.46 | 49.16 | 11.97 | 4.10 | 2.30 | 1.59 | 1.26 | 1.11 | |||
| MDRL | 90 | 49 | 25 | 7 | 3 | 1 | 1 | 1 | 1 | |||
| SDRL | 537.41 | 169.68 | 62.09 | 12.99 | 3.78 | 1.95 | 1.21 | 0.78 | 0.49 | |||
| ARL | 372.09 | 92.54 | 35.83 | 9.05 | 3.46 | 2.11 | 1.55 | 1.28 | 1.14 | |||
| MDRL | 90 | 41 | 19 | 6 | 2 | 1 | 1 | 1 | 1 | |||
| SDRL | 537.41 | 123.01 | 43.83 | 9.45 | 3.11 | 1.77 | 1.17 | 0.81 | 0.56 | |||
| ARL | 367.09 | 130.51 | 53.21 | 12.86 | 4.32 | 2.37 | 1.59 | 1.23 | 1.08 | |||
| MDRL | 87 | 50 | 26 | 8 | 3 | 1 | 1 | 1 | 1 | |||
| SDRL | 532.25 | 181.00 | 67.80 | 14.13 | 4.02 | 2.02 | 1.20 | 0.70 | 0.39 | |||
| ARL | 372.09 | 146.55 | 61.67 | 15.75 | 5.39 | 2.92 | 1.86 | 1.31 | 1.06 | |||
| MDRL | 90 | 55 | 29 | 9 | 4 | 2 | 1 | 1 | 1 | |||
| SDRL | 537.41 | 205.34 | 79.47 | 23.00 | 5.22 | 2.56 | 1.50 | 0.83 | 0.31 | |||
| 0.17 | 1.492 | ARL | 370.26 | 146.89 | 62.38 | 15.44 | 5.10 | 2.79 | 1.87 | 1.42 | 1.18 | |
| MDRL | 146 | 76 | 37 | 10 | 4 | 2 | 1 | 1 | 1 | |||
| SDRL | 471.94 | 184.05 | 71.93 | 15.83 | 4.50 | 2.21 | 1.36 | 0.89 | 0.57 | |||
| ARL | 372.64 | 114.50 | 45.69 | 10.98 | 3.83 | 2.24 | 1.63 | 1.34 | 1.18 | |||
| MDRL | 148 | 63 | 28 | 8 | 3 | 1 | 1 | 1 | 1 | |||
| SDRL | 473.84 | 139.61 | 51.29 | 10.84 | 3.26 | 1.76 | 1.17 | 0.84 | 0.62 | |||
| ARL | 373.53 | 134.57 | 55.39 | 13.53 | 4.57 | 2.57 | 1.78 | 1.39 | 1.20 | |||
| MDRL | 150 | 71 | 33 | 9 | 4 | 2 | 1 | 1 | 1 | |||
| SDRL | 474.77 | 166.77 | 63.69 | 13.69 | 3.96 | 2.04 | 1.31 | 0.89 | 0.62 | |||
| ARL | 372.67 | 135.14 | 55.40 | 13.50 | 4.58 | 2.57 | 1.78 | 1.40 | 1.20 | |||
| MDRL | 148 | 72 | 34 | 9 | 4 | 2 | 1 | 1 | 1 | |||
| SDRL | 475.41 | 166.43 | 63.20 | 13.57 | 3.95 | 2.03 | 1.31 | 0.89 | 0.61 | |||
| ARL | 372.67 | 102.46 | 40.36 | 10.15 | 3.82 | 2.33 | 1.71 | 1.39 | 1.21 | |||
| MDRL | 148 | 58 | 26 | 7 | 3 | 1 | 1 | 1 | 1 | |||
| SDRL | 475.41 | 122.54 | 44.82 | 9.89 | 3.25 | 1.85 | 1.26 | 0.91 | 0.66 | |||
| ARL | 367.92 | 143.13 | 59.55 | 14.56 | 4.82 | 2.66 | 1.80 | 1.37 | 1.16 | |||
| MDRL | 144 | 75 | 35 | 10 | 4 | 2 | 1 | 1 | 1 | |||
| SDRL | 470.68 | 178.06 | 68.68 | 14.76 | 4.20 | 2.10 | 1.30 | 0.84 | 0.53 | |||
| ARL | 372.67 | 159.37 | 69.20 | 17.88 | 6.08 | 3.31 | 2.13 | 1.49 | 1.12 | |||
| MDRL | 148 | 81 | 41 | 12 | 5 | 3 | 1 | 1 | 1 | |||
| SDRL | 475.41 | 199.96 | 80.27 | 18.55 | 5.46 | 2.65 | 1.58 | 0.97 | 0.46 | |||
| 0.20 | 1.688 | ARL | 369.35 | 154.45 | 67.33 | 17.12 | 5.60 | 3.01 | 1.97 | 1.46 | 1.20 | |
| MDRL | 192 | 95 | 46 | 12 | 4 | 3 | 1 | 1 | 1 | |||
| SDRL | 431.92 | 177.01 | 71.30 | 16.39 | 4.78 | 2.38 | 1.48 | 0.97 | 0.61 | |||
| ARL | 368.68 | 121.75 | 49.80 | 12.16 | 4.17 | 2.38 | 1.69 | 1.36 | 1.19 | |||
| MDRL | 190 | 78 | 35 | 9 | 4 | 1 | 1 | 1 | 1 | |||
| SDRL | 431.47 | 135.78 | 51.46 | 11.33 | 3.47 | 1.89 | 1.26 | 0.89 | 0.65 | |||
| ARL | 371.03 | 142.12 | 60.06 | 14.99 | 5.00 | 2.76 | 1.86 | 1.43 | 1.21 | |||
| MDRL | 193 | 89 | 41 | 11 | 4 | 2 | 1 | 1 | 1 | |||
| SDRL | 433.32 | 160.94 | 63.39 | 14.20 | 4.21 | 2.19 | 1.41 | 0.96 | 0.65 | |||
| ARL | 370.26 | 142.47 | 60.19 | 14.98 | 5.00 | 2.75 | 1.86 | 1.43 | 1.21 | |||
| MDRL | 192 | 89 | 42 | 11 | 4 | 2 | 1 | 1 | 1 | |||
| SDRL | 433.44 | 160.74 | 63.01 | 14.10 | 4.20 | 2.18 | 1.41 | 0.96 | 0.65 | |||
| ARL | 370.26 | 109.03 | 44.07 | 11.23 | 4.15 | 2.46 | 1.77 | 1.42 | 1.23 | |||
| MDRL | 192 | 71 | 31 | 8 | 4 | 1 | 1 | 1 | 1 | |||
| SDRL | 433.44 | 119.58 | 44.98 | 10.35 | 3.47 | 1.99 | 1.36 | 0.96 | 0.69 | |||
| ARL | 367.29 | 150.32 | 64.60 | 16.17 | 5.28 | 2.86 | 1.89 | 1.41 | 1.17 | |||
| MDRL | 188 | 93 | 44 | 12 | 4 | 2 | 1 | 1 | 1 | |||
| SDRL | 430.40 | 171.00 | 68.38 | 15.35 | 4.45 | 2.56 | 1.41 | 0.90 | 0.56 | |||
| ARL | 370.26 | 167.51 | 74.95 | 19.95 | 6.75 | 3.62 | 2.27 | 1.53 | 1.12 | |||
| MDRL | 192 | 102 | 51 | 15 | 5 | 3 | 1 | 1 | 1 | |||
| SDRL | 433.44 | 192.48 | 79.75 | 19.24 | 5.78 | 2.84 | 1.71 | 1.04 | 0.48 | |||
| 0.25 | 1.915 | ARL | 370.45 | 155.41 | 70.30 | 18.92 | 6.36 | 3.49 | 2.35 | 1.77 | 1.43 | |
| MDRL | 207 | 106 | 53 | 15 | 5 | 3 | 2 | 1 | 1 | |||
| SDRL | 429.72 | 162.85 | 66.38 | 16.00 | 4.78 | 2.37 | 1.51 | 1.08 | 0.78 | |||
| ARL | 369.94 | 123.56 | 52.52 | 13.53 | 4.75 | 2.77 | 2.00 | 1.60 | 1.37 | |||
| MDRL | 204 | 87 | 40 | 11 | 4 | 2 | 1 | 1 | 1 | |||
| SDRL | 429.27 | 125.04 | 48.19 | 11.14 | 3.48 | 1.91 | 1.33 | 1.01 | 0.79 | |||
| ARL | 370.68 | 143.49 | 63.25 | 16.65 | 5.68 | 3.19 | 2.21 | 1.71 | 1.42 | |||
| MDRL | 206 | 99 | 48 | 13 | 5 | 3 | 2 | 1 | 1 | |||
| SDRL | 430.15 | 148.82 | 59.33 | 13.94 | 4.22 | 2.19 | 1.46 | 1.07 | 0.80 | |||
| ARL | 370.80 | 144.03 | 63.25 | 16.59 | 5.68 | 3.20 | 2.22 | 1.71 | 1.42 | |||
| MDRL | 204 | 100 | 48 | 13 | 5 | 3 | 2 | 1 | 1 | |||
| SDRL | 431.87 | 148.19 | 58.98 | 13.84 | 4.21 | 2.18 | 1.46 | 1.07 | 0.80 | |||
| ARL | 370.80 | 111.17 | 46.92 | 12.49 | 4.70 | 2.85 | 2.09 | 1.68 | 1.43 | |||
| MDRL | 204 | 80 | 37 | 10 | 4 | 2 | 1 | 1 | 1 | |||
| SDRL | 431.87 | 110.18 | 42.52 | 10.23 | 3.48 | 2.00 | 1.42 | 1.07 | 0.84 | |||
| ARL | 368.62 | 151.42 | 67.56 | 17.86 | 6.02 | 3.33 | 2.26 | 1.71 | 1.39 | |||
| MDRL | 203 | 104 | 51 | 14 | 5 | 3 | 2 | 1 | 1 | |||
| SDRL | 428.99 | 158.06 | 63.71 | 15.01 | 4.46 | 2.25 | 1.45 | 1.02 | 0.73 | |||
| ARL | 370.80 | 167.77 | 78.23 | 22.05 | 7.70 | 4.20 | 2.75 | 1.93 | 1.38 | |||
| MDRL | 204 | 113 | 58 | 18 | 6 | 4 | 2 | 2 | 1 | |||
| SDRL | 431.87 | 177.42 | 74.56 | 18.74 | 5.81 | 2.82 | 1.70 | 1.11 | 0.66 | |||
| 0.30 | 2.027 | ARL | 368.72 | 141.80 | 66.17 | 18.88 | 6.65 | 3.84 | 2.82 | 2.37 | 2.15 | |
| MDRL | 170 | 96 | 50 | 15 | 6 | 3 | 2 | 2 | 2 | |||
| SDRL | 549.86 | 148.36 | 59.39 | 14.70 | 4.39 | 2.03 | 1.14 | 0.69 | 0.42 | |||
| ARL | 368.17 | 113.50 | 50.20 | 13.66 | 5.08 | 3.21 | 2.56 | 2.28 | 2.14 | |||
| MDRL | 170 | 80 | 39 | 11 | 4 | 3 | 2 | 2 | 2 | |||
| SDRL | 543.16 | 112.47 | 43.47 | 10.24 | 3.12 | 1.53 | 0.94 | 0.63 | 0.44 | |||
| ARL | 371.08 | 131.24 | 59.93 | 16.68 | 5.99 | 3.59 | 2.72 | 2.34 | 2.16 | |||
| MDRL | 171 | 90 | 46 | 14 | 5 | 3 | 2 | 2 | 2 | |||
| SDRL | 548.95 | 134.54 | 53.25 | 12.79 | 3.85 | 1.83 | 1.07 | 0.68 | 0.45 | |||
| ARL | 368.96 | 131.62 | 59.84 | 16.62 | 5.98 | 3.58 | 2.72 | 2.34 | 2.16 | |||
| MDRL | 168 | 90 | 46 | 14 | 5 | 3 | 2 | 2 | 2 | |||
| SDRL | 550.61 | 134.20 | 53.08 | 12.67 | 3.82 | 1.83 | 1.07 | 0.68 | 0.45 | |||
| ARL | 368.96 | 102.57 | 44.87 | 12.65 | 5.05 | 3.29 | 2.63 | 2.33 | 2.17 | |||
| MDRL | 168 | 74 | 36 | 10 | 4 | 3 | 2 | 2 | 2 | |||
| SDRL | 550.61 | 99.24 | 38.22 | 9.37 | 3.11 | 1.62 | 1.02 | 0.69 | 0.48 | |||
| ARL | 364.59 | 138.32 | 63.72 | 17.86 | 6.32 | 3.69 | 2.74 | 2.32 | 2.13 | |||
| MDRL | 169 | 94 | 48 | 15 | 5 | 3 | 2 | 2 | 2 | |||
| SDRL | 537.41 | 143.54 | 57.04 | 13.77 | 4.10 | 1.91 | 1.07 | 0.65 | 0.39 | |||
| ARL | 368.96 | 152.86 | 73.40 | 21.97 | 7.98 | 4.51 | 3.13 | 2.45 | 2.10 | |||
| MDRL | 168 | 101 | 56 | 18 | 7 | 4 | 3 | 2 | 2 | |||
| SDRL | 550.61 | 162.83 | 66.92 | 17.23 | 5.40 | 2.52 | 1.37 | 0.77 | 0.33 | |||
| Distribution | Characteristic | 0 | 0.05 | 0.10 | 0.25 | 0.50 | 0.75 | 1.00 | 1.25 | 1.50 | ||
|---|---|---|---|---|---|---|---|---|---|---|---|---|
| 0.10 | 1.071 | ARL | 371.65 | 66.86 | 23.90 | 5.86 | 2.16 | 1.30 | 1.06 | 1.01 | 1.00 | |
| MDRL | 17 | 13 | 8 | 4 | 1 | 1 | 1 | 1 | 1 | |||
| SDRL | 696.43 | 112.83 | 35.33 | 6.64 | 1.97 | 0.89 | 0.37 | 0.13 | 0.04 | |||
| ARL | 371.40 | 49.72 | 17.67 | 4.41 | 1.75 | 1.18 | 1.04 | 1.01 | 1.00 | |||
| MDRL | 17 | 11 | 7 | 3 | 1 | 1 | 1 | 1 | 1 | |||
| SDRL | 695.73 | 79.93 | 24.84 | 4.68 | 1.48 | 0.65 | 0.28 | 0.13 | 0.07 | |||
| ARL | 366.02 | 59.79 | 21.38 | 5.27 | 2.01 | 1.25 | 1.05 | 1.01 | 1.00 | |||
| MDRL | 16 | 12 | 8 | 3 | 1 | 1 | 1 | 1 | 1 | |||
| SDRL | 690.48 | 99.41 | 31.17 | 5.82 | 1.80 | 0.81 | 0.34 | 0.13 | 0.05 | |||
| ARL | 366.63 | 60.15 | 21.44 | 5.31 | 2.01 | 1.25 | 1.05 | 1.01 | 1.00 | |||
| MDRL | 17 | 12 | 8 | 4 | 1 | 1 | 1 | 1 | 1 | |||
| SDRL | 693.01 | 99.38 | 31.17 | 5.85 | 1.78 | 0.79 | 0.33 | 0.13 | 0.05 | |||
| ARL | 366.63 | 45.56 | 16.11 | 4.26 | 1.77 | 1.20 | 1.05 | 1.01 | 1.00 | |||
| MDRL | 17 | 11 | 7 | 3 | 1 | 1 | 1 | 1 | 1 | |||
| SDRL | 693.01 | 72.66 | 22.37 | 4.47 | 1.50 | 0.70 | 0.33 | 0.15 | 0.07 | |||
| ARL | 374.55 | 64.28 | 22.91 | 5.61 | 2.06 | 1.26 | 1.05 | 1.01 | 1.00 | |||
| MDRL | 17 | 12 | 8 | 4 | 1 | 1 | 1 | 1 | 1 | |||
| SDRL | 698.97 | 107.41 | 33.52 | 6.29 | 1.86 | 0.82 | 0.33 | 0.11 | 0.03 | |||
| ARL | 369.00 | 69.28 | 25.22 | 6.38 | 2.41 | 1.42 | 1.09 | 1.01 | 1.00 | |||
| MDRL | 17 | 13 | 8 | 4 | 1 | 1 | 1 | 1 | 1 | |||
| SDRL | 693.71 | 116.62 | 37.43 | 7.47 | 2.29 | 1.09 | 0.48 | 0.14 | 0.01 | |||
| 0.14 | 1.395 | ARL | 370.16 | 96.72 | 35.26 | 7.94 | 2.68 | 1.50 | 1.12 | 1.02 | 1.00 | |
| MDRL | 139 | 48 | 20 | 5 | 1 | 1 | 1 | 1 | 1 | |||
| SDRL | 462.14 | 122.89 | 41.38 | 7.94 | 2.29 | 1.09 | 0.51 | 0.20 | 0.07 | |||
| ARL | 369.52 | 73.00 | 25.68 | 5.84 | 2.11 | 1.31 | 1.08 | 1.02 | 1.01 | |||
| MDRL | 139 | 39 | 15 | 4 | 1 | 1 | 1 | 1 | 1 | |||
| SDRL | 462.17 | 90.24 | 29.35 | 5.55 | 1.73 | 0.83 | 0.40 | 0.20 | 0.10 | |||
| ARL | 368.50 | 87.93 | 31.49 | 7.08 | 2.46 | 1.43 | 1.11 | 1.02 | 1.00 | |||
| MDRL | 137 | 44 | 18 | 5 | 1 | 1 | 1 | 1 | 1 | |||
| SDRL | 461.36 | 110.47 | 36.85 | 6.97 | 2.08 | 1.00 | 0.47 | 0.20 | 0.09 | |||
| ARL | 369.43 | 88.01 | 31.51 | 7.12 | 2.47 | 1.43 | 1.11 | 1.02 | 1.00 | |||
| MDRL | 137 | 45 | 18 | 5 | 1 | 1 | 1 | 1 | 1 | |||
| SDRL | 462.20 | 109.98 | 36.64 | 6.97 | 2.06 | 0.99 | 0.47 | 0.20 | 0.08 | |||
| ARL | 369.43 | 66.98 | 23.45 | 5.59 | 2.14 | 1.35 | 1.10 | 1.03 | 1.01 | |||
| MDRL | 137 | 36 | 14 | 4 | 1 | 1 | 1 | 1 | 1 | |||
| SDRL | 462.20 | 82.26 | 26.55 | 5.27 | 1.75 | 0.89 | 0.45 | 0.23 | 0.11 | |||
| ARL | 371.38 | 93.37 | 33.81 | 7.59 | 2.56 | 1.44 | 1.10 | 1.02 | 1.00 | |||
| MDRL | 140 | 47 | 20 | 5 | 1 | 1 | 1 | 1 | 1 | |||
| SDRL | 464.13 | 118.11 | 39.48 | 7.52 | 2.16 | 1.01 | 0.45 | 0.17 | 0.05 | |||
| ARL | 369.43 | 101.30 | 37.80 | 8.82 | 3.05 | 1.69 | 1.18 | 1.02 | 1.00 | |||
| MDRL | 137 | 50 | 21 | 6 | 2 | 1 | 1 | 1 | 1 | |||
| SDRL | 462.20 | 128.06 | 44.70 | 8.96 | 2.67 | 1.31 | 0.61 | 0.21 | 0.03 | |||
| 0.15 | 1.479 | ARL | 370.63 | 103.71 | 38.14 | 8.53 | 2.85 | 1.58 | 1.15 | 1.03 | 1.00 | |
| MDRL | 183 | 59 | 24 | 6 | 2 | 1 | 1 | 1 | 1 | |||
| SDRL | 427.32 | 123.66 | 42.36 | 8.20 | 2.36 | 1.15 | 0.55 | 0.22 | 0.08 | |||
| ARL | 369.30 | 78.42 | 27.77 | 6.24 | 2.23 | 1.36 | 1.10 | 1.03 | 1.01 | |||
| MDRL | 182 | 47 | 18 | 5 | 1 | 1 | 1 | 1 | 1 | |||
| SDRL | 427.05 | 91.21 | 30.16 | 5.74 | 1.79 | 0.88 | 0.44 | 0.22 | 0.12 | |||
| ARL | 369.79 | 94.36 | 34.03 | 7.59 | 2.61 | 1.49 | 1.13 | 1.03 | 1.01 | |||
| MDRL | 183 | 54 | 21 | 5 | 1 | 1 | 1 | 1 | 1 | |||
| SDRL | 425.88 | 111.40 | 37.71 | 7.21 | 2.15 | 1.05 | >0.51 | 0.23 | 0.10 | |||
| ARL | 370.47 | 94.37 | 34.05 | 7.62 | 2.61 | 1.50 | 1.13 | 1.03 | 1.01 | |||
| MDRL | 183 | 55 | 22 | 6 | 1 | 1 | 1 | 1 | 1 | |||
| SDRL | 427.02 | 110.77 | 37.45 | 7.20 | 2.13 | 1.04 | 0.51 | 0.23 | 0.09 | |||
| ARL | 370.47 | 72.05 | 25.32 | 5.96 | 2.26 | 1.40 | 1.12 | 1.04 | 1.01 | |||
| MDRL | 183 | 43 | 16 | 5 | 1 | 1 | 1 | 1 | 1 | |||
| SDRL | 427.02 | 83.16 | 27.22 | 5.44 | 1.80 | 0.94 | 0.49 | 0.26 | 0.13 | |||
| ARL | 370.63 | 100.05 | 36.54 | 8.12 | 2.71 | 1.51 | 1.12 | 1.02 | 1.00 | |||
| MDRL | 184 | 57 | 23 | 6 | 2 | 1 | 1 | 1 | 1 | |||
| SDRL | 427.00 | 118.69 | 40.40 | 7.78 | 2.22 | 1.07 | 0.49 | 0.19 | 0.06 | |||
| ARL | 370.47 | 108.54 | 40.87 | 9.49 | 3.25 | 1.78 | 1.21 | 1.03 | 1.00 | |||
| MDRL | 183 | 62 | 25 | 7 | 2 | 1 | 1 | 1 | 1 | |||
| SDRL | 427.02 | 128.51 | 45.66 | 9.27 | 2.75 | 1.36 | 0.66 | 0.23 | 0.04 | |||
| 0.17 | 1.650 | ARL | 369.54 | 114.66 | 43.04 | 9.60 | 3.15 | 1.71 | 1.20 | 1.04 | 1.01 | |
| MDRL | 251 | 77 | 30 | 7 | 3 | 1 | 1 | 1 | 1 | |||
| SDRL | 373.04 | 123.00 | 43.68 | 8.69 | 2.51 | 1.25 | 0.63 | 0.28 | 0.10 | |||
| ARL | 368.93 | 87.50 | 31.40 | 7.00 | 2.45 | 1.44 | 1.13 | 1.04 | 1.01 | |||
| MDRL | 249 | 60 | 22 | 5 | 1 | 1 | 1 | 1 | 1 | |||
| SDRL | 372.71 | 91.98 | 31.25 | 6.10 | 1.91 | 0.97 | 0.51 | 0.26 | 0.14 | |||
| ARL | 368.52 | 104.78 | 38.46 | 8.58 | 2.87 | 1.61 | 1.18 | 1.04 | 1.01 | |||
| MDRL | 249 | 71 | 27 | 6 | 2 | 1 | 1 | 1 | 1 | |||
| SDRL | 372.20 | 111.52 | 38.94 | 7.67 | 2.28 | 1.15 | 0.59 | 0.28 | 0.12 | |||
| ARL | 369.23 | 104.70 | 38.57 | 8.57 | 2.87 | 1.61 | 1.18 | 1.04 | 1.01 | |||
| MDRL | 249 | 71 | 27 | 7 | 2 | 1 | 1 | 1 | 1 | |||
| SDRL | 372.14 | 110.84 | 38.78 | 7.64 | 2.26 | 1.14 | 0.59 | 0.28 | 0.13 | |||
| ARL | 369.23 | 80.53 | 28.74 | 6.65 | 2.47 | 1.50 | 1.17 | 1.05 | 1.01 | |||
| MDRL | 249 | 56 | 21 | 5 | 1 | 1 | 1 | 1 | 1 | |||
| SDRL | 372.14 | 84.02 | 28.38 | 5.77 | 1.93 | 1.03 | 0.57 | 0.31 | 0.16 | |||
| ARL | 368.64 | 110.57 | 41.24 | 9.15 | 2.99 | 1.63 | 1.16 | 1.03 | 1.00 | |||
| MDRL | 250 | 74 | 29 | 7 | 2 | 1 | 1 | 1 | 1 | |||
| SDRL | 372.45 | 118.14 | 41.61 | 8.23 | 2.36 | 1.17 | 0.57 | 0.24 | 0.08 | |||
| ARL | 369.23 | 120.34 | 46.21 | 10.74 | 3.61 | 1.94 | 1.28 | 1.04 | 1.00 | |||
| MDRL | 249 | 81 | 33 | 8 | 3 | 1 | 1 | 1 | 1 | |||
| SDRL | 372.14 | 128.22 | 46.93 | 9.82 | 2.92 | 1.47 | 0.76 | 0.29 | 0.05 | |||
| 0.20 | 1.890 | ARL | 370.28 | 127.97 | 49.69 | 11.26 | 3.69 | 2.01 | 1.35 | 1.10 | 1.02 | |
| MDRL | 305 | 98 | 39 | 9 | 3 | 1 | 1 | 1 | 1 | |||
| SDRL | 317.69 | 119.61 | 44.14 | 9.15 | 2.62 | 1.36 | 0.76 | 0.38 | 0.17 | |||
| ARL | 367.73 | 98.61 | 36.48 | 8.19 | 2.87 | 1.69 | 1.26 | 1.11 | 1.05 | |||
| MDRL | 302 | 76 | 29 | 7 | 3 | 1 | 1 | 1 | 1 | |||
| SDRL | 317.57 | 90.73 | 31.98 | 6.43 | 1.99 | 1.09 | 0.64 | 0.39 | 0.25 | |||
| ARL | 368.20 | 117.56 | 44.58 | 10.03 | 3.36 | 1.88 | 1.32 | 1.11 | 1.03 | |||
| MDRL | 304 | 90 | 35 | 8 | 3 | 1 | 1 | 1 | 1 | |||
| SDRL | 316.61 | 109.37 | 39.60 | 8.08 | 2.37 | 1.26 | 0.72 | 0.40 | 0.21 | |||
| ARL | 369.19 | 117.27 | 44.55 | 10.05 | 3.36 | 1.89 | 1.33 | 1.11 | 1.03 | |||
| MDRL | 305 | 90 | 35 | 8 | 3 | 1 | 1 | 1 | 1 | |||
| SDRL | 317.09 | 108.22 | 39.29 | 8.03 | 2.35 | 1.25 | 0.72 | 0.39 | 0.21 | |||
| ARL | 369.19 | 91.00 | 33.39 | 7.78 | 2.90 | 1.76 | 1.32 | 1.13 | 1.05 | |||
| MDRL | 305 | 71 | 26 | 6 | 3 | 1 | 1 | 1 | 1 | |||
| SDRL | 317.09 | 82.82 | 29.08 | 6.09 | 2.01 | 1.14 | 0.71 | 0.43 | 0.26 | |||
| ARL | 368.84 | 123.39 | 47.65 | 10.74 | 3.51 | 1.91 | 1.30 | 1.08 | 1.02 | |||
| MDRL | 302 | 94 | 37 | 9 | 3 | 1 | 1 | 1 | 1 | |||
| SDRL | 317.49 | 115.01 | 42.21 | 8.66 | 2.46 | 1.28 | 0.70 | 0.34 | 0.14 | |||
| ARL | 369.19 | 133.80 | 53.34 | 12.65 | 4.24 | 2.29 | 1.47 | 1.11 | 1.01 | |||
| MDRL | 305 | 102 | 42 | 10 | 4 | 2 | 1 | 1 | 1 | |||
| SDRL | 317.09 | 124.28 | 47.58 | 10.33 | 3.05 | 1.56 | 0.89 | 0.40 | 0.10 | |||
| 0.25 | 2.229 | ARL | 369.93 | 138.24 | 55.72 | 13.25 | 4.40 | 2.45 | 1.63 | 1.24 | 1.07 | |
| MDRL | 321 | 112 | 46 | 11 | 4 | 2 | 1 | 1 | 1 | |||
| SDRL | 284.58 | 114.78 | 43.47 | 9.40 | 2.70 | 1.43 | 0.92 | 0.56 | 0.31 | |||
| ARL | 367.49 | 107.89 | 41.34 | 9.66 | 3.42 | 2.04 | 1.48 | 1.23 | 1.12 | |||
| MDRL | 318 | 88 | 35 | 8 | 3 | 2 | 1 | 1 | 1 | |||
| SDRL | 284.09 | 87.80 | 31.74 | 6.66 | 2.06 | 1.21 | 0.82 | 0.58 | 0.41 | |||
| ARL | 367.34 | 127.27 | 50.25 | 11.80 | 4.00 | 2.28 | 1.58 | 1.25 | 1.10 | |||
| MDRL | 319 | 103 | 42 | 10 | 4 | 2 | 1 | 1 | 1 | |||
| SDRL | 283.47 | 105.02 | 39.10 | 8.33 | 2.45 | 1.35 | 0.89 | 0.58 | 0.36 | |||
| ARL | 368.50 | 127.15 | 50.21 | 11.83 | 4.01 | 2.29 | 1.58 | 1.25 | 1.10 | |||
| MDRL | 320 | 103 | 42 | 10 | 4 | 2 | 1 | 1 | 1 | |||
| SDRL | 284.04 | 104.56 | 38.76 | 8.29 | 2.43 | 1.35 | 0.89 | 0.58 | 0.36 | |||
| ARL | 368.50 | 99.62 | 37.85 | 9.18 | 3.45 | 2.12 | 1.55 | 1.27 | 1.13 | |||
| MDRL | 320 | 82 | 32 | 8 | 3 | 2 | 1 | 1 | 1 | |||
| SDRL | 284.04 | 80.45 | 28.89 | 6.30 | 2.09 | 1.26 | 0.88 | 0.62 | 0.43 | |||
| ARL | 368.11 | 133.51 | 53.50 | 12.61 | 4.19 | 2.33 | 1.56 | 1.20 | 1.06 | |||
| MDRL | 319 | 108 | 45 | 11 | 4 | 2 | 1 | 1 | 1 | |||
| SDRL | 284.11 | 110.70 | 41.69 | 8.90 | 2.54 | 1.36 | 0.87 | 0.52 | 0.27 | |||
| ARL | 368.50 | 144.72 | 59.94 | 14.90 | 5.07 | 2.80 | 1.81 | 1.26 | 1.03 | |||
| MDRL | 320 | 116 | 50 | 13 | 5 | 3 | 1 | 1 | 1 | |||
| SDRL | 284.04 | 119.68 | 46.90 | 10.61 | 3.14 | 1.61 | 1.03 | 0.58 | 0.20 | |||
| 0.30 | 2.451 | ARL | 370.61 | 140.16 | 57.19 | 14.02 | 4.76 | 2.70 | 1.85 | 1.39 | 1.15 | |
| MDRL | 309 | 113 | 48 | 12 | 4 | 3 | 2 | 1 | 1 | |||
| SDRL | 291.90 | 114.52 | 42.65 | 9.20 | 2.65 | 1.39 | 0.95 | 0.66 | 0.41 | |||
| ARL | 368.00 | 109.39 | 42.56 | 10.29 | 3.71 | 2.25 | 1.64 | 1.33 | 1.18 | |||
| MDRL | 308 | 89 | 36 | 9 | 3 | 2 | 1 | 1 | 1 | |||
| SDRL | 290.76 | 86.65 | 30.87 | 6.56 | 2.01 | 1.21 | 0.88 | 0.65 | 0.49 | |||
| ARL | 368.29 | 129.17 | 51.57 | 12.52 | 4.33 | 2.52 | 1.77 | 1.38 | 1.17 | |||
| MDRL | 310 | 104 | 43 | 11 | 4 | 2 | 1 | 1 | 1 | |||
| SDRL | 289.68 | 104.20 | 38.20 | 8.17 | 2.40 | 1.33 | 0.93 | 0.66 | 0.46 | |||
| ARL | 368.43 | 128.73 | 51.46 | 12.53 | 4.34 | 2.53 | 1.78 | 1.38 | 1.17 | |||
| MDRL | 311 | 104 | 43 | 11 | 4 | 3 | 1 | 1 | 1 | |||
| SDRL | 289.31 | 103.59 | 37.91 | 8.11 | 2.39 | 1.32 | 0.93 | 0.66 | 0.45 | |||
| ARL | 368.43 | 101.05 | 39.00 | 9.76 | 3.73 | 2.32 | 1.72 | 1.39 | 1.20 | |||
| MDRL | 311 | 83 | 33 | 9 | 4 | 2 | 1 | 1 | 1 | |||
| SDRL | 289.31 | 79.36 | 28.11 | 6.20 | 2.06 | 1.26 | 0.93 | 0.69 | 0.51 | |||
| ARL | 368.93 | 135.37 | 54.84 | 13.35 | 4.54 | 2.59 | 1.77 | 1.34 | 1.13 | |||
| MDRL | 308 | 108 | 46 | 12 | 4 | 3 | 1 | 1 | 1 | |||
| SDRL | 290.93 | 110.26 | 40.79 | 8.73 | 2.49 | 1.33 | 0.91 | 0.61 | 0.37 | |||
| ARL | 368.43 | 147.00 | 61.58 | 15.78 | 5.48 | 3.10 | 2.05 | 1.42 | 1.07 | |||
| MDRL | 311 | 118 | 51 | 14 | 5 | 3 | 2 | 1 | 1 | |||
| SDRL | 289.31 | 119.83 | 46.17 | 10.43 | 3.08 | 1.55 | 1.03 | 0.67 | 0.28 | |||
| Characteristic | 200 | 500 | 1000 | 100 | 200 | 500 | 1000 | ||
|---|---|---|---|---|---|---|---|---|---|
| 0.10 | ARL | 696.63 | 718.10 | 702.15 | 575.00 | 608.95 | 612.22 | 535.18 | 370.55 |
| MDRL | 138 | 136 | 43 | 9 | 204 | 198 | 77 | 16 | |
| SDRL | 1087.35 | 1095.80 | 1079.97 | 963.18 | 812.63 | 806.86 | 746.51 | 592.30 | |
| 0.14 | ARL | 491.08 | 464.19 | 362.49 | 206.29 | 434.97 | 394.73 | 261.18 | 108.59 |
| MDRL | 214 | 177 | 36 | 10 | 278 | 224 | 61 | 16 | |
| SDRL | 612.50 | 594.38 | 521.11 | 368.23 | 458.43 | 436.92 | 344.31 | 181.08 | |
| 0.15 | ARL | 468.92 | 435.10 | 324.74 | 170.17 | 408.85 | 363.23 | 224.43 | 84.49 |
| MDRL | 228 | 182 | 36 | 10 | 282 | 221 | 58 | 17 | |
| SDRL | 563.04 | 542.32 | 463.70 | 308.99 | 413.40 | 390.67 | 294.05 | 138.83 | |
| 0.17 | ARL | 419.44 | 375.76 | 258.77 | 113.29 | 372.14 | 316.69 | 177.11 | 61.27 |
| MDRL | 230 | 172 | 30 | 11 | 287 | 212 | 55 | 18 | |
| SDRL | 478.37 | 454.45 | 373.11 | 213.99 | 350.24 | 325.63 | 228.50 | 94.47 | |
| 0.20 | ARL | 385.18 | 335.76 | 217.66 | 88.44 | 330.64 | 270.76 | 137.14 | 54.29 |
| MDRL | 225 | 159 | 30 | 14 | 271 | 191 | 54 | 24 | |
| SDRL | 427.03 | 402.52 | 320.24 | 168.68 | 292.24 | 268.31 | 172.06 | 74.53 | |
| 0.25 | ARL | 355.27 | 306.42 | 211.25 | 112.13 | 306.18 | 245.66 | 134.48 | 78.97 |
| MDRL | 184 | 115 | 32 | 20 | 253 | 175 | 71 | 45 | |
| SDRL | 428.16 | 407.40 | 338.18 | 217.54 | 263.78 | 239.66 | 157.76 | 93.98 | |
| 0.30 | ARL | 343.74 | 319.97 | 282.32 | 243.93 | 303.14 | 253.60 | 171.75 | 131.41 |
| MDRL | 122 | 73 | 36 | 29 | 237 | 175 | 104 | 82 | |
| SDRL | 565.77 | 577.88 | 577.41 | 568.61 | 274.19 | 252.52 | 188.66 | 144.19 | |
| Distribution | Characteristic | 0 | 0.05 | 0.10 | 0.25 | 0.50 | 0.75 | 1.00 | 1.25 | 1.50 | |||
|---|---|---|---|---|---|---|---|---|---|---|---|---|---|
| 100 | 0.20 | 1.688 | ARL | 385.18 | 206.60 | 122.62 | 59.92 | 35.90 | 27.59 | 23.67 | 21.59 | 20.44 | |
| MDRL | 225 | 159 | 108 | 58 | 35 | 27 | 23 | 21 | 20 | ||||
| SDRL | 427.03 | 205.09 | 106.66 | 45.21 | 25.25 | 19.00 | 16.22 | 14.81 | 14.05 | ||||
| ARL | 386.61 | 195.09 | 115.36 | 56.28 | 34.03 | 26.50 | 23.05 | 21.24 | 20.26 | ||||
| MDRL | 226 | 151 | 103 | 55 | 34 | 26 | 23 | 21 | 20 | ||||
| SDRL | 427.71 | 190.66 | 99.13 | 42.24 | 23.91 | 18.32 | 15.87 | 14.63 | 13.97 | ||||
| ARL | 387.88 | 165.17 | 96.62 | 48.77 | 31.19 | 25.39 | 22.65 | 21.21 | 20.39 | ||||
| MDRL | 230 | 136 | 89 | 48 | 31 | 25 | 22 | 21 | 20 | ||||
| SDRL | 426.07 | 153.90 | 79.69 | 35.79 | 21.79 | 17.50 | 15.56 | 14.57 | 14.03 | ||||
| ARL | 387.88 | 218.37 | 131.74 | 65.05 | 39.43 | 30.08 | 25.18 | 22.19 | 20.24 | ||||
| MDRL | 230 | 166 | 115 | 63 | 39 | 30 | 25 | 22 | 20 | ||||
| SDRL | 426.07 | 217.89 | 115.91 | 49.48 | 27.86 | 20.68 | 17.17 | 15.15 | 13.89 | ||||
| 500 | 0.20 | 1.688 | ARL | 217.66 | 145.33 | 99.39 | 60.85 | 45.49 | 39.09 | 35.01 | 32.30 | 30.65 | |
| MDRL | 30 | 30 | 31 | 32 | 33 | 31 | 28 | 26 | 24 | ||||
| SDRL | 320.24 | 197.17 | 121.58 | 64.68 | 44.05 | 36.89 | 33.11 | 30.77 | 29.38 | ||||
| ARL | 213.02 | 137.67 | 93.89 | 58.92 | 44.72 | 38.53 | 34.75 | 32.40 | 31.00 | ||||
| MDRL | 29 | 29 | 30 | 32 | 33 | 31 | 28 | 26 | 25 | ||||
| SDRL | 316.04 | 186.04 | 114.41 | 62.12 | 42.96 | 36.25 | 32.77 | 30.79 | 29.60 | ||||
| ARL | 215.38 | 123.02 | 84.63 | 54.65 | 42.38 | 36.96 | 33.82 | 31.96 | 30.76 | ||||
| MDRL | 30 | 30 | 31 | 34 | 33 | 29 | 27 | 26 | 25 | ||||
| SDRL | 318.99 | 160.11 | 98.86 | 56.00 | 40.50 | 34.94 | 32.10 | 30.49 | 29.46 | ||||
| ARL | 215.38 | 149.78 | 104.30 | 63.44 | 47.47 | 41.24 | 36.83 | 33.29 | 30.54 | ||||
| MDRL | 30 | 30 | 30 | 31 | 33 | 32 | 30 | 27 | 24 | ||||
| SDRL | 318.99 | 205.81 | 129.72 | 68.64 | 46.52 | 38.88 | 34.51 | 31.53 | 29.26 | ||||
| 100 | 0.25 | 1.915 | ARL | 355.27 | 184.12 | 110.52 | 54.84 | 32.78 | 24.76 | 20.84 | 18.75 | 17.58 | |
| MDRL | 184 | 136 | 96 | 52 | 32 | 24 | 20 | 18 | 17 | ||||
| SDRL | 428.16 | 186.80 | 96.12 | 40.75 | 22.76 | 17.05 | 14.44 | 13.08 | 12.33 | ||||
| ARL | 352.16 | 173.58 | 103.95 | 51.62 | 30.98 | 23.69 | 20.25 | 18.46 | 17.49 | ||||
| MDRL | 180 | 129 | 90 | 49 | 30 | 23 | 19 | 18 | 17 | ||||
| SDRL | 428.65 | 172.91 | 89.18 | 38.15 | 21.56 | 16.41 | 14.12 | 12.95 | 12.32 | ||||
| ARL | 354.27 | 147.44 | 87.60 | 44.57 | 28.19 | 22.47 | 19.81 | 18.37 | 17.56 | ||||
| MDRL | 183 | 118 | 79 | 43 | 27 | 22 | 19 | 18 | 17 | ||||
| SDRL | 428.13 | 138.96 | 71.88 | 32.21 | 19.59 | 15.60 | 13.80 | 12.84 | 12.32 | ||||
| ARL | 354.27 | 193.19 | 118.61 | 59.62 | 36.18 | 27.25 | 22.38 | 19.35 | 17.40 | ||||
| MDRL | 183 | 140 | 102 | 56 | 35 | 26 | 22 | 19 | 17 | ||||
| SDRL | 428.13 | 198.09 | 104.55 | 44.71 | 25.15 | 18.61 | 15.34 | 13.40 | 12.19 | ||||
| 500 | 0.25 | 1.915 | ARL | 211.25 | 129.77 | 88.21 | 56.22 | 42.41 | 34.75 | 29.66 | 26.70 | 25.05 | |
| MDRL | 32 | 32 | 32 | 33 | 32 | 27 | 23 | 21 | 19 | ||||
| SDRL | 338.18 | 179.93 | 106.37 | 57.54 | 40.41 | 33.19 | 28.67 | 26.08 | 24.64 | ||||
| ARL | 206.49 | 122.34 | 83.88 | 54.93 | 41.52 | 34.04 | 29.33 | 26.74 | 25.34 | ||||
| MDRL | 31 | 31 | 32 | 33 | 31 | 26 | 23 | 21 | 19 | ||||
| SDRL | 333.48 | 168.13 | 100.46 | 55.81 | 39.44 | 32.48 | 28.36 | 26.09 | 24.83 | ||||
| ARL | 209.15 | 109.24 | 76.40 | 51.46 | 38.69 | 32.14 | 28.42 | 26.34 | 25.16 | ||||
| MDRL | 32 | 32 | 33 | 34 | 30 | 25 | 22 | 20 | 19 | ||||
| SDRL | 337.25 | 142.41 | 87.08 | 51.12 | 36.97 | 31.02 | 27.69 | 25.80 | 24.73 | ||||
| ARL | 209.15 | 134.36 | 92.53 | 58.24 | 44.32 | 37.26 | 31.79 | 27.67 | 24.88 | ||||
| MDRL | 32 | 32 | 32 | 32 | 32 | 29 | 25 | 21 | 19 | ||||
| SDRL | 337.25 | 189.30 | 113.83 | 60.59 | 42.32 | 35.04 | 30.32 | 26.82 | 24.43 | ||||
| Distribution | Characteristic | 0 | 0.05 | 0.10 | 0.25 | 0.50 | 0.75 | 1.00 | 1.25 | 1.50 | |||
|---|---|---|---|---|---|---|---|---|---|---|---|---|---|
| 100 | 0.17 | 1.650 | ARL | 372.14 | 183.27 | 106.81 | 50.60 | 29.47 | 22.11 | 18.69 | 16.93 | 16.02 | |
| MDRL | 287 | 160 | 102 | 51 | 30 | 22 | 18 | 17 | 16 | ||||
| SDRL | 350.24 | 159.46 | 83.38 | 35.64 | 20.02 | 15.05 | 12.84 | 11.73 | 11.17 | ||||
| ARL | 374.03 | 174.79 | 101.28 | 48.17 | 28.25 | 21.51 | 18.47 | 16.93 | 16.13 | ||||
| MDRL | 289 | 155 | 97 | 48 | 28 | 21 | 18 | 17 | 16 | ||||
| SDRL | 351.43 | 149.79 | 77.83 | 33.55 | 19.09 | 14.60 | 12.64 | 11.67 | 11.18 | ||||
| ARL | 373.27 | 149.84 | 86.33 | 42.18 | 25.88 | 20.52 | 18.12 | 16.87 | 16.19 | ||||
| MDRL | 286 | 136 | 84 | 42 | 26 | 20 | 18 | 17 | 16 | ||||
| SDRL | 352.01 | 124.61 | 64.91 | 29.15 | 17.56 | 14.02 | 12.47 | 11.67 | 11.24 | ||||
| ARL | 373.27 | 189.05 | 111.53 | 54.18 | 32.01 | 23.89 | 19.77 | 17.35 | 15.92 | ||||
| MDRL | 286 | 165 | 106 | 54 | 32 | 24 | 20 | 17 | 16 | ||||
| SDRL | 352.01 | 164.62 | 87.25 | 38.01 | 21.57 | 16.07 | 13.41 | 11.91 | 11.06 | ||||
| 500 | 0.17 | 1.650 | ARL | 177.11 | 132.74 | 98.34 | 59.78 | 38.85 | 29.64 | 24.92 | 22.37 | 21.02 | |
| MDRL | 55 | 54 | 50 | 41 | 28 | 21 | 17 | 15 | 14 | ||||
| SDRL | 228.50 | 158.41 | 107.90 | 59.27 | 37.79 | 29.69 | 25.78 | 23.62 | 22.46 | ||||
| ARL | 175.05 | 130.34 | 95.74 | 57.50 | 37.23 | 28.69 | 24.47 | 22.27 | 21.09 | ||||
| MDRL | 55 | 54 | 51 | 40 | 27 | 20 | 17 | 15 | 14 | ||||
| SDRL | 225.72 | 153.88 | 103.65 | 56.54 | 36.23 | 28.84 | 25.31 | 23.44 | 22.43 | ||||
| ARL | 177.17 | 120.06 | 86.13 | 51.33 | 33.65 | 27.01 | 23.75 | 21.99 | 21.01 | ||||
| MDRL | 55 | 53 | 48 | 36 | 24 | 19 | 16 | 15 | 14 | ||||
| SDRL | 227.99 | 138.17 | 91.17 | 50.22 | 33.28 | 27.54 | 24.76 | 23.24 | 22.37 | ||||
| ARL | 177.17 | 135.97 | 101.99 | 63.48 | 42.31 | 32.51 | 26.65 | 22.97 | 20.72 | ||||
| MDRL | 55 | 54 | 52 | 44 | 32 | 25 | 19 | 16 | 14 | ||||
| SDRL | 227.99 | 161.90 | 111.54 | 62.48 | 40.28 | 31.67 | 26.90 | 23.93 | 22.07 | ||||
| 100 | 0.25 | 2.229 | ARL | 306.18 | 178.71 | 108.49 | 50.10 | 26.77 | 18.75 | 15.12 | 13.29 | 12.35 | |
| MDRL | 253 | 159 | 102 | 49 | 26 | 18 | 15 | 13 | 12 | ||||
| SDRL | 263.78 | 141.28 | 76.42 | 31.94 | 17.10 | 12.44 | 10.30 | 9.29 | 8.75 | ||||
| ARL | 307.10 | 171.26 | 102.57 | 47.28 | 25.39 | 18.03 | 14.80 | 13.22 | 12.42 | ||||
| MDRL | 253 | 153 | 97 | 46 | 25 | 17 | 14 | 13 | 12 | ||||
| SDRL | 265.17 | 133.64 | 71.14 | 29.81 | 16.25 | 11.99 | 10.12 | 9.21 | 8.74 | ||||
| ARL | 307.22 | 148.97 | 87.28 | 40.58 | 22.65 | 16.96 | 14.45 | 13.17 | 12.48 | ||||
| MDRL | 251 | 135 | 83 | 39 | 22 | 16 | 14 | 13 | 12 | ||||
| SDRL | 266.83 | 112.47 | 59.30 | 25.68 | 14.79 | 11.44 | 9.97 | 9.22 | 8.82 | ||||
| ARL | 307.22 | 184.71 | 113.80 | 54.21 | 29.87 | 20.87 | 16.32 | 13.75 | 12.24 | ||||
| MDRL | 251 | 164 | 107 | 53 | 29 | 20 | 16 | 13 | 12 | ||||
| SDRL | 266.83 | 146.00 | 80.21 | 34.16 | 18.61 | 13.46 | 10.91 | 9.47 | 8.65 | ||||
| 500 | 0.25 | 2.229 | ARL | 134.48 | 117.05 | 94.31 | 56.14 | 29.64 | 19.18 | 14.62 | 12.47 | 11.41 | |
| MDRL | 71 | 68 | 61 | 41 | 19 | 10 | 6 | 4 | 3 | ||||
| SDRL | 157.76 | 126.70 | 94.04 | 52.29 | 30.01 | 21.25 | 17.23 | 15.27 | 14.28 | ||||
| ARL | 135.00 | 115.73 | 92.36 | 53.12 | 27.54 | 18.07 | 14.10 | 12.31 | 11.43 | ||||
| MDRL | 71 | 68 | 61 | 38 | 17 | 9 | 6 | 4 | 3 | ||||
| SDRL | 158.04 | 124.42 | 90.92 | 49.55 | 28.21 | 20.22 | 16.71 | 15.05 | 14.23 | ||||
| ARL | 135.19 | 109.50 | 83.35 | 44.59 | 23.25 | 16.33 | 13.47 | 12.10 | 11.37 | ||||
| MDRL | 71 | 66 | 56 | 31 | 13 | 7 | 5 | 4 | 3 | ||||
| SDRL | 157.69 | 114.83 | 80.61 | 42.89 | 24.99 | 18.87 | 16.22 | 14.92 | 14.21 | ||||
| ARL | 135.19 | 119.48 | 98.06 | 63.47 | 34.78 | 22.57 | 16.32 | 13.02 | 11.2 | ||||
| MDRL | 71 | 69 | 64 | 44 | 25 | 14 | 8 | 5 | 3 | ||||
| SDRL | 157.69 | 129.02 | 97.48 | 62.48 | 33.32 | 23.60 | 18.44 | 15.61 | 13.99 | ||||
| Zero-State | Steady-State () | Steady-State () | ||||||||||
|---|---|---|---|---|---|---|---|---|---|---|---|---|
| DHWMA-SR | HWMA-SR | EWMA-SR | DEWMA-SR | DHWMA-SR | HWMA-SR | EWMA-SR | DEWMA-SR | DHWMA-SR | HWMA-SR | EWMA-SR | DEWMA-SR | |
| 0.05 | 0.19 | 0.30 | 0.173 | 0.05 | 0.19 | 0.30 | 0.173 | 0.05 | 0.19 | 0.30 | ||
| 0.00 | 370.50 | 370.14 | 370.67 | 370.66 | 369.80 | 345.11 | 367.54 | 366.50 | 172.74 | 202.37 | 370.52 | 371.43 |
| (369.34) | (322.32) | (368.89) | (370.37) | (344.82) | (303.07) | (367.90) | (365.20) | (222.37) | (221.42) | (371.27) | (371.65) | |
| 0.05 | 115.74 | 112.74 | 212.49 | 208.63 | 184.03 | 138.33 | 210.97 | 208.94 | 131.35 | 124.27 | 213.28 | 211.59 |
| (122.24) | (97.21) | (209.50) | (206.89) | (158.70) | (106.64) | (207.43) | (206.75) | (156.20) | (115.74) | (209.78) | (209.32) | |
| 0.10 | 43.91 | 44.22 | 88.07 | 85.47 | 107.47 | 70.55 | 88.66 | 86.37 | 97.99 | 78.93 | 88.54 | 86.66 |
| (44.06) | (35.24) | (84.10) | (82.13) | (83.14) | (47.06) | (84.36) | (82.37) | (107.06) | (64.44) | (84.23) | (83.00) | |
| 0.25 | 9.88 | 10.81 | 15.42 | 14.61 | 50.94 | 27.72 | 16.07 | 15.59 | 59.83 | 36.34 | 16.11 | 15.59 |
| (8.88) | (7.34) | (11.51) | (11.19) | (35.54) | (15.90) | (11.48) | (11.06) | (59.00) | (27.14) | (11.56) | (11.07) | |
| 0.50 | 3.21 | 4.09 | 4.76 | 4.47 | 29.58 | 13.85 | 5.53 | 5.73 | 38.70 | 17.48 | 5.53 | 5.73 |
| (2.54) | (2.06) | (2.39) | (2.36) | (19.94) | (7.60) | (2.48) | (2.22) | (37.49) | (13.75) | (2.48) | (2.21) | |
| 0.75 | 1.73 | 2.56 | 2.83 | 2.58 | 22.11 | 9.53 | 3.60 | 4.08 | 29.51 | 11.09 | 3.60 | 4.09 |
| (1.27) | (1.24) | (1.01) | (1.11) | (14.97) | (5.25) | (1.25) | (1.18) | (29.54) | (9.33) | (1.25) | (1.17) | |
| 1.00 | 1.21 | 1.83 | 2.22 | 1.88 | 18.67 | 7.62 | 2.91 | 3.50 | 24.69 | 8.30 | 2.91 | 3.50 |
| (0.64) | (0.98) | (0.48) | (0.71) | (12.76) | (4.25) | (0.88) | (0.91) | (25.53) | (7.40) | (0.87) | (0.91) | |
| 1.25 | 1.04 | 1.38 | 2.04 | 1.53 | 16.89 | 6.68 | 2.60 | 3.23 | 21.92 | 6.99 | 2.61 | 3.24 |
| (0.28) | (0.72) | (0.20) | (0.55) | (11.66) | (3.77) | (0.72) | (0.81) | (23.77) | (6.46) | (0.73) | (0.81) | |
| 1.50 | 1.01 | 1.14 | 2.00 | 1.31 | 15.97 | 6.19 | 2.46 | 3.11 | 20.57 | 6.31 | 2.46 | 3.11 |
| (0.11) | (0.45) | (0.06) | (0.47) | (11.09) | (3.52) | (0.67) | (0.76) | (22.13) | (5.99) | (0.67) | (0.76) | |
| Chart | Normal | Logistic | Laplace | CN | Uniform | ||||
|---|---|---|---|---|---|---|---|---|---|
| 0 | DHWMA-SR | 1.479 | 370.63 | 369.30 | 369.79 | 370.47 | 370.47 | 370.63 | 370.47 |
| DHWMA sign | 1.504 | 372.69 | 368.86 | 371.16 | 370.89 | 370.89 | 369.90 | 370.89 | |
| DHWMA- | 1.551 | 370.51 | 295.79 | 347.46 | 353.25 | 335.31 | 414.71 | 386.46 | |
| 0.05 | DHWMA-SR | 1.479 | 103.71 | 78.42 | 94.36 | 94.37 | 72.05 | 100.05 | 108.54 |
| DHWMA sign | 1.504 | 212.55 | 93.78 | 116.86 | 115.81 | 66.19 | 129.55 | 190.18 | |
| DHWMA- | 1.551 | 104.61 | 103.08 | 104.99 | 105.28 | 104.71 | 107.83 | 105.94 | |
| 0.10 | DHWMA-SR | 1.479 | 38.14 | 27.77 | 34.03 | 34.05 | 25.32 | 36.54 | 40.87 |
| DHWMA sign | 1.504 | 52.12 | 33.66 | 44.10 | 43.43 | 23.78 | 50.21 | 84.02 | |
| DHWMA- | 1.551 | 38.33 | 38.64 | 37.94 | 38.27 | 38.41 | 38.70 | 38.55 | |
| 0.25 | DHWMA-SR | 1.479 | 8.53 | 6.24 | 7.59 | 7.62 | 5.96 | 8.12 | 9.49 |
| DHWMA sign | 1.504 | 11.90 | 7.55 | 9.83 | 9.82 | 5.98 | 11.46 | 20.50 | |
| DHWMA- | 1.551 | 8.38 | 8.27 | 8.19 | 8.29 | 8.30 | 8.25 | 8.31 | |
| 0.50 | DHWMA-SR | 1.479 | 2.85 | 2.23 | 2.61 | 2.61 | 2.26 | 2.71 | 3.25 |
| DHWMA sign | 1.504 | 3.93 | 2.70 | 3.40 | 3.31 | 2.47 | 3.74 | 6.32 | |
| DHWMA- | 1.551 | 2.70 | 2.65 | 2.71 | 2.66 | 2.67 | 2.65 | 2.69 | |
| 0.75 | DHWMA-SR | 1.479 | 1.58 | 1.36 | 1.49 | 1.50 | 1.40 | 1.51 | 1.78 |
| DHWMA sign | 1.504 | 2.17 | 1.59 | 1.92 | 1.90 | 1.58 | 2.05 | 3.20 | |
| DHWMA- | 1.551 | 1.46 | 1.42 | 1.46 | 1.45 | 1.45 | 1.43 | 1.46 | |
| 1.00 | DHWMA-SR | 1.479 | 1.15 | 1.10 | 1.13 | 1.13 | 1.12 | 1.12 | 1.21 |
| DHWMA sign | 1.504 | 1.46 | 1.20 | 1.35 | 1.34 | 1.23 | 1.39 | 1.98 | |
| DHWMA- | 1.551 | 1.09 | 1.09 | 1.09 | 1.09 | 1.09 | 1.08 | 1.09 | |
| 1.25 | DHWMA-SR | 1.479 | 1.03 | 1.03 | 1.03 | 1.03 | 1.04 | 1.02 | 1.03 |
| DHWMA sign | 1.504 | 1.16 | 1.06 | 1.11 | 1.11 | 1.08 | 1.12 | 1.33 | |
| DHWMA- | 1.551 | 1.01 | 1.02 | 1.01 | 1.01 | 1.01 | 1.01 | 1.01 | |
| 1.50 | DHWMA-SR | 1.479 | 1.00 | 1.01 | 1.01 | 1.01 | 1.01 | 1.00 | 1.00 |
| DHWMA sign | 1.504 | 1.04 | 1.02 | 1.03 | 1.03 | 1.02 | 1.03 | 1.03 | |
| DHWMA- | 1.551 | 1.00 | 1.00 | 1.00 | 1.00 | 1.00 | 1.00 | 1.00 |
| Chart | Gam(1,1) | Gam(3,1) | Gam(5,1) | LN(0,0.25) | LN(0,0.5) | LN(0,1) | W(0.5,1) | W(1.5,1) | W(5,1) | ||
|---|---|---|---|---|---|---|---|---|---|---|---|
| 0 | DHWMA-SR | 1.479 | 19.64 | 48.91 | 71.93 | 97.52 | 39.12 | 16.77 | 8.66 | 43.94 | 217.71 |
| DHWMA sign | 1.504 | 372.19 | 370.25 | 372.72 | 372.69 | 372.69 | 372.69 | 370.84 | 370.89 | 370.89 | |
| DHWMA- | 1.551 | 364.61 | 364.77 | 367.82 | 366.84 | 353.42 | 292.64 | 296.52 | 371.71 | 370.50 | |
| 0.05 | DHWMA-SR | 1.479 | 10.82 | 22.33 | 29.11 | 35.18 | 17.98 | 7.23 | 2.88 | 21.10 | 222.38 |
| DHWMA sign | 1.504 | 97.33 | 121.52 | 125.86 | 124.87 | 103.67 | 42.50 | 11.24 | 130.05 | 138.33 | |
| DHWMA- | 1.551 | 103.45 | 103.24 | 103.45 | 103.81 | 102.80 | 102.42 | 100.03 | 102.26 | 104.85 | |
| 0.10 | DHWMA-SR | 1.479 | 6.88 | 12.84 | 15.74 | 17.99 | 10.39 | 3.99 | 1.05 | 12.43 | 61.27 |
| DHWMA sign | 1.504 | 33.71 | 45.64 | 47.80 | 47.38 | 37.18 | 12.43 | 1.52 | 49.26 | 54.28 | |
| DHWMA- | 1.551 | 40.05 | 39.28 | 39.25 | 38.73 | 39.58 | 42.84 | 43.61 | 38.66 | 37.77 | |
| 0.25 | DHWMA-SR | 1.479 | 2.68 | 4.50 | 5.20 | 5.59 | 3.68 | 1.24 | 1.00 | 4.53 | 10.68 |
| DHWMA sign | 1.504 | 6.40 | 9.70 | 10.39 | 10.38 | 7.63 | 2.06 | 1.00 | 10.52 | 12.63 | |
| DHWMA- | 1.551 | 59.61 | 8.77 | 8.63 | 8.62 | 9.03 | 10.21 | 11.46 | 8.93 | 8.35 | |
| 0.50 | DHWMA-SR | 1.479 | 1.08 | 1.73 | 1.98 | 2.08 | 1.42 | 1.00 | 1.00 | 1.76 | 3.29 |
| DHWMA sign | 1.504 | 1.60 | 2.93 | 3.25 | 3.29 | 2.31 | 1.00 | 1.00 | 3.16 | 4.23 | |
| DHWMA- | 1.551 | 3.05 | 2.92 | 2.89 | 2.88 | 3.08 | 3.62 | 4.43 | 3.17 | 2.83 | |
| 0.75 | DHWMA-SR | 1.479 | 1.00 | 1.09 | 1.17 | 1.22 | 1.02 | 1.00 | 1.00 | 1.09 | 1.77 |
| DHWMA sign | 1.504 | 1.00 | 1.47 | 1.68 | 1.74 | 1.19 | 1.00 | 1.00 | 1.54 | 2.36 | |
| DHWMA- | 1.551 | 1.71 | 1.62 | 1.58 | 1.60 | 1.76 | 2.14 | 2.79 | 1.87 | 1.61 | |
| 1.00 | DHWMA-SR | 1.479 | 1.00 | 1.00 | 1.01 | 1.02 | 1.00 | 1.00 | 1.00 | 1.00 | 1.23 |
| DHWMA sign | 1.504 | 1.00 | 1.05 | 1.14 | 1.18 | 1.00 | 1.00 | 1.00 | 1.04 | 1.60 | |
| DHWMA- | 1.551 | 1.23 | 1.17 | 1.15 | 1.17 | 1.28 | 1.56 | 2.10 | 1.39 | 1.19 | |
| 1.25 | DHWMA-SR | 1.479 | 1.00 | 1.00 | 1.00 | 1.00 | 1.00 | 1.00 | 1.00 | 1.00 | 1.05 |
| DHWMA sign | 1.504 | 1.00 | 1.00 | 1.01 | 1.02 | 1.00 | 1.00 | 1.00 | 1.00 | 1.24 | |
| DHWMA- | 1.551 | 1.06 | 1.04 | 1.03 | 1.04 | 1.09 | 1.28 | 1.73 | 1.17 | 1.06 | |
| 1.50 | DHWMA-SR | 1.479 | 1.00 | 1.00 | 1.00 | 1.00 | 1.00 | 1.00 | 1.00 | 1.00 | 1.01 |
| DHWMA sign | 1.504 | 1.00 | 1.00 | 1.00 | 1.00 | 1.00 | 1.00 | 1.00 | 1.00 | 1.08 | |
| DHWMA- | 1.551 | 1.01 | 1.01 | 1.00 | 1.01 | 1.03 | 1.14 | 1.51 | 1.08 | 1.02 |
| t | |||||||||||||||
|---|---|---|---|---|---|---|---|---|---|---|---|---|---|---|---|
| 1 | −6.6033 | −8.6885 | −5.8915 | −5.3095 | −8.4897 | −6.5009 | −5.7023 | −7.0817 | −7.7137 | −6.2593 | 29 | 5.510 | 2.610 | 1.450 | 0.868 |
| 2 | −7.2912 | −7.0770 | −6.6033 | −6.7937 | −5.5964 | −6.6854 | −7.0175 | −8.1553 | −7.9577 | −7.7423 | 27 | 9.593 | 6.084 | 28.900 | 9.106 |
| 3 | −7.1472 | −4.8192 | −7.9577 | −6.9568 | −6.9925 | −5.8320 | −7.7173 | −4.2848 | −8.1303 | −7.1817 | 25 | 12.520 | 9.489 | 27.850 | 18.677 |
| 4 | −6.2307 | −7.3138 | −6.5914 | −9.2455 | −8.1826 | −8.6801 | −6.8044 | −4.8763 | −7.8196 | −7.2769 | 5 | 11.092 | 10.753 | 25.900 | 20.870 |
| 5 | −8.1826 | 5.8701 | −8.5778 | −7.1448 | −4.6407 | −7.5007 | −6.0010 | −6.4176 | −6.7901 | −4.9751 | 33 | 15.254 | 13.375 | 22.075 | 21.502 |
| 6 | −6.4545 | −7.5507 | −7.4162 | −6.0986 | −9.1538 | −4.6109 | −8.9110 | −6.7925 | −6.9401 | −8.6302 | 5 | 13.306 | 13.906 | 22.860 | 21.391 |
| 7 | −5.4226 | −8.6837 | −7.5947 | −8.6432 | −7.4781 | −7.3578 | −7.0317 | −7.3531 | −6.6366 | −8.4278 | −3 | 10.208 | 12.644 | 19.483 | 20.562 |
| 8 | −7.3281 | −8.3886 | −5.7880 | −7.1924 | −7.9934 | −7.6661 | −6.9056 | −8.3743 | −8.9670 | −7.1353 | −9 | 6.558 | 10.078 | 15.971 | 19.329 |
| 9 | −5.0822 | −4.8846 | −7.1758 | −8.4540 | −5.4048 | −7.0163 | −6.4581 | −8.3100 | −6.6187 | −5.2988 | 35 | 11.962 | 11.064 | 15.050 | 19.352 |
| 10 | −6.0010 | −8.7111 | −9.1169 | −8.4957 | −6.7568 | −7.6554 | −5.9820 | −6.7592 | −7.2603 | −6.8532 | 5 | 10.639 | 11.001 | 15.767 | 18.597 |
| 11 | −8.0029 | −8.5016 | −5.9796 | −6.4640 | −8.7111 | −6.7878 | −4.6990 | −7.0175 | −6.5759 | −4.6728 | 25 | 13.368 | 12.230 | 15.690 | 18.611 |
| 12 | −8.4314 | −4.5347 | −5.5547 | −6.0641 | −4.1598 | −5.2453 | −8.4350 | −8.5826 | −8.1826 | −6.6068 | 29 | 16.338 | 14.342 | 16.736 | 18.702 |
| 13 | −7.4959 | −7.4400 | −5.7975 | −5.3500 | −4.8989 | −7.2162 | −5.8011 | −6.9865 | −5.8904 | −4.1277 | 49 | 22.544 | 18.496 | 18.758 | 19.423 |
| 14 | −6.9270 | −8.2433 | −7.0175 | −8.0220 | −6.9639 | −6.1308 | −8.2957 | −6.4259 | −6.0034 | −8.3897 | 11 | 20.350 | 19.856 | 19.185 | 18.886 |
| 15 | −8.4040 | −7.5173 | −8.5457 | −6.0379 | −4.5264 | −5.9844 | −4.4597 | −5.3976 | −5.7523 | −8.3040 | 35 | 23.134 | 21.886 | 19.800 | 19.462 |
| t | ||||||||||
|---|---|---|---|---|---|---|---|---|---|---|
| 1 | 74.012 | 74.015 | 74.030 | 73.986 | 74.000 | 8 | 0.400 | 0.020 | 0.400 | 0.320 |
| 2 | 73.995 | 74.010 | 73.990 | 74.015 | 74.001 | 4 | 0.580 | 0.048 | 7.800 | 2.720 |
| 3 | 73.987 | 73.999 | 73.985 | 74.000 | 73.990 | −14 | −0.149 | 0.038 | 5.000 | 3.920 |
| 4 | 74.008 | 74.010 | 74.003 | 73.991 | 74.006 | 7 | 0.208 | 0.047 | −0.283 | 3.053 |
| 5 | 74.003 | 74.000 | 74.001 | 73.986 | 73.997 | −3 | 0.048 | 0.047 | 1.038 | 2.413 |
| 6 | 73.994 | 74.003 | 74.015 | 74.020 | 74.004 | 9 | 0.496 | 0.069 | 0.830 | 2.355 |
| 7 | 74.008 | 74.002 | 74.018 | 73.995 | 74.005 | 10 | 0.971 | 0.114 | 2.242 | 2.585 |
| 8 | 74.001 | 74.004 | 73.990 | 73.996 | 73.998 | −6 | 0.622 | 0.140 | 2.550 | 2.258 |
| 9 | 74.015 | 74.000 | 74.016 | 74.025 | 74.000 | 12 | 1.191 | 0.192 | 2.381 | 2.665 |
| 10 | 74.030 | 74.005 | 74.000 | 74.016 | 74.012 | 14 | 1.832 | 0.274 | 3.550 | 3.063 |
| 11 | 74.001 | 73.990 | 73.995 | 74.010 | 74.024 | 4 | 1.940 | 0.358 | 4.095 | 3.052 |
| 12 | 74.015 | 74.020 | 74.024 | 74.005 | 74.019 | 15 | 2.593 | 0.469 | 4.636 | 3.584 |
| 13 | 74.035 | 74.010 | 74.012 | 74.015 | 74.026 | 15 | 3.213 | 0.606 | 5.500 | 3.954 |
| 14 | 74.017 | 74.013 | 74.036 | 74.025 | 74.026 | 15 | 3.803 | 0.766 | 6.231 | 4.311 |
| 15 | 74.010 | 74.005 | 74.029 | 74.000 | 74.020 | 14 | 4.313 | 0.944 | 6.807 | 4.613 |
Disclaimer/Publisher’s Note: The statements, opinions and data contained in all publications are solely those of the individual author(s) and contributor(s) and not of MDPI and/or the editor(s). MDPI and/or the editor(s) disclaim responsibility for any injury to people or property resulting from any ideas, methods, instructions or products referred to in the content. |
© 2025 by the author. Licensee MDPI, Basel, Switzerland. This article is an open access article distributed under the terms and conditions of the Creative Commons Attribution (CC BY) license (https://creativecommons.org/licenses/by/4.0/).
Share and Cite
Alevizakos, V. A Nonparametric Double Homogeneously Weighted Moving Average Signed-Rank Control Chart for Monitoring Location Parameter. Mathematics 2025, 13, 3027. https://doi.org/10.3390/math13183027
Alevizakos V. A Nonparametric Double Homogeneously Weighted Moving Average Signed-Rank Control Chart for Monitoring Location Parameter. Mathematics. 2025; 13(18):3027. https://doi.org/10.3390/math13183027
Chicago/Turabian StyleAlevizakos, Vasileios. 2025. "A Nonparametric Double Homogeneously Weighted Moving Average Signed-Rank Control Chart for Monitoring Location Parameter" Mathematics 13, no. 18: 3027. https://doi.org/10.3390/math13183027
APA StyleAlevizakos, V. (2025). A Nonparametric Double Homogeneously Weighted Moving Average Signed-Rank Control Chart for Monitoring Location Parameter. Mathematics, 13(18), 3027. https://doi.org/10.3390/math13183027


