Article

Black–Litterman Portfolio Optimization with Dynamic CAPM via ABC-MCMC

by
Sebastián Flández
1,
Rolando Rubilar-Torrealba
1,*,
Karime Chahuán-Jiménez
2,
Hanns de la Fuente-Mella
3 and
Claudio Elórtegui-Gómez
4
1
Departamento de Industrias, Universidad Técnica Federico Santa María, Valparaíso 2090123, Chile
2
Centro de Investigación en Negocios y Gestión Empresarial, Escuela de Auditoría, Facultad de Ciencias Económicas y Aministrativas, Universidad de Valparaiso, Valparaíso 2340027, Chile
3
Facultad de Ciencias, Instituto de Estadística, Pontificia Universidad Católica de Valparaíso, Valparaíso 2340031, Chile
4
Facultad de Ciencias Económicas y Administrativas, Escuela de Periodismo, Pontificia Universidad Católica de Valparaíso, Valparaíso 2373223, Chile
*
Author to whom correspondence should be addressed.
Mathematics 2025, 13(20), 3265; https://doi.org/10.3390/math13203265
Submission received: 7 September 2025 / Revised: 8 October 2025 / Accepted: 10 October 2025 / Published: 12 October 2025

Abstract

The present research proposes a methodology for portfolio construction that integrates the Black–Litterman model with expected returns generated through simulations under dynamic Capital Asset Pricing Model (CAPM) with conditional betas, estimated via Approximate Bayesian Computation Markov Chain Monte Carlo (ABC-MCMC). Bayesian estimation enables the incorporation of volatility regimes and the adjustment of each asset’s sensitivity to the market, thereby delivering expected returns that more accurately reflect the structural state of the assets compared to historical methods. This strategy is applied to the United States stock market, and the results suggest that the Black–Litterman portfolio performs competitively against portfolios optimised using the classic Markowitz model, even maintaining the same fixed weights throughout the month. Specifically, it has been demonstrated to outperform the minimum variance portfolio with regard to cumulative return and attains a Sharpe ratio that approaches the Markowitz maximum Sharpe portfolio, although it does so with a distinct and more concentrated asset allocation. It has been observed that, while the maximum return portfolio attains the highest absolute profit, it does so at the expense of significantly higher volatility.

1. Introduction

In a world where economic uncertainty and financial cycles directly affect individuals’ and organizations’ well-being, making informed investment decisions is a strategic necessity. Building an efficient investment portfolio is essential, not just desirable. In this context, quantitative finance, particularly the construction of optimal portfolios, has become increasingly important [1].
One of the most important challenges in investment management is constructing optimal portfolios that reflect market equilibrium and investors’ particular views. In this context, the Black–Litterman model, which combines the fundamentals of the Capital Asset Pricing Model (CAPM) with a Bayesian approach to incorporate subjective views on expected returns, has become a widely accepted standard in the financial literature [2,3]. This formulation uses an equilibrium return structure as a neutral starting point that is adjusted according to the investor’s beliefs and the degree to which they are confident in them. This portfolio optimization methodology combines market expectations with investor opinions using a Bayesian approach. Black and Litterman designed this model to overcome the limitations of Markowitz’s mean-variance model by allowing for the incorporation of subjective expectations about asset return. It has been applied in various contexts, resolving many practical shortcomings of traditional optimization models, such as extreme solutions or high sensitivity to small parameter errors. The result is portfolios that are more stable, consistent with historical evidence, and adaptable to different investment horizons and operational constraints. This makes the model useful in complex contexts, such as global bond and stock markets [4,5,6].
One of the model’s outstanding features is its ability to integrate advanced data analysis techniques. Incorporation of neural networks and Gaussian models has improved the accuracy of return estimates and enabled more effective risk management in portfolios [7,8,9]. Furthermore, the use of copulas and GARCH models has allowed investors to more effectively manage correlations and volatility in financial markets [10,11,12].
The ability of models to adapt to highly volatile environments is crucial. Black–Litterman has been shown to perform well in fluctuating markets through the use of predictive modelling techniques [13], while dynamic CAPM adjusts risk premiums to reflect current market conditions [5,9,14].
The dynamic CAPM is an extension of the classic asset pricing model that considers temporal variations in risk premiums. Unlike the static CAPM, which assumes equilibrium in the market and constant risk premiums, the dynamic CAPM allows risk premiums to fluctuate over time in response to changes in economic conditions and market expectations. This makes the dynamic CAPM particularly useful for analysing emerging markets and incorporating macroeconomic and environmental factors affecting financial stability [11,15].
The Black–Litterman model [2] is a robust and flexible tool for constructing optimal portfolios [16,17,18] by combining market equilibrium information with subjective investor views [19] in a formal Bayesian framework [20,21]. This model has been extended to address the original approach’s structural limitations, such as the normality assumption in returns [22] and the absence of bias in investor views. Palczewski and Palczewski (2019) [23] introduce a general formulation of the Black–Litterman model for arbitrary continuous distributions and risk measures, such as conditional value-at-risk (CVaR) [24]. Pang and Karan (2018) [25] propose a closed-form solution under elliptical distributions, which is relevant when modelling returns with heavy tails. These extensions form the basis of the research presented here, which incorporates conditional betas generated using approximate Bayesian methods, specifically it uses Approximate Bayesian Computation Markov Chain Monte Carlo (ABC-MCMC) to achieve their objective. These distributions are difficult to fit to classical normality.
This research apply to ABC-MCMC algorithm to estimate a dynamic CAPM model with conditional betas, where the beta parameter varies according to an active market state. In this case, the state is represented by the S&P 500 volatility index, which aims to capture global market uncertainty. The authors of [26] indicate that the unconditional CAPM model is completely rejected when the regression statistics of asset returns are obtained from conditional betas and market returns. However, the conditional CAPM is not rejected and could be used to predict asset returns.
Accurately generating investor opinions is essential to the success of the Black–Litterman model. Using techniques such as machine learning, including long short-term memory (LSTM) and neural networks, has improved the accuracy of these opinions, resulting in better portfolio optimization [10,27,28].
Advances in algorithmic techniques, such as the use of Gaussian mixture models and artificial intelligence methods, have improved the accuracy of return estimation and risk management. These improvements provide a more robust framework for portfolio optimization [29,30,31].
Formulating Conditional CAPM requires estimating conditional betas that depend on state variables or time. This poses computational challenges when applying less restrictive assumptions or nonparametric models. Given this complexity, our research proposes estimating conditional CAPM using the ABC-MCMC method, which approximates the posterior distribution of parameters without specifying an explicit likelihood function [32]. Based on this Bayesian paradigm, we present the Approximate Bayesian Computation method [33], which can be considered a Bayesian methodological framework consisting of a set of algorithms and techniques that approximate the posterior distribution without explicitly calculating the likelihood. In this methodology, likelihood calculation is replaced by a simulation process. In classical ABC (ABC Rejected), candidate parameters are generated from the prior; data are simulated under the model for those parameters; and the similarity between the simulated and observed data is compared using a metric defined on summary statistics. Parameters that produce simulations sufficiently similar to the real data are accepted as representative of the posterior distribution.
The ABC method has been used in various contexts, including financial market estimation of moving average trading parameters in cryptocurrency trading to obtain a daily price using classic ABC by rejection [32], cosmology implementation of ABC-SMC to select dark energy models consistent with astrophysical observations, showing that dynamic models outperform the standard Lambda Cold Dark Matter (ΛCDM) model [34]. In health, it has been used in the design of phase I clinical trials. Here, the use of ABC-SMC allows for the determination of optimal dosing decisions under uncertainty without requiring explicit plausibility [35]. In cybersecurity, it has been used to calibrate advanced epidemiological models, such as SIIDR. This demonstrates greater accuracy in representing malware propagation compared to classical models, such as SIR [36].
Additionally, variations in methods with shared characteristics have emerged; for example, Lazy ABC [37] is a computationally efficient alternative to classical rejection. It achieves significant improvements in costly simulation problems by abandoning iterations. They implement probabilistic stopping and weight the accepted simulations. The authors of Lazy ABC extend this logic and assert that it can be used in different ABC algorithms. However, in this research, the algorithm is used in its entirety.
In summary, this study aims to integrate the Black–Litterman model with expected returns obtained through simulations under a dynamic CAPM. This model uses conditional betas estimated via approximate ABC-MCMC. This integration is intended to better capture asset sensitivity to the market in different volatility regimes. In addition, the research analyses the model’s ability to generate stable portfolios consistent with historical evidence by incorporating market equilibrium structures and investors’ views. These enhancements will improve investment decision making under conditions of uncertainty. Finally, the research explores the intersection of Bayesian statistics and asset pricing theory. The study proposes integrating the ABC-MCMC method with the Black–Litterman model using nonparametric conditional betas. The goal is to contribute to the literature on portfolio construction in financial markets.

2. Materials and Methods

2.1. Data

The dataset used corresponds to a time series of daily returns covering the period from 1 September 2019, to 28 February 2021. This time window is divided into training and simulation periods, applying a rolling window scheme with one-month shifts. The first training period spans from 1 September 2019 to 29 February 2020 (six months). This set is used to estimate the parameters of the dynamic CAPM model, apply the ABC-MCMC algorithm, and generate the expected returns that will feed the Black–Litterman portfolio optimization model. The first simulation period, from 1 March 2020 to 31 March 2020 (one month), corresponds to the test set and is used to evaluate the out-of-sample performance of the generated portfolios, comparing their returns and risk levels against alternative models. This procedure is repeated 12 times, shifting the window by one month in each iteration, allowing simulating a full year. This strategy enables a more robust validation of the proposed approach by simulating real-world implementation conditions with a clear separation between calibration and evaluation.
Fifty U.S. assets that are part of S&P 500 and have stock records dating back to 2000 were used. These assets belong to various industries (financial, technological, healthcare, consumer, among others) and are traded on the New York Stock Exchange (NYSE). The selection includes sectoral diversity and liquidity among the chosen companies. Table 1 shows the daily descriptive statistics of the assets and indicators used in this work during the first training period (from 1 September 2019 to 29 February 2020), including the symbol used on the NYSE as an abbreviation for the asset name, mean, standard deviation, minimum, maximum, and median observed.
Historical data show companies with negative and positive average returns, all with daily means below 0.003 and standard deviations around 0.01. On average, the assets present a daily mean return of 0.00008 with a standard deviation of 0.01513, with APA being the most volatile asset and WMT the least. The S&P 500 index shows a mean of 0.000076 with lower volatility than most individual stocks.
It should be noted that during the data observation period, the investor’s tendency to prefer companies that distribute dividends, as well as the specific tax rate applicable to each shareholder, was not considered; the analysis was conducted exclusively using adjusted closing prices. Therefore, the portfolio construction aims for a return derived from the appreciation of stock prices. The choice of the simulation period is directly related to the COVID-19 pandemic, with the objective of analysing how the methodology performs during a period of crisis.

2.2. Dynamic CAPM Model

The objective of this research is to estimate a dynamic CAPM model using a Bayesian approach, in which the systematic parameter β varies according to a state variable that represents the uncertainty of the market. To this end, the ABC-MCMC algorithm is employed to obtain posterior distributions of the model parameters without explicitly evaluating the likelihood function. Furthermore, a dedicated treatment of extreme parameters β is contemplated, with the objective of capturing asymmetric behaviours in high volatility scenarios.
A financial return model for an asset is considered i at time t, where systematic risk is modelled as a conditional function of a latent market variable z t . In this study, z t is defined as a 20-day rolling Sharpe-type ratio that approximates one trading month (about four weeks). Specifically, z t is constructed as the difference between the 20-day average return of the S&P 500 index and the 20-day average of the daily risk-free rate (proxied by the 1-year U.S. Treasury yield, converted to daily frequency), divided by the 20-day rolling standard deviation of S&P 500 returns. This formulation ensures that short-term dynamics of both the market and the risk-free rate are incorporated into the state variable, which serves as the basis for determining the conditional betas of the dynamic CAPM. The model is expressed as
r i , t = α i + β i ( z t ) r m , t + ε i , t , ε i , t N ( 0 , σ i 2 ) ,
where r i , t corresponds to the returns of the asset i in period t; α i in the standard CAPM model should represent the risk-free asset, but from an empirical perspective, it represents the return on the asset that is not explained by market risk [38]; r m , t correspond to the returns of the market index in period t; ε t corresponds to the term of error in period t, which we assume to be a normal distribution. The β value corresponds to a term that depends on the value of the market index; z t corresponds to the standard deviation of r m , t measured with m lag periods. The specifications of the variables are defined below.
r i , t = log P i , t P i , t 1 ,
r m , t = log P m , t P m , t 1 ,
β ( z t ) = β low if z t q 20 ( Z T ) , β med if q 20 ( Z T ) < z t q 80 ( Z T ) , β high if z t > q 80 ( r m ) ,
where P i , t and P m , t correspond to the price of the asset i and the market index in period t, respectively; q x corresponds to the percentile function ‘x’ of the time series Z T ; Z T corresponds to the vector of all z t q , measured from period t q to t; β low , β med , β high corresponds to the low, medium, and high volatility values of the dynamic model described in (1), which allows us to interpret three scenarios of volatility in which the financial series finds itself, with different behaviours.
In Equation (4), q 20 ( Z T ) and q 80 ( Z T ) represent the 20th and 80th percentiles of the empirical distribution of the Z T , respectively. The lower 20% of the Z T will be considered to represent days of low volatility (i.e., a calm market), while the upper 20% will be regarded as periods of high volatility or financial stress (i.e., crises and shocks). This approach, referred to as ‘extreme β ’, facilitates the estimation of market sensitivity in regimes of financial stress or relative stability in a differentiated manner. The selection of the 20th and 80th percentiles as the defining criteria for market regimes is arbitrary, but is based on empirical methodologies that have become widespread among financial researchers.
In particular, Jegadeesh and Titman [39] employ quintile segmentation to categorise assets according to their historical performance. This methodology enables the identification of resilient patterns of behaviour, such as momentum or reversion effects. The quintile discretisation methodology facilitates comparison between extreme groups (e.g., winners and losers) and allows specific dynamics within each group to be isolated. Utilising this rationale, the present study employs quintile partitioning of a function of S&P 500 index as a non-parametric surrogate for the degree of financial stress, thereby enabling the capture of asymmetries in market sensitivity under varying volatility conditions without the imposition of restrictive functional assumptions.

2.3. ABC-MCMC Algorithm

The implementation of the dynamic CAPM model with extreme β presents significant difficulties for the formulation of an explicit and tractable likelihood function. Firstly, the conditional β is modelled as a piecewise function of the volatility index r m , t , defined by empirical percentiles. This specification introduces discontinuities and abrupt changes in the model structure, which prevents the derivation of a closed and differentiable form of the likelihood. Moreover, when evaluating the joint probability of the observed returns under this formulation, it is necessary to condition iteratively for each value of r m , t to determine the regime in which the β is found in each period. This suggests the presence of an implicit latent state structure, analogous to that observed in regime switching models or threshold models. However, it should be noted that the analytical evaluation of such models can be intricate and computationally intensive.
For these reasons, the ABC-MCMC model is utilised. This approach is initiated from a set of observed data y corresponding to the observed returns r i , t . Subsequently, a parameter vector, designated as θ ( 0 ) = ( α ,   β low ,   β med ,   β high ,   σ ) , is proposed from an a priori distribution, along with a substantial number of iterations (N = 10,000).
It is important to note that the ABC-MCMC algorithm is susceptible to the effects of a low acceptance rate, particularly during the initial stages of the chain. To mitigate this, an initial condition has been incorporated into the algorithm. This ensures that the sampling process begin only once an initial set of parameters, denoted by θ ( 0 ) , has been identified. This set of parameters is required to generate a simulation that meets the required acceptance criteria. It is important to note that the algorithm will not start until it identifies a value such that the following condition is satisfied: δ ( s ( y sim ) ,   s ( y obs ) ) < ε . The value of the parameter is expressed as a decimal number, with a precision of 0.001. Furthermore, a maximum number of 20,000 attempts has been set to ascertain this initial value.
In the event that, subsequent to these attempts, no accepted proposal is obtained, it is considered that the model is incapable of adequately replicating the behaviour of the asset under study, and it is discarded from further analysis. This measure aims to circumvent the occurrence of degenerate chains and enhance the overall robustness of the procedure. The corresponding algorithm is shown in Algorithm 1.
Algorithm 1 ABC-MCMC with initial validation and attempt limit for dynamic CAPM with Extreme β
  1: Set N = 10000 , max _ attempts =   20000 , counter  = 0 , ϵ = 0.05
  2: repeat
  3:       Define θ ( 0 ) prior
  4:       Simulate y ( 0 ) f ( θ ( 0 ) )
  5:        δ = δ ( s ( y ( 0 ) ) ,   s ( y ) )
  6:       counter  + = 1
  7: until  δ < ε  or counter = max_attempts
  8: if counter = max_attempts and  δ ε  then
  9:       Terminate: asset rejected after max attempts
10: else
11:       for  t = 1  to  N 1  do
12:             Generate θ ( t ) q ( θ ( t ) | θ ( t 1 ) )
13:             Simulate y ( t ) f ( θ ( t ) )
14:             if  δ ( s ( y ( t ) ) ,   s ( y ) ) < ε  then
15:                    θ ( t ) = θ ( t )
16:             else
17:                    θ ( t ) = θ ( t 1 )
18:             end if
19:       end for
20: end if
21: return  { θ ( t ) } t = 0 N 1
The distribution θ ( t ) is used to simulate a series of returns y t (representing the simulated returns r ~ i , t ) using the observed values of r m , t , under the proposed parameters, ϵ represents the tolerance or threshold for accepting or rejecting a distribution, where θ ( t ) is accepted if the distance δ ( s ( y t simulated ) ,   s ( y observed ) ) is less than ϵ (the tolerance ϵ was set at a value of 0.05). This procedure is repeated during N iterations (a chain of N elements is expected), and the accepted samples are interpreted as coming from the approximate posterior distribution.
In order to verify the validity of the simulated parameters, the following summary statistics are selected for the purpose of comparing simulations and observed data. The summary statistics employed include the average asset returns, standard deviation, a static β coefficient estimated by linear regression, and the autocorrelation of the residuals. The distance between the simulation generated by a set of proposed parameters and the actual data is calculated as the Euclidean norm between the summary statistic vectors.
In the Bayesian formulation of the dynamic CAPM model, the choice of prior distributions for the parameters is fundamental, as it directly influences the ability of the ABC-MCMC algorithm to explore plausible regions of the parametric space in the absence of an explicit likelihood function. In this research, the decision has been taken to utilise a zero-centred normal distribution with reduced variance for the intercept, i.e., alpha is modelled as a random variable drawn from a distribution α N ( 0 ,   0 . 05 2 ) . This decision is founded upon the market efficiency hypothesis, which posits that abnormal returns ( α ) should, on average, be zero. As articulated by Jegadeesh and Titman [39], even when persistent patterns such as momentum are identified, these do not ensure the presence of systematic alphas that can be utilised without incurring additional risk. Consequently, adopting a central value close to zero is a rational approach.
In relation to market sensitivity coefficients in different volatility regimes ( β low < β med < β high ), a normal distribution with mean 1 and variance 0 . 25 2 is adopted for each of them. This formulation reflects the idea that β should fluctuate around the theoretical equilibrium value of the CAPM (equal to 1) but allow for contextual adjustments based on market conditions. In accordance to proposal by Basu and Stremme [40], this approach is consistent with the evidence that betas can vary over time in response to macroeconomic or market variables. Consequently, this enhances the explanatory power of the CAPM in comparison to its static version.
Finally, the standard deviation of errors, denoted by σ , is specified as a uniform distribution, denoted by U ( 0.01 ,   0.5 ) . This distribution is selected to encompass a sufficiently wide range of daily volatilities observed in equity assets, while avoiding the inclusion of extreme values that could compromise the stability of the algorithm. As Martin et al. [41] assert, in approximate inference contexts such as ABC, it is imperative to define informed yet not overly restrictive priors, particularly for dispersion parameters, as these directly influence the variability of the simulations and the acceptance rate of the algorithm. This range has been demonstrated to adequately cover both low-volatility assets and those with more erratic behaviour, without introducing strong a priori biases.

2.4. Black–Litterman Portfolio

The Black–Litterman model facilitates the integration of market beliefs, implicit in market capitalisation weightings, with the analyst’s personal expectations in a structured manner. The present research proposes an extension to the traditional approach by incorporating expectations obtained through Bayesian simulation, applied to a dynamic CAPM model.
In contrast to conventional approaches, the expected asset returns (Q) are not estimated using static regressions. Rather, they are obtained from the simulation of daily return trajectories under a dynamic CAPM model. The parameters of this model have been estimated using the ABC-MCMC algorithm. In this approach, the β parameter is not constant, but rather is subject to variation in accordance with the state of the market, which is represented by the level of the S&P 500 index, denoted by r m , t .
For each sample accepted by the ABC-MCMC algorithm, a trajectory of expected daily returns is simulated as follows:
r ~ i , t ( j ) = α i ( j ) + β i ( j ) ( z t ) · r m , t .
In the notation employed, the subscript i denotes a particular asset within the portfolio, while the superscript j designates the j-th simulated sample accepted by the ABC-MCMC algorithm. In conclusion, the anticipated return on asset i (the expected simulated daily return) is calculated as the mean of all accepted simulated trajectories, using
E [ r i ] = 1 N j = 1 N 1 T t = 1 T r ~ i , t ( j ) .
This procedure allows capturing both the non-linear dynamics of systematic risk and parameter uncertainty, integrating these elements into the estimation of expected returns that are subsequently used as views in the Black–Litterman model. The Q vector is constructed by stacking the values of E [ r i ] estimated for each asset through Equation (6), representing the analyst’s subjective expectations (views) in the model. The implied market returns (Π) are calculated using the Black–Litterman equilibrium equation:
Π = λ · Σ · w m k t ,
where Σ is the sample covariance matrix of daily returns, and w m k t is the vector of market capitalization weights. The risk aversion parameter λ is interpreted as the coefficient of the representative investor in a mean-variance optimization problem, and is estimated as follows:
λ = E [ r m k t ] r f σ m k t 2 ,
where E [ r m k t ] denotes the historical average annualised return of the S&P 500 index, σ m k t 2 its variance, and r f corresponds to the risk-free rate. In this study, r f is proxied by the 1-year U.S. Treasury securities yield, reported as an annualised daily series. For consistency with the monthly rebalancing of portfolios, the risk-free rate is calculated as the monthly average of this series.

3. Results

3.1. Estimation of Dynamic CAPM Parameters

Before analysing the portfolios, it is important to present the results obtained from the estimation of the dynamic CAPM parameters using the Approximate Bayesian Computation procedure. For each asset, the algorithm generates a large number of candidate parameter sets, of which only those that satisfy the imposed acceptance criteria are retained. These accepted distributions are then used to characterise the parameters of the model: the intercept α , the betas corresponding to different market states ( β l o w , β m e d , β h i g h ), and the volatility parameter σ . Regarding the number of accepted distributions, the results varied significantly across assets: in some cases, only a single parameter set was accepted, while in others, up to 40 or 50 valid sets were obtained. The situation of obtaining just one valid parameter set is rare and not representative of the general behaviour, since most assets presented a larger number of accepted distributions.
As an illustrative example, Figure 1 displays histograms of the accepted parameter draws for the asset WMT, based on simulations for January 2020 with a 1-year training window. The figure was generated from 100,000 ABC–MCMC iterations (rather than 10,000) to better capture and illustrate the shape of the parameter distributions. These distributions reflect uncertainty in the estimation process: α is centered near zero; the three betas vary across different market states; and σ exhibits a multimodal pattern, indicating heterogeneity in the plausible volatility levels supported by the data. Such parameter distributions serve as inputs for the construction of the portfolios analysed in the following subsections.

3.2. Performance During the Crisis Period (2020)

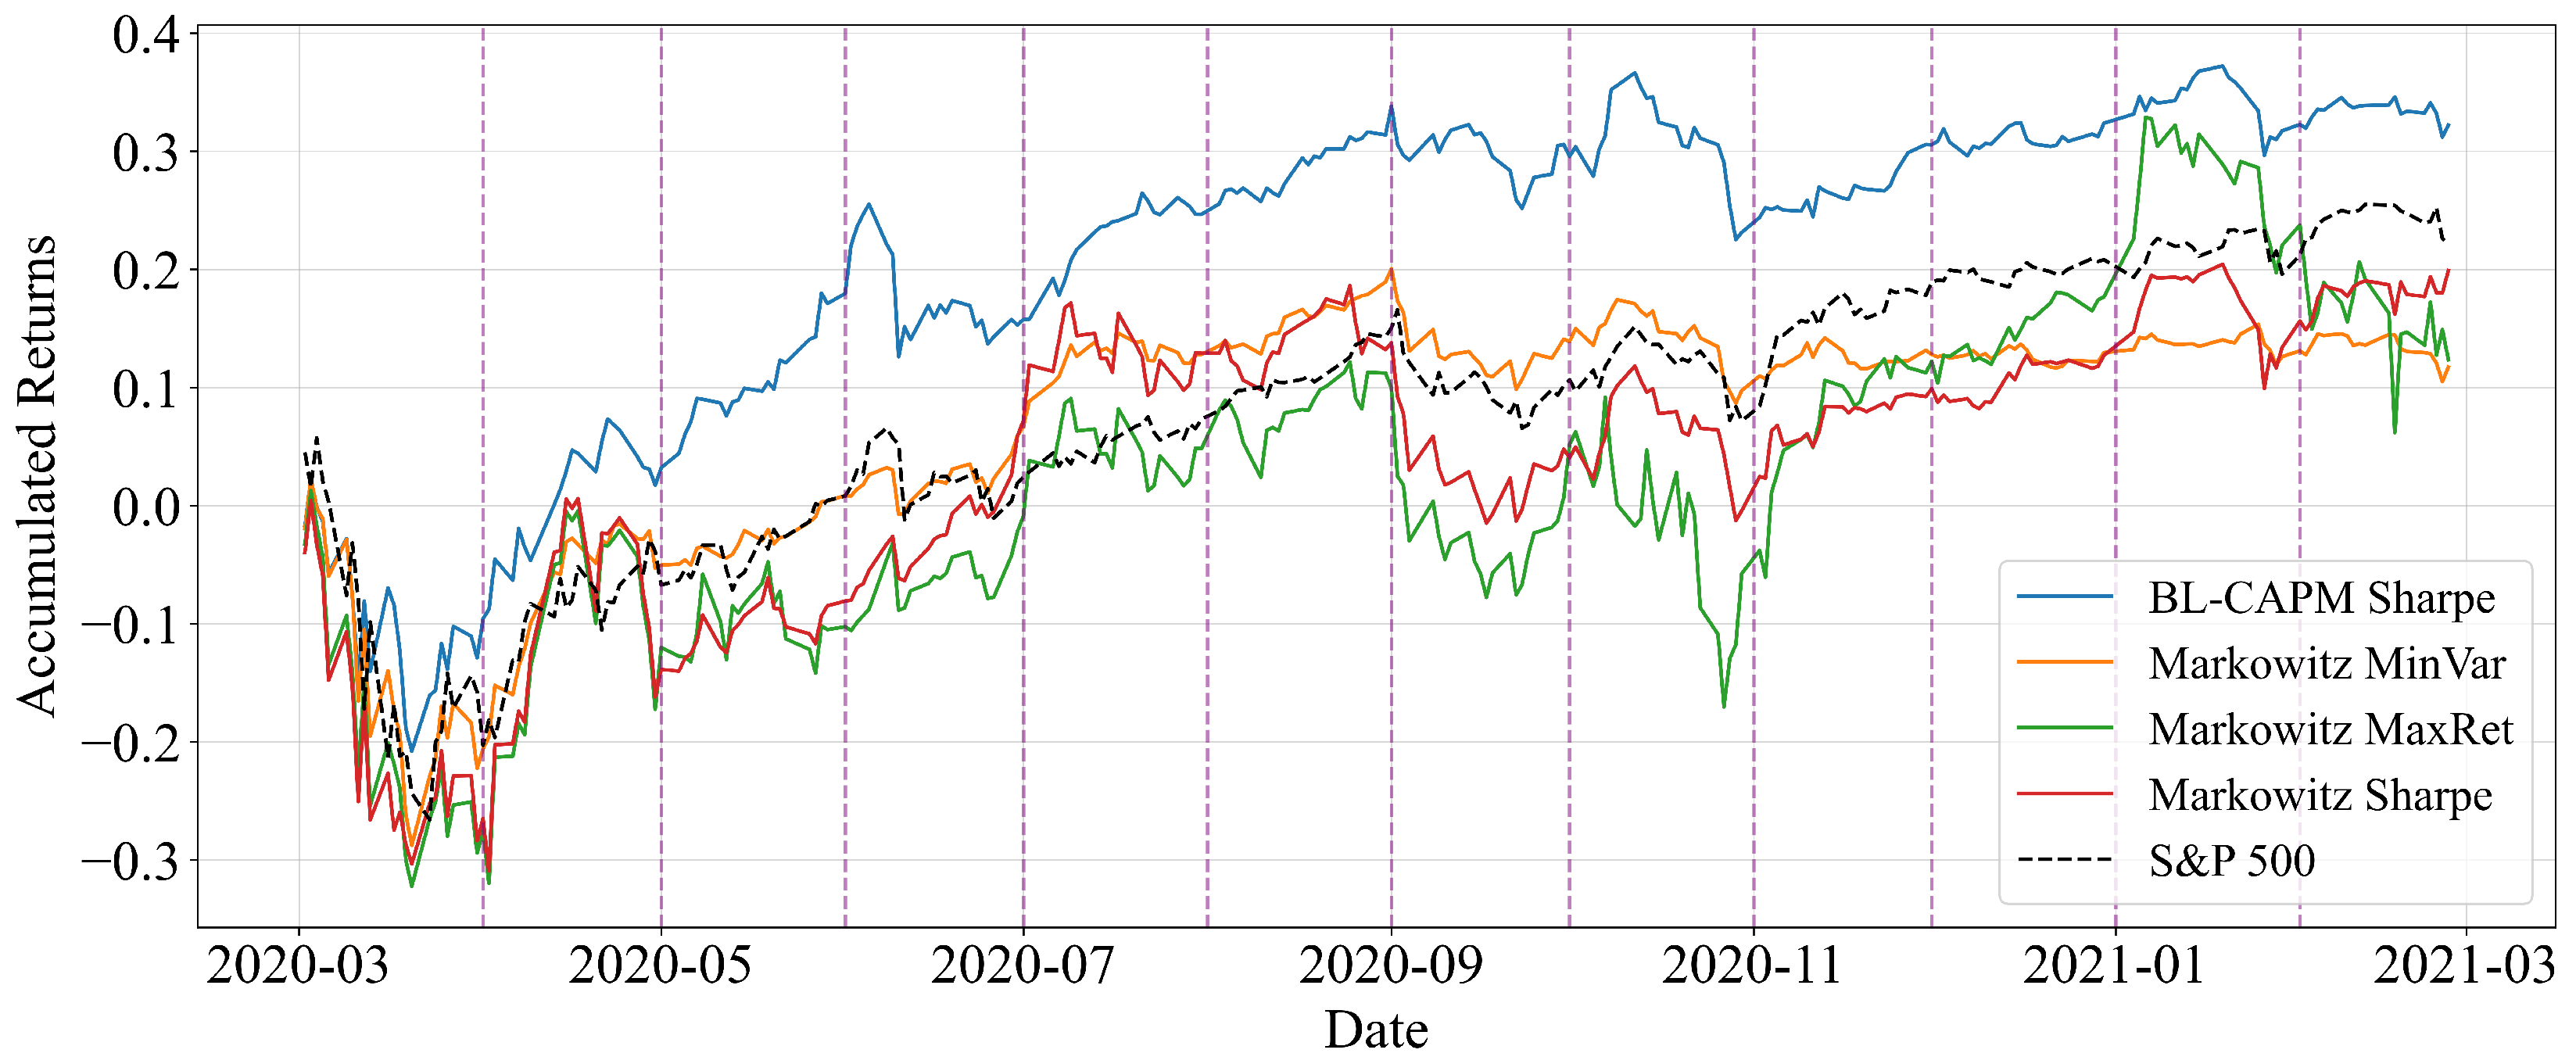
We begin by analysing the year 2020, which covers the period from March 2020 to February 2021, a time marked by high volatility and the initial COVID-19 crisis. Figure 2 presents the real cumulative return of the Buy-and-Hold portfolios with a 6-month training window. Each line corresponds to a distinct strategy that an investor can adopt, enabling a comparison of results between the various strategies with regard to both the final cumulative return and the variability of each strategy. In this sense, higher levels of cumulative return imply a superior investment scenario, weighed against certain tolerable levels of risk. In this scenario, the BL-CAPM Sharpe strategy exhibits a markedly different behaviour compared to the classical Markowitz approaches and the benchmark (S&P 500).
Table 2 shows the portfolio composition on 1 May 2020. On this date, the Markowitz MaxRet strategy allocated 100% of the investment to AMD, while the BL-CAPM Sharpe strategy concentrated the entire portfolio in EBAY. In contrast, the Markowitz MinVar and Markowitz Sharpe portfolios presented more diversified allocations across several assets. It is important to note that, among the 50 assets considered in the analysis, no valid parameter sets were obtained for the simulations corresponding to May for the following companies: HP, APA, COF, CCL, CAG, and DRI. Therefore, these firms were excluded from the optimization of the portfolios. Finally, the remaining companies not listed in Table 2 simply did not receive an investment allocation on that date.
A significant element of the estimation process is the concentration on a particular asset. Note that the date in this case corresponds to the beginning of the global pandemic, when there was complete uncertainty about the future of the financial markets, causing high levels of uncertainty and volatility that affected the portfolio optimisation process. Table 3 shows how the portfolios evolved six months later. Greater knowledge about the phenomenon of the pandemic allowed for a more appropriate optimisation process for investors, as reflected in the greater diversification of financial assets.
The results also show that the portfolio constructed with the BL-CAPM Sharpe strategy achieved a superior realised return compared to all other Markowitz portfolios and even outperformed the benchmark (S&P 500). This reinforces the idea that the alternative allocation derived from the Black–Litterman approach captures dynamics that are not fully reflected in the classical mean-variance optimization.
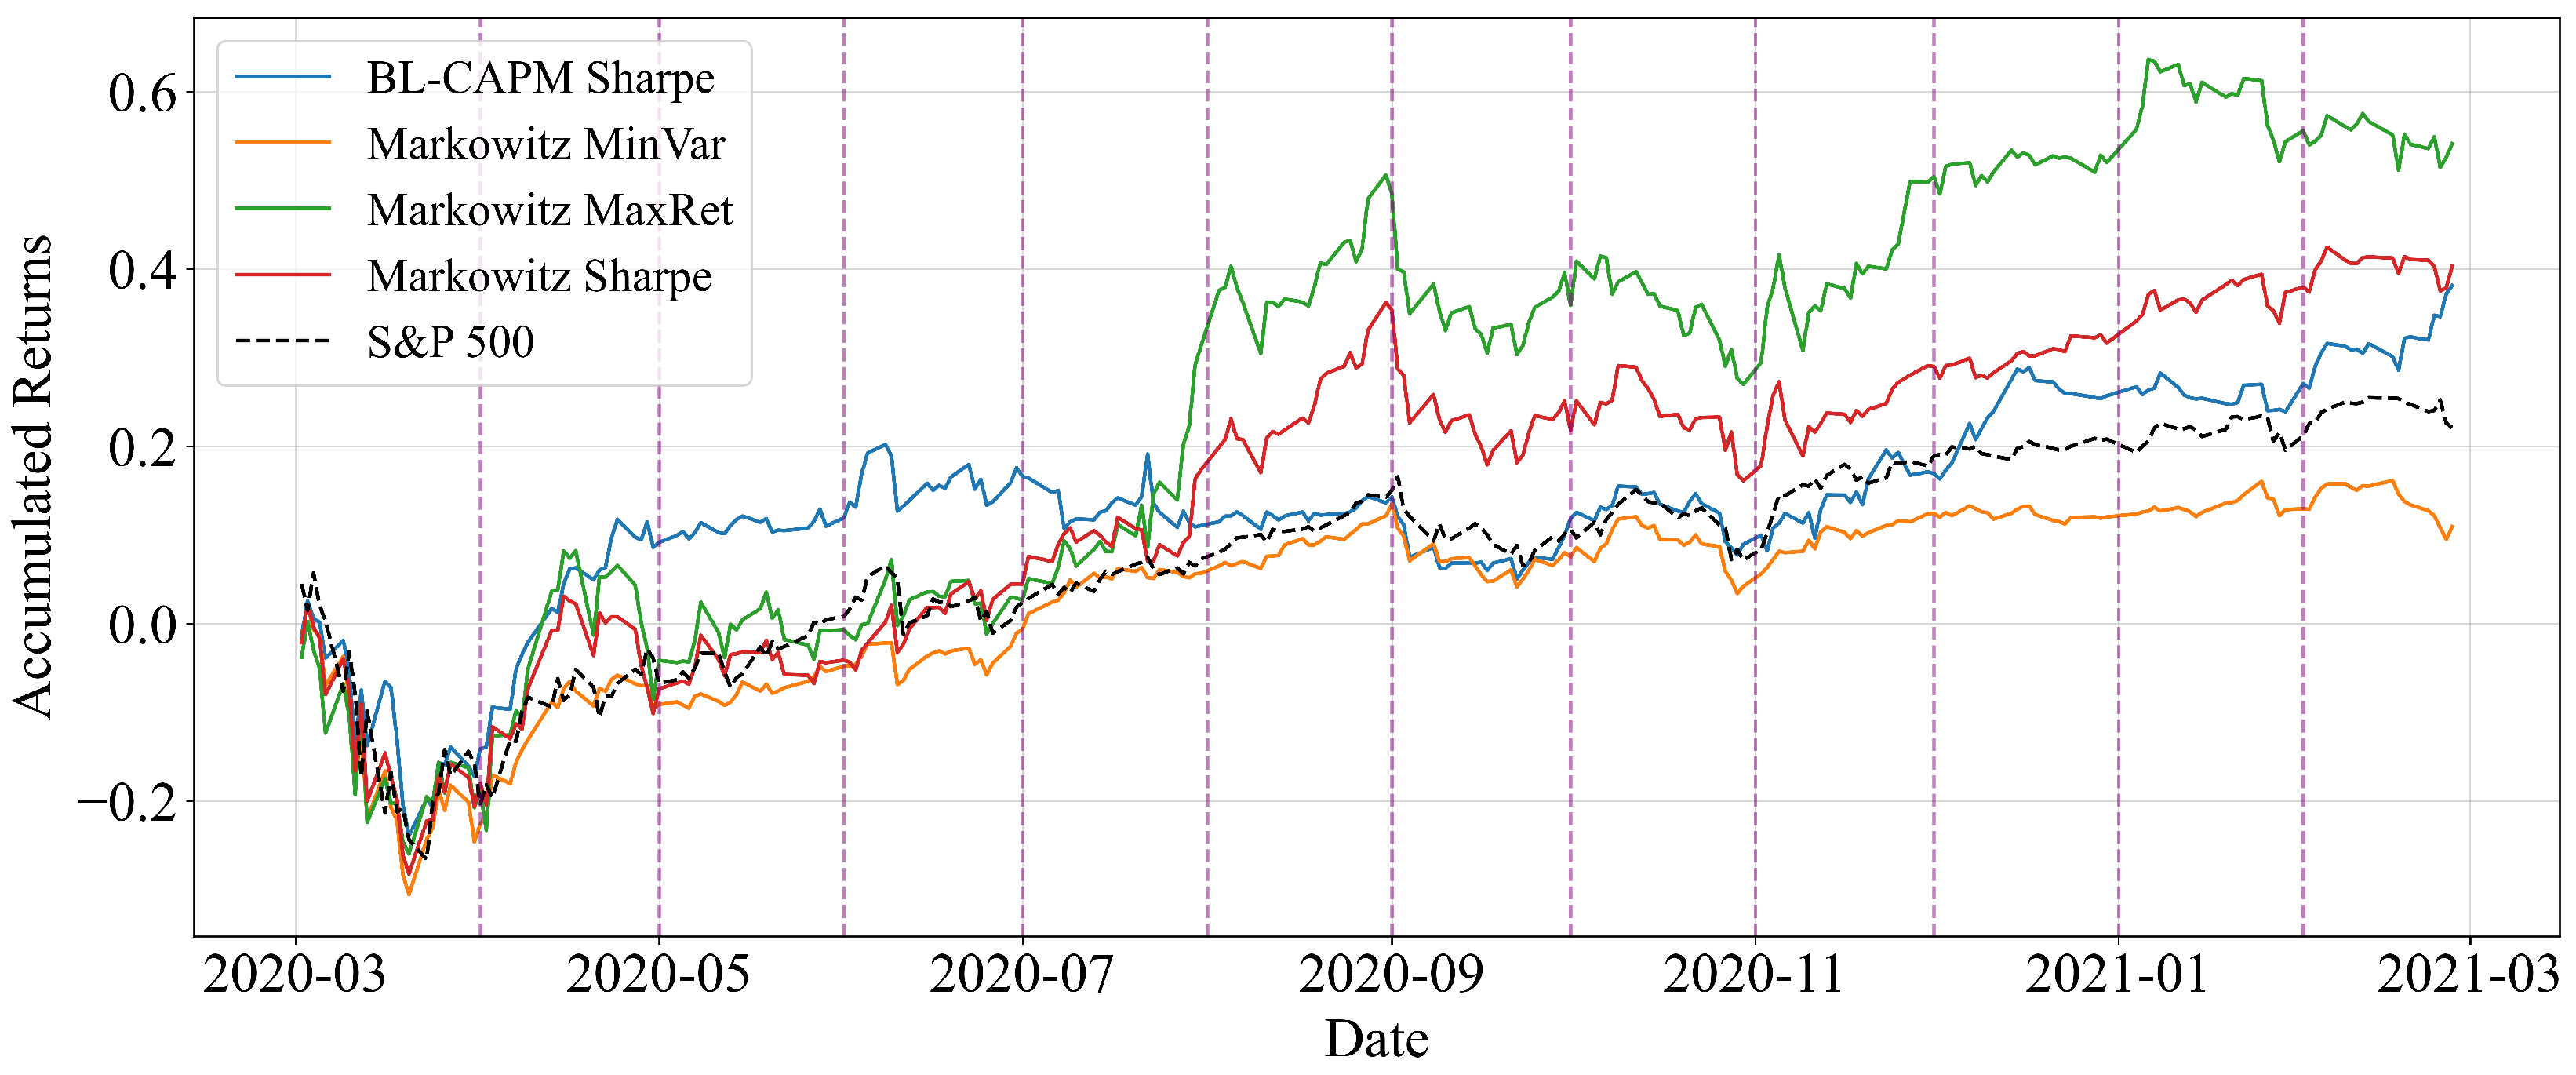
To further evaluate the sensitivity of the results to the length of the training window, Figure 3 presents the real cumulative return of the portfolios when using a 1-year estimation window for the same period (March 2020–February 2021). In this case, the performance is weaker than with the 6-month training window, both in terms of cumulative growth and relative position against the benchmark. This contrast highlights the importance of the chosen training horizon: a shorter window (6 months) proved more effective in capturing the abrupt market shifts associated with the COVID-19 crisis, which was characterised by a sudden onset and little time for gradual adjustment.

3.3. Performance During the Normal Growth Period (2019)

In contrast to the crisis dynamics observed in 2020, the year 2019 can be regarded as a period of relative market stability and steady growth. This makes it a useful benchmark to assess how the different portfolio construction methods perform in an environment without abrupt shocks.
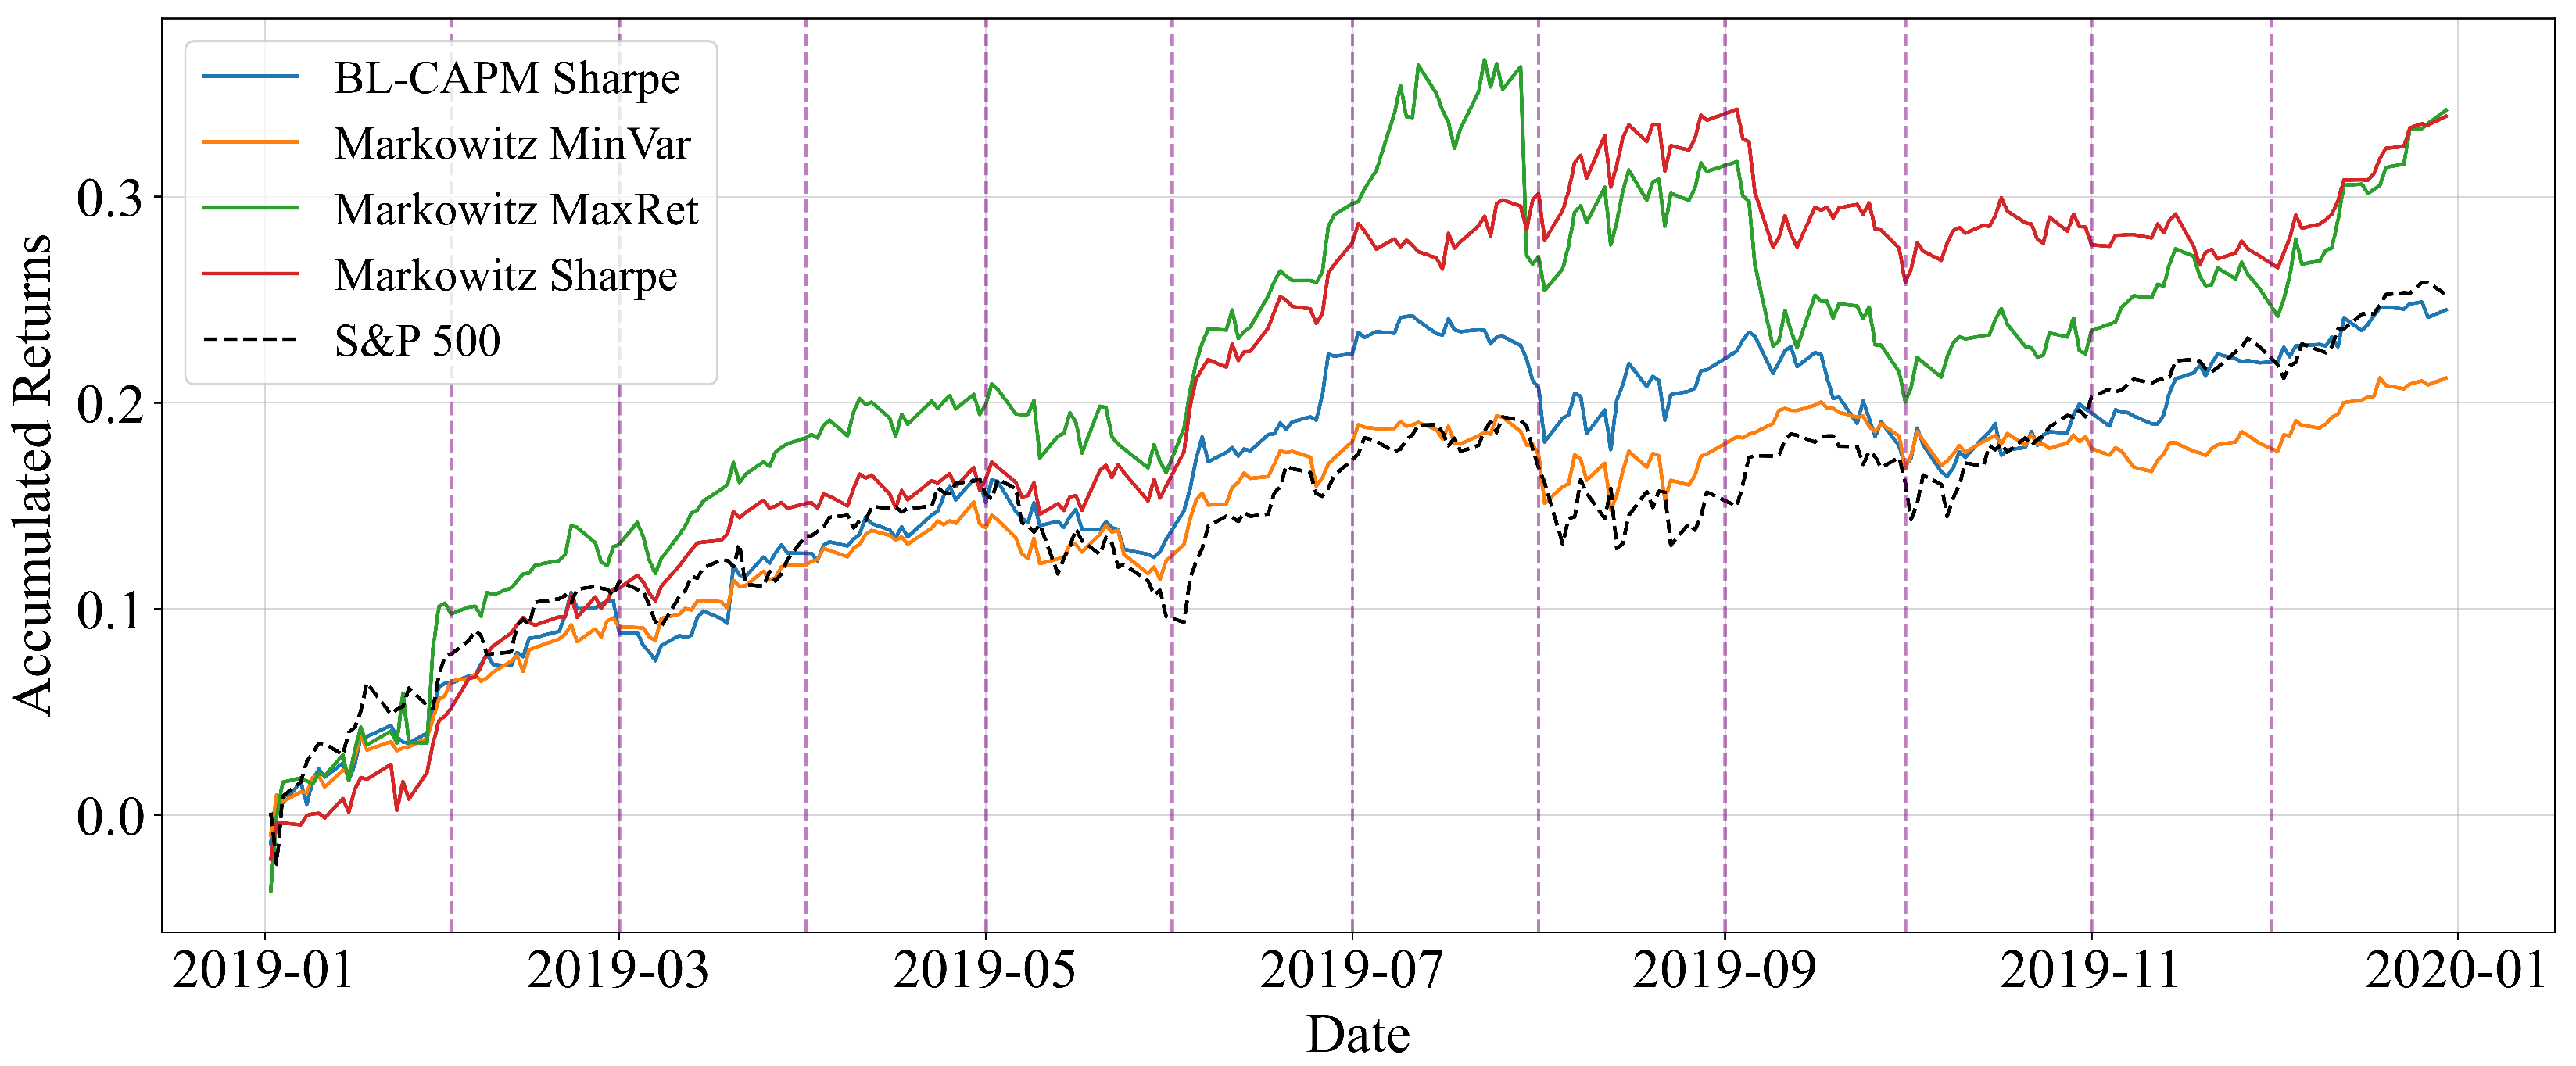
Figure 4 shows the real cumulative return of the Buy-and-Hold portfolios using a 6-month training window. In this case, all strategies exhibit positive and relatively smooth growth, closely following the upward trend of the S&P 500 benchmark. The Markowitz MaxRet and Markowitz Sharpe strategies delivered higher cumulative returns than the benchmark, while the BL-CAPM Sharpe portfolio also performed consistently well, although less aggressively than in the crisis scenario of 2020. This suggests that in more stable conditions, the performance differences across strategies are less pronounced.
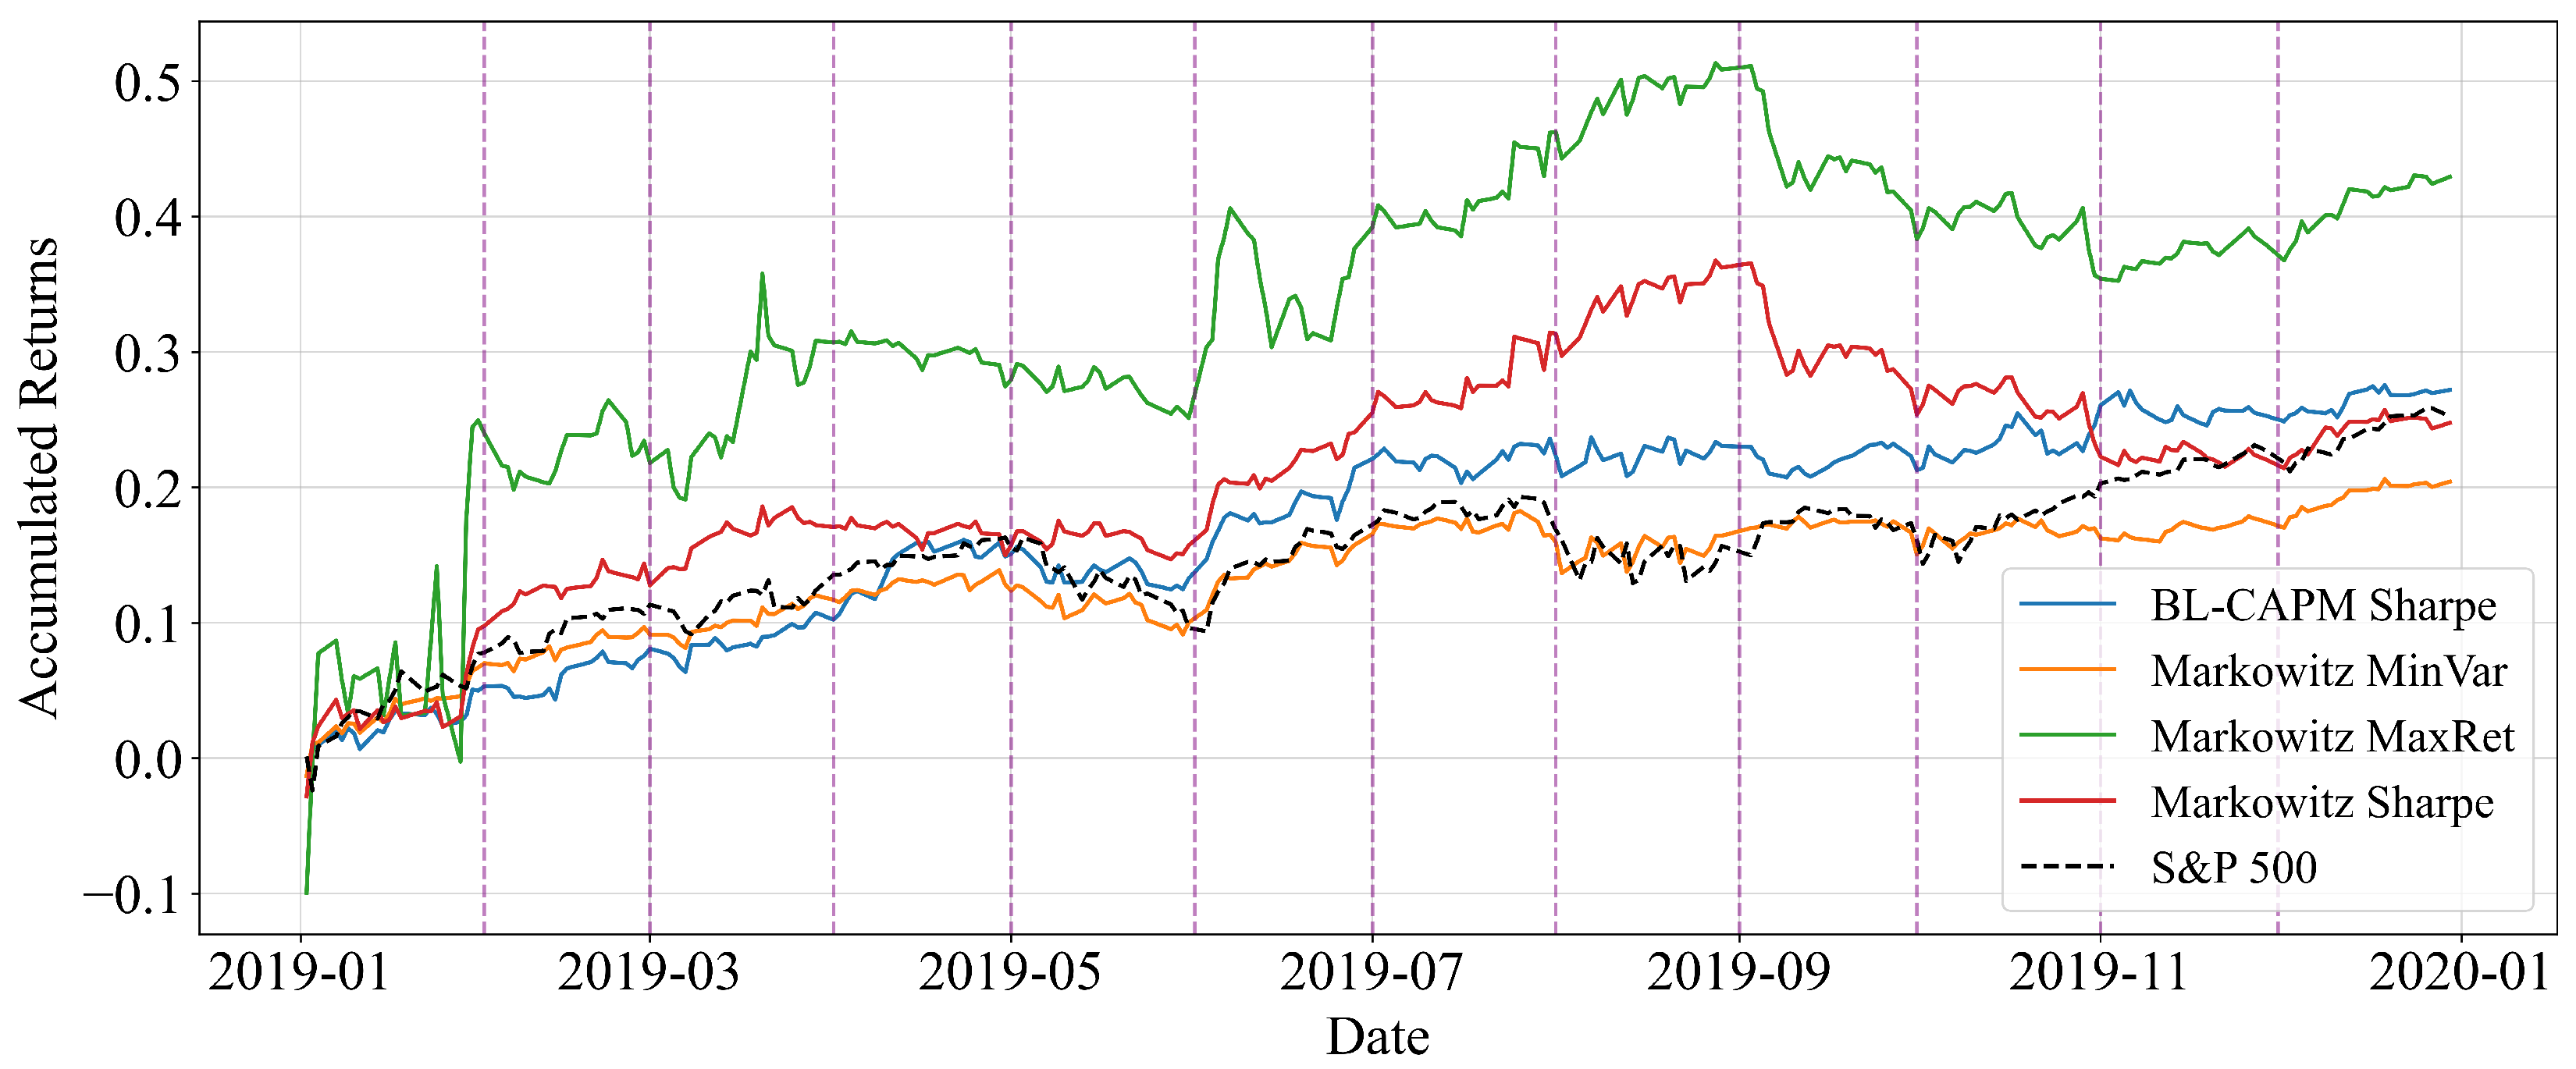
When extending the training horizon to one year, as shown in Figure 5, the results remain broadly positive. Compared to the 6-month case, the portfolios tend to exhibit smoother growth paths, reflecting the fact that longer training windows capture more stable parameter estimates in periods of economic expansion. Nonetheless, the trade-off is that shorter windows may respond more quickly to local fluctuations, whereas longer horizons provide more stability. In the context of 2019, where no abrupt shocks occurred, the one-year training window aligns well with the overall market trend, producing satisfactory results across all strategies.
To better analyse the performance of the new methodological approach, we performed a sensitivity assessment of six cases (presented in Table 4) considering the 15th and 85th percentiles, the 20th and 80th percentiles, and the 30th and 70th percentiles for a training window of one year and six months. It can be seen that the methodology is sensitive to the different specifications of the selected percentiles and observation window, with positive results for all but one of the six specifications. This suggests further research in this area to determine the optimal values that can be calculated dynamically.

4. Discussion

In a global economic environment characterised by increasing volatility, unpredictable financial cycles, and structural interdependence between markets, making informed investment decisions has become a strategic necessity. Building efficient portfolios not only responds to financial optimization criteria, but also constitutes an essential tool for preserving the economic well-being of individuals, organizations, and institutions. In this context, quantitative finance has taken on a leading role. In particular, portfolio optimization models that integrate market information with subjective expectations have proven to be important in addressing highly uncertain scenarios.
This study has proposed a methodological framework that combines the Black–Litterman portfolio model with dynamic CAPM estimation using non-parametric Bayesian techniques, specifically ABC-MCMC, applied to the United States stock market. The integration of these approaches allows investors’ specific views to be incorporated into a market equilibrium structure, weighted by their degree of confidence, resulting in more stable portfolios, consistent with market expectations, and adaptable to complex contexts. The estimation of conditional betas using ABC-MCMC facilitates the capture of temporal dynamics and non-linearities in the risk–return relationship, which is particularly relevant in periods of crisis such as the COVID-19 shock of 2020. The empirical results obtained show that the proposed model contributes to improving the quality of investment decisions in uncertain environments by offering a flexible tool that allows asset allocation strategies to be adjusted based on investors’ beliefs and observed market behaviour. This adaptability is key to addressing highly volatile scenarios, where active management and the incorporation of subjective information can make a significant difference in portfolio performance.
Unlike the work of Palczewski and Palczewski (2019) [23], who generalised the model to continuous distributions and risk measures such as CVaR, and Pang and Karan (2018) [25], who proposed closed-form solutions under elliptical distributions, this study uses a Bayesian simulation approach that does not rely on restrictive analytical assumptions. Similarly, unlike studies that have used advanced techniques, such as neural networks, GARCH models, or copulas, to improve return estimation, this study’s main contribution is estimating conditional betas using ABC-MCMC. This method generates more stable portfolios consistent with historical evidence that can respond effectively in crisis and stable periods.
The evidence presented here indicates that the Bayesian estimation method improves on traditional approaches in two dimensions. Firstly, by replacing point estimates with full posteriors for the parameters of the model, the portfolio integrates parameter uncertainty into both return expectations and view confidence, thereby reducing the sensitivity to sampling noise. Secondly, the estimation of regime betas via ABC capture has been demonstrated to be capable of ascertaining asymmetries across volatility states, obviating the necessity for restrictive functional forms. Hence, the improvement is not only conceptual but also statistically significant. This is due to the fact that it facilitates the generation of simulations based on parameter distributions, thereby enhancing the robustness of the estimates. The practical impact of Black–Litterman portfolio optimization with dynamic CAPM via ABC-MCMC is strengthened by its computational tractability, robustness to estimation errors, and its scalability in handling large portfolios—making it a compelling choice for asset managers looking for balance between performance and implementability.
The proposed methodological framework has significant broader implications beyond its application to the US stock market. Its versatility and robustness make it highly suitable for various global financial markets, including European and developing country markets. Broader implications and applications could include aspects such as adaptability to diverse market conditions, enhanced portfolio optimization, robust management in developing and emerging markets, facilitation of cross-regional investment strategies, and improving risk management and dynamic asset allocation.
Despite the methodological advances presented, there are multiple aspects that deserve to be explored in future research. First, it would be pertinent to extend the analysis to broader time horizons and assess the model’s robustness to extreme events, such as global financial crises or structural changes in the U.S. economy. Second, analysing the interaction of U.S. portfolios with global market conditions would allow us to better evaluate the model’s ability to capture interdependencies and contagion effects, which is especially relevant given the high international exposure of many U.S. firms. It is also relevant to analyse the model’s sensitivity to the degree of confidence assigned to investor views, as well as to explore its integration with ESG (environmental, social, and governance) criteria, given the growing demand for sustainable investments among institutional investors in the United States. Furthermore, the development of computationally more efficient versions of the ABC-MCMC algorithm could facilitate its application in real-time and high-frequency trading contexts, expanding its practical usefulness for portfolio managers and financial analysts. These research avenues would help consolidate the proposed approach as a robust and versatile tool for portfolio management in dynamic and highly liquid markets such as the United States.

5. Conclusions

The application of the model to the United States stock market reveals structural challenges that must be addressed to strengthen the national financial architecture. The shallow depth of certain market segments, information fragmentation, and the limited availability of high-frequency data restrict the ability to accurately calibrate nonparametric models. Overcoming these limitations requires advancing the modernization of statistical infrastructure, improving market transparency, and fostering a more sophisticated investment culture capable of formalising expectations and actively managing risk.
From an international perspective, the United States stock market provides a robust testing ground for evaluating the performance of Bayesian models under conditions of both stability and systemic stress, such as the COVID-19 crisis. The adaptability of the proposed framework highlights its potential for application across other advanced economies as well as in global contexts where high-frequency volatility and heterogeneous investor expectations shape the investment environment.
Along with this, the integration of ABC-MCMC techniques in the estimation of conditional betas opens up a relevant methodological line for financial systems facing computational constraints or challenges in modelling non-linear risk dynamics. The flexibility of the approach allows for capturing non-linear and time-dynamic relationships without imposing restrictive assumptions, making it a valuable tool for applied research in international finance. In general, this research contributes to the development of financial theory and demonstrates the applicability of advanced portfolio optimization techniques in highly liquid and globally integrated markets such as the United States. The identified challenges should be addressed through continued methodological innovation, improvements in financial infrastructure, and collaboration between academia and industry, with the goal of consolidating a more resilient and adaptive investment environment.

Author Contributions

Conceptualization, S.F. and R.R.-T.; methodology, S.F., R.R.-T., and K.C.-J.; validation, H.d.l.F.-M., C.E.-G., and R.R.-T.; formal analysis, S.F. and R.R.-T.; investigation, S.F., R.R.-T., and K.C.-J.; resources, C.E.-G.; data curation, S.F.; writing—original draft preparation, S.F. and R.R.-T.; writing—review and editing, S.F., R.R.-T., K.C.-J., and H.d.l.F.-M.; visualization, S.F.; supervision, R.R.-T. All authors have read and agreed to the published version of the manuscript.

Funding

Rolando Rubilar-Torrealba was funded by Agencia Nacional de Innovación y Desarrollo Fondecyt Iniciación grant number 11250084. H. de la Fuente-Mella was partially funded by Agencia Nacional de Innovación y Desarrollo grant number 1230881.

Institutional Review Board Statement

Not applicable.

Informed Consent Statement

Not applicable.

Data Availability Statement

Data and codes are available in https://github.com/SebastianUSMMSC/ABC-MCMC_CAPM_Black-Litterman (accessed on 1 October 2025).

Conflicts of Interest

The authors declare no conflicts of interest.

References

  1. Loayza, N.V.; Raddatz, C. The structural determinants of external vulnerability. World Bank Econ. Rev. 2007, 21, 359–387. [Google Scholar] [CrossRef]
  2. Black, F.; Litterman, R. Asset allocation: Combining investor views with market equilibrium. Goldman Sachs Fixed Income Res. 1990, 115, 7–18. [Google Scholar] [CrossRef]
  3. Black, F.; Litterman, R. Global portfolio optimization. Financ. Anal. J. 1992, 48, 28–43. [Google Scholar] [CrossRef]
  4. Gevorgyan, R.; Hovhannisyan, R. Text-mining approach with Black–Litterman model: A case study of Armenian pension funds. Invest. Anal. J. 2025, 1–10. [Google Scholar] [CrossRef]
  5. Deng, X.; Zhou, W.; Cao, Q. Portfolio with Copula-GARCH and Black-Litterman Model Using a Novel View Error Matrix. Comput. Econ. 2024, 66, 3197–3227. [Google Scholar] [CrossRef]
  6. Gao, J.; Wang, J.; Zhou, Y.; Lv, M.; Wei, D. Enhancing investment performance of Black-Litterman model with AI hybrid system: Can it be done? Expert Syst. Appl. 2024, 244, 122924. [Google Scholar] [CrossRef]
  7. Sun, Y.; Wu, Y.; De, G. A novel black-litterman model with time-varying covariance for optimal asset allocation of pension funds. Mathematics 2023, 11, 1476. [Google Scholar] [CrossRef]
  8. Jisma, M.; Mohan, V.; Thomas, M.S. Risk-return optimised energy asset allocation in transmission-distribution system using tangency portfolio and Black–Litterman model. IET Energy Syst. Integr. 2023, 5, 290–306. [Google Scholar]
  9. Fuhrer, A.; Hock, T. Uncertainty in the Black–Litterman model: Empirical estimation of the equilibrium. J. Empir. Financ. 2023, 72, 251–275. [Google Scholar] [CrossRef]
  10. Yao, H.; Li, X.; Li, L. Asset allocation based on LSTM and the Black–Litterman model. Appl. Econ. Lett. 2024, 31, 1686–1691. [Google Scholar] [CrossRef]
  11. Ko, H.; Byun, J.; Lee, J. A privacy-preserving robo-advisory system with the Black-Litterman portfolio model: A new framework and insights into investor behavior. J. Int. Financ. Mark. Inst. Money 2023, 89, 101873. [Google Scholar] [CrossRef]
  12. Ko, H.; Son, B.; Lee, J. A novel integration of the Fama–French and Black–Litterman models to enhance portfolio management. J. Int. Financ. Mark. Inst. Money 2024, 91, 101949. [Google Scholar] [CrossRef]
  13. Yuan, J.; Jin, L.; Lan, F. A BL-MF fusion model for portfolio optimization: Incorporating the Black-Litterman solution into multi-factor model. Financ. Res. Lett. 2025, 80, 107464. [Google Scholar] [CrossRef]
  14. Han, Y.; Li, J. The impact of global economic policy uncertainty on portfolio optimization: A Black–Litterman approach. Int. Rev. Financ. Anal. 2023, 86, 102476. [Google Scholar] [CrossRef]
  15. Cho, P.; Lee, M. Dynamic Black–Litterman Portfolios Incorporating Asymmetric Fractal Uncertainty. Fractal Fract. 2024, 8, 642. [Google Scholar] [CrossRef]
  16. Stoilov, T.; Stoilova, K.; Vladimirov, M. Decision support for portfolio management by information system with black–litterman model. Int. J. Inf. Technol. Decis. Mak. 2022, 21, 643–664. [Google Scholar] [CrossRef]
  17. Unni, A.C.; Ongsakul, W.; Madhu, N. Fuzzy incorporated Black–Litterman model for renewable energy portfolio optimization. Electr. Eng. 2022, 104, 4279–4288. [Google Scholar] [CrossRef]
  18. Gómez, Y.A.F.; Trujillo, J.F.M.; Quimbayo, C.A.Z. Optimal Portfolio Selection Using the Black-Litterman Model with Fuzzy Views. Lect. Econ. 2022, 369–393. [Google Scholar] [CrossRef]
  19. Kara, M.; Ulucan, A.; Atici, K.B. A hybrid approach for generating investor views in Black–Litterman model. Expert Syst. Appl. 2019, 128, 256–270. [Google Scholar] [CrossRef]
  20. Bessler, W.; Opfer, H.; Wolff, D. Multi-asset portfolio optimization and out-of-sample performance: An evaluation of Black–Litterman, mean-variance, and naïve diversification approaches. Eur. J. Financ. 2017, 23, 1–30. [Google Scholar] [CrossRef]
  21. Kolm, P.; Ritter, G. On the bayesian interpretation of black–litterman. Eur. J. Oper. Res. 2017, 258, 564–572. [Google Scholar] [CrossRef]
  22. Tang, M.L.; Wu, F.Y.; Hung, M.C. Multi-asset allocation of exchange traded funds: Application of Black–Litterman model. Invest. Anal. J. 2021, 50, 273–293. [Google Scholar] [CrossRef]
  23. Palczewski, A.; Palczewski, J. Black–Litterman model for continuous distributions. Eur. J. Oper. Res. 2019, 273, 708–720. [Google Scholar] [CrossRef]
  24. Teplova, T.; Evgeniia, M.; Munir, Q.; Pivnitskaya, N. Black-Litterman model with copula-based views in mean-CVaR portfolio optimization framework with weight constraints. Econ. Change Restruct. 2023, 56, 515–535. [Google Scholar] [CrossRef]
  25. Pang, T.; Karan, C. A closed-form solution of the Black–Litterman model with conditional value at risk. Oper. Res. Lett. 2018, 46, 103–108. [Google Scholar] [CrossRef]
  26. Hasler, M.; Martineau, C. Explaining the Failure of the Unconditional CAPM with the Conditional CAPM. Manag. Sci. 2023, 69, 1835–1855. [Google Scholar] [CrossRef]
  27. Barua, R.; Sharma, A.K. Dynamic Black Litterman portfolios with views derived via CNN-BiLSTM predictions. Financ. Res. Lett. 2022, 49, 103111. [Google Scholar] [CrossRef]
  28. Su, X.; Lu, K.; Yen, J. Objective Black-Litterman views through deep learning: A novel hybrid model for enhanced portfolio returns. Expert Syst. Appl. 2025, 295, 128868. [Google Scholar] [CrossRef]
  29. Min, L.; Lin, D.; Wang, J.; Wang, B. Black-Litterman Portfolio Optimization Using Gaussian Mixture Model. Eng. Lett. 2025, 33, 1020. [Google Scholar]
  30. Li, C.; Chen, Y.; Yang, X.; Wang, Z.; Lu, Z.; Chi, X. Intelligent black–Litterman portfolio optimization using a decomposition-based multi-objective DIRECT algorithm. Appl. Sci. 2022, 12, 7089. [Google Scholar] [CrossRef]
  31. Ko, H.; Lee, J. Portfolio management transformed: An enhanced black–litterman approach integrating asset pricing theory and machine learning. Comput. Econ. 2025, 1–47. [Google Scholar] [CrossRef] [PubMed]
  32. Rubilar-Torrealba, R.; Chahuán-Jiménez, K.; de la Fuente-Mella, H. A stochastic analysis of the effect of trading parameters on the stability of the financial markets using a Bayesian approach. Mathematics 2023, 11, 2527. [Google Scholar] [CrossRef]
  33. Beaumont, M.A. Approximate bayesian computation. Annu. Rev. Stat. Its Appl. 2019, 6, 379–403. [Google Scholar] [CrossRef]
  34. Bernardo, R.C.; Grandón, D.; Said, J.L.; Cárdenas, V.H. Dark energy by natural evolution: Constraining dark energy using Approximate Bayesian Computation. Phys. Dark Universe 2023, 40, 101213. [Google Scholar] [CrossRef]
  35. Jin, H.; Du, W.; Yin, G. Approximate Bayesian computation design for phase I clinical trials. Stat. Methods Med. Res. 2022, 31, 2310–2322. [Google Scholar] [CrossRef] [PubMed]
  36. Chernikova, A.; Gozzi, N.; Perra, N.; Boboila, S.; Eliassi-Rad, T.; Oprea, A. Modeling self-propagating malware with epidemiological models. Appl. Netw. Sci. 2023, 8, 52. [Google Scholar] [CrossRef]
  37. Prangle, D. Lazy abc. Stat. Comput. 2016, 26, 171–185. [Google Scholar] [CrossRef]
  38. Breloer, B.; Lea Hühn, H.; Scholz, H. Jensen alpha and market climate. J. Asset Manag. 2016, 17, 195–214. [Google Scholar] [CrossRef]
  39. Jegadeesh, N.; Titman, S. Returns to Buying Winners and Selling Losers: Implications for Stock Market Efficiency. J. Financ. 1993, 48, 65–91. [Google Scholar] [CrossRef]
  40. Basu, D.; Stremme, A. CAPM and time-varying beta: The cross-section of expected returns. WBS Financ. Group Res. Pap. 2007. [Google Scholar] [CrossRef]
  41. Martin, G.M.; Frazier, D.T.; Maneesoonthorn, W.; Loaiza-Maya, R.; Huber, F.; Koop, G.; Maheu, J.; Nibbering, D.; Panagiotelis, A. Bayesian forecasting in economics and finance: A modern review. Int. J. Forecast. 2024, 40, 811–839. [Google Scholar] [CrossRef]
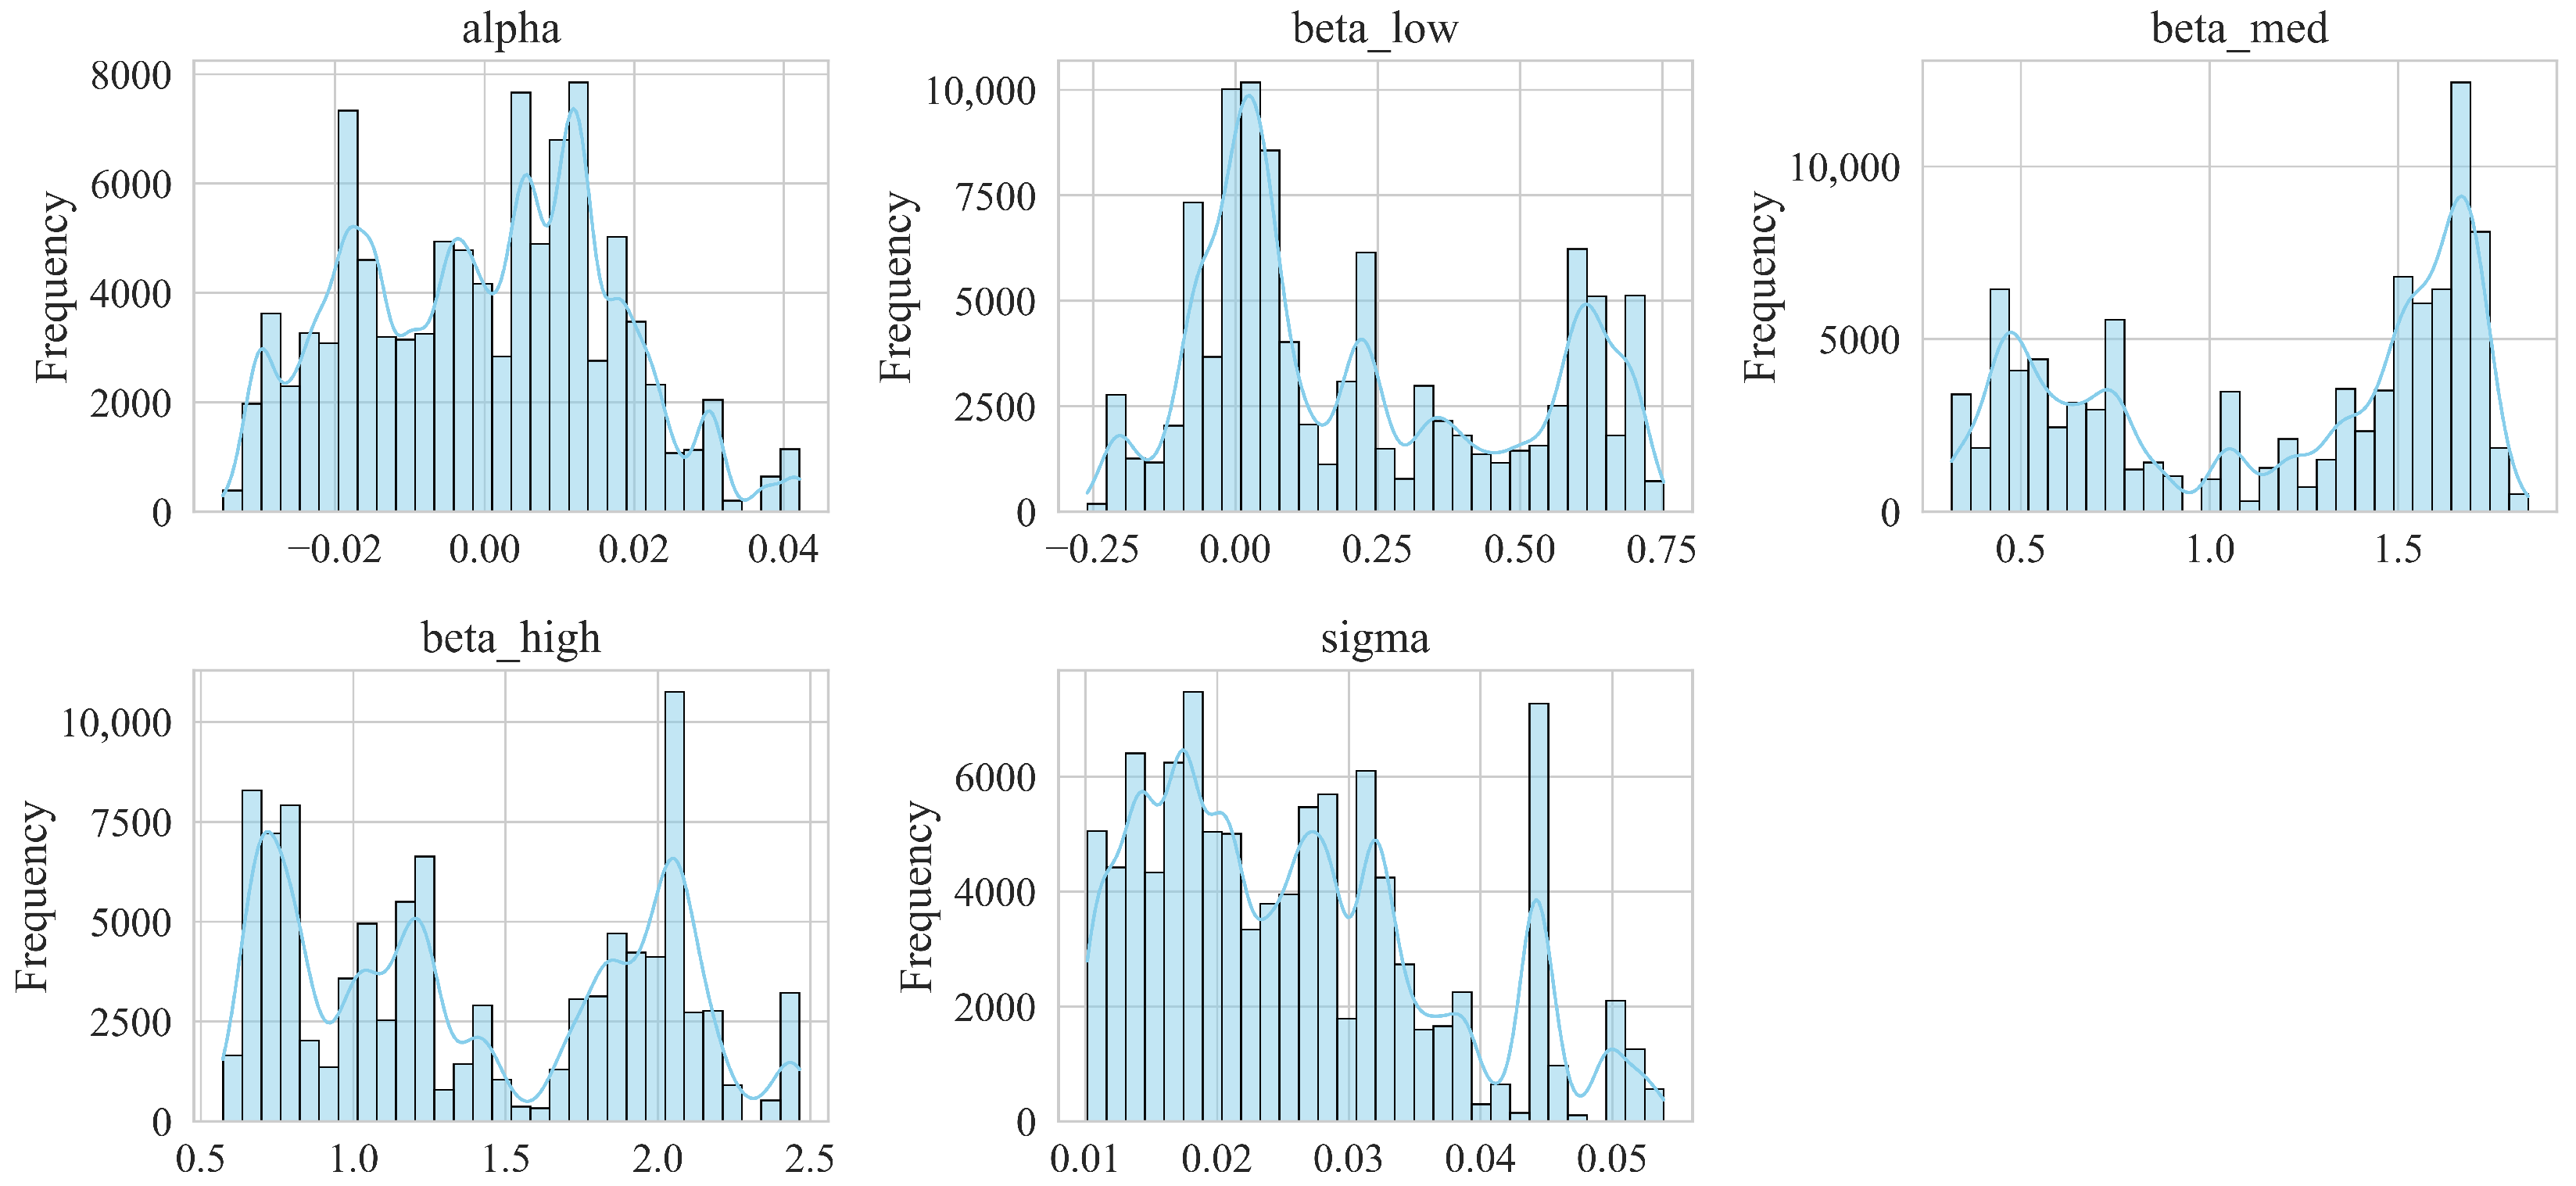
Figure 1. Histograms of accepted parameter sets for WMT in January 2020 (1-year training window), obtained from 100,000 ABC-MCMC iterations. In total, 284 sets were accepted, each comprising α , β low , β med , β high , and σ .
Mathematics 13 03265 g001
Figure 2. Real cumulative return of Buy-and-Hold portfolios with monthly rebalancing for the period from March 2020 to February 2021 (training window: 6 months).
Mathematics 13 03265 g002
Figure 3. Real cumulative return of Buy-and-Hold portfolios with monthly rebalancing for the period from March 2020 to February 2021 (training window: 1 year).
Mathematics 13 03265 g003
Figure 4. Real cumulative return of Buy-and-Hold portfolios with monthly rebalancing for the year 2019 (training window: 6 months).
Mathematics 13 03265 g004
Figure 5. Real cumulative return of Buy-and-Hold portfolios with monthly rebalancing for the year 2019 (training window: 1 year).
Mathematics 13 03265 g005
Table 1. Descriptive statistics of daily logarithmic returns by asset and index.
Stock SymbolMeanStandard DeviationMinimumMaximumMedian
AAPL0.0022180.015738−0.0676020.0324800.002749
ABT−0.0007580.011996−0.0422360.0267010.000635
JPM0.0005620.012875−0.0456700.0296960.001151
AES0.0008260.014534−0.0891510.0281060.002338
ALB0.0023630.025202−0.0881510.1127230.001763
MSFT0.0013510.013946−0.0730640.0323870.001547
AMD0.0029750.024816−0.0812950.0760790.003701
INTC0.0013570.018183−0.0661830.0781940.000901
HP0.0001230.028573−0.0730700.133893−0.000012
XOM−0.0020960.014998−0.0620640.044995−0.003482
AZO−0.0005230.013298−0.0451350.066995−0.000299
AEE0.0002960.009537−0.0436570.0228740.001318
ALL0.0002980.011180−0.0515070.0385950.002224
MO−0.0003600.013485−0.0466130.0318750.001447
AMGN−0.0002410.013087−0.0528300.0446570.000513
MMM−0.0005050.015186−0.0589250.042288−0.000650
ANSS0.0012830.016672−0.1013430.0309700.002670
KO−0.0001120.009639−0.0474630.0319350.000928
APA0.0013170.041801−0.1312250.2373940.000032
ADM0.0000440.014057−0.0580880.0473940.000844
AMZN0.0004740.013820−0.0493330.071196−0.000001
T0.0002800.011557−0.0420000.0419160.001024
ADSK0.0023390.017196−0.0539830.0550840.002362
ATO−0.0004460.009728−0.0446060.0196190.000857
AVY0.0000010.015289−0.0498990.0630710.000000
BALL−0.0010300.016855−0.0554570.038048−0.001103
COF0.0002160.014184−0.0571830.0437490.000313
CCL−0.0020370.023545−0.0990110.0735410.000000
EBAY−0.0011500.017682−0.0957700.084172−0.000564
EFX−0.0002200.013696−0.0556300.0488760.000732
IBM−0.0001480.013956−0.0568230.0496360.000140
IRM−0.0000730.014304−0.0576030.0482060.001699
JNJ0.0004830.011178−0.0642200.0299380.000554
JBL0.0008920.019031−0.0644040.0756070.002168
MCD−0.0008310.011236−0.0517320.0219260.000757
DUK0.0000740.009627−0.0407420.0318160.001318
CTSH−0.0000100.014324−0.0445860.0946520.000240
MSI−0.0006490.013980−0.0516050.0253640.001546
CAG−0.0003750.022386−0.0634580.1472920.003026
NKE0.0004960.012751−0.0442570.0407940.000774
PEP−0.0001700.009059−0.0403140.0293540.000295
PFE−0.0003390.011342−0.0516080.024640−0.001153
DRI−0.0016150.015872−0.0747330.033646−0.000043
SBUX−0.0015990.012291−0.0413040.027182−0.000512
DE0.0001530.015394−0.0439170.0676130.001396
DTE−0.0010800.011089−0.0553820.0207660.001069
WMT−0.0004420.008317−0.0301560.0157810.000377
IPG0.0007590.014699−0.0531490.0717700.002373
XEL−0.0001380.010737−0.0525650.0241370.001630
K−0.0002350.012483−0.0889010.0292120.001190
S&P 500 0.0000760.008544−0.0451680.0148690.000851
Table 2. Portfolio weights on 1 May 2020 (training window: 6 months).
Stock SymbolBL-CAPM SharpeM. Max. Ret.M. Min. Var.M. Sharpe
EBAY100.00.018.440.00
JNJ0.00.02.390.00
K0.00.020.110.00
KO0.00.02.020.00
MCD0.00.02.720.00
MMM0.00.04.250.00
MO0.00.06.810.00
PFE0.00.03.840.00
WMT0.00.017.130.00
AMZN0.00.022.2973.96
AMD0.0100.00.0026.04
Table 3. Portfolio weights on 2 November 2020 (training window: 6 months).
Stock SymbolBL-CAPM SharpeM. Max. Ret.M. Min. Var.M. Sharpe
CAG49.20900.00002.92510.0000
PFE33.27220.00001.28680.0000
EBAY12.43210.00007.56227.6751
SBUX2.60870.00000.00000.0000
JBL2.47800.00000.00000.0000
JNJ0.00000.000014.67660.0000
K0.00000.00009.63480.0000
MCD0.00000.000011.86230.0000
EFX0.00000.00000.90290.0000
NKE0.00000.00002.911910.4413
PEP0.00000.00007.74700.0000
T0.00000.00007.07340.0000
XEL0.00000.00005.96760.0000
AAPL0.000012.17780.000013.6823
ABT0.00000.00000.58830.0000
DUK0.00000.00006.18590.0000
AEE0.00000.00003.34590.0000
AES0.000021.21250.00004.9679
ALB0.000031.40820.00000.0000
AMD0.00000.00000.00004.4502
AMGN0.00000.00005.41460.0000
AMZN0.00000.00000.54180.0000
AZO0.00000.000011.37310.0000
BALL0.00000.00000.000022.8586
DE0.000035.20150.000035.9245
Table 4. BL–CAPM Sharpe—cumulative return and annualised volatility by percentile thresholds.
Train q 15 ( Z T ) and q 85 ( Z T ) q 20 ( Z T ) and q 80 ( Z T ) q 30 ( Z T ) and q 70 ( Z T )
Ret. Vol. Ret. Vol. Ret. Vol.
1 year0.0975070.0913570.3811540.0696080.3228430.067030
6 months0.3861320.0656470.3220140.064647−0.0216570.083106
Disclaimer/Publisher’s Note: The statements, opinions and data contained in all publications are solely those of the individual author(s) and contributor(s) and not of MDPI and/or the editor(s). MDPI and/or the editor(s) disclaim responsibility for any injury to people or property resulting from any ideas, methods, instructions or products referred to in the content.