Abstract
The main objective of this paper is to develop a maximum power point tracker (MPPT) for a photovoltaic module array (PVMA) under conditions of partial shading and sudden changes in solar irradiance. PVMAs exhibit nonlinear characteristics with respect to temperature and solar irradiance conditions. Therefore, when some modules in the array are shaded or when there is a sudden change in solar irradiance, the maximum power point (MPP) of the array will also change, and the power–voltage (P-V) characteristic curve may exhibit multiple peaks. Under such conditions, if the tracking algorithm employs a fixed step size, the time required to reach the MPP may be significantly prolonged, potentially causing the tracker to converge on a local maximum power point (LMPP). To address the issues mentioned above, this paper proposes a novel MPPT technique based on the nature-inspired idols algorithm (IA). The technique allows the promotion value (PM) to be adjusted through the anti-fans weight (afw) in the iteration formula, thereby achieving global maximum power point (GMPP) tracking for PVMAs. To verify the effectiveness of the proposed algorithm, a model of a 4-series–3-parallel PVMA was first established using MATLAB (2024b version) software under both non-shading and partial shading conditions. The voltage and current of the PVMAs were fed back, and the IA was then applied for GMPP tracking. The simulation results demonstrate that the IA proposed in this study outperforms existing MPPT techniques, such as particle swarm optimization (PSO), cat swarm optimization (CSO), and the bat algorithm (BA), in terms of tracking speed, dynamic response, and steady-state performance, especially when the array is subjected to varying shading ratios and sudden changes in solar irradiance.
Keywords:
idols algorithm; partial shading; photovoltaic module array; maximum power point tracking; global maximum power point; local maximum power point; tracking speed dynamic response; steady-state performance MSC:
68W99
1. Introduction
The output power of a photovoltaic module array (PVMA) [1,2] is determined by the load, which varies over time, causing the array’s output power to deviate from its maximum potential. Additionally, the output characteristic curve of PVMAs is highly sensitive to variations in temperature and solar irradiance [3], which fluctuate continuously over time. To maximize the energy conversion efficiency of these arrays, it is essential to implement effective maximum power point tracking (MPPT) control. Traditional MPPT techniques commonly employed include the constant voltage method [4,5], perturb and observe method [6,7], and power feedback method [8], among others. Although these conventional methods can effectively track the maximum power point under uniform irradiance conditions, fluctuations in irradiance and the potential for shading significantly impact the output characteristics of the PVMAs. These conditions may cause the P-V characteristic curve to exhibit multiple peaks [9], making it challenging for traditional MPPT algorithms to identify the global maximum power point (GMPP). As a result, power losses may occur, leading to reduced overall conversion efficiency. In recent years, experts and researchers have proposed numerous intelligent MPPT algorithms [10] to address the issue of multi-peak P-V characteristic curves. These algorithms can ensure that PVMAs operate at the GMPP, even under unstable irradiance conditions and when the PVMA’s output characteristic curve exhibits multiple peaks, thereby enhancing the energy conversion efficiency of the PVMAs. Common intelligent algorithms include the firefly algorithm (FA) [11,12], particle swarm optimization (PSO) [13], bat algorithm (BA) [14,15,16], and cat swarm optimization (CSO) [17,18,19], among others. Among them, the FA [11,12] is known for its large search range, fewer parameters, and stable performance. Its main advantage lies in the combination of an attractiveness decay mechanism and a random perturbation term. The attractiveness decreases exponentially with the square of the distance, which causes each firefly to be primarily attracted to “nearby better solutions.” This facilitates an effective concentration of the search in promising regions. Compared to the particle swarm optimization (PSO) algorithm, such a local attraction design enables finer preservation of solution space diversity, which helps prevent premature convergence. Furthermore, the inclusion of a random perturbation term allows fireflies to escape from local regions. Unlike Lévy flights, the perturbation intensity in the FA can be dynamically reduced by adjusting the parameter of the absorption coefficient. However, its drawback is that it tends to converge on an LMPP when dealing with multi-peak functions. In contrast, the PSO [13] is relatively simple in terms of its underlying principles and mathematical formulas, and it is easy to understand and implement. Its mathematical model is simple, and its velocity update equation resembles a feedback-based control system. The inertia weight functions similarly to a velocity damping factor. When the inertia weight is large, particles tend to maintain their original momentum, promoting global exploration; when the inertia weight is small, particles concentrate more on local solutions. However, it has higher requirements for the fitness function and thus is more sensitive to the tracking speed and steady-state response. As a result, improper parameter settings can lead to prolonged tracking times to reach the GMPP. The BA achieves a balance between global and local search by adjusting the pulse frequency to control the step size. It utilizes loudness and the pulse emission rate for search adjustment. This model can be regarded as a temperature-like scaling control mechanism: loudness decreases with iterations to reduce the jump amplitude, while the pulse emission rate increases to enhance the probability of local search, enabling the algorithm to escape from local optima during the early stages. However, the algorithm’s drawback is its high sensitivity to the parameters of the pulse frequency, loudness, and pulse emission rate. If these parameters are not properly chosen, it may result in slower convergence or lead to trapping in a local optimal solution. On the other hand, CSO is primarily divided into two behaviors: tracking and searching. Its search mode resembles a multi-point disturbance-based local search. The mathematical model typically does not include individual best memory but instead is guided directly by the global best solution. The distribution ratio between the two behavioral modes can be adjusted using the parameter of the mixture ratio (MR), which can be mathematically interpreted as a probability control variable for switching behaviors. This allows users to tune the balance between exploration and exploitation based on the problem characteristics. By switching between these behaviors, CSO can effectively combine the advantages of local and global search. However, if the probability of mode switching and the selection of parameters within each behavior are not appropriately tuned, the algorithm may struggle with switching between local and global searches, leading to slower convergence.
To address the shortcomings of these traditional intelligent MPPT methods, this paper proposes an innovative and effective MPPT technique. This method is based on the no free lunch theorems [20,21] and the evolution of the entertainment industry, and it is named the idols algorithm (IA). The idol algorithm proposed in this study has its core advantage in its iterative formula, which causes the control parameter AFR (anti-fan rate) to converge to zero over time. This results in a progressively shrinking search space, enhancing local precision and accelerating the convergence speed of the system. This characteristic is similar to the loudness decay mechanism in simulated annealing or the bat algorithm, but the idol algorithm is more structurally defined and analytically tractable. Additionally, the promotion value resembles the “velocity” in the transient response of a standard second-order system, essentially representing the first-order derivative. The body factor (BF) acts like a damping factor, which helps suppress oscillations. In this paper, the proposed IA will be used to track the maximum power point of PVMAs. Firstly, MATLAB software was used to simulate the output characteristic curves of the PVMAs under both non-shading and partial shading conditions. The IA was then employed to perform MPPT tests on the PVMAs. Finally, a comparison of the tracking performance was made between the simulation results of the proposed IA and PSO, CSO, and the BA, demonstrating that the IA outperforms these existing intelligent algorithms in terms of tracking speed, dynamic response, and steady-state performance.
2. Output Characteristics of the PVMAs Under Different Shading Conditions
A PVMA in a solar power generation system is typically formed by connecting multiple modules in series and parallel. However, when certain modules are shaded, the output power of the PVMAs is reduced, and the power–voltage (P-V) and current–voltage (I-V) characteristic curves may exhibit multiple peaks.
In this study, the shading characteristics of a 4-series–3-parallel module array, composed of SWM20W photovoltaic modules manufactured by Sunworld Co., Ltd. (Osaka, Japan) [22], were examined. The electrical performance parameters of a single module are shown in Table 1. Firstly, MATLAB (2024b version) software was used to simulate the I-V and P-V characteristic curves of a single photovoltaic module under standard test conditions (STCs), which correspond to an irradiance of 1000 W/m2, a temperature of 25 °C, and an air mass (AM) of 1.5. The simulation results under different irradiance conditions are shown in Figure 1.

Table 1.
Electrical performance parameters of a single SWM20W photovoltaic module [22].
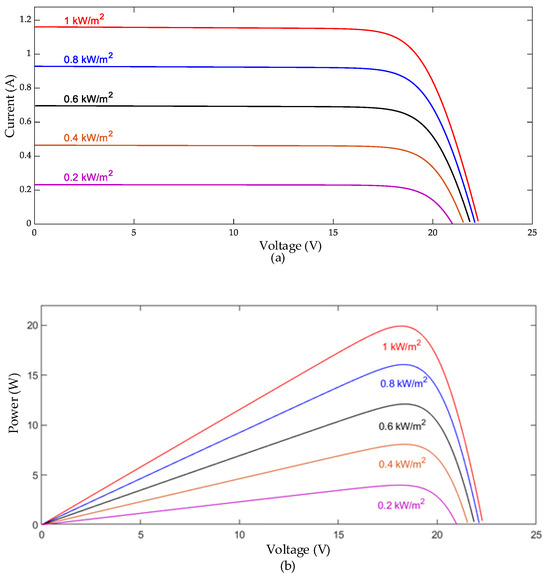
Figure 1.
I-V and P-V characteristic curves of a single photovoltaic module under different irradiance conditions: (a) I-V characteristic curve; (b) P-V characteristic curve.
3. Idols Algorithm
The proposed IA is inspired by the operation model of entertainment agencies in the entertainment industry, particularly the contractual collaboration between agencies and artists. The inspiration for this algorithm comes from the information explosion era, extending the interaction dynamics between entertainment industry stars and their agencies. The IA leverages the management strategies of entertainment agencies, where, in addition to developing the technical abilities of young trainees, the agency also maximizes each trainee’s commercial value and influence to gain widespread popularity. This algorithm is then applied to MPPT for PVMAs.
3.1. Inspiration and Introduction
The output power of a PVMA at different operating points corresponds to the online celebrity (OC) in the IA. The duty ratio of the converter used for MPPT represents the trainee (TN) in the algorithm. During the initialization phase, the basic online celebrity (power) of all trainees is set, followed by six selection stages to determine the maximum online celebrity for each trainee. These six stages include talent scouting, open auditions, solo performances, public performances, elimination rounds, and the annual key performance indicator (KPI) review.
In the proposed IA, the concepts of facial attractiveness (facialA), body fat percentage (BFP), and average weight (Aw) are derived from the extenics theory [23] introduced by Chinese scholars in 1983. This theory categorizes and quantifies characteristic values of attributes (e.g., the height of handsome men) into intervals (e.g., categorizing heights between 170 cm and 180 cm as one group). Generally speaking, the physical peak ages for men and women are 23 and 21, respectively. To enhance the visual appeal of stage performances, entertainment agencies typically impose stricter body management requirements for both men and women, with age limits set at no more than 25 years. Thus, the body fat percentage standards for young trainees are more stringent than those for the general population. For males, the standard body fat percentage is between 14% and 23%, and it is defined as M (male), as shown in Equation (1). For females, the standard body fat percentage is between 17% and 27%, and it is defined as F (female), as shown in Equation (2). Inspired by the gender-neutral concept of fireflies in the FA, the body fat percentage in the IA is defined accordingly. Firstly, the intersection of the M space and F space is obtained, as shown in Equation (3), and then the median is taken, as shown in Equation (4), resulting in a BFP of 20%. As for the elimination round, it is inspired by the selection mechanisms of major talent shows and the survival-of-the-fittest concept in the imperialistic competitive algorithm (ICA) [24], where trainees compete and compare with each other. Ultimately, the most outstanding trainee is selected and debuts in the “center”, which represents the optimal solution. The annual KPI review stage is inspired by the process in companies or organizations where, in the last quarter of each year, employees’ achievements over the past year are assessed. Performance indicators are established to evaluate individual work completion and salary bonuses.
3.2. IA Execution Steps
The IA mimics the process by which an entertainment agency signs contracts with trainees (artists), arranges their schedules, releases promotions, organizes training activities, advertisements, film and television projects, and commercial events. This strategy achieves both local and global searches (represented as solo performances and public performances, respectively), ultimately selecting the most outstanding idol, which corresponds to the optimal solution. The execution steps of the proposed IA are described as follows:
- (1)
- Initialize all parameters of the IA, defining the total number of trainees (TNt) as the search scale. The duty ratio of the boost converter is represented as “trainee,” while the output power of the PVMAs is represented as “online celebrity.” Each trainee has a corresponding online celebrity.
The initialization phase involves defining the parameters listed in Table 2 using the “talent scouting” method. Trainees are then evaluated based on their physical appearance, facial attractiveness, vocal ability, rap skills, and dance performance in the “open auditions” stage. Only trainees who pass this preliminary selection will receive their individual basic online celebrity (BOC). The BOC is organized and ranked, so each trainee will have their corresponding BOC.
Table 2.
Initialization parameters.
- (2)
- Through the establishment of a “company system”, each TN is assigned a corresponding BOC, which is then ranked accordingly.
- (3)
- Each trainee has a corresponding promotion value (PM), which is determined by three main factors: basic online celebrity, public performance, and solo performance. BOC refers to the talent showcased to fans before considering solo performances and public appearances. Each trainee must increase their popularity (likes) by managing their self-media platforms (including Facebook, Instagram, TikTok, YouTube, or Twitter), thereby attracting online celebrity. Trainees can only gain fan affection based on their appearance. The appearance factor is represented by a physical attribute factor, which is determined by facialA, body fat percentage (BFP), and Aw. The mathematical model for this is shown in Equation (5). Since every individual possesses innate features and acquired body shape, the BOC is determined by the body factor (BF). Let represent the promotion value of the current i trainee, and its mathematical model is shown in Equation (6). The initial PM for each TN is calculated using Equations (5) and (6), incorporating facialA and BF to compute the BOC.
According to a global survey conducted by the International Society of Aesthetic Plastic Surgeons (ISAPS) in 2015, Republic of Korea was ranked among the Top 10 countries for cosmetic surgery procedures [25]. The concept of facialA presented in this study is inspired by this trend. Cosmetic surgery techniques include Botox injections, subcutaneous fillers, and radiofrequency skin lifting, among others. Due to the varying quality of services in the market, the outcomes of cosmetic surgeries are mixed, with both success and failure cases. A higher facial attractiveness indicates that the trainee has undergone excessive cosmetic procedures, resulting in an unnatural or striking appearance. Conversely, a lower facial attractiveness may suggest that the trainee’s natural facial features do not conform to common aesthetic standards, which may include facial asymmetry, visible jawbone, or a higher hairline. Therefore, facial attractiveness should not be too high or too low, but rather should be at an optimal value to avoid divergence in the convergence results of the IA. In this study, facial attractiveness is set at a value of 100.
- (4)
- During the elimination round, the current fans count (fans) and the fandom are used to calculate the fan ratio (fr), as shown in Equation (7). This ratio is then used for adjustment. The current fans count represents the number of iterations, while the fandom represents the total number of iterations.
The elimination round uses a selection mechanism to update the trainees, retaining the best-performing trainees with higher online celebrity, while eliminating those with lower online celebrity. The elimination mechanism is determined by the anti-fans rate (AFR), which is influenced by the number of fans within the fandom and the anti-fans weight (afw). Firstly, by calculating the current fans count and the fandom, the fans ratio (fr) is obtained, as shown in Equation (7). Then, using the fr and anti-fans weight, the mathematical model is expressed in Equation (8).
Anti-fans weight represents the proportion of anti-fans within the group of bad fans. The fandom is defined as the Fd space, good fans are defined as the G space, bad fans as the B space, and anti-fans as the A space. The term sasaeng fan (which originates from the subculture of the Korean entertainment industry, refers to fans who are obsessed with uncovering the private lives of celebrities. Sasaeng fans typically have the financial means to purchase advanced filming equipment, allowing them to closely follow idols and capture footage in private locations or during personal activities. Additionally, they may engage in the illegal practice of trading personal information about idols, such as selling private phone numbers, flight details, or personal anecdotes.) is defined as an individual within the S space. The G space is a subset of the Fd space, but it does not belong to the B space, as shown in Equation (9). The B space is a subset of the Fd space, but it does not belong to the G space, as shown in Equation (10). The A space is a subset of the B space, but it does not belong to either the G space or the S space, as shown in Equation (11). The S space is a subset of the B space, but it does not belong to either the G space or the A space, as shown in Equation (12). It follows that both the G space and the B space are subspaces of Fd, and both the A space and the S space are subspaces of the B space. Therefore, the A space is a subspace of the Fd space, as shown in Equation (13). Since represents the subspace of anti-fans as bad fans, the anti-fans weight is required to determine the AFR. The algorithm proposed in this paper uses anti-fans for calculations, rather than sasaeng fans, who are also considered bad fans. The primary reason for this choice is that sasaeng fans are more extreme and disruptive within fan communities, often harassing idols loved by other fan groups. As a result, they are not widely accepted by other fans, and even anti-fans, who are also considered bad fans, tend to distance themselves from sasaeng fans.
- (5)
- Each trainee’s individual best online celebrity is calculated through solo performances (SL). In solo performances, trainees are required to improve their singing abilities (e.g., vocal) and dance skills (e.g., hip-hop, breaking, locking, popping, krump) to enhance their performance and gain more popularity with the audience. After each solo performance, the OC of all trainees is compared. Trainees whose OC decreases will see their rankings drop, while those whose OC increases will replace the ones with lower rankings. Eventually, the trainee with the highest OC during the solo performance will be identified. Let represent the current trainee at position , represent the highest individual OC of the trainee during the solo performance, represent the solo performance coefficient, and represent a random number for the solo performance, with a range of 0 to 1. Therefore, the mathematical model can be expressed as Equation (14).
- (6)
- The public performance (PBP) is used to compare the online celebrity of all trainees, identifying the trainee with the highest online celebrity. In public performances, each trainee is required to engage in group life, enhance their teamwork skills, and foster a spirit of collaboration. This involves participating in various public events (such as concerts, fan meetings, variety shows, talent shows, company year-end parties, and school celebrations), which helps trainees increase their exposure by showcasing themselves in the public eye. After each public performance, the OC of all trainees is compared. The trainee with the highest OC is rewarded accordingly, and this information is made public to all trainees. This motivates the trainees to compete and learn from one another to achieve a higher OC. Let represent the trainee with the highest OC during the public performance, represent the public performance coefficient, and represent a random number for the public performance, with a range of 0 to 1. Therefore, the mathematical model can be expressed as Equation (15).
- (7)
- The new promotion value for the next iteration is calculated based on the BOC, public performance, and solo performance OC. Let represent the new promotion value, and the mathematical model can be expressed as Equation (16).
- (8)
- Entering the “annual KPI review” stage, the OC of all trainees is updated based on their current number of fans, afw, and the changes in OC from the current year and previous year. The annual KPI review is a process where entertainment companies track, record, and evaluate each trainee’s number of fans at the end of each year. If the current number of fans is less than the total number of fans in the fandom, the process returns to Step (3) to continue nurturing the trainee to achieve better OC. On the other hand, if the current number of fans is equal to the total number of fans in the fandom, it means that the trainee has gained full attention and support from all the fans, with no more anti-fans. At this point, the trainee can debut in the C position (where “C” stands for “center”, originally meaning the central or most important position, later implying a strong, central figure in the group who has more screen time and is more memorable to the audience). Let represent the new trainee, the trainee with the highest OC during public performance, the anti-fans rate, and the new promotion value. The mathematical model is given in Equation (17).
The IA proposed in this paper primarily utilizes the anti-fans rate obtained from Equations (7) and (8) during the elimination phase. This rate is then substituted into Equation (17) to identify the next trainee with improved performance. In the early stages of a trainee’s development, when the number of fans is relatively low, the anti-fans rate is higher. Over time, as trainees progress, compete, and are eliminated annually, those who perform better attract more fans, leading to a decrease in the anti-fans rate. This mechanism allows the IA to converge effectively. Essentially, each trainee’s performance influences the OC they receive in the subsequent year. Trainees must continuously improve, compete with peers from the same cohort, and replace others to achieve the highest OC and debut in the center position. Figure 2 illustrates the flowchart of the IA.
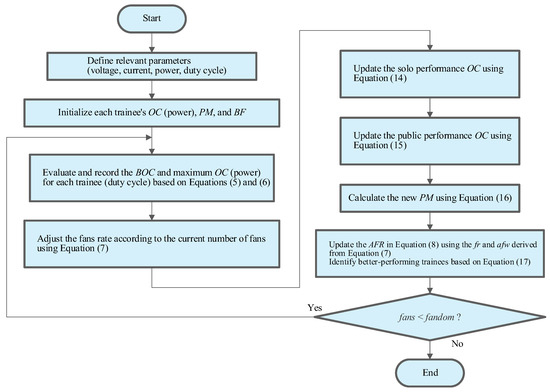
Figure 2.
Flowchart of the IA.
4. Design of Converter for Maximum Power Point Tracking Control
Figure 3 illustrates the architecture for applying the IA to track the maximum power point of the PVMA. This architecture primarily consists of four components: the PV module array, boost converter [26,27], load, and controller circuit. In implementation, a differential amplifier is used to feedback the voltage and current signals from the PVMA. The IA then adjusts the duty cycle of the boost converter in each iteration to control the output voltage of the array, ensuring maximum power point tracking.
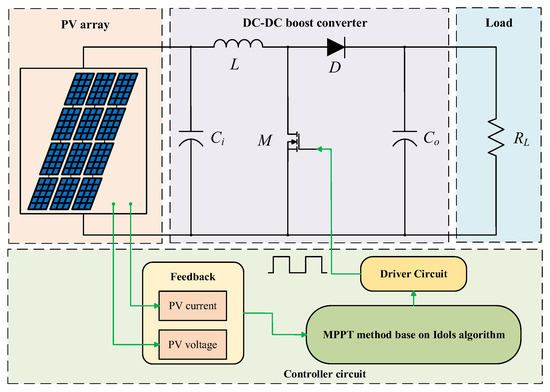
Figure 3.
MPPT architecture using the IA.
In general, the operating frequency is inversely proportional to the volume of the energy storage inductor and the filtering capacitor. Therefore, to account for the practical size constraints, the switching frequency of the boost converter is selected to be 25 kHz in this paper. Table 3 presents the component specifications of the boost converter used in this study.
Table 3.
Specifications of the boost converter components.
5. Simulation Results
This paper proposes a novel intelligent IA. To verify the feasibility of the mathematical model for the promotion values in the IA, MATLAB simulations were conducted, and the convergence curve of the promotion values is shown in Figure 4. In the simulation, the fandom was set to 500, and the total number of trainees was set to 600. From the simulation results, it is clear that the promotion values can indeed converge, confirming that the mathematical model can successfully converge to 0 with each iteration, allowing the algorithm to find the optimal solution.
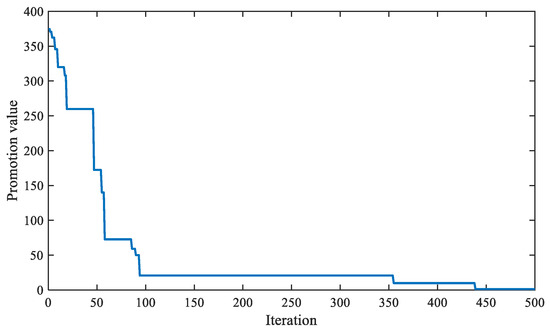
Figure 4.
Convergence curve of promotion values.
This paper uses MATLAB to establish a model for a 4S3P photovoltaic module array, consisting of single SWM20W modules, to simulate the tracking performance of the proposed IA. The simulation tests are performed under 10 different shading conditions, comparing the proposed IA with the CSO, the BA, and the PSO. The tracking response speed of the different methods is compared. Table 4 shows the parameter settings for the maximum power point tracking based on the IA. The shading ratio for each test case and the corresponding P-V characteristic curves with varying peak values are shown in Table 5.
Table 4.
Parameter settings of the MPPT based on the IA.
Table 5.
Number of peaks in the P-V characteristic curves of the PVMA under 10 different shading conditions.
- (1)
- Case 1 Test
Figure 5 shows the P-V and I-V characteristic curves of the PVMAs under standard test conditions, with no shading. The maximum power point is 238 W. Figure 6, Figure 7, Figure 8 and Figure 9 compare the simulation results of the proposed IA, CSO, BA, and PSO for maximum power point tracking. The simulation results show that all four methods successfully track the true maximum power point, voltage, current, and duty cycle. Among these methods, the IA has the fastest dynamic response and the best steady-state performance, while the dynamic response of the PSO is the slowest and most unstable.
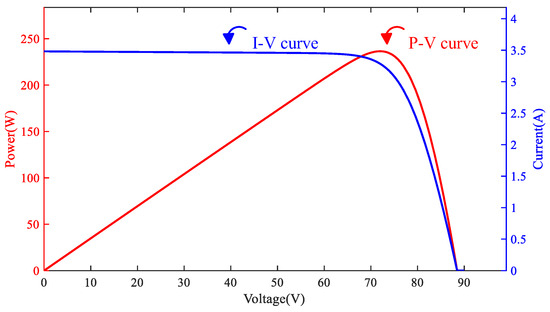
Figure 5.
P-V characteristic curve for case 1.
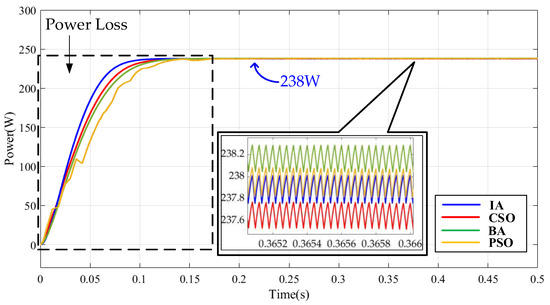
Figure 6.
Simulation power results comparison for case 1.
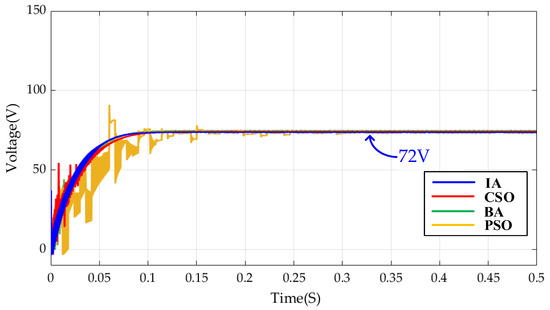
Figure 7.
Simulation voltage results comparison for case 1.
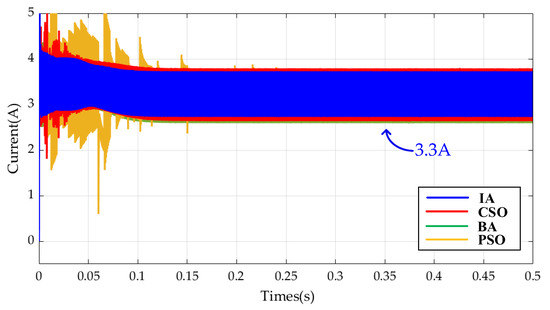
Figure 8.
Simulation current results comparison for case 1.
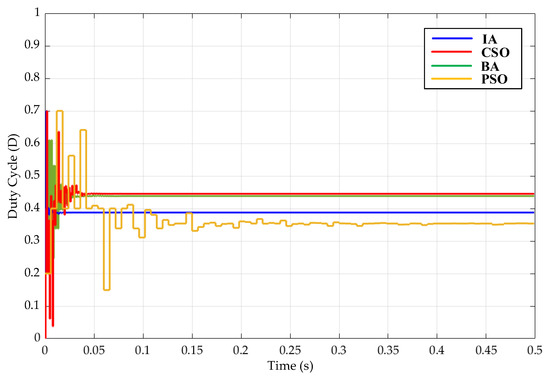
Figure 9.
Simulation duty cycle results comparison for case 1.
- (2)
- Case 2 Test
Figure 10 shows the P-V and I-V characteristic curves of the PVMAs under standard test conditions, where one module in the first string is partially shaded by 90%. The P-V characteristic curve exhibits a dual-peak phenomenon, with the GMPP at 187 W, located at the left-side peak. Figure 11, Figure 12, Figure 13 and Figure 14 compare the simulation results of the proposed IA with three other algorithms for the maximum power point tracking, voltage, current, and duty cycle. From the simulation results, it can be observed that all four methods are able to track the GMPP, with the IA being the fastest in dynamic response among the four methods.
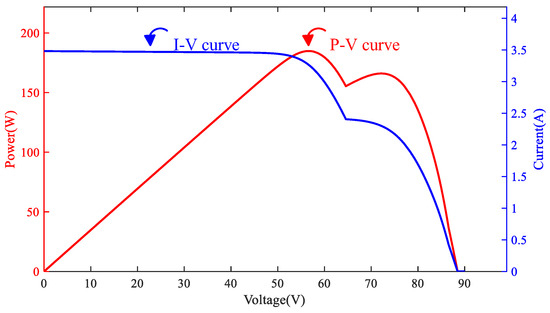
Figure 10.
P-V characteristic curve for case 2.
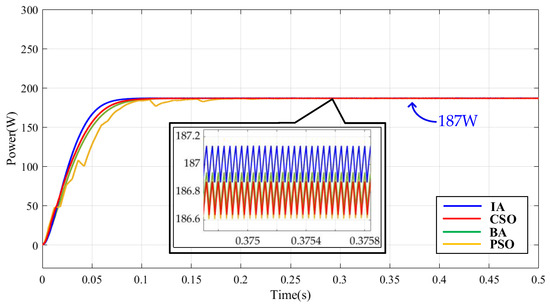
Figure 11.
Simulation power results comparison for case 2.
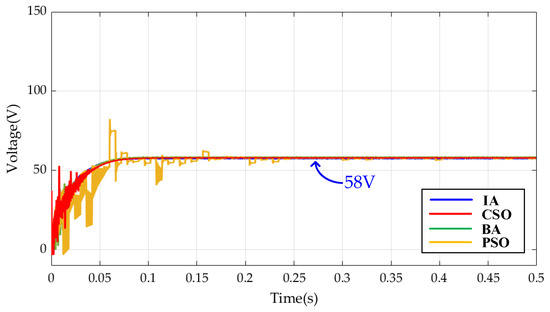
Figure 12.
Simulation voltage results comparison for case 2.

Figure 13.
Simulation current results comparison for case 2.
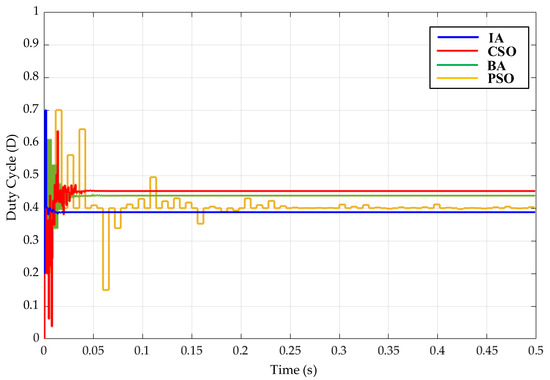
Figure 14.
Simulation duty cycle results comparison for case 2.
- (3)
- Case 3 Test
Figure 15 illustrates the P-V and I-V characteristic curves of two modules in the first string of the PVMAs under standard test conditions. One module experiences 40% shading, while the other undergoes 90% shading. The P-V characteristic curve exhibits a triple-peak phenomenon, with the GMPP at 174 W, located at the middle peak. Figure 16, Figure 17, Figure 18 and Figure 19 compare the simulation results of the proposed IA with three other algorithms for the maximum power point tracking, voltage, current, and duty cycle. From the simulation results, it can be observed that all four methods are able to track the global maximum power point. Among them, the IA exhibits the fastest dynamic response and the best steady-state performance. Although the PSO is the first to track the maximum power point, it lacks stability and continues to fluctuate during tracking.
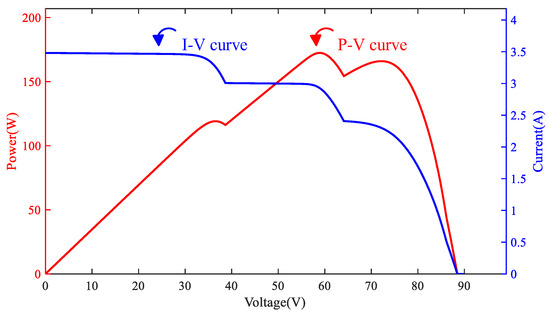
Figure 15.
P-V characteristic curve for case 3.
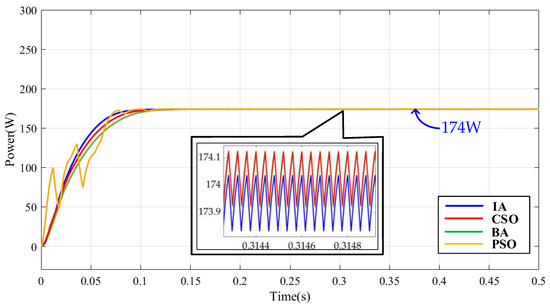
Figure 16.
Simulation power results comparison for case 3.
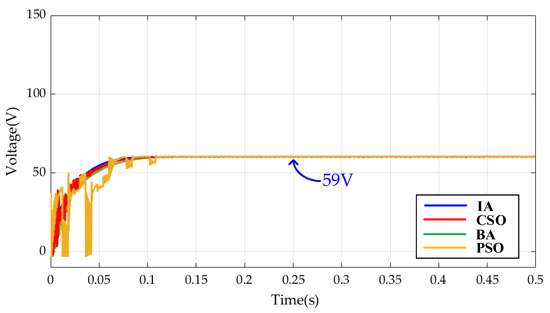
Figure 17.
Simulation voltage results comparison for case 3.
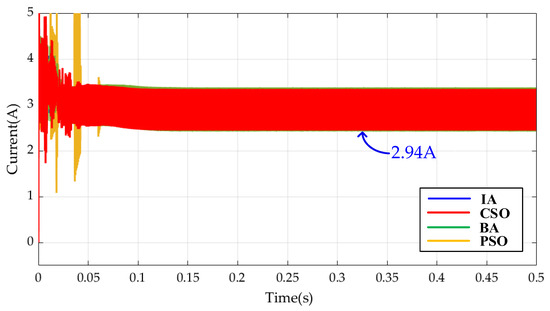
Figure 18.
Simulation current results comparison for case 3.
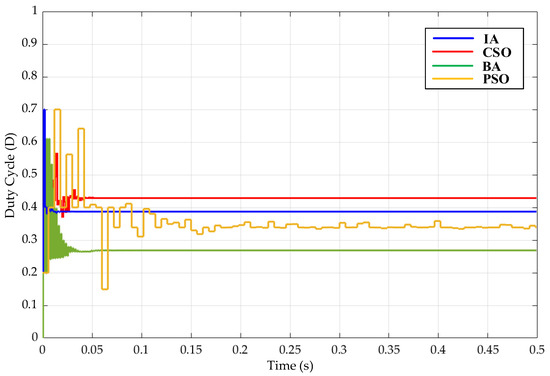
Figure 19.
Simulation duty cycle results comparison for case 3.
- (4)
- Case 4 Test
Figure 20 reveals the P-V and I-V characteristic curves of three modules in the first string of the PVMAs under standard test conditions, with shading levels of 30%, 60%, and 70%, respectively. The P-V characteristic curve exhibits a quadruple-peak phenomenon, with the GMPP at 184 W, located at the first peak on the right. Figure 21, Figure 22, Figure 23 and Figure 24 compare the simulation results of the proposed IA with three other algorithms for the maximum power point tracking, voltage, current, and duty cycle. From the simulation results, it can be observed that all four methods are able to track the global maximum power point, with the IA being the fastest in dynamic response among the four methods.
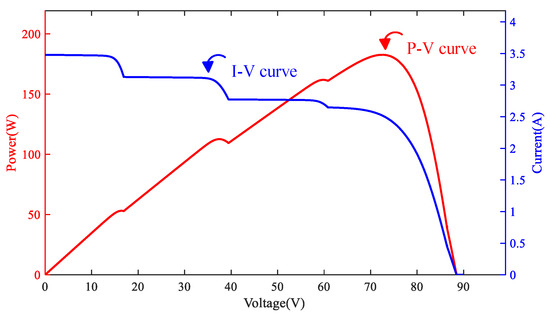
Figure 20.
P-V characteristic curve for case 4.
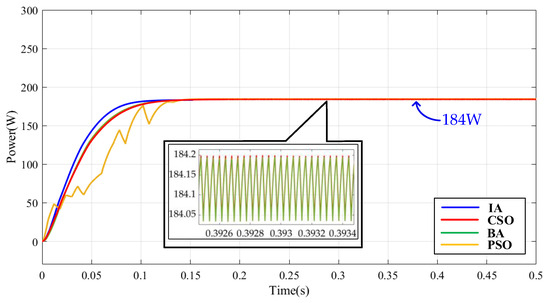
Figure 21.
Simulation power results comparison for case 4.
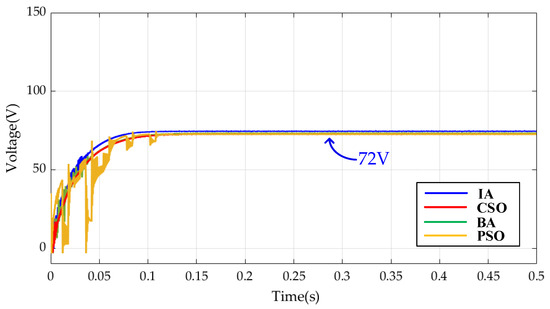
Figure 22.
Simulation voltage results comparison for case 4.
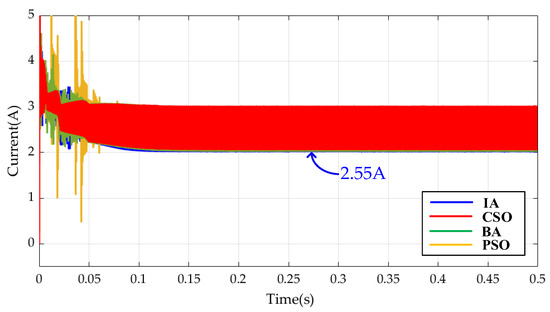
Figure 23.
Simulation current results comparison for case 4.
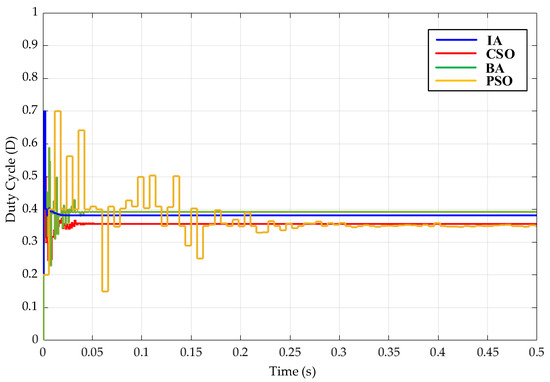
Figure 24.
Simulation duty cycle results comparison for case 4.
- (5)
- Case 5 Test
Figure 25 shows the P-V and I-V characteristic curves of nine modules from the second, third, and fourth strings of the PVMAs under standard test conditions, with three modules shaded at 10%, three at 80%, and three at 90%, respectively. The P-V characteristic curve exhibits a quadruple-peak phenomenon, with the GMPP at 106 W, located at the third peak on the left. Figure 26, Figure 27, Figure 28 and Figure 29 compare the simulation results of the proposed IA with three other algorithms for the maximum power point tracking, voltage, current, and duty cycle. The simulation results indicate that all four methods are capable of tracking the global maximum power point. While the CSO reaches the maximum power point more quickly, it does not precisely track the optimal value. Therefore, considering both the tracking speed and steady-state performance, the IA offers superior overall tracking efficiency compared to the CSO.
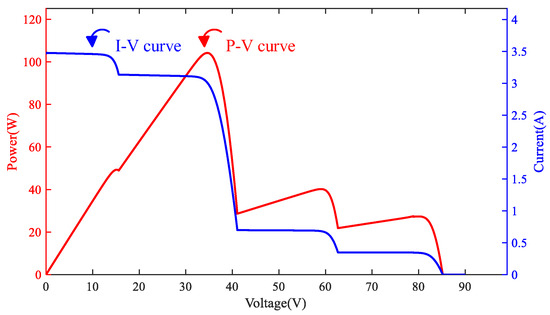
Figure 25.
P-V characteristic curve for case 5.
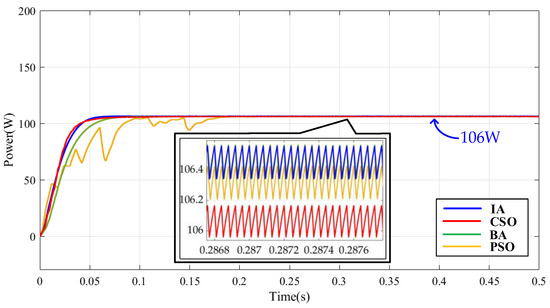
Figure 26.
Simulation power results comparison for case 5.
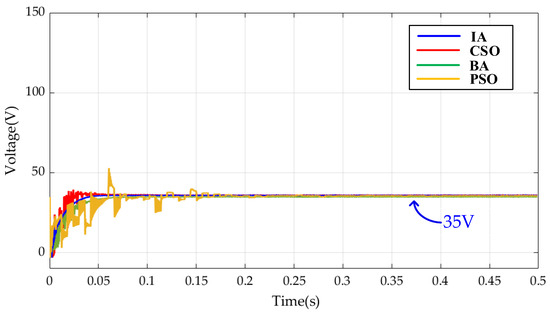
Figure 27.
Simulation voltage results comparison for case 5.
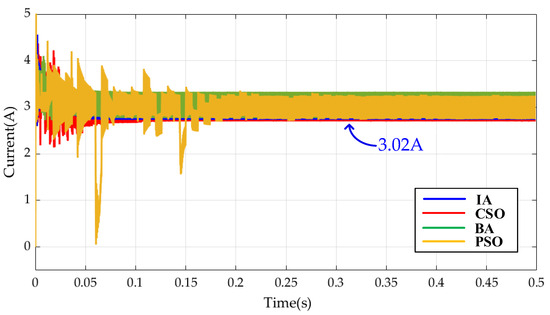
Figure 28.
Simulation current results comparison for case 5.
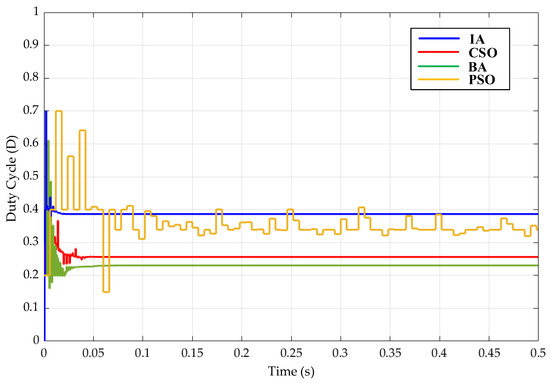
Figure 29.
Simulation duty cycle results comparison for case 5.
Taking case 1 as an example, as shown in Figure 6, the maximum power point tracking (MPPT) simulation adopts the idols algorithm, particle swarm optimization (PSO), bat algorithm (BA), and cat swarm optimization (CSO), respectively. If the area from the tracking starting point to the global maximum power point (indicated by the black dashed line) is considered the ideal output energy of the photovoltaic module array during the tracking process, and the tracking curve of each algorithm toward the global maximum power point across the entire region is regarded as the actual output energy, then the tracking efficiency is calculated as the ratio of these two areas. The comparison of tracking efficiencies for each method is shown in Table 6. It can be observed from Table 6 that all methods achieve efficiencies above 74%, and among all cases, the idols algorithm demonstrates the best dynamic tracking efficiency among the four methods, with efficiencies consistently above 85%.
Table 6.
Tracking efficiency comparison of the five cases.
6. Conclusions
This paper presents a novel optimization algorithm, referred to as the “Idol Algorithm”, which is inspired by the dynamics of the entertainment industry. The mathematical model and parameters are designed and defined based on this inspiration, and the algorithm is applied to maximum power point tracking (MPPT) for PVMAs under various shading conditions and different sunlight intensities. The goal is to improve the tracking efficiency, reduce energy loss, and ultimately increase power generation. Firstly, a PVMA model is built using MATLAB simulation software, with various shading conditions set to create different multi-peak phenomena in the P-V characteristic curves for MPPT testing. This paper compares the simulation results of the proposed IA with three other algorithms: CSO, BA, and PSO for the maximum power point tracking of PVMAs. The simulation results demonstrate that, under different shading conditions with multi-peak P-V characteristic curves, the IA successfully escapes local maximum power points and accurately tracks the global maximum power point. The idol algorithm proposed in this study primarily utilizes an iterative equation, in which the control parameter anti-fan rate (AFR) gradually converges to zero over time. This causes the search space to shrink, which facilitates localized refinement and enhances the convergence speed of the system. This characteristic is similar to the attenuation mechanism of simulated annealing or the loudness reduction mechanism in the bat algorithm (BA), but the idol algorithm is more structured and analytically defined. Moreover, the promotion value is analogous to the velocity term in the transient response of a standard second-order system, corresponding to the first derivative, while the body factor (BF) functions similarly to damping, thereby suppressing oscillations. Compared with the other three algorithms, it exhibits superior dynamic response and steady-state performance, which reduces power loss during the tracking process and enhances the overall power generation efficiency of the photovoltaic system.
Author Contributions
Conceptualization, K.-H.C.; Methodology, K.-H.C.; Software, Y.-C.K.; Validation, Y.-C.K.; Formal analysis, Y.-C.K.; Investigation, Y.-C.K.; Resources, K.-H.C.; Data curation, Y.-C.K.; Writing—original draft, K.-H.C.; Writing—review & editing, K.-H.C.; Supervision, K.-H.C.; Project administration, K.-H.C.; Funding acquisition, K.-H.C. All authors have read and agreed to the published version of the manuscript.
Funding
The authors gratefully acknowledge the support and funding of this project by the National Science and Technology Council, Taiwan, under the Grant Number NSTC 113-2221-E-167-035.
Institutional Review Board Statement
Not applicable.
Informed Consent Statement
Not applicable.
Data Availability Statement
The original contributions presented in this study are included in the article. Further inquiries can be directed to the corresponding author.
Conflicts of Interest
The authors of the manuscript declare no conflicts of interest.
References
- He, X.; Huang, B.; Ye, Y.; Fang, Y.; Wang, Z.; He, X. Optimizing Grid-connected Photovoltaic Systems through Reactive Power Control Strategy. In Proceedings of the 2023 Panda Forum on Power and Energy (PandaFPE), Chengdu, China, 27–30 April 2023; pp. 119–124. [Google Scholar]
- Lu, K.C.; Lin, F.J.; Yang, B.H. Profit Optimization-based Power Compensation Control Strategy for Grid-Connected PV System. IEEE Syst. J. 2018, 12, 2878–2881. [Google Scholar] [CrossRef]
- Routray, D.; Rout, P.K.; Sahu, B.K. A Brief Review and Comparative Analysis of Two Classical MPPT Techniques. In Proceedings of the 2021 International Conference in Advances in Power, Signal, and Information Technology (APSIT), Bhubaneswar, India, 8–10 October 2021; pp. 1–6. [Google Scholar]
- Masoum, M.A.S.; Dehbonei, H.; Fuchs, E.F. Theoretical and Experimental Analyses of Photovoltaic Systems with Voltage and Current-based Maximum Power-point Tracking. IEEE Trans. Energy Convers. 2002, 17, 514–522. [Google Scholar] [CrossRef]
- Shams, I.; Mekhilef, S.; Tey, K.S. Improved Social Ski Driver-based MPPT for Partial Shading Conditions Hybridized with Constant Voltage Method for Fast Response to Load Variations. IEEE Trans. Sustain. Energy 2021, 12, 2255–2267. [Google Scholar] [CrossRef]
- Femia, N.; Granozio, D.; Petrone, G.; Spagnuolo, G.; Vitelli, M. Predictive & Adaptive MPPT Perturb and Observe Method. IEEE Trans. Aerosp. Electron. Syst. 2007, 43, 934–950. [Google Scholar] [CrossRef]
- Killi, M.; Samanta, S. Modified Perturb and Observe MPPT Algorithm for Drift Avoidance in Photovoltaic Systems. IEEE Trans. Ind. Electron. 2015, 62, 5549–5559. [Google Scholar] [CrossRef]
- Tsai, Z.M.; Sun, K.J.; Vendelin, G.D.; Wang, H. A New Feedback Method for Power Amplifier with Unilateralization and Improved Output Return Loss. IEEE Trans. Microw. Theory Tech. 2006, 54, 1590–1597. [Google Scholar] [CrossRef]
- Verma, P.; Katal, N.; Jain, G.; Jayaswal, K. Global Maximum Power Point Tracking Methods for Multi-Peak Power Versus Voltage Curve of Photovoltaics: A Review. In Proceedings of the 6th IEEE International Conference on Recent Advances and Innovations in Engineering (ICRAIE), Kedah, Malaysia, 1–3 December 2021; pp. 1–5. [Google Scholar]
- Ma, Y.; Zhou, X.; Gao, Z.; Bai, T. Summary of the Novel MPPT (Maximum Power Point Tracking) Algorithm Based on Few Intelligent Algorithms Specialized on Tracking the GMPP (Global Maximum Power Point) for Photovoltaic Systems under Partially Shaded Conditions. In Proceedings of the IEEE International Conference on Mechatronics and Automation, Takamatsu, Japan, 6–9 August 2017; pp. 311–315. [Google Scholar]
- Huang, Y.P.; Huang, M.Y.; Ye, C.E. A Fusion Firefly Algorithm with Simplified Propagation for Photovoltaic MPPT under Partial Shading Conditions. IEEE Trans. Sustain. Energy 2020, 11, 2641–2652. [Google Scholar] [CrossRef]
- Chao, K.H.; Zhang, S.W. An Maximum Power Point Tracker of Photovoltaic Module Arrays Based on Improved Firefly Algorithm. Sustainability 2023, 15, 8550. [Google Scholar] [CrossRef]
- Pragallapati, N.; Sen, T.; Agarwal, V. Adaptive Velocity PSO for Global Maximum Power Control of a PV Array under Nonuniform Irradiation Conditions. IEEE J. Photovolt. 2017, 7, 624–639. [Google Scholar] [CrossRef]
- Tey, K.S.; Mekhilef, S.; Seyedmahmoudian, M. Implementation of Bat Algorithm as Maximum Power Point Tracking Technique for Photovoltaic System under Partial Shading Conditions. In Proceedings of the IEEE Energy Conversion Congress and Exposition (ECCE), Portland, OR, USA, 23–27 September 2018; pp. 2531–2535. [Google Scholar]
- Eltamaly, A.M.; AI-Saud, M.S.; Abokhalil, A.G. A Novel Bat Algorithm Strategy for Maximum Power Point Tracker of Photovoltaic Energy Systems Under Dynamic Partial Shading. IEEE Access 2020, 8, 10048–10060. [Google Scholar] [CrossRef]
- Chao, K.H.; Bau, T.T.T. Global Maximum Power Point Tracking of Photovoltaic Module Arrays Based on an Improved Intelligent Bat Algorithm. Electronics 2024, 13, 1207. [Google Scholar] [CrossRef]
- Chao, K.H.; Nguyen, T.B.N. Global Maximum Power Point Tracking of a Photovoltaic Module Array Based On Modified Cat Swarm Optimization. Appl. Sci. 2024, 14, 2853. [Google Scholar] [CrossRef]
- Thangam, T.; Mythuvel, K. Hybrid Algorithm Based PFoPID Control Design of a Grid-connected PV Inverter for MPPT. In Proceedings of the IEEE Second International Conference on Inventive Research in Computing Applications (ICIRCA), Coimbatore, India, 15–17 July 2020; pp. 992–998. [Google Scholar]
- Guo, X.C.; Xu, D. Application of Improved Cat Swarm Optimization in MPPT Control of Photovoltaic Arrays. IOP Conf. Ser. Earth Environ. Sci. 2018, 153, 032024. [Google Scholar]
- Wolpert, D.H.; Macready, W.G. No Free Lunch Theorems for Optimization. IEEE Trans. Evol. Comput. 1997, 1, 67–82. [Google Scholar] [CrossRef]
- Kang, J.W.; Park, H.J.; Ro, J.; Jung, H.K. A Strategy-selecting Hybrid Optimization Algorithm to Overcome the Problems of the No Free Lunch Theorem. IEEE Trans. Magn. 2018, 54, 8201904. [Google Scholar] [CrossRef]
- SunWorld Datasheet. Available online: http://www.ecosolarpanel.com/ecosovhu/products/18569387_0_0_1.html (accessed on 1 April 2025).
- Chao, K.H.; Chang, L.Y.; Xu, F.Q. Smart Fault-tolerant Control System Based on Chaos Theory and Extension Theory for Locating Faults in a Three-level T-type Inverter. Appl. Sci. 2019, 9, 3071. [Google Scholar] [CrossRef]
- Luo, J.; Zhou, J.; Jiang, X. A Modification of The Imperialist Competitive Algorithm with Hybrid Methods for Constrained Optimization Problems. IEEE Access 2021, 9, 161745–161760. [Google Scholar] [CrossRef]
- International Society of Aesthetic Plastic Surgeons (ISAPS). Global Survey 2015. Available online: https://www.isaps.org/discover/about-isaps/global-statistics/reports-and-press-releases/global-survey-2015-full-report-and-press-releases-english/ (accessed on 2 June 2025).
- Azer, P.; Emadi, A. Generalized State Space Average Model for Multi-Phase Interleaved Buck, Boost and Buck-Boost DC-DC Converters: Transient, Steady-State and Switching Dynamics. IEEE Access 2020, 8, 77735–77745. [Google Scholar] [CrossRef]
- Veerachary, M.; Kumar, P. Analysis and Design of Quasi-Z-Source Equivalent DC–DC Boost Converters. IEEE Trans. Ind. Appl. 2020, 56, 6642–6656. [Google Scholar] [CrossRef]


Disclaimer/Publisher’s Note: The statements, opinions and data contained in all publications are solely those of the individual author(s) and contributor(s) and not of MDPI and/or the editor(s). MDPI and/or the editor(s) disclaim responsibility for any injury to people or property resulting from any ideas, methods, instructions or products referred to in the content. |
© 2025 by the authors. Licensee MDPI, Basel, Switzerland. This article is an open access article distributed under the terms and conditions of the Creative Commons Attribution (CC BY) license (https://creativecommons.org/licenses/by/4.0/).