Abstract
In this study, we formulate and analyze a susceptible–infected–susceptible (SIS) dynamic on metapopulation networks, where each node has a finite carrying capacity and the motion of individuals is modulated by vacant space at the destination. We obtain that the vacancy-dependent mobility pattern results in various asymptotic population distributions on heterogeneous metapopulation networks. The resulting population distributions have remarkable impact on the behavior of SIS dynamics. We show that, for the given total number of individuals, higher heterogeneity in population distributions facilitates epidemic spreading in terms of both a smaller epidemic threshold and larger macroscopic incidence. Moreover, we analytically obtain a sufficient condition that the disease-free equilibrium becomes unstable and an endemic state arises. Contrary to the absence of an epidemic threshold in the standard diffusion case without excluded-volume effects, the finite carrying capacity induces a nonzero epidemic threshold under certain conditions in the limit of infinite network sizes with an unbounded maximum degree. Our analytical results agree well with numerical simulations.
Keywords:
heterogeneous networks; susceptible-infected-susceptible; epidemic threshold; macroscopic incidence; mobility pattern MSC:
92D30; 92B05; 05C82; 82C26
1. Introduction
Metapopulation networks have been widely used to study the epidemic processes in a spatially structured population with mobile individuals [1]. This includes, for example, forecasting global outbreak trajectories of severe acute respiratory syndrome (SARS) [2] and assessing intervention strategies for COVID-19 [3]. In metapopulation networks, nodes represent subpopulations where individuals interact and edges allow for the movement of individuals [4,5,6]. Previous studies have shown that mobility patterns fundamentally influence the epidemic processes on metapopulation networks. Various mobility patterns have been considered, such as recurrent host mobility [7,8,9,10,11], prevalence-base mobility restrictions [12], mobility processes based on realistic transportation data [2], and density-dependent migration [13].
In many real systems, due to the finite carrying capacity of each node, diffusion behavior is usually affected by competition for the available space or resource. The actual migratory flows between nodes depend on vacant conditions [14]. This vacancy-dependent mobility has resulted in a nonlinear relationship between the stationary distribution of diffusing individuals and the node degree [14,15,16] at variance with the linear relationship in standard diffusion with independent movements among individuals [4,17]. There is growing concern about the effect of finite carrying capacity on epidemic spreading on metapopulation networks. Recently, Siebert et al. [18] proposed an epidemic model of optimal social distancing in the framework of metapopulation networks with finite carrying capacity.
In this paper, we investigate susceptible–infected–susceptible (SIS) dynamics on heterogeneous metapopulation networks with finite carrying capacity. The diffusion of individuals is dependent on the vacant space at the nearest neighbors. This vacancy-dependent mobility generates various steady population distributions on heterogeneous metapopulation networks. We find that, for the given total number of individuals, greater heterogeneity in population distribution favors epidemic spreading with a smaller epidemic threshold and a larger macroscopic incidence. Furthermore, we analytically obtain a sufficient condition for the instability of the disease-free state. We find that when the number of individuals at the maximum-degree nodes is bounded, the epidemic threshold is nonzero in the limit of infinite network sizes with a diverging maximum degree, at variance with the absence of an epidemic threshold in the standard diffusion case (which corresponds to the situation where each node has unlimited carrying capacity in the context of our studied model) [17,19,20]. Our analytical results are confirmed by numerical simulations.
2. The Model
We consider a generic undirected network composed of N nodes and characterized by its adjacency matrix A, with elements when nodes i and j are connected and zero otherwise. The degree of node i is the number of connected neighbors, i.e., . Let represents the carrying capacity of node i, which indicates that node i is able to host a maximum number of individuals. The number of individuals in node i is denoted as . Each individual attempts to perform diffusion with rate d, while the actual jump between nodes depends on vacant conditions of the destination. The jump can only occur if the destination node j has vacant space, i.e., with probability [14]. So, when moving, individuals prefer destinations with a higher vacant level. Thus, the hopping probability from node i to j is
where is the probability that the individuals sitting on node i randomly select one of the neighboring nodes as its destination. In Appendix A, Figure A1a shows a schematic of the movement process between two nodes of the network.
In addition to the movement processes, local SIS reaction dynamics take place simultaneously. Each individual can be either susceptible (S, who can catch the disease) or infected (I, who has the disease and transmits it). Let and denote the number of susceptible and infected individuals in node i, respectively. Hence, is the total number of individuals in node i. We assume the two different classes are uniformly mixed and there is all-to-all interaction within each node. The transmission of the infection involves each pair having an infection rate at which a susceptible individual becomes infected,
Under well-mixed assumption, within node i, there are a total of distinct pairs (i.e., susceptible individuals interact with all of the infected individuals in the same node). Thus, the infection event rate within node i is . One infection event means that the number of susceptible individuals is reduced by one. The gain in the infected individuals is equal to the loss of susceptible individuals. The recovery process is that each infected individual spontaneously becomes susceptible with recovery rate ,
Then, within node i, the recovery event rate is . An infection event reduces the number of infected individuals by one. In Appendix A, Figure A1b shows a schematic of the local SIS reaction dynamics.
To capture the heterogeneity in the carrying capacity [21], we assume the following nonlinear form for carrying capacity :
where is the average carrying capacity per node and . The tunable exponent controls the correlation between the carrying capacity and the node’s degree. For , we have a scenario in which larger degree nodes have a higher carrying capacity. On the other hand, an exponent implies a scenario in which smaller degree nodes have a higher carrying capacity. Finally, for , each node has the same carrying capacity.
3. Simulation Procedures
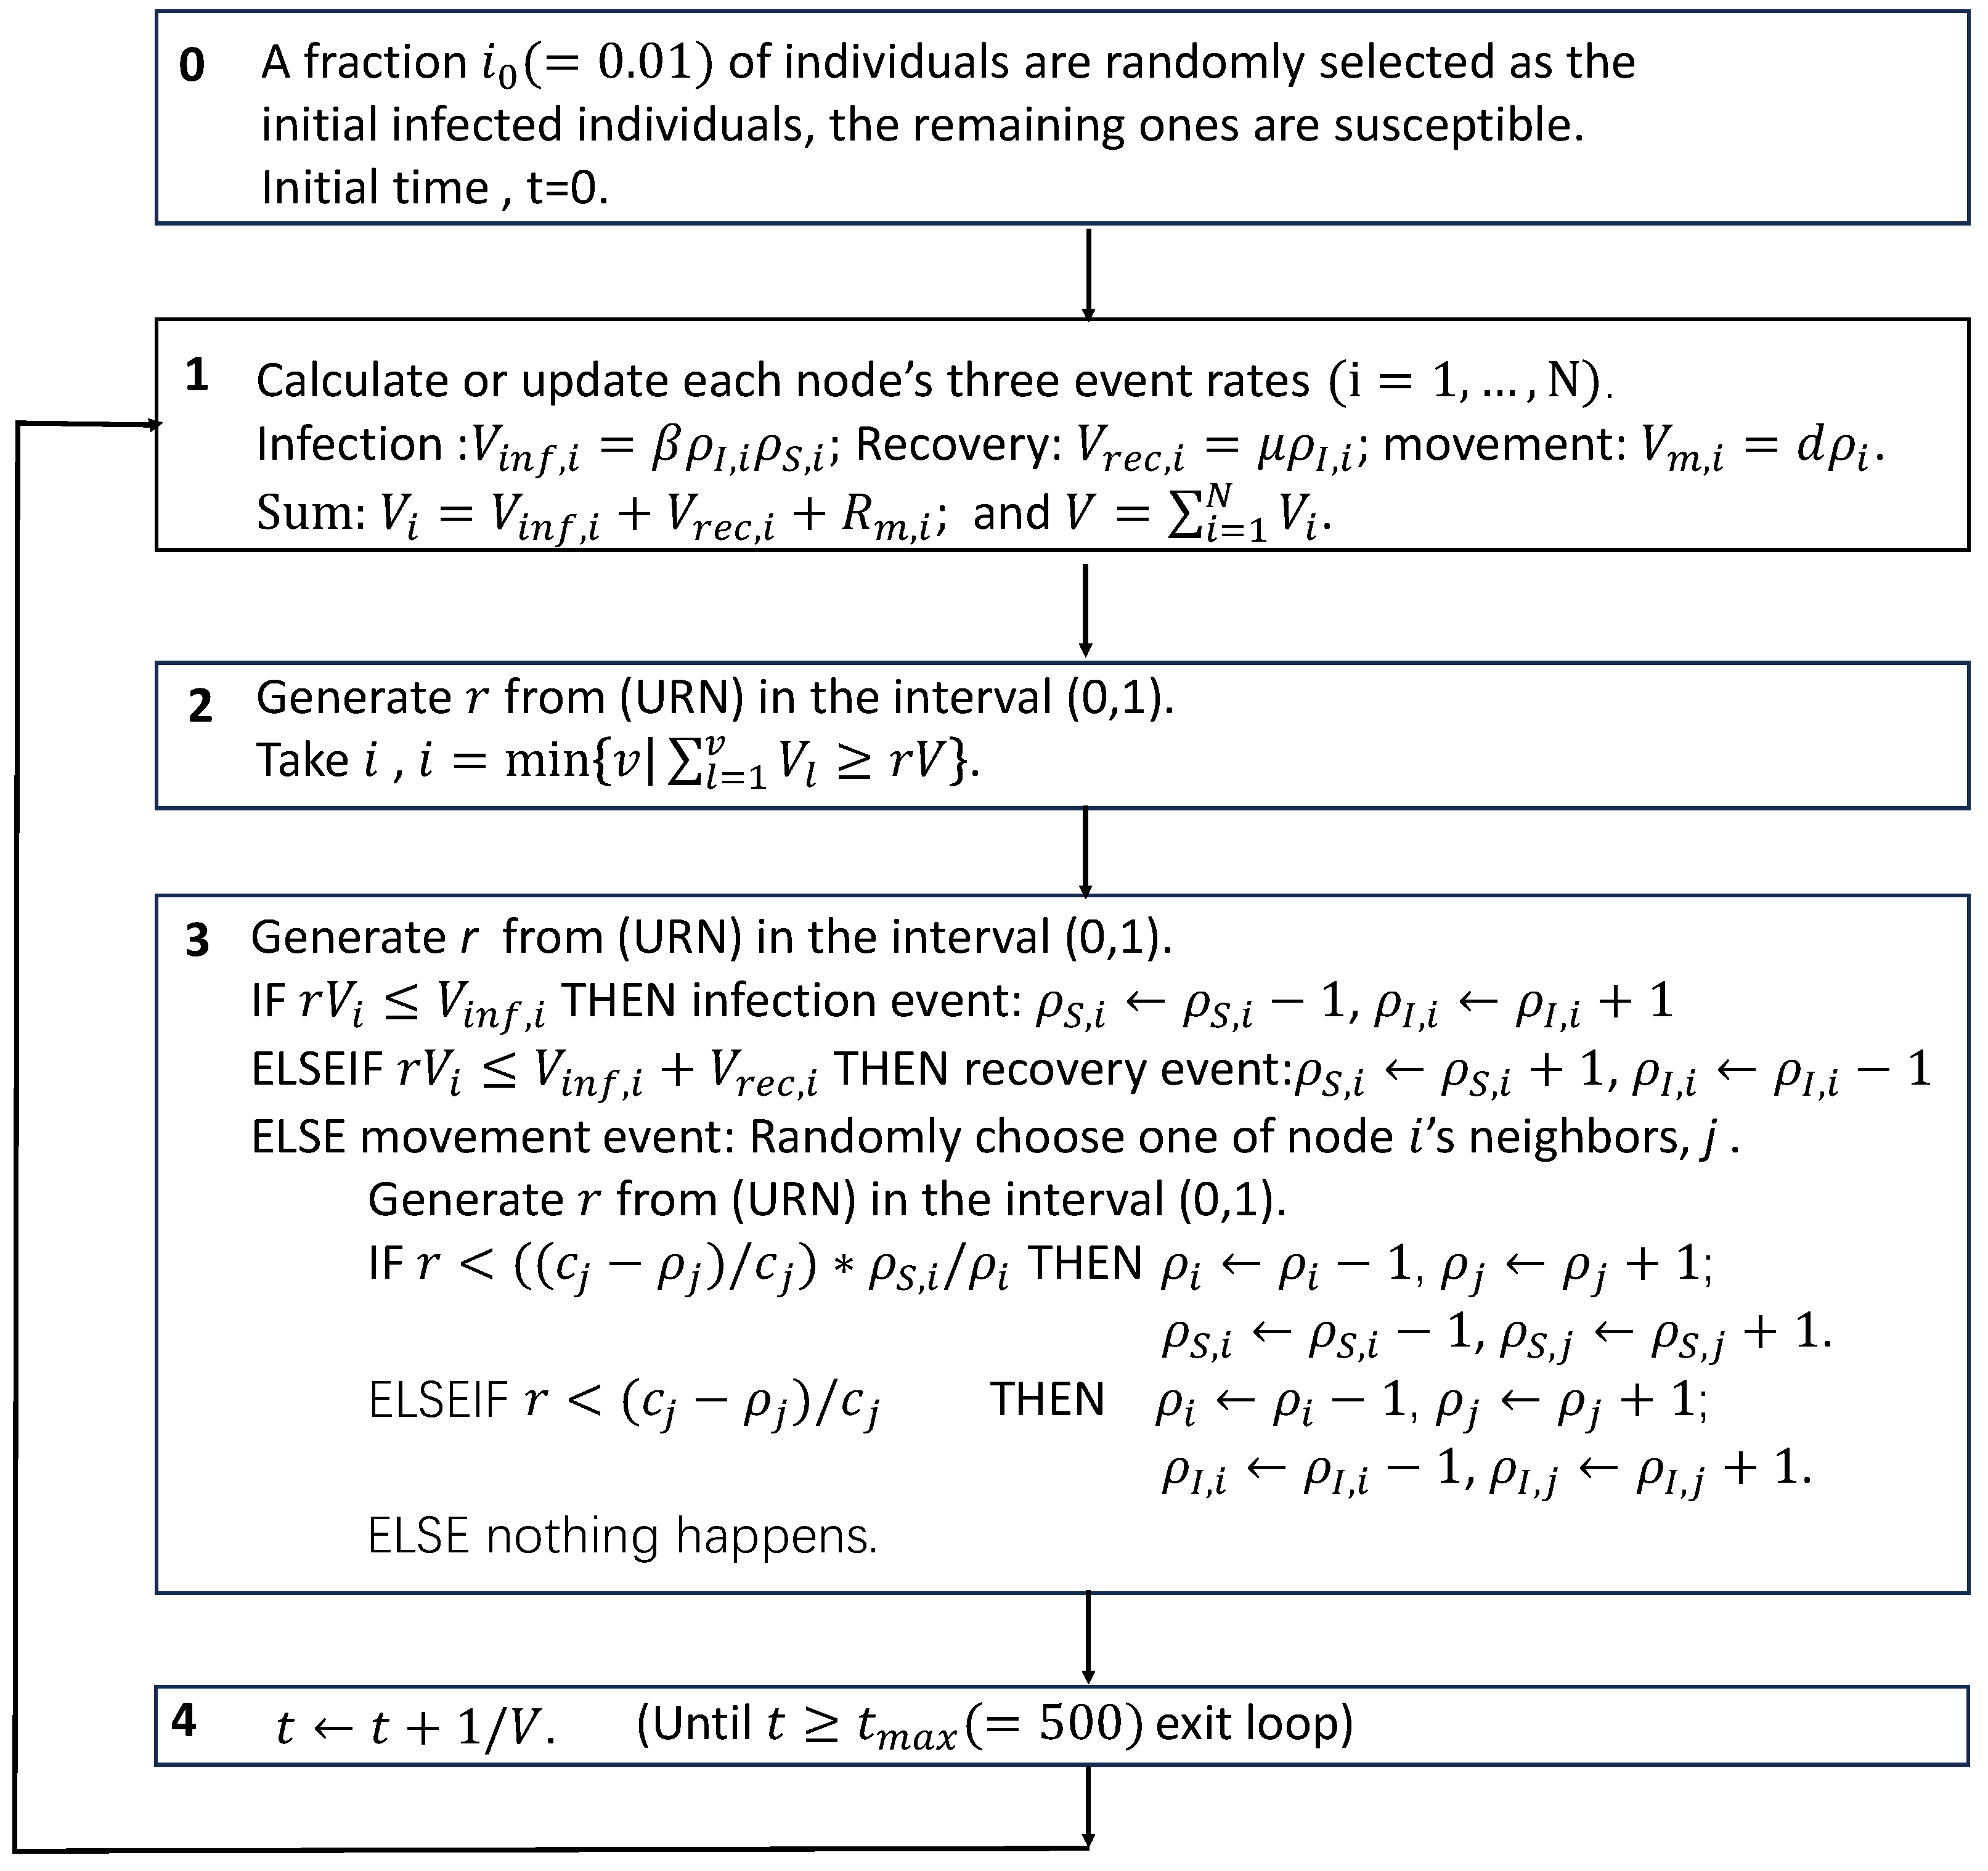
We use Gillespie’s algorithm [22] to simulate our studied model for confirming analytical predictions. For a given set of parameters and , we calculate from Equation (4) each node’s carrying capacity . In the numerical simulation, initially, a total population ( is the average number of individuals per node, and ) are randomly assigned on the network nodes, with the constraint . At first, we perform the movement process only, until the population distribution arrives at a steady state (see Appendix A, Figure A2 for a schematic of this simulation procedure). Then a fraction of individuals are randomly selected as the initial infected individuals, while the remaining ones are susceptible. At each time step, we perform the following procedures: (i) a node i is selected with probability , where , i.e., the summation of the rates of the infection, recovery, and movement event within node i, and . (ii) The next event is chosen from three possibilities according to the following rules: (a) recovery event (, ) with probability ; (b) infection event (, ) with probability ; and (c) movement event with probability . If the movement event is chosen, one neighboring node is selected randomly, say j, as the destination. With probability , one randomly selected individual at node i hops into node j; otherwise, nothing happens.
Time is updated as . Finally, steps (i) and (ii) are iterated until the dynamics arrive at a steady state (see Appendix A, Figure A3 for a schematic of this simulation procedure). Considering that many realistic networks have a heterogeneous degree distribution, we build the random uncorrelated scale-free networks, generated according to Ref. [23], as the substrate network of the metapopulation. For any system of finite population, the system will eventually enter the absorbing state where all individuals are susceptible due to finite-size fluctuations. Based on this fact, we allow the system to evolve up to and average the related quantities over the last 100 times as the results in a steady state in one realization. The results are averaged over 50 runs.
4. Results
According to the model’s assumptions, we use the continuous-time formulation developed in [17] to describe the dynamics at the single-node level,
The first term in each sub-equation of Equation (5) corresponds to the infection and recovery processes. The last two terms represent the movement process. The negative term counts the number of individuals leaving from node i, while the positive term is the sum of the flow of individuals arriving at node i from its neighbors.
Adding the two sub-equations in Equation (5), we obtain the rate equation for the evolution of the number of individuals at node i,
where we have used Equation (1). Summing the overall nodes in both sides of Equation (6), we obtain , which is consistent with the fact that the total number of individuals in the system is conserved. Note that when , for all i, Equation (6) is reduced to the standard diffusion equation [4,17]. The equilibrium solution of Equation (6) can be obtained by setting . Obviously, we can obtain
where the constant a is determined from the conservation condition, that is, is equal to the total number of individuals in the system. Substituting Equation (4) into Equation (7), we can obtain the number of individuals in the node of degree k at steady state, i.e., the asymptotic population distribution
where the constant a is also determined from the conservation condition . From Equation (8), we can obtain for the standard diffusion process (i.e., by setting ) [4,17]. When , we have for the case that the carrying capacity of each node is identical [14].
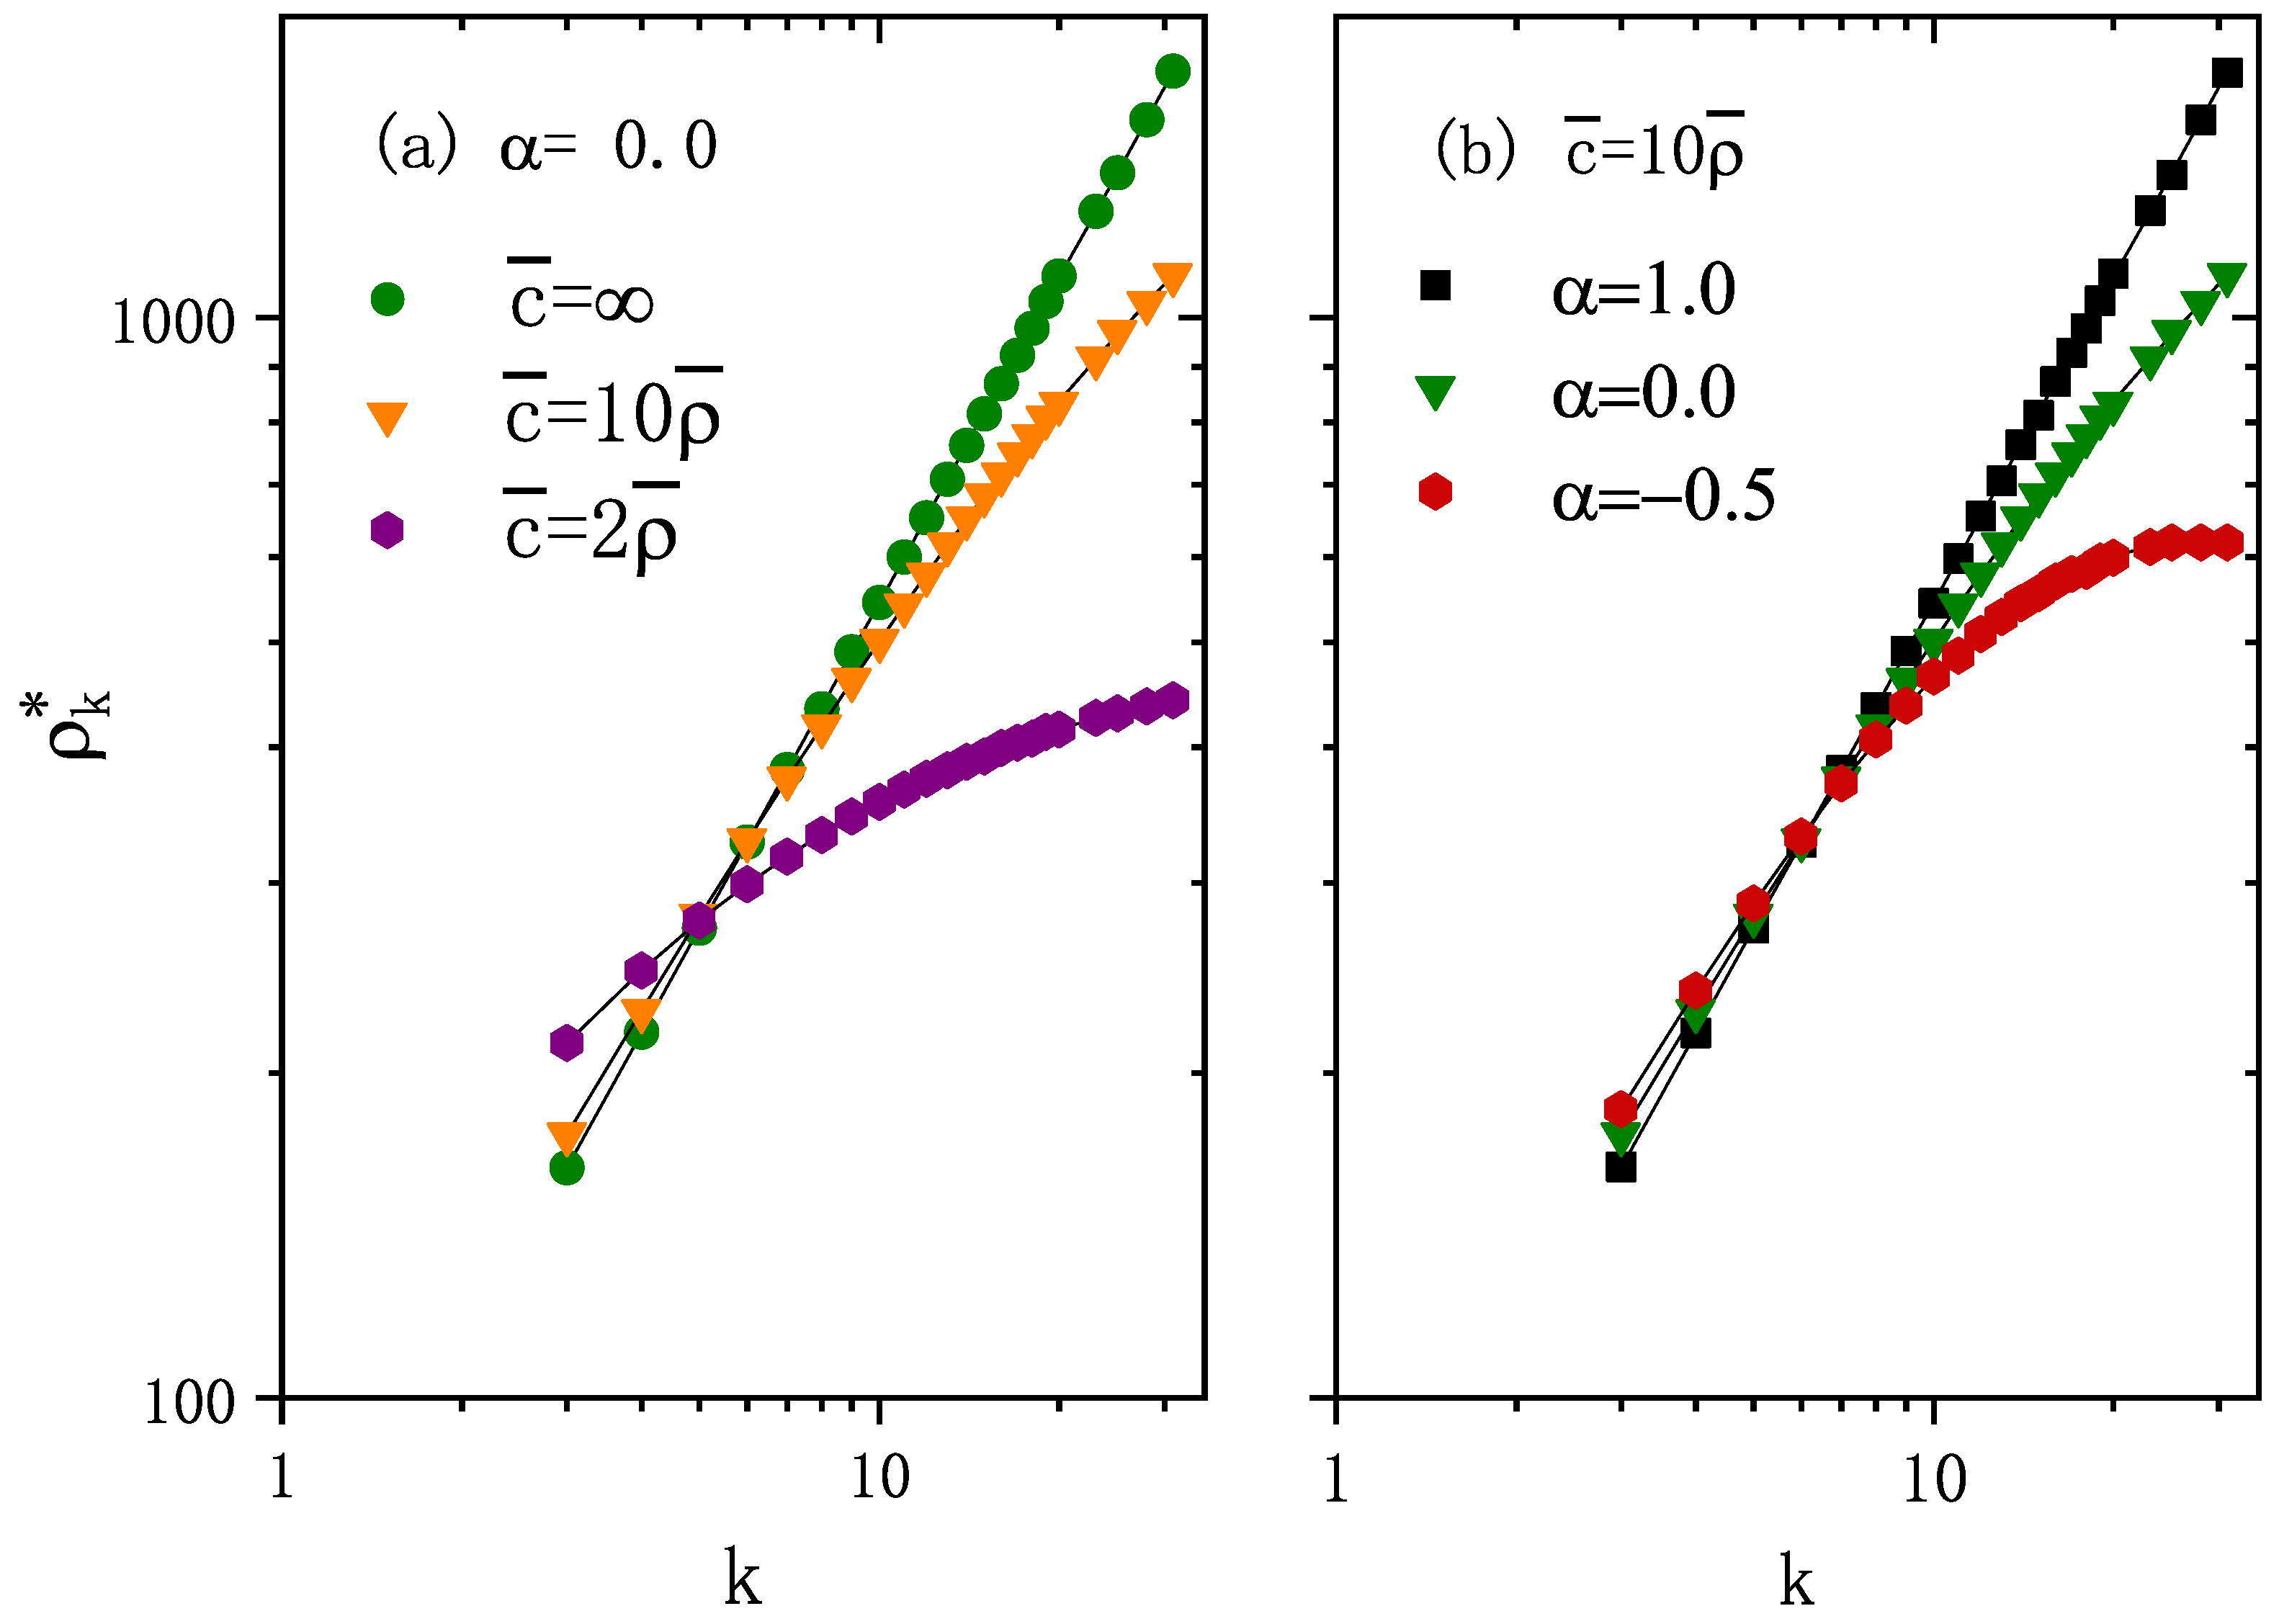
The theoretical results are compared to those obtained from numerical simulations, where the underlay network is generated by the uncorrelated configuration model [23] with degree distribution , minimum degree , maximum degree , and network size . As shown in Figure 1, the numerical solutions for stationary population distribution (obtained from Equation (8)) are in good agreement with the results of numerical simulations. Note that the stationary population distribution is independent of the infection dynamics and the diffusion rate d. The simulation data were obtained from the simulation algorithm of the movement process without considering the infection status of each individual (see Appendix A, Figure A2 for a schematic of this simulation procedure). We denote the macroscopic incidence (fraction of infected population) at steady state as , which is computed as the number of infected individuals after transient divided by the total number of individuals, i.e.,
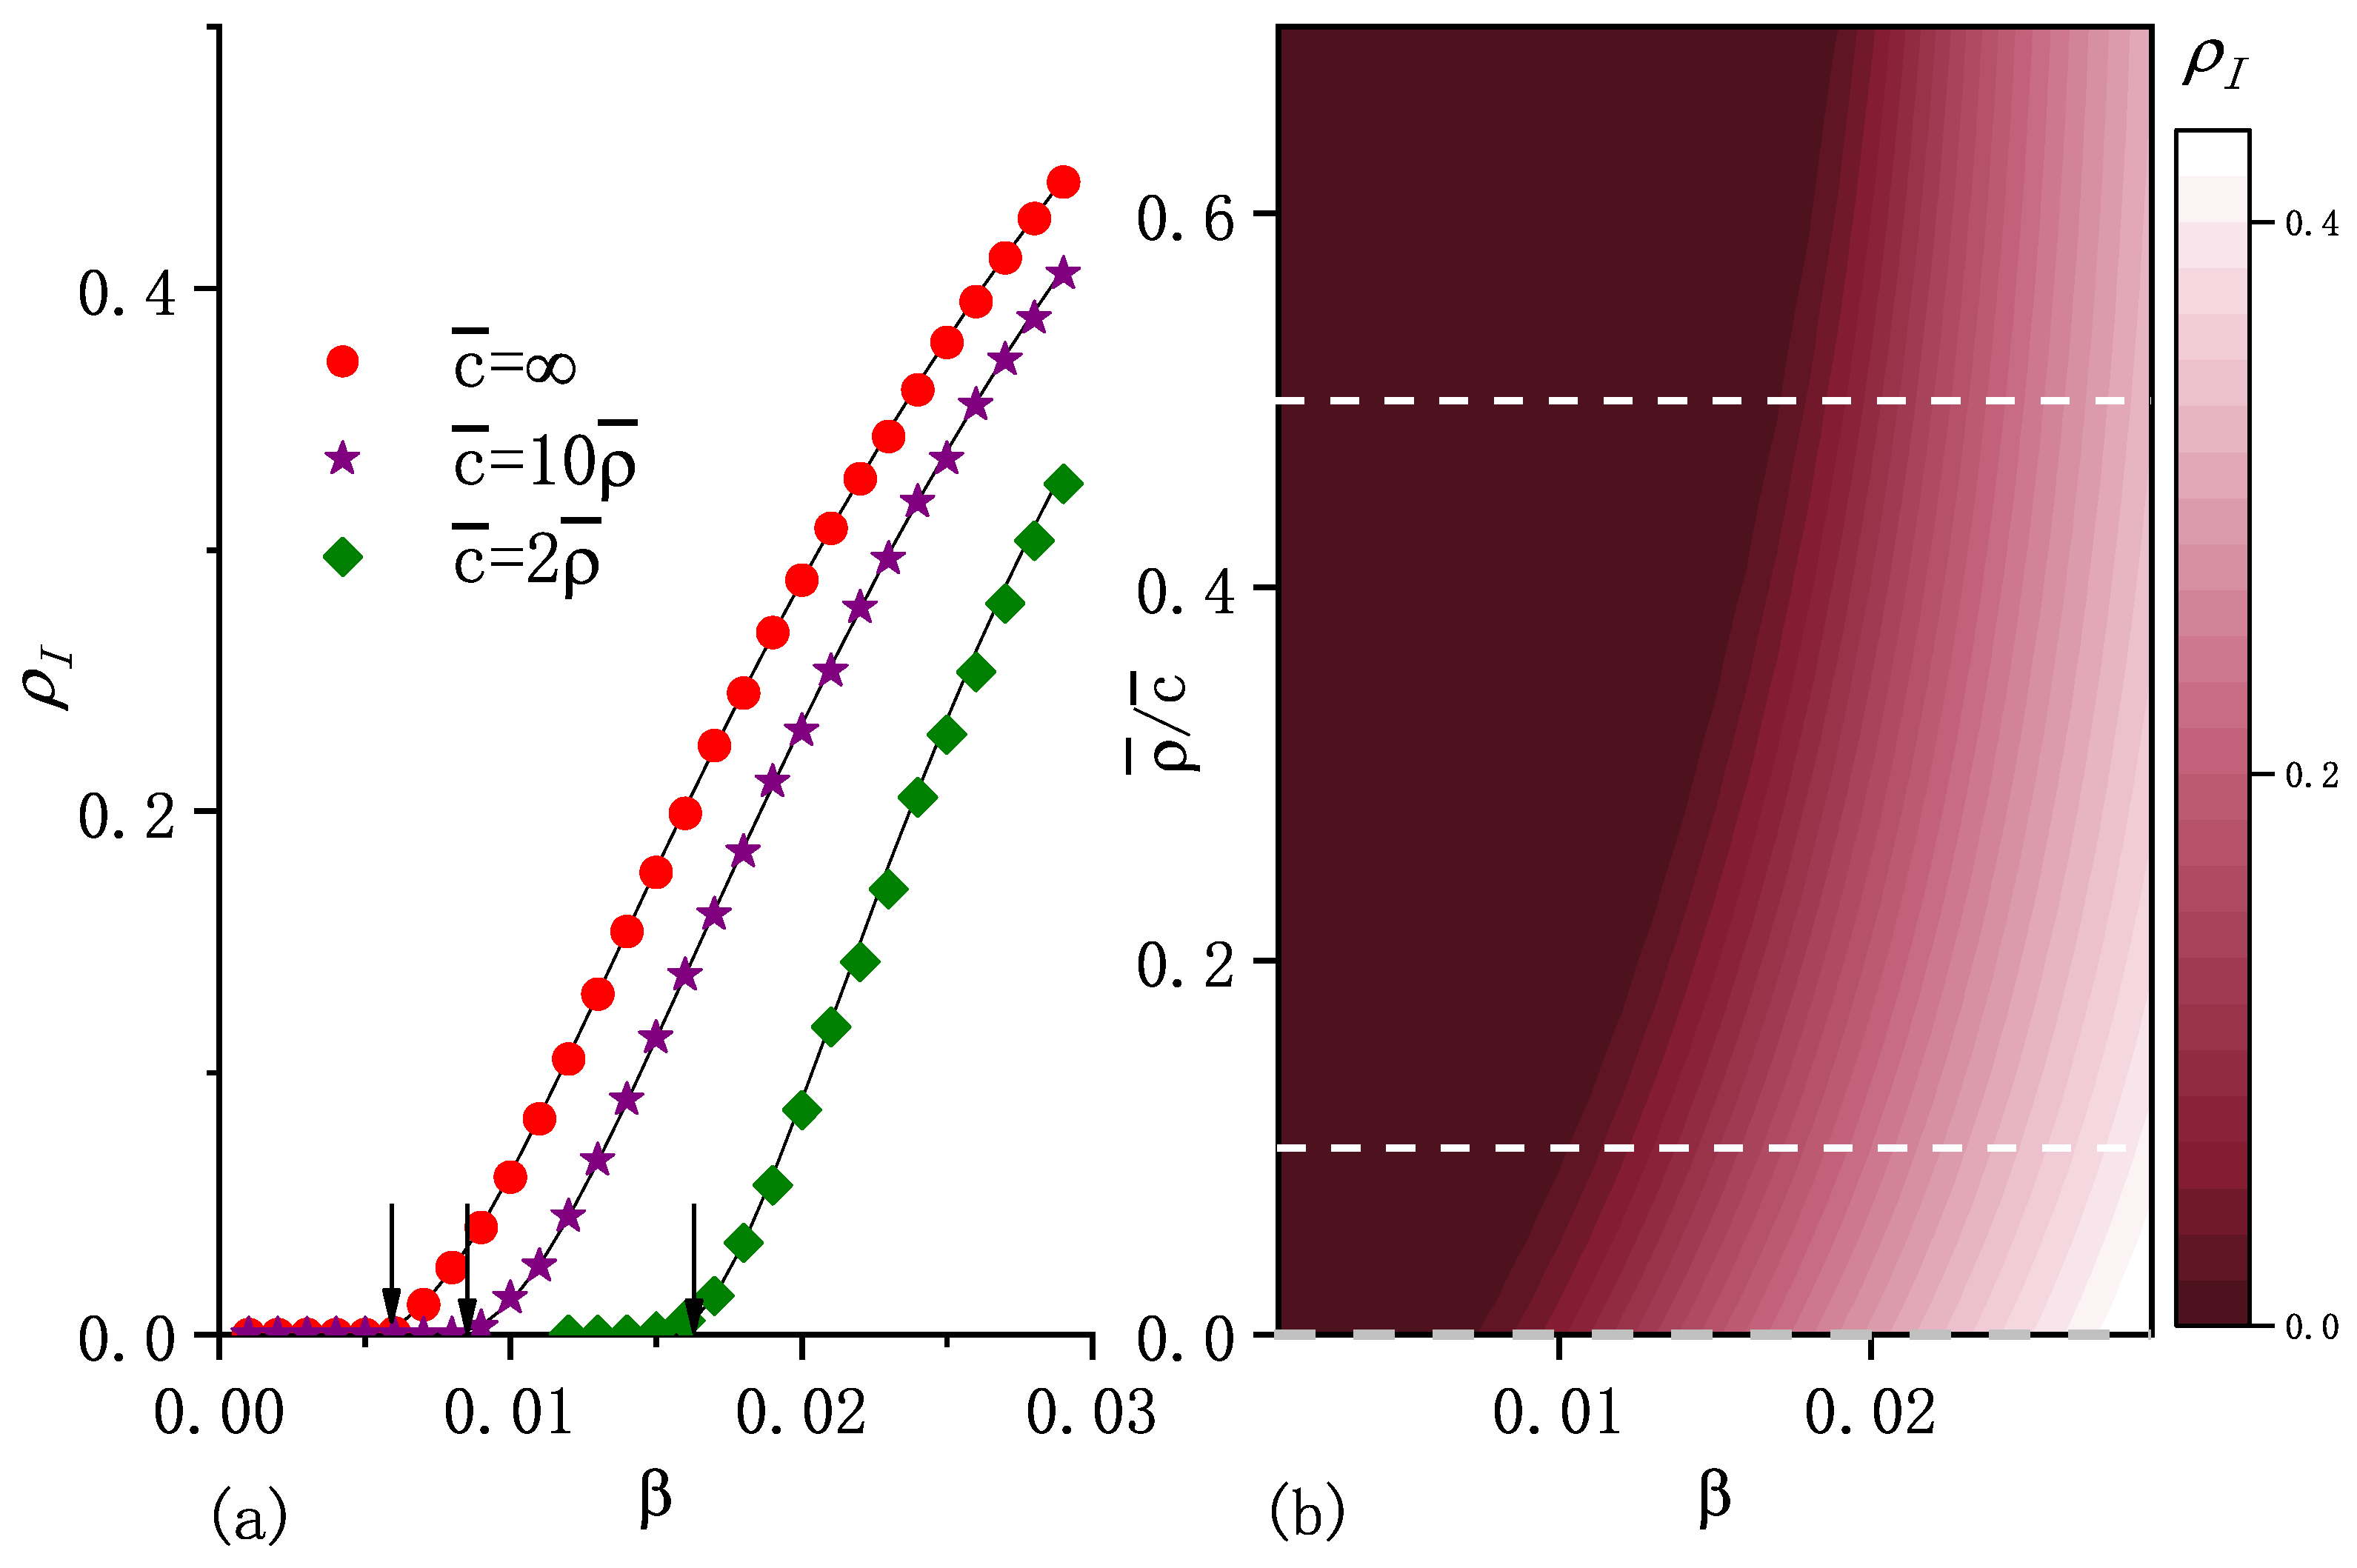
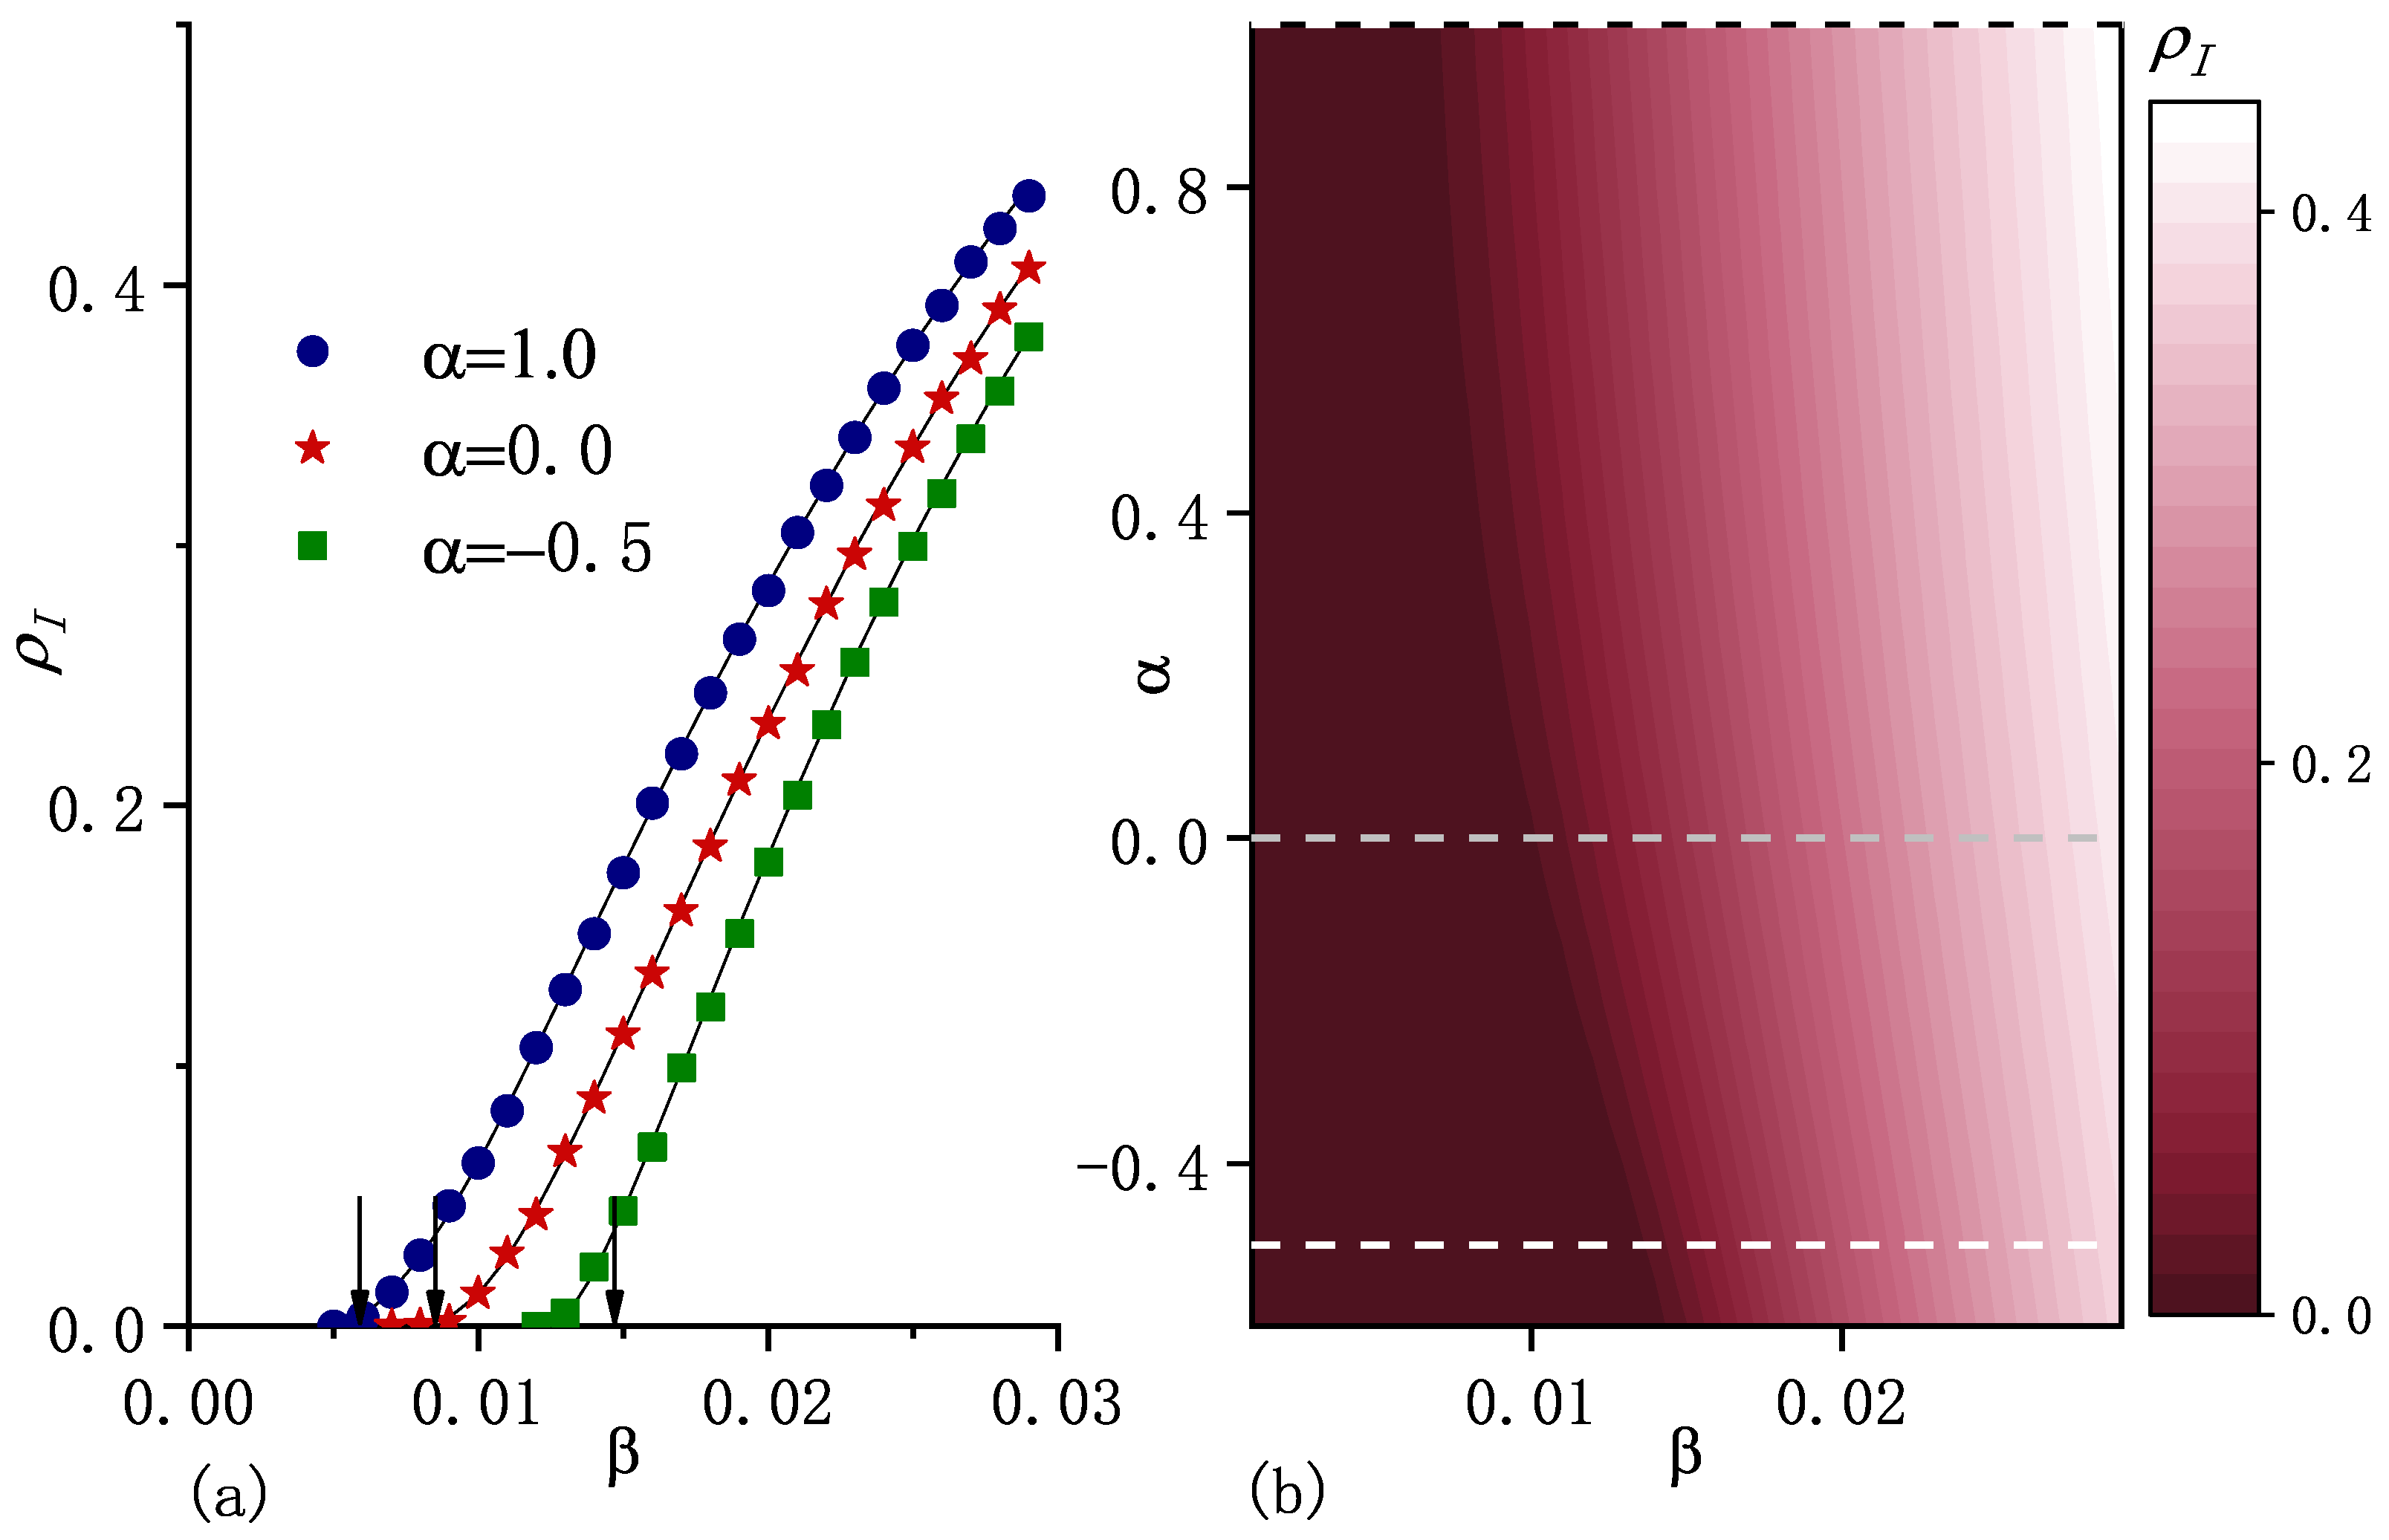
where is the number of infected individuals within node i at steady state. Figure 2a and Figure 3a show that the numerical solutions for macroscopic incidence , obtained from Equations (5) and (9), agree well with computer simulations.
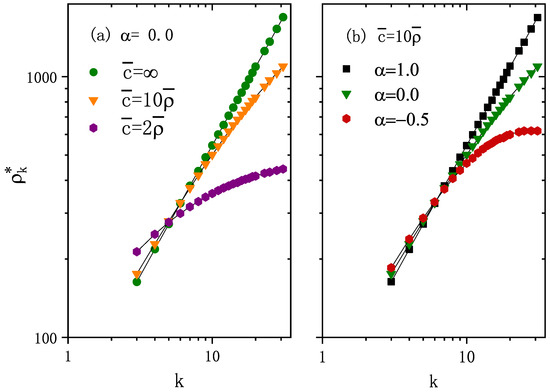
Figure 1.
The stationary number of individuals in each node with degree k in log–log scale. (a) and different values of average carrying capacity per node . Note that represents the standard diffusion case. (b) and different . The points correspond to the numerical simulation results and curves are the calculated results from Equation (8). The degree distribution , minimum degree , maximum degree , and network size are included. The average number of individuals per node . Note that the stationary population distribution is independent of the infection dynamics, and the diffusion rate is d.
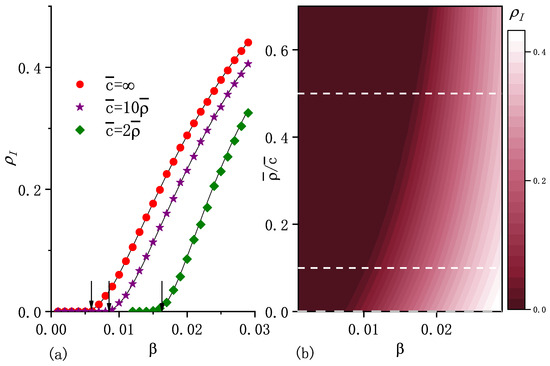
Figure 2.
(a) Macroscopic incidence in the steady state as a function of the infection rate for three values of . Note that represents the standard diffusion case. The points correspond to the numerical simulation results and curves stand for the numerical solutions of Equations (5) and (9). The arrows indicate the positions of critical infection rates , which are the calculated results from Equation (17). From the left to the right, the values of are , , and . (b) , obtained from the numerical solutions as a function of and . Dashed horizontal lines correspond to the selected values shown in (a). The initial fraction of the infected population , recovery rate , diffusion rate , and are included. Other parameters are the same as in the caption of Figure 1.
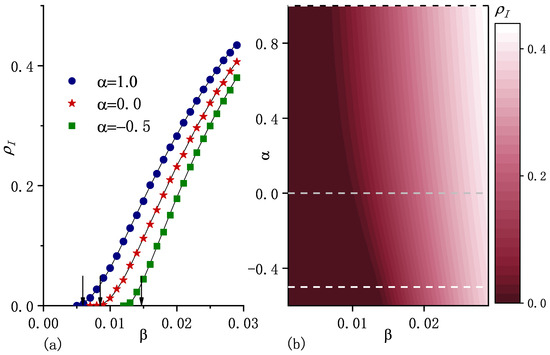
Figure 3.
(a) Macroscopic incidence in the steady state as a function of the infection rate for three values of . The points correspond to the numerical simulation results and curves stand for the numerical solutions of Equations (5) and (9). The arrows indicate the positions of critical infection rates , which are the calculated results from Equation (17). From the left to the right, the values of are , , and . (b) , obtained from the numerical solutions as a function of and . Dashed horizontal lines correspond to the selected values shown in (a). The initial fraction of the infected population , the recovery rate , the diffusion rate , and are included. Other parameters are the same as in the caption of Figure 1.
For the fixed carrying capacity exponent and average number of individuals per node , Figure 1a shows that is an increasing function of degree k for any value of . As increases, increases for high k values, whereas it decreases for lower k values. Thus, the increasing causes a larger range of values for ’s, that is, more heterogeneity in the distribution of individuals. Figure 2 shows that higher values of enhance epidemic spreading in terms of both a smaller epidemic threshold and larger macroscopic incidence.
For fixed average population per node and fixed , Figure 1b shows with different carrying capacity exponent . As increases, i.e., carrying capacity correlates more strongly with node degree, the asymptotic population distribution becomes more heterogeneous (see Figure 1b), which enhances epidemic spreading in terms of both smaller epidemic threshold and larger macroscopic incidence (as shown in Figure 3).
Next, we will analyze the sufficient condition that the disease-free equilibrium becomes unstable and investigate how the carrying capacity exponent affects the epidemic threshold. For the sake of analytical treatment described, we will assume statistical equivalence for nodes with the same degree. Under this heterogeneous mean-field approximation [1,24], we can introduce degree-block variables and represents the numbers of susceptible and infected individuals in the node of degree k, respectively, i.e.,
where is the set of nodes of degree k. We can split the sum with index j into two sums over and , i.e.,
The double sum over is related to the conditional probability that a node of given degree k has a neighbor which has degree . Furthermore, we restrict ourselves to the case of uncorrelated networks in which the conditional probability takes the simple form [1,24]. Thus, after some reformulation, Equation (5) simplifies to
To obtain the sufficient condition that the disease-free equilibrium becomes unstable, we use the analytical argument presented in [17,19,20]. The Jacobian matrix of Equation (12) at the disease-free equilibrium (i.e., and for all k) can be written in blocks as
where each block is an matrix, with being the number of degrees in the network, 0 as the null matrix, I as the identical matrix, and representing the diagonal matrix with diagonal element . It is notable that can be considered as an effective diffusion rate
stands for the matrix with elements
Obviously, is a rank-one matrix. The eigenvalues of are , with algebraic multiplicity and a simple eigenvalue , owing to the fact that the sum of the diagonal elements of is equal to 1. Thus, the characteristic polynomial of the upper diagonal block of the Jacobian matrix is , and its largest eigenvalue is equal to 0. The lower diagonal block of the Jacobian matrix has the form , which is perturbed by the rank-one matrix . According to the general interlacing theorem of eigenvalues for this type of matrix [25], its largest eigenvalue satisfies . The triangular structure of the Jacobian matrix means its spectrum is the union of the spectra of these two diagonal blocks. Finally, the largest eigenvalue of the Jacobian matrix is . Therefore, a sufficient condition for the disease-free equilibrium to be unstable is given by
For the standard diffusion scenario, the inequality reduces to , as reported in Refs. [17,19]. The left-hand side of this inequality can be approximately treated as a basic reproductive number at maximum-degree nodes. Note that we only consider the case that is an increasing function of k. Rewriting Equation (16), we obtain the sufficient condition of as
which indicates that if , the system certainly reaches an endemic state. As the arrows show in Figure 2a and Figure 3a, can be approximately considered as an epidemic threshold which separates the endemic state from the disease-free state. Note that it may be possible to have an endemic state if is less than . Equation (17) shows that is an increasing function of , which implies that diffusion suppresses epidemic spreading in the sense of an increase in the epidemic threshold. This is consistent with the result obtained for the standard diffusion scenario in [20].
In the thermodynamics limit (i.e., and is a finite fixed value), for networks with a bounded average degree and an unbounded largest degree , from Equation (8), we have
Combining Equations (17) and (18), we obtain
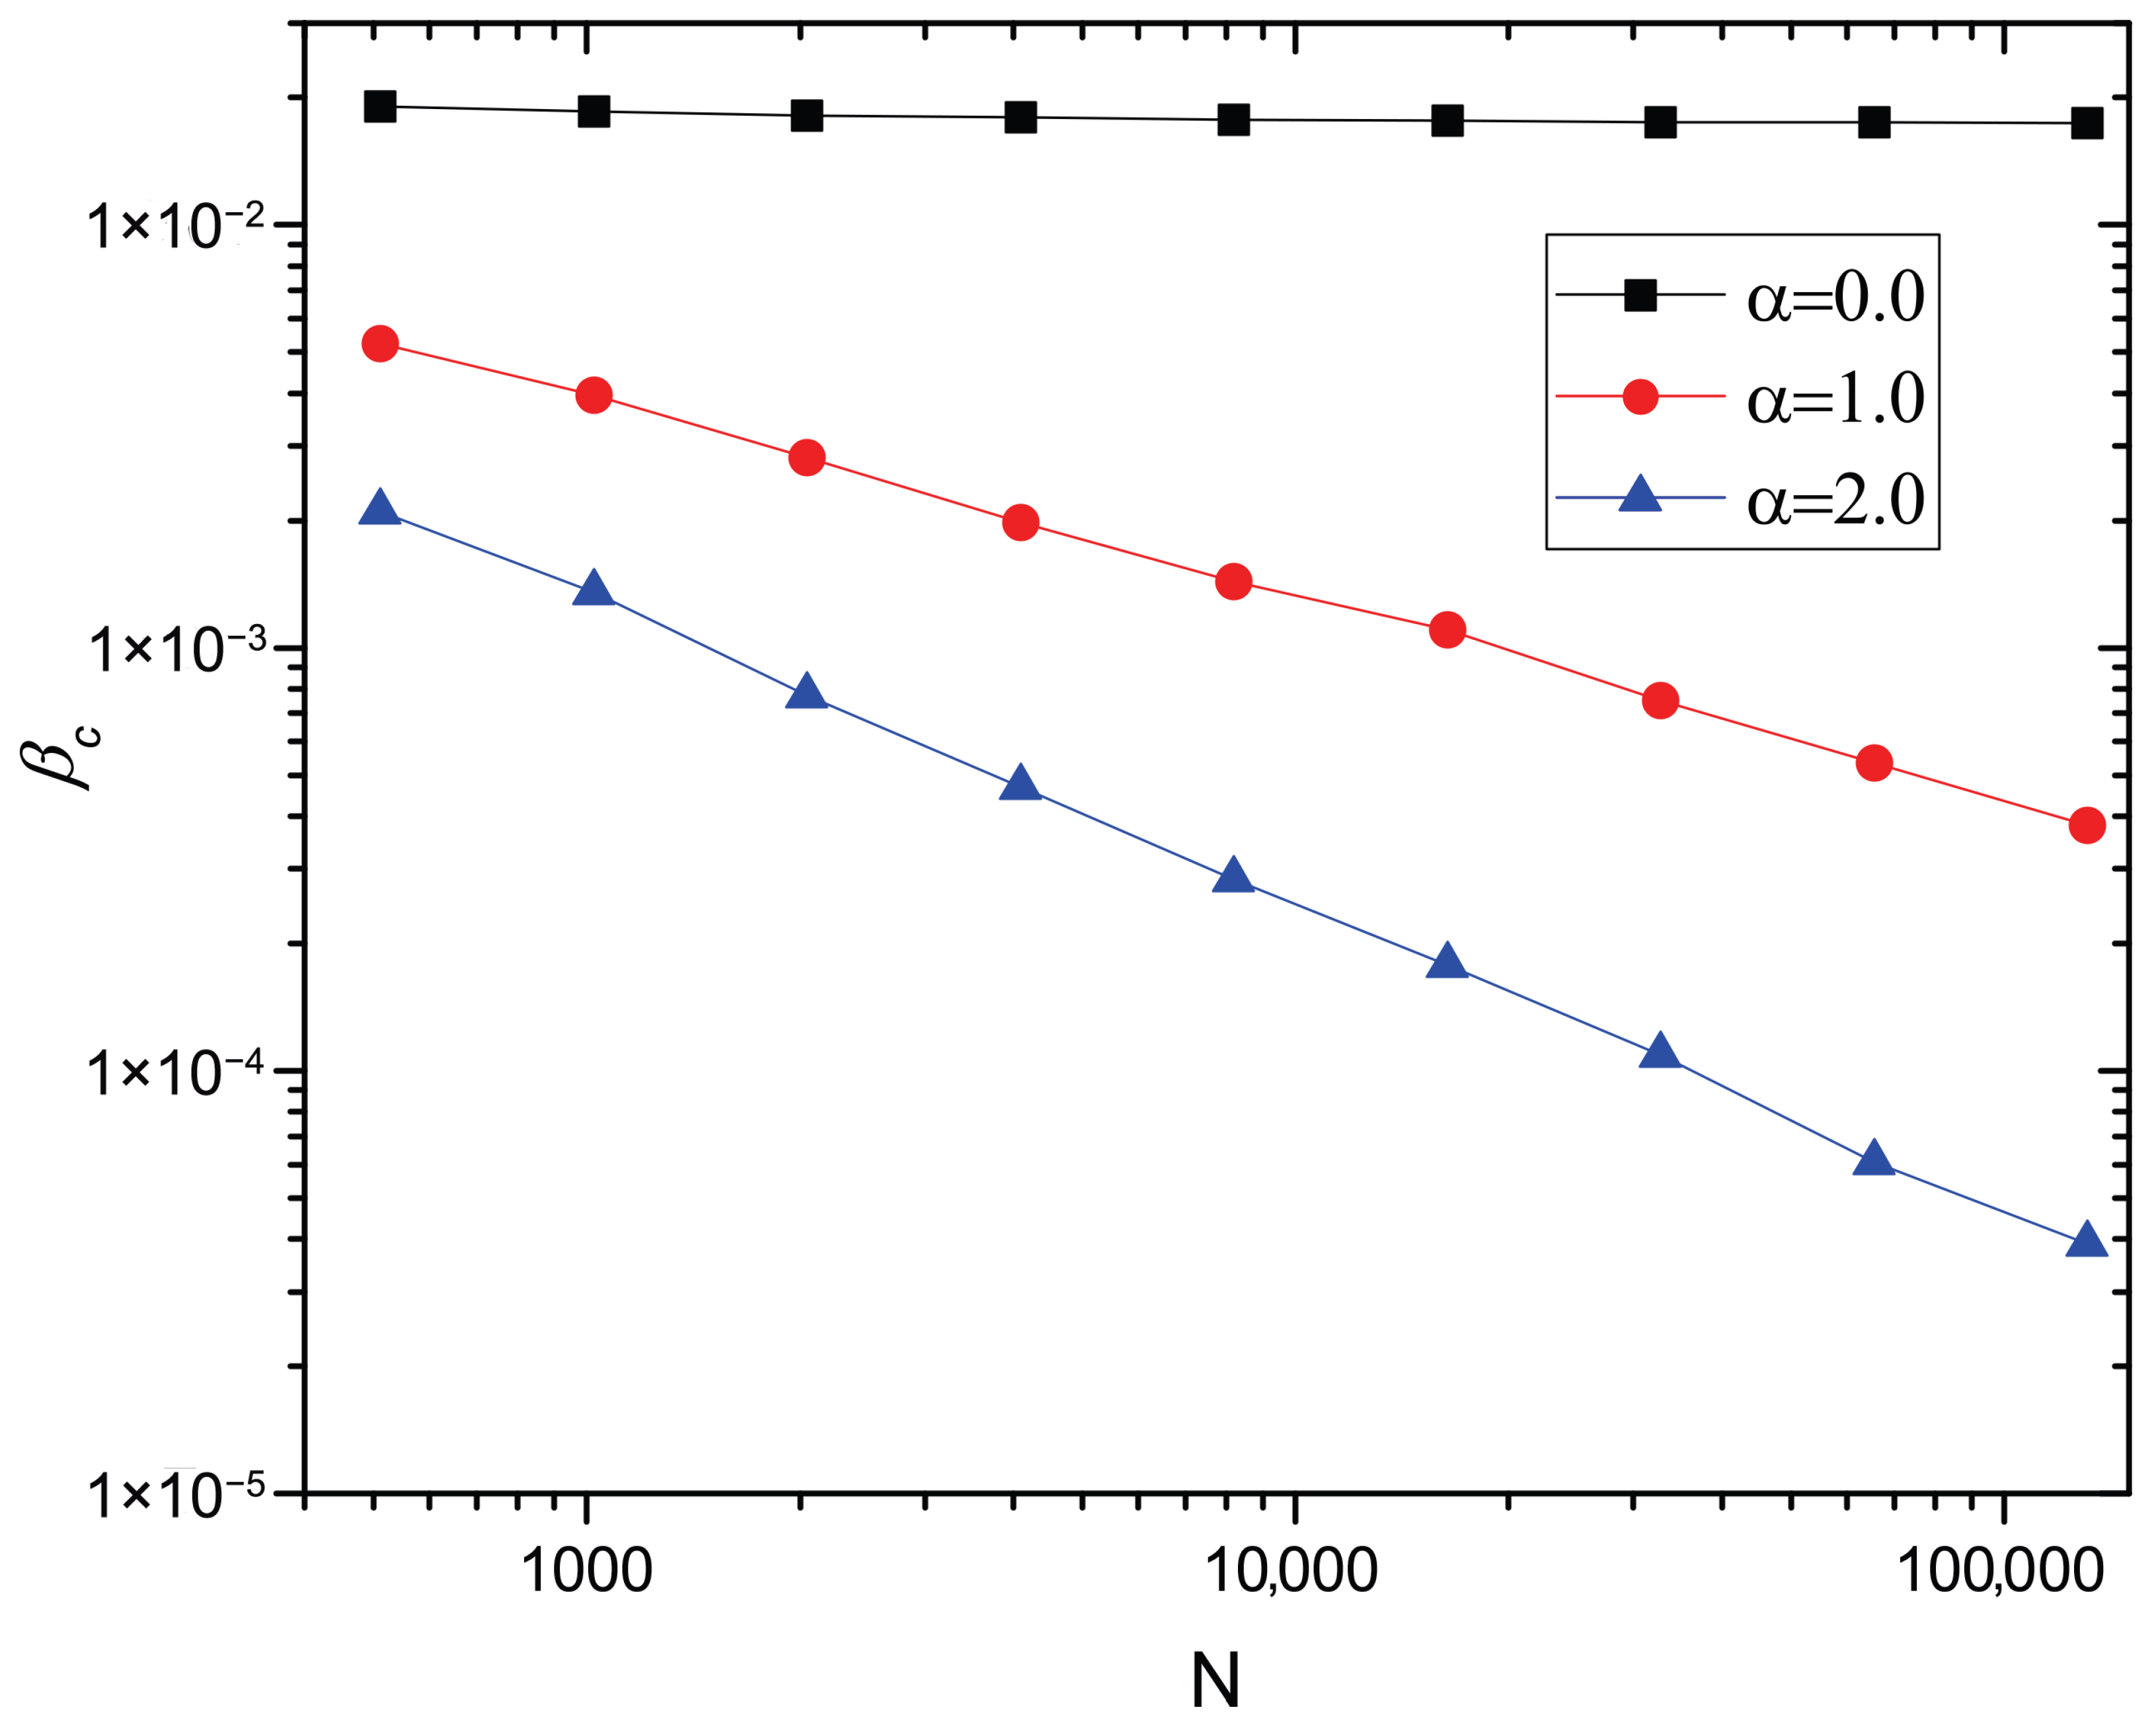
for a network with in the thermodynamics limit. Note that the lack of an epidemic threshold, i.e., , is also obtained for the standard diffusion scenario [17,19,20], while in the finite carrying capacity scenarios, the conditions for the lack of an epidemic threshold depend on the value of the carrying capacity exponent . When , the number of individuals at maximum-degree nodes is bounded (see Equation (18)), which results in the presence of a nonzero epidemic threshold. As shown in Figure 4, for , is almost unchanged as the network size N increases, which indicates the presence of a positive epidemic threshold in limit . On the other hand, when , is linear in , which indicates the absence of an epidemic threshold in limit .
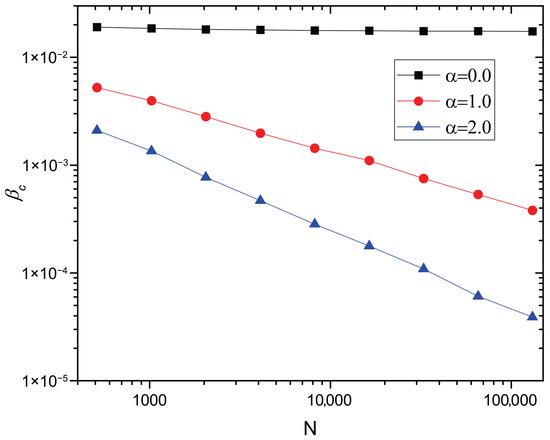
Figure 4.
versus N in log–log scale for . The points correspond to the numerical solutions of Equation (17). The degree distribution , minimum degree , and maximum degree are included. The average number of individuals per node , (), recovery rate , and diffusion rate are also included.
5. Conclusions
In summary, motivated by the fact that the mobility pattern of individuals in many real systems is usually affected by competition for available space or resources, we investigated an SIS metapopulation model with finite carrying capacity, where the mobility of individuals is modulated by the vacant space at the destination. Considering that many realistic networks have heterogeneous degree distribution, we have used random uncorrelated scale-free networks [23] as the substrate network of the metapopulation. To capture the heterogeneity in the carrying capacity [21], we have assumed that the carrying capacity scales as a power law of the node’s degree. The introduced exponent allows us to tune the correlation between the carrying capacity and node degree. We obtained both a higher value of the average carrying capacity per node and a higher value of the carrying capacity exponent , generating greater heterogeneity in the population distribution, which promotes the spread of a disease in terms of both a smaller epidemic threshold and larger stationary macroscopic incidence. We found that the value of determines whether a nonzero epidemic threshold exists or not in the limit of infinite network sizes with an unbounded maximum degree. Our study enriches the understanding of how the mobility patterns induced by finite carrying capacity influence the epidemic processes on metapopulation networks. To reduce the complexity of our model, we have not considered the demographic evolution, i.e., there are no natural birth and death processes. It would be interesting, in the future, to consider the scenario in which the finite carrying capacity can drive mobility and shape demographics simultaneously.
Funding
This research received no external funding.
Data Availability Statement
The original contributions presented in this study are included in the article. Further inquiries can be directed to the corresponding author.
Conflicts of Interest
The author declares no conflicts of interest.
Appendix A
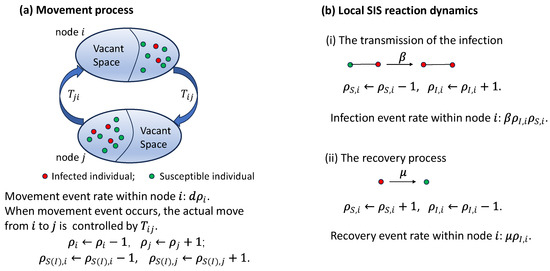
Figure A1.
Schematic of the studied model. (a) Movement process between two nodes of the network. Node i consists of individuals, namely as susceptible and as infected (). Each individual attemps to jump with the rate d. The actual jump can likely occur only if the destination node has vacant space. is the hopping probability from node i to j (see Equation (1)). (b) Local reaction dynamics contain two types of events, which are infection and recovery. In each pair, susceptible individuals becomes infected at rate . Within node i, a total of distinct pairs exist. Thus, the infection event rate within node i is . Each infected individual spontaneously becomes susceptible with recovery rate . Thus, the recovery event rate within node i is .
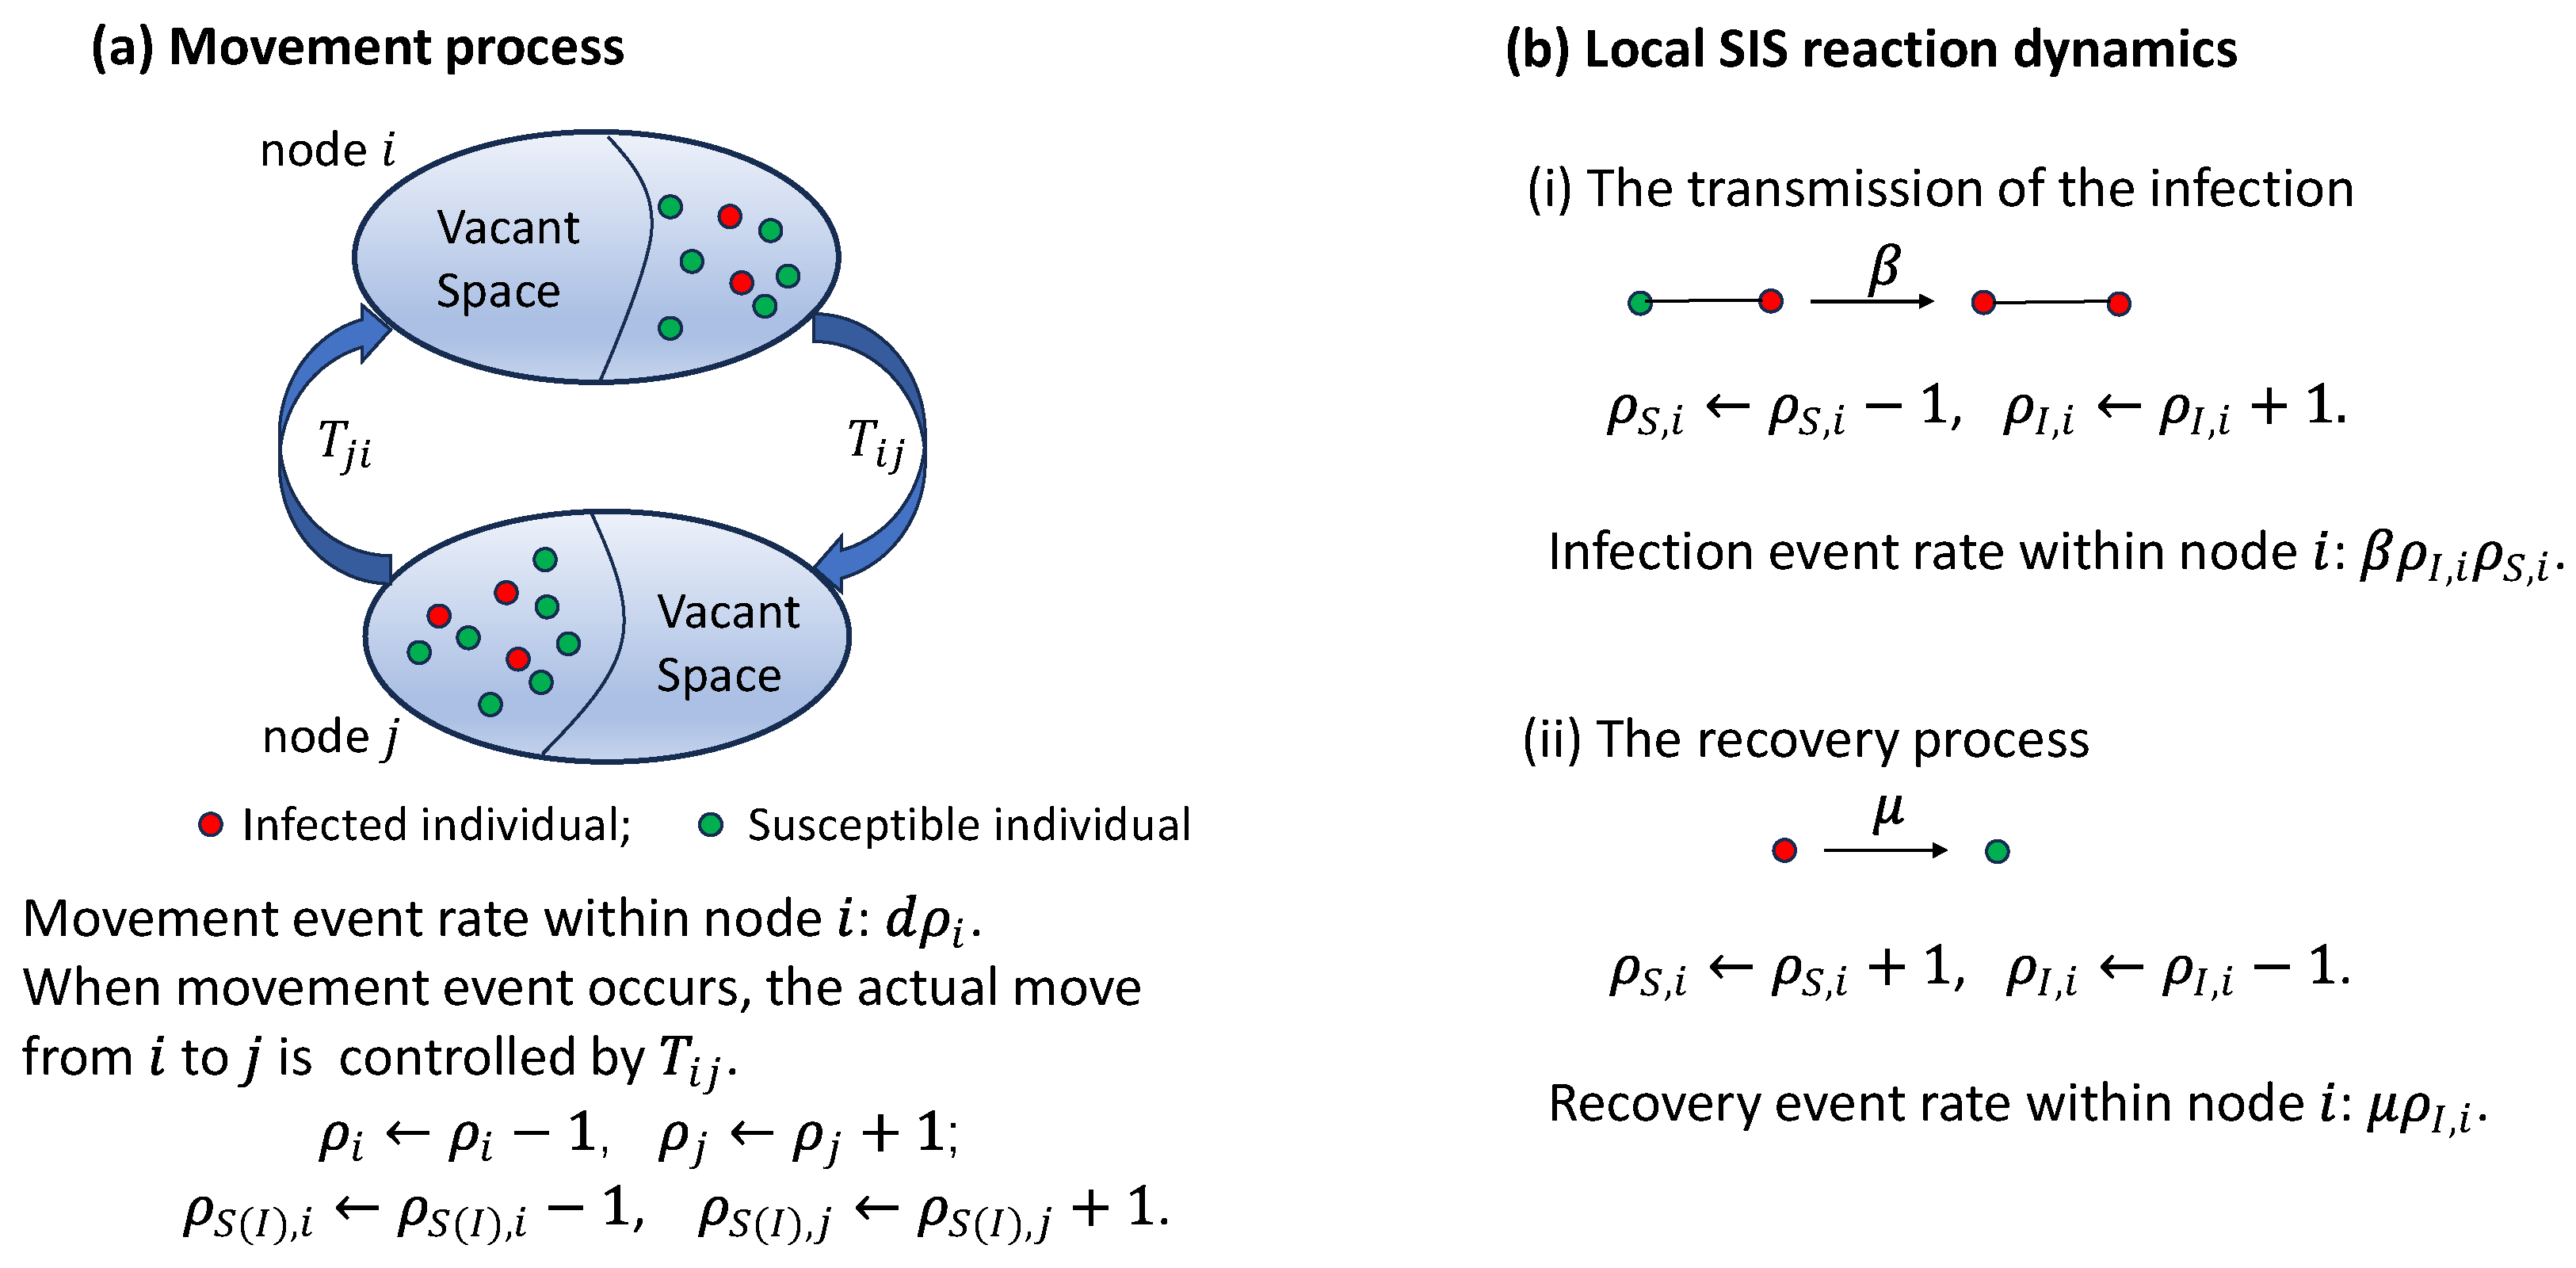
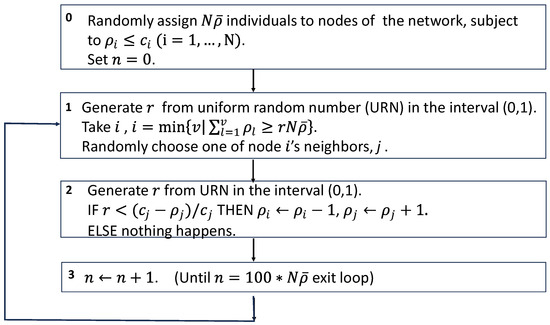
Figure A2.
Schematic of the simulation algorithm of the movement process without considering the infection status of each individual.
Figure A2.
Schematic of the simulation algorithm of the movement process without considering the infection status of each individual.
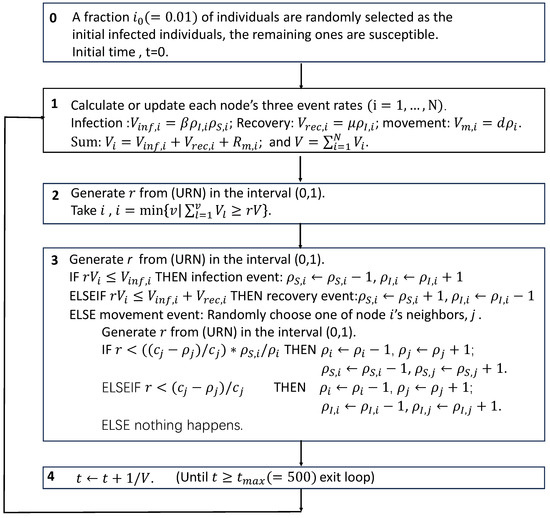
Figure A3.
Schematic of the simulation algorithm of the studied model.
Figure A3.
Schematic of the simulation algorithm of the studied model.
References
- Pastor-Satorras, R.; Castellano, C.; Van Mieghem, P.; Vespignani, A. Epidemic processes in complex networks. Rev. Mod. Phys. 2014, 87, 925. [Google Scholar] [CrossRef]
- Hufnagel, L.; Brockmann, D.; Geisel, T. Forecast and control of epidemics in a globalized world. Proc. Natl. Acad. Sci. USA 2004, 101, 15124. [Google Scholar] [CrossRef]
- Chinazzi, M.; Davis, J.T.; Ajelli, M.; Gioannini, C.; Litvinova, M.; Merler, S.; Piontti, A.P.Y.; Mu, K.; Rossi, L.; Sun, K.; et al. The effect of travel restrictions on the spread of the 2019 novel coronavirus (COVID-19) outbreak. Science 2020, 368, 395. [Google Scholar] [CrossRef] [PubMed]
- Colizza, V.; Vespignani, A. Invasion threshold in heterogeneous metapopulation networks. Phys. Rev. Lett. 2007, 99, 148701. [Google Scholar] [CrossRef] [PubMed]
- Colizza, V.; Vespignani, A. Epidemic modeling in metapopulation systems with heterogeneous coupling pattern: Theory and simulations. J. Theor. Biol. 2008, 251, 450–467. [Google Scholar] [CrossRef]
- Vespignani, A. Modelling dynamical process in complex socio-technical systems. Nat. Phys. 2012, 8, 32–39. [Google Scholar] [CrossRef]
- Balcan, D.; Vespignani, A. Phase transitions in contagion processes mediated by recurrent mobility patterns. Nat. Phys. 2011, 7, 581–586. [Google Scholar] [CrossRef]
- Balcan, D.; Vespignani, A. Invasion threshold in structured populations with recurrent mobility patterns. J. Theor. Biol. 2012, 293, 87–100. [Google Scholar] [CrossRef][Green Version]
- Belik, V.; Geisel, T.; Brockmann, D. Natural human mobility patterns and spatial spread of infectious diseases. Phys. Rev. X 2011, 1, 011001. [Google Scholar] [CrossRef]
- Belik, V.; Geisel, T.; Brockmann, D. Recurrent host mobility in spatial epidemics: Beyond reaction-diffusion. Eur. Phys. J. B 2011, 84, 579–587. [Google Scholar] [CrossRef]
- Soriano-Paños, D.; Lotero, L.; Arenas, A.; Gómez-Gardeñes, J. Spreading processes in multiplex metapopulations containing different mobility networks. Phys. Rev. X 2018, 8, 031039. [Google Scholar] [CrossRef]
- Meloni, S.; Perra, N.; Arenas, A.; Gómez, S.; Moreno, Y.; Vespignani, A. Modeling human mobility responses to the large-scale spreading of infectious diseases. Sci. Rep. 2011, 1, 62. [Google Scholar] [CrossRef]
- Ripoll, J.; Avinyó, A.; Pellicer, M.; Saldaña, J. Impact of density-dependent migration flows on epidemic outbreaks in heterogeneous metapopulations. Phys. Rev. E 2015, 92, 022809. [Google Scholar] [CrossRef] [PubMed]
- Asllani, M.; Carletti, T.; Di Patti, F.; Fanelli, D.; Piazza, F. Hopping in the crowd to unveil network topology. Phys. Rev. Lett. 2018, 120, 158301. [Google Scholar] [CrossRef] [PubMed]
- Carletti, T.; Asllani, M.; Fanelli, D.; Latora, V. Nonlinear walkers and efficient exploration of congested networks. Phys. Rev. Res. 2020, 2, 033012. [Google Scholar] [CrossRef]
- de Kemmeter, J.-F.; Carletti, T. Multigraph reconstruction via nonlinear random walk. J. Complex Netw. 2024, 12, cnae038. [Google Scholar] [CrossRef]
- Saldaña, J. Continuous-time formulation of reaction-diffusion processes on heterogeneous metapopulations. Phys. Rev. E 2008, 78, 012902. [Google Scholar] [CrossRef][Green Version]
- Siebert, B.A.; Gleeson, J.P.; Asllani, M. Nonlinear random walks optimize the trade-off between cost and prevention in epidemics lockdown measures: The ESIR model. Chaos Soliton Fract 2022, 161, 112322. [Google Scholar] [CrossRef]
- Juher, D.; Ripoll, J.; Saldaña, J. Analysis and Monte Carlo simulations of a model for the spread of infectious diseases in heterogeneous metapopulations. Phys. Rev. E 2009, 80, 041920. [Google Scholar] [CrossRef]
- Masuda, N. Effects of diffusion rates on epidemic spreads in metapopulation networks. New J. Phys. 2010, 12, 093009. [Google Scholar] [CrossRef]
- Iijima, H.; Ueno, M. Spatial heterogeneity in the carrying capacity of sika deer in Japan. J. Mammal. 2016, 97, 734. [Google Scholar] [CrossRef]
- Gillespie, D.T. A general method for numerically simulating the stochastic time evolution of coupled chemical reactions. J. Comput. Phys. 1976, 22, 403. [Google Scholar] [CrossRef]
- Catanzaro, M.; Boguñá, M.; Pastor-Satorras, R. Generation of uncorrelated random scale-free networks. Phys. Rev. E 2005, 71, 027103. [Google Scholar] [CrossRef] [PubMed]
- Dorogovtsev, S.N.; Goltsev, A.V.; Mendes, J.F.F. Critical phenomena in complex networks. Rev. Mod. Phys. 2008, 80, 1275. [Google Scholar] [CrossRef]
- Anderson, J. A secular equation for the eigenvalues of a diagonal matrix perturbation. Linear Algebra Appl. 1996, 246, 49. [Google Scholar] [CrossRef][Green Version]
Disclaimer/Publisher’s Note: The statements, opinions and data contained in all publications are solely those of the individual author(s) and contributor(s) and not of MDPI and/or the editor(s). MDPI and/or the editor(s) disclaim responsibility for any injury to people or property resulting from any ideas, methods, instructions or products referred to in the content. |
© 2025 by the author. Licensee MDPI, Basel, Switzerland. This article is an open access article distributed under the terms and conditions of the Creative Commons Attribution (CC BY) license (https://creativecommons.org/licenses/by/4.0/).

