Article

A Feature Engineering Framework for Smart Meter Group Failure Rate Prediction

School of Electrical and Electronic Engineering, Huazhong University of Science and Technology, Wuhan 430074, China
*
Author to whom correspondence should be addressed.
Mathematics 2025, 13(15), 2472; https://doi.org/10.3390/math13152472
Submission received: 14 June 2025 / Revised: 27 July 2025 / Accepted: 30 July 2025 / Published: 31 July 2025
(This article belongs to the Special Issue Evolutionary Algorithms and Applications)

Abstract

Smart meters play a significant role in power systems, but their condition assessment faces challenges such as inconsistent evaluation criteria and inaccurate assessment results. This paper proposes feature engineering including feature construction and feature selection for smart meter group failure rate prediction. First, the basic structure and common fault types of smart meters are introduced. Smart meters are grouped by batch and distribution area. Next, 25 condition features are constructed based on failure mechanisms and technical specifications. Then, an evolutionary multi-objective feature selection algorithm combining NSGA-II, Jaccard similarity, and XGBoost is developed, where feature subsets are encoded as binary individuals optimized for three objectives: MSE, 1 − R2, and the number of features. The experimental results demonstrate that the proposed method not only reduces the number of features (25→7) but also improves the prediction accuracy (MSE: 0.0049 → 0.0042, R2: 0.6638 → 0.7228) of smart meter group failure rates. Comparative studies with other feature selection methods further confirm the superiority of our approach. The optimized features enhance interpretability and computational efficiency, providing a practical solution for large-scale smart meter condition assessment in power systems.

1. Introduction

1.1. Condition Assessment for Smart Meters

Smart meters are the core sensing terminals in smart grids. They play a pivotal role in power systems [1]. By integrating real-time monitoring, data acquisition, and remote control capabilities, they not only enable efficient recording and transmission of consumer electricity consumption data [2,3] but also support the implementation of dynamic pricing mechanisms. These functionalities effectively guide users to optimize their electricity usage patterns, mitigate peak-valley load disparities, and enhance the operational reliability of power systems [4,5,6,7]. However, with the widespread deployment of smart meters, the inefficiencies and resource wastage inherent in traditional maintenance strategies have become increasingly apparent. This underscores the urgent need to establish a scientific condition assessment framework to serve as the decision-making foundation for precision management.
The construction of condition assessment features critically determines evaluation outcomes. Current literature on smart meter condition assessment predominantly relies on either subjective experience or purely data-driven approaches for feature selection, exhibiting deficiencies in comprehensiveness and scientific rigor. Xie and Luo proposed four indicator categories (error stability, operational reliability, potential risks, and other factors) extracted from metering production dispatch platforms, marketing business systems, and electricity information collection systems, while neglecting the impact of operating conditions [8,9]. Liu selected indicators based on operational status, configuration methods, and working conditions but failed to incorporate influences from production [10]. Cai, Cai, Ma, and Ye established evaluation indicators including metering anomalies, all events, meter overload rates, and clock battery abnormalities. While these studies focused on operational anomaly detection, they similarly failed to account for influences of production [11,12,13,14]. Li developed condition assessment indicators by integrating basic information, operational status, and field test data [15]. Ying, Cheng, and Chen proposed the most comprehensive indicator system, covering all lifecycle stages as well as operating conditions [16,17,18].
In summary, current condition assessment features for smart meters inadequately incorporate both failure mechanisms and domain expertise, while exhibiting feature redundancy. Therefore, a systematic feature reconstruction followed by rigorous feature selection is therefore imperative.

1.2. Multi-Objective Evolutionary Feature Selection

Feature selection is a crucial step in machine learning and data mining, aiming to select the most relevant and discriminative feature subset from the original feature set to improve model performance, reduce computational complexity, and enhance interpretability [19,20,21,22]. It can be classified into three categories: wrapper-based, filter-based, and embedded [23]. In many cases, feature selection needs to consider multiple objectives simultaneously, including model performance (e.g., F1-score or MSE) and the number of features. Therefore, feature selection can be regarded as a multi-objective optimization problem.
A multi-objective optimization problem can be defined as follows [24]:
min F x = { f 1 x , f 2 x , , f M x } ,   x   ϵ   Ω
where x is a solution of the search space Ω, fj is the jth objective, j = 1, 2,…, M. If M is 2 or 3, the problem is called a multi-objective optimization problem. If M > 3, it is called a many-objective optimization problem.
For multi-objective optimization problems, evolutionary algorithms are an effective solution [25,26,27]. Evolutionary algorithms are a class of optimization methods inspired by Darwin’s theory of natural selection. They efficiently search for global or near-optimal solutions in the solution space by simulating the mechanisms of selection, recombination, and mutation in biological evolution. The core process includes initializing a random population, evaluating individual quality based on objective function values, selection, crossover (generating new individuals through genetic recombination, such as single-point crossover or simulated binary crossover), and mutation (introducing random perturbations to maintain diversity), until convergence criteria are met [28,29,30,31]. The advantages of evolutionary algorithms lie in their ability to handle complex optimization problems involving high dimensions, nonlinearity, and multimodality without requiring gradient information, while naturally supporting parallel computation.
In multi-objective optimization problems, evolutionary algorithms extend the single-objective framework by incorporating Pareto dominance relations and non-dominated sorting mechanisms, enabling the simultaneous optimization of multiple conflicting objectives and generating a set of balanced solutions (Pareto front) [32,33,34,35].
Numerous multi-objective evolutionary algorithms have been applied to feature selection, such as NSGA-II, NSGA-III, MOEA/D, and SPEA2. NSGA-II employs fast non-dominated sorting and crowding distance mechanisms, demonstrating high computational efficiency for two–three objective problems. However, its selection pressure diminishes in high-dimensional objective spaces (M > 3), requiring additional constraint handling design, and its solution distribution uniformity depends on crowding distance accuracy [36]. NSGA-III effectively maintains solution distribution in high-dimensional spaces (M ≤ 15) through reference point strategies, supporting constrained and preference-based multi-objective optimization, yet it exhibits sensitivity to reference point configuration, incurs 30–50% higher computational overhead than NSGA-II, and demands complex parameter tuning [37]. MOEA/D decomposes multi-objective problems into single-objective subproblems with strong mathematical foundations and parallel computing support, but its solution distribution heavily relies on weight vector design, shows poor dynamic environment adaptability, and requires domain expertise for weight adjustment [38,39]. SPEA2 utilizes external archives and k-nearest neighbor density estimation with strong elitism preservation, though its higher computational complexity limits efficiency for large-scale problems [40].
These multi-objective evolutionary algorithms are particularly effective for optimizing problems with more than three conflicting objectives, generating well-distributed and representative Pareto fronts. During optimization, these methods incorporate advanced population-based strategies such as Pareto dominance relationships and crowding distance estimation. These mechanisms work synergistically to produce optimal, non-dominated solution sets.
The current smart meter state evaluation technologies take individual meters as the research object, and have problems with unscientific and redundant condition features. To address these challenges, this study proposes novel feature engineering, including feature construction that embeds physical mechanisms with expert knowledge, while integrating multi-objective evolutionary feature selection. The main contributions include the following:
(1) Grouping of smart meters by production batches and transformer areas to mitigate the impact of inaccurate fault classification, with group failure rate used as the label for analysis.
(2) Feature construction: The establishment of a dual-driven analytical approach combining physical mechanisms and expert knowledge. Fault tree analysis is employed to identify sensitive parameters of typical failures, while test-failure mapping relationships are extracted from technical specifications to construct a scientifically validated and engineering-interpretable feature set.
(3) Feature selection: The NSGA-II algorithm is employed to generate individuals while controlling population diversity through Jaccard similarity, screening feature subsets to train an XGBoost model. The XGBoost model takes the selected features as input and outputs the failure rate prediction for smart meter groups. With MSE, 1 − R2, and the number of features as optimization objectives, Pareto-optimal feature subsets are obtained to achieve the optimal balance between prediction performance and feature compactness.
The proposed algorithm ultimately reduces the feature set from 25 to 7 while achieving improved model performance (MSE: 0.0049 → 0.0042, R2: 0.6638 → 0.7228). Comparative analysis with other feature selection methods further demonstrates the superiority of the proposed approach.

2. Materials and Methods

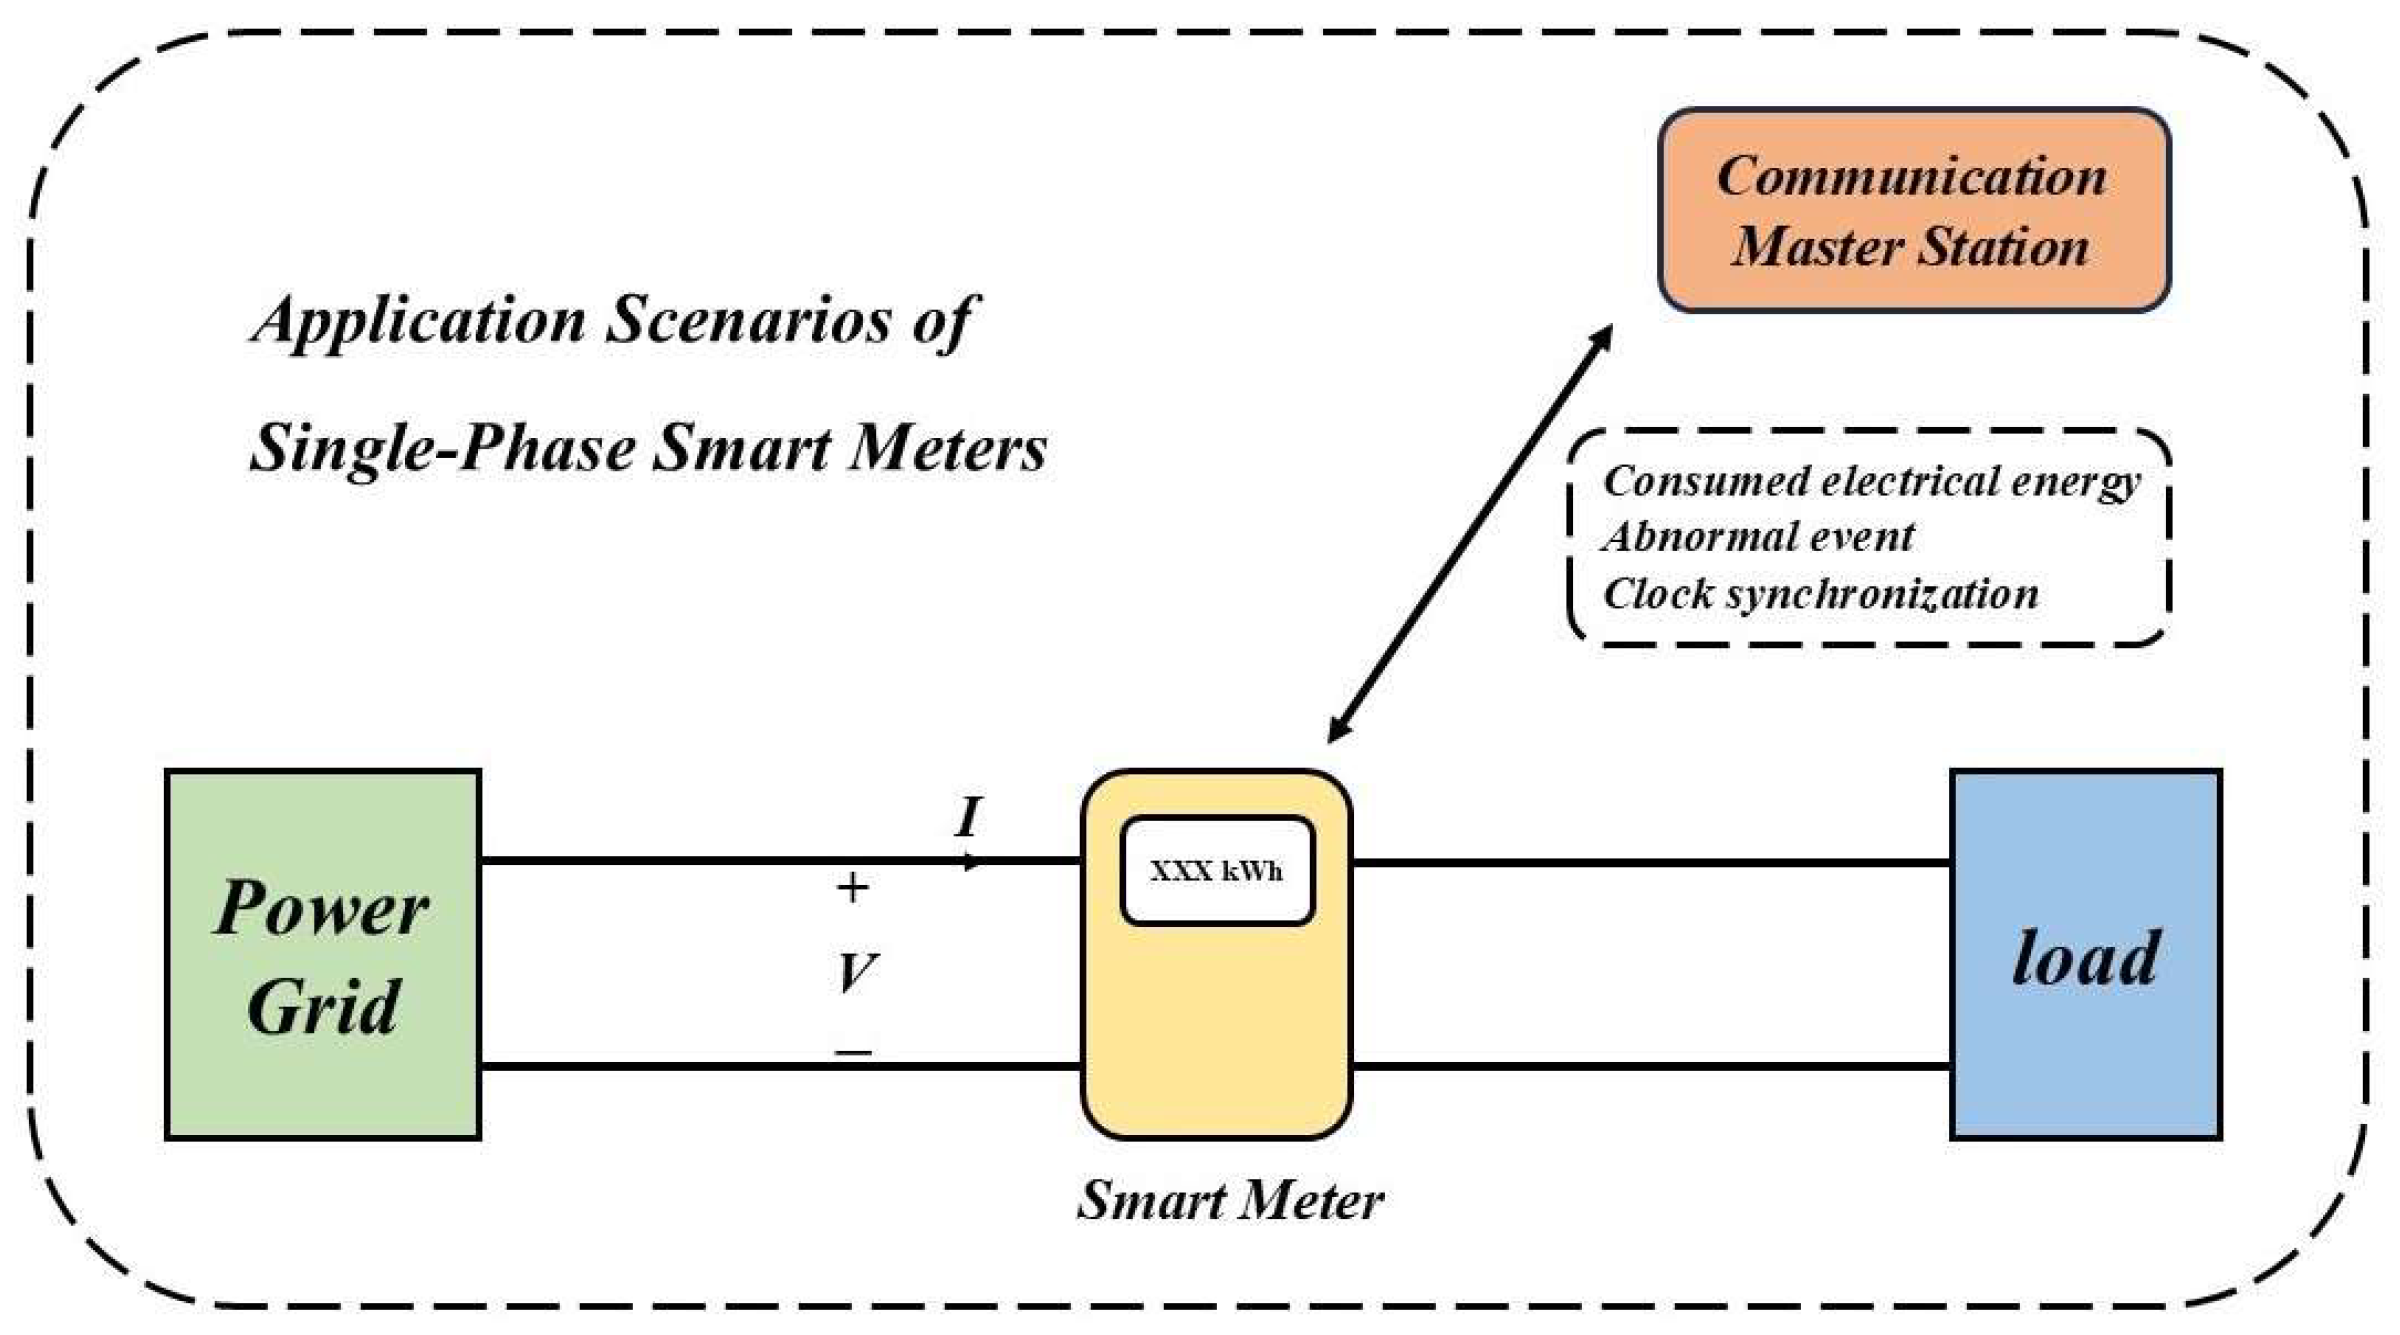
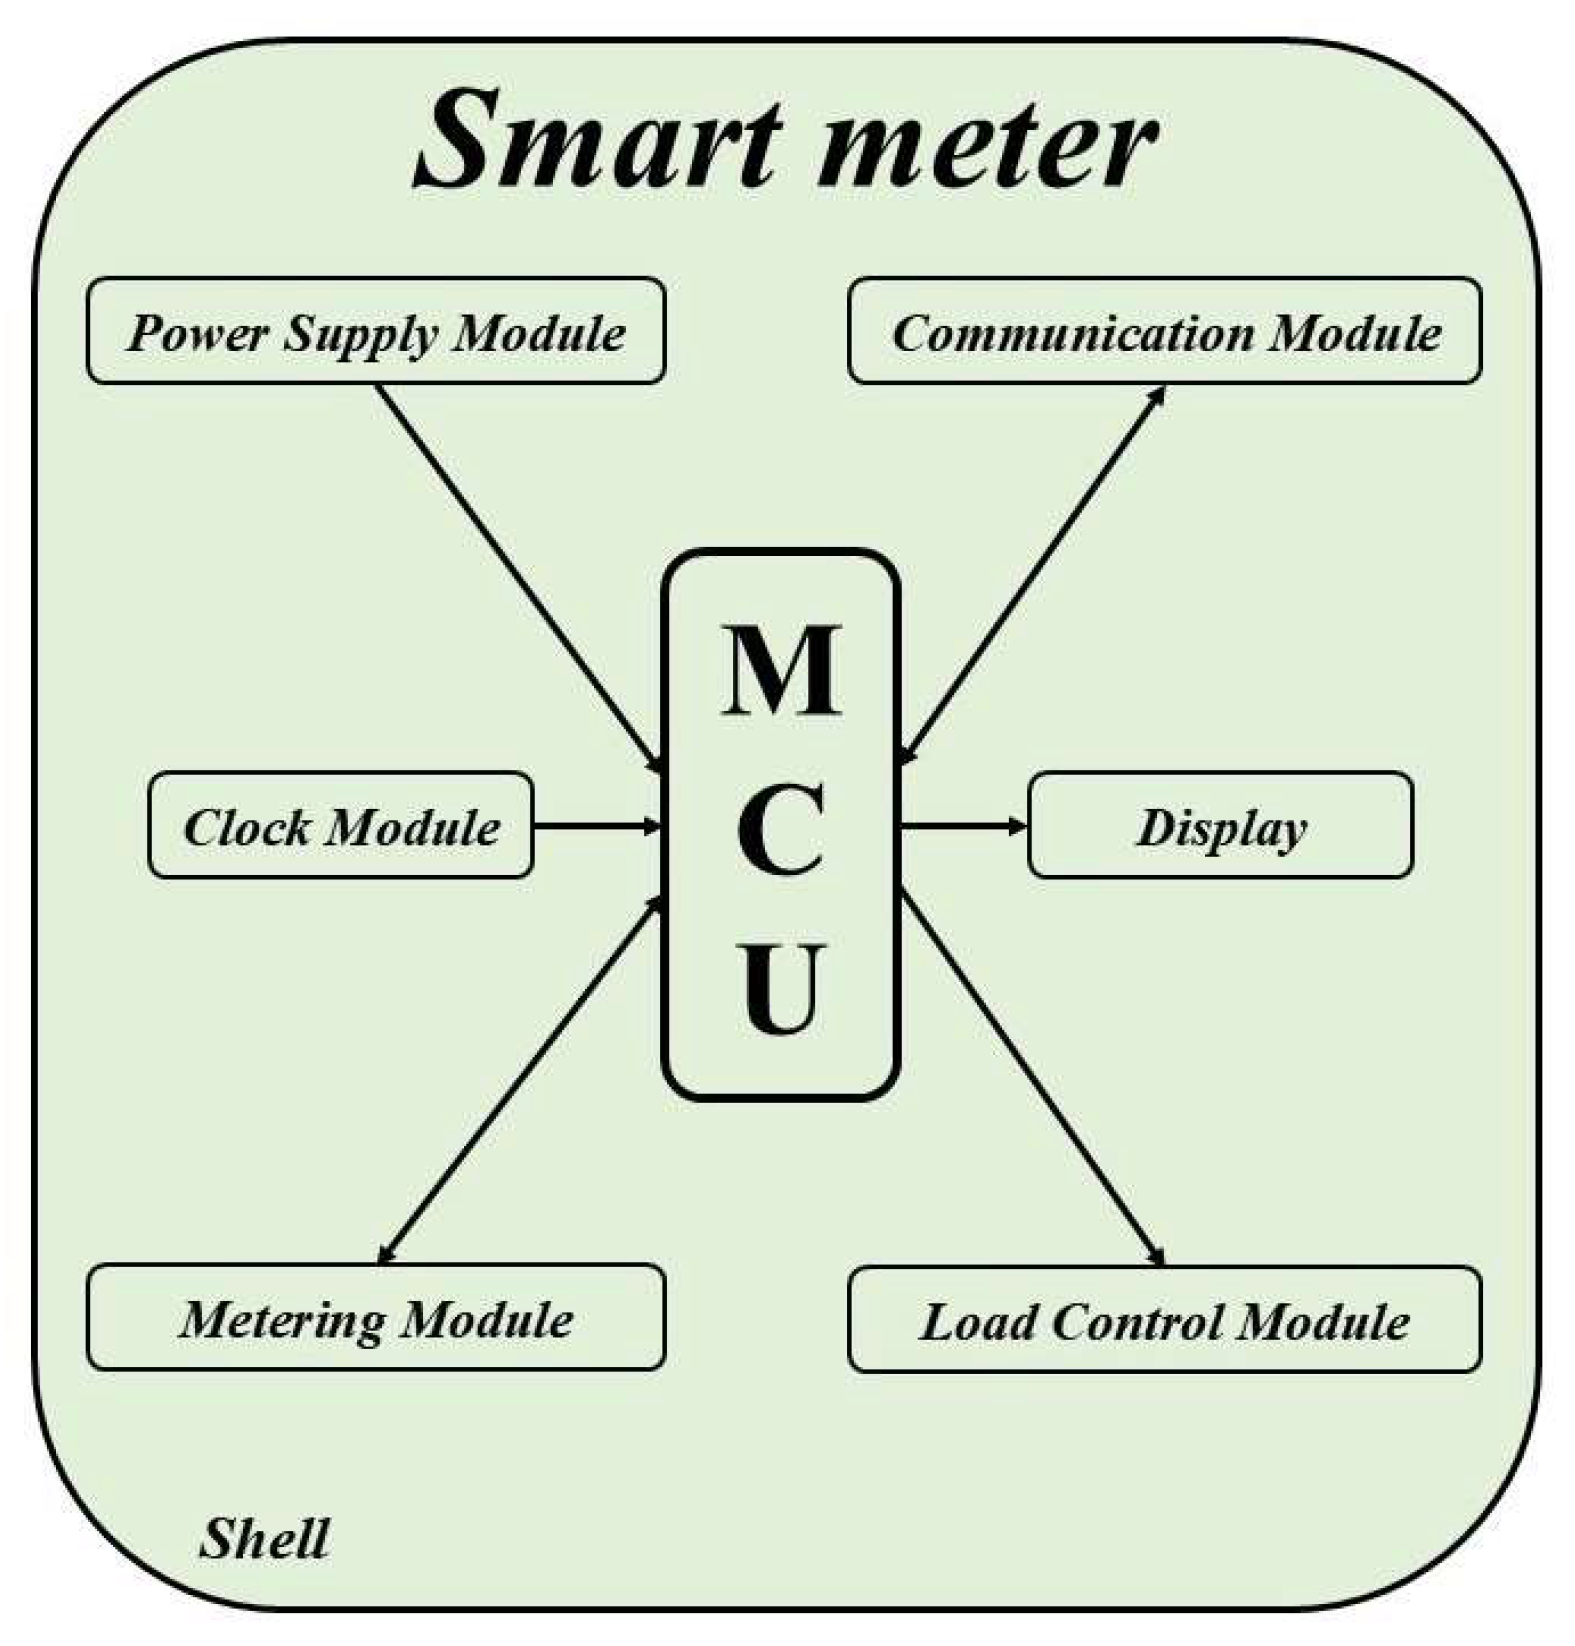
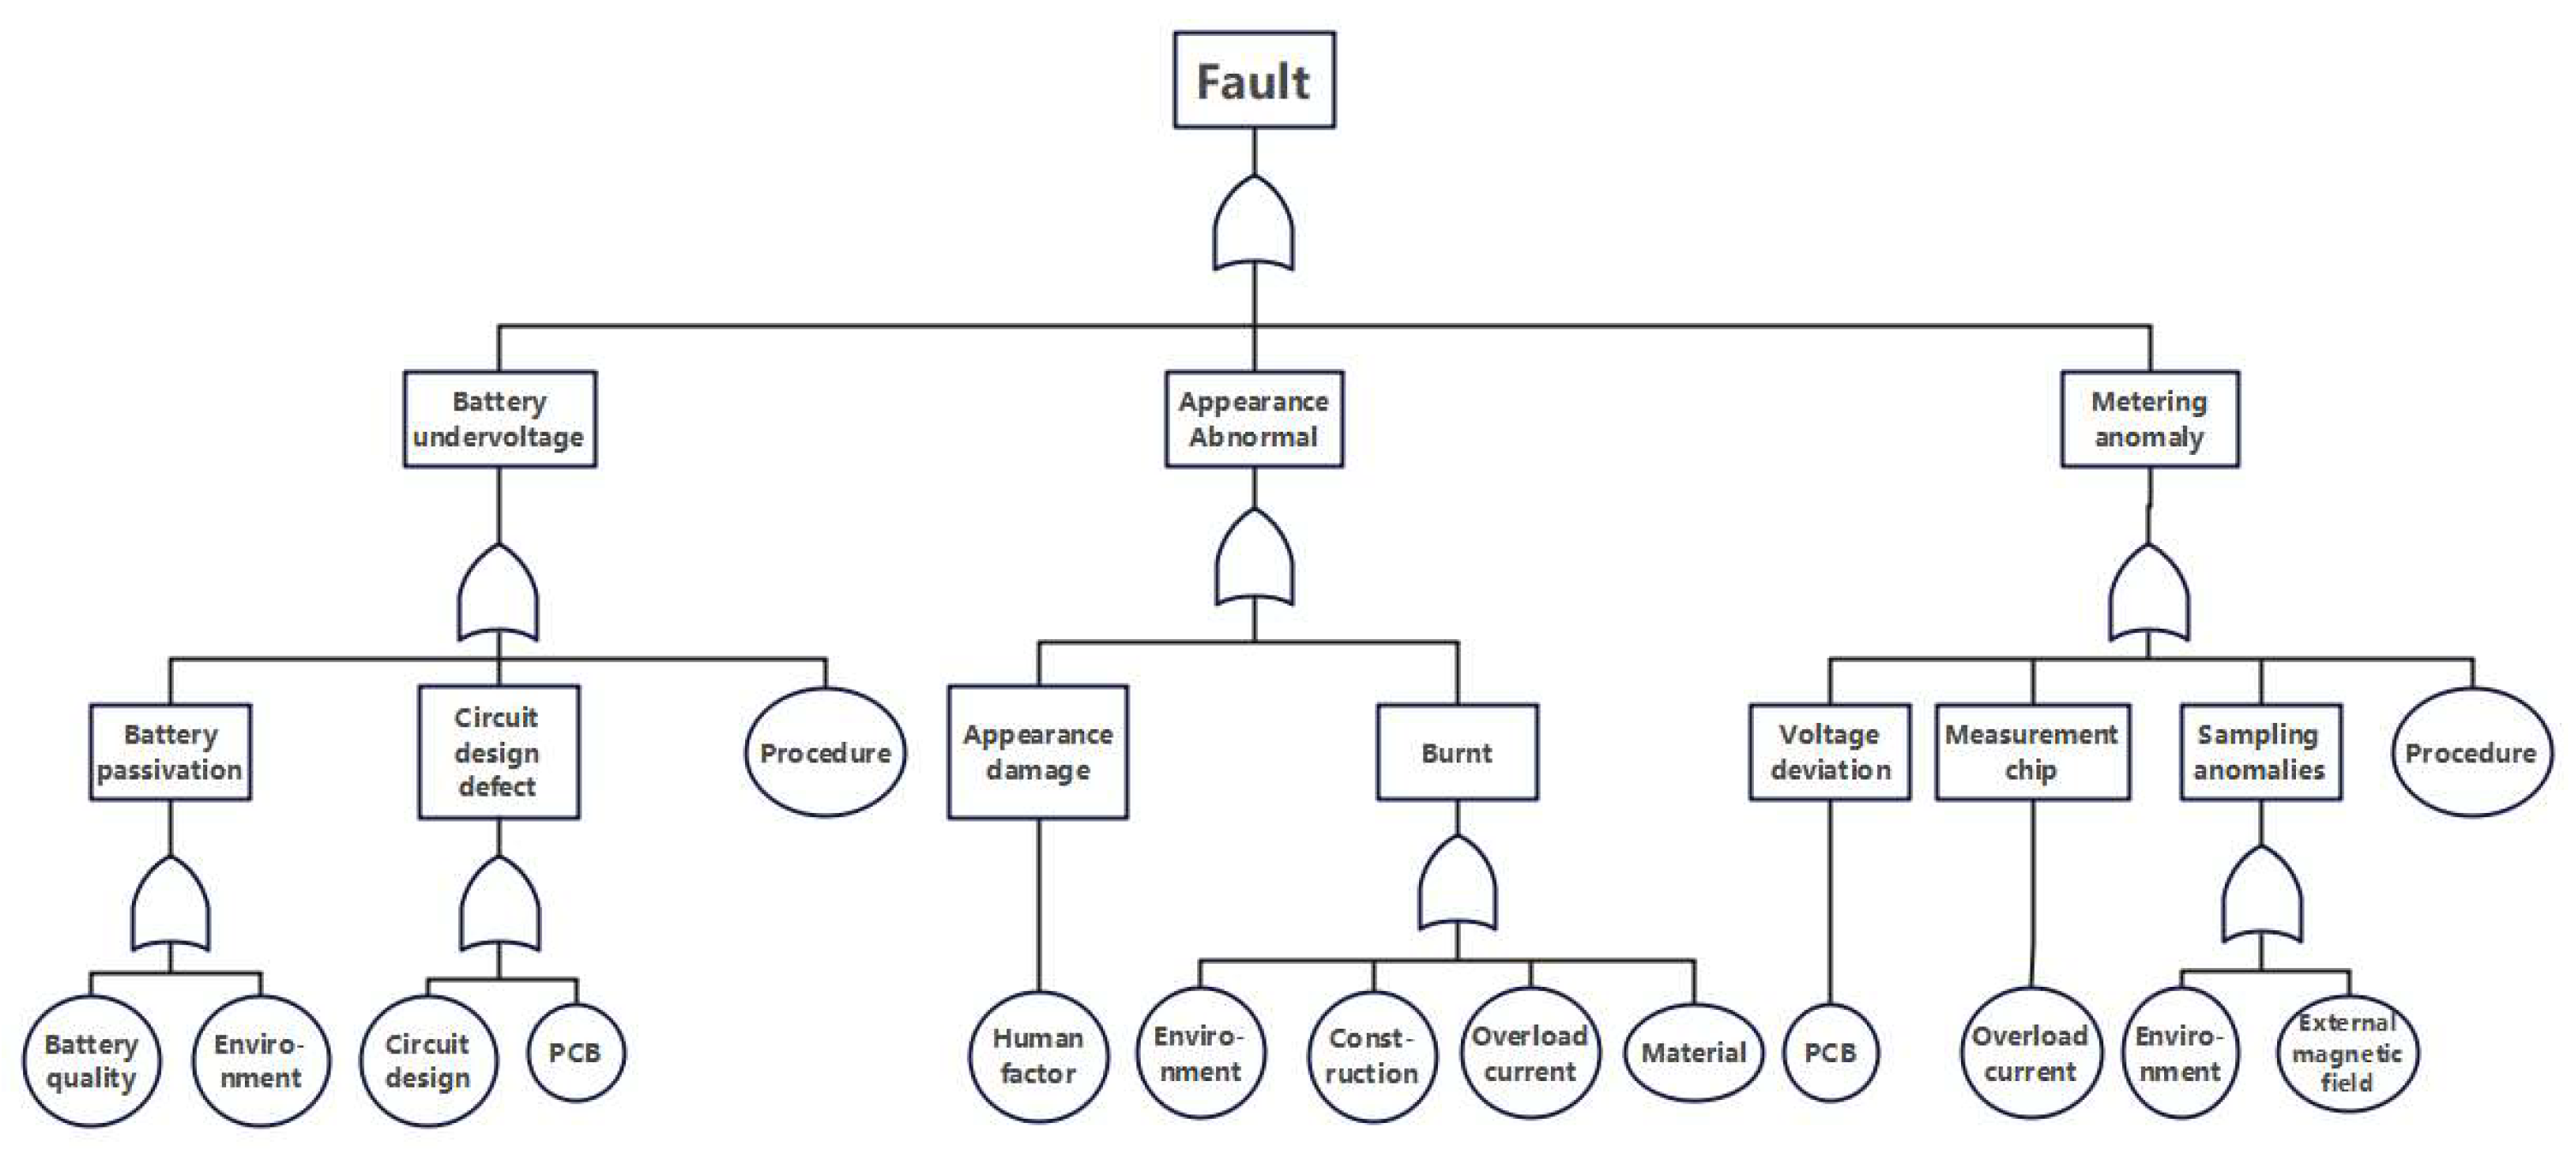
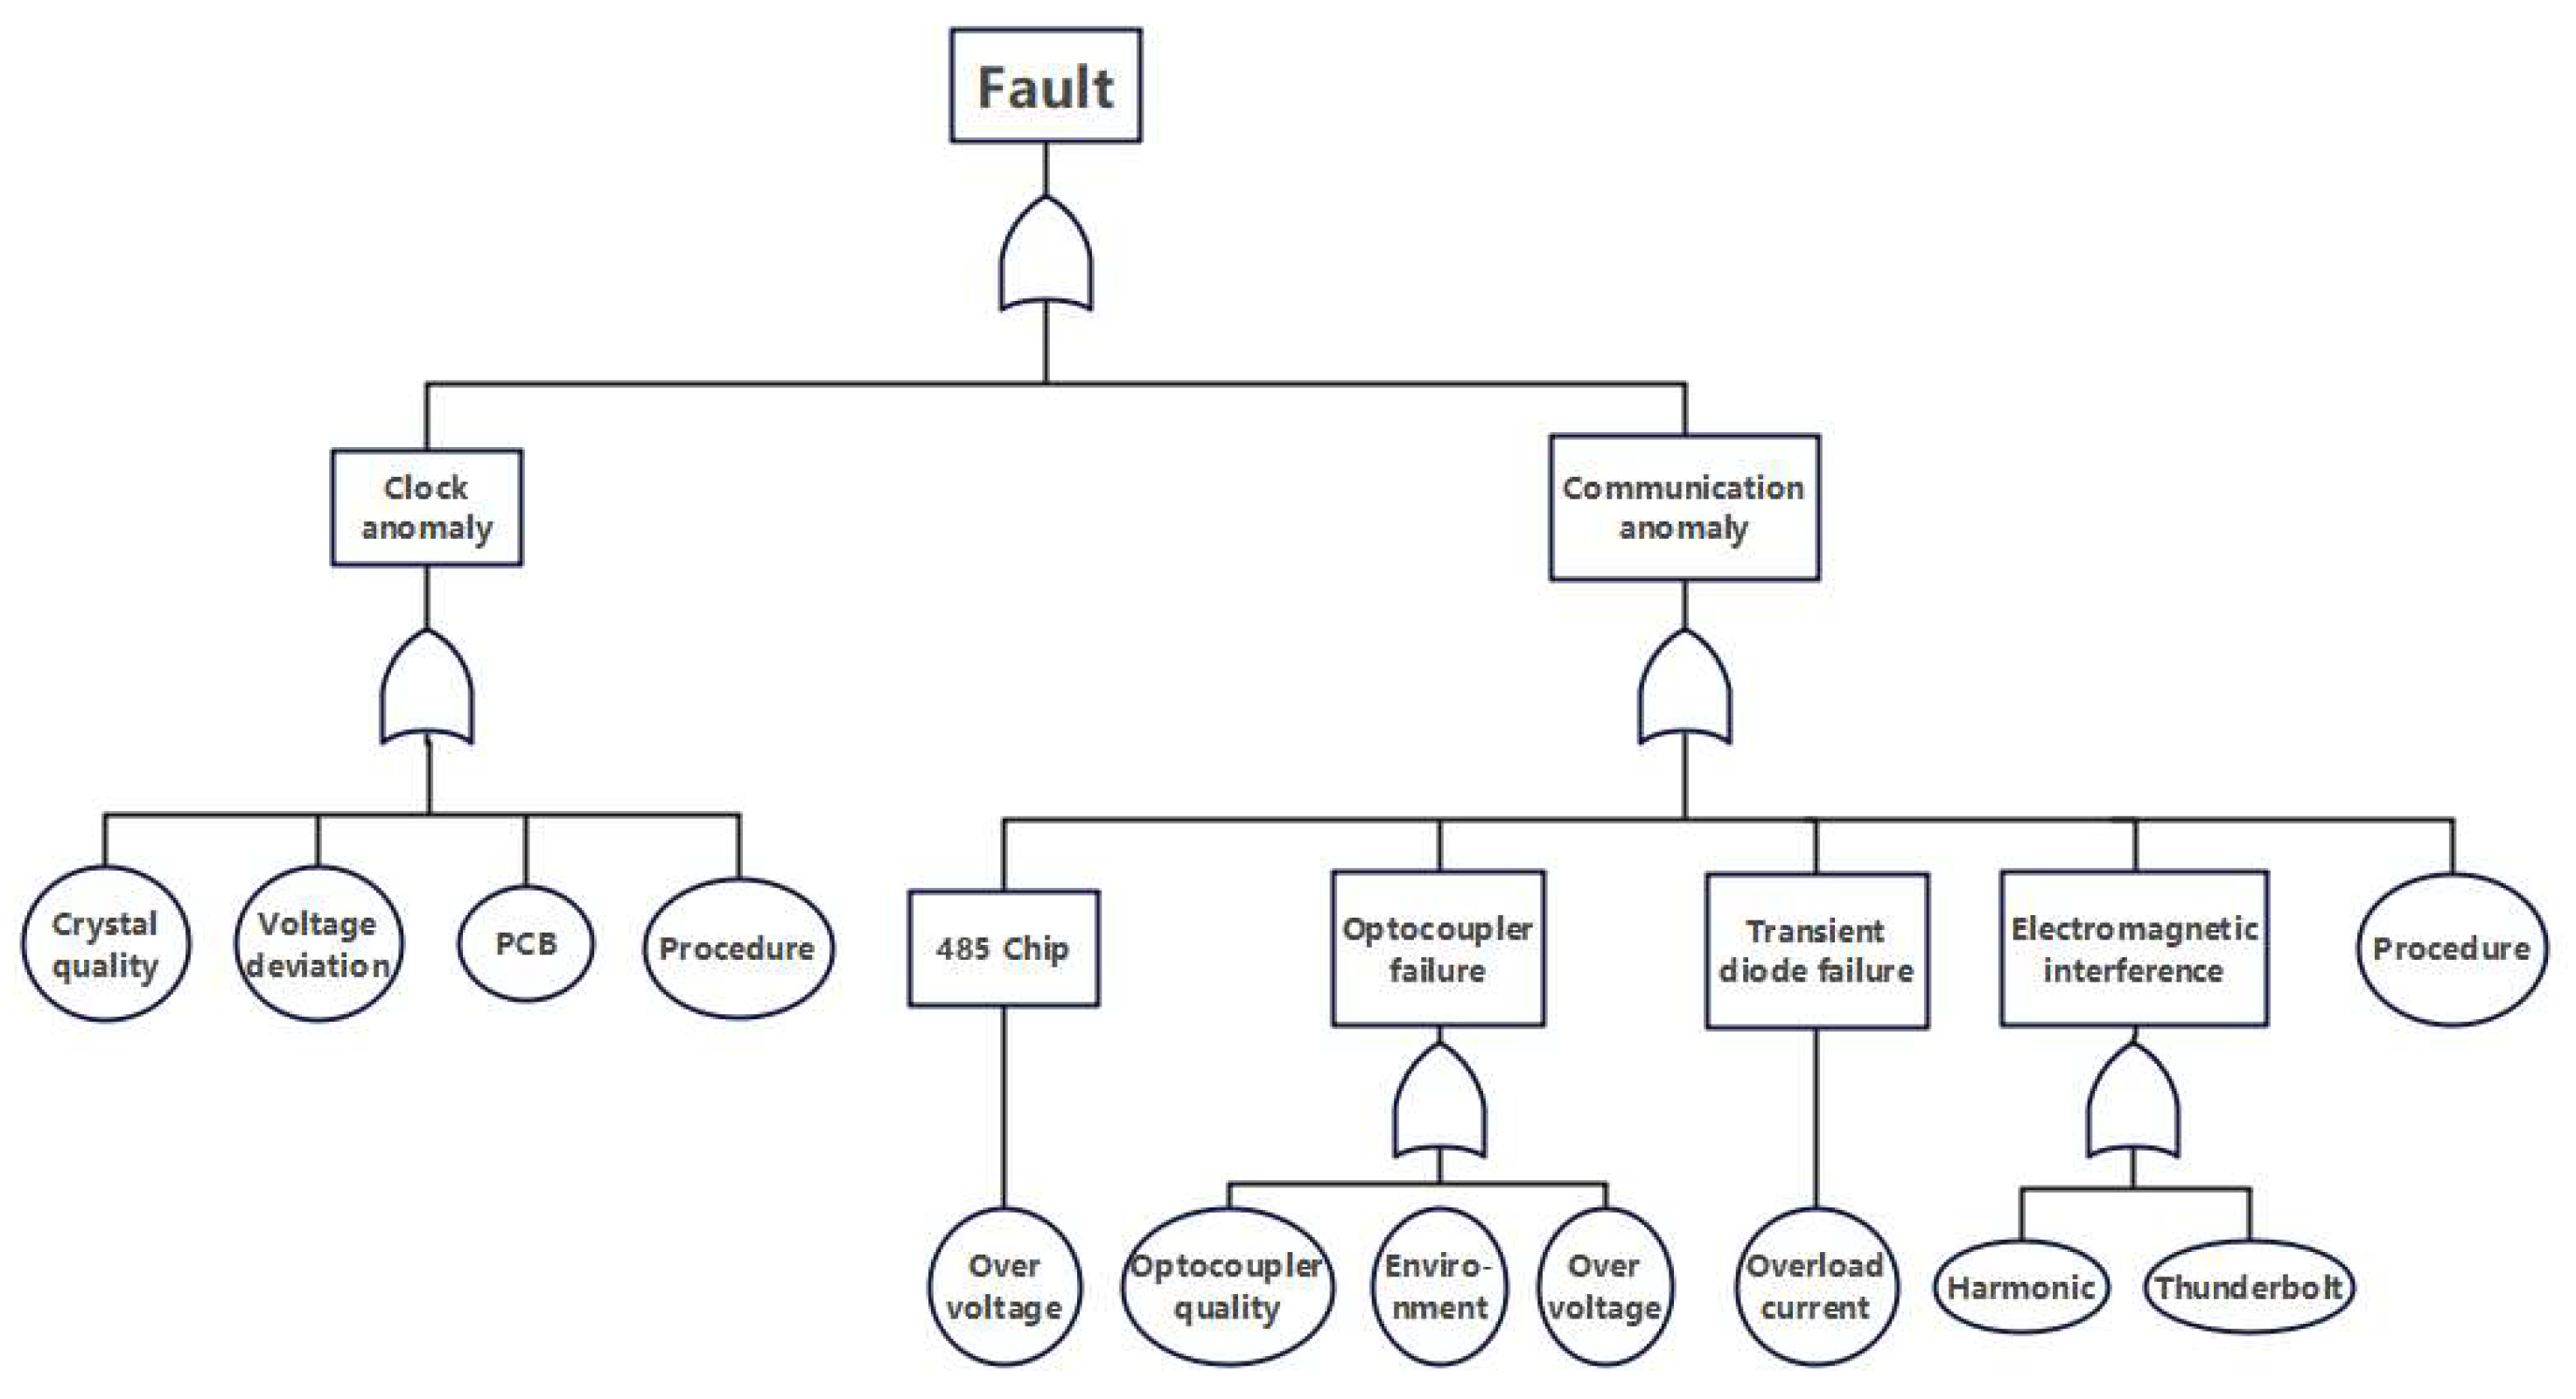
2.1. Basic Structure and Typical Faults of Smart Meters

Smart meters are electronic instruments that integrate computer technology, measurement technology, and communication technology as their core components. They possess basic functions including energy metering, communication, remote power on/off control, data storage, and processing, as well as extended capabilities such as water/gas/heat meter reading (Figure 1).
According to their hardware composition and functionality, smart meters can be divided into 8 modules: power supply module, metering module, communication module, clock module, micro controller unit (MCU), load control module, display, shell. They are shown in Figure 2.
The modules achieve functional coordination through electrical connections. The MCU serves as the core module of the smart meter, with all other modules connected to it.
Based on the structure of smart meters, their fault types can also be categorized into 8 distinct classifications. Analysis of all faulty smart meters from a provincial power grid in 2022 reveals the percentage distribution of various failure types, as shown in Figure 3.
Based on Figure 3, the analysis reveals that power supply faults and shell damage represent the most prevalent failure types in smart meters, accounting for 45.32% and 28.60% of total failures, respectively.
The faults in electricity meters are influenced by factors such as their own quality, natural environment, electromagnetic environment, and user electricity consumption habits. These interference sources exhibit coupling relationships with each other, resulting in highly complex failure mechanisms. Consequently, both the probability of faults and the types of faults are difficult to predict. Additionally, the fault inspection results of smart meters are prone to deviations due to factors such as the operating habits of personnel, casting doubt on their accuracy. In other words, the quality of existing data is insufficient to support the condition assessment or prediction of individual smart meters.
To address this problem, this study categorizes all smart meters into groups based on their production batches and distribution transformer areas. The research focuses on these groups as the primary units of analysis, shifting the state assessment objective to predicting the fault rate of smart meter clusters rather than individual meters. This approach specifically evaluates whether smart meters fail (binary classification) without attempting to predict the exact fault types.
By shifting the research focus from single meters to groups defined by production batches and distribution areas, we aggregate discrete unit fault labels (0/1) into continuous group fault rates (∈[0,1]). This approach leverages the Law of Large Numbers to cancel out random errors at the group level, significantly reducing noise impact.

2.2. Feature Construction for Smart Meter Group Condition Assessment

Knowledge related to smart meters encompasses both objective physical principles and subjective expert experience. The objective physical knowledge specifically refers to the failure mechanisms of smart meters. By analyzing the failure mechanisms of typical faults, disturbance sources affecting smart meter conditions can be identified, thereby constructing condition features. The subjective expert experience is embedded in smart meter technical specifications, including test items and applied disturbance sources. By compiling all test items and their corresponding disturbance sources, additional condition features can be established. Finally, all smart meter condition features are categorized into various lifecycle stages to form a comprehensive condition characterization system.

2.2.1. Physics-Knowledge-Based Construction of Smart Meter Condition Features

Fault tree analysis (FTA), as a core methodology in reliability engineering, employs a logical tree model with the top event as its root node to achieve formalized representation of failure mechanisms [41,42,43]. Through mechanistic analysis of typical smart meter failures, this study constructs the fault tree illustrated in Figure 4 and Figure 5, where the basic events represent potential disturbance sources that may lead to smart meter malfunctions.
Battery undervoltage serves as a representative case. Batteries inherently exhibit a non-negligible defect rate, primarily manifested through insufficient initial voltage, electrolyte leakage, and elevated self-discharge rates. Suboptimal peripheral circuit design or manufacturing flaws can further increase discharge current. Under high temperature and high humidity conditions, the battery discharge current of electricity meters rises significantly. During power outages, failure of the processor to enter low-power mode promptly results in rapid battery depletion.
In fault tree analysis, minimal cut sets represent the smallest combinations of basic events that can trigger the top event. From the fault tree shown in Figure 4 and Figure 5, a total of 15 minimal cut sets were calculated for typical smart meter failures, covering the entire lifecycle of smart meters. These include battery quality, environmental factors, circuit design, PCB manufacturing process, human factors, installation quality, overcurrent conditions, material quality, external magnetic fields, crystal oscillator quality, overvoltage conditions, optocoupler quality, power grid harmonics, lightning strikes, and software defects.
These interference sources can be classified into four major failure domains:
(1)
Component Quality: including battery quality, crystal oscillator quality, and optocoupler quality;
(2)
Electromagnetic Environment: comprising external magnetic fields, overvoltage, power grid harmonics, and lightning strikes;
(3)
Natural Environment: such as temperature and humidity;
(4)
Process Control: encompassing PCB manufacturing process, circuit design, installation quality, and software defects.

2.2.2. Expert-Experience-Based Construction of Smart Meter Condition Features

Technical specifications for smart meters primarily evaluate specific performance characteristics under defined conditions. Their testing methodologies derive from expert experience and analysis of extensive historical failure data.
Based on Q/GDW 10364-2020 “Technical Specification for Single-phase Smart Meters” [44], the standard testing protocol comprises nine core test categories:
  • Accuracy Tests
  • External Influence Tests
  • Climatic Impact Tests
  • Mechanical Tests
  • Electrical Performance Tests
  • Insulation Tests
  • Tariff Control Security Tests
  • Reliability Verification Tests
  • Communication Checks
This study employs a test-failure mapping methodology to establish correlations between test parameters and smart meter operational states.
Taking the Electrical Fast Transient/Burst (EFT) immunity test in external influence testing as an example, the test conditions and methodology are specified as follows: (a) Apply rated voltage to the voltage circuit; (b) Inject 10 times the basic current to the current circuit; (c) Maintain the test signal at unity power factor (1.0); (d) Keep the test signal constant within specified reference conditions; (e) Use a 1 m cable between the coupling device and the meter under test; (f) Apply test voltages in common mode sequentially to each port, ±4 kV for mains power ports and current transformer ports, ±2 kV for HLV signal ports (all terminals tested as one group), and ±1 kV for ELV signal ports (all terminals tested as one group); (g) Maintain each polarity test duration for 60 s; (h) Set the repetition rate at 100 kHz.
The test voltages are coupled to the smart meter’s ports (including voltage circuit ports, current circuit ports, and signal ports). These disturbances are characterized by sudden occurrence, high voltage amplitude, strong energy intensity, and significant suppression challenges.
Through comprehensive analysis of all test items, Table 1 summarizes the identified interference sources.
The test-driven set of interference sources for smart meters comprises transient overvoltage, power-frequency overvoltage, power supply quality, spatial electromagnetic interference, temperature, humidity, solar radiation, dust contamination, mechanical shock, and operational duration.

2.2.3. Condition Features for Smart Meter Group

The condition features derived from the integration of physical mechanisms and expert knowledge can be classified into four categories, as follows in Figure 6.
The basic metering errors include the mean error, standard deviation, skewness, kurtosis, and range measured at different power factors (1.0 and 0.5 L). Similarly, the daily timing error comprises the mean value, standard deviation, deviation, kurtosis, and range. So, the total number of condition features is 25.

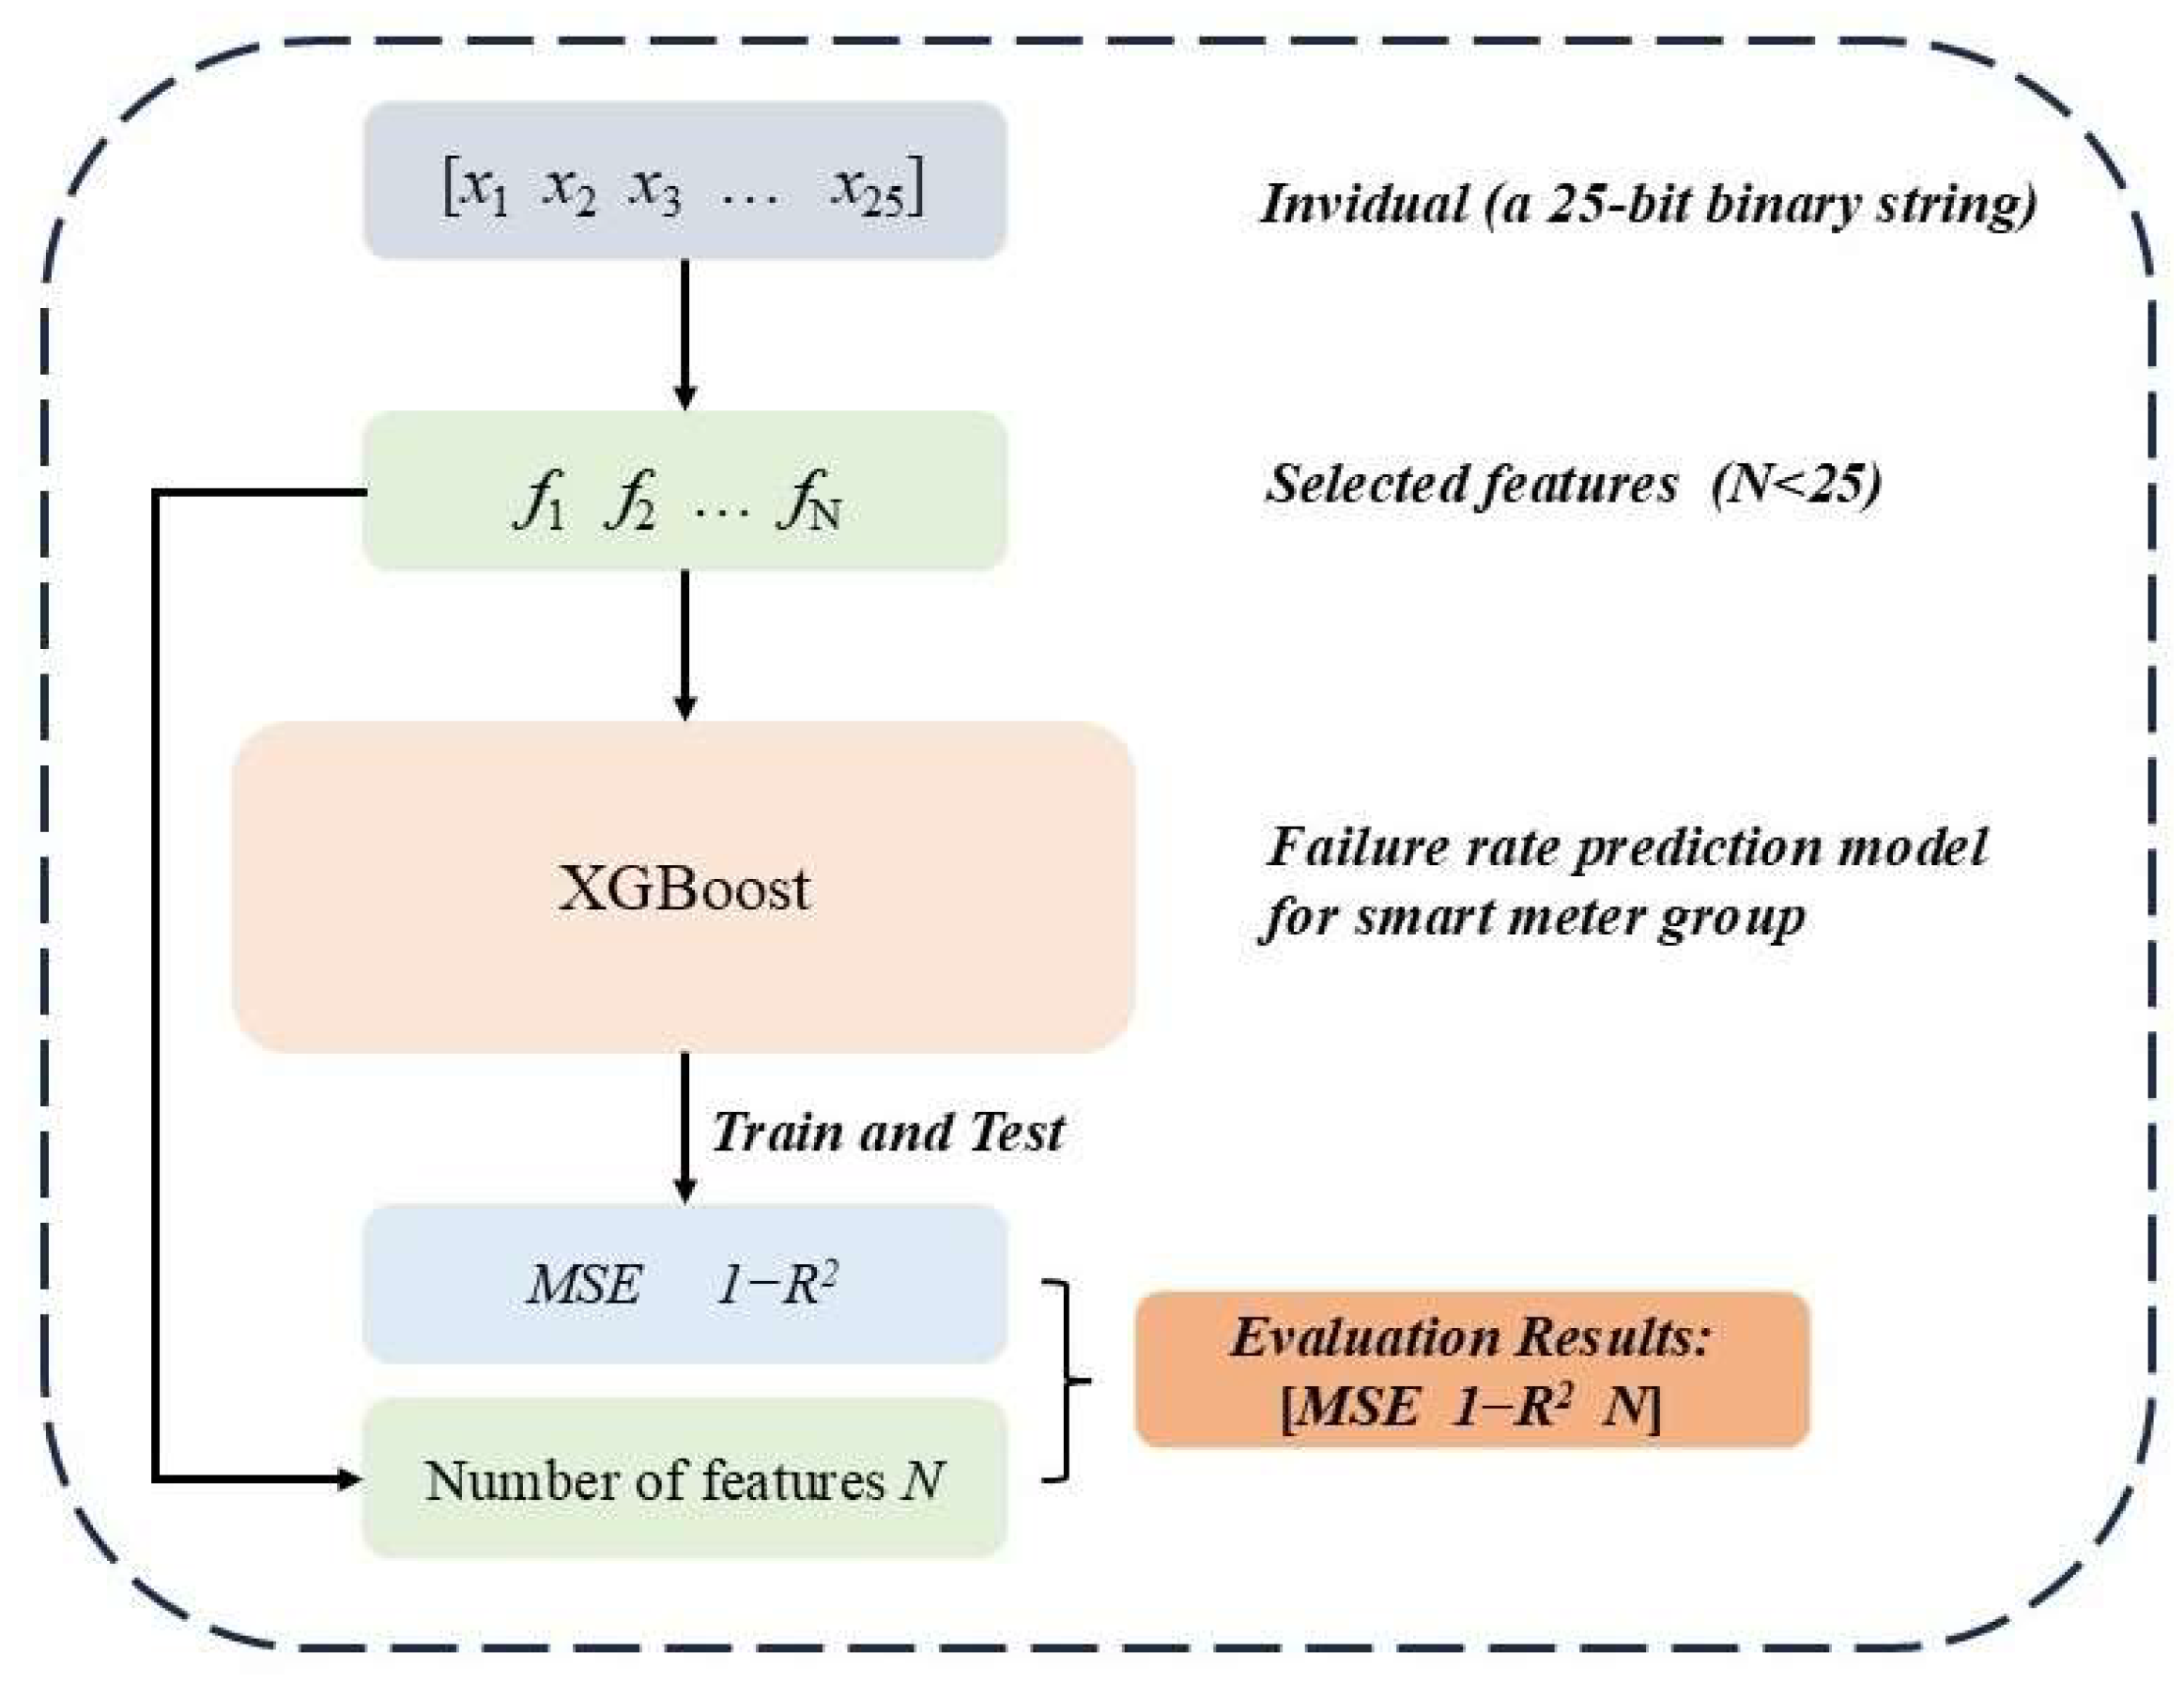
2.3. Feature Selection for Smart Meter Group Condition Assessment

Among the aforementioned 25 features, redundancy may exist, leading to increased model complexity and reduced inference speed. So, feature selection is necessary to screen effective features. Feature selection aims to minimize the number of features while maximizing model performance. Therefore, feature selection is also a multi-objective optimization problem.

2.3.1. Optimization Objectives for Feature Selection

In this study, the condition assessment of smart meter groups is formulated as a regression problem, where the target output is the predicted failure rate. To evaluate model performance, two standard regression metrics are employed: the mean squared error (MSE), which quantifies the average squared deviation between predicted and actual failure rates, and the coefficient of determination (R2), which measures the proportion of variance in the failure rate explained by the model.
To align all optimization objectives toward minimization (a common convention in optimization frameworks), the R2 metric is transformed into 1 − R2. This conversion ensures that improving model performance (i.e., increasing R2) corresponds to minimizing the objective function.
Additionally, to promote model parsimony and avoid overfitting, a third objective is introduced: the number of selected features (N). This penalizes overly complex models, encouraging a balance between predictive accuracy and simplicity.
Thus, the multi-objective optimization problem comprises three targets:
(1)
Minimize MSE (reduce model prediction error)
(2)
Minimize 1 − R2 (reduce model prediction error)
(3)
Minimize N (reduce feature count)

2.3.2. Optimization Algorithms for Feature Selection
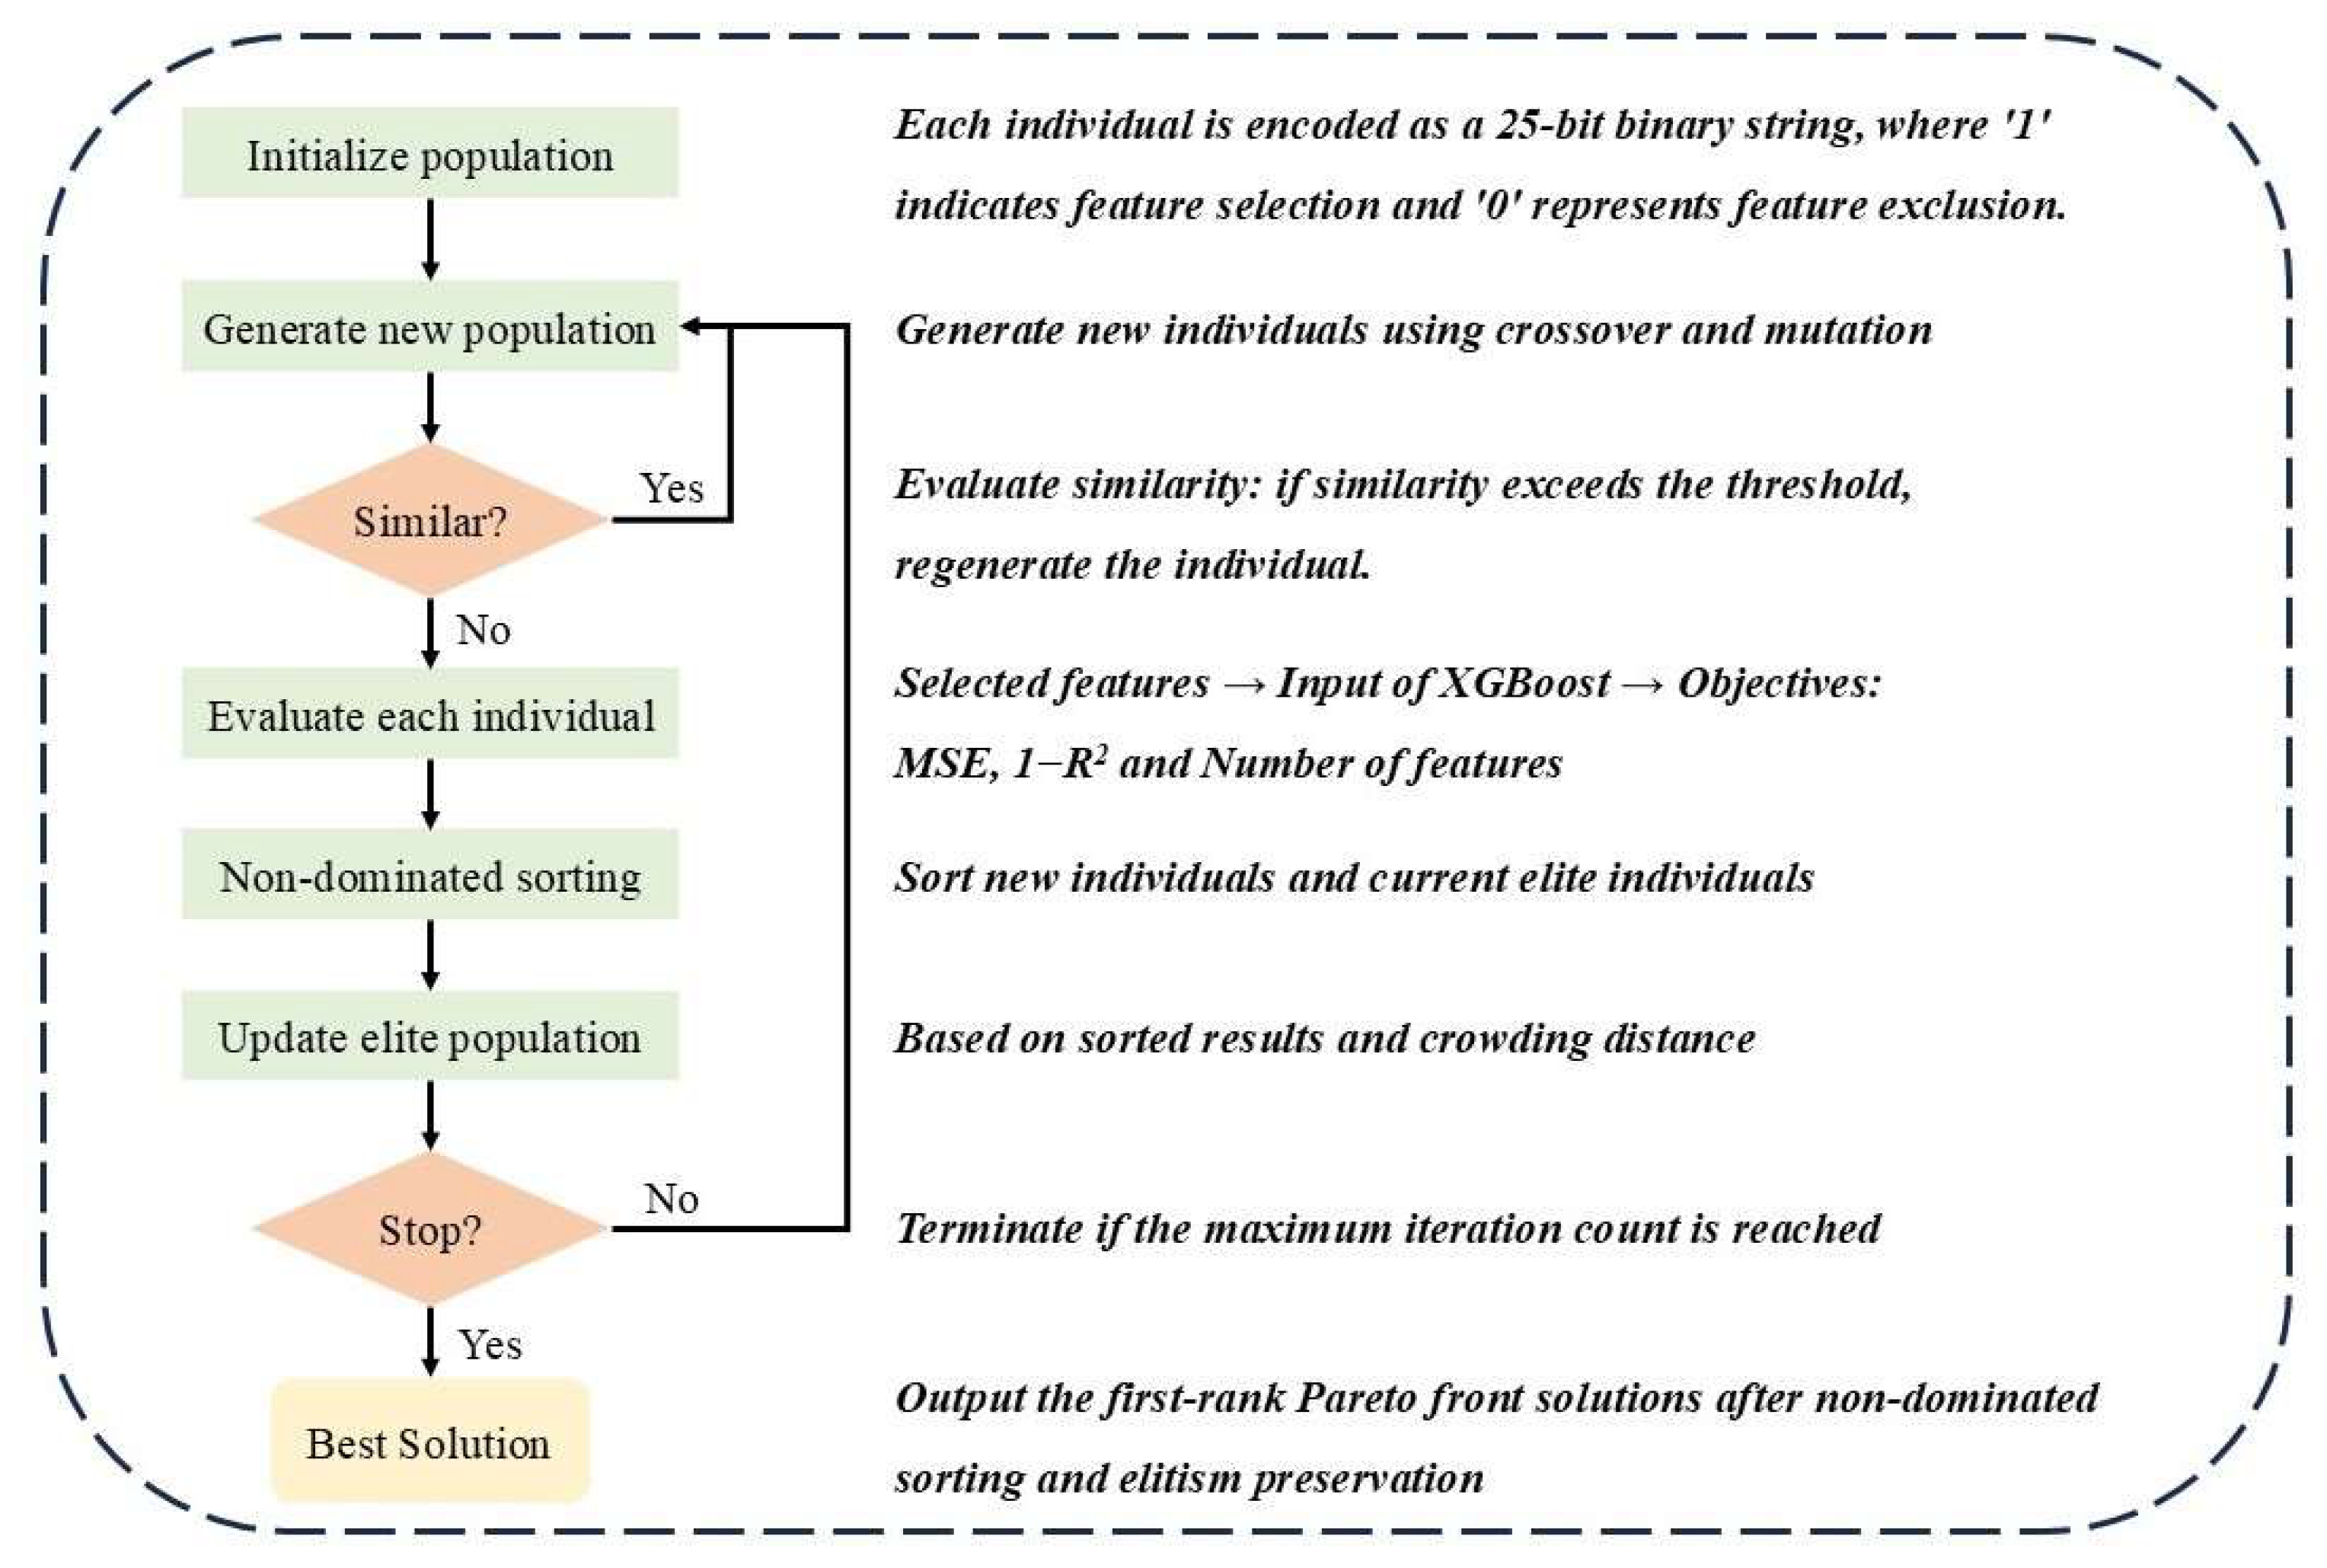
The number of optimization objectives is 3. For problems that have 3 optimization objectives, NSGA-II exhibits faster convergence and is widely applied [45]. This paper integrates NSGA-II with Jaccard similarity, binary encoding, and XGBoost for feature selection in a group smart meter failure rate prediction model. The algorithm workflow is illustrated in Figure 7.
(1)
Initialize population
The total number of condition features is 25. The individuals are randomly generated as 25-bit binary strings, where a ‘0’ at the nth position indicates the exclusion of the nth feature, and a ‘1’ represents its selection. Following generation, the Jaccard similarity between the new individual and existing population is computed. If the similarity exceeds a predefined threshold (e.g., 0.3), the individual is regenerated.
Jaccard similarity is calculated using the following formula [46]:
J A , B = | A B | | A B |
AB is the number of features both individuals select. AB is number of features selected by either individual.
Jaccard similarity is particularly well-suited for binary-encoded individuals. It focuses on the overlap of selected features (represented by 1) while ignoring interference from unselected features (0). In high-dimensional feature spaces with low selection rates, Jaccard similarity effectively captures overlaps in sparse feature selections, whereas metrics like Euclidean distance are prone to distortion due to the abundance of 0.
(2)
Generate new population
The existing population serves as the parent generation, undergoing pairwise crossover and random mutation to produce a new offspring population.
The crossover and mutation processes are presented in Algorithms 1 and 2, respectively. AND mimics L1 regularization for high-frequency features, whereas OR emulates random subspace sampling, together balancing stability and diversity. This design outperforms standard operators’ “blind” gene recombination.
(3)
Similar?
During offspring generation, each newly created individual undergoes a rigorous similarity assessment against both the existing offspring pool and the parent population to prevent redundancy.
Specifically, we compute the Jaccard similarity—a measure of overlap between binary-encoded feature subsets for every pairwise comparison. If the similarity between the new individual and any existing or parent solution exceeds a predefined threshold (e.g., 0.3), the individual is discarded and regenerated via fresh crossover and mutation operations.
Algorithm 1: Crossover
Inputs: Random parent individuals x1, x2
Outputs: Offspring individuals y1, y2
1.y1x1 AND x2
2.y2x1 OR x2
3.return (y1, y2)
Algorithm 2: Mutation
Inputs:Offspring population X, Mutation rate m
Outputs:Mutated populaton Y
1.While i < length(X) do
2. if random(0,1) < u then
3.  X[i] ← 1 − X[i]
4.  if sum(X) == 0 then
5.   k ← random(0, length(X)−1)
6.   X [k] ← 1
7.  end if
8.  if sum(X) == length(X) then
9.   k ← random(0, length(X)−1)
10.   child[k] ← 0
11.  end if
12. end if
13.end while
This mechanism ensures population diversity by actively suppressing near-duplicate solutions, thereby enhancing exploration across the feature space while maintaining selective pressure toward high-quality candidates.
(4)
Evaluate each individual
The evaluation process is shown in Figure 8. Each individual in the population is represented as a 25-bit binary string, where each bit corresponds to the selection state (1) or exclusion (0) of a specific feature. This binary encoding is decoded into an active feature subset, which is then used as input features for training the XGBoost model. The target label for prediction is the empirically observed failure rate of each predefined smart meter group.
After training and testing, two key metrics are computed: MSE and 1 − R2. These performance metrics, combined with the cardinality of the selected feature subset (ranging from 1 to 25 features), collectively form a three-dimensional objective vector [MSE, 1 − R2, N] that characterizes the quality of each individual solution.
For each feature selection scheme, the optimal hyperparameters of the XGBoost model are different. Therefore, hyperparameter tuning is required each time an individual is evaluated. Bayesian optimization is a hyperparameter optimization method based on probabilistic modeling, particularly suitable for problems with high computational costs and complex parameter spaces [47,48,49]. Its core idea is to model the distribution of the objective function through a Gaussian process and intelligently select the next set of hyperparameters to evaluate using an acquisition function, thereby finding the global optimum with the fewest experiments.
(5)
Non-dominated sorting
The offspring and parent populations undergo non-dominated sorting based on their evaluation results (MSE, 1 − R2, N) to construct the Pareto front, followed by crowding distance calculation to ensure diversity preservation.
Non-dominated sorting ranks solutions into hierarchical Pareto fronts based on dominance relationships. A solution x dominates y (x < y) if it is equal/better in all objectives and strictly better in at least one.
The process iteratively identifies:
  • Front 1: All non-dominated solutions in the current population;
  • Front k: Solutions only dominated by those in preceding fronts.
This creates a partial order where solutions in earlier fronts have higher priority.
Crowding distance quantifies solution density in objective space to preserve diversity. For each front:
  • Sort solutions along each objective axis;
  • Assign infinite distance to boundary solutions;
  • For intermediate solutions, compute normalized Manhattan distance between adjacent neighbors.
Solutions with larger crowding distances reside in less crowded regions, promoting uniform front spreading.
(6)
Update elite population
The elite population is updated based on the non-dominated sorting ranks and crowding distances to preserve the best-performing and most diverse solutions.
(7)
Stop?
The algorithm checks whether the maximum iteration count has been reached. If the condition is met, the execution terminates.
(8)
Best Solution
Output the Pareto-optimal solution set.

2.4. Dataset Description

Current regulations mandate compulsory replacement of smart meters upon reaching 8 years of operational service. However, empirical evidence indicates that the majority of smart meters remain functionally operational beyond this threshold, resulting in non-trivial resource wastage due to premature replacements.
This study specifically examines smart meters with operational durations spanning 5–9 years, including units exceeding the 8-year regulatory limit due to implementation exceptions in maintenance management protocols.
The dataset comprises 892,547 randomly sampled smart meters deployed across all prefecture-level cities in a Chinese province between 2014 and 2018, subsequently clustered into 5749 groups. Each record includes the following:
  • Unique meter identifiers;
  • Initial verification metrics (metering error and daily timing error);
  • Installation locations;
  • Binary fault status and fault type;
  • Operational duration (5–9 years);
  • Manufacturer specifications and production batch codes;
  • Anomaly event logs (power interruptions, overcurrent incidents, undervoltage occurrences).
As illustrated in Figure 9 and Figure 10, the distribution of operational durations (5–9 year range) and fault type prevalence are visualized.
The raw dataset was processed to generate the 25 condition features specified in Section 2.2.3. The temperature and humidity data were obtained from meteorological databases. Some metrics are defined with the following units: Overcurrent frequency and undervoltage frequency are measured in occurrences per year (times/year), power outage duration is quantified in hours, and operating duration is recorded in years.
The 25 constructed features for smart meter group condition assessment are numbered as shown in Table 2.
Additionally, we calculated the group-level failure rate (defined as the ratio of faulty meters to total meters per group) to serve as the target label for XGBoost regression training.

3. Results

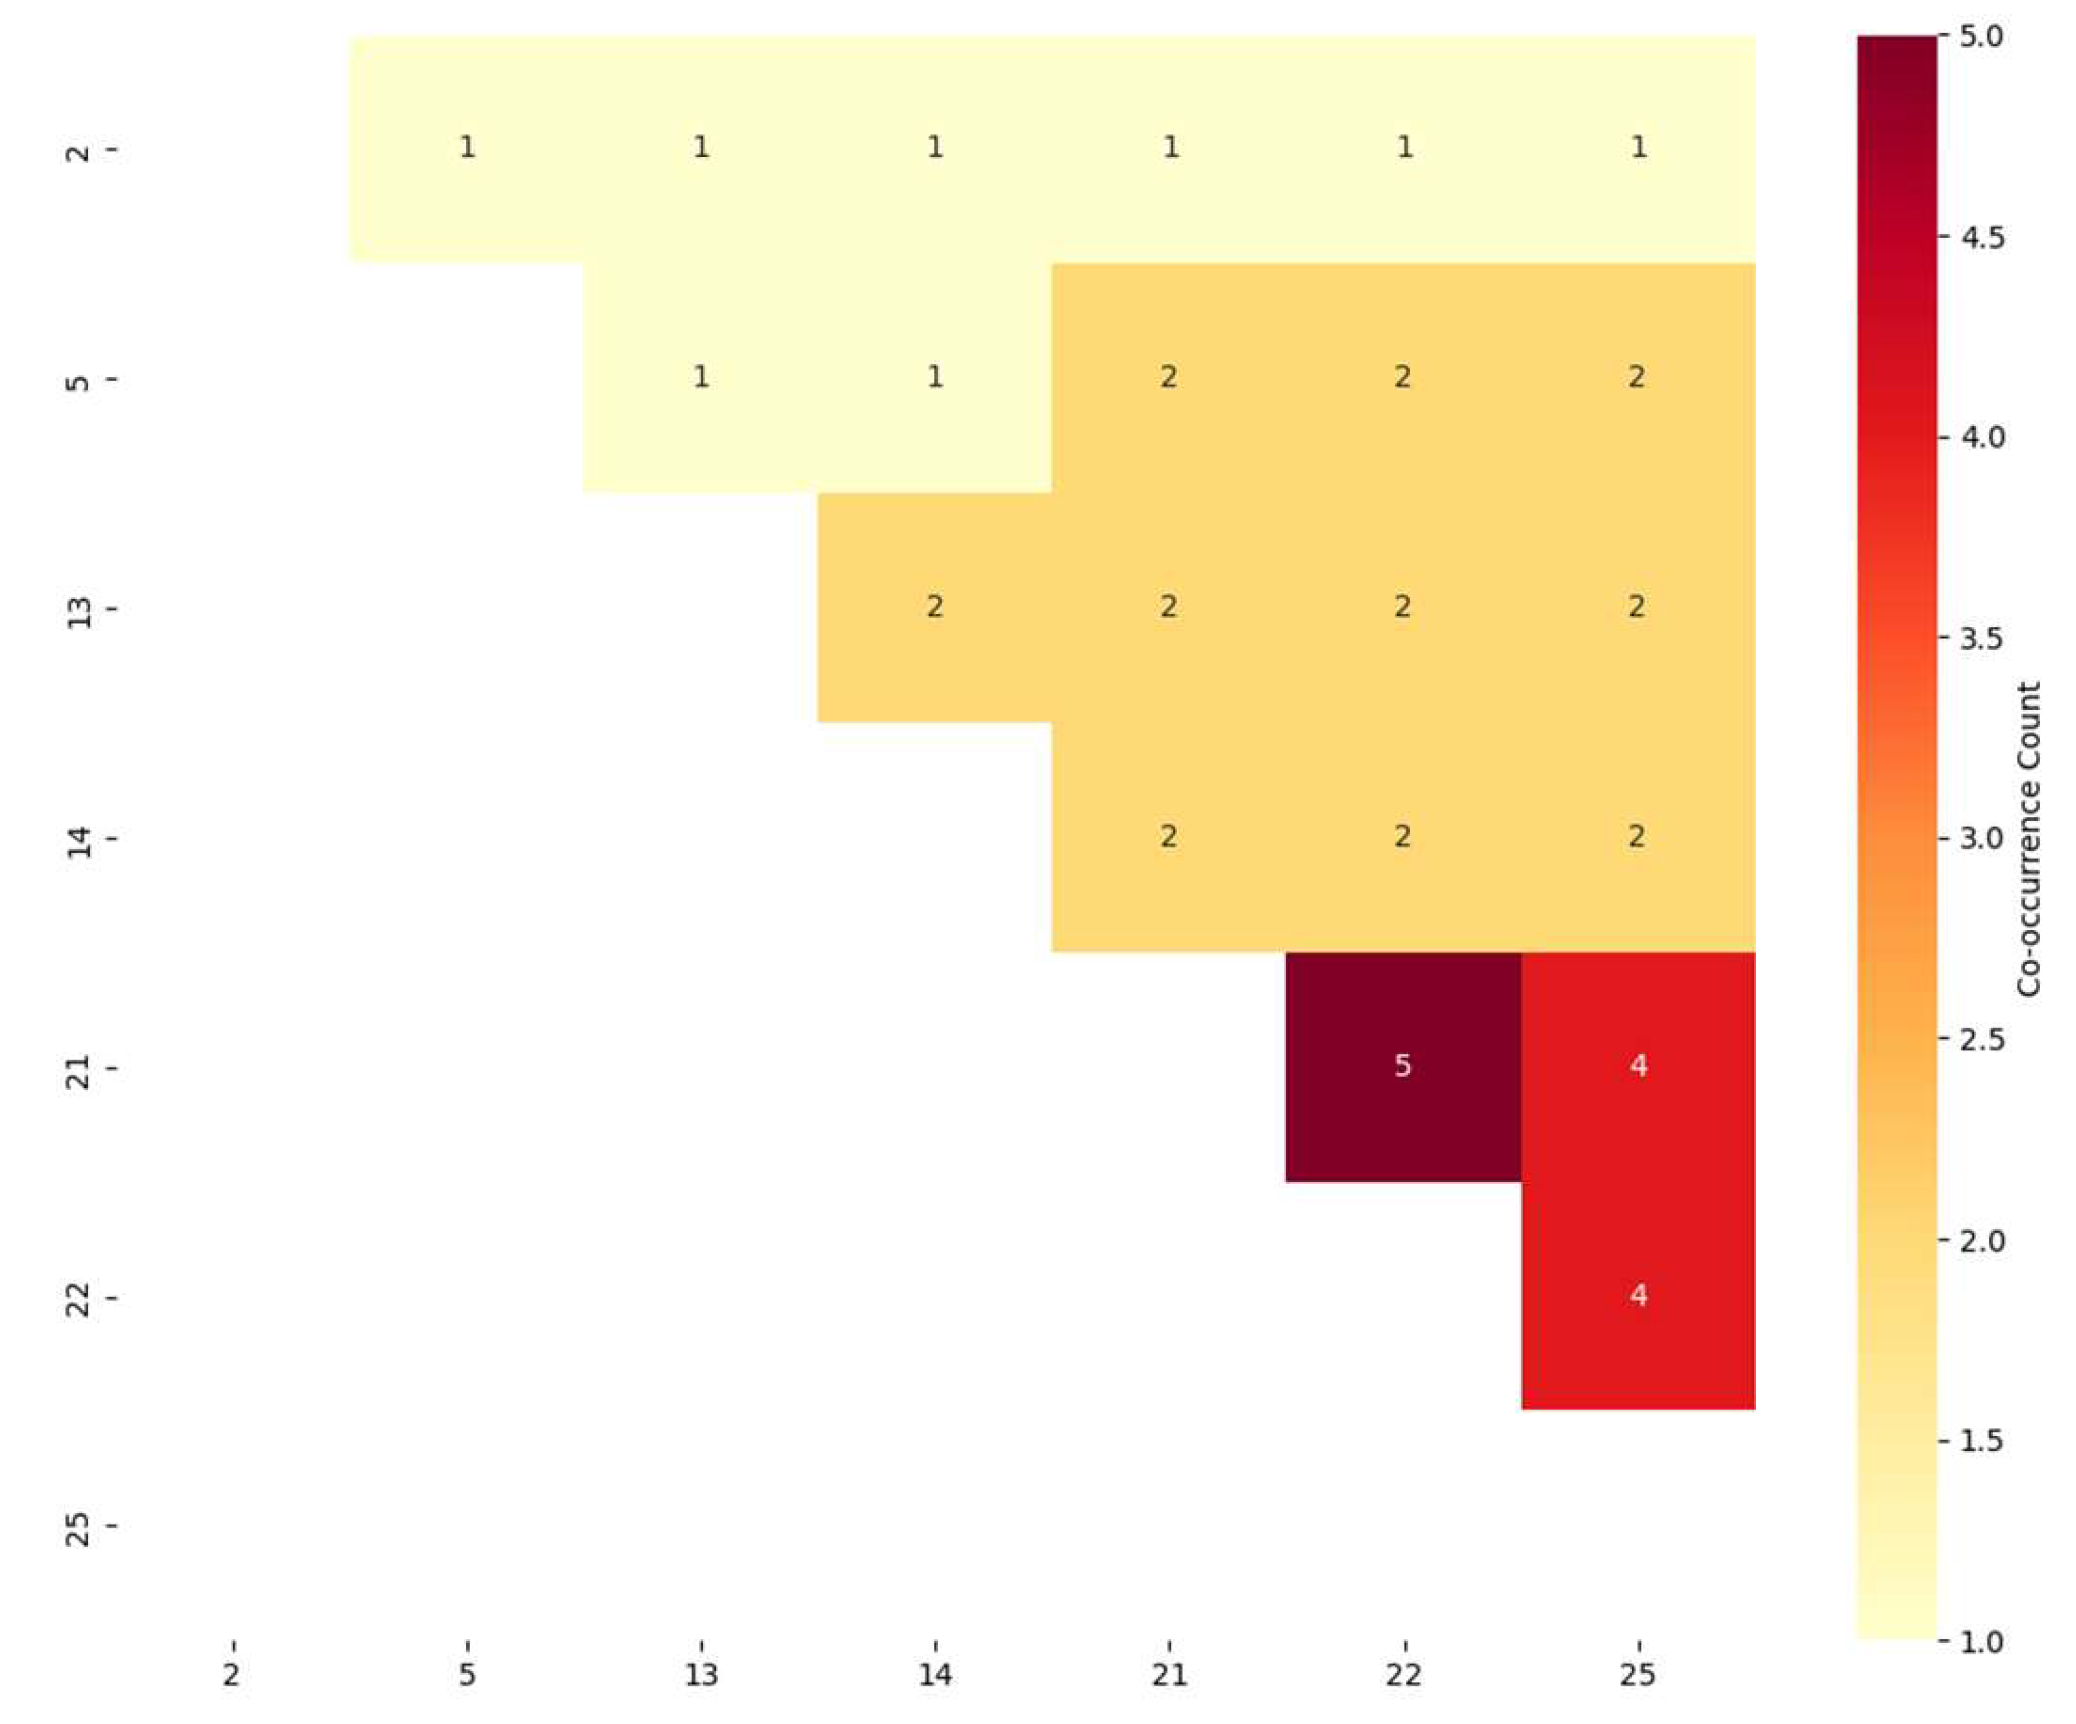
3.1. Optimal Feature Subset

This paper proposes an evolutionary multi-objective feature selection algorithm to address feature redundancy in condition assessment. The method innovatively combines NSGA-II with Jaccard similarity and XGBoost for optimized feature selection.
During population initialization, the Jaccard similarity index measures solution similarity to eliminate redundant individuals. In the evaluation phase, each candidate feature subset is input into XGBoost for training and testing. MSE, 1 − R2 and the number of features N total the three optimization objectives.
The population size was set to 100, the maximum number of generations (iterations) was configured as 200, and the Jaccard similarity threshold was fixed at 0.3 [45]. Bayesian search space and Bayesian optimizer parameters [47,48,49] are shown in Table 3.
The proposed algorithm generates multiple Pareto fronts as results, each consisting of a set of non-dominated solutions. The first front constitutes the Pareto-optimal set. All individuals in the Pareto-optimal set are shown in Table 4.
The relationship between model performance and the number of features is shown in Figure 11. The occurrence frequency of individual features and co-occurrence frequency of feature pairs are presented in Figure 12 and Figure 13, respectively.
The Pareto-optimal solutions demonstrate a clear non-linear trade-off between model complexity and predictive accuracy, where reducing feature dimensionality from the maximum seven features to a single feature leads to exponential performance degradation. Specifically, the mean squared error (MSE) exhibits a 36-fold increase from 0.0043 to 0.1548, while the coefficient of determination (R2) shows a precipitous 93.7% decline from 0.7239 to just 0.0456. This dramatic performance deterioration follows a characteristic elbow pattern, with particularly severe drops occurring when feature counts are reduced below three, suggesting the existence of a critical threshold for maintaining model fidelity.
Feature 21 emerges as the most critical indicator, demonstrating perfect selection stability across all solutions (100% selection frequency in the Pareto front). This universal inclusion strongly suggests Feature 21 captures fundamental operational characteristics essential for smart meter condition assessment. Features 22 and 25 form a stable core combination with this primary indicator, appearing together in 83.3% and 66.7% of solutions, respectively. Their persistent co-selection indicates these features likely measure complementary aspects of meter performance that synergistically enhance model accuracy when combined with Feature 21.
Through multi-objective optimization balancing model complexity (feature count) and prediction accuracy (MSE and 1 − R2), the feature subset [2, 5, 13, 14, 21, 22, 25] emerges as the Pareto-optimal solution, with quantitative comparisons presented in Table 5.

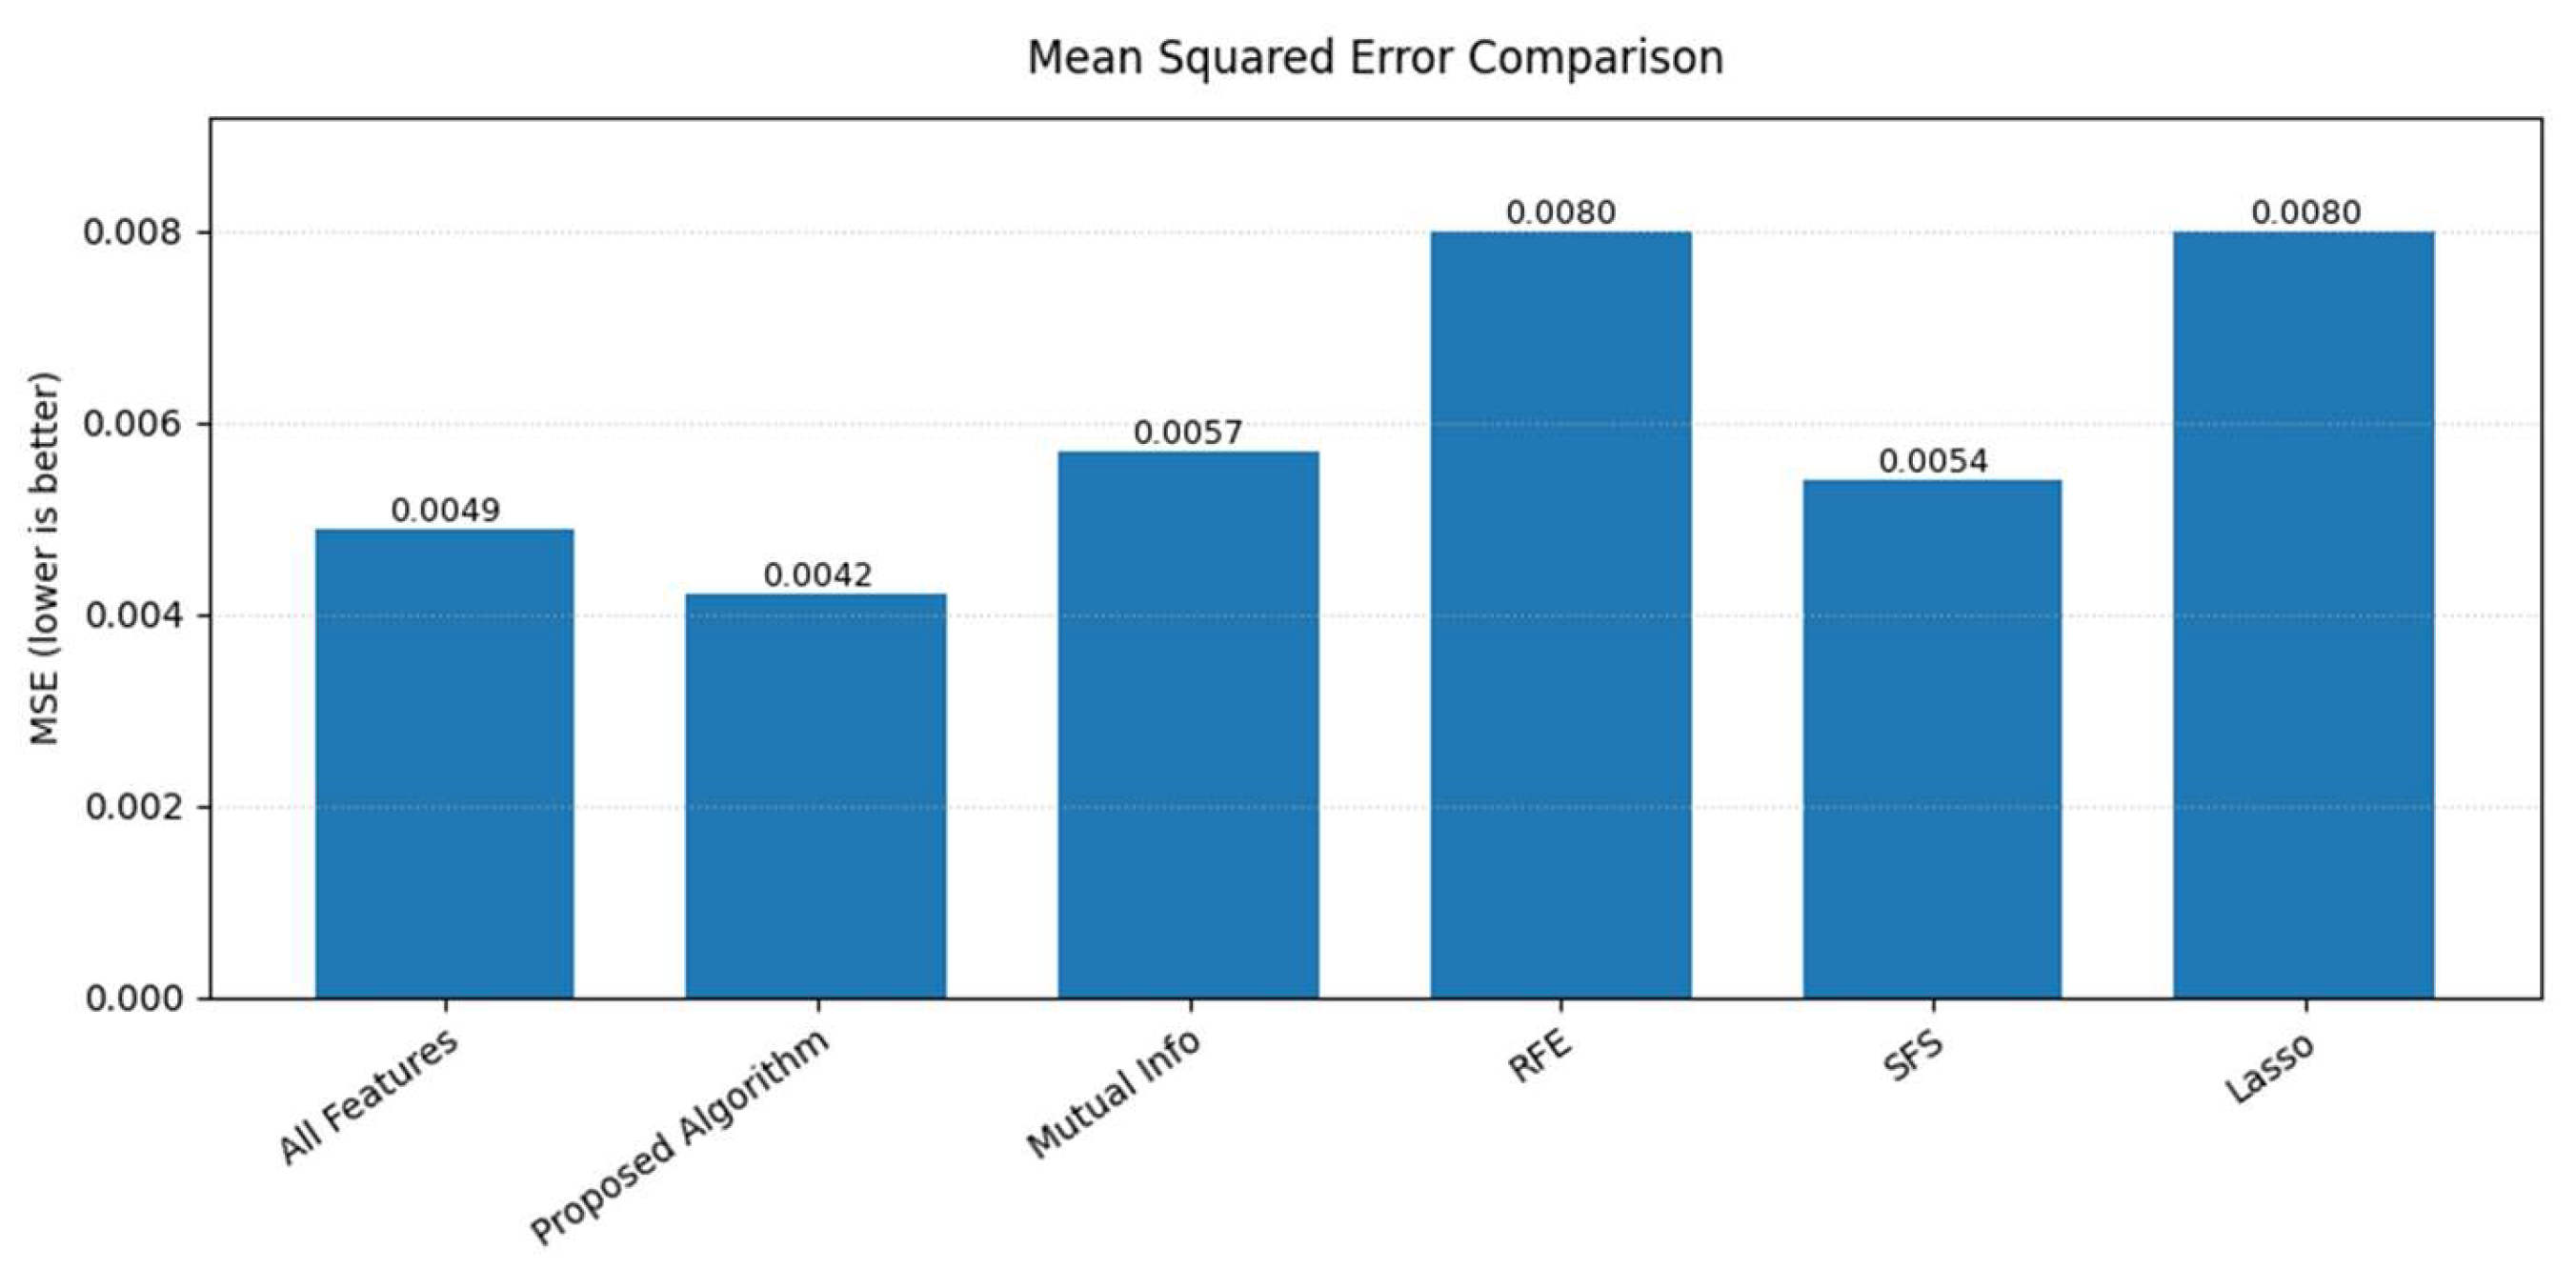
3.2. Comparative Analysis

Feature selection algorithms can be broadly categorized into three main approaches: filter methods, wrapper methods, and embedded methods, each with distinct advantages and limitations. Filter methods, such as Mutual Information, evaluate features based on their intrinsic statistical properties without involving predictive models, offering computational efficiency but potentially overlooking feature interactions. Wrapper methods, exemplified by Recursive Feature Elimination (RFE) and Sequential Feature Selection (SFS), iteratively select features by optimizing model performance, thereby capturing feature dependencies at the cost of higher computational complexity. Embedded methods, like Lasso regression, integrate feature selection within the model training process, balancing efficiency and effectiveness through regularization.
The proposed multi-objective optimization algorithm demonstrates robust feature selection capability by identifying an optimal subset of seven critical features, with statistical significance confirmed through 95% confidence intervals (CI). This optimized subset is derived through a Pareto-optimal solution that simultaneously maximizes feature relevance while minimizing redundancy.
To establish a rigorous comparative framework, we enforce strict parity conditions: the top seven features selected by each of the four benchmark methods (including filter, wrapper, and embedded approaches) are evaluated using identical training protocols and testing datasets. The predictive efficacy of these feature subsets is systematically quantified through an XGBoost model, with performance metrics carefully evaluated using both MSE and R2 to capture different aspects of model accuracy. For comprehensive bench-marking, the model’s performance using the complete set of 25 features is also reported.
The comparative results are comprehensively presented in Table 6 and visually illustrated in Figure 14 and Figure 15.
The proposed feature selection algorithm demonstrates superior performance across three key metrics: achieving the lowest MSE (0.0042), highest R2 (0.7228), and most stable predictions (R2 CI width = 0.0973, 44% narrower than SFS).
Compared with using all 25 features (MSE = 0.0049, R2 = 0.6638), our seven-feature subset simultaneously improves accuracy (14.3% lower MSE, 8.9% higher R2) while reducing dimensionality by 72%.
Among comparative methods, SFS shows the closest performance (MSE = 0.0054, R2 = 0.6543), though still underperforming our method by 22.2% in MSE. In contrast, RFE and Lasso exhibit significantly degraded results (MSE ≈ 0.008, R2 < 0.49) with non-overlapping confidence intervals (p < 0.01), confirming their statistical inferiority. The algorithm’s unique feature selection (21,22,25,2,13,5,14) captures discriminative patterns missed by other approaches.

4. Discussion

This study investigates smart meter condition assessment through a novel group-based approach. Unlike conventional single-meter analysis, we categorize meters into groups by production batches and distribution transformer areas, establishing failure rate as the prediction target.
By analyzing failure mechanisms and technical specifications, we identify four feature categories influencing meter conditions: (1) initial inspection errors, (2) natural environment, (3) manufacturing information, and (4) electromagnetic environment—totaling 25 initial features.
To address the issue of redundancy in condition assessment features, this paper proposes an evolutionary multi-objective feature selection algorithm. The algorithm innovatively integrates the NSGA-II framework with Jaccard similarity and XGBoost model to achieve feature selection through multi-objective optimization: during initial population generation, the Jaccard similarity index is employed to measure the similarity between new individuals and existing solutions, effectively avoiding redundant solutions; during the evaluation phase, the feature subset corresponding to each individual is input into the XGBoost model for training and testing, with MSE and 1 − R2 serving as two objectives, while feature count is considered as the third objective; finally, the population is stratified and filtered based on non-dominated sorting and crowding distance, retaining elite individuals with optimal trade-off characteristics. Experimental results demonstrate that this method successfully reduces feature dimensionality from 25 to 7 (as shown in Table 6) while significantly improving the prediction accuracy of smart meter cluster failure rates (MSE: 0.0049 → 0.0042, R2: 0.6638 → 0.7228).
Further comparative experiments show that, when compared to traditional filter, wrapper, and embedded feature selection methods, the proposed algorithm demonstrates clear advantages in prediction accuracy.
The proposed method reduces feature dimensions from 25 to 7 through feature selection, significantly lowering computational complexity and enabling efficient execution on low-power edge devices (e.g., Raspberry Pi, Jetson Nano). It supports Docker containerized deployment for seamless integration with utility edge computing platforms. Feature compression (25→7 dimensions) reduces cloud storage requirements by 72% per meter per day. All seven selected features are sourced directly from standard utility databases, eliminating additional data collection needs and enabling plug-and-play integration with existing systems without modification.
These results validate the effectiveness and superiority of the proposed method for smart meter group failure rate prediction tasks. While the current study focuses on optimizing three key objectives (MSE, R2, and feature count), future extensions of this work could productively incorporate additional optimization targets. However, such expansions would require careful algorithmic reconsideration because NSGA-II algorithm exhibits degraded performance when handling more than three objectives.

Author Contributions

Conceptualization, Y.L.; Methodology, Y.L.; Software, Y.L.; Validation, Y.L.; Formal analysis, X.X.; Investigation, X.X.; Resources, X.X.; Data curation, Z.Z. and W.L.; Writing – original draft, Y.L.; Writing – review & editing, X.X. and W.L.; Visualization, Z.Z.; Supervision, W.L.; Project administration, W.L. All authors have read and agreed to the published version of the manuscript.

Funding

This research received no external funding.

Data Availability Statement

No additional data available.

Conflicts of Interest

The authors declare no conflicts of interest. The funders had no role in the design of the study; in the collection, analyses, or interpretation of data; in the writing of the manuscript; or in the decision to publish the results.

References

  1. Bibek, K.B.; Shiv, N.Y.; Shivam, K.; Sadhan, G. IoT Based Smart Energy Meter for Efficient Energy Utilization in Smart Grid. In Proceedings of the 2018 2nd International Conference on Power, Energy and Environment, Shillong, India, 1–2 June 2018; pp. 1–5. [Google Scholar]
  2. Tomasz, T.W. Who is Smart? Smart Metering and Billing System for Prosumer Microgrids With New-Type Multi-Source Energy Meters. In Proceedings of the 2024 IEEE 12th International Conference on Smart Energy Grid Engineering (SEGE), Oshawa, ON, Canada, 18–20 August 2024; pp. 47–51. [Google Scholar]
  3. Sreedevi, S.V.; Prasannan, P.; Jiju, K.; Indu, L.I.J. Development of Indigenous Smart Energy Meter Adhering Indian Standards for Smart Grid. In Proceedings of the 2020 IEEE International Conference on Power Electronics, Smart Grid and Renewable Energy (PESGRE2020), Cochin, India, 2–4 January 2020; pp. 1–5. [Google Scholar]
  4. Chen, M.; Zhang, Y.; Zou, Y.; Xin, R.; Zhang, L.Y.; Gao, C.; Lin, H. A Medium-Voltage Stealing Type Detection Method Based on Robust Regression and Convolutional Neural Network. Power Syst. Technol. 2024, 48, 4729–4738. [Google Scholar]
  5. Yuan, B.; Liu, H.; Ge, S.Y. Optimal Construction Method for Advanced Metering Infrastructure of Power Grid Based on Multi-Dimensional Compressed Sensing. Autom. Electr. Power Syst. 2024, 48, 167–176. [Google Scholar]
  6. Santosh, K.; Suneetha, K.; Amandeep, G. Utilization of IoT and Smart Meters for Energy Management. In Proceedings of the 2023 International Conference on Power, Energy, Environment and Intelligent Control (PEEIC), Greater Noida, India, 19–23 December 2023; pp. 1254–1258. [Google Scholar]
  7. Tan, H.Y.; Yao, H.J.; Huang, Y.; Wang, H.; Zhao, Z.; He, Y. Temperature-Controlled Smart Energy Meter Field Calibration System Based on Measurement Risk Rating. In Proceedings of the 2019 3rd International Conference on Smart Grid and Smart Cities (ICSGSC), Berkeley, CA, USA, 25–28 June 2019; pp. 60–64. [Google Scholar]
  8. Xie, L.T.; Ma, Y.B.; Yang, L.; Zhou, L.H.; Ren, M.; Shu, Q.Q. Construction for Power Meter Condition Inspection Function. Electron. Meas. Technol. 2017, 40, 65–70. [Google Scholar]
  9. Luo, Q.; Liu, C.Y.; Zhang, J.A.; Zhang, J.; Wang, S.K.; Ge, L.J. Online Platform Development and Evaluation Indexes of State Inspection for Smart Meter. Electr. Meas. Instrum. 2017, 54, 94–99, 111. [Google Scholar]
  10. Liu, C.Y.; Liu, Z.F.; Luo, Q.; Ge, L.J.; Deng, W.; Wang, Y. A Comprehensive Evaluation and Trend Prediction Method of Health Degree for Electric Energy Measuring Devices. Power Syst. Prot. Control 2018, 46, 47–53. [Google Scholar]
  11. Cai, H.; Chen, H.; Ye, X.; Zhang, X.; Wen, H.; Li, J.; Guo, Q. An Online State Evaluation Method of Smart Meters Based on Information Fusion. IEEE Access 2019, 7, 163665–163676. [Google Scholar] [CrossRef]
  12. Cai, H.; Qiao, S.S.; Yuan, J.; Chen, H.Q.; Li, J.; Pan, Y.Z. Information Fusion Based Dynamic Evaluation Model of Low-Voltage Smart Electricity Meter. Autom. Electr. Power Syst. 2020, 44, 206–214. [Google Scholar]
  13. Ma, J.; Tang, Q.; Duan, J.F.; Liu, J.; Han, M.; Yi, K.Y.; Teng, Z.S. Measurement Error Evaluation Model for Smart Meter Under High Dry Heat Environment. Proc. CSEE 2023, 43, 4581–4589. [Google Scholar]
  14. Ye, J.B.; Zhu, D.S.; Wang, Y.J.; Chen, Y.L.; Zhang, Y.S. Research on Intelligent Electric Energy Meter State Inspection Technology. Process Autom. Instrum. 2020, 41, 51–55. [Google Scholar]
  15. Li, X.S.; Gao, Y. State Assessment Method of Electricity Meter Based on Grey Correlation Analysis. Process Integr. Optim. Sustain. 2023, 7, 1149–1156. [Google Scholar] [CrossRef]
  16. Ying, C.Y.; Jie, D.; Feng, Z.; Ji, X.; Xiao, Y.H. Application of Variable Weight Fuzzy Analytic Hierarchy Process in Evaluation of Electric Energy Meter. In Proceedings of the 2017 IEEE 2nd Advanced Information Technology, Electronic and Automation Control Conference (IAEAC), Chongqing, China, 25–26 March 2017; pp. 1–5. [Google Scholar]
  17. Cheng, X.; Yu, M.; Liu, M.; Huang, R.; Xie, L.; Tan, H. Research on Comprehensive Performance Evaluation Method of Smart Energy Meter. In Proceedings of the 2018 3rd International Conference on Mechanical, Control and Computer Engineering (ICMCCE), Harbin, China, 14–16 September 2018; pp. 1–5. [Google Scholar]
  18. Chen, H.Q. Research on State Indicators and Modeling Method for Online Evaluation of Smart Meters. Master’s Thesis, China Jiliang University, Hangzhou, China, 2020. [Google Scholar]
  19. Peng, H.; Long, F.; Ding, C. Feature Selection Based on Mutual Information Criteria of Max-Dependency, Max-Relevance, and Min-Redundancy. IEEE Trans. Pattern Anal. Mach. Intell. 2005, 27, 1226–1238. [Google Scholar] [CrossRef]
  20. Han, Y.; Park, K.; Guan, D.; Halder, S.; Lee, Y. Topological Similarity-Based Feature Selection for Graph Classification. Comput. J. 2015, 58, 1884–1893. [Google Scholar] [CrossRef]
  21. Zhou, P.; Zhang, Y.; Ling, Z.; Yan, Y.; Zhao, S.; Wu, X. Online Heterogeneous Streaming Feature Selection Without Feature Type Information. IEEE Trans. Big Data 2024, 10, 470–485. [Google Scholar] [CrossRef]
  22. Taşkın, G.; Kaya, H.; Bruzzone, L. Feature Selection Based on High Dimensional Model Representation for Hyperspectral Images. IEEE Trans. Image Process. 2017, 26, 2918–2928. [Google Scholar] [CrossRef]
  23. Komeili, M.; Armanfard, N.; Hatzinakos, D. Multiview Feature Selection for Single-View Classification. IEEE Trans. Pattern Anal. Mach. Intell. 2021, 43, 3573–3586. [Google Scholar] [CrossRef] [PubMed]
  24. Castillo, C.F.C.; Coello, C.A. A Survey of Applications of Multi-Objective Evolutionary Algorithms in Biotechnology. In Proceedings of the 2024 IEEE Congress on Evolutionary Computation (CEC), Yokohama, Japan, 14–19 July 2024; pp. 1–8. [Google Scholar]
  25. Hong, W.; Chen, C.; Zhu, Z.; Tang, K. An Elite Archive-Assisted Multi-Objective Evolutionary Algorithm for mRNA Design. In Proceedings of the 2024 IEEE Congress on Evolutionary Computation (CEC), Yokohama, Japan, 14–19 July 2024; pp. 1–8. [Google Scholar]
  26. Hou, H.; He, Z.; Xiang, M.; Lu, Y.; Yang, J.; Huang, L.; Xie, C. Interval Multi-Objective Optimization for Low-Carbon Building Energy Management System Upon Deep Reinforcement Learning. IEEE Trans. Ind. Appl. 2025, 61, 2193–2202. [Google Scholar] [CrossRef]
  27. Yang, R.; Yi, Z.; Xu, Y.; Chen, G.; Yang, H.; Yi, R.; Li, T.; Shen, M.; Li, J.; Gao, H.; et al. Adaptive Multi-Objective Bayesian Optimization for Capacity Planning of Hybrid Heat Sources in Electric-Heat Coupling Systems of Cold Regions. IEEE Trans. Ind. Appl. 2025, 61, 4718–4729. [Google Scholar] [CrossRef]
  28. Zhang, Z.-X.; Chen, W.-N.; Shi, W.; Jeon, S.-W.; Zhang, J. An Individual Evolutionary Game Model Guided by Global Evolutionary Optimization for Vehicle Energy Station Distribution. IEEE Trans. Comput. Soc. Syst. 2024, 11, 1289–1301. [Google Scholar] [CrossRef]
  29. Gu, Y.-R.; Bian, C.; Li, M.; Qian, C. Subset Selection for Evolutionary Multiobjective Optimization. IEEE Trans. Evol. Comput. 2024, 28, 403–417. [Google Scholar] [CrossRef]
  30. Chen, W.; Ishibuchi, H.; Shang, K. Fast Greedy Subset Selection From Large Candidate Solution Sets in Evolutionary Multiobjective Optimization. IEEE Trans. Evol. Comput. 2022, 26, 750–764. [Google Scholar] [CrossRef]
  31. Buskulic, N.; Doerr, C. Maximizing Drift Is Not Optimal for Solving OneMax. Evol. Comput. 2021, 29, 521–541. [Google Scholar] [CrossRef]
  32. Li, T.; Meng, Y.; Tang, L. Scheduling of Continuous Annealing With a Multi-Objective Differential Evolution Algorithm Based on Deep Reinforcement Learning. IEEE Trans. Autom. Sci. Eng. 2024, 21, 1767–1780. [Google Scholar] [CrossRef]
  33. Xue, Y.; Tang, Y.; Xu, X.; Liang, J.; Neri, F. Multi-Objective Feature Selection With Missing Data in Classification. IEEE Trans. Emerg. Top. Comput. Intell. 2022, 6, 355–364. [Google Scholar] [CrossRef]
  34. Hua, Y.; Zhu, H.; Xu, Y. Multi-Objective Optimization Design of Bearingless Permanent Magnet Synchronous Generator. IEEE Trans. Appl. Supercond. 2020, 30, 1–5. [Google Scholar] [CrossRef]
  35. Li, Y.; Xie, Z.; Yang, S.; Ren, Z. A Novel Hybrid Multi-Objective Optimization Algorithm and Its Application to Designs of Electromagnetic Devices. IEEE Trans. Magn. 2025, 61, 1–4. [Google Scholar] [CrossRef]
  36. Li, Y.; Xie, Z.; Yang, S.; Ren, Z. A Hybrid Algorithm Based on NSGA-II and MOPSO for Multi-Objective Designs of Electromagnetic Devices. IEEE Trans. Magn. 2023, 59, 1–4. [Google Scholar] [CrossRef]
  37. Wang, Y.; van Stein, B.; Bäck, T.; Emmerich, M. A Tailored NSGA-III for Multi-objective Flexible Job Shop Scheduling. In Proceedings of the 2020 IEEE Symposium Series on Computational Intelligence (SSCI), Canberra, ACT, Australia, 1–4 December 2020; pp. 2746–2753. [Google Scholar]
  38. Wang, X.; Zhao, Y.; Tang, L.; Yao, X. MOEA/D With Spatial-Temporal Topological Tensor Prediction for Evolutionary Dynamic Multiobjective Optimization. IEEE Trans. Evol. Comput. 2025, 29, 764–778. [Google Scholar] [CrossRef]
  39. Xie, Y.; Yang, S.; Wang, D.; Qiao, J.; Yin, B. Dynamic Transfer Reference Point-Oriented MOEA/D Involving Local Objective-Space Knowledge. IEEE Trans. Evol. Comput. 2022, 26, 542–554. [Google Scholar] [CrossRef]
  40. Khajwaniya, K.K.; Tiwari, V. Satellite Image Denoising Using Wiener Filter With SPEA2 Algorithm. In Proceedings of the 2015 IEEE 9th International Conference on Intelligent Systems and Control (ISCO), Coimbatore, India, 9–10 January 2015; pp. 1–6. [Google Scholar]
  41. Liu, D.; Xu, X.; Ma, K.; Tao, L.; Suo, M. Fault Diagnosis Based on Fault Tree and Bayesian Network with Grey Optimization. In Proceedings of the 2022 34th Chinese Control and Decision Conference (CCDC), Hefei, China, 15–17 August 2022; pp. 1787–1792. [Google Scholar]
  42. Li, Y.; Wang, K.; Kang, Y.; Zhao, Y.; Bai, P. Board-level Functional Test Selection Based on Fault Tree Analysis. In Proceedings of the 2023 6th International Symposium on Autonomous Systems (ISAS), Nanjing, China, 12–14 May 2023; pp. 1–6. [Google Scholar]
  43. Wang, C.; Wang, L.; Chen, H.; Yang, Y.; Li, Y. Fault Diagnosis of Train Network Control Management System Based on Dynamic Fault Tree and Bayesian Network. IEEE Access 2021, 9, 2618–2632. [Google Scholar] [CrossRef]
  44. Q/GDW 10364-2020; Technical Specification for Single Phase Smart Electricity Meters. Ministry of Science and Technology, State Grid Corporation of China: Beijing, China, 2020.
  45. Saadatmand, H.; Akbarzadeh-T, M.-R. Many-Objective Jaccard-Based Evolutionary Feature Selection for High-Dimensional Imbalanced Data Classification. IEEE Trans. Pattern Anal. Mach. Intell. 2024, 46, 8820–8835. [Google Scholar] [CrossRef]
  46. Zhang, Z.; Yang, X.; Jia, X. Scale-Adaptive NN-Based Similarity for Robust Template Matching. IEEE Trans. Instrum. Meas. 2021, 70, 1–9. [Google Scholar] [CrossRef]
  47. Li, J.; Chen, R.; Huang, X.; Qu, Y. Development of Deep Residual Neural Networks for Gear Pitting Fault Diagnosis Using Bayesian Optimization. IEEE Trans. Instrum. Meas. 2022, 71, 1–15. [Google Scholar] [CrossRef]
  48. Ma, W.; Tan, L.; Feng, H.; Ma, S.; Cao, D.; Yin, C. A Data-Driven LSTM Soft Sensor Model Based on Bayesian Optimization for Hydraulic Pressure Measurement of Excavator. IEEE Sens. J. 2023, 23, 25749–25759. [Google Scholar] [CrossRef]
  49. Wei, L.; Sun, Y.; Diao, Q.; Xu, H.; Tan, X.; Fan, Y. State of Health Estimation of Lithium-Ion Batteries Based on Stacked-LSTM Transfer Learning With Bayesian Optimization and Multiple Features. IEEE Sens. J. 2024, 24, 37607–37619. [Google Scholar] [CrossRef]
Figure 1. Application Scenarios of Smart Meters.
Mathematics 13 02472 g001
Figure 2. Structure of smart meter.
Mathematics 13 02472 g002
Figure 3. Distribution of various fault types.
Mathematics 13 02472 g003
Figure 4. Fault Tree I.
Mathematics 13 02472 g004
Figure 5. Fault Tree II.
Mathematics 13 02472 g005
Figure 6. Condition features for smart meter group.
Mathematics 13 02472 g006
Figure 7. Optimization algorithm for feature selection proposed in this paper.
Mathematics 13 02472 g007
Figure 8. Evaluate each individual.
Mathematics 13 02472 g008
Figure 9. Distribution of operational durations.
Mathematics 13 02472 g009
Figure 10. Distribution of all fault types.
Mathematics 13 02472 g010
Figure 11. Model performance vs. N.
Mathematics 13 02472 g011
Figure 12. Occurrence Count of each feature in Pareto solutions.
Mathematics 13 02472 g012
Figure 13. Feature Pair Co-occurrence in Pareto Solutions.
Mathematics 13 02472 g013
Figure 14. MSE Comparison across methods.
Mathematics 13 02472 g014
Figure 15. R2 Comparison across methods.
Mathematics 13 02472 g015
Table 1. Expertise-based interference sources for smart meter operational status.
TestInterference Sources
Accuracy Teststemperature
External Influence Teststransient overvoltage, power supply quality, electromagnetic interference, temperature
Climatic Impact Testshigh temperature, low temperature, high humidity, sunlight radiation
Mechanical Testsmechanical shock, dust, thermal overload
Electrical Performance Testsovervoltage
Insulation Testsovervoltage
Tariff Control Security Testspower supply quality
Reliability Verification Teststemperature, humidity, operating hours
Table 2. The number of all features for smart meter group condition assessment.
NumberFeature
1–5Mean, standard deviation, skewness, kurtosis, and range of metering error at 1.0 power factor
6–10Mean, standard deviation, skewness, kurtosis, and range of metering error at 0.5 L power factor
11–15Mean, standard deviation, skewness, kurtosis, and range of daily timing error
16Urban area indicator (0 or 1)
17Overcurrent frequency (times/year)
18Power outage duration (hours)
19Distance to coastline (km)
20Manufacturer failure rate (%)
21Batch failure rate (%)
22Operating duration (year)
23Temperature (℃)
24Humidity (%RH)
25Undervoltage frequency (times/year)
Table 3. Bayesian search space and Bayesian optimizer parameters.
ParameterSearch Space
learning_rateReal (0.01, 0.3), log-uniform
max_depthInteger (3, 10)
n_estimatorsInteger (50, 300)
γReal (0, 5)
subsampleReal (0.6, 1)
colsample_bytreeReal (0.6, 1)
reg_alphaReal (0.001, 10), log-uniform
reg_lambdaReal (0.001, 10), log-uniform
n_iter50
CV folds5
Table 4. All individuals in the Pareto-optimal set.
InvidualFeaturesNMSER2
1[2, 5, 13, 14, 21, 22, 25]70.00430.7239
2[13, 14, 21, 22, 25]50.00590.7217
3[5, 21, 22, 25]40.00980.6425
4[21, 22, 25]30.01270.4759
5[21, 22]20.09480.1579
6[21]10.15480.0456
Table 5. Selected features.
NumberFeature
2Standard deviation of metering error at 1.0 power factor
5Range of metering error at 1.0 power factor
13Skewness of daily timing error
14Kurtosis of daily timing error
21Batch failure rate (%)
22Operating duration (year)
25Undervoltage frequency (times/year)
Table 6. Comparative analysis with other methods.
MethodsTop 7 FeaturesNMSE (95% CI)R2 (95% CI)
All featuresAll features250.0049 [0.0039, 0.0055]0.6638 [0.6595, 0.7560]
Proposed algorithm[21, 22, 25, 2, 13, 5, 14]70.0042 [0.0040, 0.0052]0.7228 [0.6485, 0.7458]
Mutual Information[22, 21, 12, 6, 1, 11, 15]70.0057 [0.0050, 0.0063]0.6329 [0.5955, 0.6759]
RFE[21, 24, 2, 1, 12, 15, 7]70.0080 [0.0078, 0.0081]0.4832 [0.4765, 0.4955]
SFS[21, 24, 25, 22, 7, 16, 2]70.0054 [0.0047, 0.0073]0.6543 [0.5279, 0.7008]
Lasso regression[21, 24, 23, 6, 2, 7, 10]70.0080 [0.0078, 0.0081]0.4869 [0.4821, 0.4963]
Disclaimer/Publisher’s Note: The statements, opinions and data contained in all publications are solely those of the individual author(s) and contributor(s) and not of MDPI and/or the editor(s). MDPI and/or the editor(s) disclaim responsibility for any injury to people or property resulting from any ideas, methods, instructions or products referred to in the content.

