Article

Development of an Optimal Novel Cascaded 1+TDFλ/PIλDμ Controller for Frequency Management in a Triple-Area Power Grid Considering Nonlinearities and PV/Wind Integration

by
Abdullah Hameed Alhazmi
1,
Ashraf Ibrahim Megahed
1,
Ali Elrashidi
1,2,* and
Kareem M. AboRas
1,*
1
Department of Electrical Power and Machines, Faculty of Engineering, Alexandria University, Alexandria 21544, Egypt
2
Electrical Engineering Department, University of Business and Technology, Jeddah 23435, Saudi Arabia
*
Authors to whom correspondence should be addressed.
Mathematics 2025, 13(18), 2985; https://doi.org/10.3390/math13182985
Submission received: 2 August 2025 / Revised: 27 August 2025 / Accepted: 12 September 2025 / Published: 15 September 2025
(This article belongs to the Section E: Applied Mathematics)

Abstract

Continuous decrease in inertia and sensitivity to load/generation fluctuation are significant challenges for present-day power networks. The primary reason for these issues is the increased penetration capabilities of renewable energy sources. An imbalanced load with significant power output has a substantial impact on the frequency and voltage characteristics of electrical networks. Various load frequency control (LFC) technologies are widely used to address these issues. Existing LFC approaches in the literature are inadequate in addressing system uncertainty, parameter fluctuation, structural changes, and disturbance rejection. As a result, the purpose of this work is to suggest a better LFC approach that makes use of a combination of a one plus tilt fractional filtered derivative (1+TDFλ) cascaded controller and a fractional order proportional–integral–derivative (PIλDμ) controller, which is referred to as the recommended 1+TDFλ/PIλDμ controller. Drawing inspiration from the dynamics of religious societies, including the roles of followers, missionaries, and leaders, and the organization into religious and political schools, this paper proposes a new application of the efficient divine religions algorithm (DRA) to improve the design of the 1+TDFλ/PIλDμ controller. A triple-area test system is constructed to analyze a realistic power system, taking into account certain physical restrictions such as nonlinearities as well as the impact of PV and wind energy integration. The effectiveness of the presented 1+TDFλ/PIλDμ controller is evaluated by comparing their frequency responses to those of other current controllers like PID, FOPID, 2DOF-PID, and 2DOF-TIDμ. The integral time absolute error (ITAE) criterion was employed as the objective function in the optimization process. Comparative simulation studies were conducted using the proposed controller, which was fine-tuned by three recent metaheuristic algorithms: the divine religions algorithm (DRA), the artificial rabbits optimizer (ARO), and the wild horse optimizer (WHO). Among these, the DRA demonstrated superior performance, yielding an ITAE value nearly twice as optimal as those obtained by the ARO and WHO. Notably, the implementation of the advanced 1+TDFλ/PIλDμ controller, optimized via the DRA, significantly minimized the objective function to 0.4704 × 10 4 . This reflects an approximate enhancement of 99.5 % over conventional PID, FOPID, and 2DOF-TIDμ controllers, and a 99 % improvement relative to the 2DOF-PID controller. The suggested case study takes into account performance comparisons, system modifications, parameter uncertainties, and variations in load/generation profiles. Through the combination of the suggested 1+TDFλ/PIλDμ controller and DRA optimization capabilities, outcomes demonstrated that frequency stability has been significantly improved.

1. Introduction

1.1. Background

Ensuring a reliable and stable power supply with acceptable quality for consumers is the main objective of all electrical services. However, the growing demand for electricity makes it difficult to maintain a balance between power generation and consumption [1]. This balance is achieved by managing both active and reactive power. For active power, the aim is to keep the grid frequency within a safe range, as deviations can harm electrical devices. Reactive power, on the other hand, ensures voltage remains within safe limits [2]. Essentially, an active power imbalance leads to frequency variations: when demand exceeds supply, frequency drops, and when supply surpasses demand, frequency rises [3]. Automatic generation control (AGC), also called load frequency control (LFC), continuously monitors system frequency and tie-line power flows, determining the necessary production adjustments in response to demand changes. AGC then modifies the generator set points to reduce the area control error (ACE) over time [4].

1.2. Literature Review

The literature review has been examined under three different categories: power system types, controllers, and optimization algorithms frequently used in power systems.

1.2.1. Power Grid Configurations

The key power systems examined in the literature include single-area power systems [5,6,7], linear [8,9,10,11] or nonlinear [12,13,14,15] multi-area systems, and deregulated power systems [16,17,18]. Additionally, each area within a power system may incorporate one or more traditional energy sources, such as a gas turbine or thermal power, or renewable energy sources (RESs) like hydropower, solar photovoltaic (PV) power, or wind turbine (WT) generators. Some systems also feature energy storage solutions like battery energy storage systems (BESS), flywheel energy storage systems (FESS), and fuel cell (FC)/electrolyzer units. Moreover, diesel or biogas generators are often employed to supplement production during off-grid micro-grid operations. The specific combinations of these power systems differ across countries and regions, depending on the distribution of resources

1.2.2. Controller Classification

The literature shows a variety of controllers employed for power system control, ranging from classical to intelligent methods. In load frequency control (LFC) studies, advanced approaches such as fuzzy logic control (FLC) [19,20], adaptive neuro-fuzzy inference system (ANFIS) [21,22], sliding mode control (SMC) [23,24], optimal control [25], and robust control [26] are commonly used. However, researchers have predominantly focused on proportional–integral (PI) [8,9,12,13] and proportional–integral–derivative (PID) [3,10,14,15,27] controllers due to their ease of implementation and widespread familiarity [28]. In recent years, fractional-order (FO) controllers have gained popularity in various engineering applications, demonstrating superior control performance compared to integer-order controllers. Key FO controllers include the tilt–integral–derivative (TID) and fractional-order proportional–integral–derivative (FOPID) controllers. TID-based power systems include dual-area hydro-thermal power systems [29], dual-area systems comprising solar, gas, wind turbine (WT), and biodiesel generators [30], frequency and voltage regulation with electric vehicle integration [31], systems with high penetration of renewable energy sources (RESs) [11], and dual-area four-unit thermal-gas systems [16]. Meanwhile, FOPID controllers have been applied in systems such as single-area multi-source power systems with renewables and battery/flywheel storage [5], dual-area systems incorporating PV and WT [32], dual-area systems with generation rate constraints (GRC) and governor dead band (GDB) nonlinearities [33], and triple-area single-unit power systems [34]. Recent advances in microgrid control have led to the development of sophisticated controller architectures that incorporate fractional-order and tilt-based elements. Notable examples include fractional-order TID controllers [35,36], enhanced modified TID designs [37], hybrid FOPI-PIDD2 structures [38], and tilt fractional-order integral–derivative controllers with integrated fractional filtering [39]. Advanced cascaded configurations have also emerged, such as TID-filter combined with 1+PI controllers (TIDN-(1+PI)) [40], cascaded PI-TID architectures [41], and intelligent fuzzy-tilt fractional-order integral–filtered derivative (FTIλDN) systems [42]. Furthermore, researchers have proposed fractional-order proportional tilt–integral–derivative plus one (FOPTID+1) controllers [43], sophisticated cascade arrangements combining TID with fractional-order proportional integral–derivative filters (cascaded TID-PIλDμN) [44,45], and hybrid tilt integral–derivative-fractional order proportional tilt–integral–derivative (TID-FOPTID) configurations [46]. These innovative control strategies collectively represent significant efforts to optimize AGC in complex microgrid environments containing diverse generation sources.

1.2.3. Types of Optimization Approaches

The performance of controllers largely depends on the correct tuning of their parameters. As a result, the literature shows a shift from traditional methods like Ziegler–Nichols or Cohen–Coon to artificial intelligence optimization algorithms for parameter tuning. Given the variety of optimization algorithms available, researchers are constantly seeking those with superior tuning capabilities. In this regard, various algorithms have been employed to tune the parameters of PID, TID, and FOPID controllers, including the bacteria foraging optimization algorithm (BFOA) [8], firefly algorithm (FA) [12], differential evolution algorithm (DE) [9,14], hybrid particle swarm optimization-pattern search (hPSO-PS) [13], whale optimization algorithm (WOA) [15], teaching–learning-based optimization algorithm (TLBO) [10], hunger games search optimizer (HGSO) [32], genetic algorithm (GA) [34], levy flight and fitness distance balance-based coyote optimization algorithm [47], wild horse optimizer (WHO) [48], salp swarm algorithm (SSA) [34], non-dominated sorting genetic algorithm-II (NSGA-II) [27], multi-objective grasshopper optimization algorithm (MOGOA) [5], and mother optimization algorithm (MOA) [49].

1.3. Motivations

Load frequency control (LFC) issues are a critical topic in electrical engineering. A poorly functioning LFC system can lead to significant frequency and tie-line power deviations, which may result in electricity supply disruptions and damage to electrical equipment. Key reasons for employing LFC include regulating frequency, monitoring load demands, achieving zero steady-state error for frequency and tie-line power deviations, and ensuring acceptable settling time and overshoot in these deviations. According to the literature, most studies on LFC systems use PI/PID controllers. While these controllers perform well in power systems with linear and simple structures, their effectiveness diminishes as the system’s size grows and nonlinearities increase. Intelligent control methods have also been explored for power system control, but they face drawbacks due to high computational demands, implementation challenges, and the need for expert knowledge. Recently, there has been growing interest in fractional-order (FO) controllers, such as TID and FOPID, though research on modifying these types of controllers is still limited. In many simulations, nonlinearities are often overlooked, but they must be addressed in real-world applications. Therefore, studies on controlling power systems with nonlinearities using simple yet effective controllers in simulation environments are essential. For instance, in [50], a second-order integer-based derivative term was added to a PID controller for high-performance LFC in a triple-area single-unit interconnected power system, yielding successful results. However, the potential impact of adding a fractional-calculus-based extra derivative term to fractional-calculus-based TID controllers remains worth investigating. It is well known that increasing tuning parameters and incorporating fractional calculus into controllers enhances their performance. Thus, by adding an extra derivative term, the FO-based TID controller, already benefiting from a tilt compensator, is expected to improve its time-domain characteristics. This approach combines the advantages of TID and FOPID controllers with an additional fractional derivative term, leading to enhanced performance.
In this paper, we propose a 1+ tilt fractional filtered derivative (1+TDFλ) cascaded with fractional-order proportional–integral–derivative (PIλDμ), referred to as the 1+TDFλ/PIλDμ controller, to enhance the control performance of a triple-area multi-source power system, taking into account physical constraints such as nonlinearities, in addition to the dynamic impact of PV and wind power integration on the examined system.

1.4. Primary Contributions and Paper Organization

Under the umbrella of the previously mentioned motivations, the detailed contributions of this study can be listed as follows:
i.
Developing a novel controller design called 1+TDFλ/PIλDμ for frequency and tie-line power regulation in a triple-area power system.
ii.
An evolutionary socio-economic optimization algorithm, known as the divine religions algorithm (DRA) [51], is employed for the first time to optimize the parameters of the proposed controller in the context of LFC.
iii.
The effectiveness of the DRA algorithm in solving the LFC problem is thoroughly investigated and benchmarked against two recent metaheuristic optimizers: the artificial rabbits optimizer (ARO) [52] and the wild horse optimizer (WHO) [53].
iv.
The performance of the proposed 1+TDFλ/PIλDμ controller is comprehensively evaluated through a comparative analysis with conventional and advanced controllers, including PID [3], FOPID [5], 2DOF-PID [54,55], and 2DOF-TIDμ [10] controllers.
v.
Validating the superiority of the proposed 1+TDFλ/PIλDμ controller over the other compared ones under realistic conditions involving system nonlinearities, stochastic load disturbances, and high-penetration stochastic RESs such as PV and wind power.
vi.
Validating the robustness of the presented 1+TDFλ/PIλDμ controller by testing its performance under significant variations in system parameters, demonstrating its adaptability to practical power system uncertainties.
The structure of this paper is organized as follows: Section 2 describes the power system utilized in the study. Section 3 outlines the controller design methodology, the problem formulation, and the implementation of the divine religions algorithm (DRA). Section 4 presents the simulation results under various scenarios. Section 5 offers concluding remarks and summarizes the key findings of the study. Finally, Section 6 outlines the limitations of our study and suggests directions for future research.

2. The Investigated Triple-Area System Model

This case study focuses on a triple-area interconnected power system comprising three thermal generating units with distinct dynamic and control parameters, thereby forming an unequal system. Each area includes detailed subsystems such as the governor, turbine, generation, and load sections. To assess the effectiveness and robustness of the proposed control strategy, renewable energy sources are integrated into the system—specifically, a photovoltaic (PV) unit in Area 1 and a wind farm in Area 2. The overall structure of the system is depicted in Figure 1, where the dynamic behavior of each subsystem is represented using transfer function models. The system also incorporates key nonlinearities to reflect real-world operational conditions. These include the generation rate constraint (GRC), governor dead band (GDB), and commutation time delays (CTDs).
The GRC limits the rate of change of the governor valve position, and is typically expressed as
d P g o v ( t ) d t ± G R C m a x
where P g o v ( t ) denotes the governor output (per unit power), and G R C m a x is the maximum permissible rate of change.
The GDB defines the range of frequency deviation Δ f i within which no corrective governor action is taken by the turbine control valve, typically represented by the absolute amplitude of sustained speed variations that fail to elicit a corresponding valve movement. It is formulated as
Δ P g o v i ( t ) = 0 ,   i f   | Δ f i | G D B 1 R i · ( | Δ f i | G D B ) ,   i f   | Δ f i | > G D B
where Δ f i depicts the frequency deviation in area i , G D B denotes the dead band width, and R i is the droop setting for area i .
In this study, both GRC and GDB are modeled at 3% [42], to capture their practical impact on generator response without excessively complicating the system dynamics. Moreover, the parameters of the system, as illustrated in Figure 1, are defined as follows:
1.
Governor Dynamics:  T G 1 , T G 2 , T G 3 represent the time constants of the governors in Areas 1, 2, and 3, respectively. For this study, their values are taken as 0.08 s, 0.06 s, and 0.07 s.
2.
Turbine Dynamics:  T T 1 , T T 2 , T T 3 denote the turbine time constants. The values used in this study are 0.4 s, 0.44 s, and 0.3 s, respectively.
3.
Reheat Turbine Parameters:  K R 1 , K R 2 , K R 3 are the gains, and T T 1 , T T 2 , T T 3 are the time constants of the reheat turbine components. The gains are set to 0.6, 0.7, and 0.5, while the corresponding time constants are 12 s, 14 s, and 10 s, respectively.
4.
Generation and Load Dynamics:  T P 1 , T P 2 , T P 3 and K P 1 , K P 2 , K P 3 are the time constants and gains associated with the generation-load subsystems in each area. The time constants are taken as 20 s, 22 s, and 24 s, while the gains are set to 105 Hz/P.U MW, 100 Hz/P.U MW, and 120 Hz/P.U MW, respectively.
Additional control and system interconnection parameters include the following:
  • Frequency Bias Factors:  B 1 , B 2 , B 3 , which influence the sensitivity of each area’s frequency control mechanism. Their values are taken as 0.3483 P.U MW/Hz, 0.3827 P.U MW/Hz, and 0.3692 P.U MW/Hz, respectively.
  • Droop Settings:  R 1 , R 2 , R 3 , which determine the governor response to frequency deviations. The respective values used are 3 Hz/P.U MW, 2.73 Hz/P.U MW, and 2.82 Hz/P.U MW.
  • Tie-Line Synchronizing Coefficients:  T 12 , T 13 , T 23 , representing the coupling strength between the areas through tie-lines. Their values are taken as 0.2 P.U MW/rad, 0.3 P.U MW/rad, and 0.44 P.U MW/rad, respectively.
The dynamic behavior of the system is further described by frequency deviations F 1 , F 2 , F 3 for Areas 1, 2, and 3, respectively, and incremental changes in tie-line power flow denoted by P t i e 12 , P t i e 13 , P t i e 23 . The modeling details of the renewable energy sources (RES) units, specifically photovoltaic (PV) and wind energy systems, are comprehensively discussed in the following two subsections. These sections provide an in-depth explanation of the mathematical representations, and the output power from each unit, which is used to accurately capture the performance and variability of each RES.

2.1. Modelling of PV Unit

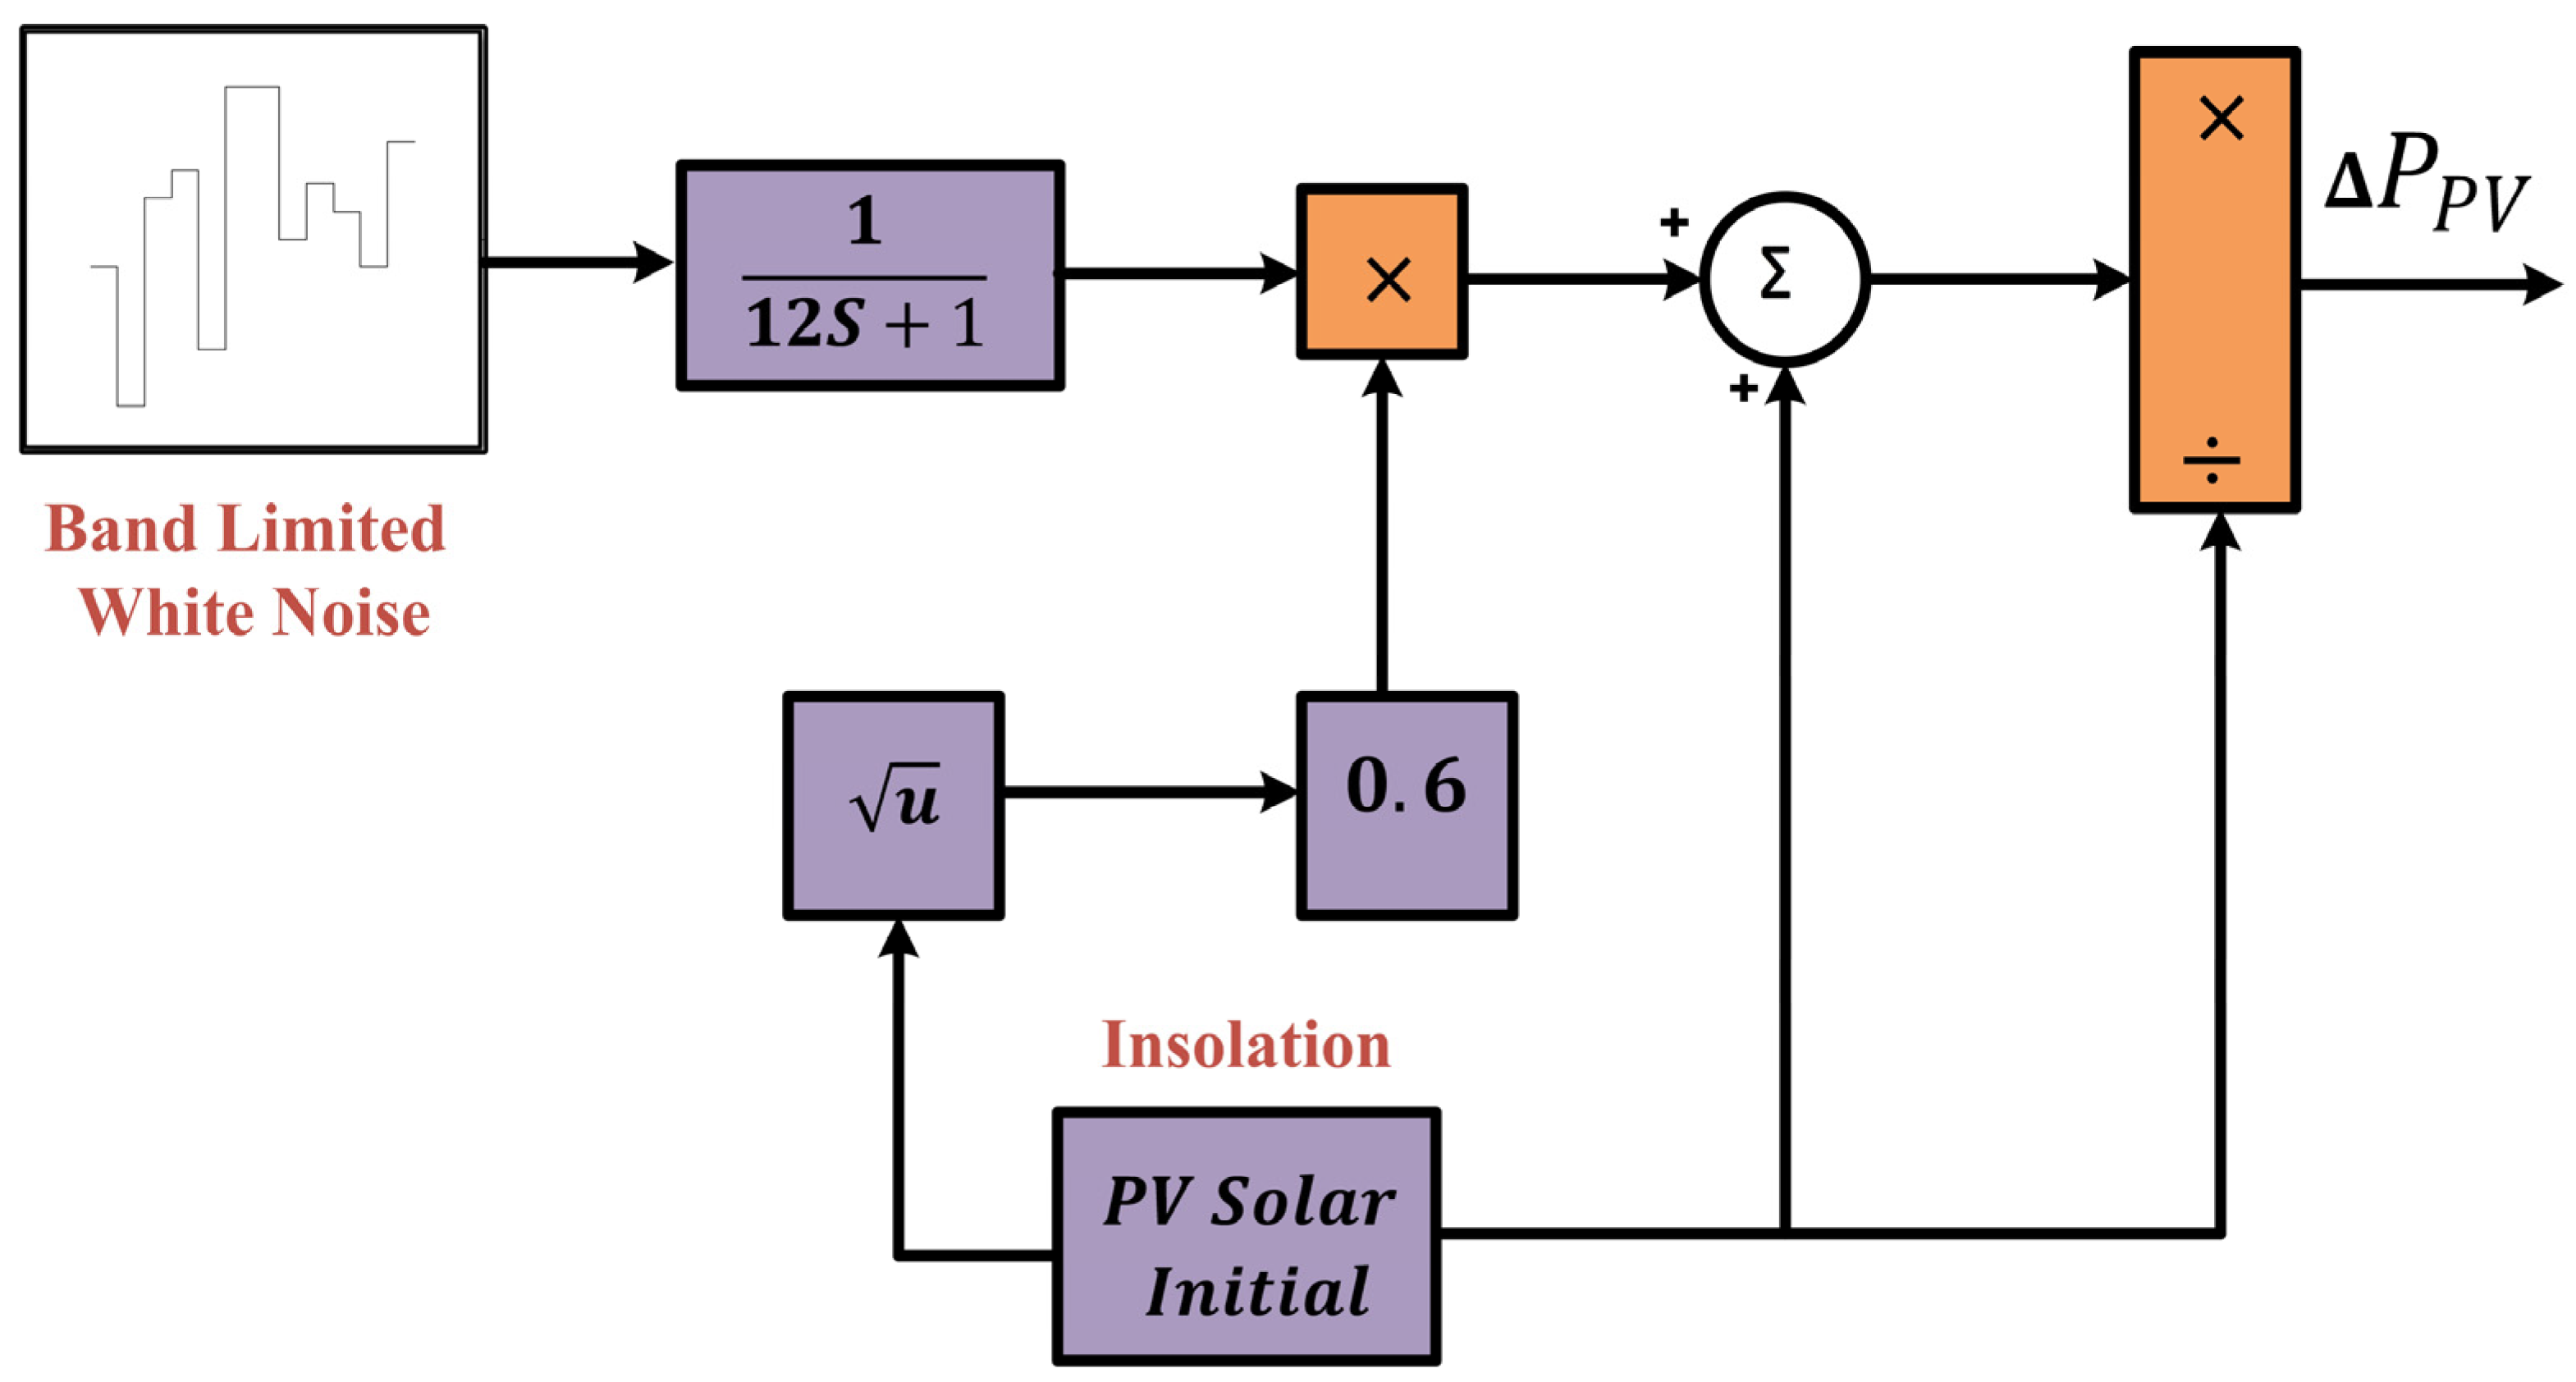
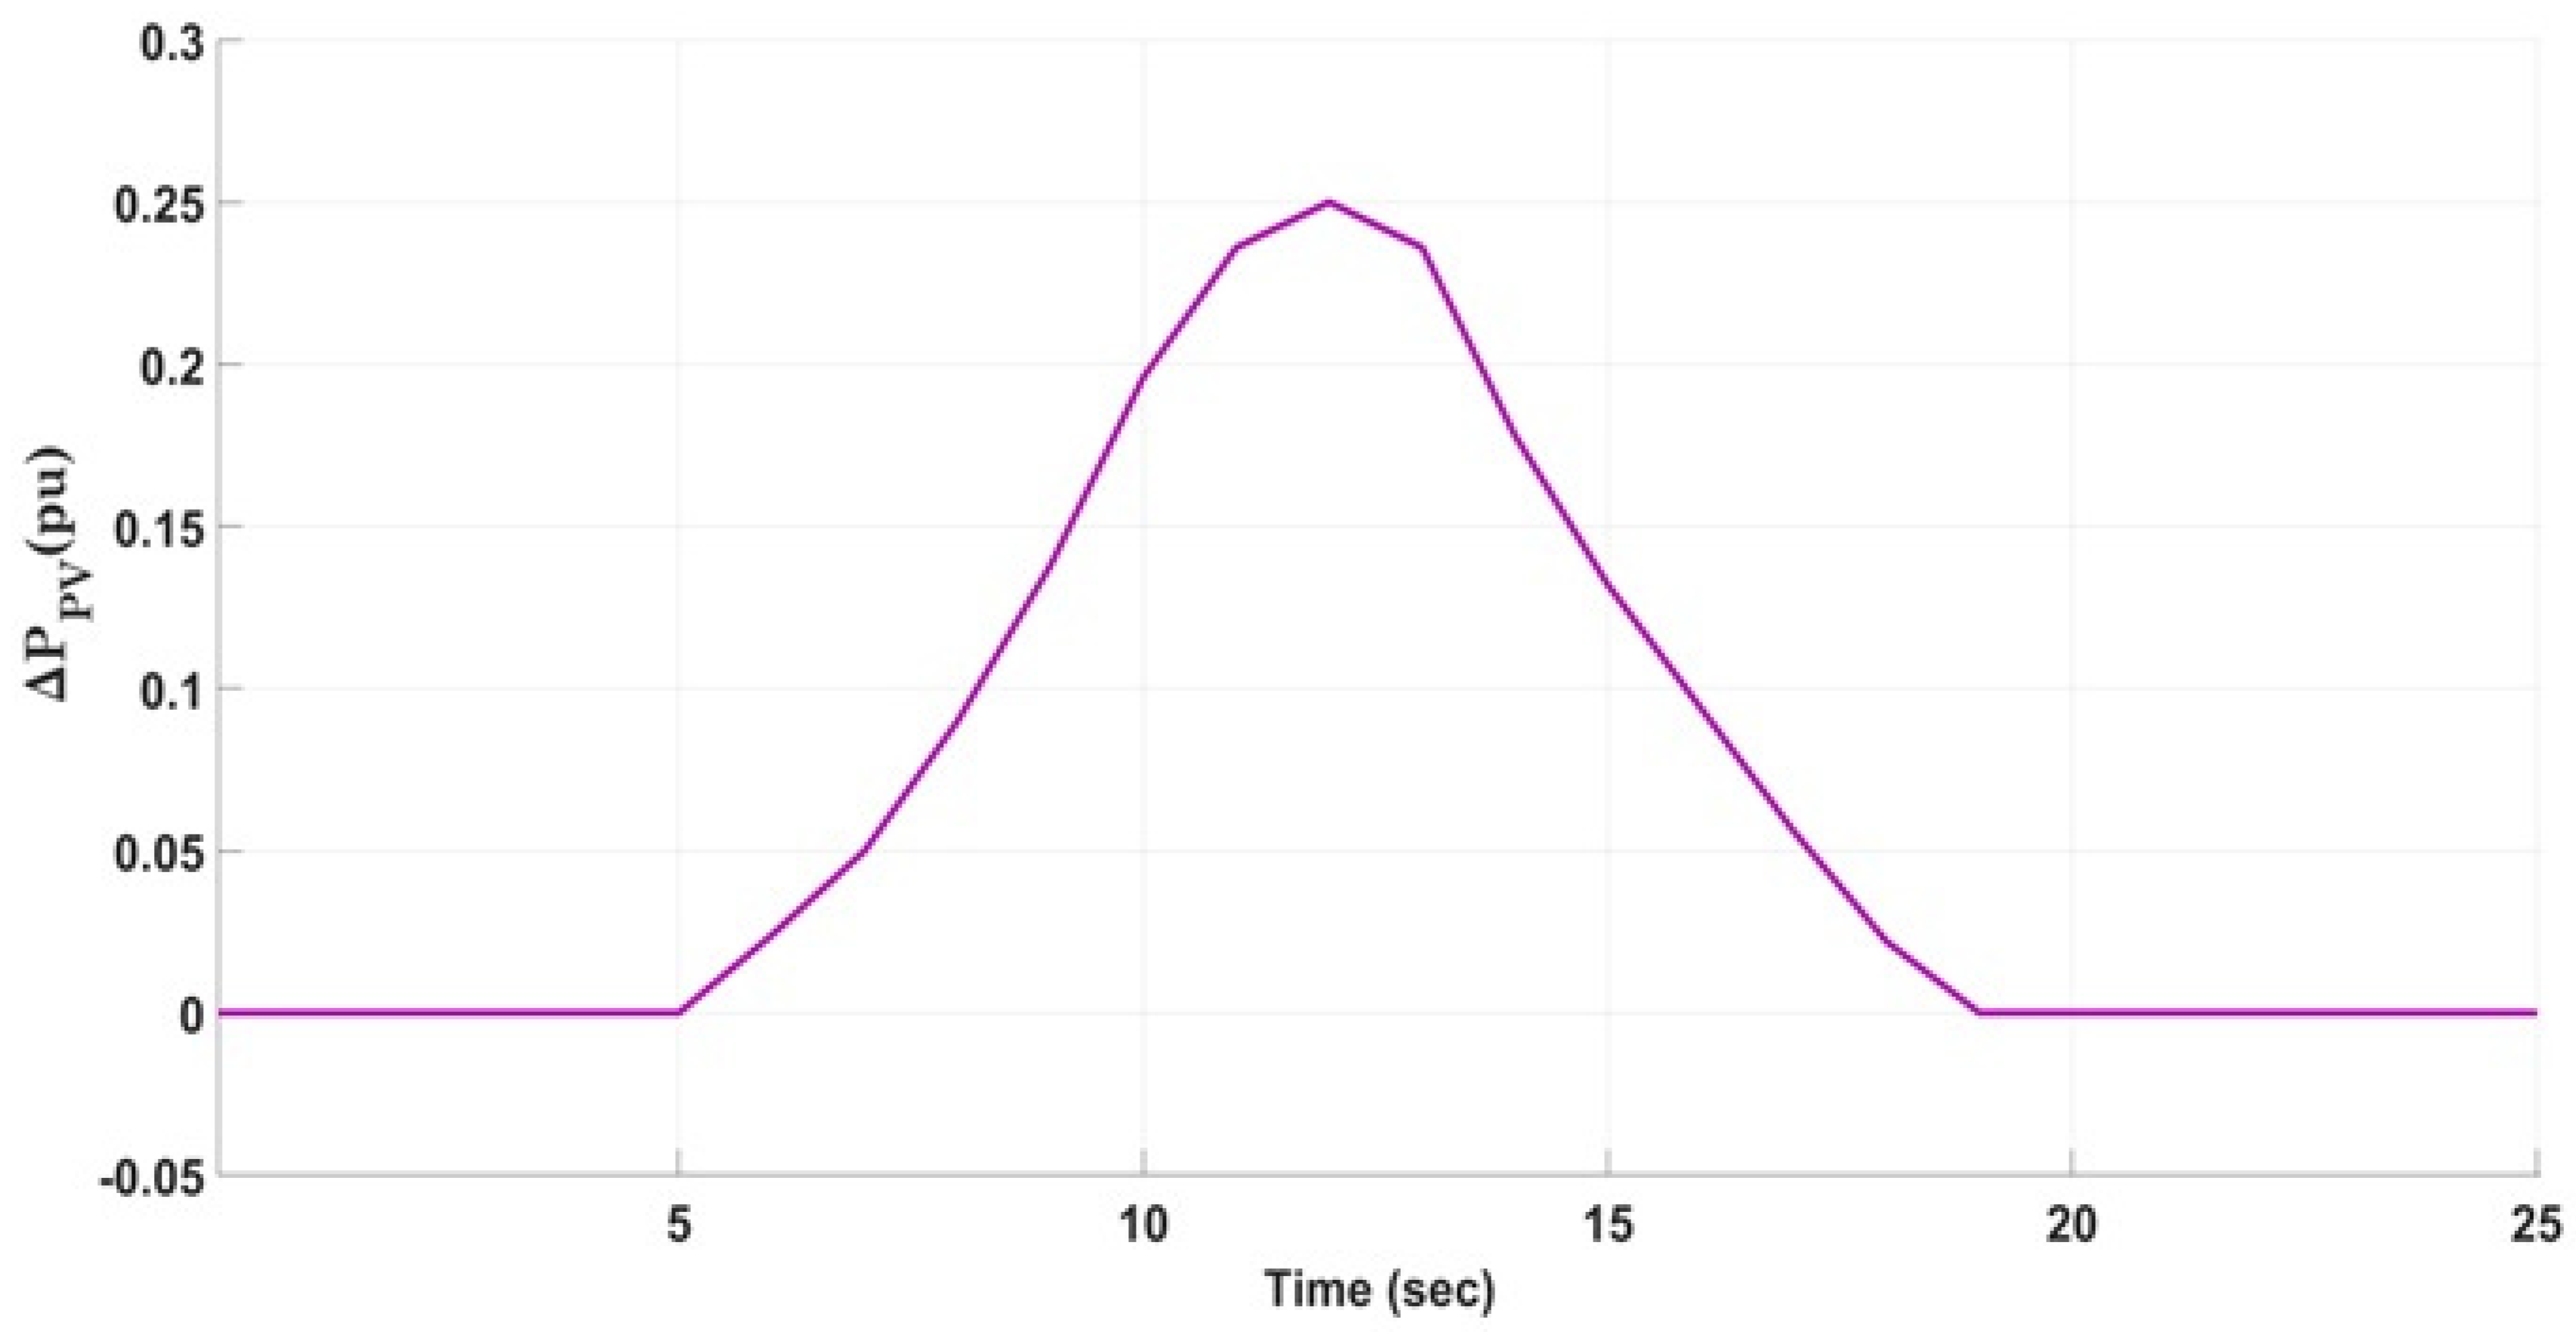
The variability in photovoltaic (PV) system output is largely influenced by changing weather conditions. As a result, frequency stability within the power system is at risk due to the significant fluctuations in frequency caused by inconsistent PV output power. Therefore, evaluating power fluctuations in solar PV systems must consider both uniform and non-uniform solar irradiance conditions. As shown in Figure 2 of the analyzed PV solar power system [38,45], a white noise block implemented in MATLAB/Simulink R2023b simulates the real-life variations in solar power output. To replicate these fluctuations, Equation (3) is employed to model the variable output power of the PV system. Figure 3 presents the resulting power output generated by the simulated PV model.
Δ P S o l a r = 0.6 P S o l a r

2.2. Modelling of Wind Unit

As seen in Figure 4, the white noise block employed inside the wind farm model in the MATLAB/Simulink framework functions just as a stochastic variable, which is augmented by the velocity of the wind flow. Figure 5 denotes the wind turbine’s changing power output. The equation below can be employed to ascertain the wind farm generation units’ output power [38,45].
P W = 1 2 ρ A T V W 3 C P λ , β
where P W represents the output power generated by the wind engine, ρ is the air density in kg / m 3 , A T is the rotor’s swept area in m 2 , V W is the speed of the wind in m / s , and CP is the blade parameter. The parameters of the turbine are C 1 through C 7 , and C P is computed using Equation (5).
C P λ , β = C 1 · C 2 λ I C 3 β C 4 β 2 C 5 . e C 6 λ I + C 7 λ T
where β denotes the pitch angle of the blade and λ T is the optimum tip speed ratio ( T S R ), which can be calculated utilizing Equation (6).
λ T = λ T O P = ω T · r T V W
where r T represents the rotor’s radius and λ I represents the discontinuous tip velocity ratio as resolved by the Equation (7). The normal wind farm generation unit parameters can be seen in Table A1.
1 λ I = 1 λ T + 0.08 β 0.035 β 3 + 1 λ T = λ T O P = ω T · r T V W

3. Problem Formulation and Mathematical Representations of Controllers and DRA

3.1. Explanation of the Fitness Function (FF)

In LFC systems, any disturbance in the power network primarily calls for two corrective actions: (1) restoring the system frequency to its nominal value by eliminating any frequency deviation, and (2) maintaining the scheduled power exchange across tie-lines between interconnected areas. To fulfil these objectives within an optimization framework, a suitable objective function must be formulated.
Numerous performance indices have been employed in the literature to quantify the system’s dynamic response and guide the tuning of LFC controllers. Among these indices are the integral of absolute error (IAE), integral of squared error (ISE), integral of time squared error (ITSE), and integral of time absolute error (ITAE). Among them, the ITAE criterion has been widely recognized as particularly effective due to its superior capability in minimizing settling time and suppressing long-term oscillations more effectively than IAE or ISE [56]. Additionally, ITSE-based regulators are known to produce relatively large control actions that contribute to fast tracking of setpoint changes but may lead to aggressive control behavior. Given its proven advantages in achieving faster settling time and smoother control response, the ITAE has been adopted in this study as the fitness function for optimizing the controller parameters of the test system illustrated in Figure 1. Specifically, in the context of LFC, the ITAE is computed by integrating the time-weighted sum of frequency deviations in each area and the incremental changes in tie-line power flows over the entire simulation period. The mathematical formulation of the fitness function (FF) is given as
F F = I T A E = 0   t s i m   i = 1 N A   t · f i ( t ) + j = 1 j i N A   t · P t i e i j ( t ) d t
where f i ( t ) denotes the frequency deviation in area i , P t i e i j ( t ) depicts the incremental change in tie-line power between area i and area j , N A stands for the total number of control areas, and t s i m represents the total simulation time. The optimization problem is subject to constraints defined by the permissible boundaries of the controller parameters.

3.2. The Examined Controllers’ Designs

In this part, the structures of the controllers compared in this study (i.e., PID, FOPID, 2DOF-PID, 2DOF-TIDμ, and the proposed 1+TDFλ/PIλDμ) are presented. The corresponding transfer functions and block diagram representations of each controller are provided. Furthermore, the implementation of the fitness function (ITAE) for each controller is described in detail in the subsequent subsections.

3.2.1. PID Controller

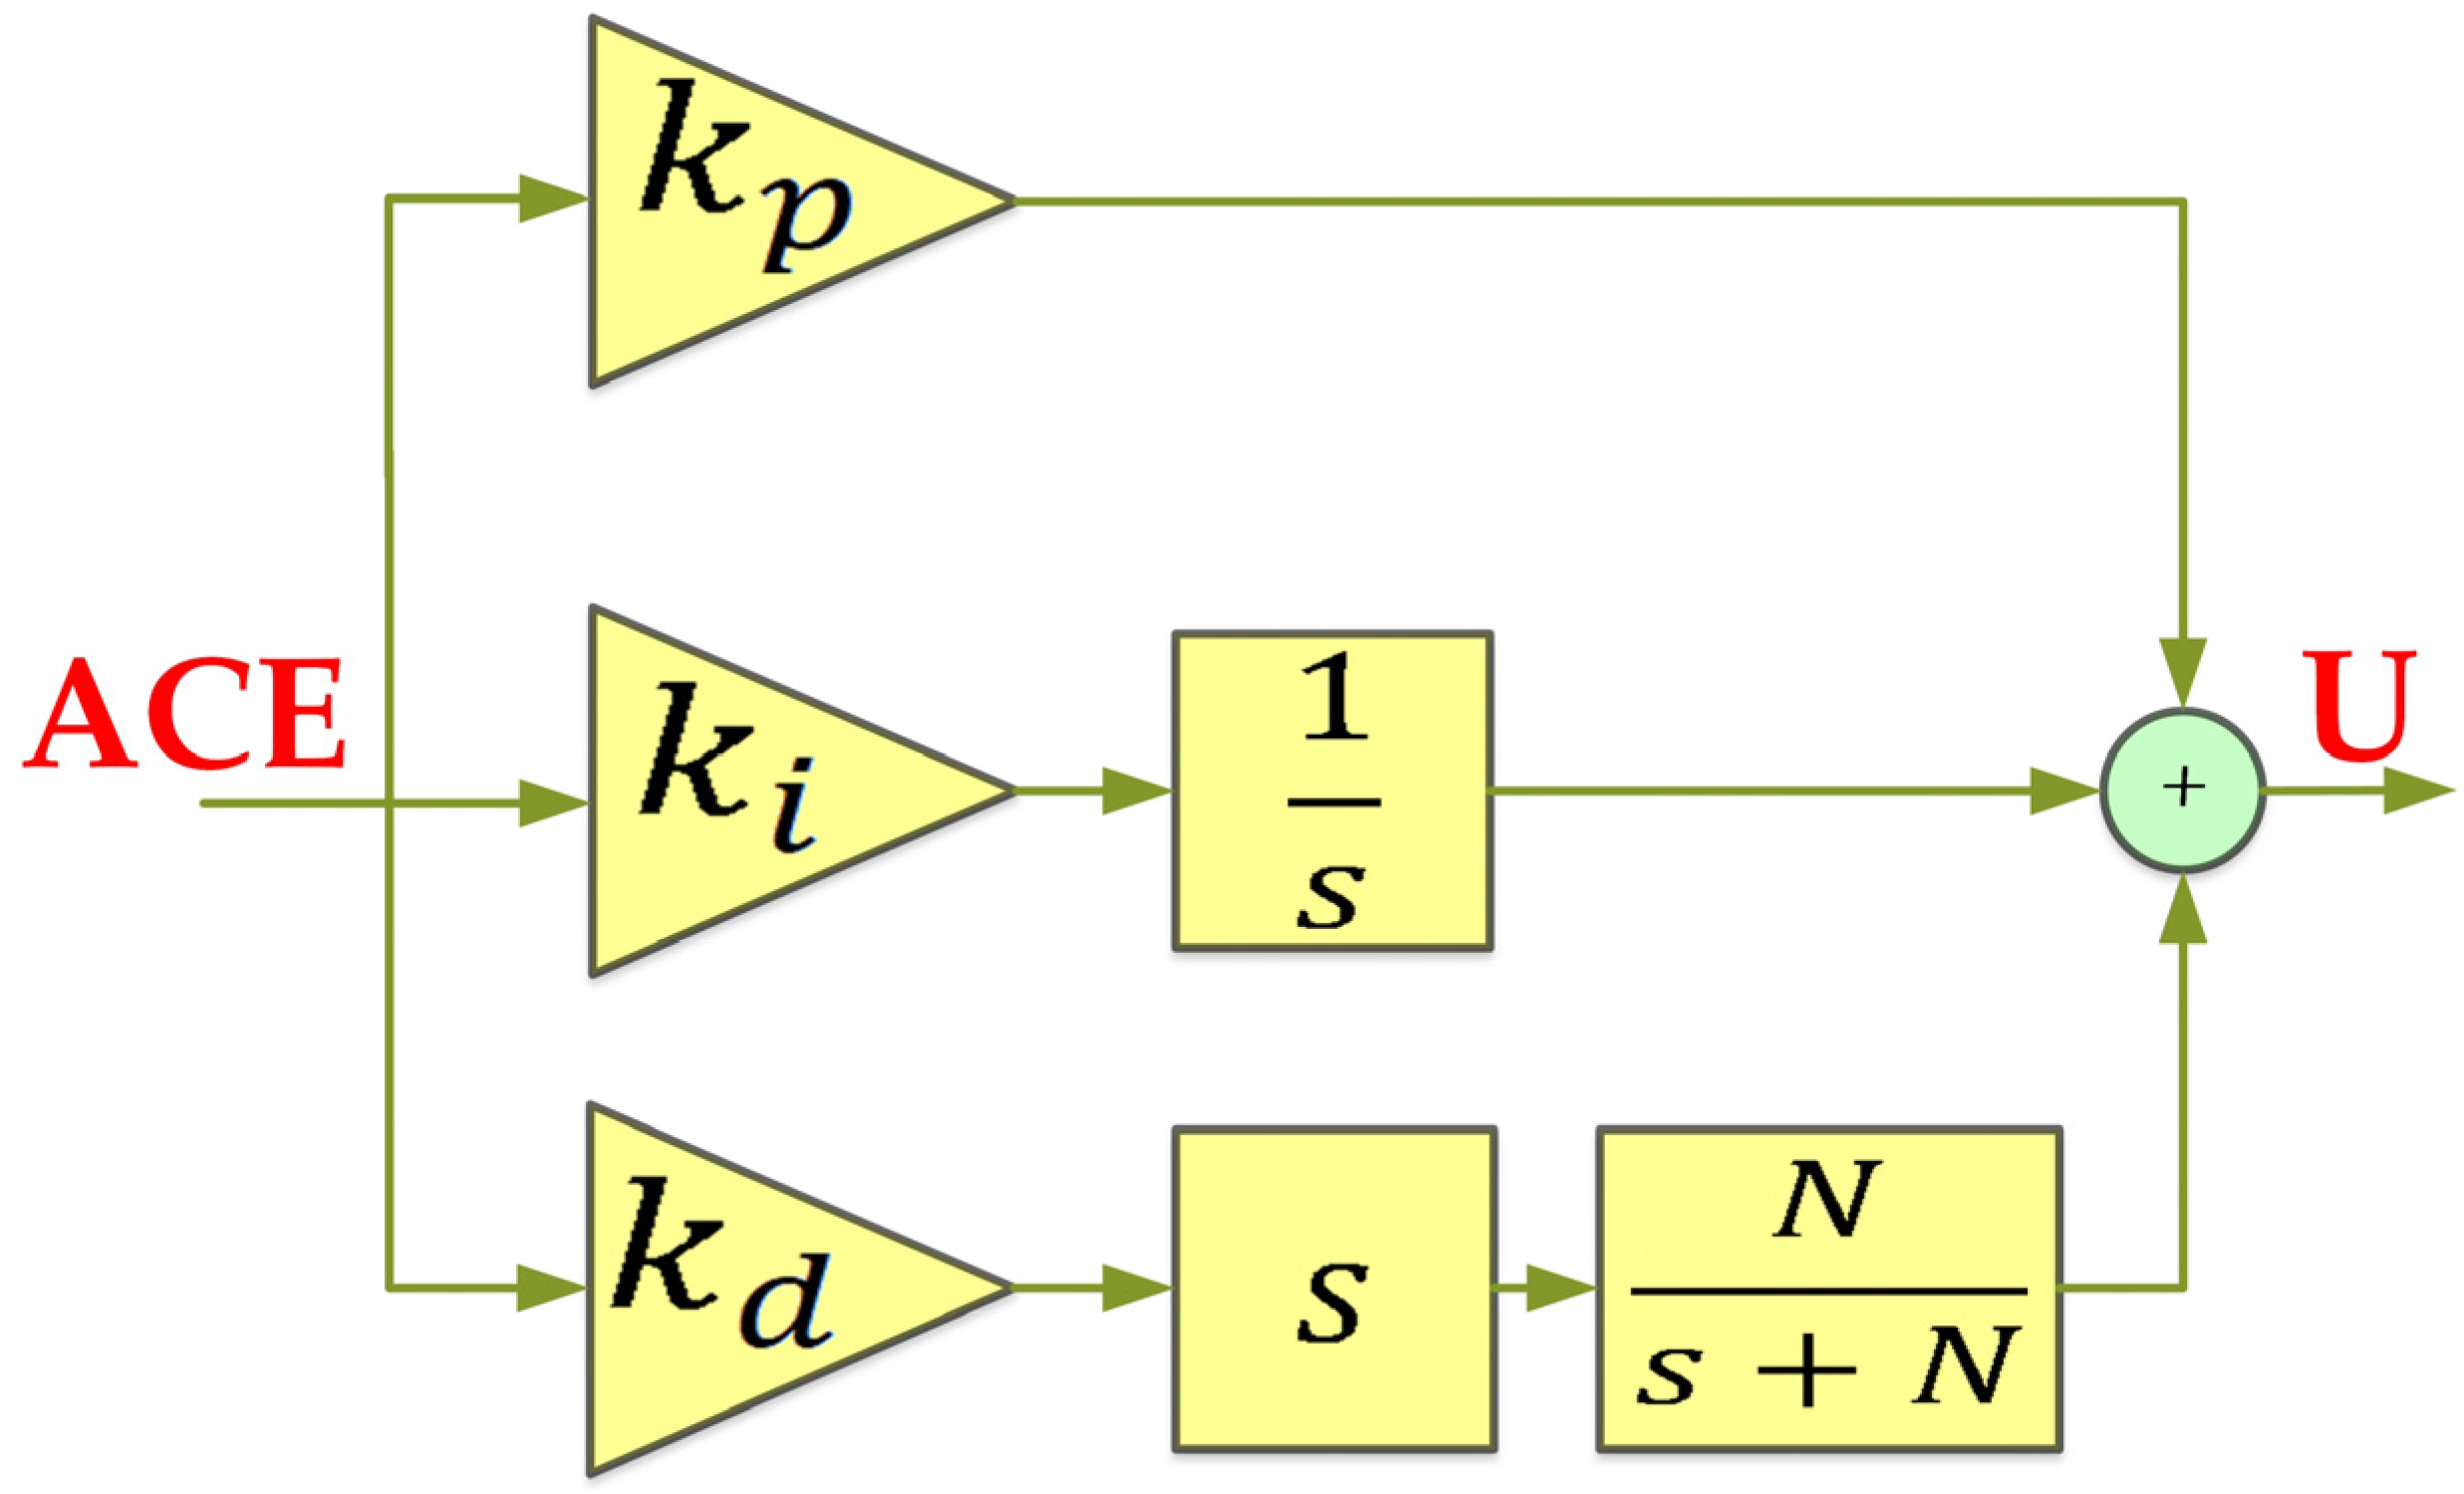
The proportional–integral–derivative (PID) controller is a fundamental control strategy widely used in industrial automation, power systems, and process control due to its simplicity, robustness, and ease of implementation [3]. It operates by continuously calculating the error signal as the difference between a desired reference value and the measured system output, and then applying corrective action based on proportional, integral, and derivative terms. To improve the practical implementation of the derivative action and reduce sensitivity to high-frequency measurement noise, the derivative term is typically filtered using a first-order low-pass filter. The block diagram of the PID controller is described in Figure 6. The Laplace domain representation of the PID controller with a filtered derivative is [10,15]
C { P I D } S = k p + k i S + k d S N S + N                    
where k p , k i , and k d stand for the proportional, integral, and derivative gains, respectively. N denotes the derivative filter coefficient, which defines the bandwidth of the filter applied to the derivative action. Tuning the PID controller involves selecting the four parameters ( k p , k i , k d , and N ) to achieve desired performance characteristics such as fast response, minimal overshoot, and reduced settling time. In our study, the target is to reduce f i ( t ) and P t i e i j ( t ) over time. The optimization problem based on ITAE as FF is formulated as follows:
M i n i m i z e   F F k p , k i , k d ,   N   s u b j e c t   t o :   0 k p 20 0 k i 20 0 k d 10 100 N 500        

3.2.2. FOPID Controller

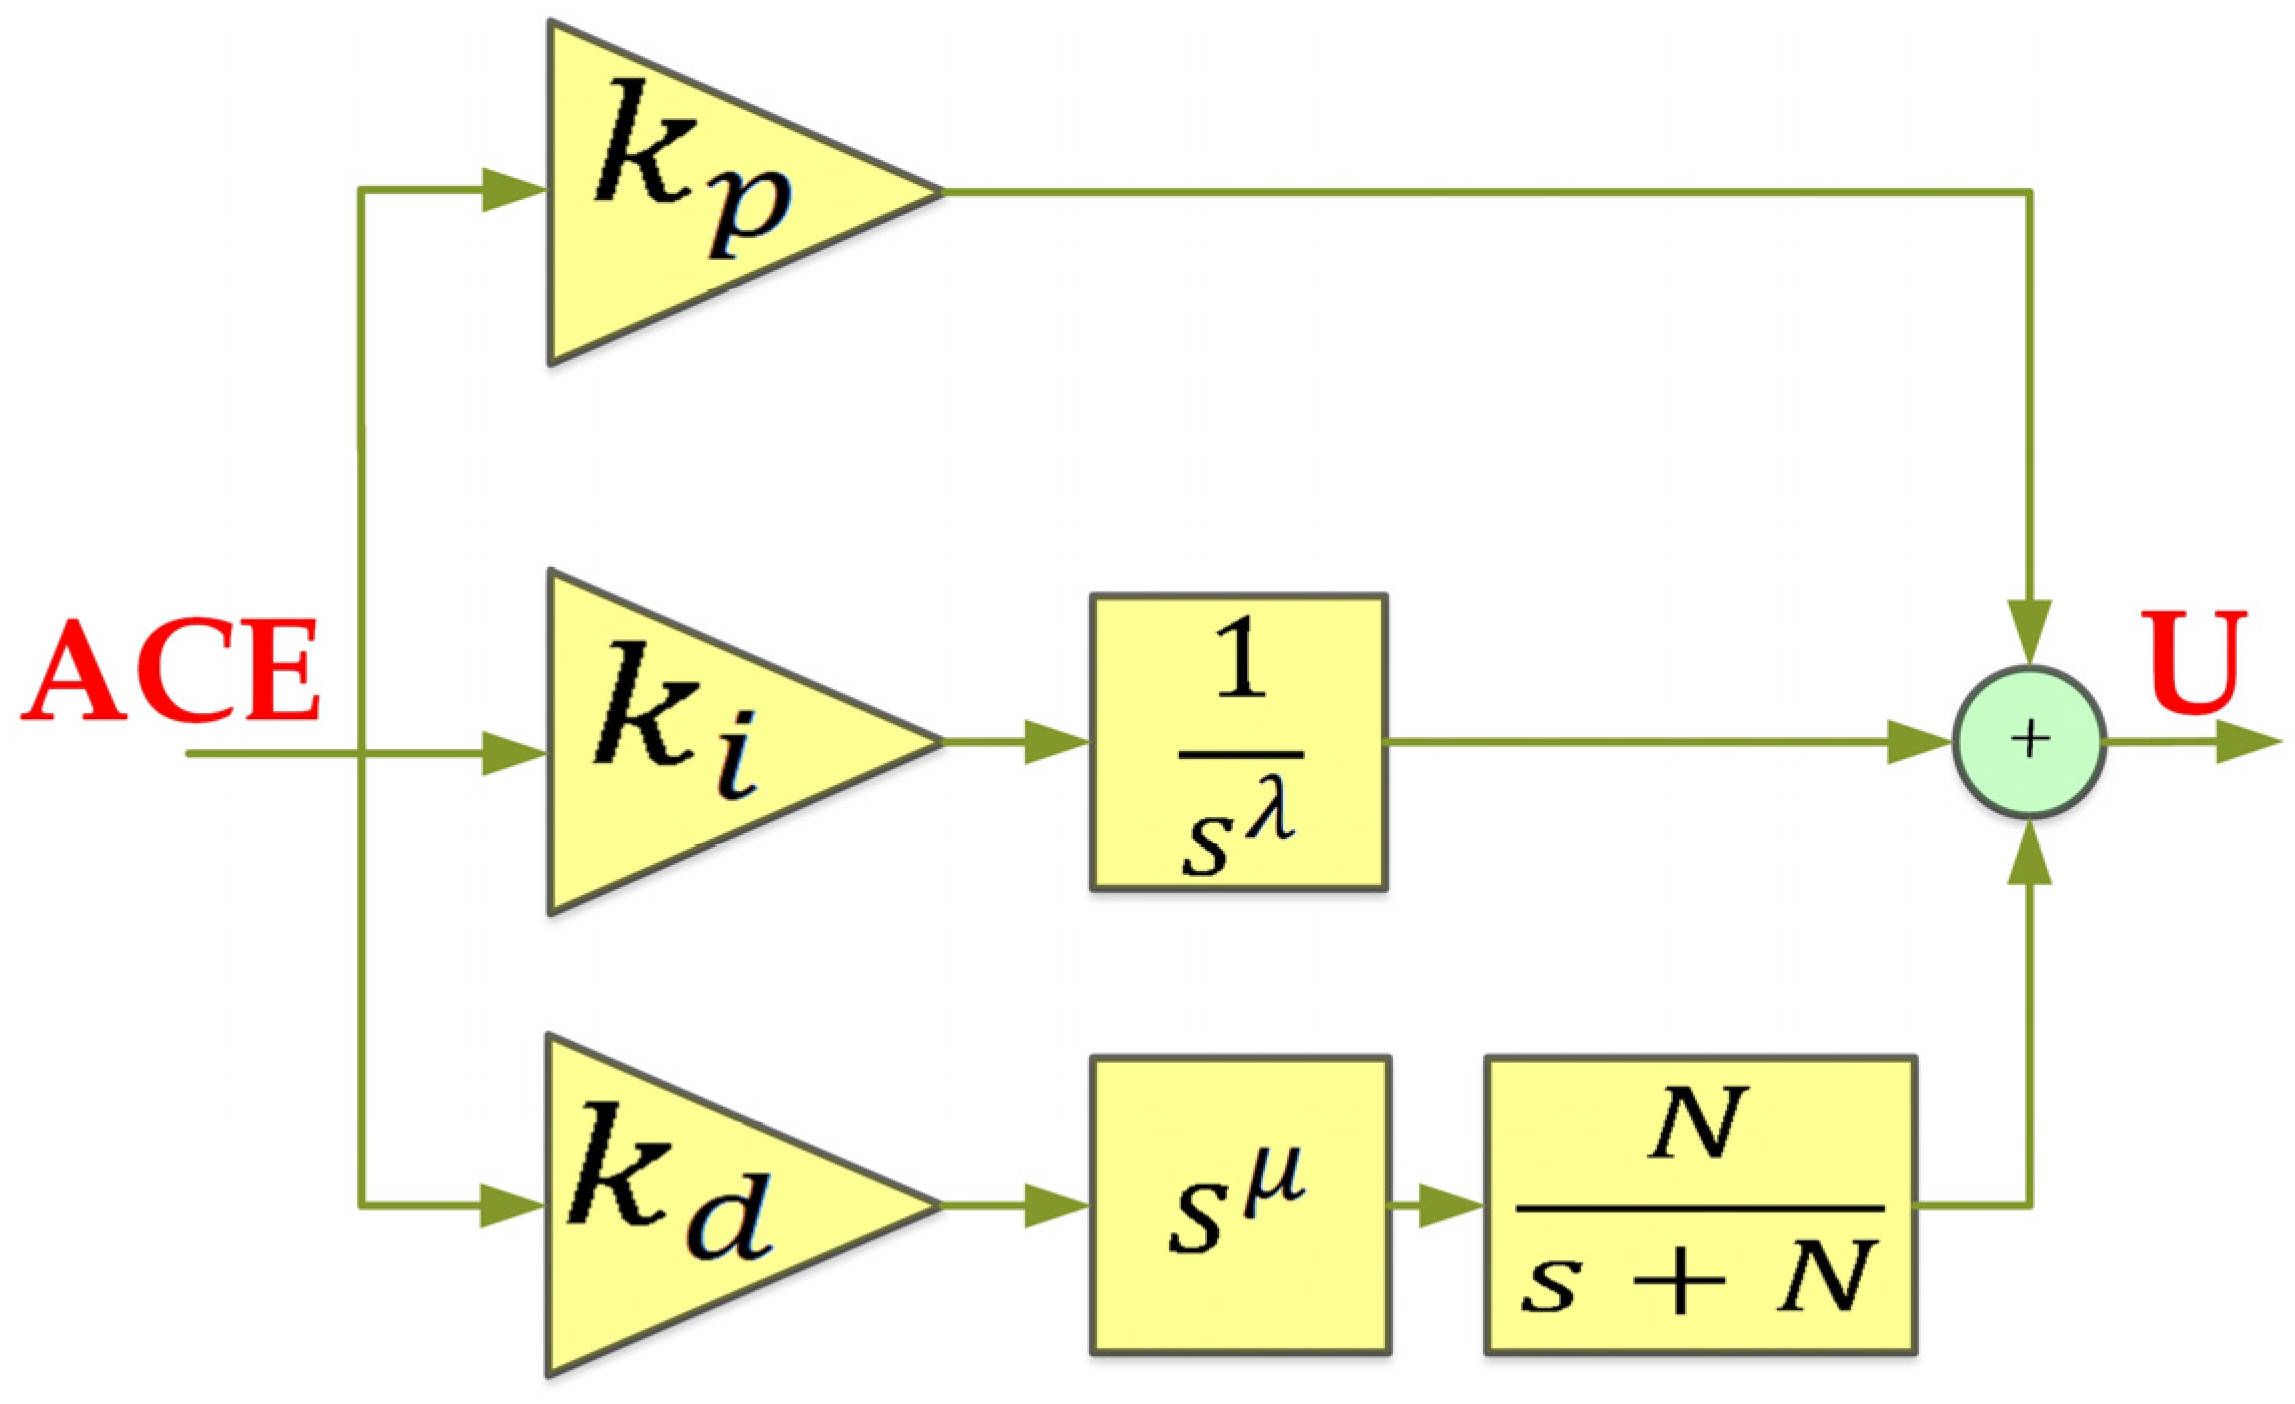
The fractional order proportional–integral–derivative (FOPID) controller offers several significant advantages over its classical counterpart. These include enhanced robustness, greater tuning flexibility, and improved tolerance to system parameter variations and external disturbances. Such features make the FOPID controller highly effective for maintaining stable and reliable control, even in systems with time-varying or uncertain dynamics. Furthermore, FOPID controllers generally exhibit superior steady-state accuracy and faster transient response compared to traditional PID controllers. The structural configuration of a FOPID controller is illustrated in Figure 7. Its mathematical representation is given by [5]:
C { F O P I D } S =   k p + k i S λ + k d S µ N S + N                    
In this formulation, λ and µ denote the fractional orders of integration and differentiation, respectively. These parameters expand the conventional PID tuning space, allowing for a more comprehensive optimization of controller performance [5]. To achieve optimal tuning, the design process can be formulated as a constrained optimization problem. F F k p , k i , k d , λ , µ ,   N   is minimized subject to the bounds on each design parameter as follows:
M i n i m i z e   F F k p , k i , k d , λ , µ ,   N   s u b j e c t   t o :   0 k p 20 0 k i 20 0 k d 20 0 λ 2 0 µ 2 100 N 500        

3.2.3. 2 DOF-PID Controller

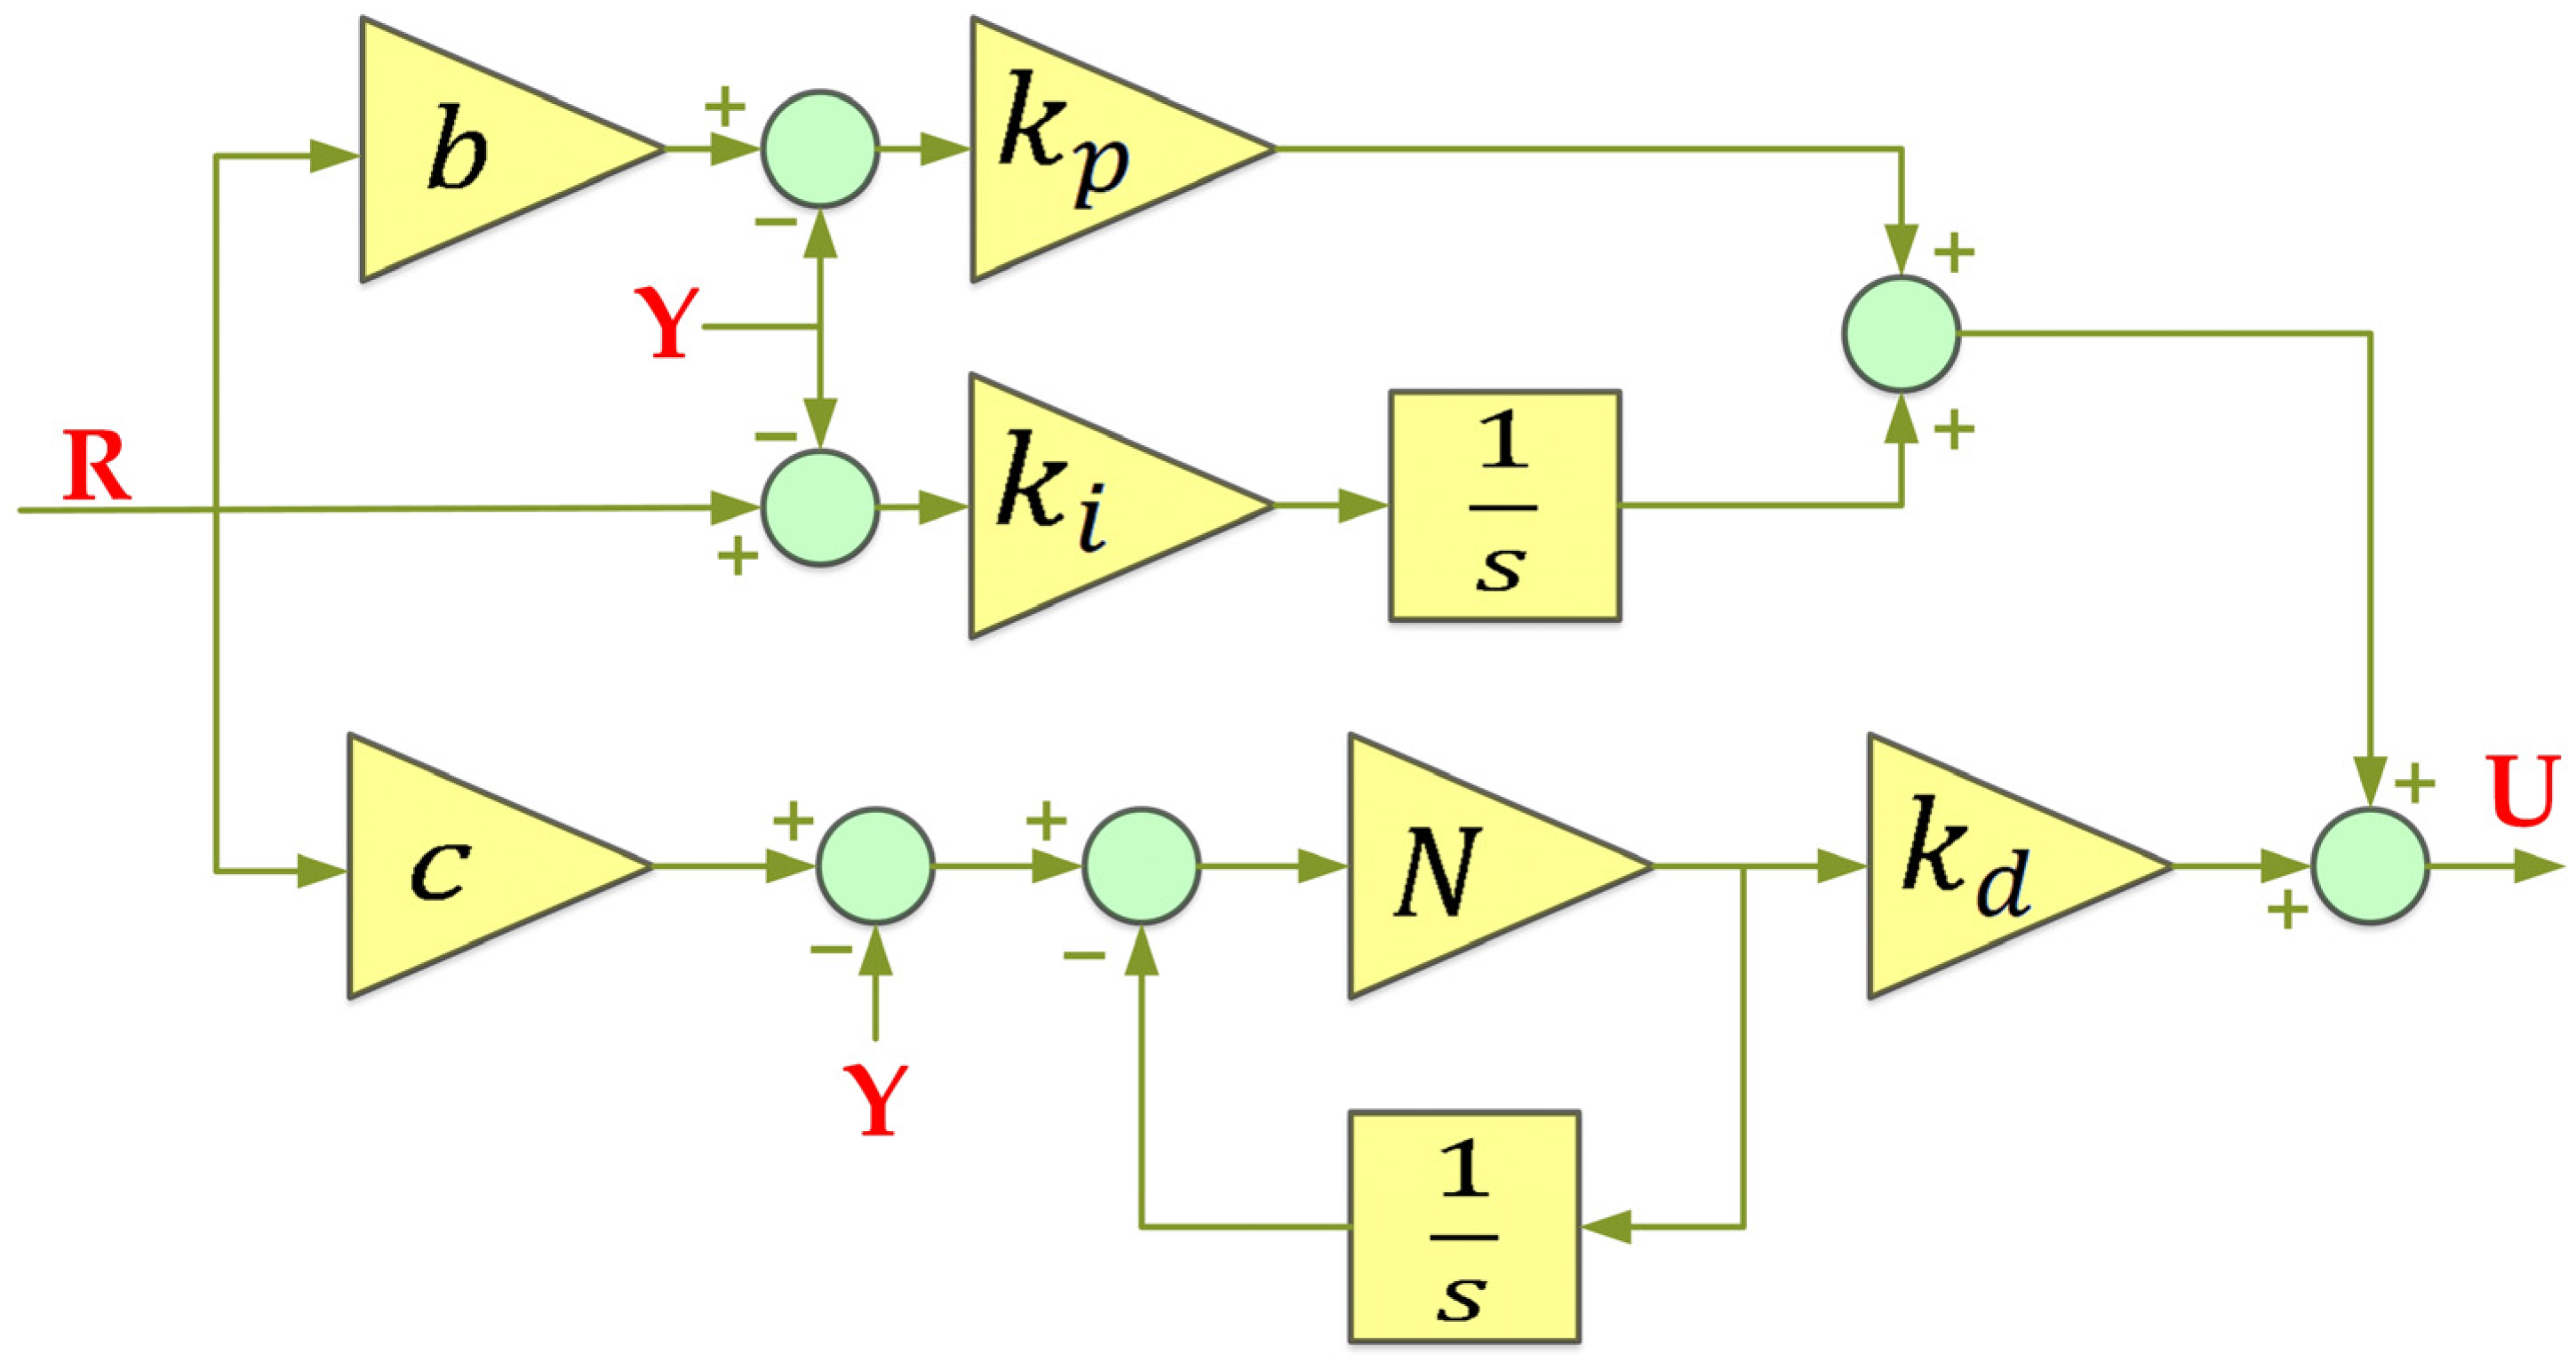
In control systems engineering, the term degree of freedom (DOF) refers to the number of independently tuneable closed-loop transfer functions within a control architecture. This concept serves as a key indicator of the system’s flexibility in achieving desired performance characteristics. Specifically, a control system with two degrees of freedom (2DOF) provides a distinct advantage over a single-degree-of-freedom (1DOF) system by allowing independent shaping of both reference tracking and disturbance rejection responses during the design phase. A 2DOF regulator can separately process the reference input and the feedback signal, enabling more refined control behavior. Upon detecting the deviation between the setpoint and the measured output, the 2DOF controller generates an actuation signal that better aligns the system’s response with the desired trajectory. The structure of a parallel 2DOF proportional–integral–derivative (2DOF-PID) controller is illustrated in Figure 8. In this diagram, R , Y , and U denote the reference input (setpoint), the measured system output, and the controller output, respectively. The mathematical formulation of the 2DOF-PID controller is given by the following expression [54,55]:
U { 2 D O F - P I D } S = k p b R Y + k i 1 S R Y + k d S N S + N   c R Y
Here, k p , k i , and k d stand for the proportional, integral, and derivative gains, respectively. The parameters b and c depict the proportional and derivative setpoint weights, and N denotes the filter coefficient used to avoid amplification of high-frequency noise in the derivative term. For optimal tuning of the 2DOF-PID controller parameters, an objective function is defined based on the minimization of frequency deviation and tie-line powers exchange between the three areas. The optimization problem is formulated as follows:
M i n i m i z e   F F k p , k i , k d , b , c ,   N   s u b j e c t   t o :   20 k p 20 20 k i 20 20 k d 20 2 b 2 2 c 2 100 N 500        

3.2.4. 2 DOF-TIDμ Controller

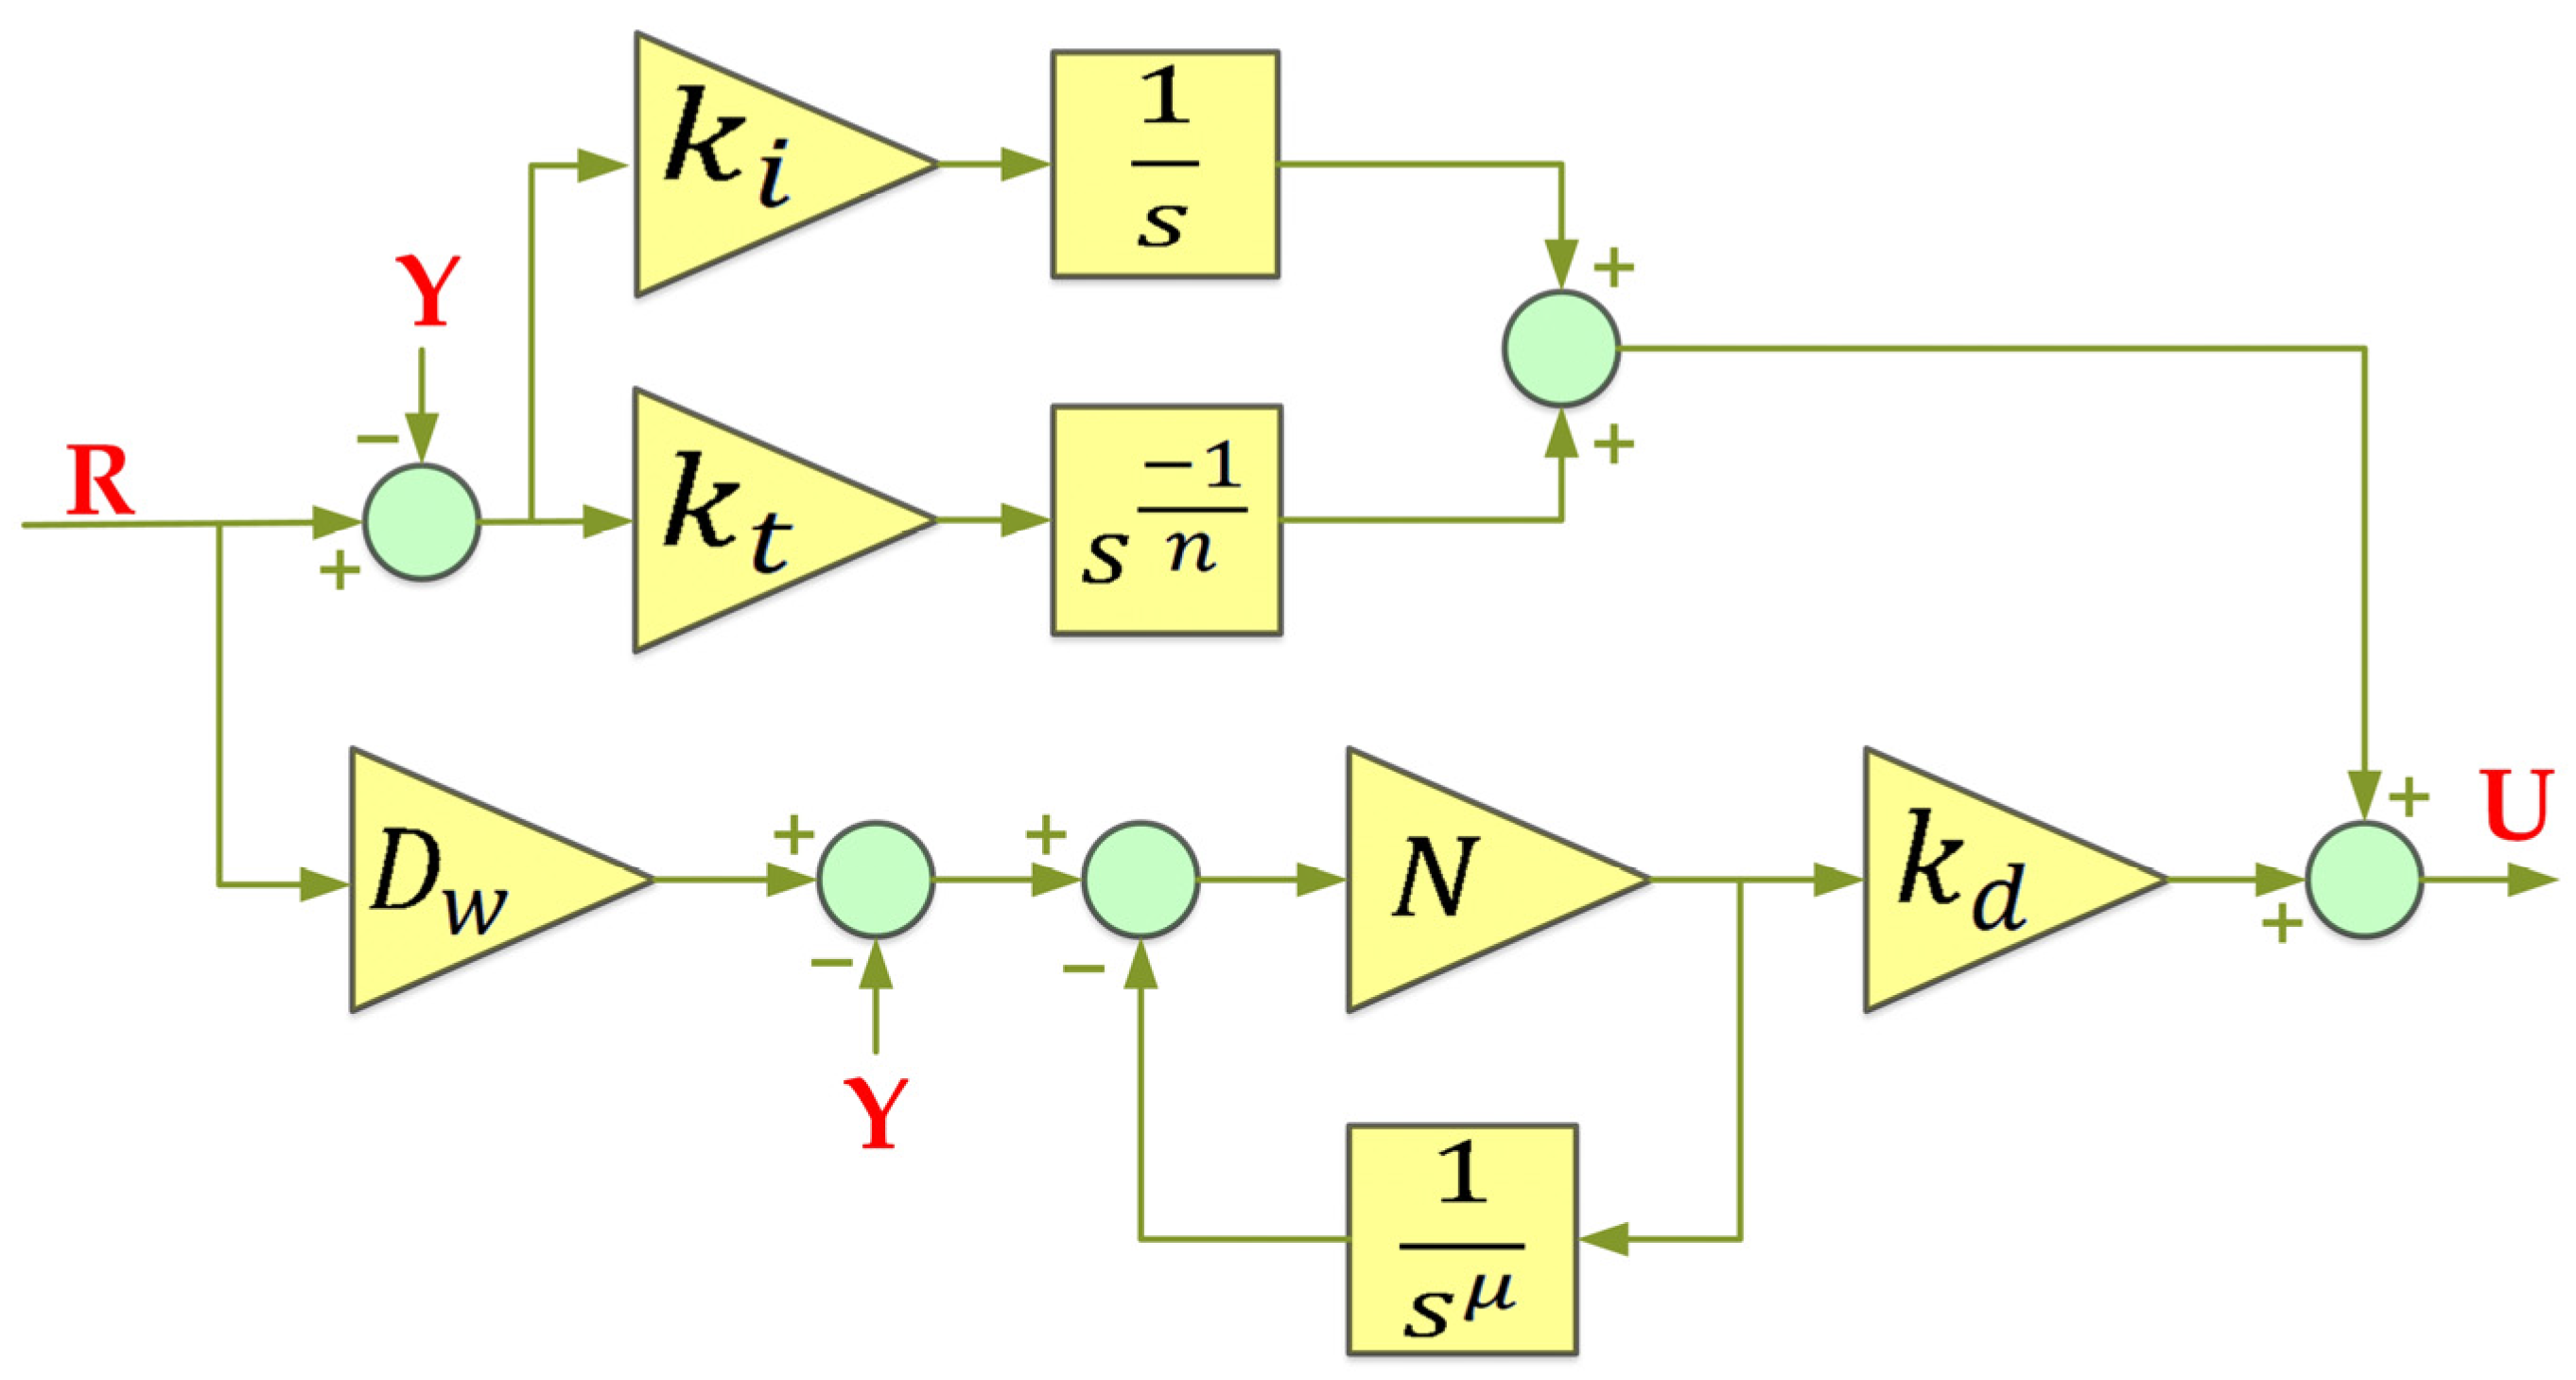
In the realm of advanced control strategies, the two-degree-of-freedom tilt–integral–derivative controller with a fractional derivative component (2DOF-TIDμ) emerges as a powerful alternative to classical controllers, offering enhanced flexibility and performance. Unlike the 2DOF-PID structure, the 2DOF-TIDμ controller involves seven parameters to be optimized ( k t ,   k i ,   k d ,   D w ,   n ,   N ,   μ ) introducing one additional tuning variable. This results in a slight trade-off between enhanced performance and increased computational complexity [10]. What distinguishes the 2DOF-TIDμ formulation is the incorporation of a tilt term instead of the conventional proportional component and the use of a fractional-order derivative operator, which introduces an additional degree of freedom through the non-integer order μ . As illustrated in Figure 9, the 2DOF-TIDμ controller takes in the setpoint (R) and measured output (Y) and computes a control signal (U) that robustly aligns the system’s behavior with the desired performance. The transfer function of the 2DOF-TIDμ controller is expressed as [10]
U { 2 D O F T I D μ } S = k t S 1 / n ( R Y ) + k i 1 S R Y + k d S μ N S μ + N ( D w R Y )
Here, k t , k i , and k d represent the tilt, integral, and derivative gains, respectively, n denotes the fractional order power of the tilt term, D w depicts the setpoint weighting factor for the derivative term, N stands for the filter coefficient to suppress high-frequency noise in the fractional derivative action, and μ denotes the fractional order of differentiation. For optimal tuning of the 2DOF-TIDμ controller parameters, the ITAE formula (Equation (8)) is used as the objective function, constrained by the permissible boundaries of the controller parameters. The tuning problem is mathematically formulated as
M i n i m i z e   F F k t , k i , k d , D w , n ,   N ,   μ   s u b j e c t   t o :   20 k t 20 20 k i 20 20 k d 20 20 D w 20 1 n 10 100 N 500 0 µ 2        

3.2.5. 1+TDFλ/PIλDμ Controller (Proposed)

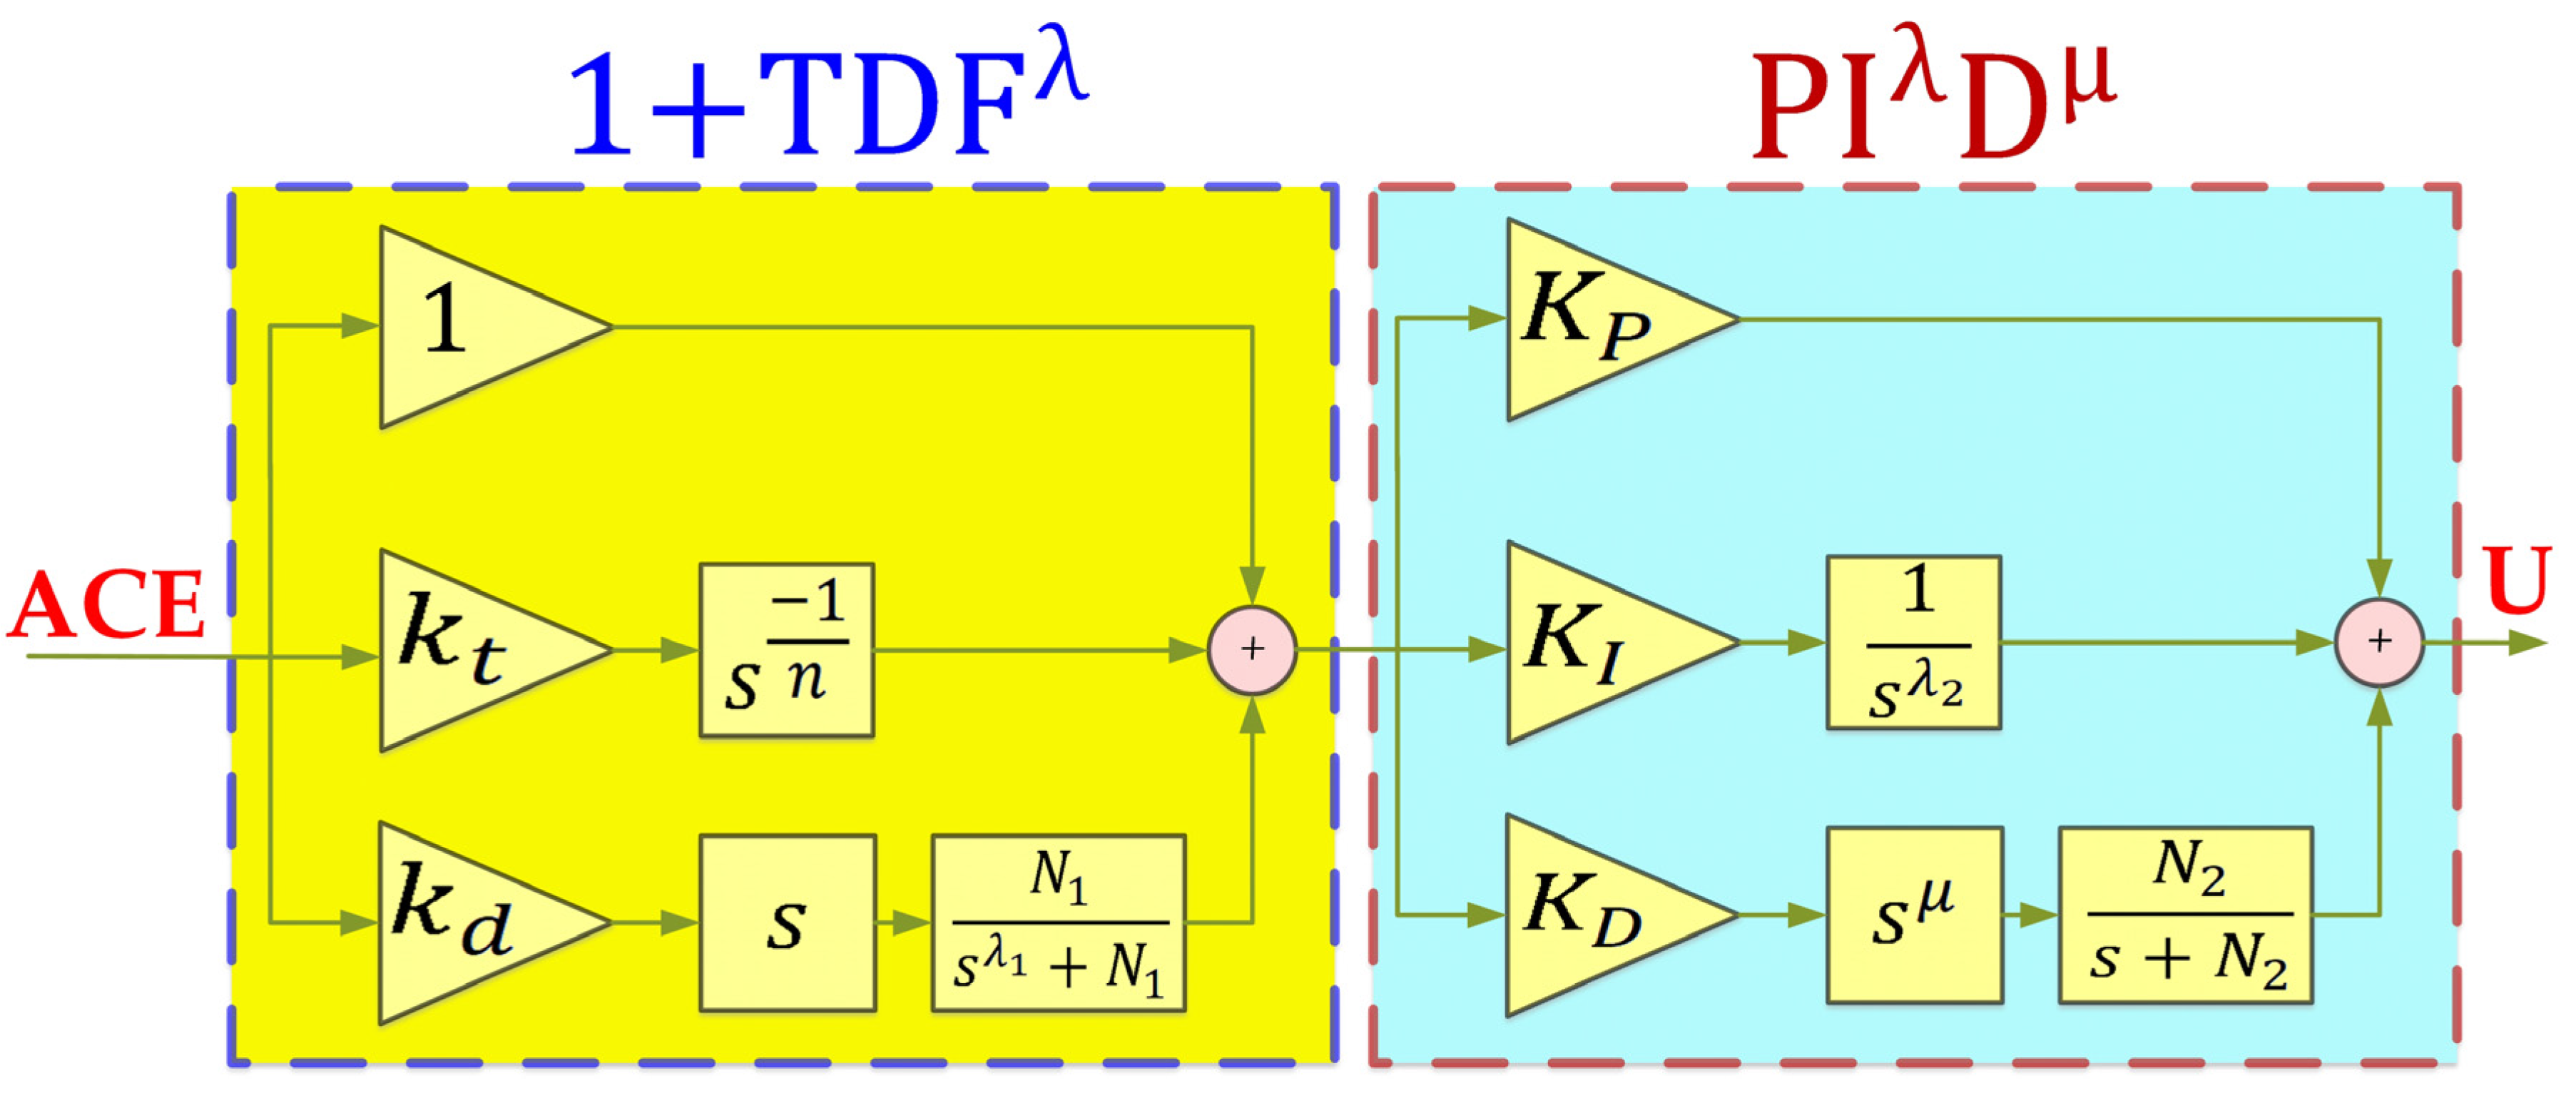
In the landscape of advanced fractional-order control design, the proposed 1+TDFλ/PIλDμ controller emerges as a robust and highly tuneable structure that effectively combines two powerful control philosophies: the anticipatory action of the one plus tilt fractional filtered derivative (1+TDFλ) and the versatile regulation offered by the fractional-order PID controller (PIλDμ). The unique contribution of this controller lies in its dual-action capability: the first stage anticipates disturbances using fractional tilt–derivative logic, while the second stage ensures precise correction through fractional integral and derivative regulation. The proposed cascaded architecture is particularly well-suited for large scale dynamic systems requiring tight regulation under uncertainty such as green energy-based power systems.
The controller operates in a series (cascaded) configuration, where the first block (1+TDFλ) processes the area control error (ACE), and the second block refines the output using the PIλDμ regulator. This sequential processing enhances both the anticipatory and corrective behavior of the controller, ensuring fast transient response, reduced overshoot, and robust disturbance rejection. As illustrated in Figure 10, the input to the combined controller structure is the A C E ( S ) signal, while the output is the control signal U ( S ) that drives the system plant. The complete transfer function of the proposed 1+TDFλ/PIλDμ controller is given by
C { 1 + T D F λ / P I λ D μ } S = 1 + k t S 1 / n + k d S N 1 S λ 1 + N 1 K P + K I S λ 2 + K D S µ N 2 S + N 2            
where k t , n , k d , λ 1 , N 1 are the parameters of the first part (1+TDFλ), representing the gain and tilt operator order of the tilt action, the derivative gain, the fractional order of the filter, and the coefficient of the derivative action, respectively. Moreover, K P , K I , λ 2 , K D , µ , N 2 are the parameters of the second part (PIλDμ), representing the proportional gain, integral gain, fractional order of integration, derivative gain, fractional order, and the filter coefficient of the derivative action, respectively. This configuration results in a total of 11 parameters to be tuned.
This expanded tuning space allows for exceptional flexibility in meeting conflicting control objectives such as speed versus robustness or noise rejection versus sensitivity. The extra degrees of freedom come at the cost of higher computational burden, but modern optimization algorithms such as DRA can handle this complexity effectively. To optimize these parameters, the ITAE criterion, shown in Equation (8), is adopted as fitness function. Accordingly, the parameter tuning task is formulated as a constrained nonlinear optimization problem:
M i n i m i z e   F F k t ,   n ,   k d ,   λ 1 ,   N 1 ,   K P ,   K I ,   λ 2 ,   K D ,   µ ,   N 2   s u b j e c t   t o :   0 k t 20 1 n 10 0 k d 20 0 λ 1 2 100 N 1 500 0 K P 20 0 K I 20 0 λ 2 2 0 K D 5 0 µ 2 100 N 2 500        

3.3. Divine Religions Algorithm (DRA)

The divine religions algorithm (DRA) is a novel metaheuristic optimization method inspired by a political-religious framework. It models a society in which leaders seek followers who align with their beliefs, aiming to reach optimal solutions guided by an objective function [51]. Each follower is represented by a belief vector, composed of religious and political attributes such as morality, truthfulness, and fairness. These vectors serve as candidate solutions. When a belief vector satisfies performance criteria, it is stored in a belief profile. New vectors are generated using selection rules based on existing profiles and arbitrary variation, following a memory-based optimization strategy. The algorithm promotes structure by forming religious schools, where the followers with the best performance become leaders, and others align under them [51]. Followers strive to improve their position by adopting the beliefs of their school’s missionary. To diversify solutions and encourage adaptation, mechanisms like advertising, competition, and penalties are introduced. Underperforming followers are added to a banned list, excluding them from further selection or mutation. Leadership is dynamic (i.e., followers may outperform missionaries or leaders, resulting in role changes).
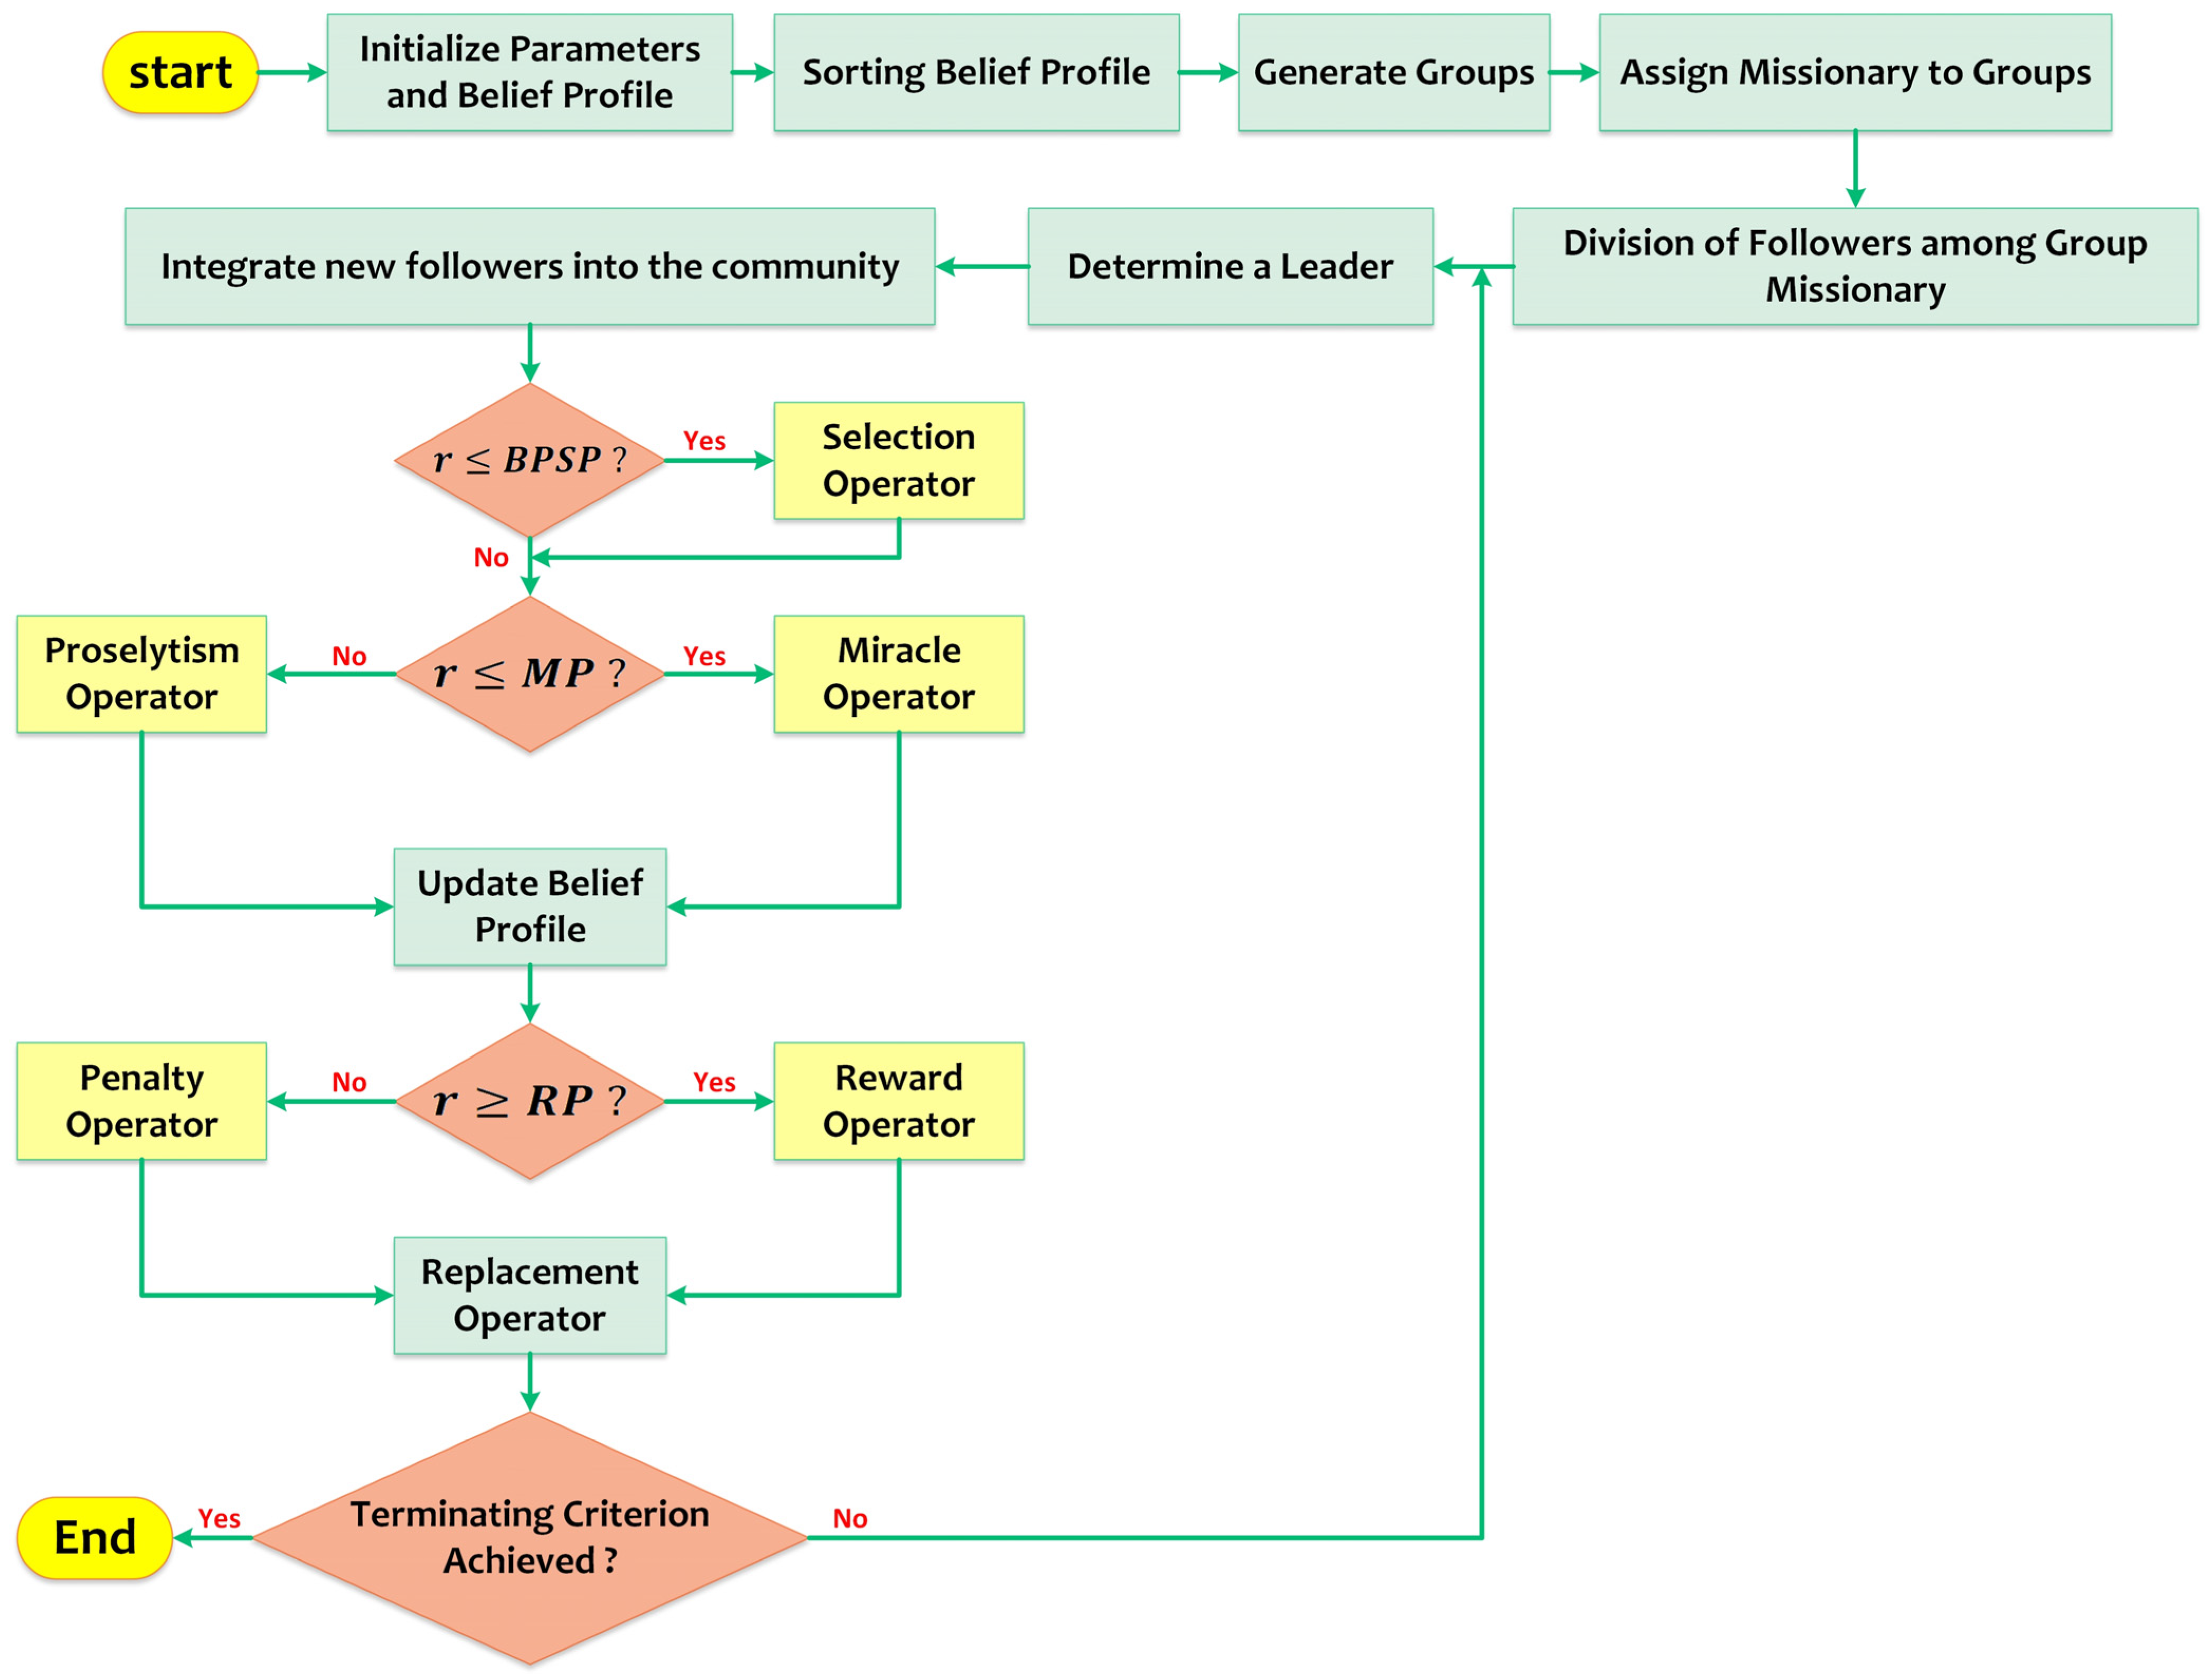
Figure 11 illustrates the hierarchical organization of the religious society, showing the interaction between leaders, missionaries, and followers. Figure 12a further details the roles and responsibilities of each group, highlighting how followers operate at different levels and how their rewards vary based on their efforts. The process of community expansion is shown in Figure 12b, which depicts how new followers are assessed based on the quality of their belief profiles, and how they may replace existing members if they demonstrate superior merits. Figure 13 presents an overview flowchart of the DRA, outlining its core steps starting from belief initialization and leader selection, and ending with belief evolution and algorithm termination. This belief-driven optimization continues iteratively, refining solutions until convergence is achieved.

3.4. DRA Procedure Modelling

In this subsection, the detailed steps of the divine religious optimization are discussed. DRA can be divided into 8 steps as follows:

3.5. Sending Believers to Different Populations

The mathematical modelling notations of DRA have been summarized in Table A2. The system consists of M religions, each with one missionary and N j individuals (including followers). The set of all religions is denoted by M = { m 1 , m 2 , , m M } , and each religion m j has a population W j = { w 1 , w 2 , , w N j } . The complete community is defined as [51]
W = j M   W j , w i W j
Each follower w j in a community m j has a belief vector C j j = c i j 1 , c i j 2 , , c i j d with normalized values between zero and unity. The beliefs of all followers in m j form a matrix:
C j = c 1 j 1 c 1 j 2 c 1 j d c 2 j 1 c 2 j 2 c 2 j d c n j 1 c n j 2 c n j d
The overall belief matrix across all communities is
C 1 × M = C 1         C 2         C 3         C M
Each follower’s performance is measured using a fitness function:
f i j = k = 1 d   c i j k , j M
Fitness values in each community m j are stored in
F j = f 1 j f 2 j f N j , j v
The complete fitness matrix is
F = F 1         F 2         F 3         F M
The optimal belief solution across communities is
C 1 × M * = C 1 *         C 2 *         C 3 *         C M *
Initially, belief profiles C n × d are arbitrarily generated, and fitness values F n × 1 are computed. The final solution C 1 × d * contains the best attribute values. Key hyperparameters of DRA, which will be described in detail in the following subsections, include the following:
  • BPSP: Belief Profile Selection Probability.
  • MP: Miracle Probability.
  • RP: Reward/Penalty Probability.
  • NI: Number of Iterations.

3.6. Finding the Most Appreciated Follower

The algorithm selects the follower w i ^ with the highest overall belief fitness across all communities, as denoted by
i ^ j ^ = a r g m i n   ( F )
where j ^   is the community containing this top follower ( w i ^ ), whose belief profile is [51]
C ^ i ^ j ^ = c ^ i ^ j ^ 1 , c ^ i ^ j ^ 2 , , c ^ i ^ j ^ d
The missionary is selected similarly but within each community (i.e., the highest-fitness member locally). The profile of the missionary for community m j is depicted by C ^ j .

3.7. Inviting a Fresh Follower

New followers can join a religious community. A new individual w i ´ , with belief vector C i ´ j = c i ´ j 1 , c i ´ j 2 , , c i ´ j d , may attempt to integrate into community u j . This process is modeled using two operators: proselytism and miracles. Only one is applied to each new follower, based on an arbitrary number between zero and unity compared to the belief profile selection probability (BPSP).
If the arbitrary value ≤ BPSP:
  • Selection Operator: A prominent follower w i ^ in the same community m j is identified. One belief index d ´ [ 1 , d ] is arbitrarily selected:
d ´ = U n i f o r m ( 1 , d )
The corresponding belief of the new follower is updated as [51]
c i ´ j d ´ = c i ^ j d ´ × ( r a n d c o s ( r a n d ) )
  • Miracles Operator: With a probability governed by the miracle probability (MP), a new follower may be added with arbitrarily assigned beliefs to diversify the community and boost its overall performance.
  • Proselytism Operator: This reflects a missionary’s influence, guiding new followers to align with existing beliefs. To facilitate this process, a randomly created value between zero and unity is compared with a predefined MP threshold. Based on this comparison, the selection of followers is determined using a specific evaluation formula for the miracles and proselytism mechanisms:
  M P = ( 1 × r a n d ) × 1 t   M a x _ I t e r × 2 × r a n d  
r a n d M P r a n d 0.5         c i ´ = c i ´ × cos π 2 × [ r a n d cos ( r a n d ) ] r a n d > 0.5         c i ´ = c i ´ + r a n d × c i ´ r o u n d 1 r a n d × c i ´     M i r a c l e s   O p e r a t o r  
r a n d > M P r a n d > ( 1 M P ) c i ´ = c i ´ × 0.01 + c ¯ i ´ × ( 1 M P ) + 1 c ¯ i ´ ( r a n d 4 × s i n ( π × r a n d ) ] r a n d ( 1 M P ) c i = r a n d 2 × r a n d c ¯ i ´ × ( 2 × r a n d ( 1 M P ) × r a n d n ) P r o s e l y t i s m   O p e r a t o r  
These mechanisms balance exploration (miracles) and exploitation (proselytism) in belief adaptation.

3.8. A Prospective Follower Fitness

After constructing the belief vector for the newly entered follower w i ´ , who is attempting to join community m j , the fitness must be calculated. Similar to Equation (22), it is determined by summing the values of the follower’s attributes as follows [51]:
I f   f o l l o w e r   ( i ) = = p e n a l t y     A d d   f o l l o w e r s   t o   t h e   f o r b i d d e n   l i s t     e l s e     C o n t i n u e  
By fostering a competitive environment, the reward and penalty mechanisms help maintain a balance between the exploration and exploitation phases. Additionally, the use of the f o r b i d d e n   l i s t prevents the algorithm from becoming trapped in local optima.

3.9. Creating the Operator of Reward or Penalty

To encourage competition among followers, some are arbitrarily selected or chosen based on performance to be rewarded or penalized. This approach helps improve the overall performance of the follower population. An arbitrary value between zero and unity is first generated to determine whether to apply a reward or penalty. This value is compared to a predefined threshold R P :
  • If r a n d R P , the reward is applied.
  • If r a n d < R P , the penalty is applied.
One attribute of the selected follower, denoted c i ´ , is then updated using a uniformly distributed arbitrary value, according to the following rules [51]:
I f   r a n d   R P                     c i ´ = c i ´ × 1   r a n d n   R e w a r d   O p e r a t o r     r a n d   < R P                     c i ´ = c i ´ × 1 +   r a n d n   P e n a l t y   O p e r a t o r  
Here, r a n d is a normally distributed arbitrary number. The reward decreases the attribute to refine the solution, while the penalty increases it to promote exploration.

3.10. Modifying a Follower’s Faith Status

The replacement has been performed using the belief vector of the weakest follower or a repeated belief vector among the followers. After this, the population is sorted according to the objective function. Specifically, the followers are ordered in ascending order based on their fitness values. To describe this process formally, we first identify the follower w i ˘ with the worst fitness in community m j as the weakest follower:
i ˘ = a r g m a x   ( F )
The belief profile of this weakest follower in the community is represented as
C ˘ i ˘ j = c ˘ i ˘ j 1 , c ˘ i ˘ j 2 , , c ˘ i ˘ j d
Next, if the fitness of a newly introduced follower w i ´ is greater than that of the weakest follower w i ˘ (i.e., C i ´ j < C ˘ i ˘ j ), their belief profiles are swapped as follows [51]:
I f C i ´ j < C ˘ i ˘ j         s w a p C i ´ j , C ˘ i ˘ j , w i ˘   is   the   worst   follower   C i ´ j C ˘ i ˘ j   C o n t i n u e  
where the attributes of one follower are replaced by those of the other. Otherwise, if C i ´ j C ˘ i ˘ j , no change is made and the process continues.

3.11. Creating the Operator of Replacement

Followers can enhance their rank using selection, miracle, promotion, reward, and penalty operators by modifying their characteristics. If a follower’s fitness surpasses that of the current missionary, they exchange positions. The missionary s j can be described as
s j = a r g m i n   ( F j )
The missionary’s belief profile m j is
C ^ s j = c ^ s j 1 , c ^ s j 2 , , c ^ s j d
If a new follower w i ´ has better fitness than the missionary s j (i.e., C i ´ j < C ^ s j ), they swap profiles:
S w a p   C i ´ j ,   C ^ s j
where s j becomes the supervisor.

3.12. Terminating Criterion

At the conclusion of each iteration, the performance and status of all communities and their respective followers are evaluated to determine whether the optimization process should continue or be terminated. The algorithm is designed to stop under two conditions: either the maximum number of iterations has been reached, or there is no improvement in the fitness value of any follower compared to its previous value—indicating stagnation in the search process (i.e., F ( t + 1 ) = F ( t ) ). This stopping criterion helps ensure computational efficiency by preventing unnecessary iterations when further progress is unlikely. Finally, Algorithm 1 outlines the steps of the suggested DRA.
Algorithm 1. DRA Pseudocode
Inputs:
         M    → Number of communities
         N    → Total number of followers
         M   → Set of all communities
         W   → Set of all followers
           d    → Number of belief attributes per follower
Output:
         C 1 × M * → Optimal belief vector of the society
Initialize:
         t   = 1 → Iteration counter
Repeat
        // Step 1: Distribute Followers into Communities
        For ( j   =   1 to M   ) do
               Initialize C j           → Belief matrix of followers in community m j (Equation (20))
               Initialize F j ( t )   → Fitness matrix of community m j (Equation (23))
        End For
        // Step 2: Society-Wide Initialization
        Initialize C ( 1 × M )          → Combined belief matrix of all communities (Equation (21))
        Initialize F 1 × M ( t )     → Combined fitness matrix of all communities (Equation (24))
        // Step 3: Identify Most Prominent Follower
      Find   w i ^   → Follower with the best fitness in society (Equation (26))
        Set    j ^        → Community index of w i ^
        Set   c ^ i ^ j ^    → Belief profile of w i ^ (Equation (27))
        // Step 4: Belief Update Based on Probability
        Set    r   → Random number in [ 0 ,   1 ]
        If (   r     B P S P   ) then
               // Selection Operator
                d ´   → Randomly selected attribute index (Equation (28))
                w i ´ ( d ´ )     w i ^ ( d ´ )   // Copy the d ´ -th belief from w i ^ to w i ´ (Equation (29))
        End If
        If (   r     M P   ) then
              // Miracles Operator
                c i ´   → Integrate a fresh follower with arbitrary belief values into the community (Equation (26))
               // Proselytism Operator
               Substitute one belief attribute in leader’s vector with that of an arbitrary follower (Equation (27))
        End If
        // Step 5: Evaluate New Follower
        Compute f i ´ j ( t ) → Fitness of new follower w i ´ (Equation (33))
        // Step 6: Reward Operator
        Set    r   → Random number in [ 0 ,   1 ]
        If ( r     R P   ) then
               choose an attribute index ( d ´ ) arbitrarily (Equation (34))
        End If
        // Step 7: Update Weakest Follower
        Set i ˘   → Index of weakest follower in community m j (Equation (35))
        Set C ˘ i ˘ j → Belief profile of weakest follower (Equation (36))
        If ( C i ´ j <   C ˘ i ˘ j   ) then
                S w a p   ( C i ´ j ,   C i ˘ j )   // Swap beliefs (Equation (37))
        End If
        // Step 8: Replacement with the Most Prominent Follower
        Set s j   → Index of most prominent follower in m j (Equation (38))
        Set C ^ s j → Belief profile of s j (Equation (39))
        If ( C i ´ j <   C ^ s j   ) then
                S w a p ( C i ´ j ,   C ^ s j )   // Swap beliefs (Equation (40))
        End If
t   ( t + 1 )
Until   t   > ( M a x _ I t e r   +   1 )
Return   C 1 × M *

4. Simulation Results and Discussion

A comprehensive set of simulation studies was conducted on the triple-area test system illustrated in Figure 1 to identify the most effective combination of several optimizers and various controller structures. These studies encompass a diverse range of scenarios designed to thoroughly evaluate system performance under different conditions.
Section 4.1 begins with the application of standard step disturbances to Areas 1 and 2 of the system. The results are used to compare the effectiveness of several optimization algorithms, ultimately selecting the most promising one for further analysis. This selected algorithm is then employed to tune multiple controllers, including the proposed design, with the outcomes subjected to rigorous statistical evaluation. In Section 4.2, multi-step disturbances are introduced in both first and second areas to assess the dynamic response of the different controllers. A detailed comparative analysis is provided. Section 4.3 extends the investigation by applying a sequence of escalating pulse disturbances to Areas 1 and 2, with statistical methods again used to evaluate controller performance. The robustness of the controllers against renewable energy fluctuations is examined in Section 4.4 and Section 4.5, where variations in photovoltaic (PV) and wind power generation are introduced into Areas 1 and 2, respectively. To impose more challenging conditions, Section 4.6 integrates the scenarios from Section 4.2, Section 4.4, and Section 4.5, combining multi-step disturbances with renewable energy variability. Finally, Section 4.7 presents a sensitivity analysis that explores the impact of system parameter variations on controller performance. Each of these test scenarios is discussed in detail in the subsequent subsections.

4.1. Scenario I: 5% Step Load Disturbance (SLD) in Area 1 and Area 2

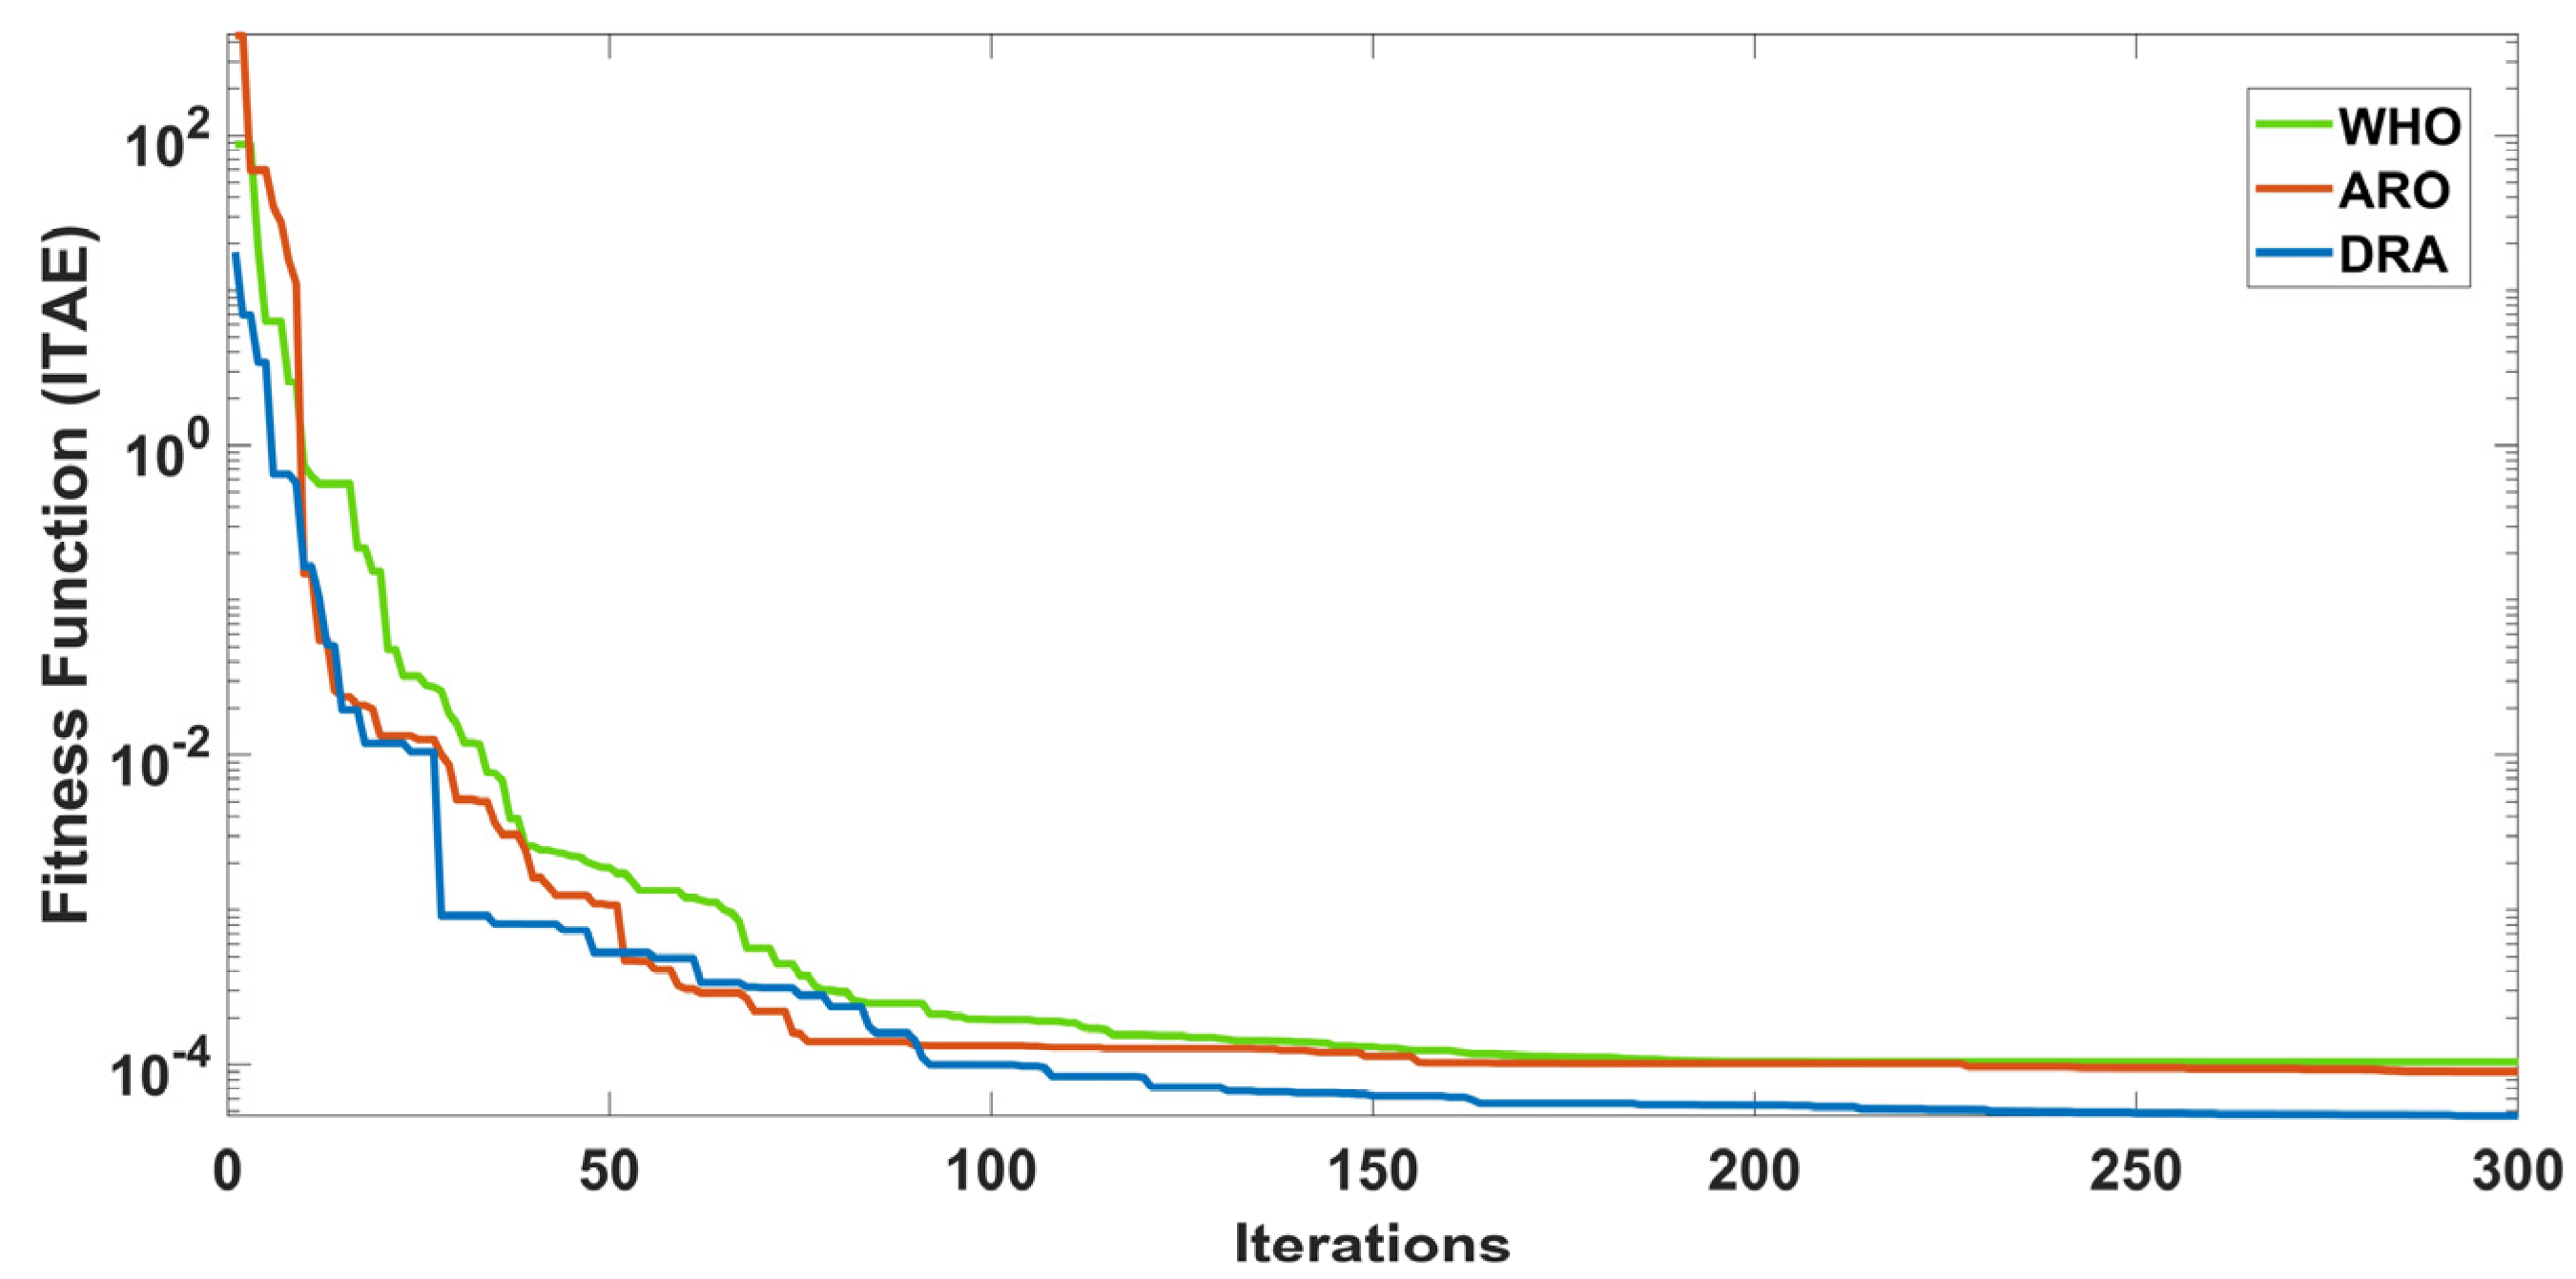
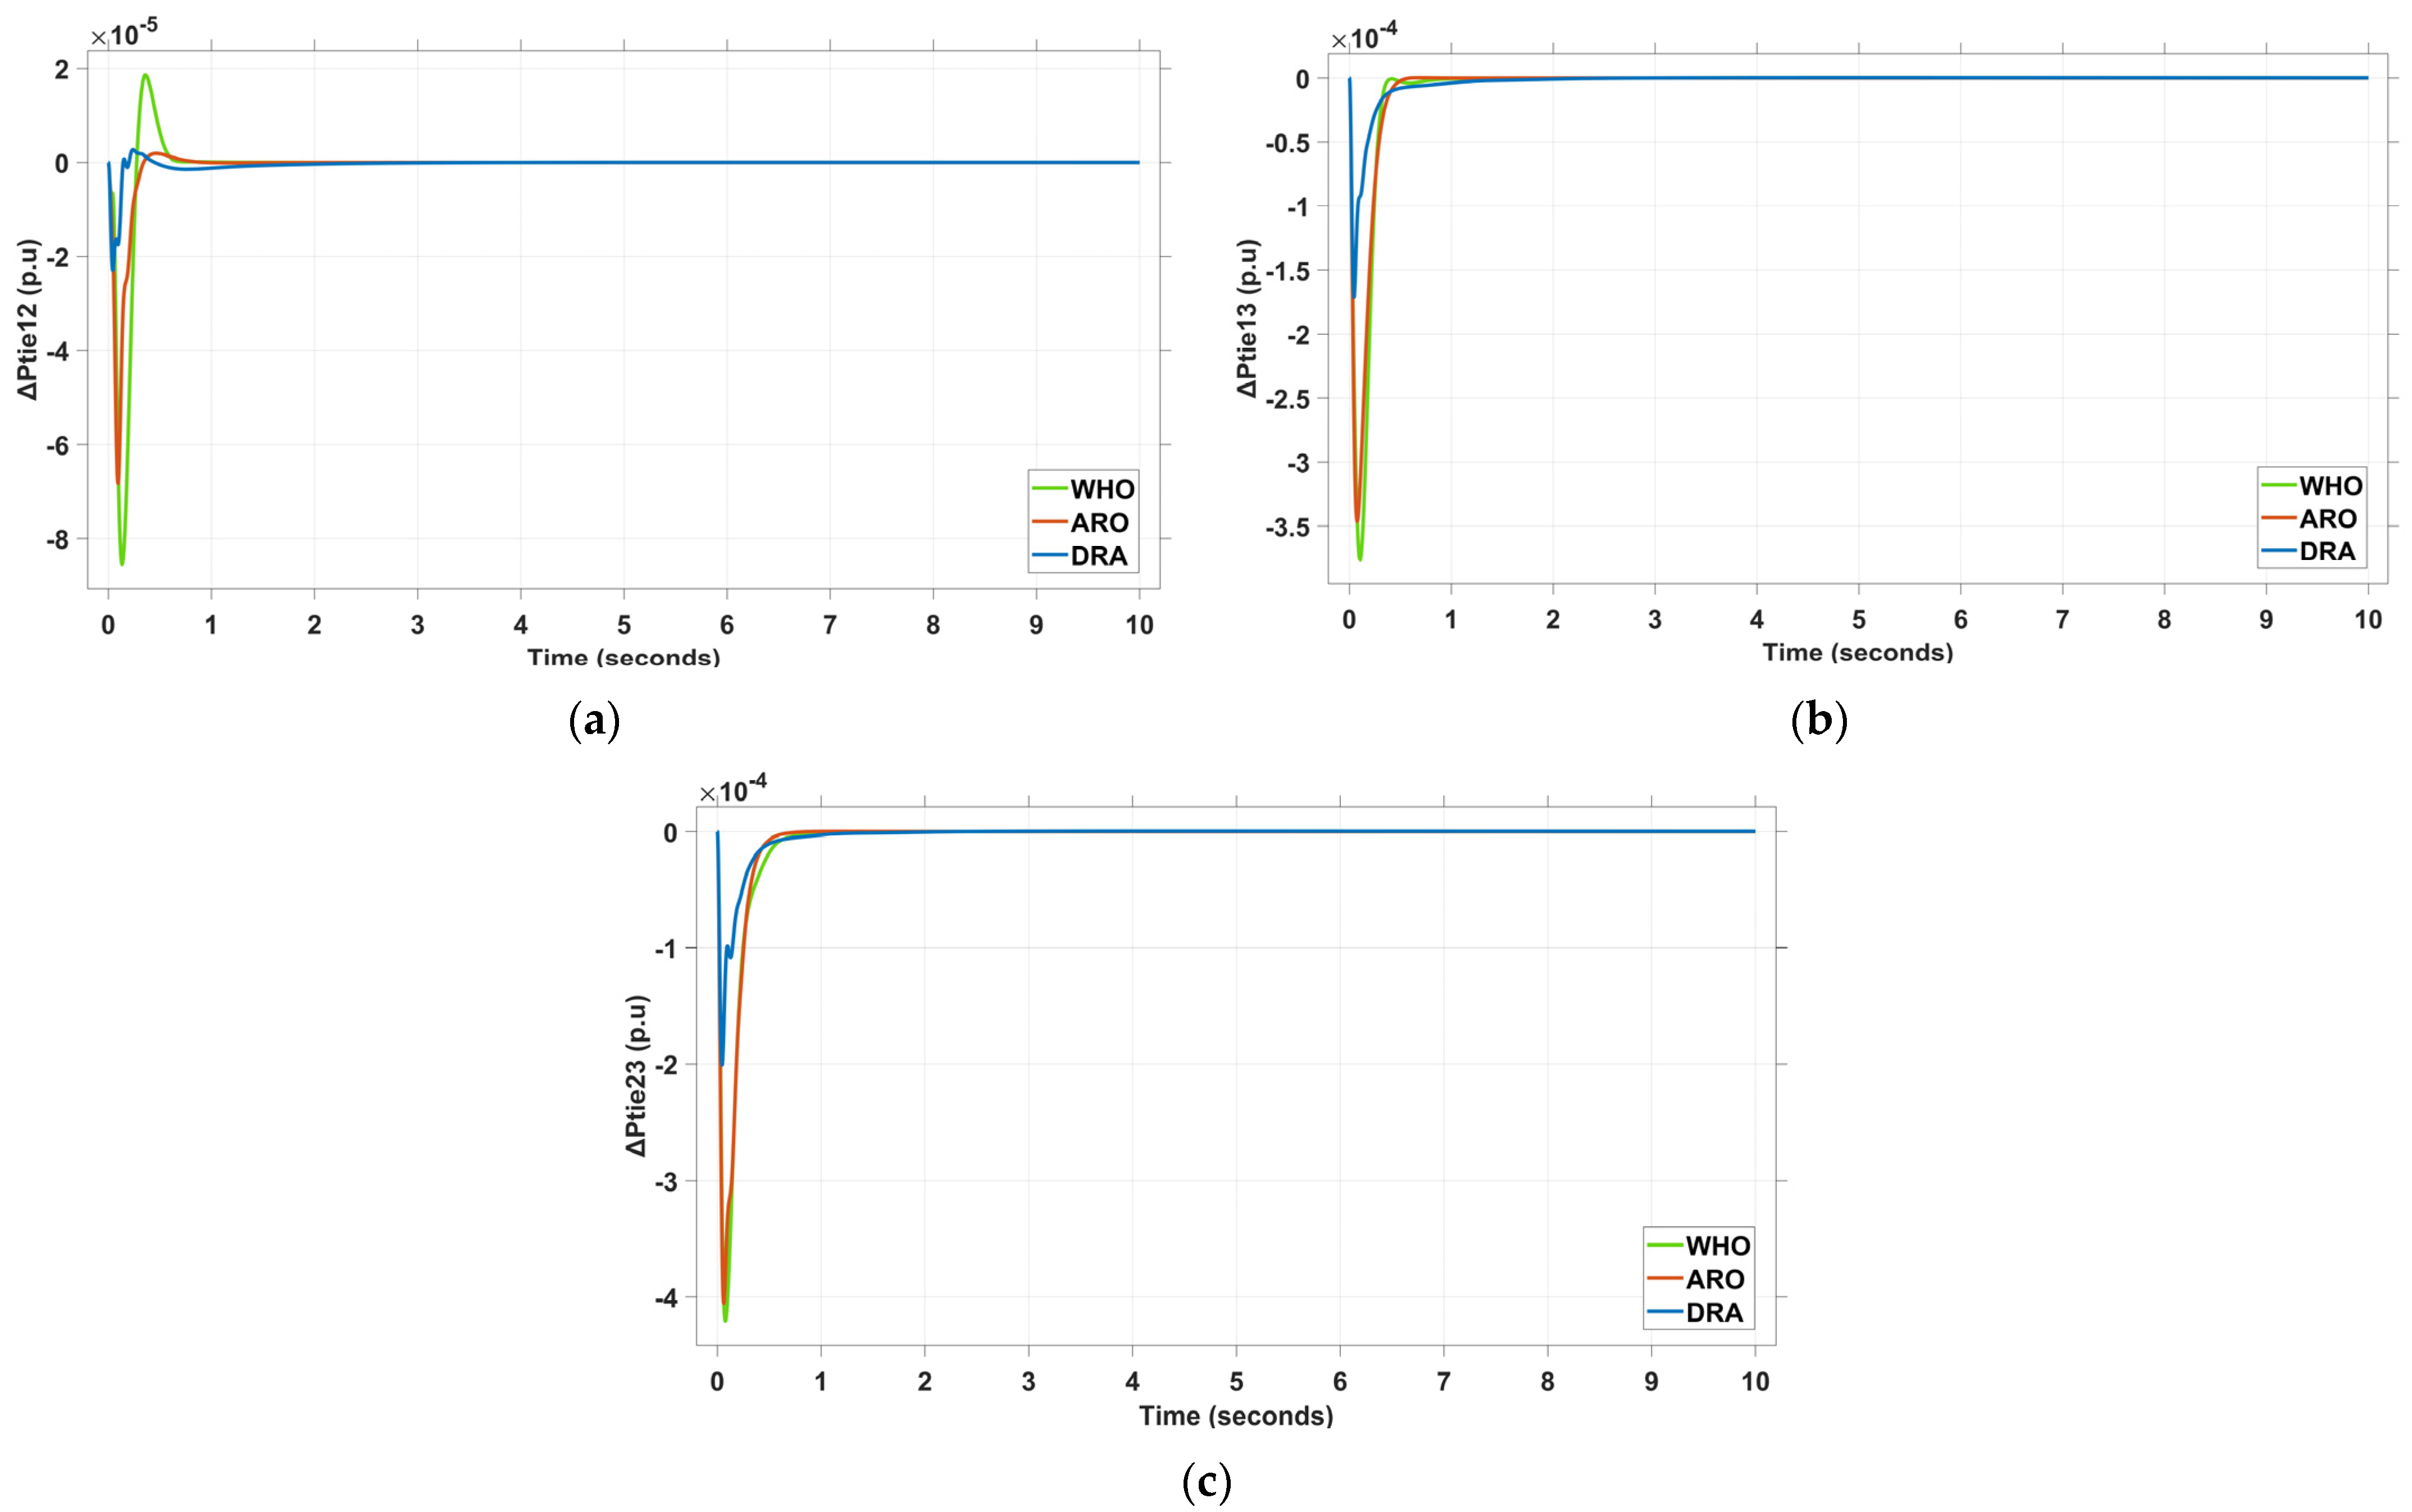
Herein, a 5% step load disturbance (SLD) is introduced simultaneously in Areas 1 and 2 of the examined triple-area power system to evaluate and demonstrate the superiority of the proposed optimization technique, the DRA, in tuning the newly designed 1+TDFλ/PIλDμ controller. The performance of DRA is compared against other advanced optimization methods, namely the WHO and ARO. These algorithms were benchmarked using a maximum of 300 iterations and 30 search agents. All simulation experiments were conducted on a computer with an Intel Core i7-11700K processor (3.6 GHz), 20 GB RAM, running Windows 10 (64-bit). The algorithms were implemented in MATLAB/Simulink R2023b, and the system dynamics were solved using the ODE15s solver with a variable time step and a maximum step size of 1 × 10 5 . All simulations were executed in normal mode. Results clearly indicate that the DRA-based tuning yields significantly better system responses, characterized by notably reduced overshoot and undershoot, as well as a lower fitness function value. This superiority is well illustrated by the convergence behavior depicted in Figure 14, while the enhanced dynamic performance of the system under the different algorithms is presented in Figure 15 (frequency deviation responses) and Figure 16 (tie-line power responses), respectively. The effectiveness of each optimization method is further supported by the optimized controller parameters detailed in Table 1.
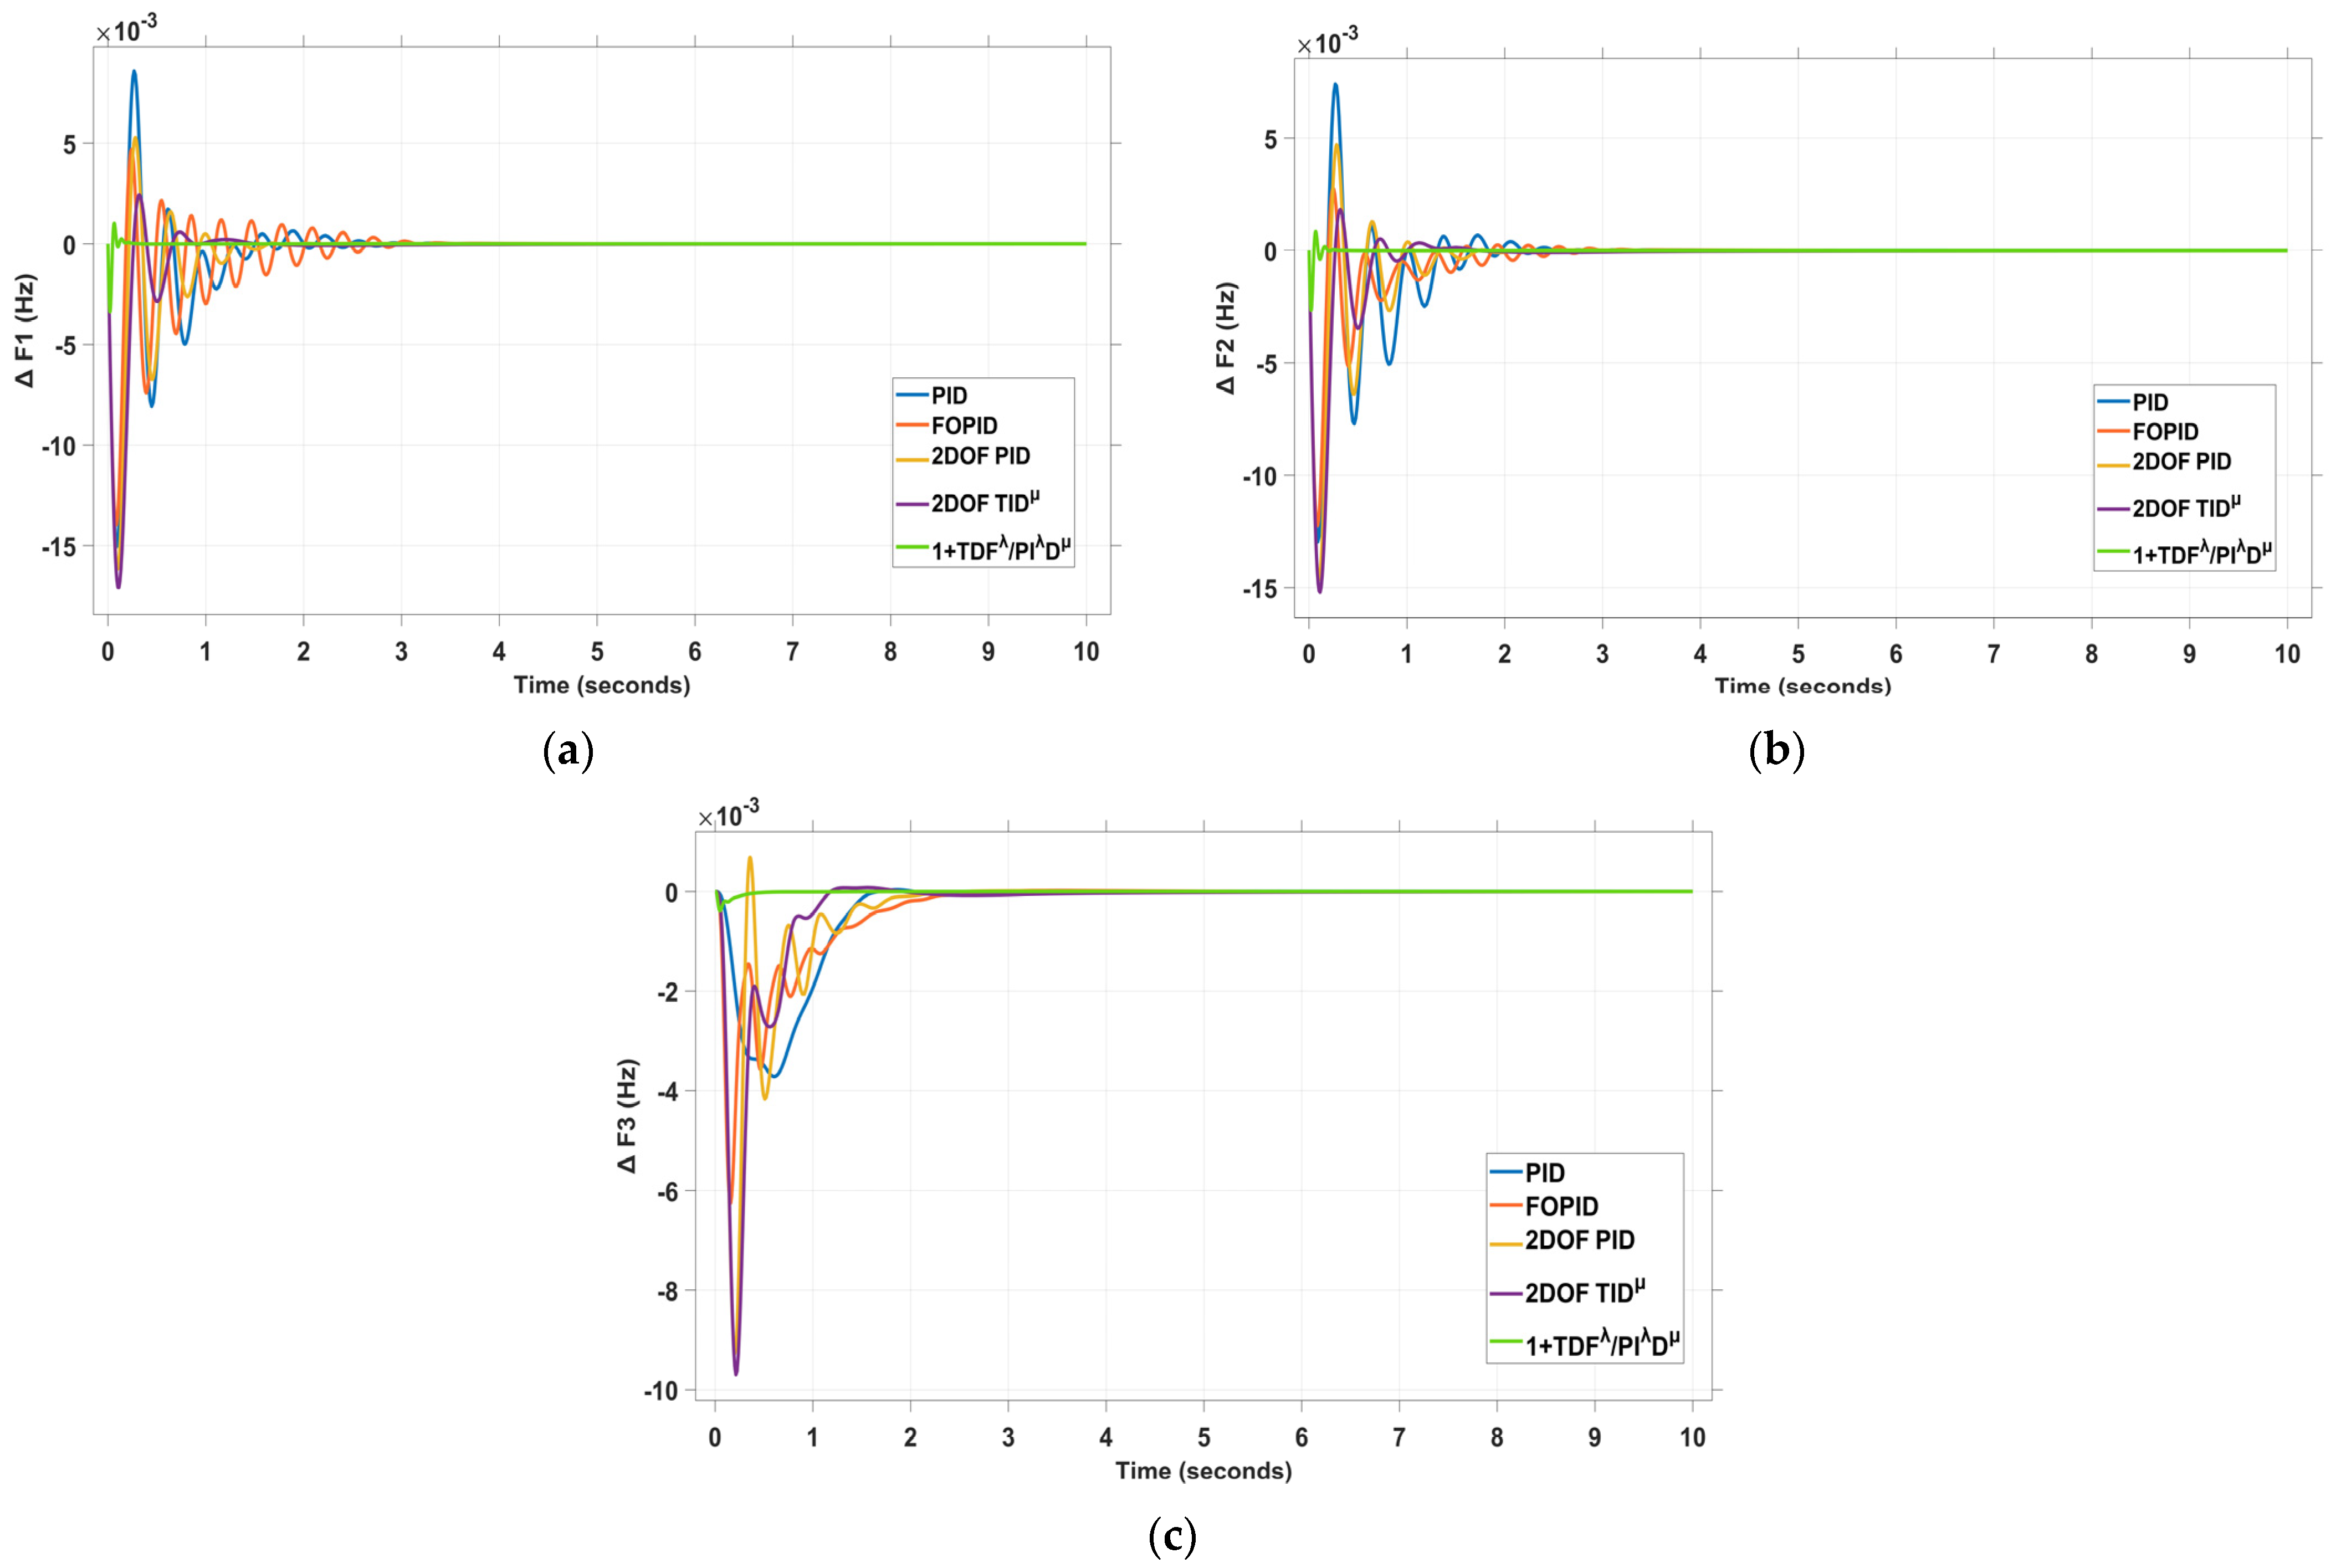
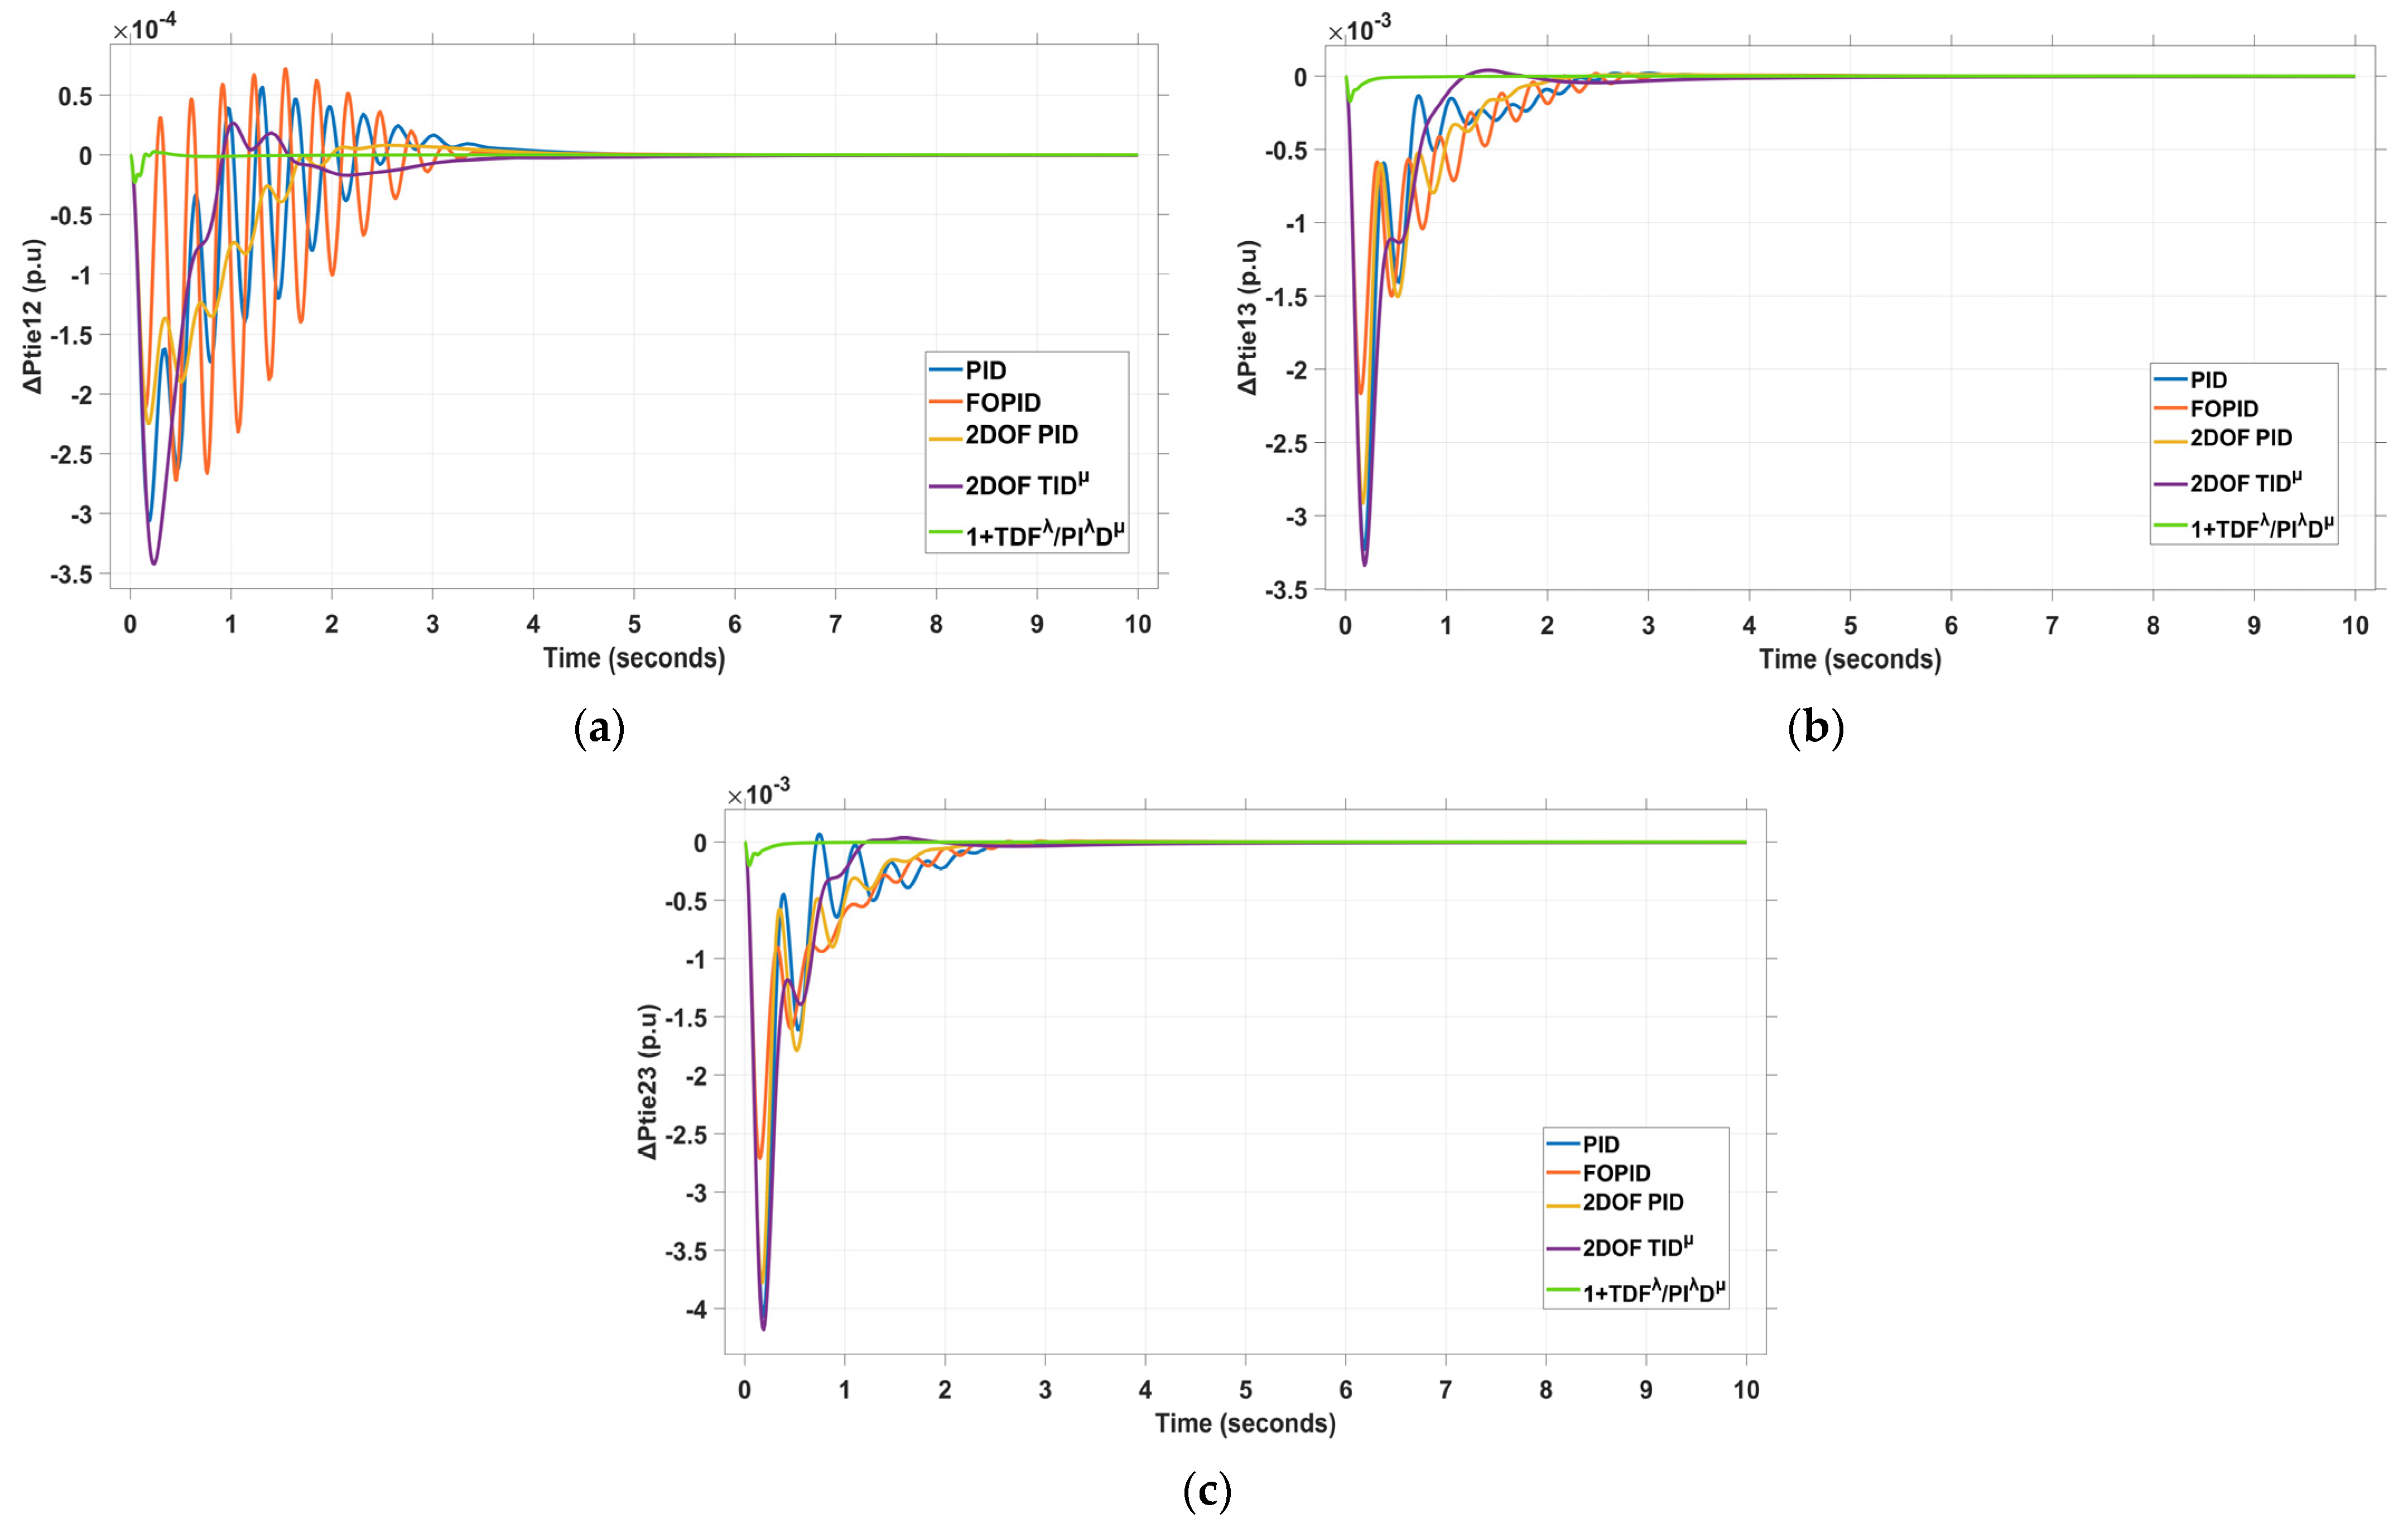
Also, the superiority of the proposed DRA-optimized 1+TDFλ/PIλDμ regulator over other competing controllers, including PID, 2DOF-PID, FOPID, and 2DOF-TIDμ, all similarly tuned via the DRA algorithm, is clearly demonstrated. Table 2 summarizes the optimized parameter values of these controllers for the designated case study. Among the tested control schemes, the recommended DRA-based 1+TDFλ/PIλDμ controller consistently exhibits superior performance. This is evidenced by the frequency and tie-line power responses (ΔF1, ΔF2, ΔF3, ΔPtie12, ΔPtie13, ΔPtie23) of the examined hybrid triple-area power grid, which are depicted in Figure 17 and Figure 18. The results confirm that the proposed controller achieves significantly reduced settling times, overshoots, and undershoots compared to its counterparts. Notably, the undershoot in ΔF1 recorded by the DRA-tuned 1+TDFλ/PIλDμ controller is approximately 3.373 × 10 3 , representing an improvement of about 4.5 times compared to PID ( 15.05 × 10 3 ), 4 times over FOPID ( 13.96 × 10 3 ), 4.8 times relative to 2DOF-PID ( 16.16 × 10 3 ), and 5 times better than 2DOF-TIDμ ( 17.07 × 10 3 ). A detailed comparative evaluation across key performance metrics, including settling time (ST), overshoot (OS), undershoot (US), and fitness function (FF), is provided in Table 3, further reinforcing the enhanced effectiveness of the proposed controller.

4.2. Scenario 2: A Multi-Step Load Disturbance (MSLD) in Area 1 and Area 2

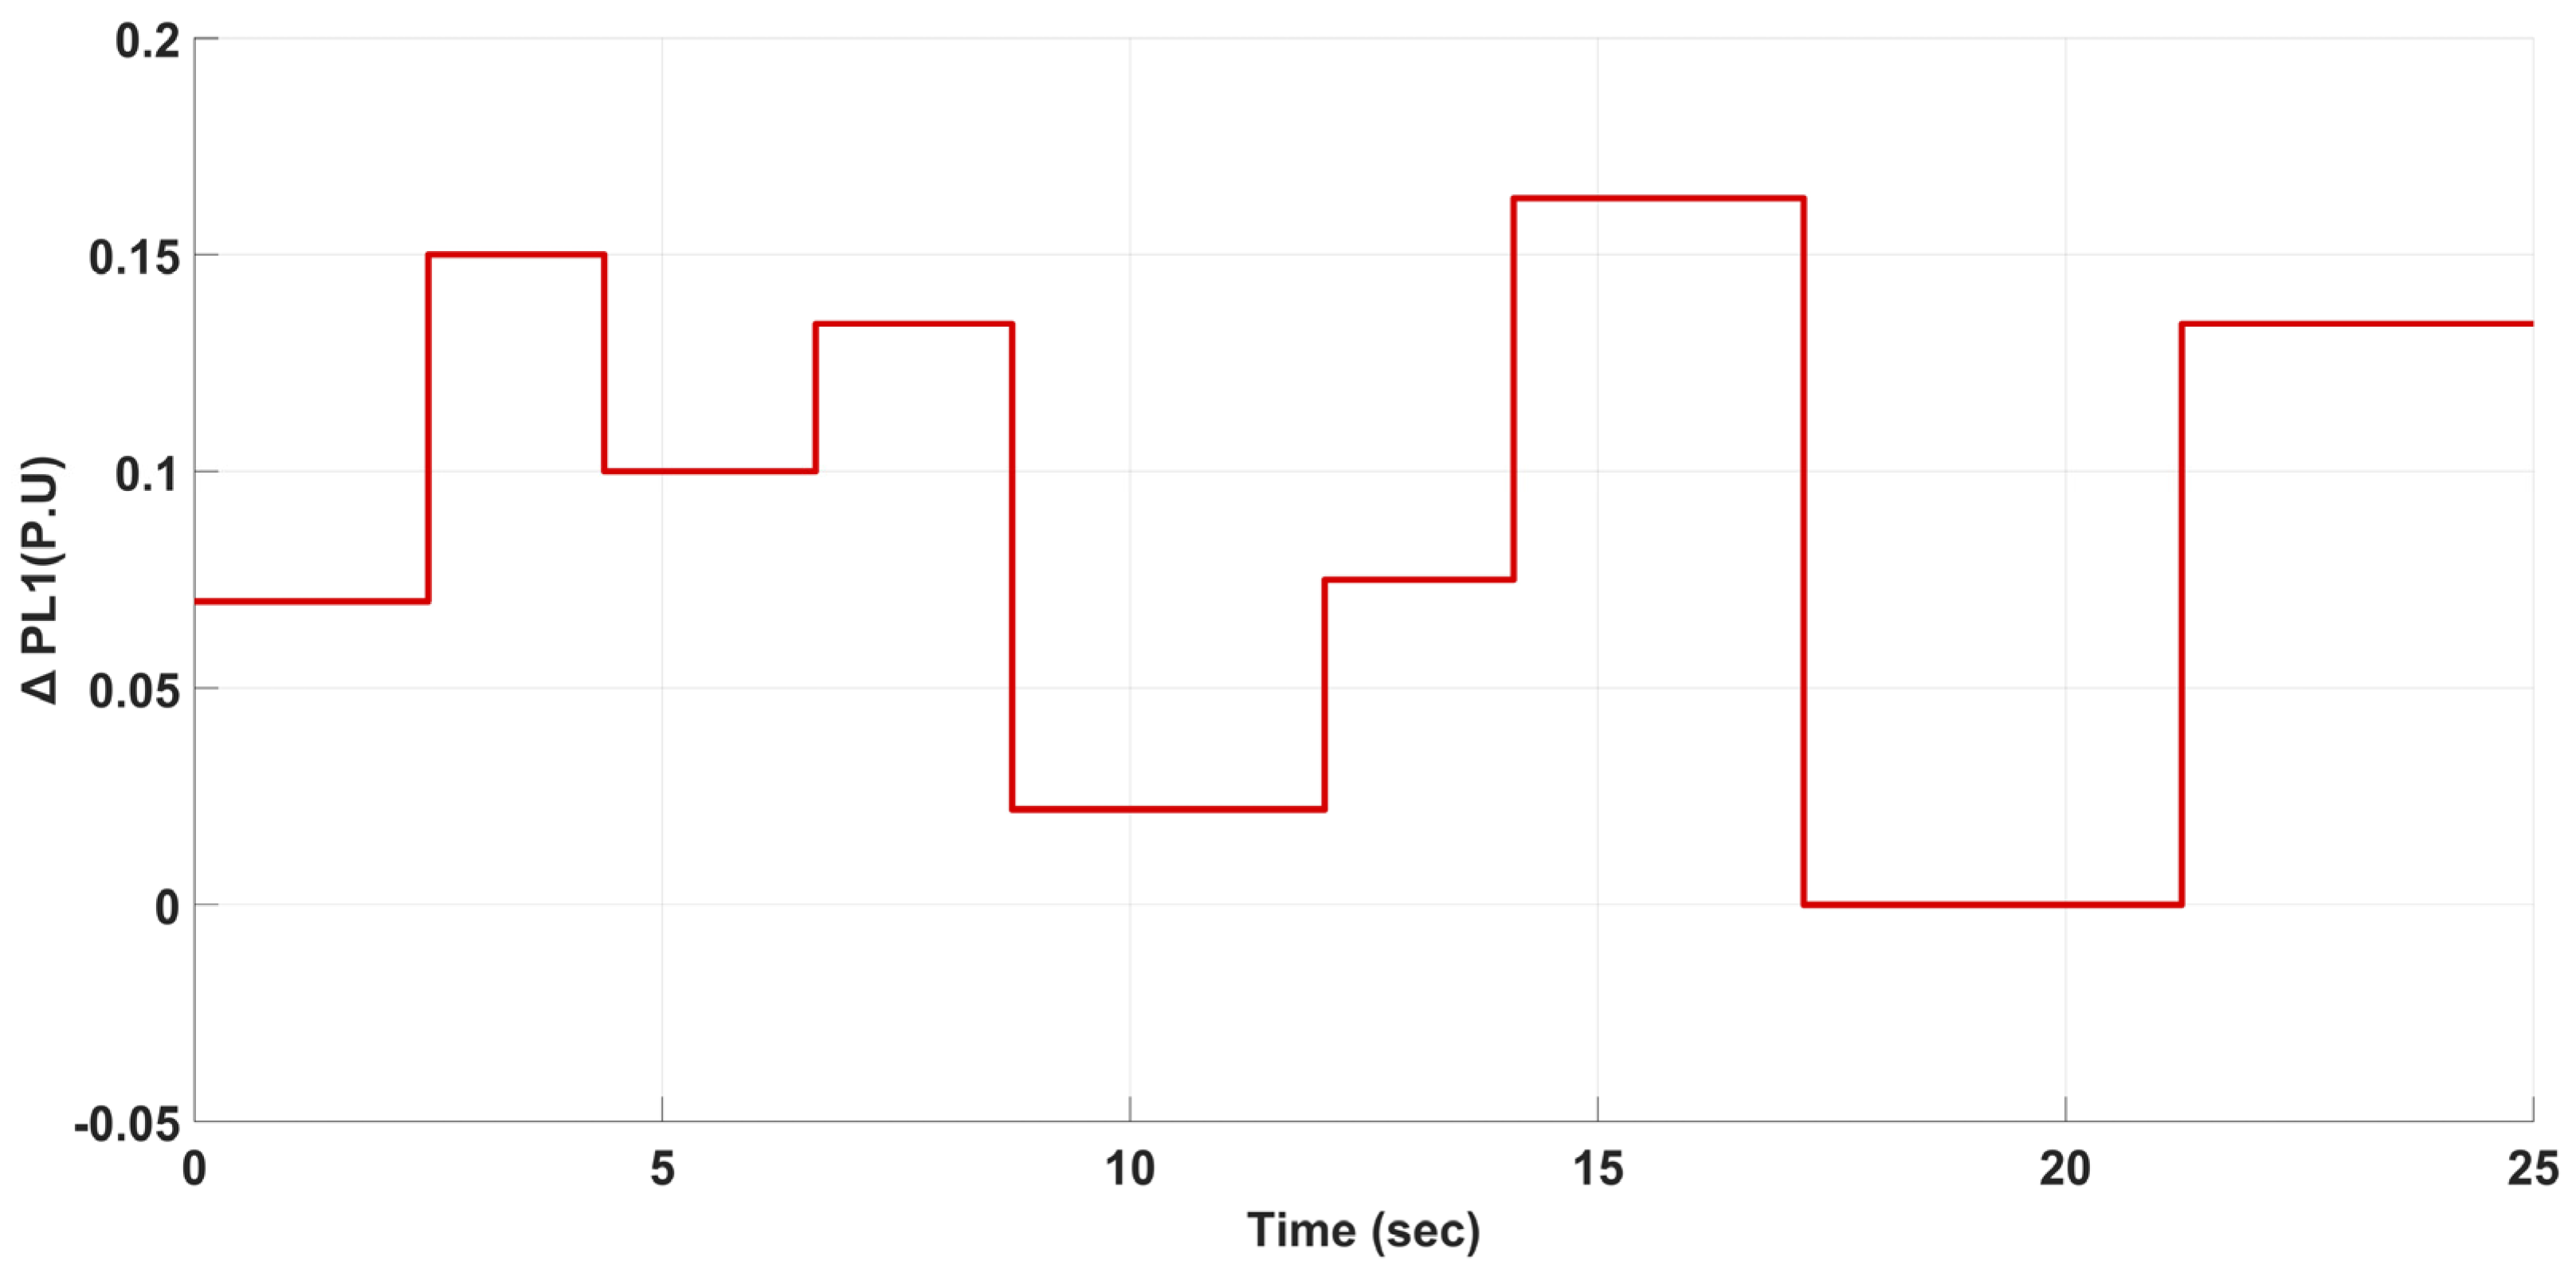
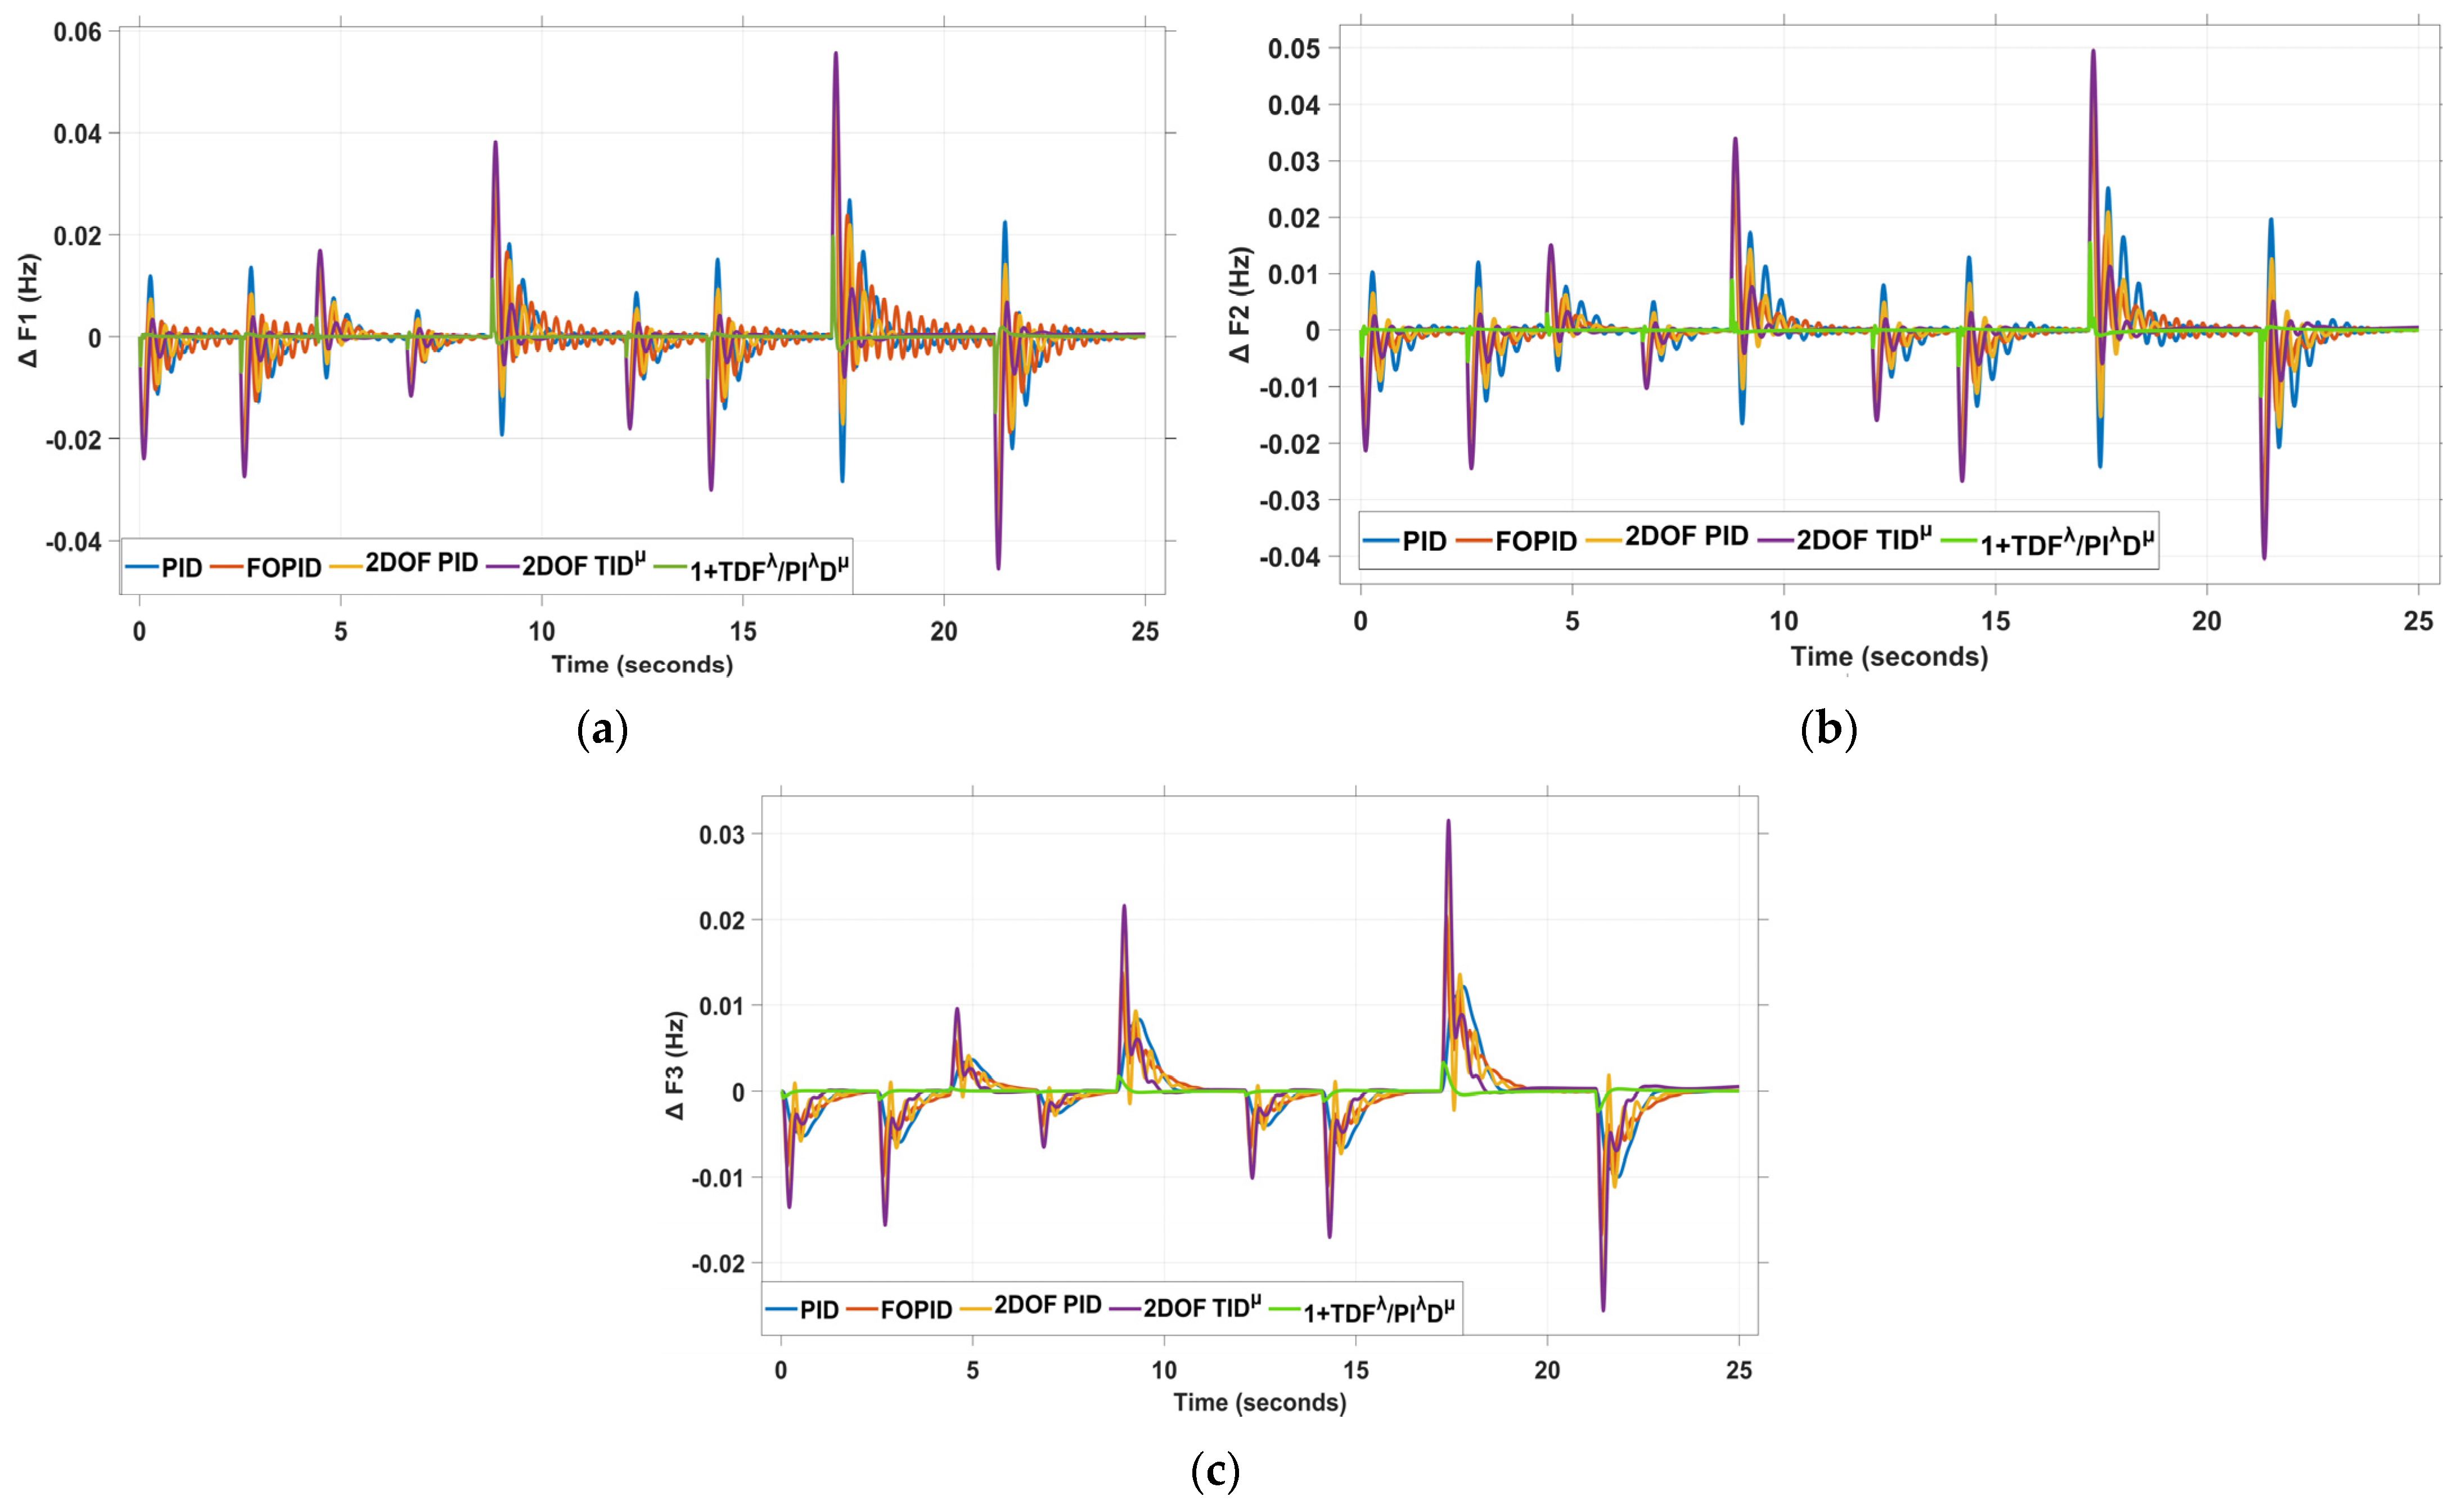
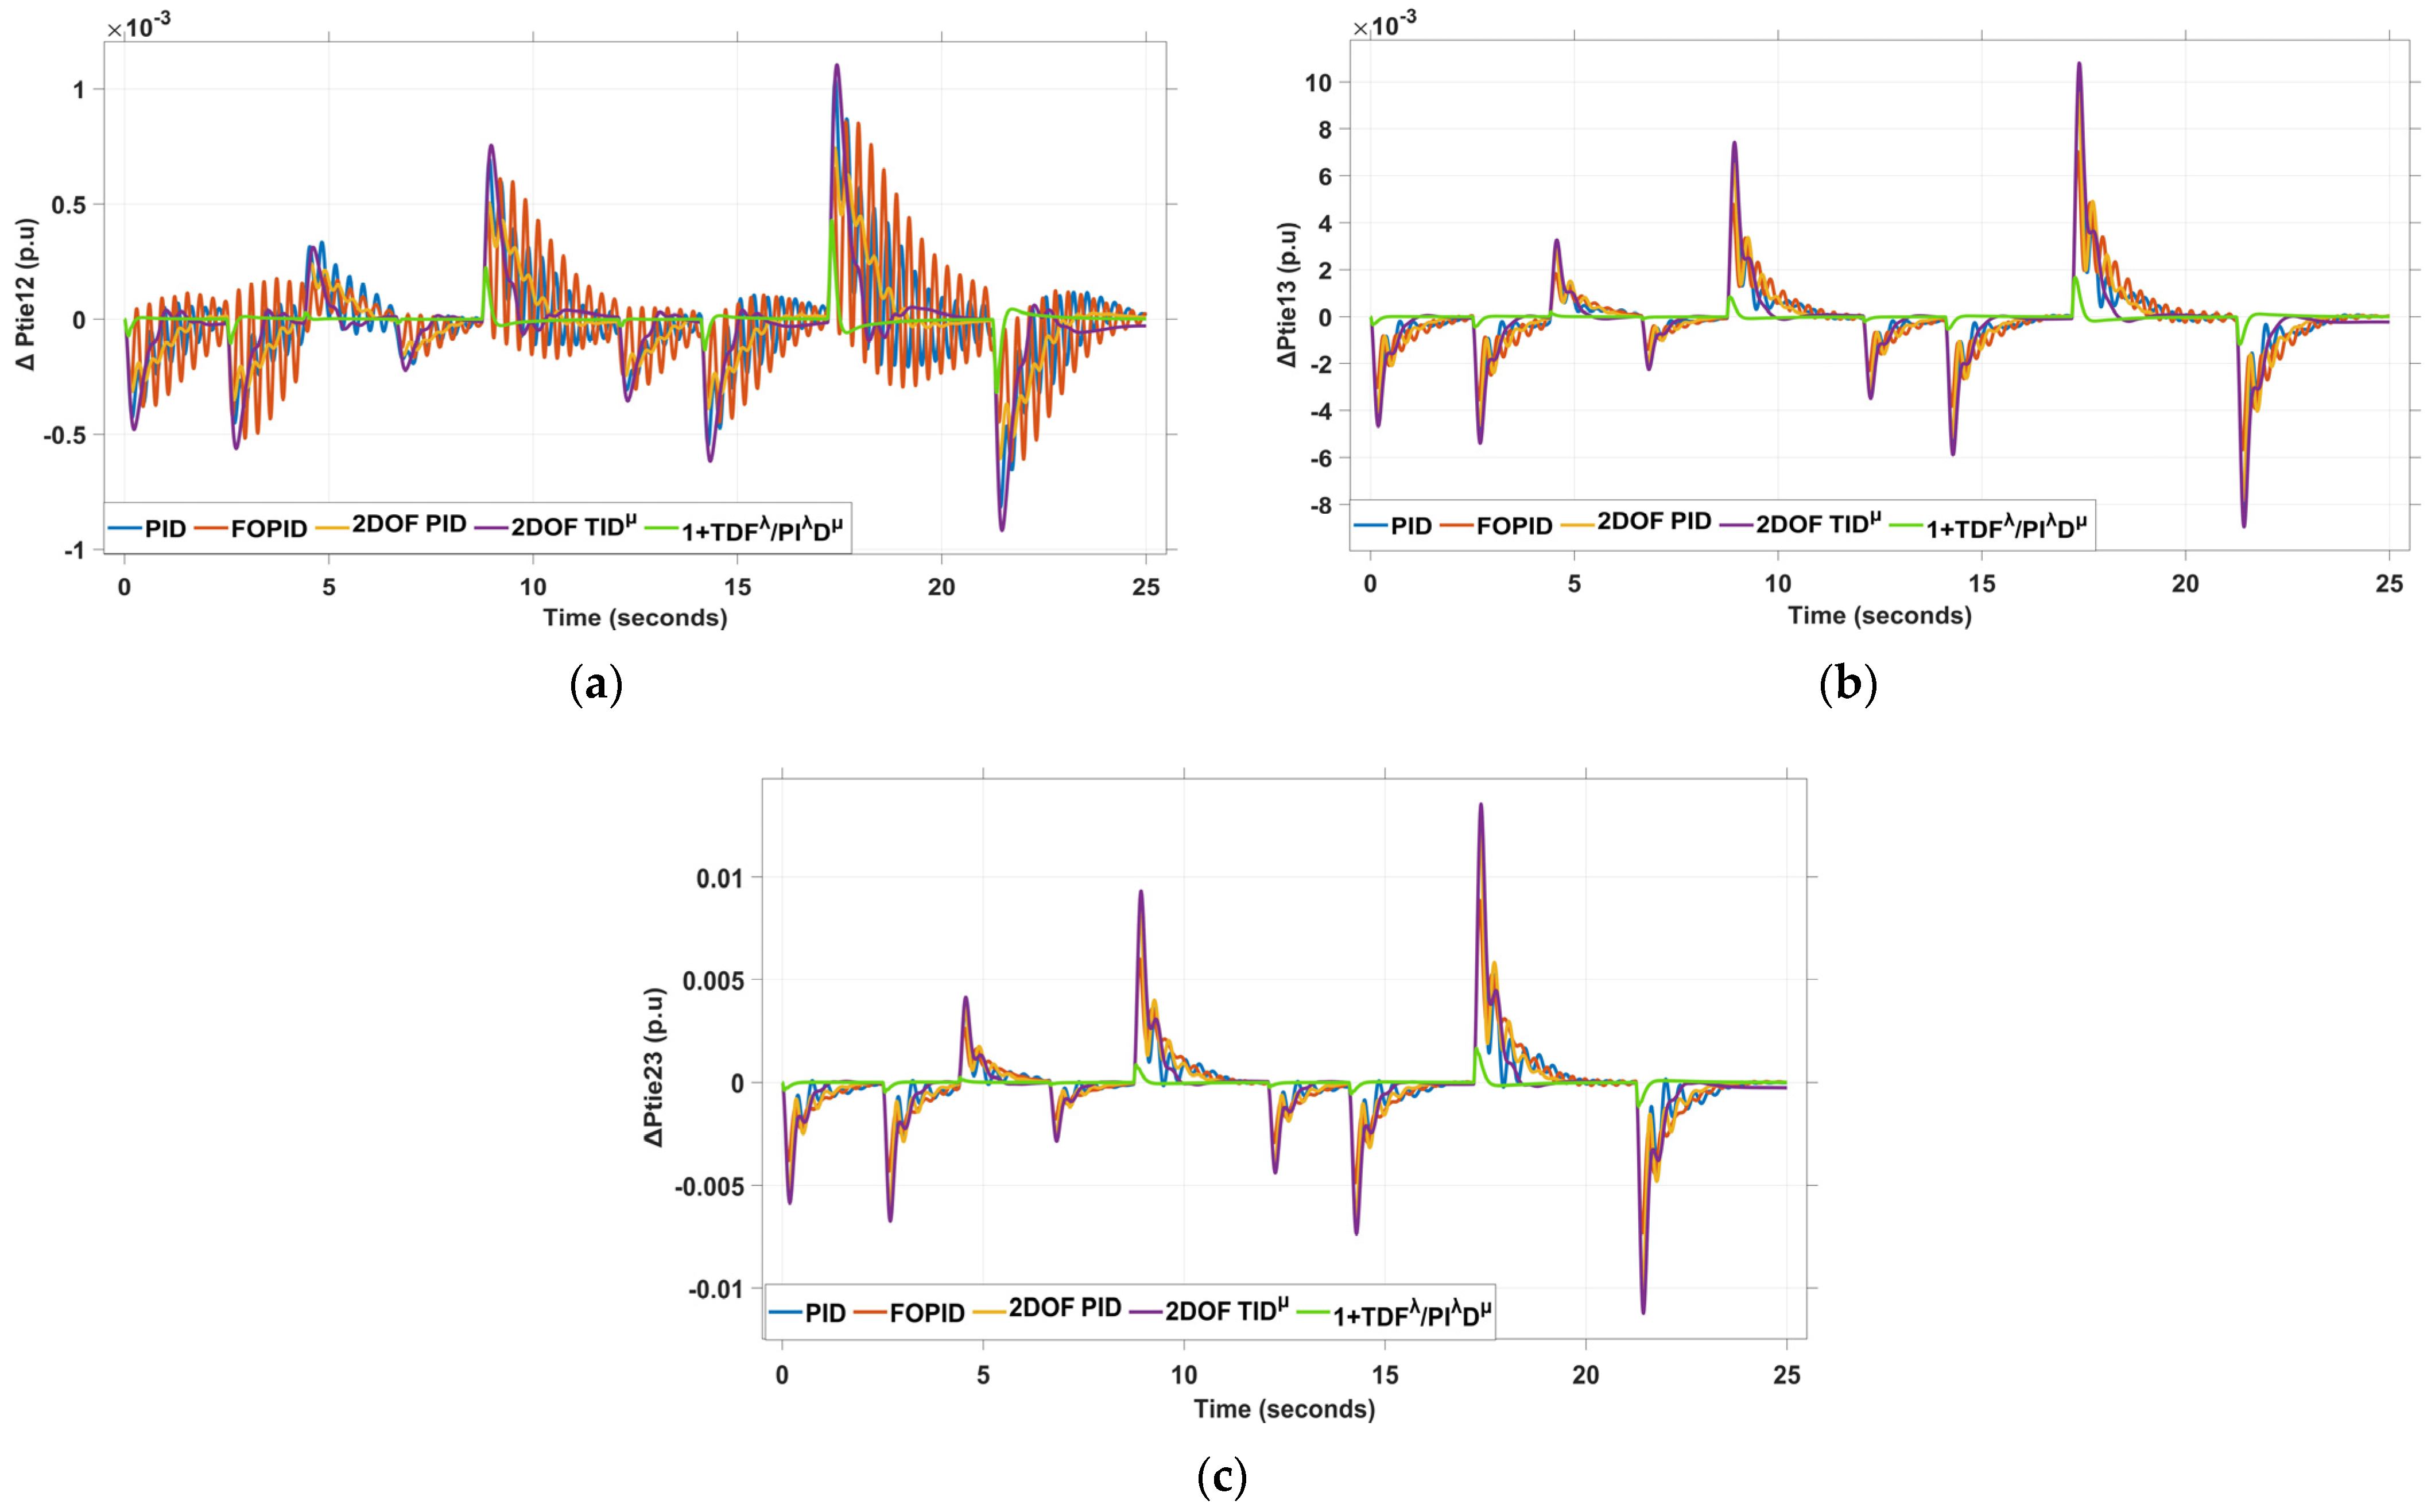
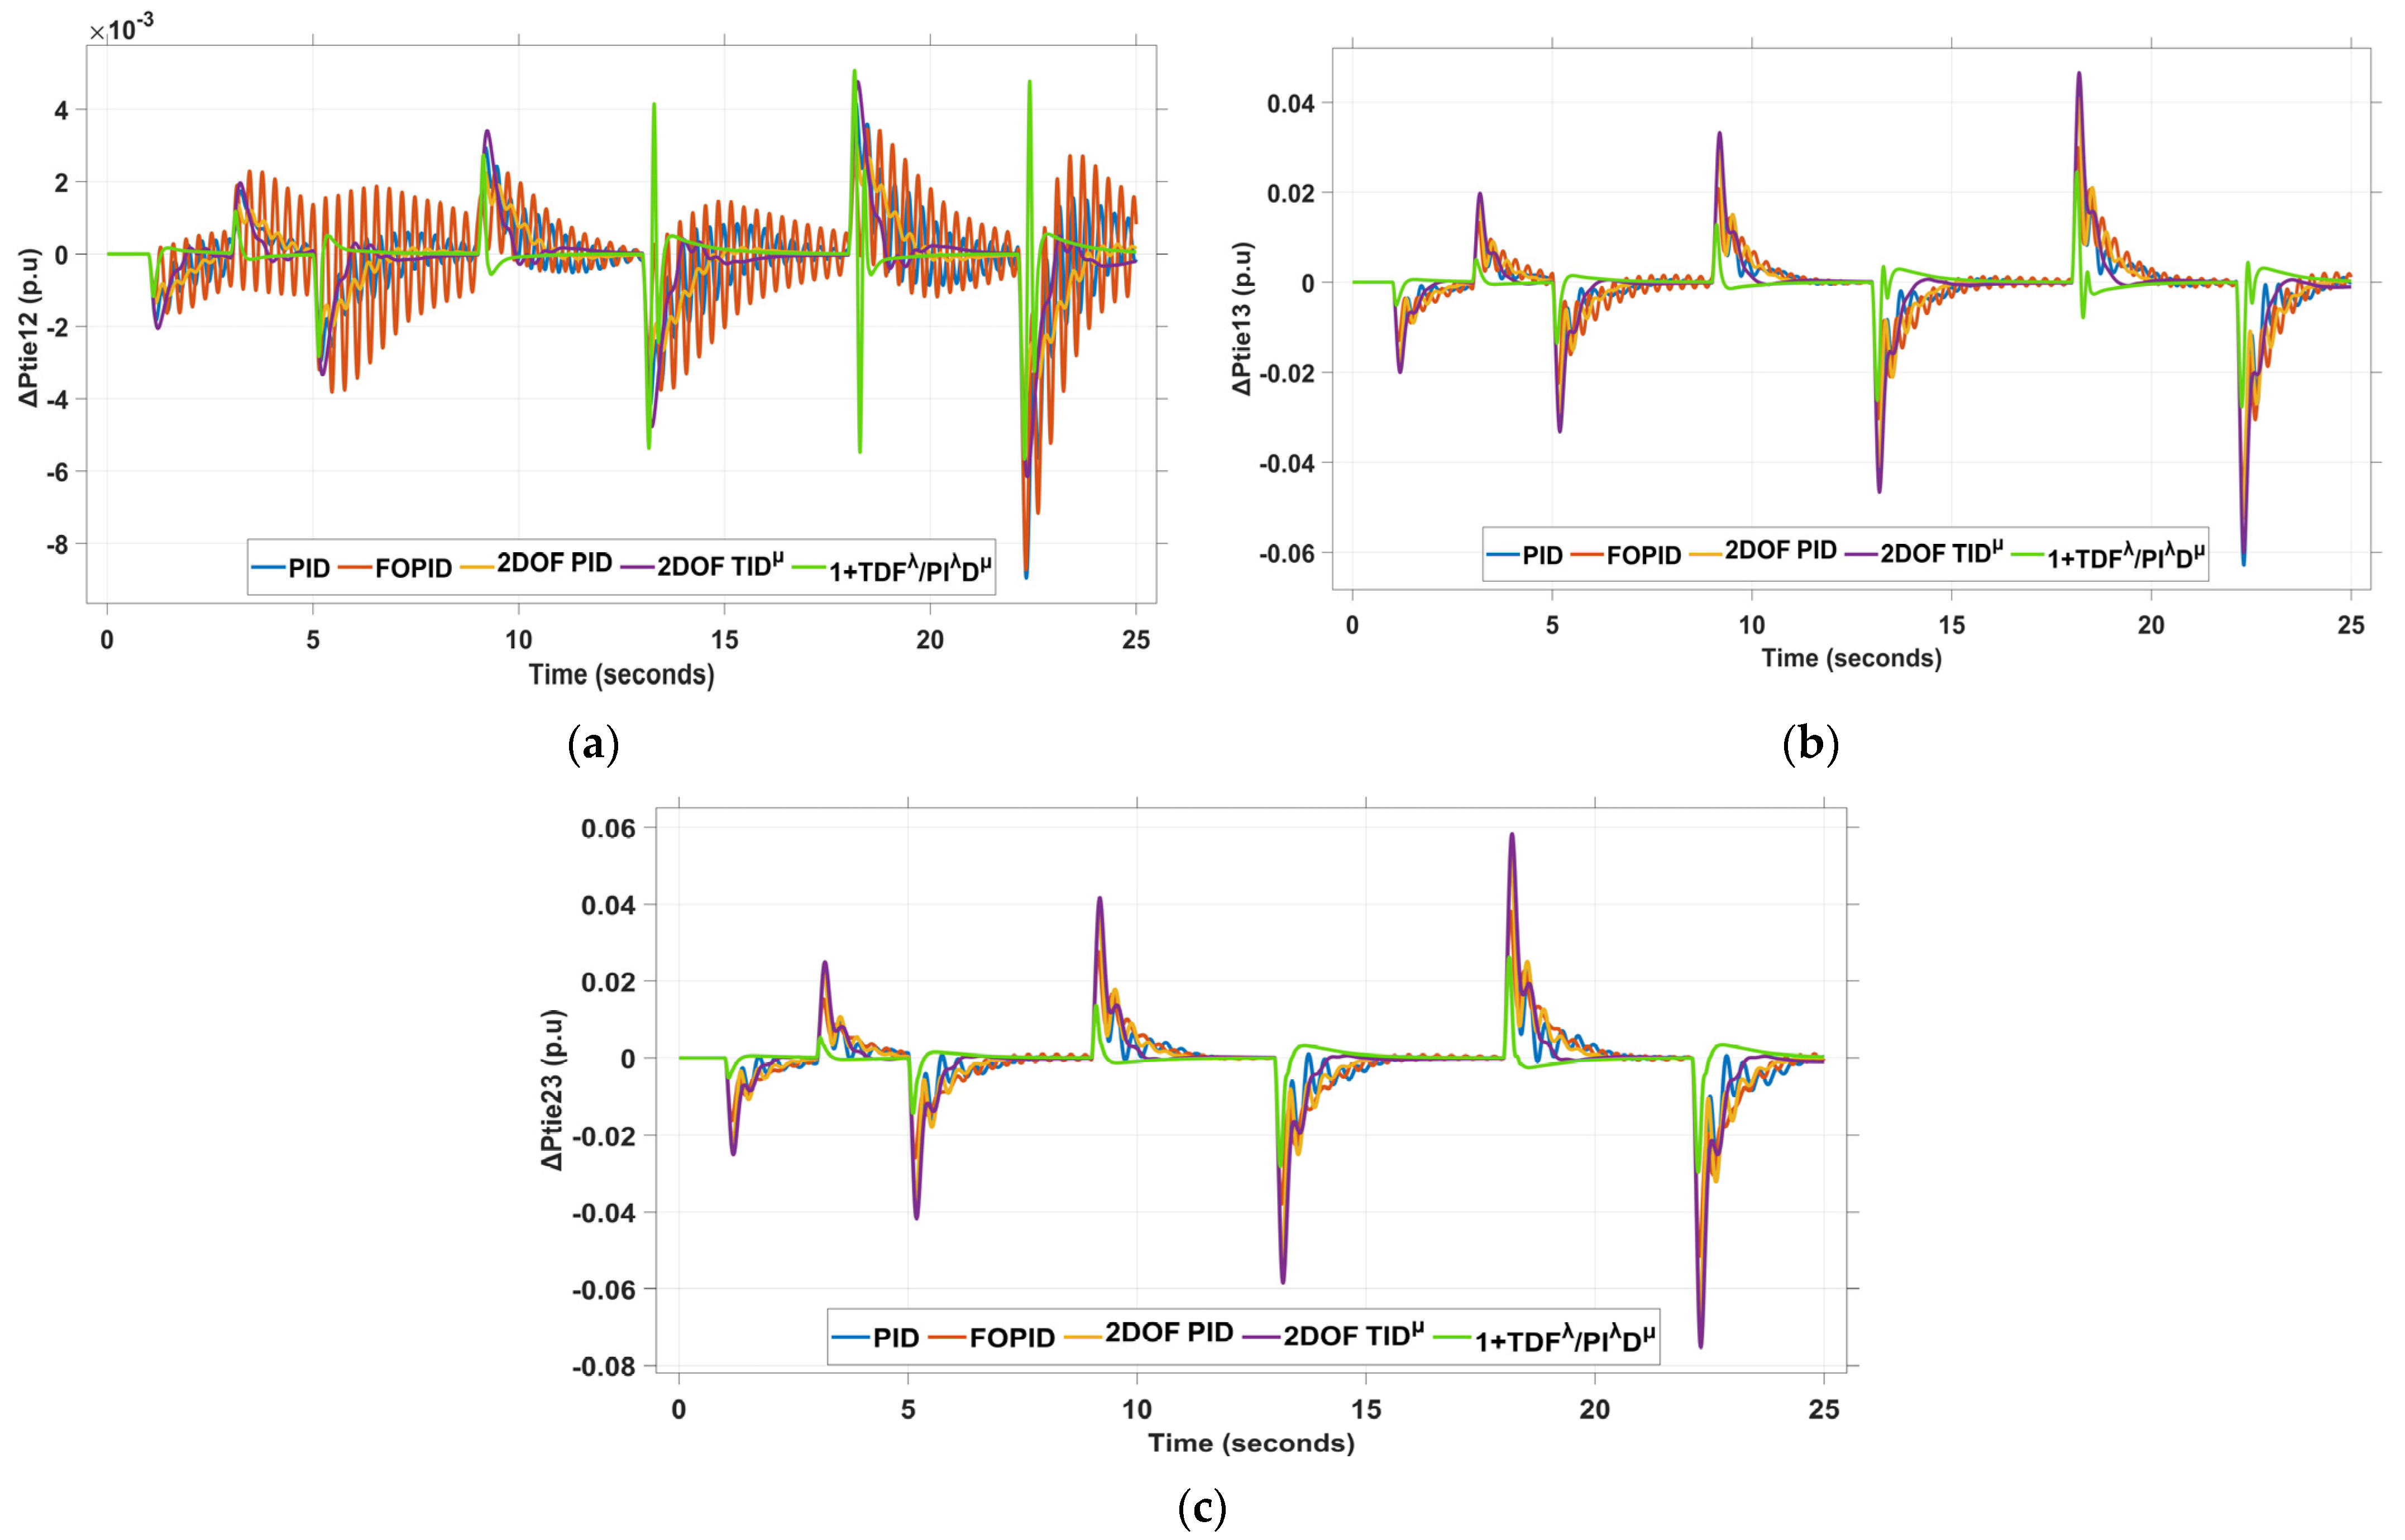
In this scenario, a significant multi-step load disturbance (MSLD) pattern is applied to both Area 1 and Area 2. The inserted MSLD profile is illustrated in Figure 19. The performance of the proposed DRA-based 1+TDFλ/PIλDμ controller is evaluated under this challenging condition, revealing its effectiveness and robustness. The MSLD scenario is designed to simulate realistic, sequential changes in connected loads, which could result either from abrupt load disconnections or forced generator switching sequences. Figure 20 and Figure 21 depict the system’s frequency and power deviation responses under this extreme multi-step load disturbance, for which the proposed controller has been specifically designed.
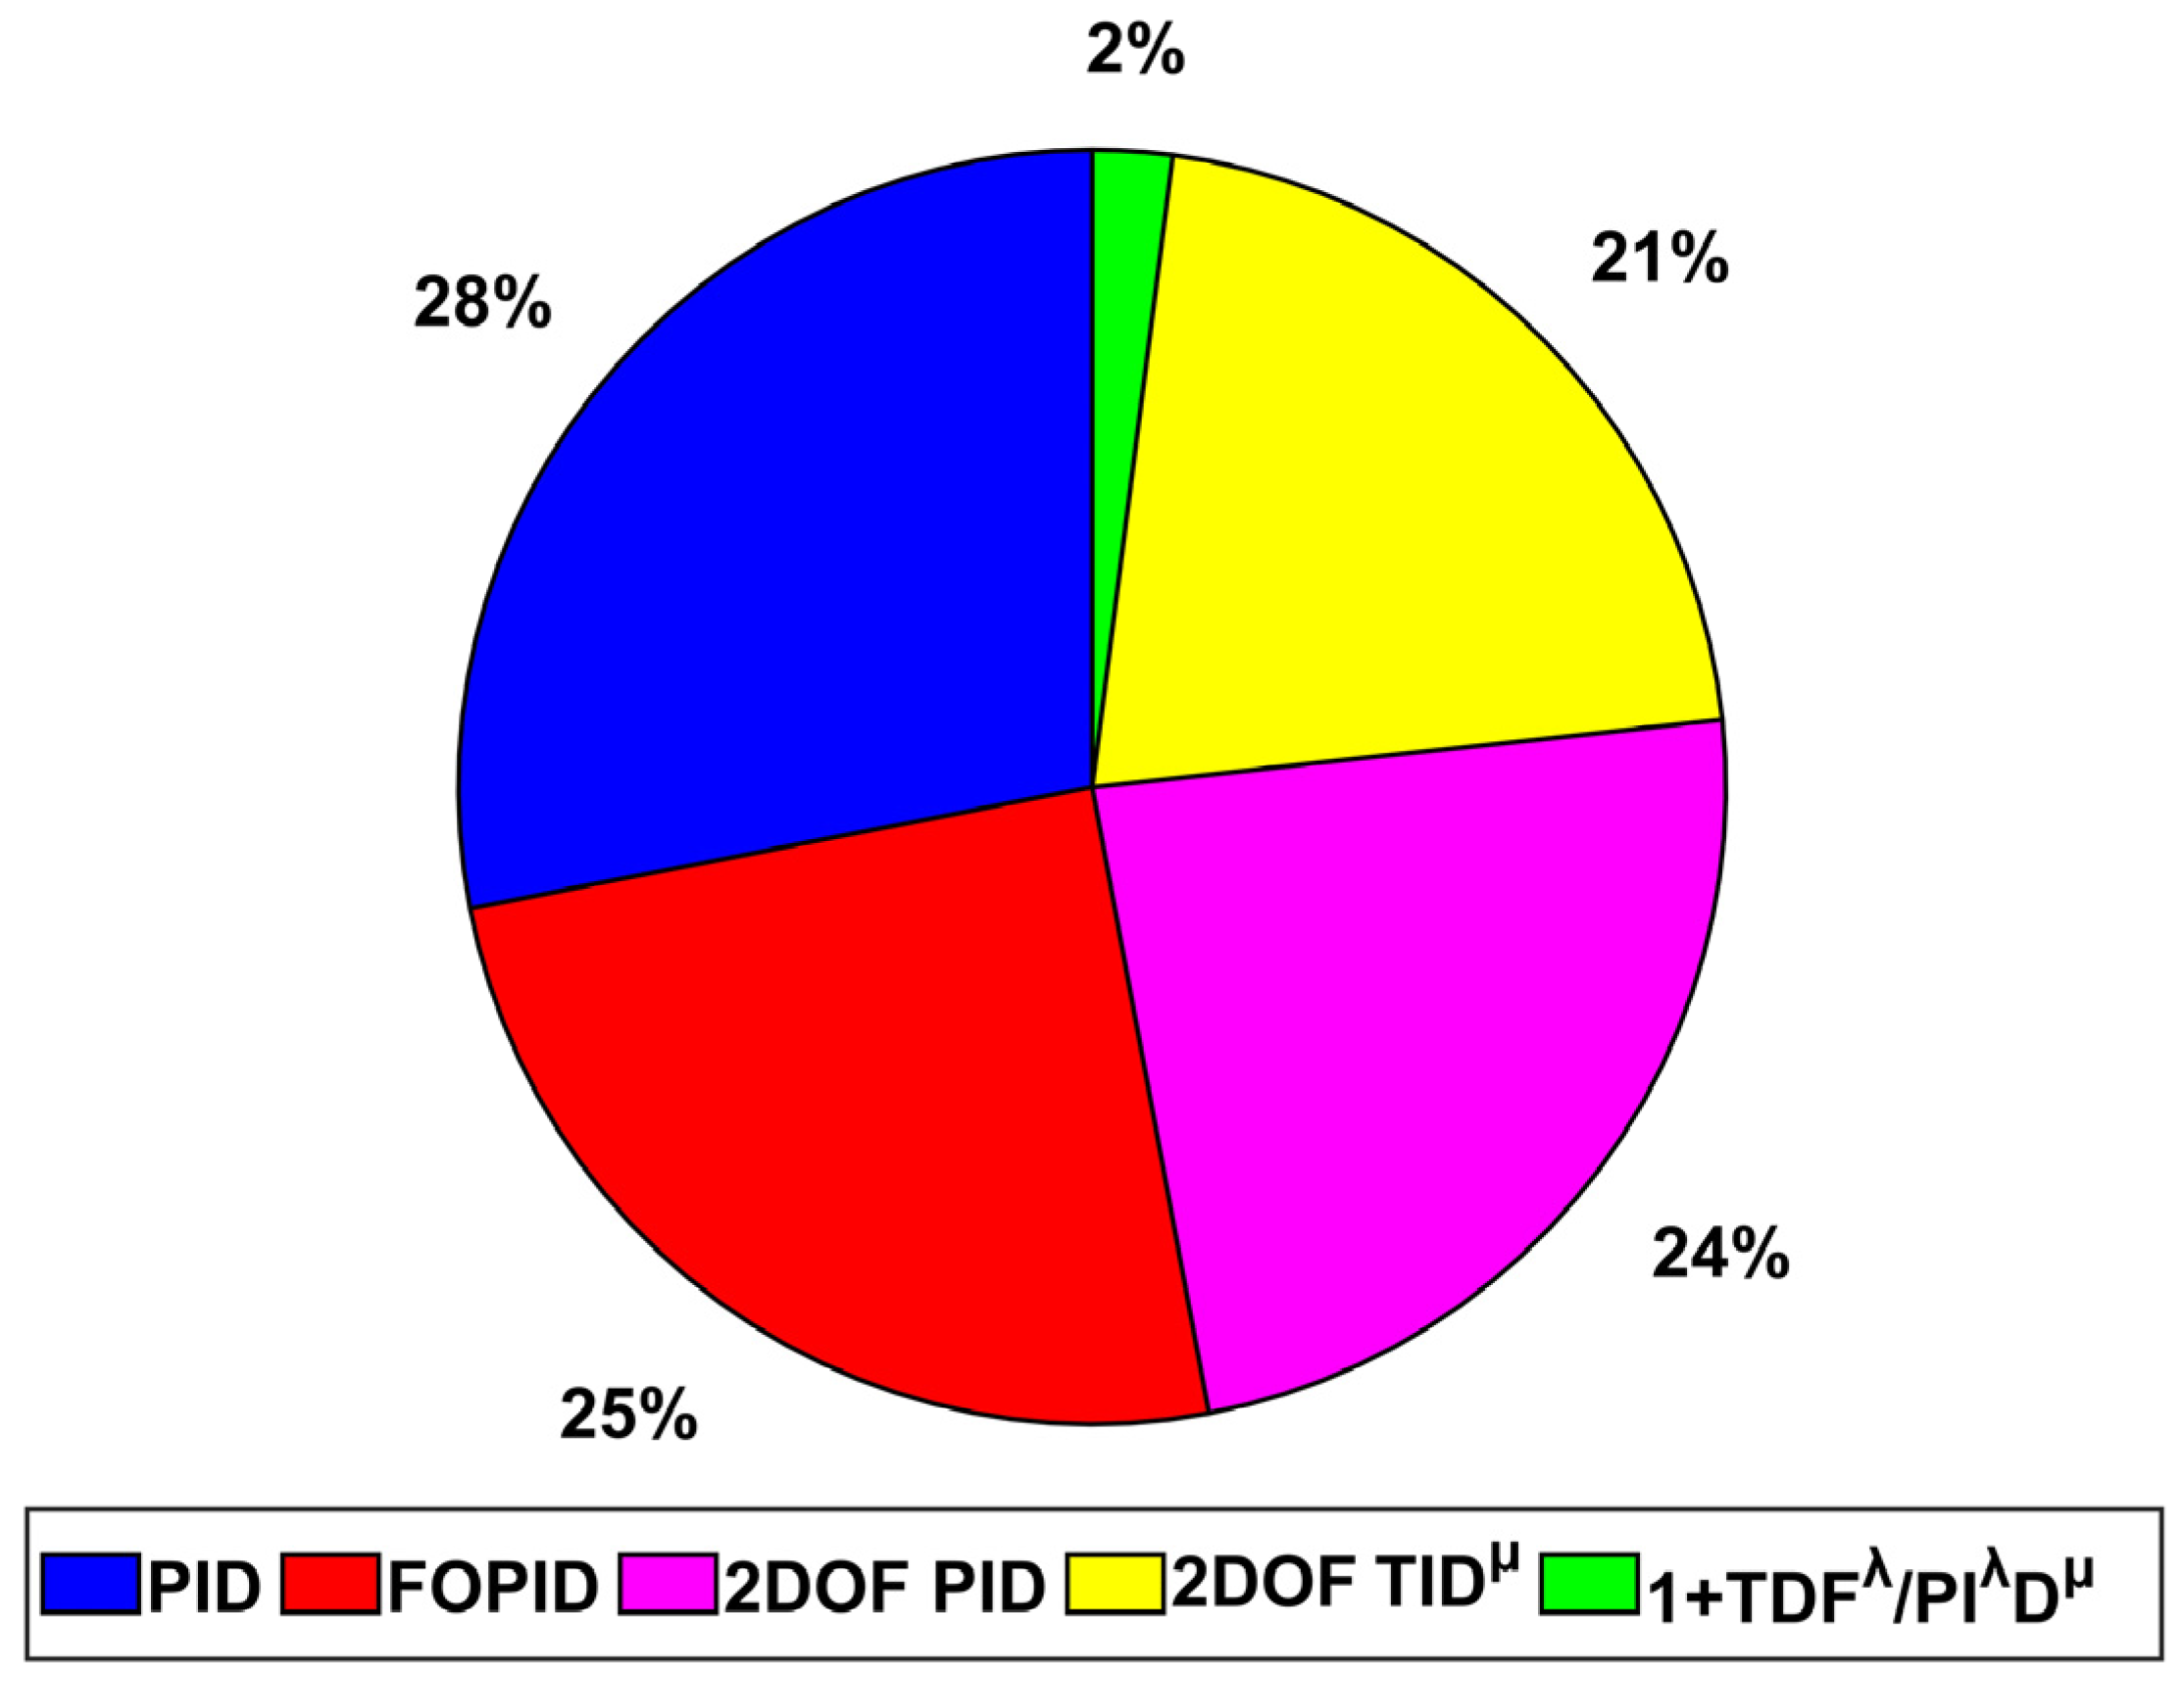
Compared to conventional control strategies, the proposed approach results in significantly reduced percentage deviations and faster response times. As shown in Figure 22, the DRA-based 1+TDFλ/PIλDμ controller successfully minimizes the total ITAE percentage to a low value of 2%. This represents a performance improvement of 92.8%, 92%, 91.6%, and 90.5% compared to the PID, FOPID, 2DOF-PID, and 2DOF-TIDμ controllers, respectively. Therefore, Figure 22 clearly highlights the superior performance of the proposed controller over existing alternatives, demonstrating its capability to maintain system stability and enhance dynamic response under severe load variations.

4.3. Scenario 3: Pulse Load Disturbance (PLD) in Area 1 and Area 2

Throughout the entire simulation duration of 25 s, as illustrated in Figure 23, a severe pulse load disturbance (PLD) with a progressively increasing amplitude is applied to both Area 1 and Area 2. The corresponding dynamic responses in terms of area frequencies and tie-line power oscillations are presented in Figure 24 and Figure 25, respectively. The simulation outcomes clearly demonstrate that the proposed DRA-based 1+TDFλ/PIλDμ controller exhibits superior damping performance compared to previously established control strategies. It effectively suppresses oscillations and achieves rapid stabilization in both frequency and tie-line power deviations, even under the high-amplitude and time-varying PLD scenario.
Figure 26 provides a pie chart highlighting the comparative improvement in ITAE achieved by the proposed controller. Notably, the proposed DRA-based 1+TDFλ/PIλDμ regulator contributes to a 10% share of the total ITAE, outperforming conventional controllers such as PID, FOPID, 2DOF-PID, and 2DOF-TIDμ, which account for 26%, 24%, 21%, and 18% of the total error, respectively. This performance not only underscores the enhanced damping capabilities of the proposed controller but also validates its robustness and adaptability under harsh operational conditions induced by severe PLDs.

4.4. Scenario 4: PV Integration in Area 1

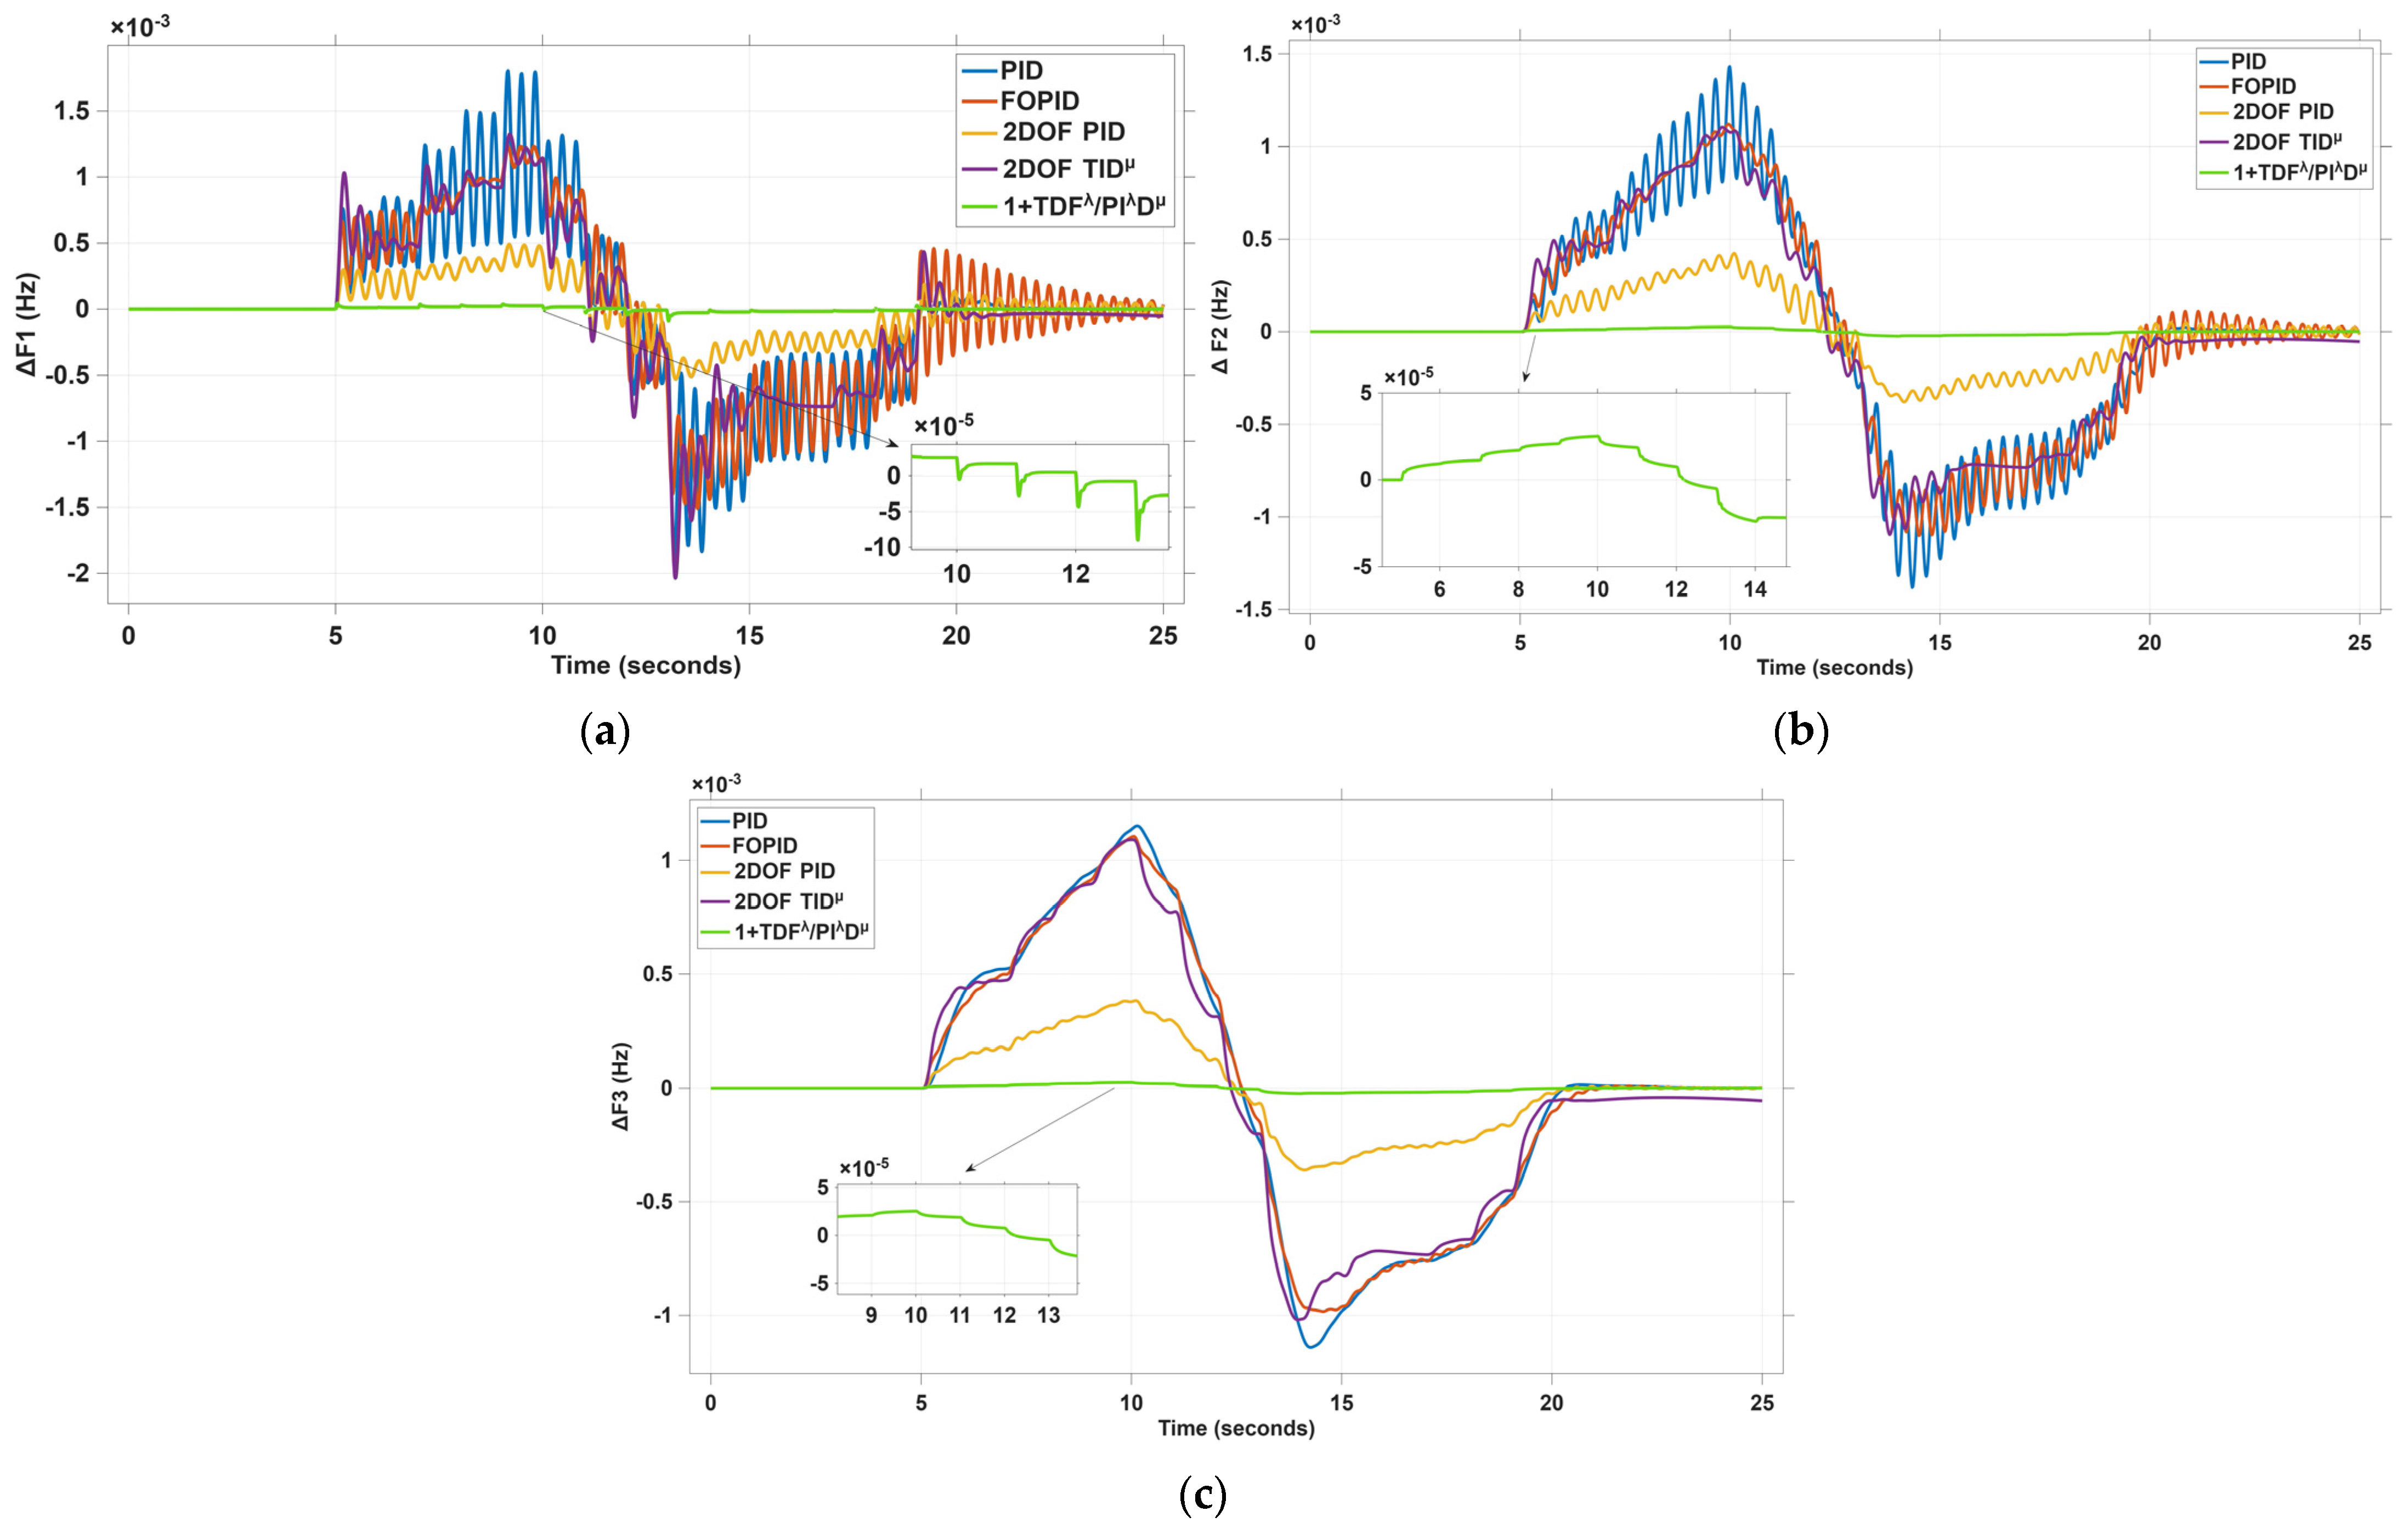
This section evaluates the effectiveness of the proposed DRA-based 1+TDFλ/PIλDμ regulator in enhancing system robustness under the influence of significant photovoltaic (PV) power penetration, specifically by integrating a PV unit into Area 1. The PV power profile used in the simulation, shown in Figure 3, closely mirrors realistic solar generation patterns, peaking at 0.25 P.U around midday. To benchmark performance, a comparative analysis was conducted using several advanced control strategies, including DRA-based PID, FOPID, 2DOF-PID, and 2DOF-TIDμ regulators. The results clearly demonstrate the superior dynamic performance of the proposed 1+TDFλ/PIλDμ regulator. As illustrated in Figure 27 and Figure 28, this controller effectively minimizes frequency deviations and tie-line power oscillations, leading to improved overall grid stability.
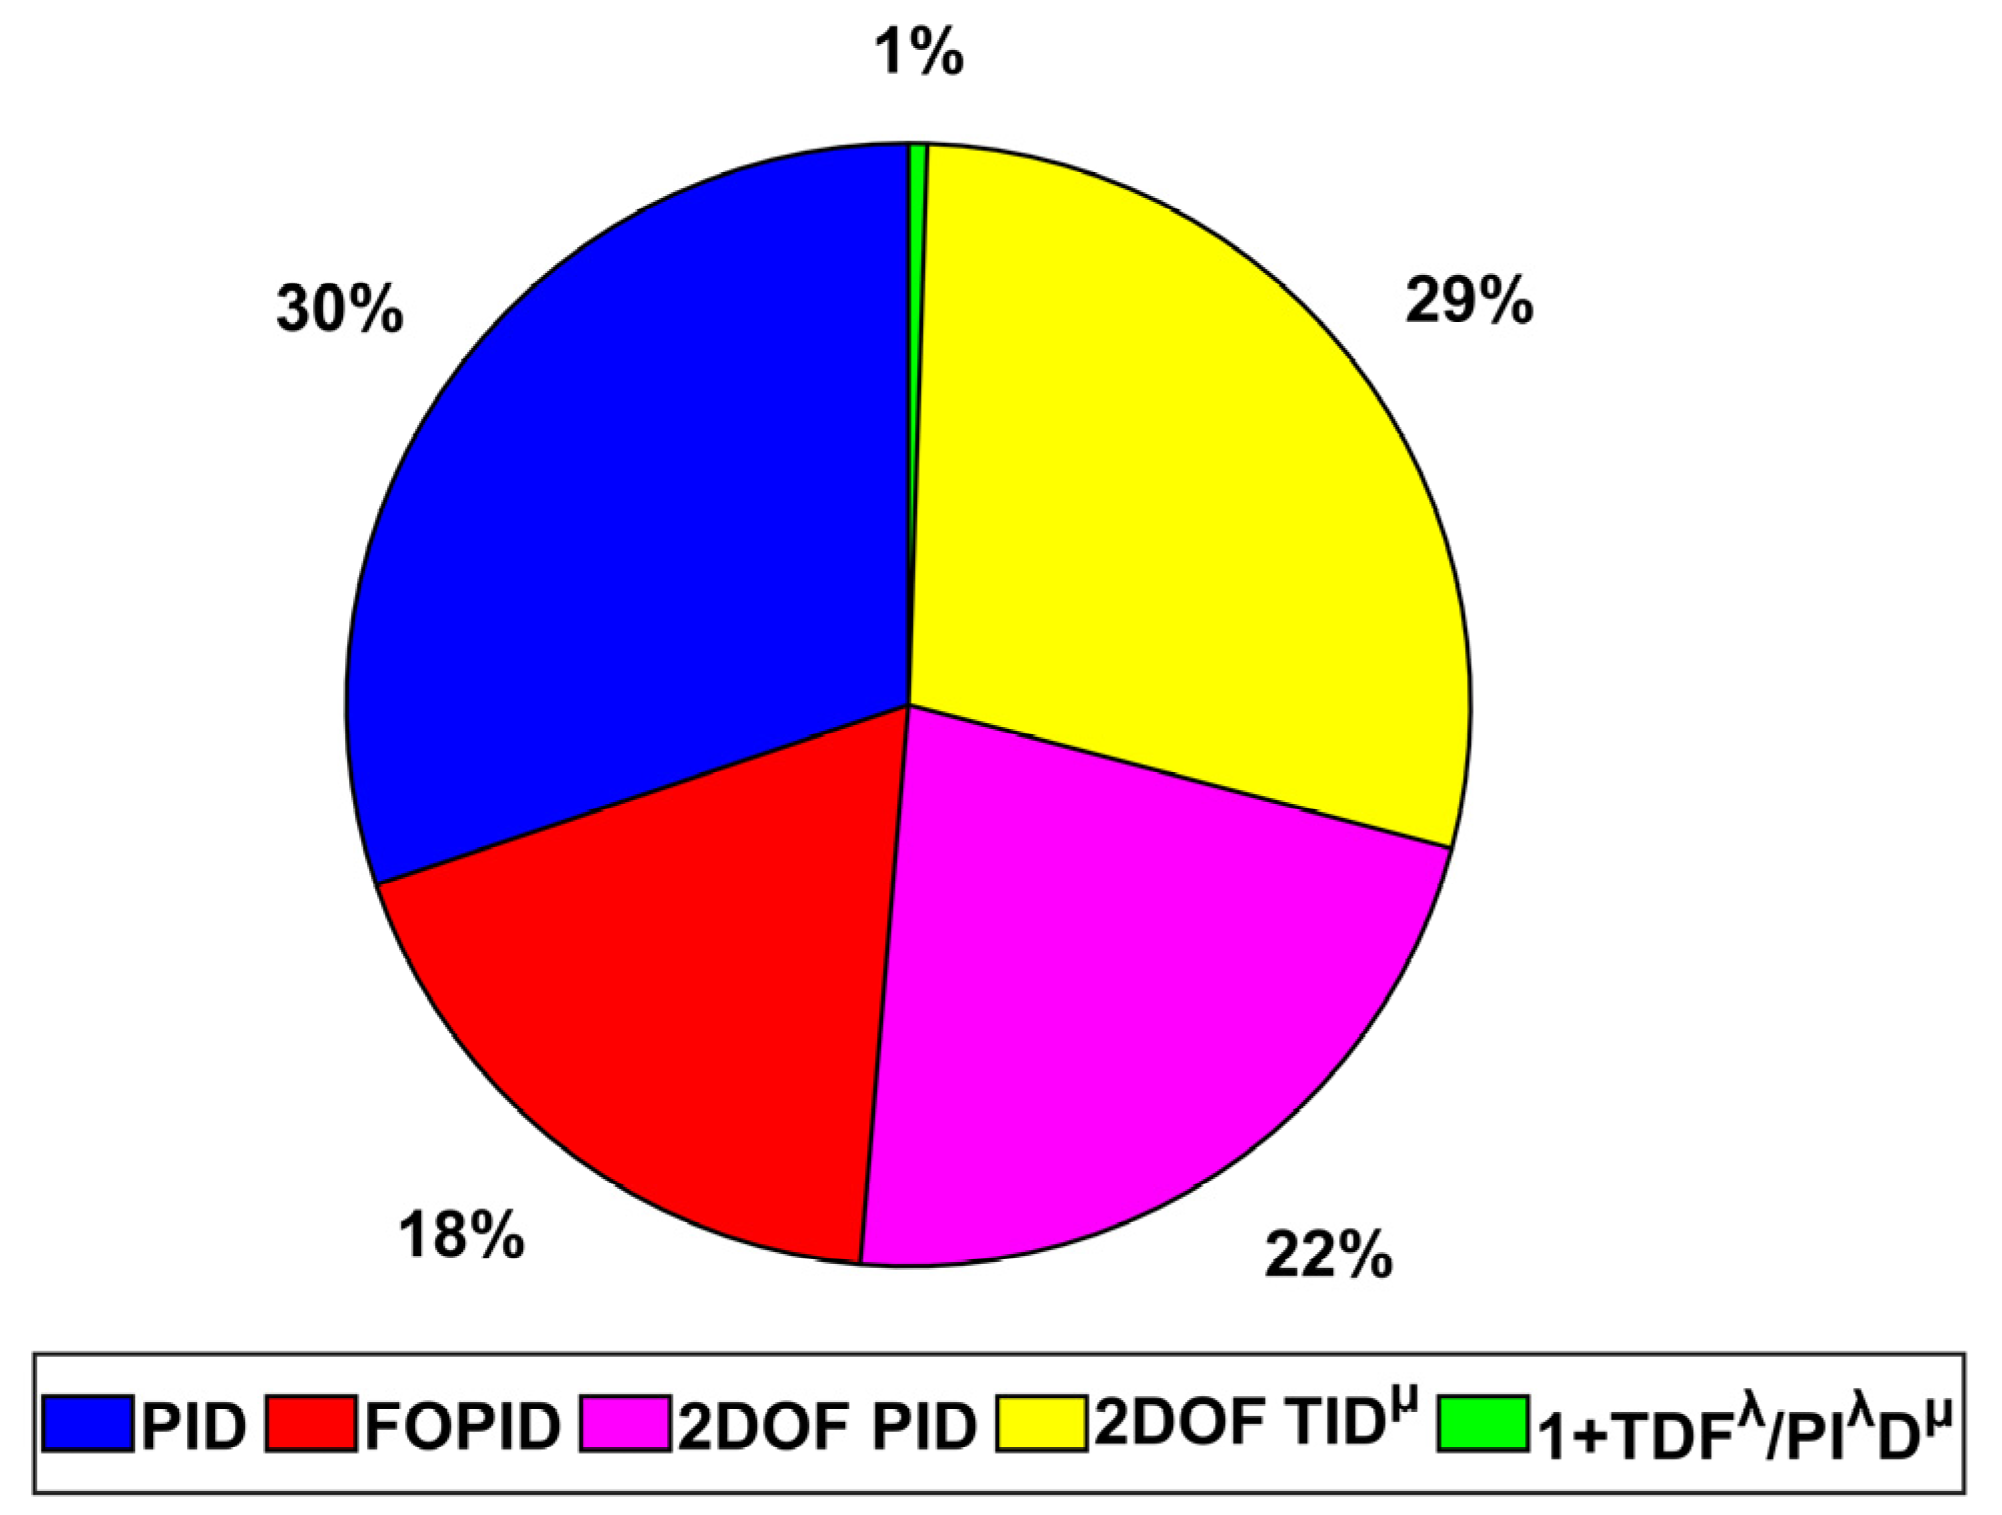
Moreover, Figure 29 presents the percentage ITAE for the evaluated controllers in a pie chart format. The proposed DRA-based 1+TDFλ/PIλDμ regulator achieves the lowest ITAE value at just 1%, significantly outperforming its counterparts. Specifically, its ITAE is approximately 27 times lower than the DRA-based PID, 17 times lower than the FOPID, 29 times lower than the 2DOF-PID, and 26 times lower than the 2DOF-TIDμ regulator—highlighting its pronounced advantage in damping system oscillations and ensuring smoother power system dynamics.

4.5. Scenario 5: Wind Integration in Area 2

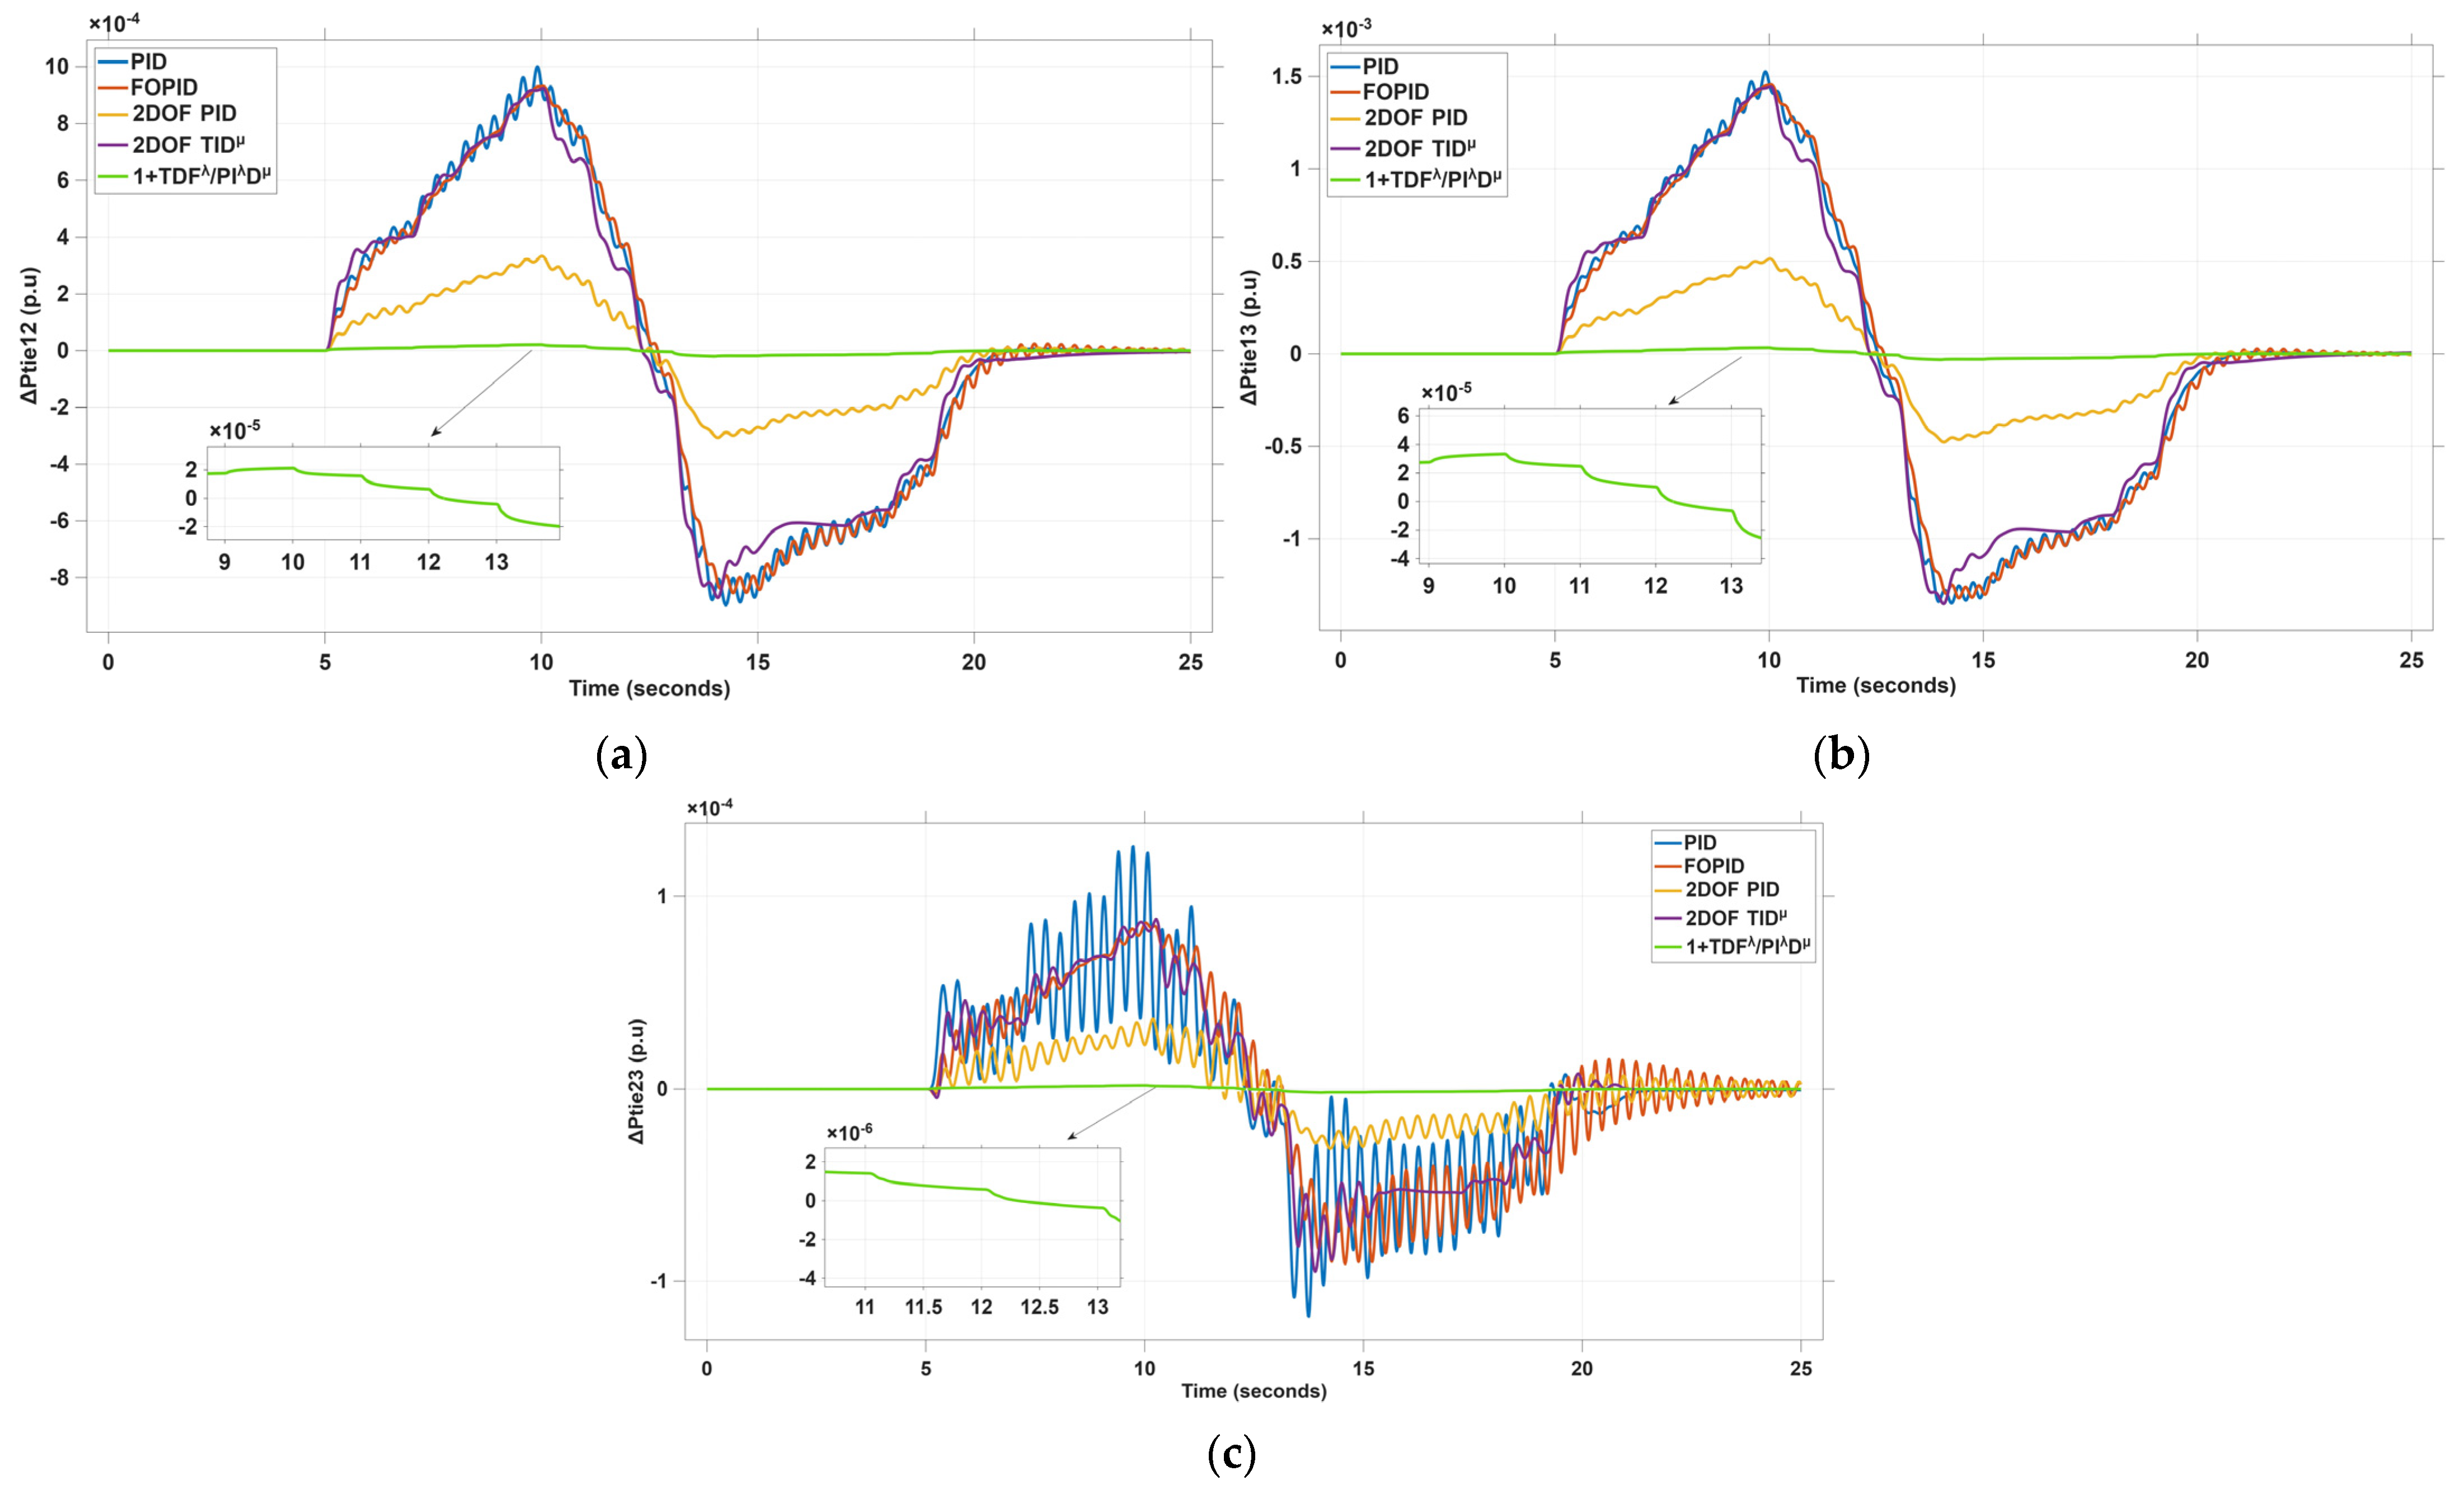
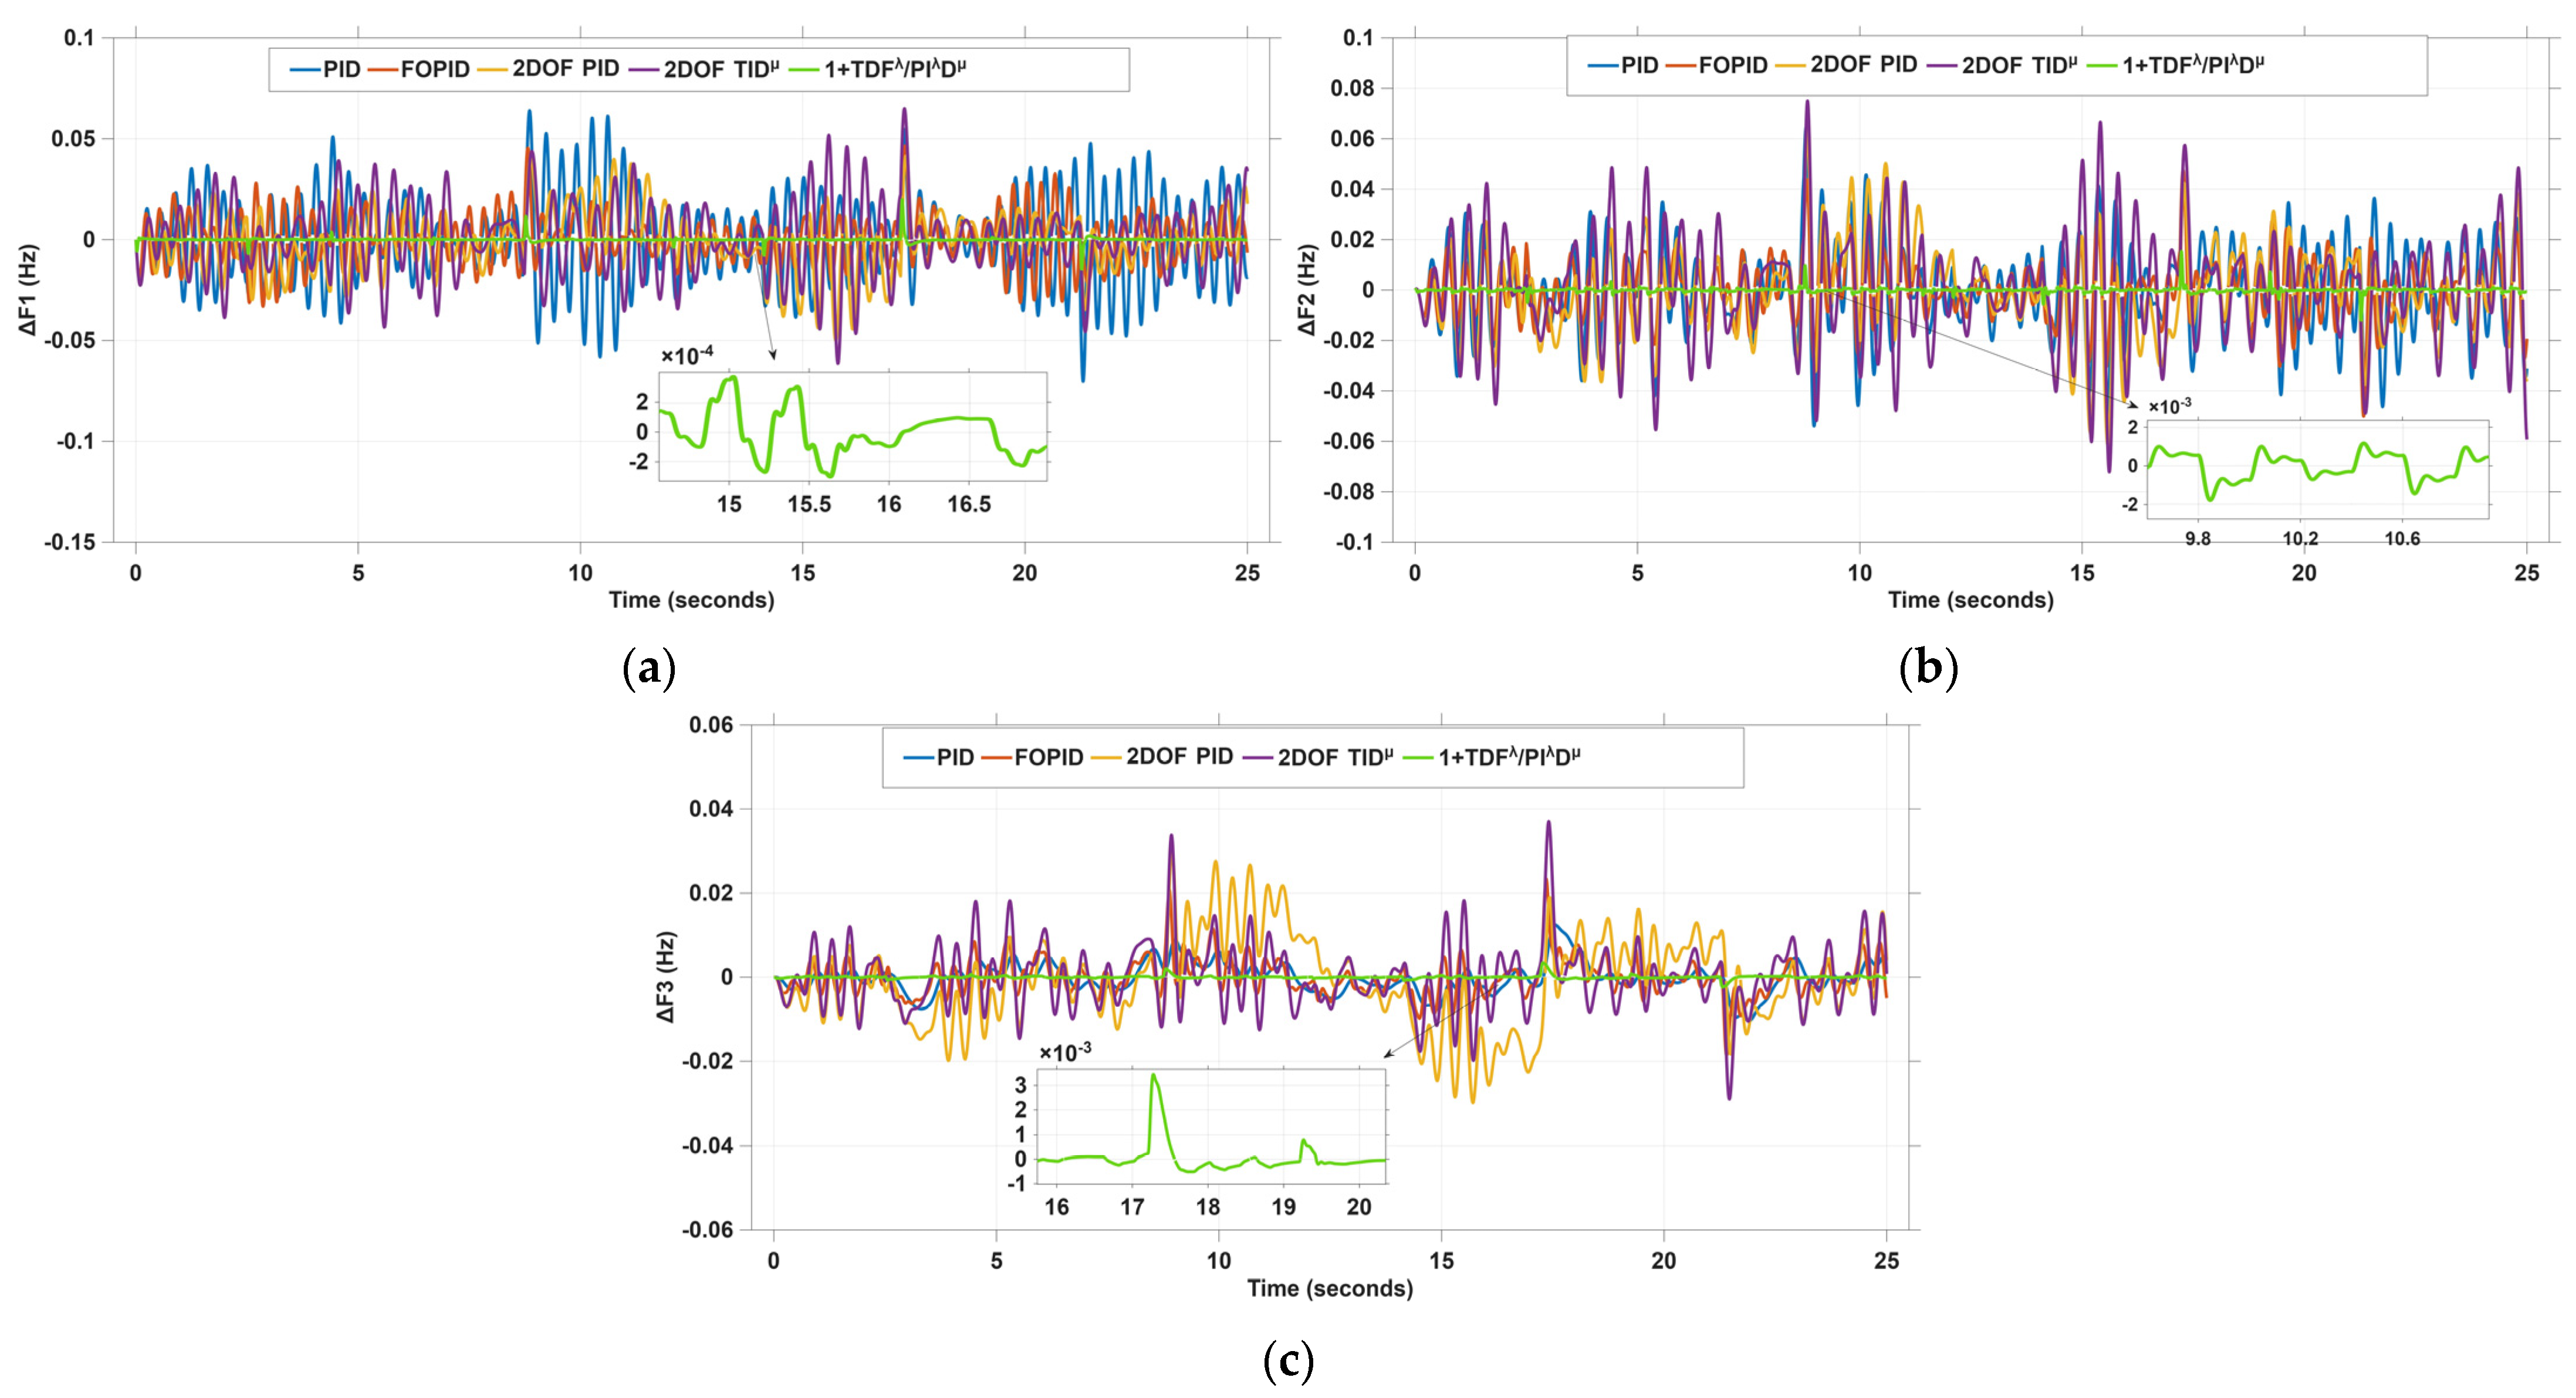
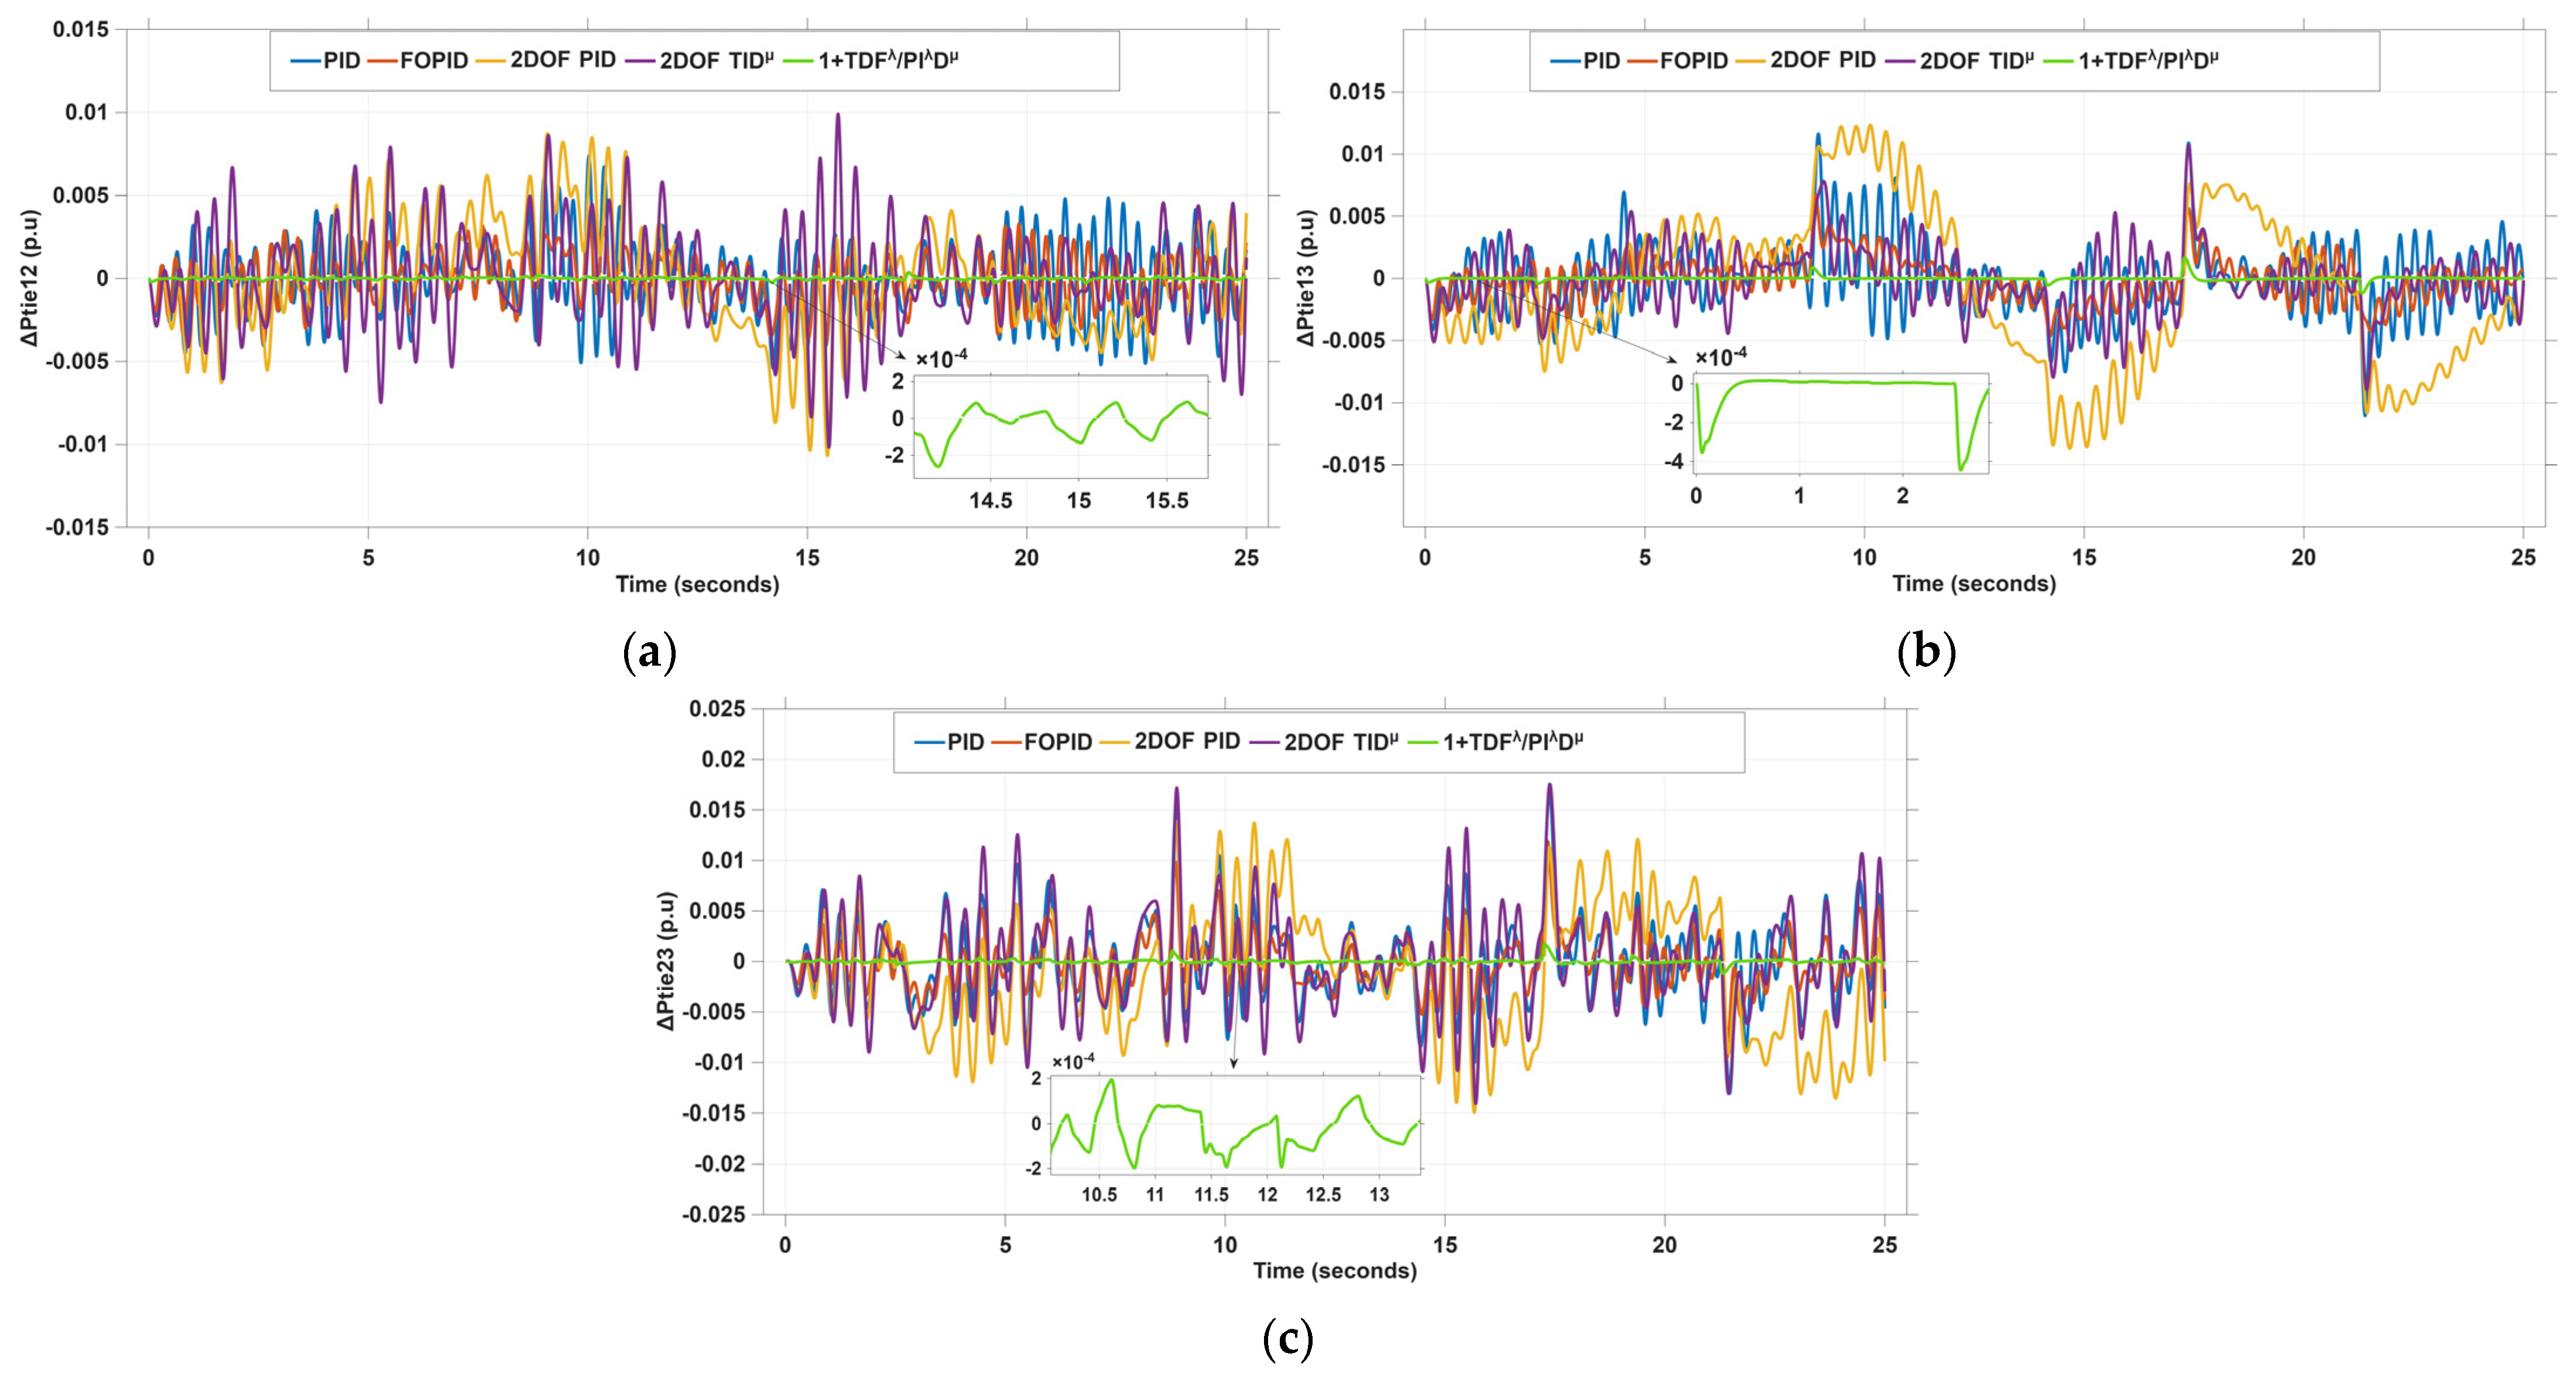
This subsection evaluates the robustness of the proposed DRA-optimized 1+TDFλ/PIλDμ controller in handling the dynamic challenges introduced by high levels of wind power integration, specifically through the addition of a wind turbine unit in Area 2. Figure 5 illustrates the wind power fluctuations imposed on the system, which range between 0.03 and 0.2 P.U. To validate the controller’s effectiveness, a comparative analysis is conducted against several conventional and advanced control strategies, including PID, FOPID, 2DOF-PID, and 2DOF-TIDμ controllers—each tuned using the DRA. As depicted in Figure 30 and Figure 31, the inclusion of wind power leads to noticeable disturbances in system frequency and tie-line power exchange. The resulting dynamic responses (ΔF1, ΔF2, ΔF3, ΔPtie12, ΔPtie13, and ΔPtie23) clearly demonstrate the proposed controller’s superior capability to suppress oscillations and stabilize system behavior. These results highlight its adaptability in maintaining frequency regulation and ensuring smoother power interchange among areas under fluctuating renewable input conditions.
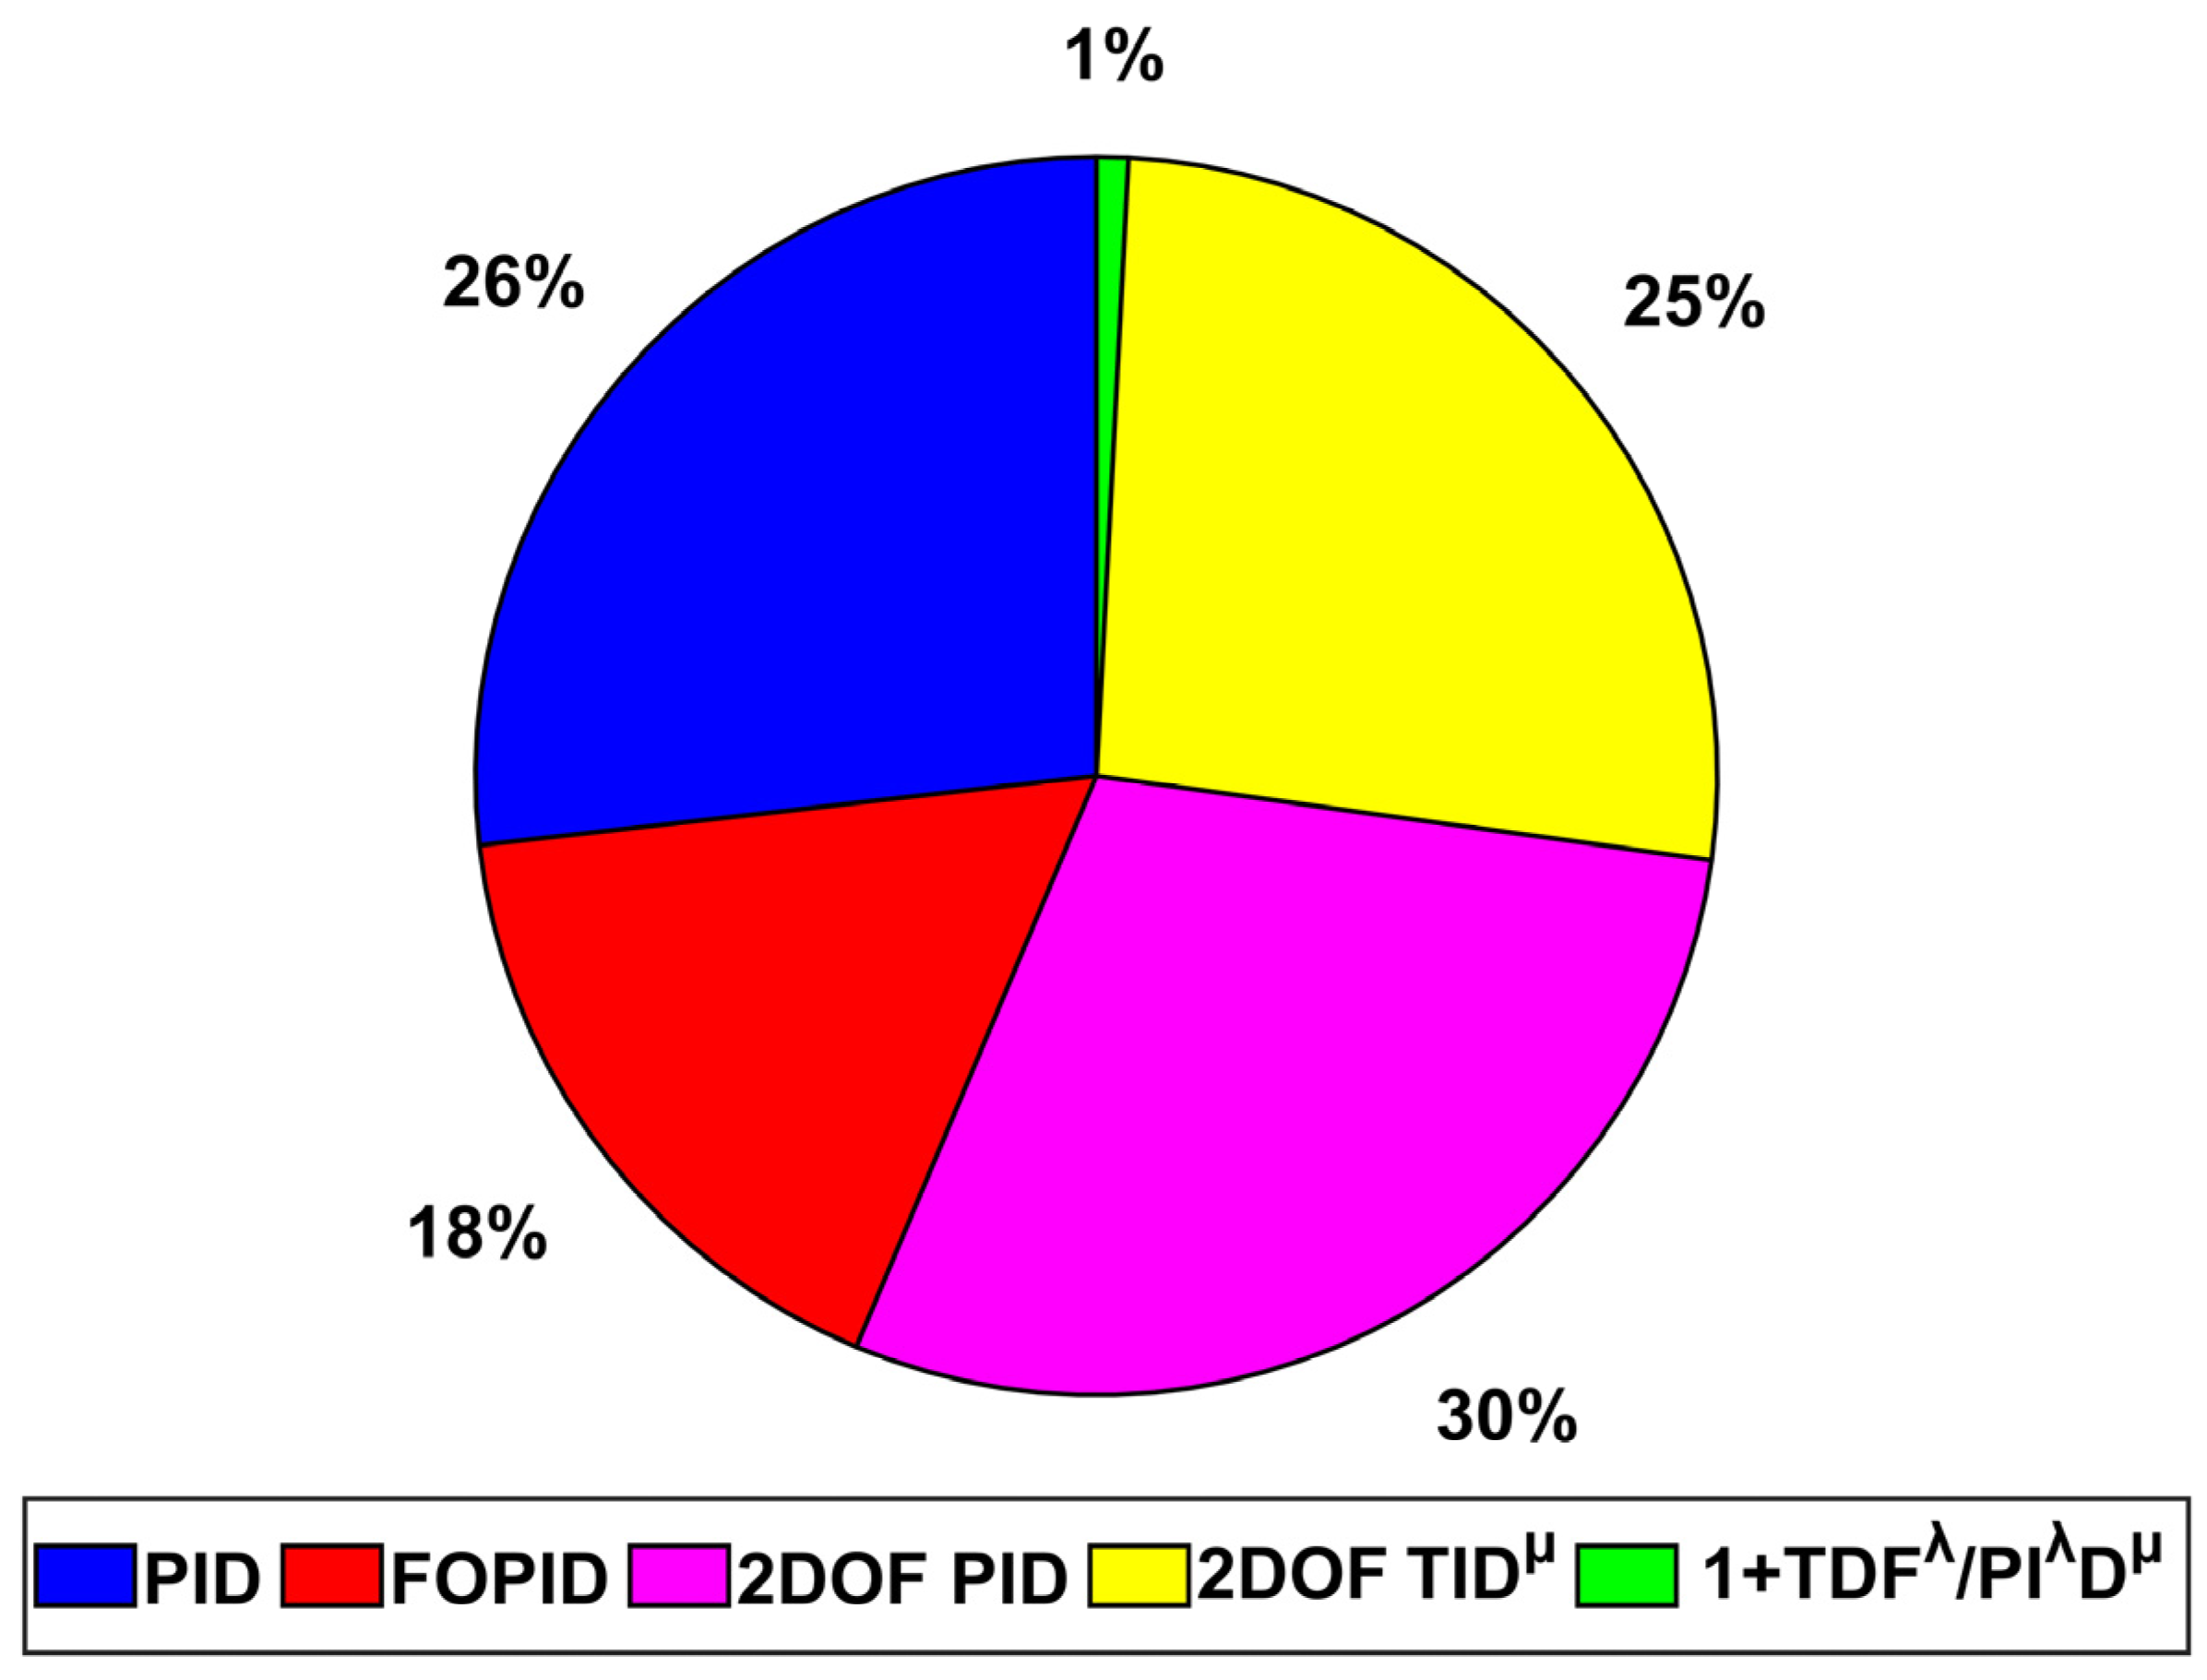
Furthermore, Figure 32 presents a pie chart summarizing the performance of the tested controllers based on the percentage of the ITAE. The DRA-based 1+TDFλ/PIλDμ controller achieves the lowest ITAE contribution, accounting for just 1% of the total error. This corresponds to significant performance enhancement of approximately 96.6%, 94.4%, 95.5%, and 96.5% when compared to the PID, FOPID, 2DOF-PID, and 2DOF-TIDμ controllers, respectively. This consequently affirming the proposed method’s effectiveness in enhancing system resilience under renewable variability.

4.6. Scenario 6: PV/Wind Integration and MSLD in Area 1 and Area 2

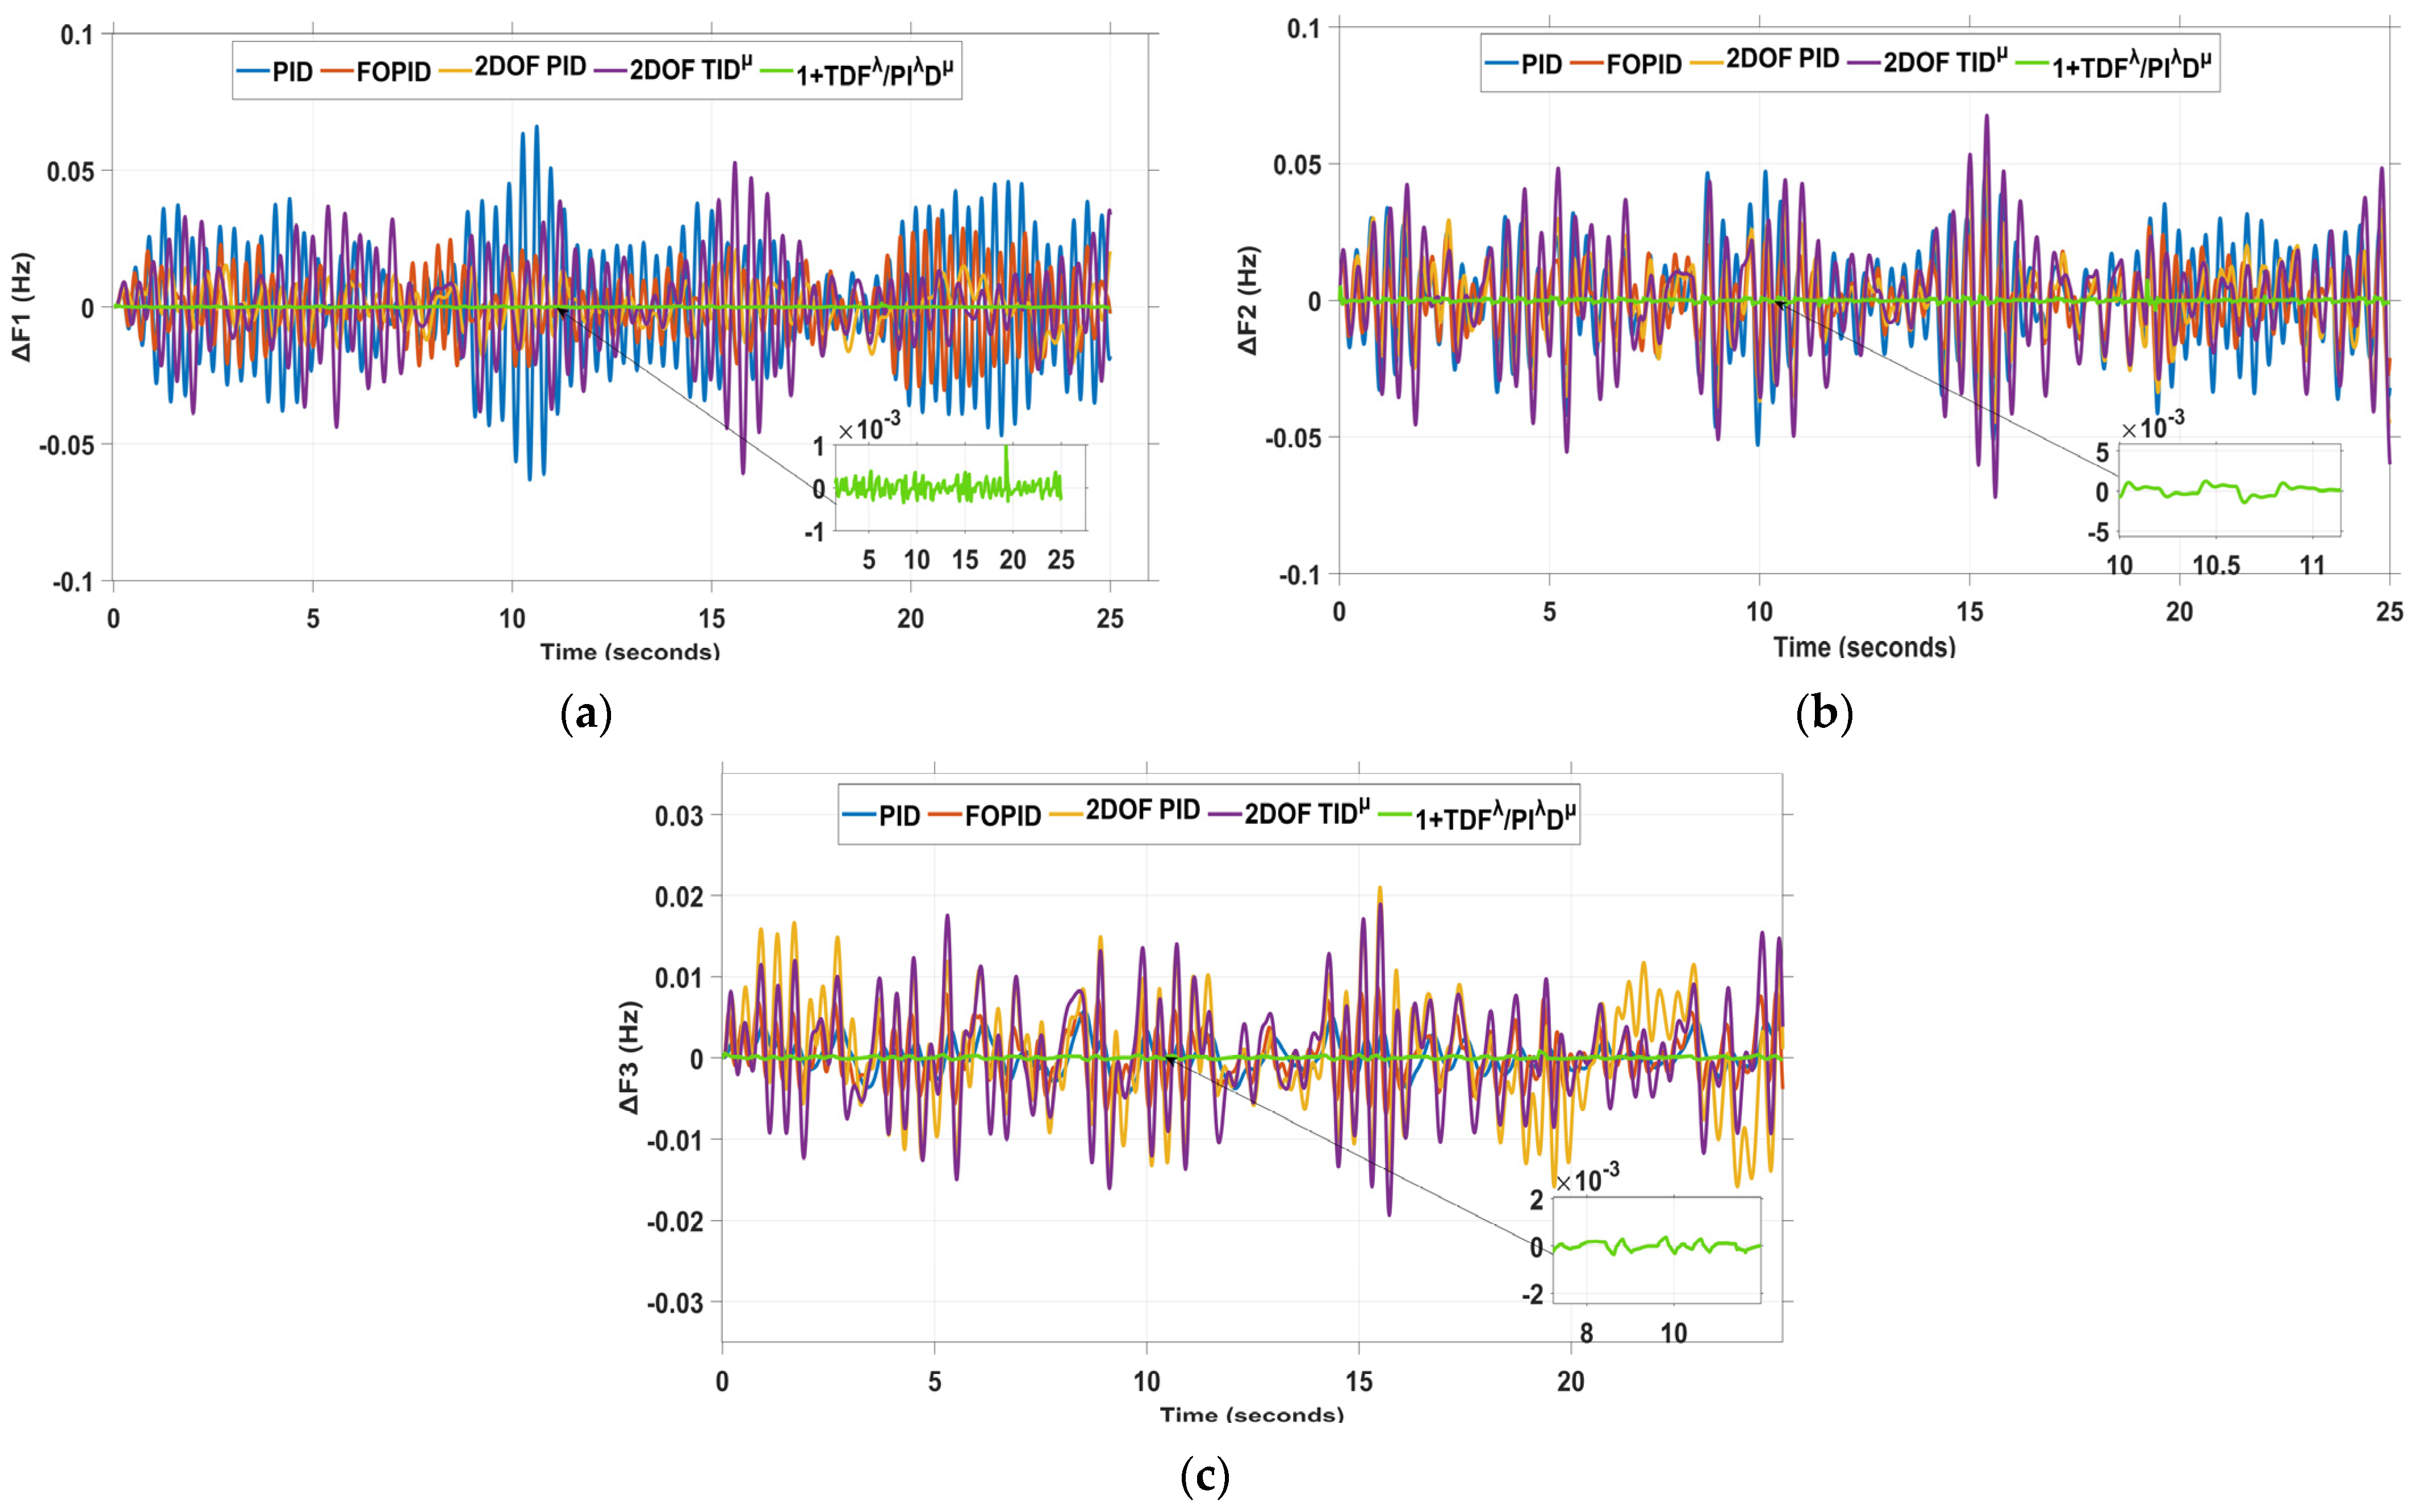
To rigorously assess the robustness of the proposed 1+TDFλ/PIλDμ controller, a more demanding operating scenario was considered. Specifically, the PV generation profile (Figure 3) was introduced into Area 1 of the test system, in conjunction with the MSLD profile (Figure 19), while Area 2 was subjected to the wind energy profile (Figure 5) combined with the same MSLD fluctuations as in Area 1. To evaluate the effectiveness of the proposed controller, its performance was benchmarked against several advanced control techniques, including the DRA-based PID, FOPID, 2DOF-PID, and 2DOF-TIDμ regulators. The comparative results, depicted in Figure 33 and Figure 34, reveal that the 1+TDFλ/PIλDμ controller exhibits significantly enhanced dynamic behavior, demonstrating superior capability in suppressing frequency deviations and reducing tie-line power oscillations, thereby contributing to improved grid stability under harsh conditions.
Additionally, the performance metrics are further substantiated by the ITAE-based analysis shown in Figure 35, where the proposed controller achieves the lowest percentage ITAE value (just 1%). This represents a substantial performance gain, with the ITAE being approximately 26 times lower than that of the DRA-based PID, 18 times lower than the FOPID, 30 times lower than the 2DOF-PID, and 25 times lower than the 2DOF-TIDμ controllers. These findings underscore the controller’s exceptional proficiency in damping system oscillations and delivering smoother, more reliable power system dynamics.

4.7. Scenario 7: Sensitivity Analysis

Sensitivity refers to a system’s resilience in the face of perturbations to its parameters within a predefined tolerance range. In this section, the power system’s resilience is evaluated by modifying system parameters such as B i , R i , T G i , T T i , T P i , K P i , T 12 , T 13 , and T 23 , where i denotes the area number. These parameters are varied from their nominal values by ± 25 % , without altering the optimal settings of the proposed 1+TDFλ/PIλDμ controller used in Case 1. The results of the system’s performance are presented in Table 4 for a 5% step load change in both Area 1 and Area 2, under nominal and perturbed parameter conditions. When the aforementioned parameters are varied, the dynamic responses of ΔF1, ΔF2, ΔF3, ΔPtie12, ΔPtie13, and ΔPtie23 are only slightly affected. Moreover, the overshoot (OS), undershoot (US), and settling time (ST) exhibit minimal variations compared to normal operation. It is worth noting that the dynamic performance of the proposed system remains unaffected by changes in other system parameters. Consequently, the DRA-based 1+TDFλ/PIλDμ controller demonstrates reliability and high effectiveness in maintaining system stability even under parameter variations.
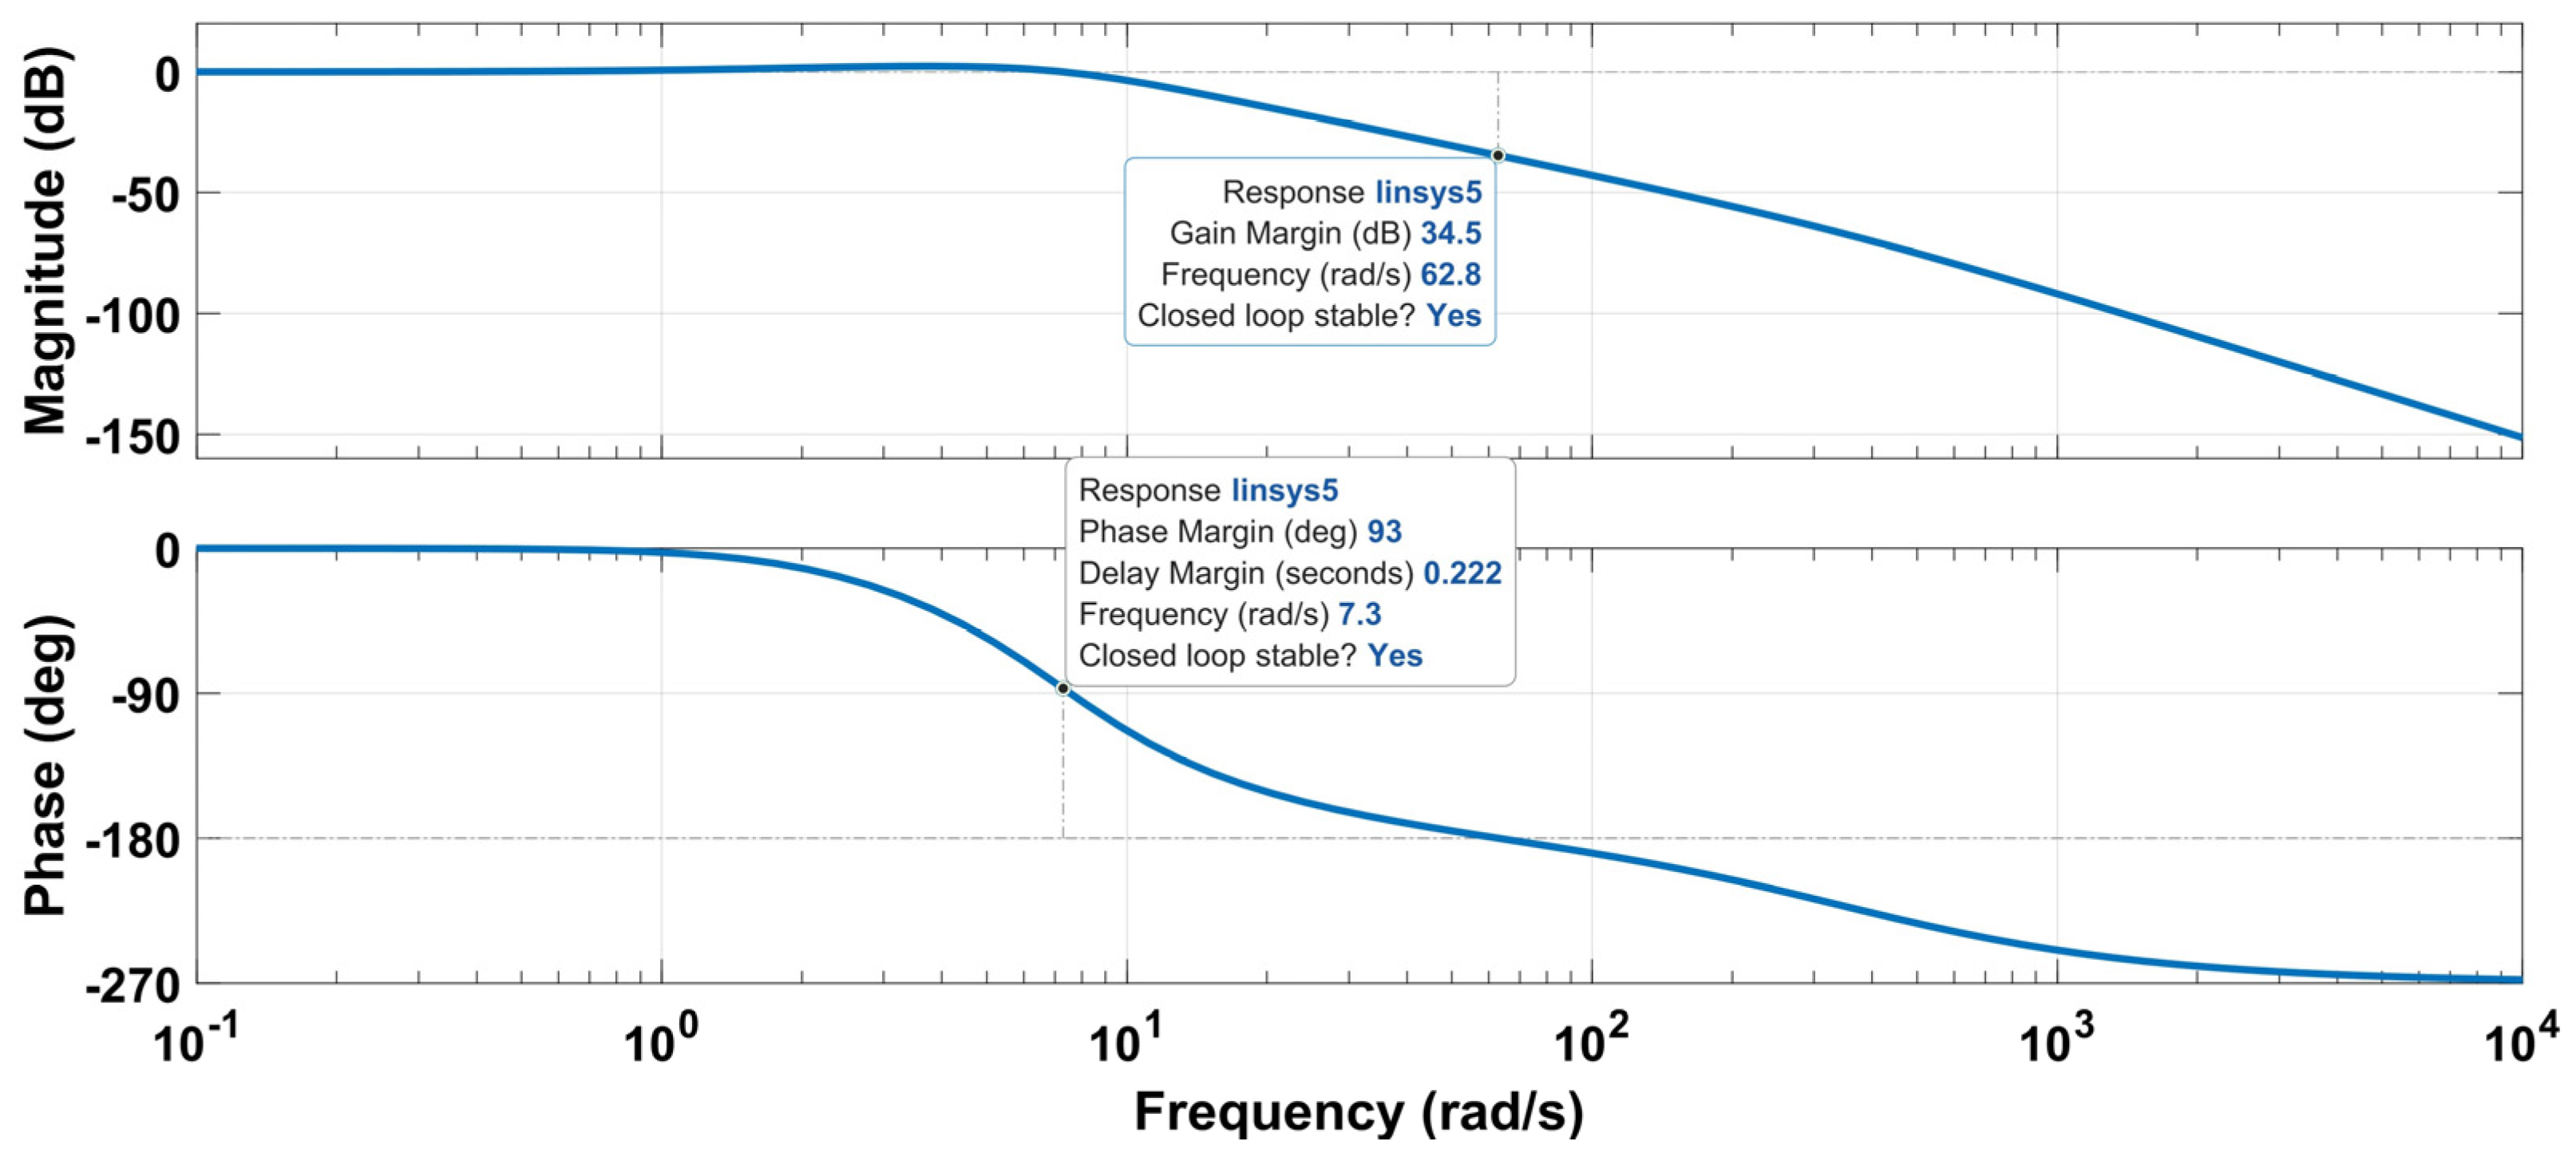
To further substantiate the stability of the proposed 1+TDFλ/PIλDμ controller, frequency-domain analysis was carried out using the Bode plot of the closed-loop system. As shown in Figure 36, the system achieves a gain margin of 34.5 dB at a crossover frequency of 62.8 rad/s and a phase margin of 93° at a frequency of 7.3 rad/s. These large stability margins confirm that the designed controller ensures robust closed-loop performance, providing strong resilience against model uncertainties and disturbances. The positive gain and phase margins, together with the wide stability region, indicate that the proposed cascaded fractional-order structure not only improves dynamic response but also guarantees theoretical stability, thereby complementing the time-domain simulation results.
Finally, from a practical viewpoint, although the proposed 1+TDFλ/PIλDμ controller involves 11 parameters, not all of them must be treated as free decision variables in practice. Several can be predetermined or simplified without significantly compromising performance. For instance, the approximation orders ( N 1 , N 2 ) can be fixed to common values (e.g., 400–500) according to bandwidth and memory limits, as they are implementation choices rather than critical tuning factors. Similarly, the fractional orders can be constrained (e.g., setting λ 2 = 1 and/or μ = 1 ) to reduce the structure to a PID-like form while still benefiting from the TDFλ filtering effect. Alternatively, only one fractional operator may be retained (e.g., λ 2 1 , μ = 1 ) to strike a balance between performance and simplicity. Furthermore, parameter sharing can be adopted by using common fractional orders across areas and tuning only the proportional–integral–derivative gains, or even employing a single common controller for all areas. These simplification strategies demonstrate that, while the full parameter set ensures maximum flexibility during offline optimization, the effective parameter count can be reduced to facilitate practical implementation and maintenance.

5. Conclusions

This work proposed a novel LFC strategy based on a cascaded controller structure (1+TDFλ/PIλDμ) optimized using the recently developed divine religions algorithm (DRA). The presented frequency regulator addresses key challenges in modern power systems, such as reduced inertia and increased sensitivity to load and generation variations resulting from high penetration of renewable energy sources. A comprehensive simulation study was conducted on a triple-area interconnected power system, incorporating real-world considerations including nonlinearities, parameter uncertainties, and the integration of PV and wind energy sources. The effectiveness of the proposed approach was evaluated against several existing controllers (PID, FOPID, 2DOF-PID, and 2DOF-TIDμ) across a wide range of disturbance scenarios. Under a 5 % step load disturbance in Area 1 and Area 2, the proposed controller achieved superior frequency regulation. The DRA-optimized 1+TDFλ/PIλDμ controller consistently minimized the objective function (i.e., ITAE), reaching a value of 0.4704   ×   10 4 , reflecting a 99.5 % improvement over conventional control strategies. In multi-step load disturbance (MSLD) scenario, it demonstrated approximately 90 % performance improvement. During the pulse load disturbance, a 52 % improvement was observed. In renewable integration tests, the controller maintained high stability and dynamic response, achieving approximately 95 % and 94 % improvements in PV and wind integration scenarios, respectively. Furthermore, in the most demanding case of combined PV/wind integration with MSLD in Areas 1 and 2, the controller maintained its robustness with nearly 95 % performance enhancement compared to existing methods. These results demonstrate the controller’s effective disturbance rejection capabilities, adaptability to renewable integration, and resilience under system uncertainties.

6. Challenges and Future Directions

While the proposed 1+TDFλ/PIλDμ controller has shown promising results, several limitations suggest directions for future work. The current validation is limited to specific operating scenarios, whereas real-world power systems are subject to more diverse and unpredictable disturbances. Further testing is needed under complex conditions, such as high penetration of various RESs and potential cyber threats. Additionally, the controller’s high parameter count, particularly in the context of a triple-area system, increases computational demands and complicates real-time tuning. This may limit its applicability in systems with constrained processing capabilities, prompting the need for lightweight optimization strategies or hardware-accelerated implementations.
Future research could explore scaling the framework to larger networks and a broader range of RESs, including wave, biomass, fuel cells, and electric vehicles, while integrating adaptive control and robust cyber-physical security. Employing AI-driven methods, such as predictive control, reinforcement learning, or hybrid optimizers, may enhance responsiveness to dynamic grid conditions. Finally, real-time testing using platforms like OPAL-RT or dSPACE will be essential to validate the approach in practical settings and uncover real-world challenges.

Author Contributions

Conceptualization, A.H.A., A.E. and K.M.A.; Methodology, A.H.A., A.E. and K.M.A.; Software, A.H.A., A.E. and K.M.A.; Validation, A.H.A. and K.M.A.; Formal analysis, A.H.A., A.E. and K.M.A.; Investigation, K.M.A.; Resources, A.I.M., A.E. and K.M.A.; Data curation, A.I.M., A.E. and K.M.A.; Writing—original draft, A.I.M. and K.M.A.; Writing—review & editing, A.I.M. and K.M.A.; Visualization, A.I.M. and K.M.A.; Supervision, A.I.M. and K.M.A.; Project administration, K.M.A.; Funding acquisition, K.M.A. All authors have read and agreed to the published version of the manuscript.

Funding

This research received no external funding.

Data Availability Statement

The original contributions presented in this study are included in the article. Further inquiries can be directed to the corresponding author.

Conflicts of Interest

The authors declare no conflicts of interest.

Appendix A

Table A1. Wind model coefficients.
CoefficientValueCoefficientValue
P W 750   k W C 2 116
V W 15   m / s C 3 0.4
r T 22.9   m C 4 0
ρ 1.225   k g / m 3 C 5 5
A T 1684   m 2 C 6 21
λ T 22.5   r p m C 7 0.1405
C 1 0.6175
Table A2. Mathematical modelling notations of DRA.
SymbolDescription
M The number of missionaries (number of religions)
N The number of all people in the society
M The set of all religions
W j The set of individuals corresponding to a community m j
W The set of all individuals in the community
u j j -th religion in the society ( m j M )
d The maximum number of beliefs of each follower
w j i -th follower in society ( w j W )
C j j Belief vector of follower w j interested in community m j
C j Belief matrix of all followers belonging to community m j
C Belief matrix of all followers in the society
f i j Fitness of follower w j who is a member of community m j
F j Fitness values of attracted followers in community m j
F Fitness values of the entire society (consisting of M religions)
C ( 1 × M ) * Optimal vector of belief attributes in the algorithm
j ^ Community index of the most prominent follower w i *
C ^ i ^ j ^ Belief profile of the most prominent follower w i ^
C ^ j Belief profile of the most prominent follower in community m j
C i ´ j Belief vector of follower w i ´ hoping to join community m j
U ( 1 ,   d ) Arbitrary number with a uniform distribution in the interval [ 1 ,   d ]
i ˘ Identifier index of the weakest follower in community m j
C ˘ i ˘ j Belief profile of the weakest follower w i ˘ in community m j
s j Most prominent follower of community m j
C ^ s j   Belief profile of the most prominent follower s j in community m j

References

  1. Singh, S.P.; Prakash, T.; Singh, V.P.; Babu, M.G. Analytic hierarchy process based automatic generation control of multi-area interconnected power system using Jaya algorithm. Eng. Appl. Artif. Intell. 2017, 60, 35–44. [Google Scholar] [CrossRef]
  2. Gozde, H.; Taplamacioglu, M.C. Automatic generation control application with craziness based particle swarm optimization in a thermal power system. Int. J. Electr. Power Energy Syst. 2011, 33, 8–16. [Google Scholar] [CrossRef]
  3. Gozde, H.; Taplamacioglu, M.C.; Kocaarslan, I. Comparative performance analysis of Artificial Bee Colony algorithm in automatic generation control for interconnected reheat thermal power system. Int. J. Electr. Power Energy Syst. 2012, 42, 167–178. [Google Scholar] [CrossRef]
  4. Kundur, P. Power System Stability and Control, 8th ed.; Tata McGraw-Hill: New Delhi, India, 2009. [Google Scholar]
  5. Tabak, A. Fractional order frequency proportional-integral-derivative control of microgrid consisting of renewable energy sources based on multi-objective grasshopper optimization algorithm. Trans. Inst. Meas. Control 2022, 44, 378–392. [Google Scholar] [CrossRef]
  6. Pan, I.; Das, S. Kriging based surrogate modeling for fractional order control of microgrids. IEEE Trans. Smart Grid 2015, 6, 36–44. [Google Scholar] [CrossRef]
  7. Sondhi, S.; Hote, Y.V. Fractional order PID controller for load frequency control. Energy Convers. Manag. 2014, 85, 343–353. [Google Scholar] [CrossRef]
  8. Ali, E.S.; Abd-Elazim, S.M. Bacteria foraging optimization algorithm based load frequency controller for interconnected power system. Int. J. Electr. Power Energy Syst. 2011, 33, 633–638. [Google Scholar] [CrossRef]
  9. Rout, U.K.; Sahu, R.K.; Panda, S. Design and analysis of differential evolution algorithm based automatic generation control for interconnected power system. Ain Shams Eng. J. 2013, 4, 409–421. [Google Scholar] [CrossRef]
  10. Sahu, R.K.; Panda, S.; Rout, U.K.; Sahoo, D.K. Teaching learning based optimization algorithm for automatic generation control of power system using 2-DOF PID controller. Int. J. Electr. Power Energy Syst. 2016, 77, 287–301. [Google Scholar] [CrossRef]
  11. Elmelegi, A.; Mohamed, E.A.; Aly, M.; Ahmed, E.M.; Mohamed, A.A.A.; Elbaksawi, O. Optimized tilt fractional order cooperative controllers for preserving frequency stability in renewable energy-based power systems. IEEE Access 2021, 9, 8261–8277. [Google Scholar] [CrossRef]
  12. Padhan, S.; Sahu, R.K.; Panda, S. Application of firefly algorithm for load frequency control of multi-area interconnected power system. Electr. Power Compon. Syst. 2014, 42, 1419–1430. [Google Scholar] [CrossRef]
  13. Sahu, R.K.; Panda, S.; Sekhar, G.T.C. A novel hybrid PSO-PS optimized fuzzy PI controller for AGC in multi-area interconnected power systems. Int. J. Electr. Power Energy Syst. 2015, 64, 880–893. [Google Scholar] [CrossRef]
  14. Mohanty, B.; Panda, S.; Hota, P.K. Differential evolution algorithm based automatic generation control for interconnected power systems with non-linearity. Alex. Eng. J. 2014, 53, 537–552. [Google Scholar] [CrossRef]
  15. Hasanien, H.M. Whale optimisation algorithm for automatic generation control of interconnected modern power systems including renewable energy sources. IET Gener. Transm. Distrib. 2018, 12, 607–614. [Google Scholar] [CrossRef]
  16. Khamari, D.; Sahu, R.K.; Gorripotu, T.S.; Panda, S. Automatic generation control of power system in deregulated environment using hybrid TLBO and pattern search technique. Ain Shams Eng. J. 2020, 11, 553–573. [Google Scholar] [CrossRef]
  17. Nandi, M.; Shiva, C.K.; Mukherjee, V. TCSC based automatic generation control of deregulated power system using quasi-oppositional harmony search algorithm. Eng. Sci. Technol. Int. J. 2017, 20, 1380–1395. [Google Scholar] [CrossRef]
  18. Gorripotu, T.S.; Sahu, R.K.; Panda, S. AGC of a multi-area power system under deregulated environment using redox flow batteries and interline power flow controller. Eng. Sci. Technol. Int. J. 2015, 18, 555–578. [Google Scholar] [CrossRef]
  19. AboRas, K.M.; Ragab, M.; Shouran, M.; Alghamdi, S.; Kotb, H. Voltage and frequency regulation in smart grids via a unique Fuzzy PIDD2 controller optimized by Gradient-Based Optimization algorithm. Energy Rep. 2023, 9, 1201–1235. [Google Scholar] [CrossRef]
  20. Kumar, N.K.; Gopi, R.S.; Kuppusamy, R.; Nikolovski, S.; Teekaraman, Y.; Vairavasundaram, I.; Venkateswarulu, S.V. Fuzzy logic-based load frequency control in an island hybrid power system model using artificial bee colony optimization. Energies 2022, 15, 2199. [Google Scholar] [CrossRef]
  21. Eshetu, W.; Sharma, P.; Sharma, C. ANFIS based load frequency control in an isolated micro-grid. In Proceedings of the IEEE International Conference on Industrial Technology, Lyon, France, 20–22 February 2018; pp. 1165–1170. [Google Scholar]
  22. Khuntia, S.R.; Panda, S. Simulation study for automatic generation control of a multi-area power system by ANFIS approach. Appl. Soft Comput. 2012, 12, 333–341. [Google Scholar] [CrossRef]
  23. Kumar, A.; Anwar, M.N.; Kumar, S. Sliding mode controller design for frequency regulation in an interconnected power system. Prot. Control Mod. Power Syst. 2021, 6, 6. [Google Scholar] [CrossRef]
  24. Tran, A.-T.; Huynh, V.V.; Shim, J.W.; Lim, C.P. Optimized sliding mode frequency controller for power systems integrated energy storage system with droop control. IEEE Access 2025, 13, 43749–43766. [Google Scholar] [CrossRef]
  25. Hakimuddin, N.; Nasiruddin, I.; Bhatti, T.S.; Arya, Y. Optimal automatic generation control with hydro, thermal, gas, and wind power plants in 2-area interconnected power system. Electr. Power Compon. Syst. 2020, 48, 558–571. [Google Scholar] [CrossRef]
  26. Shangguan, X.C.; Zhang, C.K.; He, Y.; Jin, L.; Jiang, L.; Spencer, J.W.; Wu, M. Robust load frequency control for power system considering transmission delay and sampling period. IEEE Trans. Ind. Inform. 2021, 17, 5292–5303. [Google Scholar] [CrossRef]
  27. Panda, S.; Yegireddy, N.K. Automatic generation control of multi-area power system using multi-objective non-dominated sorting genetic algorithm-II. Int. J. Electr. Power Energy Syst. 2013, 53, 54–63. [Google Scholar]
  28. Çelik, E. Incorporation of stochastic fractal search algorithm into efficient design of PID controller for an automatic voltage regulator system. Neural Comput. Appl. 2018, 30, 1991–2002. [Google Scholar] [CrossRef]
  29. Topno, P.N.; Chanana, S. Differential evolution algorithm based tilt integral derivative control for LFC problem of an interconnected hydro-thermal power system. J. Vib. Control 2017, 24, 3952–3973. [Google Scholar] [CrossRef]
  30. Bhuyan, M.; Das, D.C.; Barik, A.K. Proficient power control strategy for combined solar gas turbine-wind turbine generator-biodiesel generator based two-area interconnected microgrid employed with DC link using Harris’s hawk optimization optimised tilt-integral-derivative controller. Int. J. Numer. Model. Electron. Netw. Devices Fields 2022, 35, e2991. [Google Scholar] [CrossRef]
  31. Shukla, H.; Nikolovski, S.; Raju, M.; Rana, A.S.; Kumar, P. A particle swarm optimization technique tuned TID controller for frequency and voltage regulation with penetration of electric vehicles and distributed generations. Energies 2022, 15, 8225. [Google Scholar] [CrossRef]
  32. Fathy, A.; Yousri, D.; Rezk, H.; Thanikanti, S.B.; Hasanien, H.M. A robust fractional-order PID controller based load frequency control using modified hunger games search optimizer. Energies 2022, 15, 361. [Google Scholar] [CrossRef]
  33. Lamba, R.; Singla, S.K.; Sondhi, S. Design of fractional order PID controller for load frequency control in perturbed two-area interconnected system. Electr. Power Compon. Syst. 2019, 47, 998–1011. [Google Scholar] [CrossRef]
  34. Bayati, N.; Dadkhah, A.; Vahidi, B.; Hossein, S.; Sadeghi, H. FOPID design for load-frequency control using genetic algorithm. Sci. Int. 2015, 27, 3089–3094. [Google Scholar]
  35. Mohamed, E.A.; Ahmed, E.M.; Elmelegi, A.; Aly, M.; Elbaksawi, O.; Mohamed, A.A.A. An optimized hybrid fractional order controller for frequency regulation in multi-area power systems. IEEE Access 2020, 8, 213899–213915. [Google Scholar] [CrossRef]
  36. Sharma, M.; Prakash, S.; Saxena, S.; Dhundhara, S. Optimal fractional-order tilted-integral-derivative controller for frequency stabilization in hybrid power system using salp swarm algorithm. Electr. Power Compon. Syst. 2021, 48, 1912–1931. [Google Scholar] [CrossRef]
  37. Ahmed, M.; Magdy, G.; Khamies, M.; Kamel, S. Modified TID controller for load frequency control of a two-area interconnected diverse-unit power system. Int. J. Electr. Power Energy Syst. 2022, 135, 107528. [Google Scholar] [CrossRef]
  38. Alharbi, M.; Ragab, M.; AboRas, K.M.; Kotb, H.; Dashtdar, M.; Shouran, M.; Elgamli, E. Innovative AVR-LFC design for a multi-area power system using hybrid fractional-order PI and PIDD2 controllers based on dandelion optimizer. Mathematics 2023, 11, 1387. [Google Scholar] [CrossRef]
  39. Mohamed, E.A.; Aly, M.; Watanabe, M. New tilt fractional-order integral derivative with fractional filter (TFOIDFF) controller with artificial hummingbird optimizer for LFC in renewable energy power grids. Mathematics 2022, 10, 3006. [Google Scholar] [CrossRef]
  40. Das, S.; Saikia, L.C.; Datta, S. Maiden application of TIDN-(1 + PI) cascade controller in LFC of a multi-area hydro-thermal system incorporating EV–Archimedes wave energy-geothermal-wind generations under deregulated scenario. Int. Trans. Electr. Energy Syst. 2021, 31, e12907. [Google Scholar] [CrossRef]
  41. Bhuyan, M.; Das, D.C.; Barik, A.K.; Sahoo, S.C. Performance assessment of novel solar thermal-based dual hybrid microgrid system using CBOA optimized cascaded PI-TID controller. IETE J. Res. 2022, 69, 9076–9093. [Google Scholar] [CrossRef]
  42. Arya, Y. ICA assisted FTI λ DN controller for AGC performance enrichment of interconnected reheat thermal power systems. J. Ambient Intell. Humaniz. Comput. 2021, 14, 1919–1935. [Google Scholar] [CrossRef]
  43. Choudhary, R.; Rai, J.N.; Arya, Y. FOPTID + 1 controller with capacitive energy storage for AGC performance enrichment of multi-source electric power systems. Electr. Power Syst. Res. 2023, 221, 109450. [Google Scholar] [CrossRef]
  44. Hassan, A.; Aly, M.; Elmelegi, A.; Nasrat, L.; Watanabe, M.; Mohamed, E.A. Optimal frequency control of multi-area hybrid power system using new cascaded TID-PIλDμN controller incorporating electric vehicles. Fractal Fract. 2022, 6, 548. [Google Scholar] [CrossRef]
  45. Kihal, M.C.; Yahiou, A.; Kihal, M.; Azizi, H.; Sekki, D.; Chabout, M. TID-FOPIDN controller for frequency control using Lemur optimization in two-area power systems. Braz. J. Technol. 2024, 7, e74676. [Google Scholar] [CrossRef]
  46. Ahmad, R.; Arya, Y.; Ahmer, M.F.; Nasiruddin, I. Enhanced frequency/voltage control in multi-source power system using CES and SSA-optimized cascade TID-FOPTID controller. IETE J. Res. 2025, 71, 652–667. [Google Scholar] [CrossRef]
  47. Tabak, A.; Duman, S. Levy flight and fitness distance balance-based coyote optimization algorithm for effective automatic generation control of PV-based multi-area power systems. Arab J. Sci. Eng. 2022, 47, 14757–14788. [Google Scholar]
  48. Khudhair, M.; Ragab, M.; AboRas, K.M.; Abbasy, N.H. A newly resilient combination of PIDD2 and PD controllers to boost the frequency response in a two-area hybrid power system with nonlinearities using wild horse optimizer. In Proceedings of the 2022 International Conference on Electrical, Computer and Energy Technologies (ICECET), Prague, Czech Republic, 20–22 July 2022; pp. 1–11. [Google Scholar]
  49. AboRas, K.M.; Sedik, A.M.A.; Hammad, M.R. Hybrid dual-area power grid frequency fluctuation effective control utilizing a maiden combination of MOA-based 1 + PIID and PDμFλ controllers. Sci. Prog. 2025, 108, 00368504251330521. [Google Scholar] [CrossRef] [PubMed]
  50. Raju, M.; Saikia, L.C.; Sinha, N. Automatic generation control of a multi-area system using ant lion optimizer algorithm based PID plus second order derivative controller. Int. J. Electr. Power Energy Syst. 2016, 80, 52–63. [Google Scholar] [CrossRef]
  51. Mozhdehi, A.T.; Khodadadi, N.; Aboutalebi, M.; El-kenawy, E.S.M.; Hussien, A.G.; Zhao, W.; Nadimi-Shahraki, M.H.; Mirjalili, S. Divine Religions Algorithm: A novel social-inspired metaheuristic algorithm for engineering and continuous optimization problems. Clust. Comput. 2025, 28, 253. [Google Scholar] [CrossRef]
  52. Wang, L.; Cao, Q.; Zhang, Z.; Mirjalili, S.; Zhao, W. Artificial rabbits optimization: A new bio-inspired meta-heuristic algorithm for solving engineering optimization problems. Eng. Appl. Artif. Intell. 2022, 114, 105082. [Google Scholar] [CrossRef]
  53. Naruei, I.; Keynia, F. Wild horse optimizer: A new meta-heuristic algorithm for solving engineering optimization problems. Eng. Comput. 2022, 38, 3025–3056. [Google Scholar] [CrossRef]
  54. Sahu, R.K.; Chandra Sekhar, G.; Panda, S. DE optimized fuzzy PID controller with derivative filter for LFC of multi-source power system in deregulated environment. Ain Shams Eng. J. 2015, 6, 511–530. [Google Scholar] [CrossRef]
  55. Soni, V.; Parmar, G.; Kumar, M.; Panda, S. Hybrid Grey Wolf Optimization-Pattern Search (hGWO-PS) optimized 2DOF-PID controllers for load frequency control in interconnected thermal power plants. ICTACT J. Soft Comput. 2016, 6, 1244–1256. [Google Scholar]
  56. Moschos, I.; Parisses, C. Combined frequency and voltage control of two-area multi-source interconnected microgrids via the 2DOF-TIDμ controller. e-Prime Adv. Electr. Eng. Electron. Energy 2023, 5, 100268. [Google Scholar] [CrossRef]
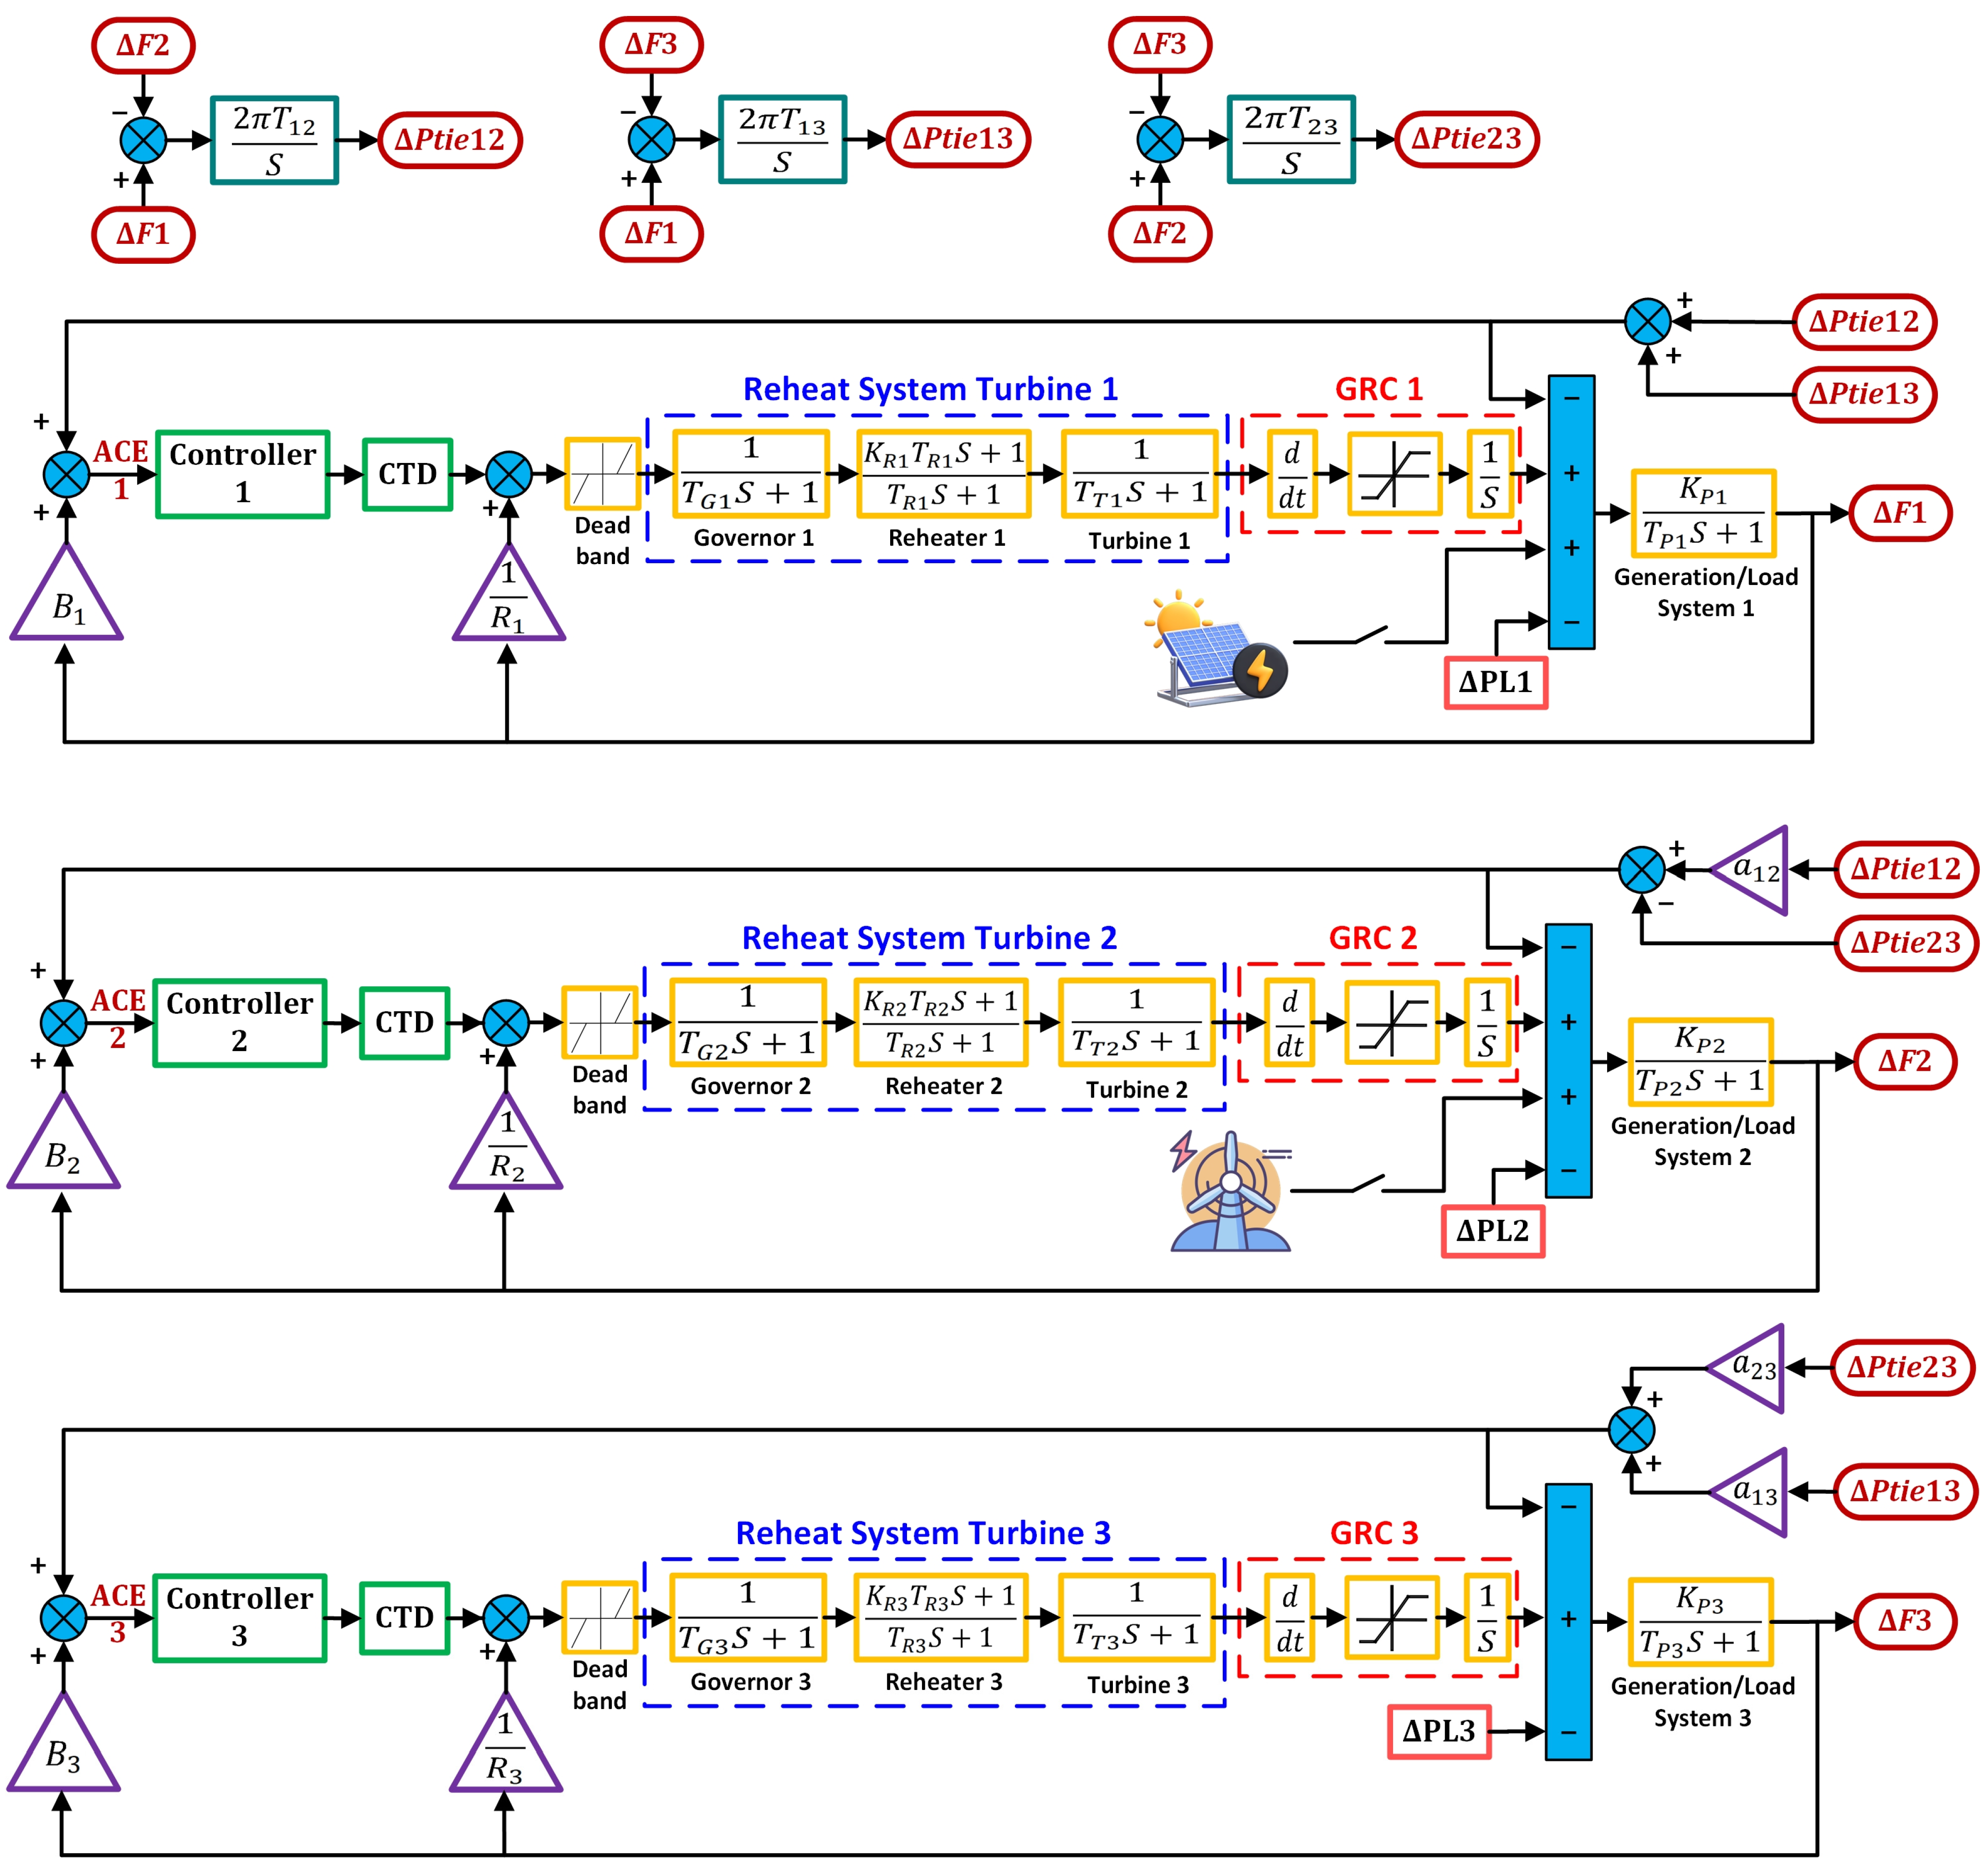
Figure 1. The triple-area system studied.
Mathematics 13 02985 g001
Figure 2. PV unit modelling representation.
Mathematics 13 02985 g002
Figure 3. Output power of PV unit.
Mathematics 13 02985 g003
Figure 4. Wind unit modelling representation.
Mathematics 13 02985 g004
Figure 5. Output power of wind unit.
Mathematics 13 02985 g005
Figure 6. Diagrammatic representation of PID controller.
Mathematics 13 02985 g006
Figure 7. Diagrammatic representation of FOPID controller.
Mathematics 13 02985 g007
Figure 8. Diagrammatic representation of 2DOF-PID controller.
Mathematics 13 02985 g008
Figure 9. The diagrammatic representation of 2DOF-TIDμ controller.
Mathematics 13 02985 g009
Figure 10. The diagrammatic representation of the proposed 1+TDFλ/PIλDμ controller.
Mathematics 13 02985 g010
Figure 11. Illustration of the communication structure among followers, missionaries, and leaders within the religious community.
Mathematics 13 02985 g011
Figure 12. Overview of the structure and dynamics within a religious community. (a) Positions of followers, missionaries, and leaders in the religious society. (b) Process of attracting new followers into the community.
Mathematics 13 02985 g012
Figure 13. Overview flowchart of the DRA.
Mathematics 13 02985 g013
Figure 14. Convergence curves for WHO, ARO, and DRA optimization techniques.
Mathematics 13 02985 g014
Figure 15. Frequency deviation response comparison using three different optimization techniques: (a) ΔF1, (b) ΔF2, (c) ΔF3.
Mathematics 13 02985 g015
Figure 16. Tie-line power deviation response comparison using three different optimization techniques: (a) ΔPtie12, (b) ΔPtie13, (c) ΔPtie23.
Mathematics 13 02985 g016
Figure 17. Frequency deviation response for the studied triple-area system under the impact of Scenario 1: (a) ΔF1, (b) ΔF2, (c) ΔF3.
Mathematics 13 02985 g017
Figure 18. Tie-line power deviation response for the studied triple-area system under the impact of Scenario 1: (a) ΔPtie12, (b) ΔPtie13, (c) ΔPtie23.
Mathematics 13 02985 g018
Figure 19. MSLD profile for Scenario 2.
Mathematics 13 02985 g019
Figure 20. Frequency deviation response for the studied triple-area system under the impact of Scenario 2: (a) ΔF1, (b) ΔF2, (c) ΔF3.
Mathematics 13 02985 g020
Figure 21. Tie-line power deviation response for the studied triple-area system under the impact of Scenario 2: (a) ΔPtie12, (b) ΔPtie13, (c) ΔPtie23.
Mathematics 13 02985 g021
Figure 22. Pie chart representation of the ITAE percentage for the studied controllers in Scenario 2.
Mathematics 13 02985 g022
Figure 23. PLD profile for Scenario 3.
Mathematics 13 02985 g023
Figure 24. Frequency deviation response for the studied triple-area system under the impact of Scenario 3: (a) ΔF1, (b) ΔF2, (c) ΔF3.
Mathematics 13 02985 g024
Figure 25. Tie-line power deviation response for the studied triple-area system under the impact of Scenario 3: (a) ΔPtie12, (b) ΔPtie13, (c) ΔPtie23.
Mathematics 13 02985 g025
Figure 26. Pie chart representation of the ITAE percentage for the studied controllers in Scenario 3.
Mathematics 13 02985 g026
Figure 27. Frequency deviation response for the studied triple-area system under the impact of Scenario 4: (a) ΔF1, (b) ΔF2, (c) ΔF3.
Mathematics 13 02985 g027
Figure 28. Tie-line power deviation response for the studied triple-area system under the impact of Scenario 4: (a) ΔPtie12, (b) ΔPtie13, (c) ΔPtie23.
Mathematics 13 02985 g028
Figure 29. Pie chart representation of the ITAE percentage for the studied controllers in Scenario 4.
Mathematics 13 02985 g029
Figure 30. Frequency deviation response for the studied triple-area system under the impact of Scenario 5: (a) ΔF1, (b) ΔF2, (c) ΔF3.
Mathematics 13 02985 g030
Figure 31. Tie-line power deviation response for the studied triple-area system under the impact of Scenario 5: (a) ΔPtie12, (b) ΔPtie13, (c) ΔPtie23.
Mathematics 13 02985 g031
Figure 32. Pie chart representation of the ITAE percentage for the studied controllers in Scenario 5.
Mathematics 13 02985 g032
Figure 33. Frequency deviation response for the studied triple-area system under the impact of Scenario 6: (a) ΔF1, (b) ΔF2, (c) ΔF3.
Mathematics 13 02985 g033
Figure 34. Tie-line power deviation response for the studied triple-area system under the impact of Scenario 6: (a) ΔPtie12, (b) ΔPtie13, (c) ΔPtie23.
Mathematics 13 02985 g034
Figure 35. Pie chart representation of the ITAE percentage for the studied controllers in Scenario 6.
Mathematics 13 02985 g035
Figure 36. Bode plot of the suggested 1+TDFλ/PIλDμ controller in the studied system.
Mathematics 13 02985 g036
Table 1. Proposed controller parameters when tuned by WHO, ARO, and DRA.
Algorithm k t n k d λ 1 Ν 1 Κ P K I λ 2 Κ D μ Ν 2 Runtime (Hour)
WHO 1.24
Area 118.1366.02214.1581.35323619.93819.9970.8351.5440.789289
Area 219.1221.02113.1421.78114011.79519.9861.7221.4021.478488
Area 317.77713.4781.52348619.8530.8671.2584.5071.369500
ARO 1.25
Area 116.45114.9821.7922232019.9910.7519.4721.257190
Area 215.2321.1863.8711.43210119.83919.9850.36610.5911.479203
Area 319.6391.6837.4171.4011010.3220.1761.0021.3901.893101
DRA 1.21
Area 117.4627.55111.5681.521209 19.99419.9881.7433.2630.793201
Area 212.1539.91314.2981.74347819.85318.3661.2582.3251.743319
Area 318.1268.31118.6471.6924892017.5481.4873.7541.235451
Table 2. Optimum parameters for the five compared controllers.
ControllerParameters
PID k p k i k d N
Area 118.023206.145256
Area 219.14919.6816.059348
Area 30.164 0.1140.009409
FOPID k p k i k d λ μ N
Area 119.997207.1750.7610.573489
Area 22019.9816.8850.4930.373426
Area 318.32319.92816.9970.8310.664500
2DOF-PID k p k i k d b c N
Area 1−17.204−19.996−5.223−1.755−1.998499
Area 2−17.988−20−4.9760.118−1.973173
Area 3−19.998−8.425−7.88922271
2DOF-TIDμ D w k d k i k t μ Ν n
Area 11.443−3.609−19.98816.3181.08348910
Area 219.496−4.094−19.998−16.1911.0214989.998
Area 31.093−7.7486.386−17.6310.9724839.997
1+TDFλ/PIλDμ k t n k d λ 1 Ν 1 Κ P K I λ 2 Κ D μ Ν 2
Area 117.4627.55111.5681.521209 19.99419.9881.7433.2630.793201
Area 212.1539.91314.2981.74347819.85318.3661.2582.3251.743319
Area 318.1268.31118.6471.6924892017.5481.4873.7541.235451
Table 3. The analyzed system’s transient response dynamics for Scenario 1.
Controller ΔF1 (Hz)ΔF2 (Hz)ΔF3 (Hz)ΔPtie12 (P.U)ΔPtie13 (P.U)ΔPtie23 (P.U)
PID
OS     ×     10 5 858.5740.53.675.661.976.78
US   ×   10 3 −15.05−12.96−3.719−0.306−3.233−4.068
ST (Sec.)2.51.81.82.552.62.4
FF   ×   10 4 29.9130.2424.092.11710.278.988
FOPID
OS   ×   10 5 469.5276.72.0137.1931.7530.922
US   ×   10 3 −13.96−12.24−6.248−0.272−2.165−2.71
ST (Sec.)2.21.61.62.42.452.25
FF   ×   10 4 38.2721.0421.42.84810.869.948
2DOF-PID
OS   ×   10 5 528.3470.268.420.7981.1220.318
US   ×   10 3 −16.16−14.66−9.277−0.225−2.914−3.779
ST (Sec.)1.511.422.21.6
FF   ×   10 4 15.5316.1117.21.4688.5177.788
2DOF-TIDμ
OS   ×   10 5 243.2181.88.0222.6483.9883.476
US   ×   10 3 −17.07−15.2−9.698−0.3421−3.338−4.183
ST (Sec.)0.70.61.21.61.81.2
FF   ×   10 4 26.7427.0528.261.16110.678.991
1+TDFλ/PIλDμ (Proposed)
OS   ×   10 5 102.184.310.0650.2710.0270.0349
US   ×   10 3 −3.373−2.661−0.389−0.023−0.1712−0.2007
ST (Sec.)0.10.140.30.20.10.1
FF   ×   10 4 0.08510.08050.14120.0180.06810.0775
Table 4. Dynamic response specifications for system parameter changes.
ParametersPercentage
Change
Dynamic
Features
ΔF1 (Hz)ΔF2 (Hz)ΔF3 (Hz)ΔP12 (P.U)ΔP13 (P.U)ΔP23 (P.U)
NormalOS   ×   10 5 102.184.310.0650.2710.0270.0349
US   ×   10 3 −3.373−2.661−0.389−0.023−0.171−0.201
ST (Sec.)0.10.140.30.20.10.1
B i 25 % OS   ×   10 5 194.1157.90.087260.42960.027910.03454
US   ×   10 3 −4.011−3.125−0.6457−0.03669−0.2238−0.2498
ST (Sec.)0.160.2660.30.330.210.43
+ 25 % OS   ×   10 5 24.6825.090.013340.22250.051610.05813
US   ×   10 3 −3.531−2.786−0.3295−0.03635−0.1802−0.2132
ST (Sec.)0.1650.1830.560.330.50.55
R i 25 % OS   ×   10 5 93.6784.570.07380.21750.030140.04033
US   ×   10 3 −3.625−2.887−0.4295−0.02534−0.189−0.2214
ST (Sec.)0.120.20.410.370.330.5
+ 25 % OS   ×   10 5 96.3684.550.07390.2210.030070.04004
US   ×   10 3 −3.65−2.889−0.4295−0.02533−0.1891−0.2216
ST (Sec.)0.170.220.530.370.420.56
T G i 25 % OS   ×   10 5 47.227.520.071990.12160.02950.03902
US   ×   10 3 −3.198−2.502−0.3291−0.0204−0.144−0.1741
ST (Sec.)0.2130.1250.50.4660.4180.52
+ 25 % OS   ×   10 5 158.8141.60.075590.46680.03070.04119
US   ×   10 3 −4.058−3.228−0.5264−0.034360.232−0.2682
ST (Sec.)0.140.2530.4450.40.410.47
T T i 25 % OS   ×   10 5 73.5447.160.067870.076780.028560.03597
US   ×   10 3 −3.172−2.472−0.3192−0.02015−0.1391−0.1646
ST (Sec.)0.1440.120.550.430.5540.52
+ 25 % OS   ×   10 5 94.1163.130.13180.1210.034910.0729
US   ×   10 3 −4.082−3.261−0.5379−0.0336−0.2395−0.2781
ST (Sec.)0.1450.1570.40.440.350.4
T P i ,  K P i 25 % OS   ×   10 5 96.3184.510.076360.21890.030030.04003
US   ×   10 3 −3.649−2.889−0.4294−0.0253−0.189−0.2215
ST (Sec.)0.190.140.50.370.430.42
+ 25 % OS   ×   10 5 96.4484.610.073910.21930.030060.04017
US   ×   10 3 −3.65−2.89−0.4296−0.02553−0.1891−0.2216
ST (Sec.)0.120.140.420.350.50.5
T 12 ,  T 13 ,  T 23 25 % OS   ×   10 5 80.0571.250.07280.076510.029790.03951
US   ×   10 3 −3.661−2.901−0.3359−0.01876−0.1469−0.1746
ST (Sec.)0.120.140.430.230.40.4
+ 25 % OS   ×   10 5 112.995.820.07450.37360.03030.0406
US   ×   10 3 −3.644−2.874−0.5172−0.0321−0.2286−0.2647
ST (Sec.)0.130.0940.360.2060.350.37
Disclaimer/Publisher’s Note: The statements, opinions and data contained in all publications are solely those of the individual author(s) and contributor(s) and not of MDPI and/or the editor(s). MDPI and/or the editor(s) disclaim responsibility for any injury to people or property resulting from any ideas, methods, instructions or products referred to in the content.