Article

The Distribution Characteristics of Adsorbed CH4 in Various-Sized Pore Structures of Coal Seams

1
School of Safety Science and Engineering, Xi’an University of Science and Technology, Xi’an 710054, China
2
Department of Energy and Mineral Engineering, G3 Center and EMS Energy Institute, The Pennsylvania State University, University Park, PA 16802, USA
*
Authors to whom correspondence should be addressed.
Mathematics 2025, 13(18), 2931; https://doi.org/10.3390/math13182931
Submission received: 5 August 2025 / Revised: 29 August 2025 / Accepted: 5 September 2025 / Published: 10 September 2025

Abstract

The distribution characteristics of adsorbed CH4 across pores of various sizes underpin coal mine gas disaster prevention, resource assessment, and efficient coalbed methane (CBM) extraction. Utilizing Grand Canonical Monte Carlo (GCMC) simulations as a theoretical framework, this study establishes a mathematical model linking microscopic pore structure to macroscopic CH4 adsorption thermodynamics in coal. Results reveal that micropores (0.38–1.5 nm) dominate pore structures in coal. For micropores (0.419–1.466 nm), CH4 adsorption follows the Dubinin-Astakhov (DA) equation. The adsorption parameters change significantly as pore diameter increases, indicating that micropore size distribution predominantly governs CH4 adsorption in coal. For larger pores (1.619–4.040 nm), Langmuir equation analysis reveals no significant changes in CH4 adsorption parameters with increasing pore size, suggesting that the CH4 adsorption behavior in pore structures larger than 1.5 nm is relatively consistent and does not vary substantially with respect to pore size. The accuracy of the mathematical model improves with coal rank, reducing prediction errors from 35.371% to 11.044%. Decomposed CH4 adsorption isotherms reveal that while CH4 adsorption capacity increases with equilibrium pressure for all pores, smaller pores achieve saturation at lower pressures. The proportion of total adsorption attributed to smaller pores peaks before declining with further pressure increases.

1. Introduction

Coalbed methane (CBM), a significant co-product of coal mining, is primarily composed of methane (CH4). In the environmental context, CH4 acts as a potent greenhouse gas with a global warming potential 25 times greater than that of CO2 [1]. From an energy perspective, CH4 represents an efficient and clean fuel. The calorific value of one cubic meter of CH4 is 35.9 MJ, equivalent to the energy released by the combustion of 1.2 kg of standard coal [2]. CH4 poses a significant hazard during coal mining, capable of triggering coal and gas outbursts, gas explosions, and other catastrophic accidents [3]. Its extraction from coal reservoirs not only mitigates environmental pollution but also enables CH4 to be repurposed for energy use. This fundamentally reduces the risk of such accidents. Meanwhile, the extraction and development of CBM are conducive to the healthy development of the energy industry. They also contribute to the realization of carbon emission reduction goals [4,5,6,7]. Efficient CBM recovery depends on accurately characterizing its distribution across coal’s complex pore networks, offering critical guidance for extraction strategies and resource assessment [8,9,10,11,12,13].
As is widely known, coal inherently contains a vast network of pores with diverse sizes, shapes, and origins, which provide storage space for CH4 and govern its adsorption characteristics [14,15]. It is widely accepted that CH4 exists in coal in both adsorbed and free states within pores of varying sizes. The adsorbed state predominantly resides in micropores and accounts for over 80% of the total gas. However, the detailed distribution of adsorbed CH4 across different pore sizes remains unclear, and adsorption mechanisms and theoretical models for CH4 in coal are still debated [16,17]. Previous studies primarily inferred CH4 adsorption behavior in coal by correlating adsorption characteristics with pore structural parameters such as pore volume and specific surface area. Moore et al. [18] found that the CH4 adsorption capacity of coal reservoirs is related to the pore surface area rather than pore volume. This suggests that CH4 is predominantly stored on the coal pore surface via adsorption. Bustin et al. [19] revealed that the CH4 adsorption capacity of coal is closely related to the micropore structure, particularly for micropores with a diameter less than 2 nm. They concluded that CH4 is mainly stored on the surface of micropores smaller than 2 nm in coal through adsorption. An et al. [20] noticed similar experimental phenomena and emphasized that the specific surface area of micropores determined the adsorption characteristics of CH4 in coal. However, Tao et al. [21,22] compared the CH4 Langmuir volume (VL) and the Brunauer–Emmett–Teller (BET) specific surface area of coal samples with different metamorphic degrees to evaluate their correlation. Using the BET specific surface area derived from low-pressure N2 adsorption (LPGA-N2), they found a poor correlation with the CH4 adsorption capacity. Thus, they concluded that the specific surface area of pores is not the dominant factor controlling the CH4 adsorption capacity of coal. Given that CH4 adsorption in coal is a physical process [23,24] and its pore structures are predominantly composed of micropores, Wang et al. [25] employed mercury intrusion porosimetry (MIP) and LPGA-N2/CO2 adsorption to demonstrate that micropores (<2 nm) account for the vast majority of the total specific surface area (SSAto). They also found that the CH4 adsorption capacity increases with micropore volume (PVmi) and micropore specific surface area (SSAmi). These findings confirm that the micropore structure is the dominant factor governing CH4 adsorption capacity. In addition, Lozano-Castello et al. [26] conducted further research by comparing the relationship between the CH4 adsorption capacity of the samples and their pore characteristic parameters. They demonstrated that the pore volume and pore size distribution characteristics of the micropores jointly affect the CH4 adsorption capacity of coal. Jin et al. [27,28] noticed discrepancies between micropore structure and high-pressure CH4 adsorption characteristics by comparing the relationship between BET surface area (SSABET), pore volume, and VL. They speculated that high-pressure adsorption capacity is influenced by a combination of <2 nm micropores, SSABET, and pore volume. This interpretation is further corroborated by our recent findings [29,30], which experimentally show that the density of adsorbed-phase CH4 remains below that of the liquid-phase across all pressures. This implies that CH4 adsorption in coal is not solely governed by available pore volume. Thus, pore volume is ruled out as the sole determinant of adsorption capacity.
In our previous work [2,31], adsorption science and theoretical quantum mechanical approaches were combined to study CH4 adsorption behavior in pores of varying sizes. We analyzed the ultimate CH4 adsorption capacity within the multi-scale pore structure of coal and developed a quantitative characterization model based on microscopic pore structure. The model reveals that at infinite CH4 pressure, adsorbed CH4 primarily exists in a micropore-filling state. Only a small portion of CH4 is adsorbed in the form of a monolayer on the surface of pores larger than 1.5 nm [32]. The distribution of CH4 molecules across different pore sizes is illustrated in Figure 1 [33]. Although the thermodynamic distribution of adsorbed CH4 at saturation is partly understood, its variation across pore sizes—especially under low-pressure conditions—remains unclear. Therefore, there is a need to develop a mathematical model that correlates the microscopic pore structure with the thermodynamic parameters of CH4 adsorption. This model will elucidate how adsorbed CH4 is distributed under varying equilibrium conditions.
In this study, the complex pore network of coal was discretized into uniform adsorption pore units of fixed size. Each unit corresponds to a specific pore size interval, for which CH4 adsorption isotherms were obtained using Grand Canonical Monte Carlo (GCMC) simulations. Micropores (0.38–1.5 nm) were divided into 12 units based on the DFT-derived pore size distribution, while pores larger than 1.5 nm were simplified into a single unit to represent monolayer adsorption. GCMC simulations were employed to obtain CH4 adsorption isotherms for these pore structures at various scales. This approach allows the development of a mathematical model that connects the microscopic pore structure of coal to the thermodynamic characteristic parameters of CH4 adsorption. By integrating the pore size distribution results from LPGA-N2/CO2 experiments, the CH4 isothermal adsorption behavior within the complex pore system can be quantitatively characterized. Specifically, micropore size distributions (0.38–1.5 nm) were determined from LPGA-CO2 (273 K) using the DFT method, and mesopore/macropore distributions (2–300 nm) were obtained from LPGA-N2 (77 K) using the BJH method. Experimentally derived pore volumes and surface areas serve as input parameters for the adsorption model, directly linking experimental characterization with theoretical modeling. Furthermore, it allows us to determine the thermodynamic distribution of adsorbed CH4 across different pore sizes under varying equilibrium pressures. This study is the first to systematically explain the distribution patterns of adsorbed CH4 in different-sized coal pores under different pressures. It offers theoretical guidance for efficient CH4 extraction and accurate resource assessment.

2. Adsorption Model Development

2.1. Quantitative Characterization Model for CH4 Isothermal Adsorption Characteristics in Coal

Coal, as a typical porous medium, exhibits pore structures spanning from molecular to micrometer scales [33,34]. This multi-scale nature precludes the comprehensive characterization of CH4 adsorption behavior using a single isothermal adsorption model. In this study, the complex pore network of coal was divided into adsorption units of uniform size. The isothermal adsorption characteristics of CH4 within these pore structures were then quantitatively characterized. Combining the test results of pore structures with different sizes in coal enabled the quantitative characterization of CH4 isothermal adsorption in complex pore structures. As demonstrated by Hu et al. [31], CH4 adsorption in pores with diameters of 0.38–1.5 nm occurs through micropore filling, whereas pores exceeding 1.5 nm exhibit monolayer adsorption. Therefore, the quantitative model for CH4 isothermal adsorption in the complex pore structure of coal is:
Q = Q mi + Q mo
where Q is the CH4 adsorption capacity of all pore sizes in coal, cm3/g; Qmi is the CH4 adsorption capacity of coal adsorbed in the form of micropore filling, cm3/g; Qmo is the CH4 adsorption capacity of coal adsorbed in the form of monolayer adsorption, cm3/g.
Due to the distinct adsorption mechanisms of CH4 in different-sized pores, the theoretical models used to quantitatively characterize CH4 isothermal adsorption behavior also vary. Based on the classical isothermal adsorption theories [35,36,37,38,39,40,41,42], the DA equation and the Langmuir equation were applied to quantify the isothermal adsorption characteristics of CH4 in coal pore structures. The DA equation was used for pores sized 0.38–1.5 nm, while the Langmuir equation was employed for pores larger than 1.5 nm.
Q mi = r = 0.38 r = 1.5 V mi , r exp K r ln p 0 p n r
Q mo = r = 1.5 r = V mo , r p P L , r + p
where r is the pore diameter, nm; p is the gas pressure, MPa; p0 is the CH4 saturated gas pressure, MPa; Vmi,r is the ultimate filling adsorption capacity of the pore structure with a pore size of r, cm3/g; Kr is the adsorption proportion constant of the pore structure with a pore size of r; nr is the adsorption non-uniformity parameter of the pore structure with a pore size of r; Vmo,r is the CH4 Langmuir volume of the pore structure with a pore size of r, cm3/g; PL,r is the CH4 Langmuir pressure of the pore structure with a pore size of r, MPa.
Although pore sizes vary inconsistently among different coal samples, the CH4 adsorption characteristic parameters remain consistent for pores of the same size. This consistency allows the parameters in the formulas to be separated. However, since CH4 adsorption occurs in different forms which depend on pore size, the factors controlling its ultimate adsorption capacity also vary. As shown in Figure 2, the CH4 adsorption capacity of micropore and macropore structures with the same surface area can differ by as much as 3.6 times [2]. Therefore, Equations (2) and (3) can be transformed into the following form:
Q mi = r = 0.38 r = 1.5 V r v mi , r exp K r ln p 0 p n r
Q mo = r = 1.5 r = S r v mo , r p P L , r + p
where Vr is the volume of the pore structure with a pore size of r, cm3/g; νmi,r is the CH4 adsorption capacity per unit pore volume, cm3/cm3; Sr is the surface area of the pore structure with a pore size of r, m2/g; νmo,r is the CH4 adsorption capacity per unit pore surface area, cm3/m2.
Combining Equations (4) and (5), the CH4 adsorption isotherm in coal with complex pore structures can be obtained:
Q = r = 0.38 r = 1.5 V r v mi , r exp K r ln p 0 p n r + r = 1.5 r = S r v mo , r p P L , r + p

2.2. Simplification of the Quantitative Characterization Model

Based on our previous work [31], micropores smaller than 1.5 nm dominate the pore structure in coal. Under saturation conditions, CH4 adsorbed in a monolayer form constituted a small fraction (<10%). Furthermore, molecular simulations [43,44,45] indicate that mesopore size has little effect on CH4 adsorption characteristics. Micropores between 0.38 and 1.50 nm were thus represented as 12 adsorption units of similar sizes. Pores larger than 1.50 nm were simplified into a single unit. This simplification reduces Equations (4) and (5) to:
Q mi = i = 1 i = 12 V i v mi , i exp K i ln p 0 p n i
Q mo = S BET v mo , r ¯ p P L , r ¯ + p
where V i is the volume of the pore structure with a pore size range of i, cm3/g; v mo , r ¯ is the CH4 adsorption capacity per unit equivalent cylindrical pore structure specific surface area, cm3/m2; S BET is the external specific surface area of all mesopores and macropores, m2/g; P L , r ¯ is the CH4 Langmuir pressure of equivalent cylindrical pore structure, MPa.
Therefore, Equation (6) for the CH4 adsorption isotherm with a complex pore structure in coal can be simplified as:
Q = i = 1 i = 12 V i v mi , i exp K i ln p 0 p n i + S BET v mo , r ¯ p P L , r ¯ + p
To elucidate how the micropore structure of coal governs CH4 adsorption behavior, the pore structure was quantitatively characterized. Combining the CH4 adsorption characteristic parameters for different pore sizes yields the theoretical adsorption isotherm for the complex coal pore structure. The theoretical adsorption isotherm (Equation (9)) consists of 13 distinct CH4 adsorption isotherms. These isotherms correspond to different pore sizes. Therefore, the CH4 occurrence region can be partitioned into 13 adsorption zones. Consequently, partitioning Equation (9) enables the derivation of the CH4 adsorption behavior in different-sized coal pores under varying pressure conditions.

2.3. CH4 Adsorption Parameters of Quantitative Characterization Model

2.3.1. Construction of Pore Structures of Different Sizes and Simulation of CH4 Adsorption

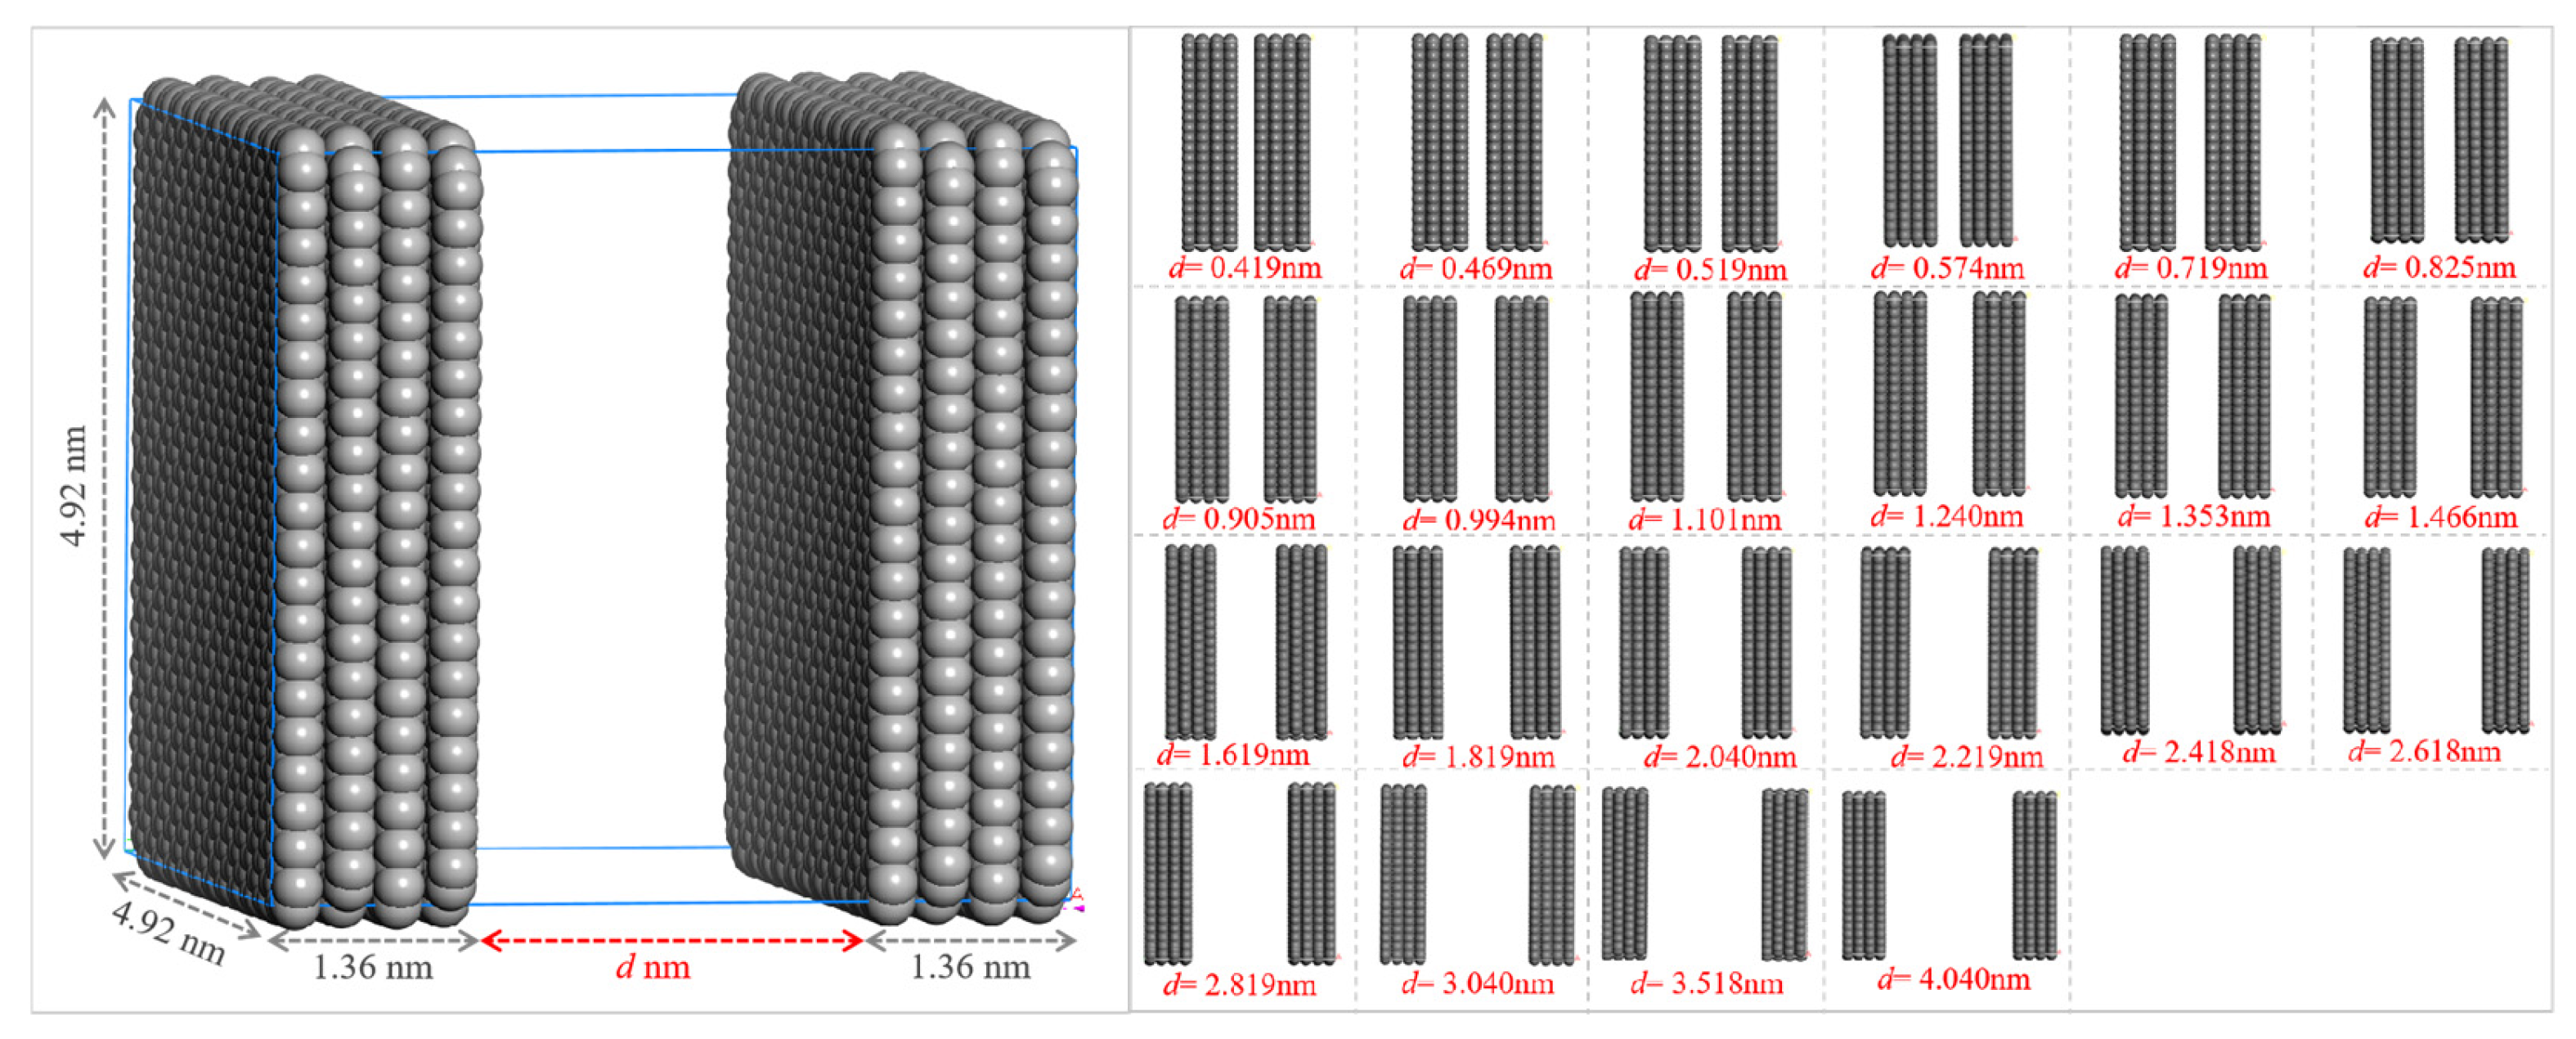
Previous studies have shown [43,44,45,46] that the CH4 adsorption characteristics in pores of different sizes can be predicted by MS. Additionally, slit pores more closely resemble the actual pores in coal samples. Slit pores of varying sizes were modeled with graphite structures (Figure 3). The volume and surface area of different pore sizes were obtained using the Atom Volumes and Surfaces tool, where Grid resolution was set to Fine and Connolly radius to 0.19 nm. The equivalent pore diameter of each slit pore structure could be derived based on its pore volume and surface area of different pore sizes.
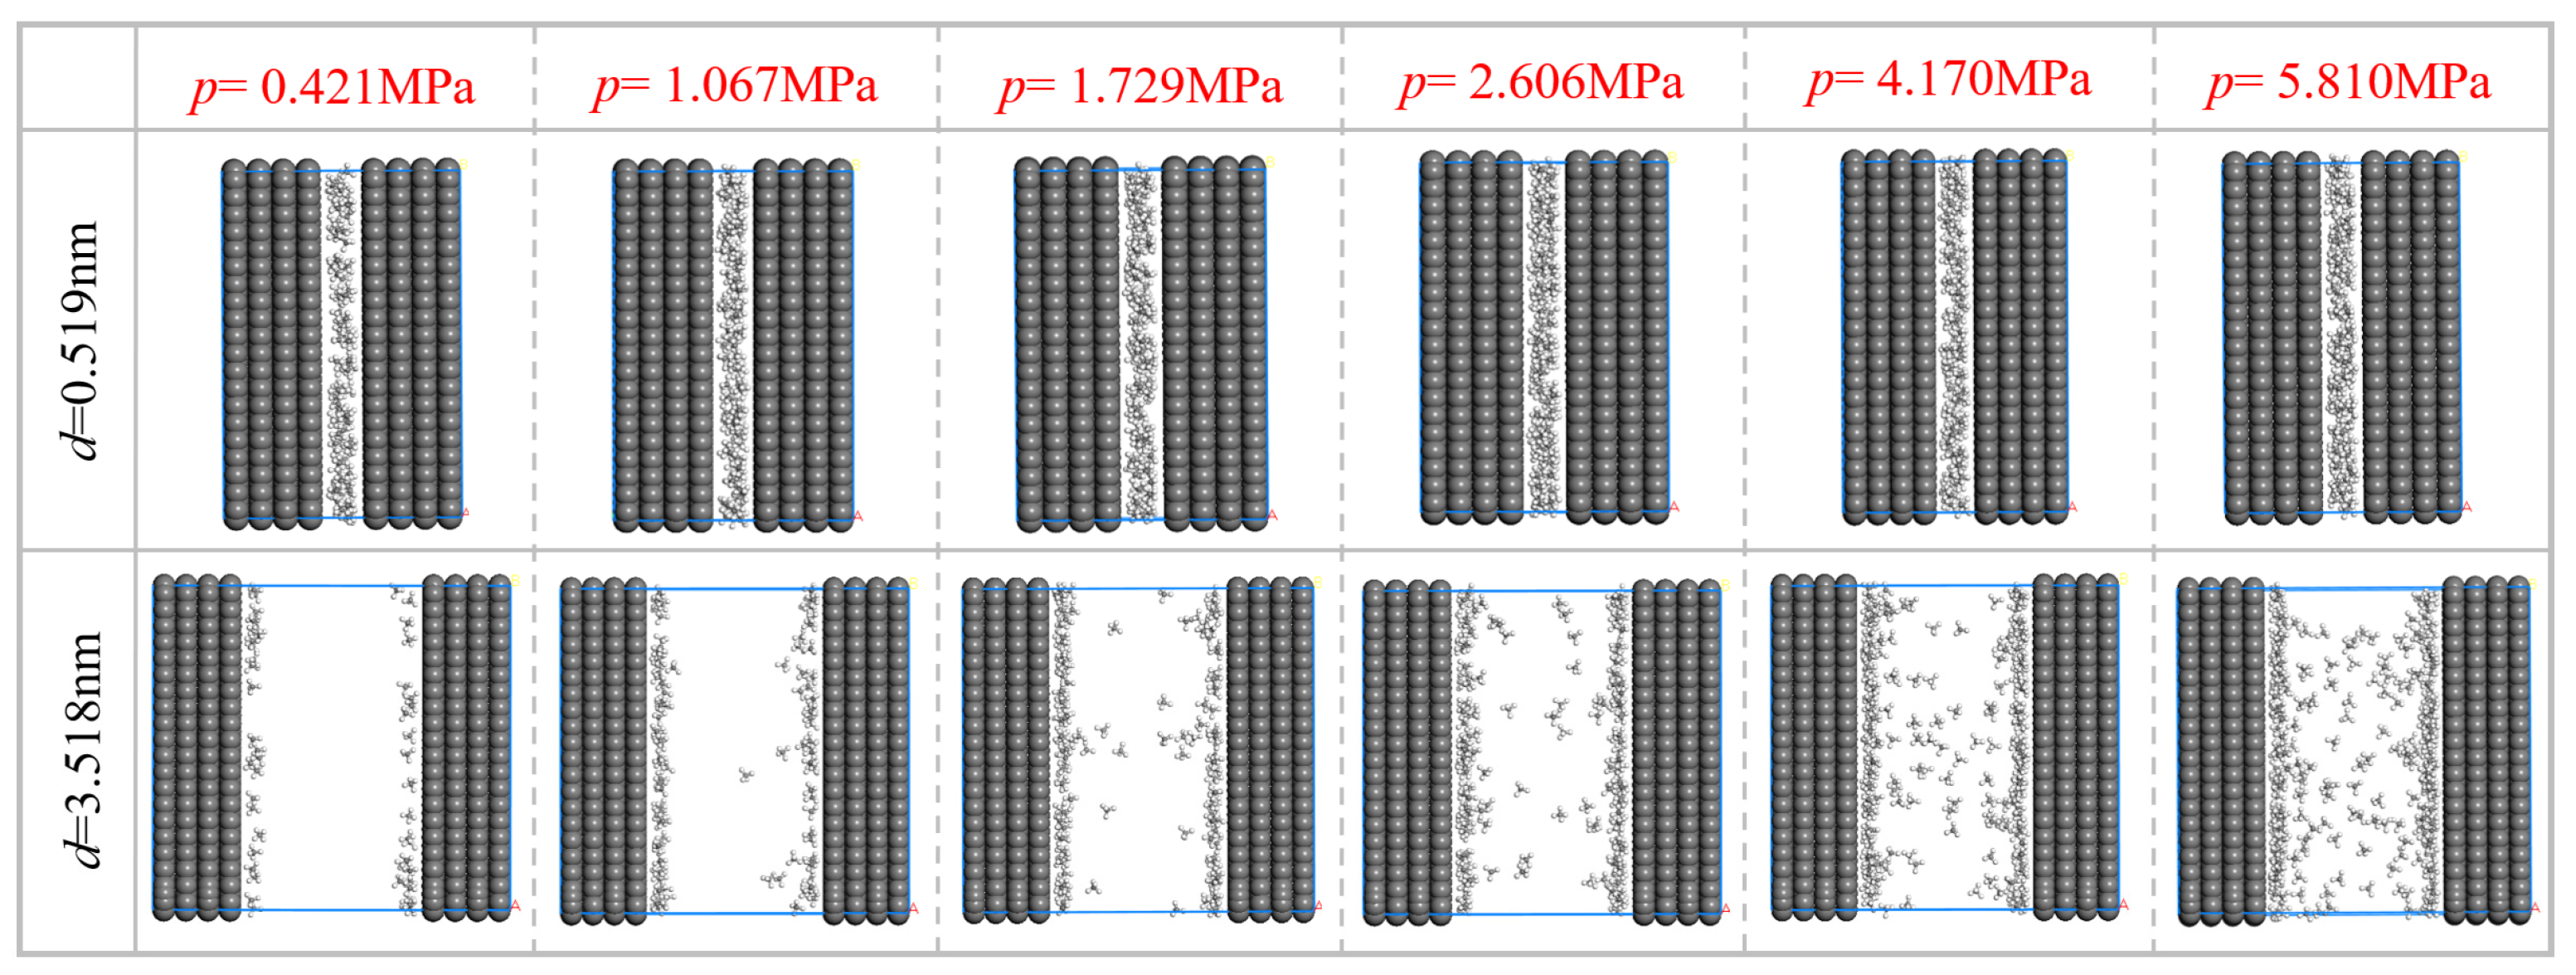
The selection of a molecular force field is critical for predicting gas adsorption isotherms in pores of different sizes. This study employs the PCFF force field, which is built upon CFF91 and includes additional computational parameters for metals, polymers, and zeolites. This makes it suitable for simulating organic polymers and zeolite systems [43]. It should be noted that in GCMC simulations, chemical potential is input as fugacity rather than absolute pressure. Fugacity relates the chemical potential of a real gas to that of an ideal gas at the same temperature. It represents the pressure that an ideal gas would need to exert to achieve an equivalent chemical potential. The Peng-Robinson state equation was used to convert between fugacity and pressure in this study [47]. GCMC simulations provided the lowest-energy configurations of CH4 in slit pores across a range of pressure. As shown in Figure 4, we take 0.519 nm and 3.518 nm slit pore structures as examples.
By comparing the lowest energy configurations in the 0.519 nm and 3.518 nm slit pore structures, we can find that CH4 molecules almost completely filled the 0.519 nm slit pore at 0.421 MPa. As the pressure increased, the concentration of CH4 molecules in the pores remained relatively stable. For the 3.518 nm slit pore, when the CH4 pressure was raised to 5.810 MPa, there was still a considerable gap between the CH4 molecular concentration in the center of the pore and that on the walls. This indicates that no filling phenomenon occurred. This result supports the view of Ortiz et al. [2,48] that CH4 exhibits micropore filling behavior in pore structures below 1.5 nm, but no similar volume filling phenomenon occurs in larger pore structures. By comparing the lowest energy configurations of slit pore structures of other sizes, we observed that the smaller the size of the slit pore, the more sensitive the CH4 isothermal adsorption data is to gas pressure. For slit pore structures below 0.6 nm, only extremely low gas pressure (<0.421 MPa) is needed to achieve half of their ultimate adsorption capacity. This indicates that the smaller the pore size, the greater its surface energy [44,49].

2.3.2. CH4 Adsorption Parameters of Pore Structures of Different Sizes

To accurately characterize CH4 adsorption behavior in slit pores of different sizes and obtain the corresponding adsorption characteristic parameters, it was essential to define the boundaries between adsorbed and free state CH4 in the simulated crystal cell structure. This study adopted the approach of Song et al. [50] to separately define pore structures that exhibit micropore filling and surface coverage adsorption behaviors. It was assumed that in micropores smaller than 1.50 nm, all gas was in the adsorbed state. In pores larger than 1.50 nm, the adsorption space was defined as the region with a monolayer thickness of adsorbate molecules on the pore space area. Void space beyond the adsorption region was considered free gas. Consequently, the absolute adsorption capacity in micropores (0.38–1.5 nm) was calculated using Equation (10), while Equation (11) was used for larger pores (>1.50 nm):
N a , mi ab = N
N a , mo ab = N N A ρ g V pore V a , mo M
where N a , mi ab is the absolute adsorption capacity of gas molecules in the pore structure ranging from 0.38 to 1.5 nm, individual; N a , mo ab is the absolute adsorption capacity of gas molecules in the pore structure larger than 1.5 nm, individual; V a , mo is the volume of gas adsorption space in the pore structure greater than 1.5 nm, cm3; N is the total number of gas molecules in the simulated unit cell pore structure, individual.
The absolute adsorption amount calculated via Equations (10) and (11) uses a unit that is inconsistent with the commonly used unit for gas adsorption amount. To perform unit conversion on the above simulation results, we first convert the number of adsorbed CH4 molecules to the adsorption volume using the ideal gas state equation, whose expression is shown in Equation (12):
V a = N a ab N A × 22400
The gas adsorption volume V a in a single simulated unit cell obtained via the above calculation has a unit of “cm3”, which cannot be used directly. Given the research focus of this study, we do not use the commonly used unit “cm3/g” (typically employed to measure the gas adsorption capacity of pore structures with different sizes). For microporous structures (0.38–1.5 nm), we use the “gas adsorption amount per unit pore volume” (unit: cm3/cm3) to measure the gas adsorption capacity of micropores of different sizes.
V a = V a V a , mi
For pore structures larger than 1.5 nm, the amount of adsorbed gas per unit pore surface area is used as the unit (cm3/m2) to measure the gas adsorption capacity of pore structures of different sizes.
V a = V a S a , mo
where NA is Avogadro’s constant; Va,mi is the volume within a single simulated unit cell, cm3; Sa,mo is the pore surface area within a single simulated unit cell, m2.
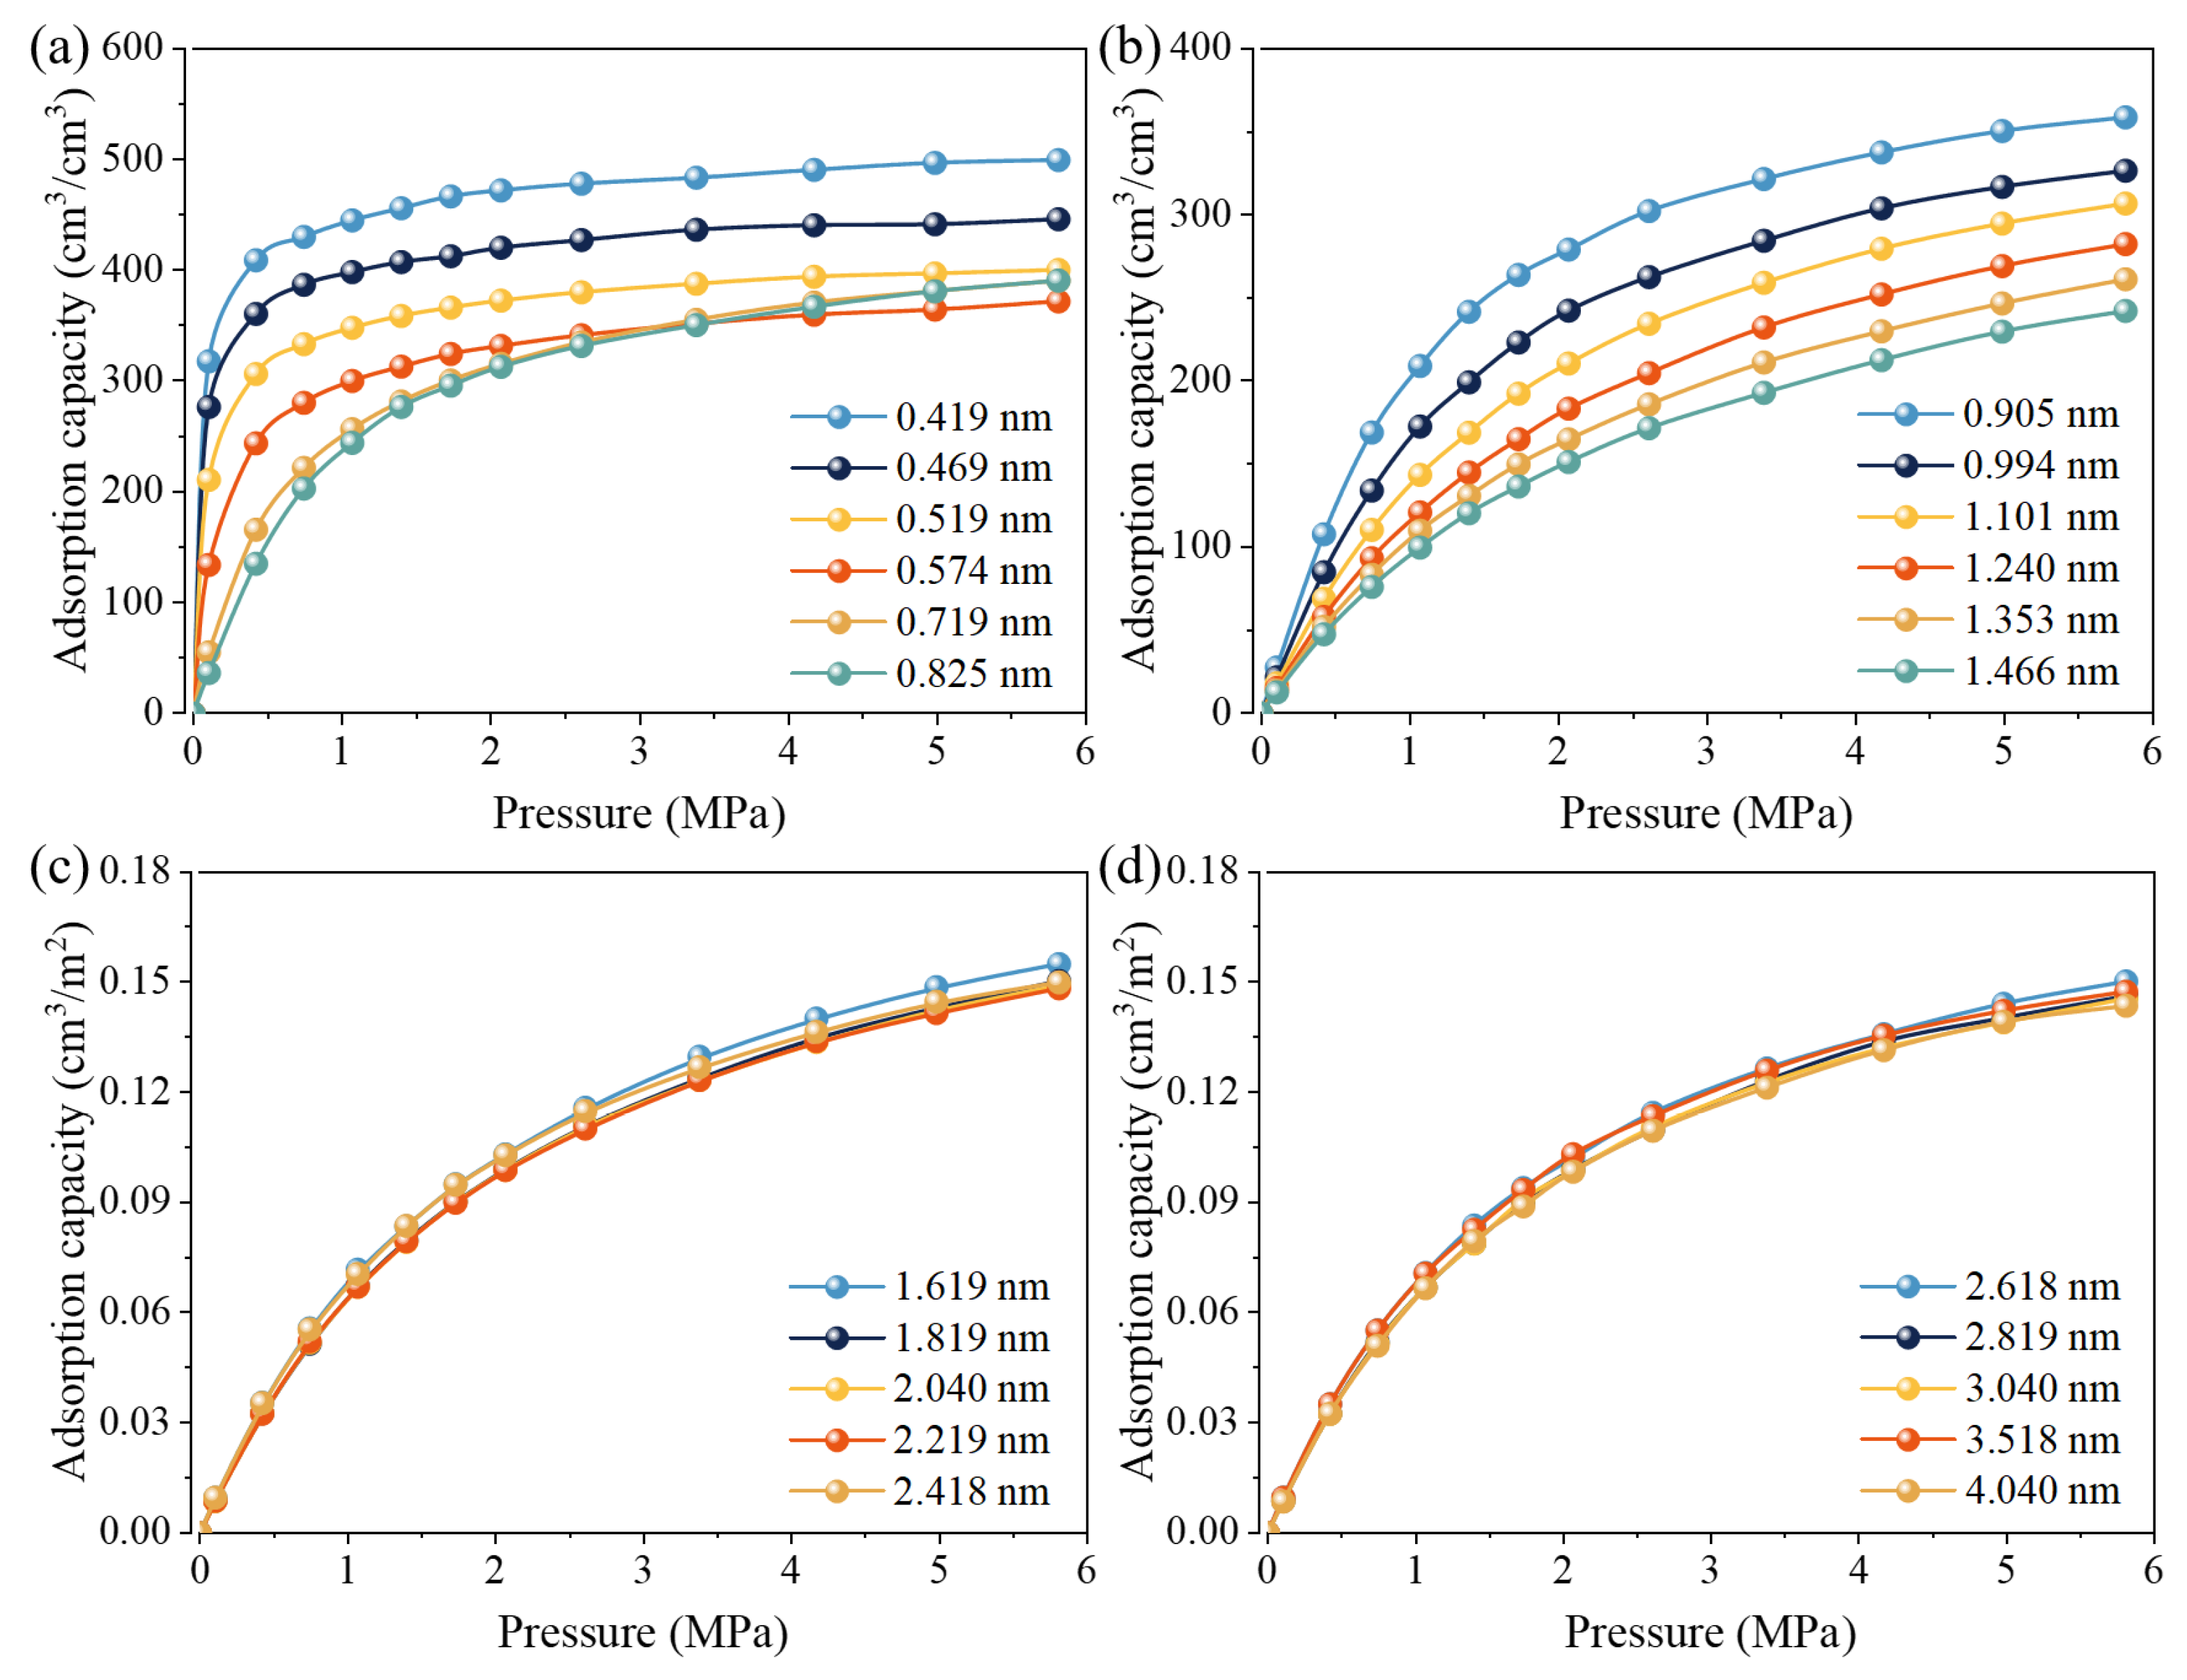
The number of CH4 molecules within a single simulated unit cell at varying pressures was converted. This conversion was performed to determine the corresponding quantity of adsorbed molecules per unit mass (or volume). Unit conversion was applied through Equations (12)–(14) with integration of the results. This process yielded the gas adsorption isotherms for pore structures of different sizes, as shown in Figure 5.
The CH4 adsorption isotherm of slit pore structures of different sizes showed that the smaller the pore size, the lower the pressure required for the pore to reach its ultimate adsorption capacity. Moreover, the smaller the pore size, the higher the adsorption potential energy [44,49]. Under the same gas pressure conditions, as the pore size increased from 0.419 nm to 1.466 nm, the ultimate CH4 adsorption capacity that the pore structure could accommodate did not decrease monotonically with increasing pore size. According to geometric theory, the maximum packing density of gas molecules within pores varies irregularly with pore size. This indicates that the ultimate density of adsorbed CH4 varied among pores of different sizes [44]. For slit pore structures ranging from 1.619 to 4.040 nm, the CH4 adsorption isotherms of different pore sizes were essentially consistent, reflecting similar adsorption behavior of CH4 within this size range. The Dubinin-Astakhov (DA) equation was applied to fit the CH4 isothermal adsorption data for pores of 0.38–1.5 nm, yielding the total micropore volume V0, proportion coefficient K, and heterogeneity parameter n, as shown in Table 1. The Langmuir equation was used to fit the CH4 isothermal adsorption data for pores larger than 1.5 nm, obtaining the characteristic parameters VL and PL of CH4 adsorption in pore structures above 1.5 nm, as shown in Table 1.
For CH4 adsorption in slit pores ranging from 0.419 to 1.466 nm, the correlation coefficient between the CH4 isothermal adsorption data and the DA equation rose sharply with pore size. This was mainly due to larger relative errors in adsorption data from fewer CH4 molecules in smaller pores and insufficient GCMC simulation iterations, which resulted in less smooth data. For CH4 adsorption in slit pores ranging from 1.619 to 4.040 nm, the CH4 isothermal adsorption data generally aligned well with the Langmuir equation. The correlation coefficient exceeded 0.9984, indicating that the monolayer adsorption theory effectively describes CH4 adsorption within this pore size range. Within slit pores ranging from 0.419 nm to 1.466 nm, the CH4 adsorption characteristic parameter νmi,r exhibited irregular variations but overall decreased as pore size increased. The adsorption characteristic parameter Kr increased monotonically with pore size, rising from 0.018 to 0.255 (representing an approximately 14 times increase). The parameter nr initially increased and subsequently decreased with pore size, changing from 2.044 to 2.366 before falling to 1.607. The adsorption characteristic parameter, Langmuir volume (VL), decreased monotonically with the increase in pore size for slit pores ranging from 1.619 to 4.040 nm. In contrast, the Langmuir pressure (PL) remained nearly constant. This suggests that the adsorption potential energies across these pore sizes are closely related, and that variations in ultimate adsorption capacity are potentially linked to the division of the adsorption region.

3. Experimental

3.1. Sample Preparation

To evaluate the relationship between the micropore structure and macroscopic CH4 adsorption characteristics in coal, and to validate the proposed theoretical model against experimental results, four coal samples were selected from different mining areas in China following GB/T 19222-2003 [51]. The metamorphic degree of coal samples was characterized based on proximate analysis parameters (volatile matter, Vdaf, and fixed carbon, FCad). As summarized in Table 2, the volatile matter decreases from 37.26% to 4.96%, while fixed carbon increases from 57.92% to 86.39%, indicating a clear progression from low-rank to high-rank coal. The basic physical property parameters of the coal samples were determined according to GB/T 212-2008 [52] using a 5E-MAG6600 fully automatic industrial analyzer (Changsha Kaiyuan Instrument Co., Ltd., Changsha, China). The test results of the basic physical property parameters are shown in Table 2.

3.2. Testing Methods

To quantitatively evaluate the distribution characteristics of adsorbed CH4 within pore structures of varying sizes in coal, this study employed the LPGA-N2 (77 K) and LPGA-CO2 (273 K) methods for the segmented quantitative characterization of different pore size ranges within coal samples. The LPGA-N2 (77 K) and LPGA-CO2 (273 K) experiments were conducted using an Autosorb iQ2 automated gas sorption analyzer (Quantachrome Instruments, Boynton Beach, FL, USA). The meso-macropore structures of the coal samples were quantitatively characterized in accordance with GB/T 21650.2-2008 [53], and the detailed experimental procedures followed previously published literature [31]. The micropore structures of the coal samples were quantitatively characterized in accordance with GB/T 21650.3-2011 [54], and the detailed experimental procedures followed previously published literature [55].
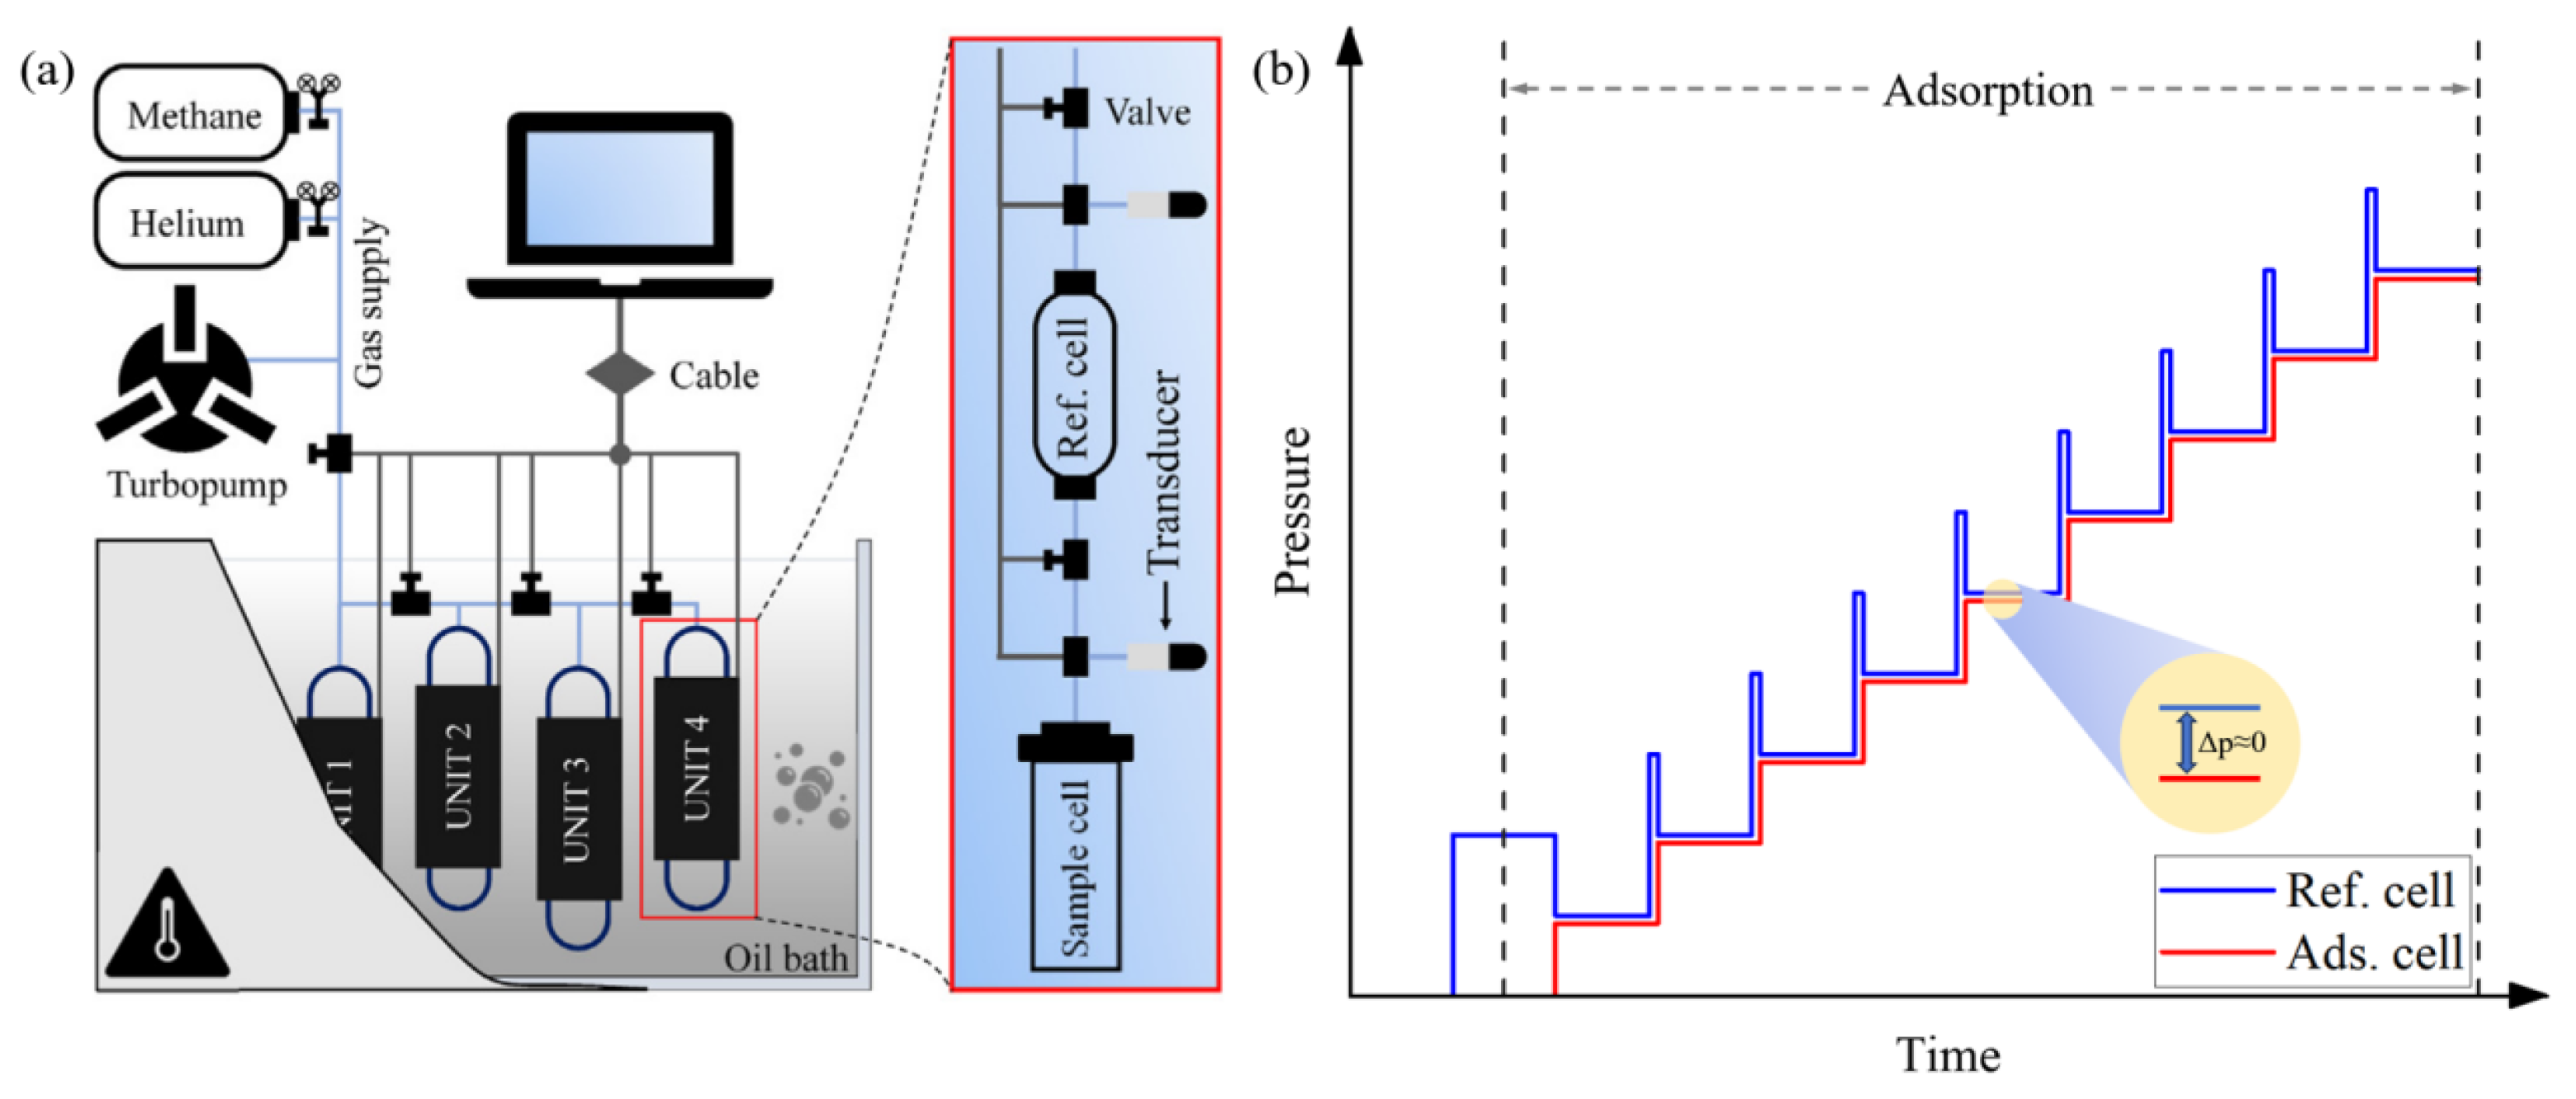
This study employed the volumetric method to examine the adsorption characteristics of coal samples with varying metamorphic degrees. The tests were conducted under different gas conditions at the National Engineering Research Center of Coal Mine Gas Control, China University of Mining and Technology. The experiments utilized a KDXJ-II coal gas adsorption/desorption dynamics analyzer, manufactured by Jiangsu Kedi Petroleum Instrument Co., Ltd. (Haian, China) [56] (See Figure 6 for the experimental instrument). The gas adsorption characteristics of coal samples with different metamorphic degrees were tested according to GB/T 19560-2008 [57]. The adsorption test steps mainly include the following: hermeticity testing, calibration of the reference and sample cell volumes, coal sample pretreatment, free space calibration of the sample cell, gas adsorption testing, and experimental data processing. Specific experimental details are available in previously published literature [58,59]. The adsorption experiments were carried out using the volumetric method under specified conditions. To ensure reliability, all experiments—including LPGA-CO2 (273 K), LPGA-N2 (77 K), and high-pressure CH4 adsorption—were conducted in triplicate for each coal sample. The reported results are averaged values, with deviations among parallel tests within ±3%, confirming good repeatability and a negligible influence on the conclusions.

4. Results and Discussion

4.1. Pore Size Distribution in Coal Samples

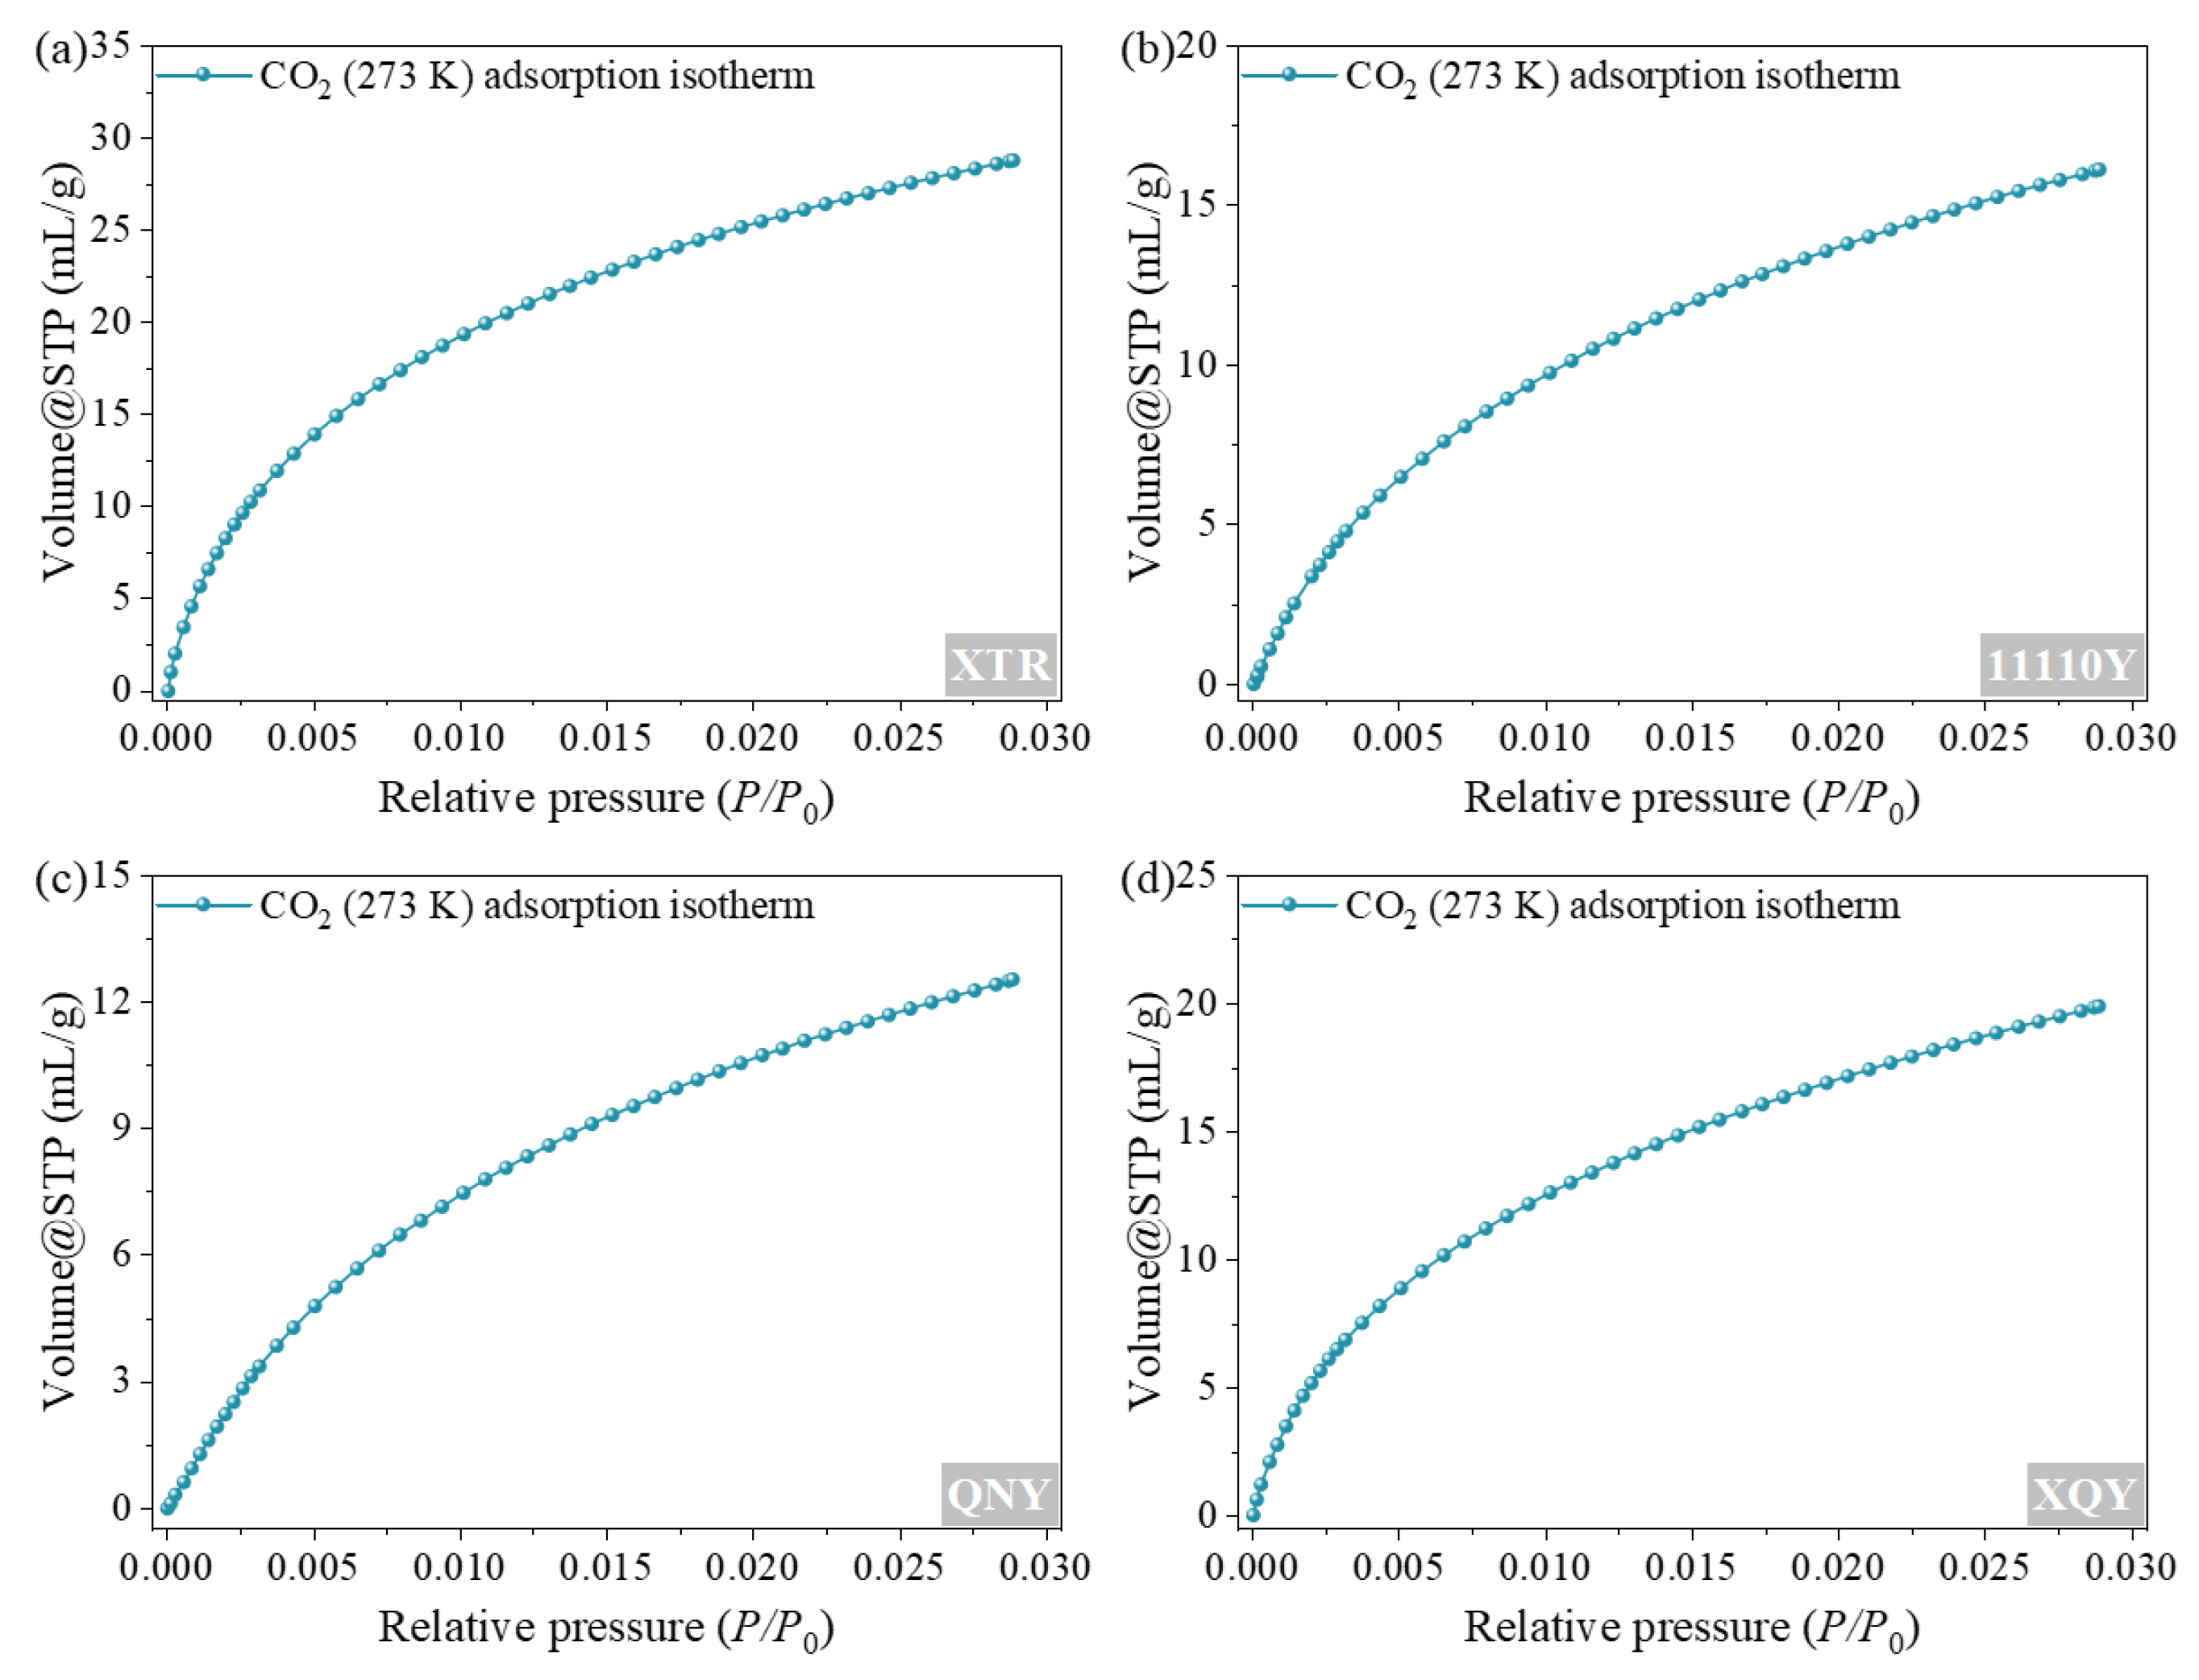
To quantitatively characterize the pore structures of varying sizes in coal, LPGA-N2 (77 K) adsorption/desorption isotherms and LPGA-CO2 (273 K) adsorption isotherms were measured for four coal samples of varying ranks. These isotherms are shown in Figure 7 and Figure 8, respectively.
The IUPAC classification now includes eight types of physical adsorption isotherms [60], an update from the original six. Thus, the LPGA-N2 (77 K) adsorption isotherms (Figure 7) of coal samples reflect a combination of Type I, Type IV (a), and Type II isotherms. At low relative pressures, the isotherm rises sharply, consistent with the low-pressure region of Type I isotherms. This behavior is attributed to N2 micropore filling within the coal matrix [60]. After micropore filling, the heterogeneity of the coal surface potential energy decreases significantly. This allows probe molecules to undergo monolayer adsorption, multilayer adsorption, and capillary condensation in mesopores and macropores. Capillary condensation typically causes irreversible adsorption/desorption, observable as hysteresis loops. This corresponds to the adsorption behavior near P/P0 ≈ 0.5 in Type IV (a) isotherms, suggesting the presence of mesopores around 4 nm in the coal [60,61,62]. As relative pressure approaches 1, the adsorption isotherm of coal showed varying degrees of rapid rise without the extreme adsorption plateau observed in category IV (a) adsorption isotherms [60,63]. This is consistent with the high-pressure stage of category II adsorption isotherms, indicating the existence of abundant macropores larger than 300 nm in coal [64]. Conversely, the LPGA-CO2 (273 K) adsorption isotherms (Figure 8) of coal samples with different metamorphic degrees displayed a convex shape increasing with relative pressure, corresponding to the adsorption isotherm of class I. This indicates the presence of a large number of micropore structures in coal [65,66].
Considering the applicability and analysis ranges of various analytical methods [55,67], the DFT method was selected to process LPGA-CO2 (273 K) isothermal adsorption data to obtain pore size distribution characteristics of micropores (0.38 to 1.50 nm). The micropore size range was then divided into 12 intervals (0.33 to 0.38 nm, 0.38 to 0.45 nm, 0.45 to 0.52 nm, 0.52 to 0.59 nm, 0.59 to 0.66 nm, 0.66 to 0.76 nm, 0.76 to 0.82 nm, 0.82 to 0.92 nm, 0.92 to 1.03 nm, 1.03 to 1.14 nm, 1.14 to 1.26 nm, 1.26 to 1.37 nm, and 1.37 to 1.50 nm). Segmental pore volumes for pores of different sizes were calculated using interpolation methods [31]. Based on LPGA-N2 (77 K) adsorption data, the BJH method was applied to determine the pore volume and specific surface area of pores ranging from 2 to 300 nm in different coal samples [68,69]. The pore volume parameters for different pore size ranges in coal are summarized in Table 3.
Analysis of the pore volume parameters for different size ranges of various coal samples (Table 3) shows that the total pore volume for four samples (0.38–300 nm) is between 0.042 and 0.088 cm3/g. Among the 13 artificially defined pore size intervals, the 0.52–0.59 nm interval accounts for the highest proportion of the total pore volume (18.63–21.88%). Pores within the ultra-micropore range (0.38–0.76 nm) constitute a substantial 58.23% to 66.33% of the total pore volume, while micropores (0.38–1.5 nm) represent 95.10% to 95.75%. These findings demonstrate that micropores (0.38–1.5 nm) dominate the pore structure of these coals. Within this micropore fraction, ultra-micropores (0.38–0.76 nm) contribute over 50% of the total pore volume, providing substantial adsorption sites for CH4 storage.

4.2. Validation of the Theoretical CH4 Adsorption Isotherms

To accurately characterize the CH4 adsorption features of pore structures within specific size ranges, each pore size range was treated as an adsorption unit containing only single-sized pores. The equivalent pore diameter was defined as the average pore diameter of its segment. The equivalent diameters for the 12 segments are 0.415 nm, 0.485 nm, 0.555 nm, 0.625 nm, 0.710 nm, 0.789 nm, 0.868 nm, 0.972 nm, 1.084 nm, 1.198 nm, 1.315 nm, and 1.437 nm. Based on the CH4 adsorption characteristic parameters for different pore structures obtained from GCMC simulation (see Table 1), the CH4 adsorption characteristic parameters (V0, K, n, VL, and PL) of slit pores under different conditions were determined using interpolation methods, as shown in Table 4.
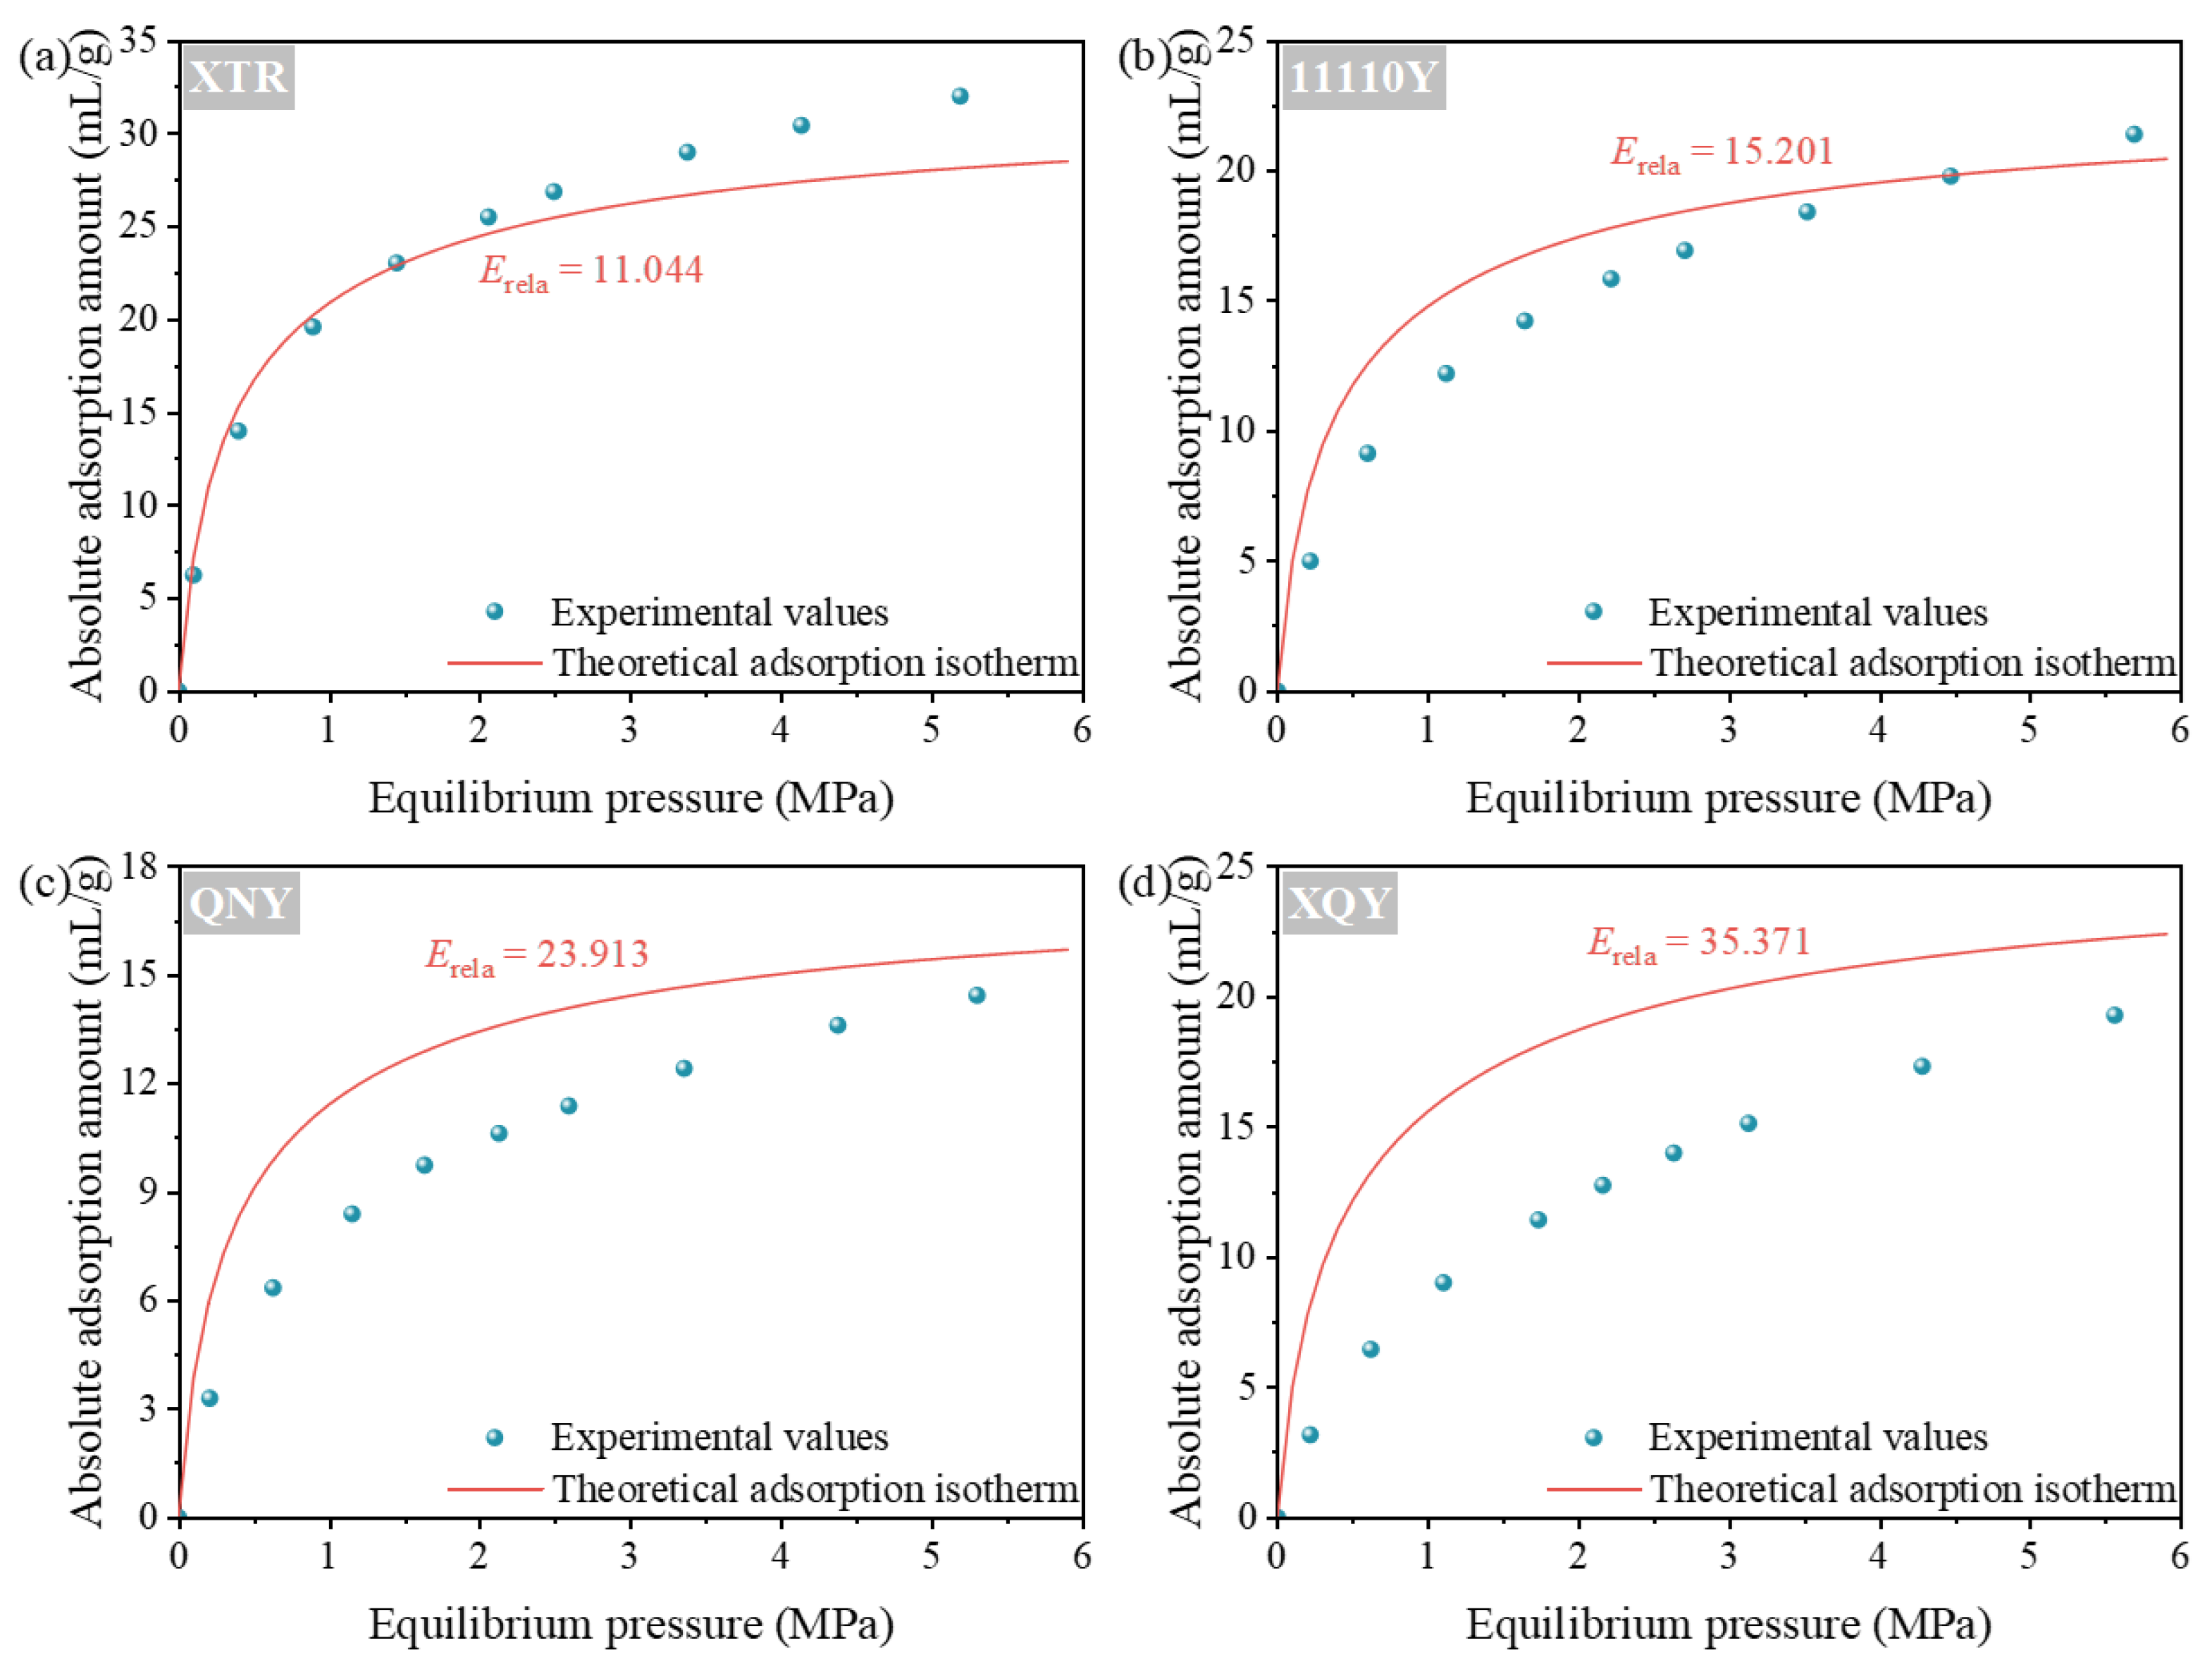
To validate the theoretical CH4 adsorption model for coal’s complex pore structure, the pore size distribution parameters (see Table 3) and their corresponding CH4 adsorption parameters (see Table 4) were substituted into Equation (9). This generated theoretical adsorption isotherms under the slit-pore assumption. The measured isothermal adsorption data and theoretical CH4 adsorption isotherms were then compared, as shown in Figure 9. To quantify the discrepancy between them, we calculated the average relative error (Erela) at each adsorption pressure. The Erela values were used to assess model accuracy:
E rela = 100 m i = 1 m V i meas V i theo V i theo
where m is the number of measured isothermal adsorption data, individual; V i meas is measured values of coal sample adsorption CH4 under different pressure conditions, cm3/g; V i theo is theoretical values of coal sample adsorption of CH4 under different pressure conditions, cm3/g.
By comparing the theoretical CH4 adsorption isotherms with the actual isotherm data of different coal samples under 30 °C conditions (see Figure 9), it is evident that with the intensification of coal chemical metamorphism, the average relative error between the theoretical CH4 adsorption isotherms and the measured isothermal adsorption data decreases rapidly from 35.371% to 11.044%. This demonstrates that the thermodynamic characterization model for CH4 adsorption in coal—established based on CH4 adsorption isotherm characteristics derived from a graphitic molecular structure model—is feasible. Although significant discrepancies exist when characterizing CH4 adsorption in medium-rank and low-rank coals, the model still yields the thermodynamic distribution characteristics of adsorbed CH4 within pore structures of varying sizes under different equilibrium pressures. These characteristics hold significant reference value for anthracite, which exhibits a graphite-like structure. The reason for this is that the macromolecular structure of coal gradually transforms into a graphite-like structure as the degree of metamorphism increases [70,71,72]. The graphite molecular structure model can reflect the CH4 adsorption characteristics of high-rank coal, which differ significantly from those of medium-rank and low-rank coal. In addition, Mosher et al. [44,46] observed significant deviations between theoretical predictions and experimental measurements when predicting CH4 adsorption isotherms for high-volatile bituminous coal based on the adsorption characteristics of individual pore sizes. Incomplete pore characterization data and oversimplified theoretical adsorption models were likely the primary factors contributing to these discrepancies.

4.3. Distribution Characteristics of Adsorbed CH4

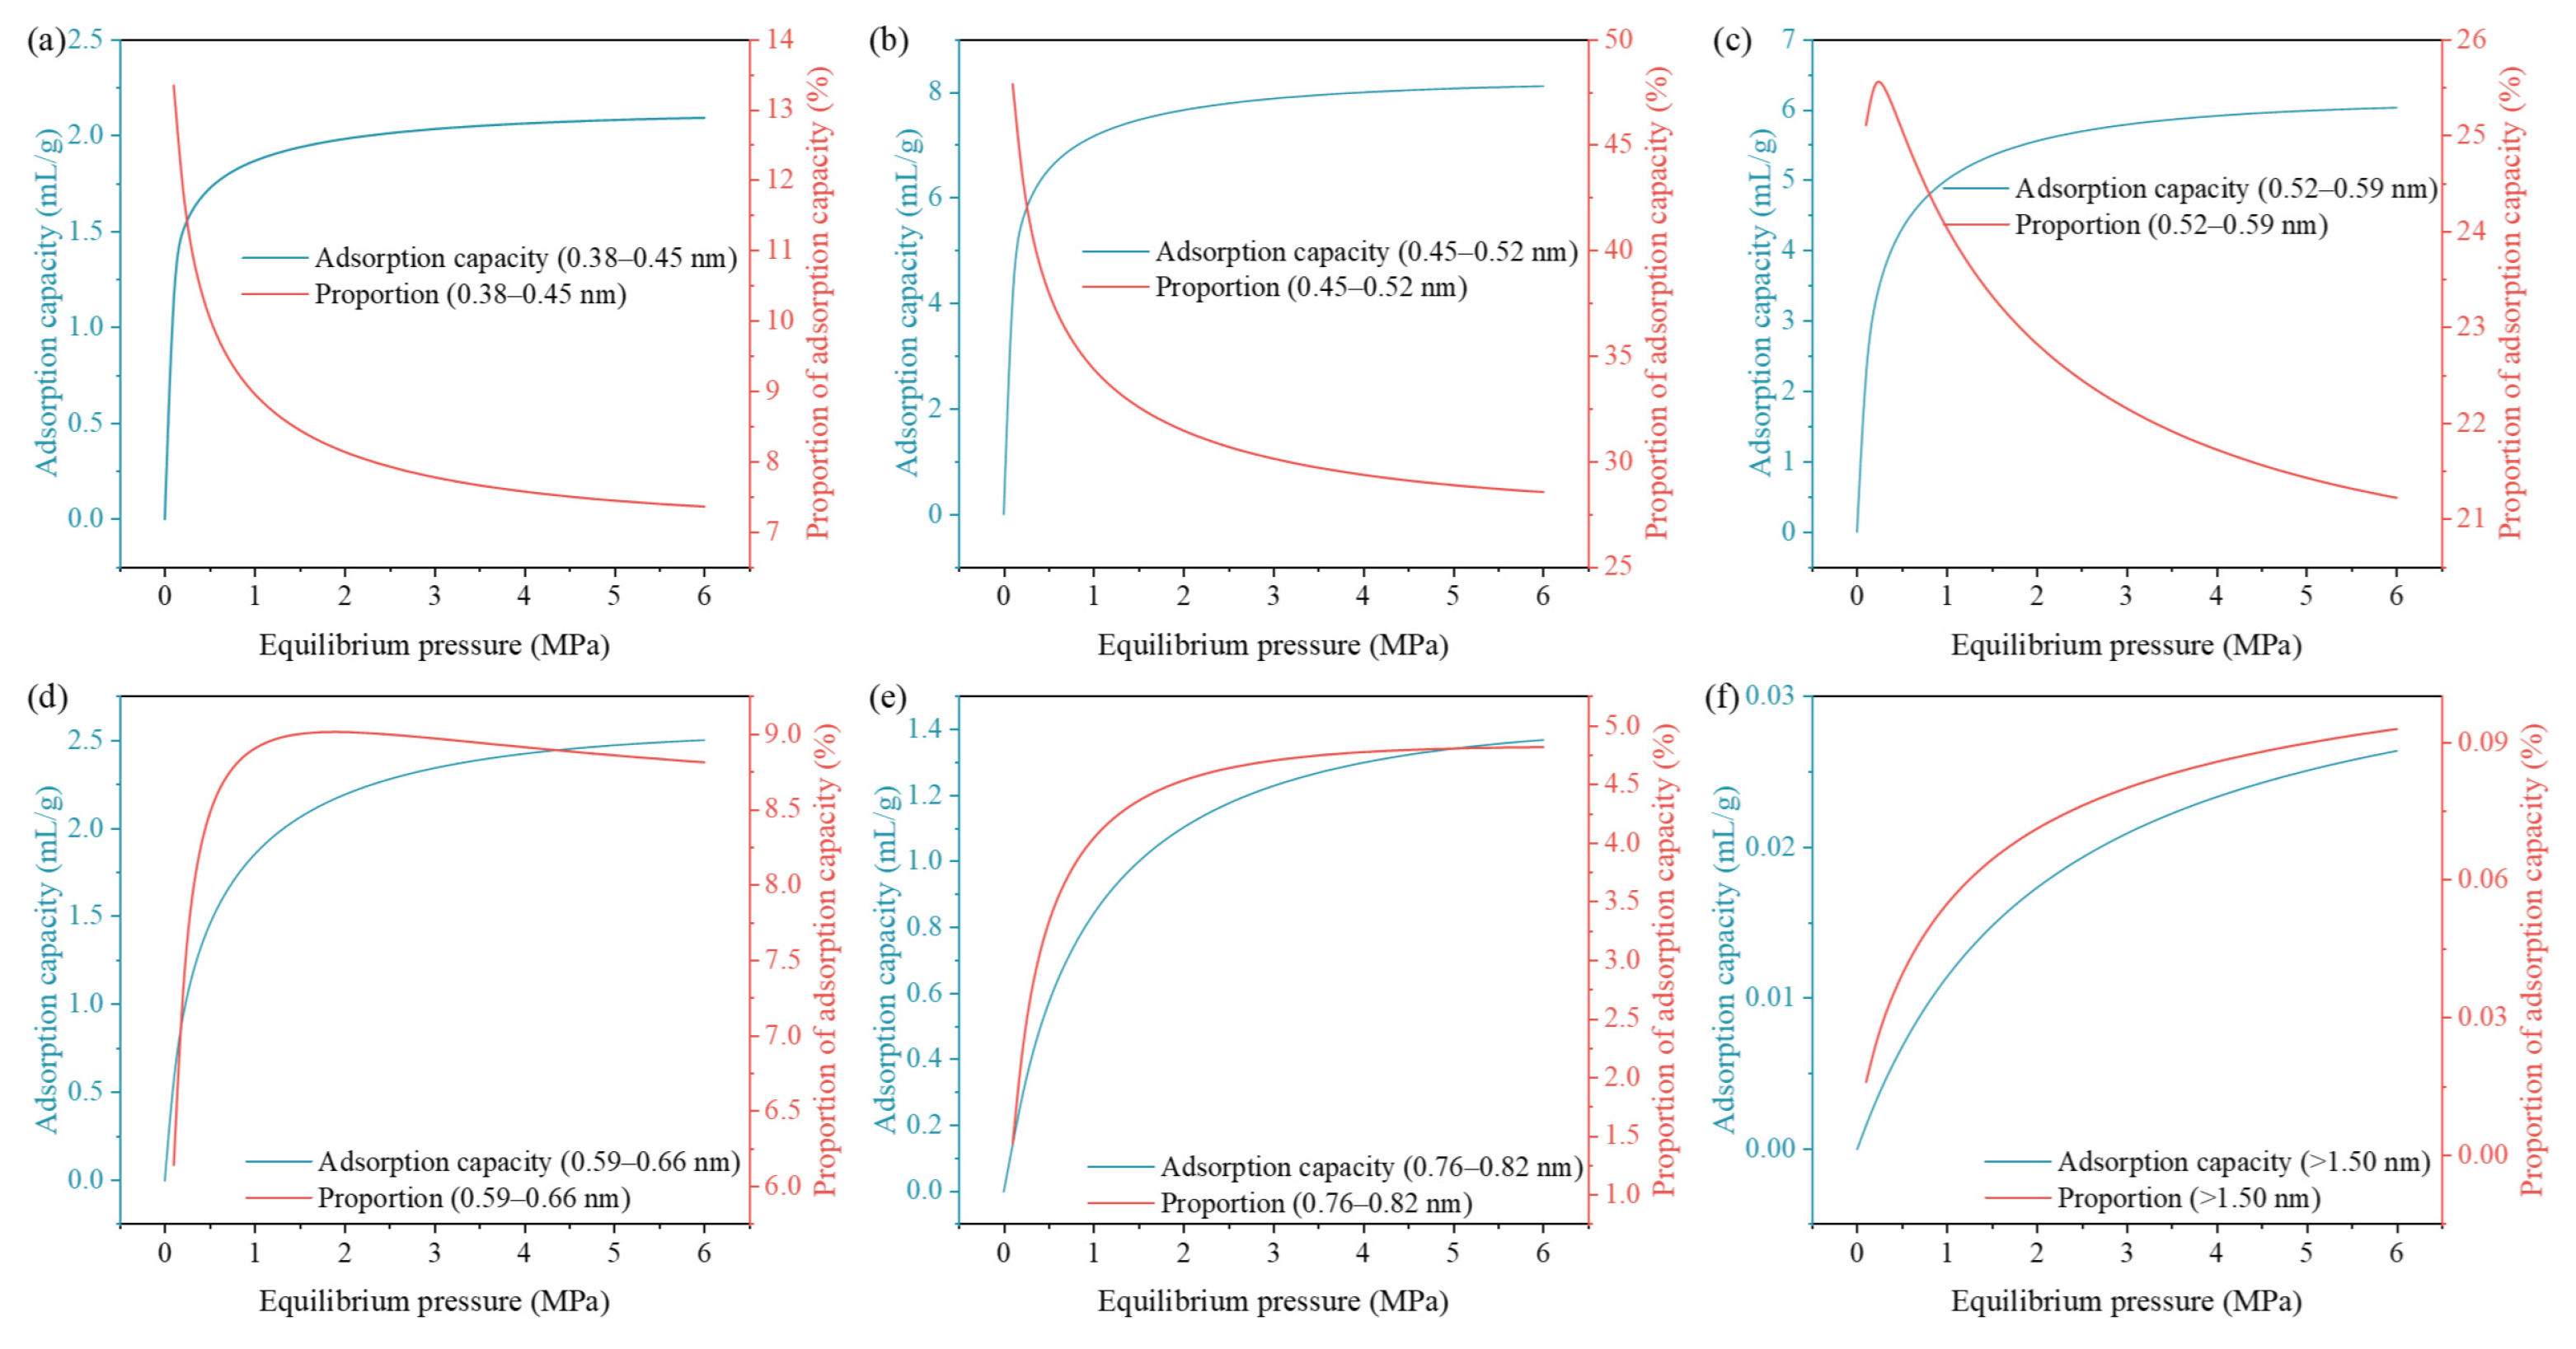
As outlined in Section 2.2, the theoretical CH4 adsorption isotherm for a coal sample is derived by combining the adsorption isotherms of its individual pore units. Consequently, by deconstructing the theoretical adsorption isotherm, we can reveal the CH4 adsorption characteristics of different pore structures under various pressures. Using the XTR coal sample as an example, Figure 10 displays the adsorption capacity and its proportion relative to the total capacity across different pore size ranges under increasing pressures. The results show that the adsorption capacity for all pore sizes increases as the equilibrium pressure rises. At an equilibrium pressure of 6 MPa, the adsorbed amounts for the pore size interval reached 2.091, 8.112, 6.028, 2.504, 1.369, and 0.026 cm3/g, respectively. These results indicate that the adsorption amount first increases and then decreases as the pore size grows. Specifically, pores in the 0.45–0.52 nm range exhibited the highest adsorption, while pores larger than 1.5 nm had the lowest-with an adsorbed volume significantly less than that of all other pore sizes. A comparison of adsorption trends across different pore sizes reveals distinct behaviors. For pores smaller than 0.52 nm (see Figure 10a,b), the adsorption amount increases rapidly at very low pressures and quickly approaches saturation. For pores between 0.52 and 1.5 nm (see Figure 10c–e), the adsorption amount rises rapidly initially and then gradually approaches saturation. For pores larger than 1.5 nm (see Figure 10f), the adsorbed amount increases continuously across the pressure range. Although the rate of increase slows, saturation is not achieved. This suggests that CH4 molecules preferentially fill smaller micropores as pressure increases.
Analysis of the adsorption capacity ratio of different pore structures of XTR coal samples under different pressure conditions at 30 °C (see Figure 10) reveals that the proportion of adsorption capacity attributed to pores smaller than 0.52 nm decreases gradually with increasing pressure. By combining this analysis with the lowest energy configurations of slit pores of different sizes at various CH4 pressures (see Figure 4), it is observed that CH4 molecules almost fully saturate the 0.519 nm pores at 0.1 MPa. Subsequent increases in pressure cannot accommodate more CH4 in these pores, while larger pores continue to adsorb CH4. This causes the proportion of CH4 adsorption capacity from sub-0.52 nm pores to decline slowly as pressure increases. The proportion of CH4 adsorption capacity for pores between 0.52 and 0.76 nm first increases and then decreases with pressure. This indicates that at lower pressures, the adsorption capacity of CH4 molecules in these pores increases gradually. As the CH4 pressure increases, the total amount of CH4 adsorbed by the complex pore structure in coal also increases. However, the increase in adsorption capacity provided by this pore size range mainly contributes to the total increase in adsorption capacity. This leads to an upward trend in the proportion of CH4 adsorption capacity from this pore size range as pressure increases. When the gas pressure further increases, the increase in adsorption capacity provided by this pore size range accounts for only a small proportion of the total adsorption capacity increase. This leads to a downward trend in the proportion of CH4 adsorption capacity from this pore size range as pressure increases. The peak pressure at which the proportion of adsorption capacity of different pore sizes increases with CH4 pressure varies; the smaller the pore size, the lower the CH4 pressure required to reach the peak. This indicates that smaller pore structures require less gas pressure to be filled with CH4 molecules. The proportion of CH4 adsorption capacity from pore structures larger than 0.92 nm in coal increases continuously with increasing pressure. This indicates that when the CH4 pressure is below 5.9 MPa, pore structures larger than 0.92 nm are not fully filled with CH4 molecules. Based on the changes in the proportion of CH4 adsorption capacity from pore structures larger than 1.5 nm in XTR coal samples under varying pressures, it is observed that under extreme conditions, CH4 molecules adsorbed on the surface of pores larger than 1.5 nm in a monomolecular form account for less than 1% of the ultimate adsorption capacity. As the pressure on CH4 decreases, the proportion of adsorption capacity from pores larger than 1.5 nm further decreases.
As stated in the introduction, a key application for this work is to provide a more accurate basis for resource assessment. Our thermodynamic model improves upon traditional methods in several critical ways. Firstly, conventional assessments often rely on a single set of ‘lumped’ parameters (e.g., from the Langmuir model) to characterize the entire coal matrix, which oversimplifies the heterogeneous pore system. Our model, by contrast, adopts a ‘distributed’ approach, quantifying the contribution of each pore size class to total gas storage. This provides a more physically grounded estimate of the gas in place (GIP). Secondly, and perhaps more importantly, our model differentiates between total GIP and recoverable reserves. The adsorption potential is much stronger in smaller pores, meaning gas is held more tightly. As demonstrated by the dynamic distribution analysis (Figure 10), our model can predict which portion of the gas is released at various stages of pressure depletion. This is crucial for forecasting production behavior and estimating ultimate recovery, which offers a significant advantage over methods that cannot distinguish the varying energy states of adsorbed gas molecules.

4.4. Limitations and Future Perspectives

While this study provides a robust framework for analyzing adsorbed gas distribution, several limitations are acknowledged, which also represent important avenues for future research.
(1)
The analysis in this study was conducted isothermally at 30 °C. However, in situ reservoir temperatures can vary significantly with depth. To extend the model’s applicability, future work should involve performing GCMC simulations across a range of geologically relevant temperatures. This would enable the establishment of temperature-dependent thermodynamic parameters, which in turn allows the model to predict gas distribution under diverse geothermal gradients—a capability crucial for deep coalbed methane (CBM) exploration.
(2)
The experimental validation and simulations in this study were limited to a maximum pressure of 6 MPa, constrained by our experimental setup. While this pressure range is sufficient for many conventional CBM scenarios, deep coal seams typically exhibit much higher pressures. Future studies should aim to acquire high-pressure experimental data to validate and potentially refine the model’s predictive behavior in the supercritical region—this will ensure the model’s robustness for deep reservoir conditions.
(3)
It should be noted that the GCMC simulations in this study employed a simplified slit-pore geometry. Although coal contains various pore morphologies, such as ink-bottle, wedge-shaped, and irregular pores, previous research has shown that slit pores are the most frequent type in the coal matrix [44,73]. They provide a large specific surface area and significantly influence methane adsorption capacity. Furthermore, GCMC studies have demonstrated that experimentally measured isotherms align more closely with slit-pore model predictions, whereas circular and square pore models tend to underestimate actual adsorption [46]. Therefore, the slit-pore model was adopted to simulate methane adsorption behavior, ensuring comparability and reducing computational complexity. However, it may overlook the effects of complex pore connectivity and geometric features. Future research will incorporate more realistic pore geometries to improve predictive accuracy.
Addressing these aspects will enhance the model’s fidelity and broaden its application scope, building upon the foundational understanding of dynamic gas distribution established in this work.

5. Conclusions

This study presents a quantitative thermodynamic framework to characterize CH4 adsorption behavior in coal with complex pore structures of various sizes. By integrating GCMC simulations with pore structure characterization and experimental validation, we systematically revealed the spatial distribution and governing mechanisms of CH4 adsorption under different pressure conditions. The main conclusions are as follows:
(1)
Micropores (0.38–1.5 nm) dominate the pore structure of the studied coals. They account for 95.10–95.75% of the total pore volume. Within this range, ultra-micropores (0.38–0.76 nm) contribute 58.23–66.33%, serving as the principal adsorption sites for CH4 storage.
(2)
CH4 adsorption behavior strongly depends on pore size. Smaller pores require lower pressure to reach CH4 saturation and exhibit higher adsorption potential energy. In slit pores from 0.419 to 1.466 nm, the characteristic parameter νmi,r decreases irregularly overall (from 500.7 to 278.5 cm3/cm3), Kr increases significantly (from 0.018 to 0.255, 14 times), and nr initially rises (from 2.044 to 2.366) and then declines (to 1.607). For larger slit pores (1.619–4.040 nm), VL gradually decreases (from 0.211 to 0.198 cm3/m2), while PL remains almost constant. This suggests similar CH4 adsorption behavior in these pores.
(3)
The proposed thermodynamic model is based on GCMC-derived adsorption behavior. It shows good agreement with experimental CH4 adsorption isotherms, especially for high-rank coals. As coal rank increases, the mean relative deviation between theoretical and measured CH4 adsorption isotherms drops sharply from 35.371% to 11.044%. This supports the model’s applicability to coals with graphite-like molecular structures.
(4)
Adsorbed CH4 distribution analysis reveals dynamic pressure-dependent pore contributions: pores <0.52 nm dominate at low pressures but saturate rapidly, reducing their relative share. Pores in the range of 0.52–0.76 nm show a peak contribution at intermediate pressures. Pores larger than 0.92 nm continue to increase their contribution as pressure rises, highlighting their importance for high-pressure CH4 storage.

Author Contributions

B.H.: Data curation, Formal analysis, Funding acquisition, Methodology, Project administration, Resources, Writing—review and editing. Z.R.: Data curation, Formal analysis, Methodology, Validation, Writing—original draft. S.L.: Conceptualization, Methodology, Resources. X.H.: Investigation, Validation, Writing—review and editing. H.L.: Formal analysis, Methodology. L.C.: Formal analysis, Project administration. R.L.: Investigation, Validation. All authors have read and agreed to the published version of the manuscript.

Funding

This research was supported by the National Natural Science Foundation of China (No. 52304255), the Education Department of Shaanxi Province (No. 23JK0546), the Shaanxi Province Postdoctoral Science Foundation (No. 2023BSHYDZZ153).

Data Availability Statement

The original contributions presented in this study are included in the article. Further inquiries can be directed to the corresponding author.

Acknowledgments

The use of the Materials Studio 2020 (20.1.0.2728) software package, which was supported by the College of Chemistry and Chemical Engineering of Xi’an University of Science and Technology, is gratefully acknowledged.

Conflicts of Interest

The authors declare no conflicts of interest.

References

  1. Zhao, W.; Zhao, D.; Wang, K.; Fan, L.; Zhao, Z.; Dong, H.; Shu, L. Will Greenhouse Gas Emissions Increase with Mining Depth in Coal Mines? An Analysis of Gas Occurrence under Varying in-Situ Stress Conditions. Sci. Total Environ. 2024, 945, 173957. [Google Scholar] [CrossRef]
  2. Cheng, Y.; Hu, B. Main occurrence form of methane in coal: Micropore filling. J. China Coal Soc. 2021, 46, 2933–2948. [Google Scholar] [CrossRef]
  3. Zhao, W.; Dong, H.; Yan, Z.; Wang, K.; Shu, L.; Feng, Z.; Lu, S.; Hu, K. Hierarchical occurrence law of gas content in deep coal seams and its relationship with outburst prevention. J. China Coal Soc. 2025, 50, 1555–1568. [Google Scholar] [CrossRef]
  4. Qin, Y.; Shen, J.; Shi, R. Strategic value and choice on construction of large CMG industry in China. J. China Coal Soc. 2022, 47, 371–387. [Google Scholar] [CrossRef]
  5. Fang, Z.; Yang, C.; Wang, R. Monitoring Technologies for CO2 Storage in Coal Seams and Enhanced Coalbed Methane Recovery: A Review of Field Applications. Fuel Process. Technol. 2025, 276, 108274. [Google Scholar] [CrossRef]
  6. Li, H.; Wu, X.; Liu, H.; Hong, Y.; Zou, Q.; Lu, J.; Mou, J. Gas-Flow Microchannels in Coal Due to Microwave-LN2 Cycles: Adsorption/Desorption Behavior and Nanoscale Surface Morphology. Energy Fuels 2025, 39, 5349–5363. [Google Scholar] [CrossRef]
  7. Xue, H.; Wang, G.; Gong, H.; Li, X.; Du, F. Effect of CO2 Sinusoidal, Step-Flow Injection on Coalbed CH4 Desorption-Diffusion Mechanisms. Energy Fuels 2024, 38, 16756–16771. [Google Scholar] [CrossRef]
  8. Chai, H.; Wu, J.; Zhang, L.; Zhao, Y.; Cai, K. Research on an Equivalent Algorithm for Predicting Gas Content in Deep Coal Seams. Appl. Sci. 2024, 14, 9601. [Google Scholar] [CrossRef]
  9. Zhao, B.; Wen, G.; Ma, Q.; Sun, H.; Yan, F.; Nian, J. Distribution Characteristics of Pulverized Coal and Stress–Gas Pressure–Temperature Response Laws in Coal and Gas Outburst under Deep Mining Conditions. Energy Sci. Eng. 2022, 10, 2205–2223. [Google Scholar] [CrossRef]
  10. Chen, D.; Qu, B.; Zhang, J.; Long, Q.; Sun, R. Methods and Techniques for Determining the Gas Content of Coal Seams in China: A Mini-Review. Fuel Process. Technol. 2025, 275, 108257. [Google Scholar] [CrossRef]
  11. Yang, D.; Cui, G.; Elsworth, D.; Wang, C.; Cheng, W.; Yang, C.; Chen, T. Damage-Based Microscale Model Explains Observed Two-Stage Shale Gas Depletion Profiles at Reservoir Scale. Energy Fuels 2025, 39, 13488–13504. [Google Scholar] [CrossRef]
  12. Liu, T.; Lin, B.; Sang, S.; Yang, W.; Liu, T.; Liu, S.; Zheng, S.; Wang, T. Control Mechanisms of Macromolecular Compositions and Structures of Coals on the Evolution of Nanopores during Coalification. Energy Fuels 2024, 38, 13002–13018. [Google Scholar] [CrossRef]
  13. Yang, T.; Tang, H.; Hou, Y.; He, Y.; Liu, B.; Wang, P.; Peng, X.; Zhang, M.; Wang, Z.; Wang, M. Pore Structure Evolution in Long-Term Water-Flooding Unconsolidated Sandstone Reservoirs. Energy Fuels 2025, 39, 12860–12874. [Google Scholar] [CrossRef]
  14. Clarkson, C.R.; Bustin, R.M. The Effect of Pore Structure and Gas Pressure upon the Transport Properties of Coal: A Laboratory and Modeling Study. 2. Adsorption Rate Modeling. Fuel 1999, 78, 1345–1362. [Google Scholar] [CrossRef]
  15. Nie, B.; Liu, X.; Yang, L.; Meng, J.; Li, X. Pore Structure Characterization of Different Rank Coals Using Gas Adsorption and Scanning Electron Microscopy. Fuel 2015, 158, 908–917. [Google Scholar] [CrossRef]
  16. Lu, J.; Wang, X.; Li, H.; Shi, S.; Yang, W.; Lu, Y.; Shao, S.; Ye, Q. Molecular Insights into the Methane Adsorption Capacity of Coal under Microwave Irradiation Based on Solid-State 13C-NMR and XPS. Fuel 2023, 339, 127484. [Google Scholar] [CrossRef]
  17. Liu, D.; Yao, Y.; Chang, Y. Measurement of Adsorption Phase Densities with Respect to Different Pressure: Potential Application for Determination of Free and Adsorbed Methane in Coalbed Methane Reservoir. Chem. Eng. J. 2022, 446, 137103. [Google Scholar] [CrossRef]
  18. Moore, T.A. Coalbed Methane: A Review. Int. J. Coal Geol. 2012, 101, 36–81. [Google Scholar] [CrossRef]
  19. Bustin, R.M.; Clarkson, C.R. Geological Controls on Coalbed Methane Reservoir Capacity and Gas Content. Int. J. Coal Geol. 1998, 38, 3–26. [Google Scholar] [CrossRef]
  20. An, F.-H.; Cheng, Y.-P.; Wu, D.-M.; Wang, L. The Effect of Small Micropores on Methane Adsorption of Coals from Northern China. Adsorption 2013, 19, 83–90. [Google Scholar] [CrossRef]
  21. Tao, S.; Chen, S.; Tang, D.; Zhao, X.; Xu, H.; Li, S. Material Composition, Pore Structure and Adsorption Capacity of Low-Rank Coals around the First Coalification Jump: A Case of Eastern Junggar Basin, China. Fuel 2018, 211, 804–815. [Google Scholar] [CrossRef]
  22. Byamba-Ochir, N.; Shim, W.G.; Balathanigaimani, M.S.; Moon, H. High Density Mongolian Anthracite Based Porous Carbon Monoliths for Methane Storage by Adsorption. Appl. Energy 2017, 190, 257–265. [Google Scholar] [CrossRef]
  23. Juntgen, H. Research for Future in Situ Conversion of Coal. Fuel 1987, 66, 443–453. [Google Scholar] [CrossRef]
  24. Busch, A.; Gensterblum, Y. CBM and CO2-ECBM Related Sorption Processes in Coal: A Review. Int. J. Coal Geol. 2011, 87, 49–71. [Google Scholar] [CrossRef]
  25. Wang, Y.; Zhu, Y.; Liu, S.; Zhang, R. Pore Characterization and Its Impact on Methane Adsorption Capacity for Organic-Rich Marine Shales. Fuel 2016, 181, 227–237. [Google Scholar] [CrossRef]
  26. Lozano-Castelló, D.; Cazorla-Amorós, D.; Linares-Solano, A. Powdered Activated Carbons and Activated Carbon Fibers for Methane Storage:  A Comparative Study. Energy Fuels 2002, 16, 1321–1328. [Google Scholar] [CrossRef]
  27. Jin, K.; Cheng, Y.; Liu, Q.; Zhao, W.; Wang, L.; Wang, F.; Wu, D. Experimental Investigation of Pore Structure Damage in Pulverized Coal: Implications for Methane Adsorption and Diffusion Characteristics. Energy Fuels 2016, 30, 10383–10395. [Google Scholar] [CrossRef]
  28. Li, C.; Qin, Y.; Guo, T.; Shen, J.; Yang, Y. Supercritical Methane Adsorption in Coal and Implications for the Occurrence of Deep Coalbed Methane Based on Dual Adsorption Modes. Chem. Eng. J. 2023, 474, 145931. [Google Scholar] [CrossRef]
  29. He, X.; Zhang, R.; Elsworth, D.; He, L.; Liu, S. Beyond Liquid Density Assumptions: A Novel SANS-Based Approach to Quantify Adsorbed Methane and Adsorption-Induced Coal Microstructure Alterations. Chem. Eng. J. 2025, 518, 164725. [Google Scholar] [CrossRef]
  30. Hu, B.; Ren, Z.; Li, S.; He, X.; Lin, H.; Bai, Y.; Yan, D.; Luo, R. A New Quantitative Characterization Method of Absolute Methane Adsorption Isotherm in Coal. Chem. Eng. J. 2025, 522, 167551. [Google Scholar] [CrossRef]
  31. Hu, B.; Cheng, Y.; He, X.; Wang, Z.; Jiang, Z.; Wang, C.; Li, W.; Wang, L. New Insights into the CH4 Adsorption Capacity of Coal Based on Microscopic Pore Properties. Fuel 2020, 262, 116675. [Google Scholar] [CrossRef]
  32. Jia, T.; Zhang, S.; Tang, S.; Xin, D.; Zhang, S.; Wang, B.; Zhang, Q.; Zhang, K.; Lin, D.; Yang, W. Density and Volume of Adsorbed Methane in Key Applications for In-Situ Gas Content: Insights from Molecular Simulation. Chem. Eng. J. 2024, 490, 151809. [Google Scholar] [CrossRef]
  33. Hu, B.; Cheng, Y.; Pan, Z. Classification Methods of Pore Structures in Coal: A Review and New Insight. Gas Sci. Eng. 2023, 110, 204876. [Google Scholar] [CrossRef]
  34. Zhang, K.; Xing, X.; Wang, L.; Yang, B.; Li, J.; Zhang, H. Micro-CT Image-Based Characterization of Microstructure Complexity in Coal: From the Perspective of Fractal Geometrical Theory. Nat. Resour. Res. 2025. [Google Scholar] [CrossRef]
  35. Dubinin, M.M. The Potential Theory of Adsorption of Gases and Vapors for Adsorbents with Energetically Nonuniform Surfaces. Chem. Rev. 1960, 60, 235–241. [Google Scholar] [CrossRef]
  36. Brunauer, S.; Emmett, P.H.; Teller, E. Adsorption of Gases in Multimolecular Layers. J. Am. Chem. Soc. 1938, 60, 309–319. [Google Scholar] [CrossRef]
  37. Langmuir, I. The Adsorption of Gases on Plane Surfaces of Glass, Mica and Platinum. J. Am. Chem. Soc. 1918, 40, 1361–1403. [Google Scholar] [CrossRef]
  38. Dubinin, M.M.; Astakhov, V.A. Description of Adsorption Equilibria of Vapors on Zeolites over Wide Ranges of Temperature and Pressure. In Advances in Chemistry; American Chemical Society: Washington, DC, USA, 1971; Volume 102, pp. 69–85. [Google Scholar] [CrossRef]
  39. Dubinin, M.M. Adsorption in Micropores. J. Colloid Interface Sci. 1967, 23, 487–499. [Google Scholar] [CrossRef]
  40. Hao, S.; Chu, W.; Jiang, Q.; Yu, X. Methane Adsorption Characteristics on Coal Surface above Critical Temperature through Dubinin–Astakhov Model and Langmuir Model. Colloids Surf. Physicochem. Eng. Asp. 2014, 444, 104–113. [Google Scholar] [CrossRef]
  41. Charoensuppanimit, P.; Mohammad, S.A.; Robinson, R.L.; Gasem, K.A.M. Modeling the Temperature Dependence of Supercritical Gas Adsorption on Activated Carbons, Coals and Shales. Int. J. Coal Geol. 2015, 138, 113–126. [Google Scholar] [CrossRef]
  42. Yelash, L.V.; Kraska, T. A Generic Equation of State for the Hard-Sphere Fluid Incorporating the High Density Limit. Phys. Chem. Chem. Phys. 2001, 3, 3114–3118. [Google Scholar] [CrossRef]
  43. Hu, B. Methane Adsorption Behavior Characteristics of Multi-Scale Pore Structure in Coal and its Microscopic Influencing Mechanism. Ph.D. Thesis, China University of Mining and Technology, Xuzhou, China, 2022. [Google Scholar] [CrossRef]
  44. Mosher, K.; He, J.; Liu, Y.; Rupp, E.; Wilcox, J. Molecular Simulation of Methane Adsorption in Micro- and Mesoporous Carbons with Applications to Coal and Gas Shale Systems. Int. J. Coal Geol. 2013, 109, 36–44. [Google Scholar] [CrossRef]
  45. Liu, Y.; Zhu, Y.; Liu, S.; Li, W.; Tang, X. Temperature Effect on Gas Adsorption Capacity in Different Sized Pores of Coal: Experiment and Numerical Modeling. J. Pet. Sci. Eng. 2018, 165, 821–830. [Google Scholar] [CrossRef]
  46. Song, W.; Yao, J.; Ma, J.; Li, A.; Li, Y.; Sun, H.; Zhang, L. Grand Canonical Monte Carlo Simulations of Pore Structure Influence on Methane Adsorption in Micro-Porous Carbons with Applications to Coal and Shale Systems. Fuel 2018, 215, 196–203. [Google Scholar] [CrossRef]
  47. Lemmon, E.W.; Huber, M.L.; McLinden, M.O. NIST Standard Reference Database 23: Reference Fluid Thermodynamic and Transport Properties, Version 9.1; NIST: Gaithersburg, MD, USA, 2013. [Google Scholar]
  48. Ortiz, L.; Kuchta, B.; Firlej, L.; Roth, M.W.; Wexler, C. Methane Adsorption in Nanoporous Carbon: The Numerical Estimation of Optimal Storage Conditions. Mater. Res. Express 2016, 3, 55011. [Google Scholar] [CrossRef]
  49. Heffelfinger, G.S.; Tan, Z.; Gubbins, K.E.; Marini Bettolo Marconi, U.; Van Swol, F. Fluid Mixtures in Narrow Cylindrical Pores: Computer Simulation and Theory. Int. J. Thermophys. 1988, 9, 1051–1060. [Google Scholar] [CrossRef]
  50. Song, W.; Yao, B.; Yao, J.; Li, Y.; Sun, H.; Yang, Y.; Zhang, L. Methane Surface Diffusion Capacity in Carbon-Based Capillary with Application to Organic-Rich Shale Gas Reservoir. Chem. Eng. J. 2018, 352, 644–654. [Google Scholar] [CrossRef]
  51. GB/T 19222-2003; Sampling of Coal Petrology. Standard Press of China: Beijing, China, 2003.
  52. GB/T 212-2008; Proximate Analysis of Coal. Standard Press of China: Beijing, China, 2008.
  53. GB/T 21650.2-2008; Pore Size Distribution and Porosity of Solid Materials by Mercury Porosimetry and Gas Adsorption—Part 2: Analysis of Mesopores and Macropores by Gas Adsorption. Standard Press of China: Beijing, China, 2008.
  54. GB/T 21650.3-2011; Pore Size Distribution and Porosity of Solid Materials by Mercury Porosimetry and Gas Adsorption—Part3: Analysis of Micropores by Gas Adsorption. Standard Press of China: Beijing, China, 2011.
  55. Hu, B.; Cheng, Y.; Wang, Z.; He, X.; Jiang, Z.; Yi, M.; Li, W.; Wang, L. Effect of Pulverization on the Microporous and Ultramicroporous Structures of Coal Using Low-Pressure CO2 Adsorption. Energy Fuels 2019, 33, 10611–10621. [Google Scholar] [CrossRef]
  56. He, X.; Cheng, Y.; Hu, B.; Wang, Z.; Wang, C.; Yi, M.; Wang, L. Effects of Coal Pore Structure on Methane-coal Sorption Hysteresis: An Experimental Investigation Based on Fractal Analysis and Hysteresis Evaluation. Fuel 2020, 269, 117438. [Google Scholar] [CrossRef]
  57. GB/T 19560-2008; Experimental Method of High-Pressure Isothermal Adsorption to Coal. Standard Press of China: Beijing, China, 2008.
  58. Hu, B.; Cheng, Y.; Wang, L.; Zhang, K.; He, X.; Yi, M. Experimental Study on Influence of Adsorption Equilibrium Time on Methane Adsorption Isotherm and Langmuir Parameter. Adv. Powder Technol. 2021, 32, 4110–4119. [Google Scholar] [CrossRef]
  59. Ekundayo, J.M.; Rezaee, R. Effect of Equation of States on High-Pressure Volumetric Measurements of Methane–Coal Sorption Isotherms—Part 1: Volumes of Free Space and Methane Adsorption Isotherms. Energy Fuels 2019, 33, 1029–1036. [Google Scholar] [CrossRef]
  60. Thommes, M.; Kaneko, K.; Neimark, A.V.; Olivier, J.P.; Rodriguez-Reinoso, F.; Rouquerol, J.; Sing, K.S.W. Physisorption of Gases, with Special Reference to the Evaluation of Surface Area and Pore Size Distribution (IUPAC Technical Report). Pure Appl. Chem. 2015, 87, 1051–1069. [Google Scholar] [CrossRef]
  61. Landers, J.; Gor, G.Y.; Neimark, A.V. Density Functional Theory Methods for Characterization of Porous Materials. Colloids Surf. A 2013, 437, 3–32. [Google Scholar] [CrossRef]
  62. Thommes, M.; Cychosz, K.A. Physical Adsorption Characterization of Nanoporous Materials: Progress and Challenges. Adsorption 2014, 20, 233–250. [Google Scholar] [CrossRef]
  63. Cai, Y.; Liu, D.; Pan, Z.; Yao, Y.; Li, J.; Qiu, Y. Pore Structure and Its Impact on CH4 Adsorption Capacity and Flow Capability of Bituminous and Subbituminous Coals from Northeast China. Fuel 2013, 103, 258–268. [Google Scholar] [CrossRef]
  64. Guo, H.; Cheng, Y.; Wang, L.; Lu, S.; Jin, K. Experimental Study on the Effect of Moisture on Low-Rank Coal Adsorption Characteristics. J. Nat. Gas Sci. Eng. 2015, 24, 245–251. [Google Scholar] [CrossRef]
  65. Sing, K.S.W. Reporting Physisorption Data for Gas/Solid Systems with Special Reference to the Determination of Surface Area and Porosity (Recommendations 1984). Pure Appl. Chem. 1985, 57, 603–619. [Google Scholar] [CrossRef]
  66. Brunauer, S.; Deming, L.S.; Deming, W.E.; Teller, E. On a Theory of the van Der Waals Adsorption of Gases. J. Am. Chem. Soc. 1940, 62, 1723–1732. [Google Scholar] [CrossRef]
  67. Hu, B.; Cheng, Y.; He, X.; Wang, Z.; Jiang, Z.; Yi, M.; Li, W.; Wang, L. Effects of Equilibrium Time and Adsorption Models on the Characterization of Coal Pore Structures Based on Statistical Analysis of Adsorption Equilibrium and Disequilibrium Data. Fuel 2020, 281, 118770. [Google Scholar] [CrossRef]
  68. Neimark, A.V.; Ravikovitch, P.I.; Grün, M.; Schüth, F.; Unger, K.K. Pore Size Analysis of MCM-41 Type Adsorbents by Means of Nitrogen and Argon Adsorption. J. Colloid Interface Sci. 1998, 207, 159–169. [Google Scholar] [CrossRef]
  69. Monson, P.A. Understanding Adsorption/Desorption Hysteresis for Fluids in Mesoporous Materials Using Simple Molecular Models and Classical Density Functional Theory. Microporous Mesoporous Mater. 2012, 160, 47–66. [Google Scholar] [CrossRef]
  70. Li, K.; Liu, Q.; Cheng, H.; Hu, M.; Zhang, S. Classification and Carbon Structural Transformation from Anthracite to Natural Coaly Graphite by XRD, Raman Spectroscopy, and HRTEM. Spectrochim. Acta. A. Mol. Biomol. Spectrosc. 2021, 249, 119286. [Google Scholar] [CrossRef] [PubMed]
  71. Luo, H.; Liang, W.; Wei, C.; Wu, D.; Gao, X.; Hu, G. Mineral Composition and Graphitization Structure Characteristics of Contact Thermally Altered Coal. Molecules 2022, 27, 3810. [Google Scholar] [CrossRef] [PubMed]
  72. Xu, C.; Li, H.; Lu, J.; Lu, Y.; Shi, S.; Ye, Q.; Li, M.; Wang, Z. An Investigation into the Modification of Microwave-Assisted Oxidation in the Macromolecular Structure of Coal via XRD and Raman Spectroscopy. Fuel 2023, 338, 127192. [Google Scholar] [CrossRef]
  73. Liu, Y.; Zhu, Y.; Li, W.; Xiang, J.; Wang, Y.; Li, J.; Zeng, F. Molecular Simulation of Methane Adsorption in Shale Based on Grand Canonical Monte Carlo Method and Pore Size Distribution. J. Nat. Gas Sci. Eng. 2016, 30, 119–126. [Google Scholar] [CrossRef]
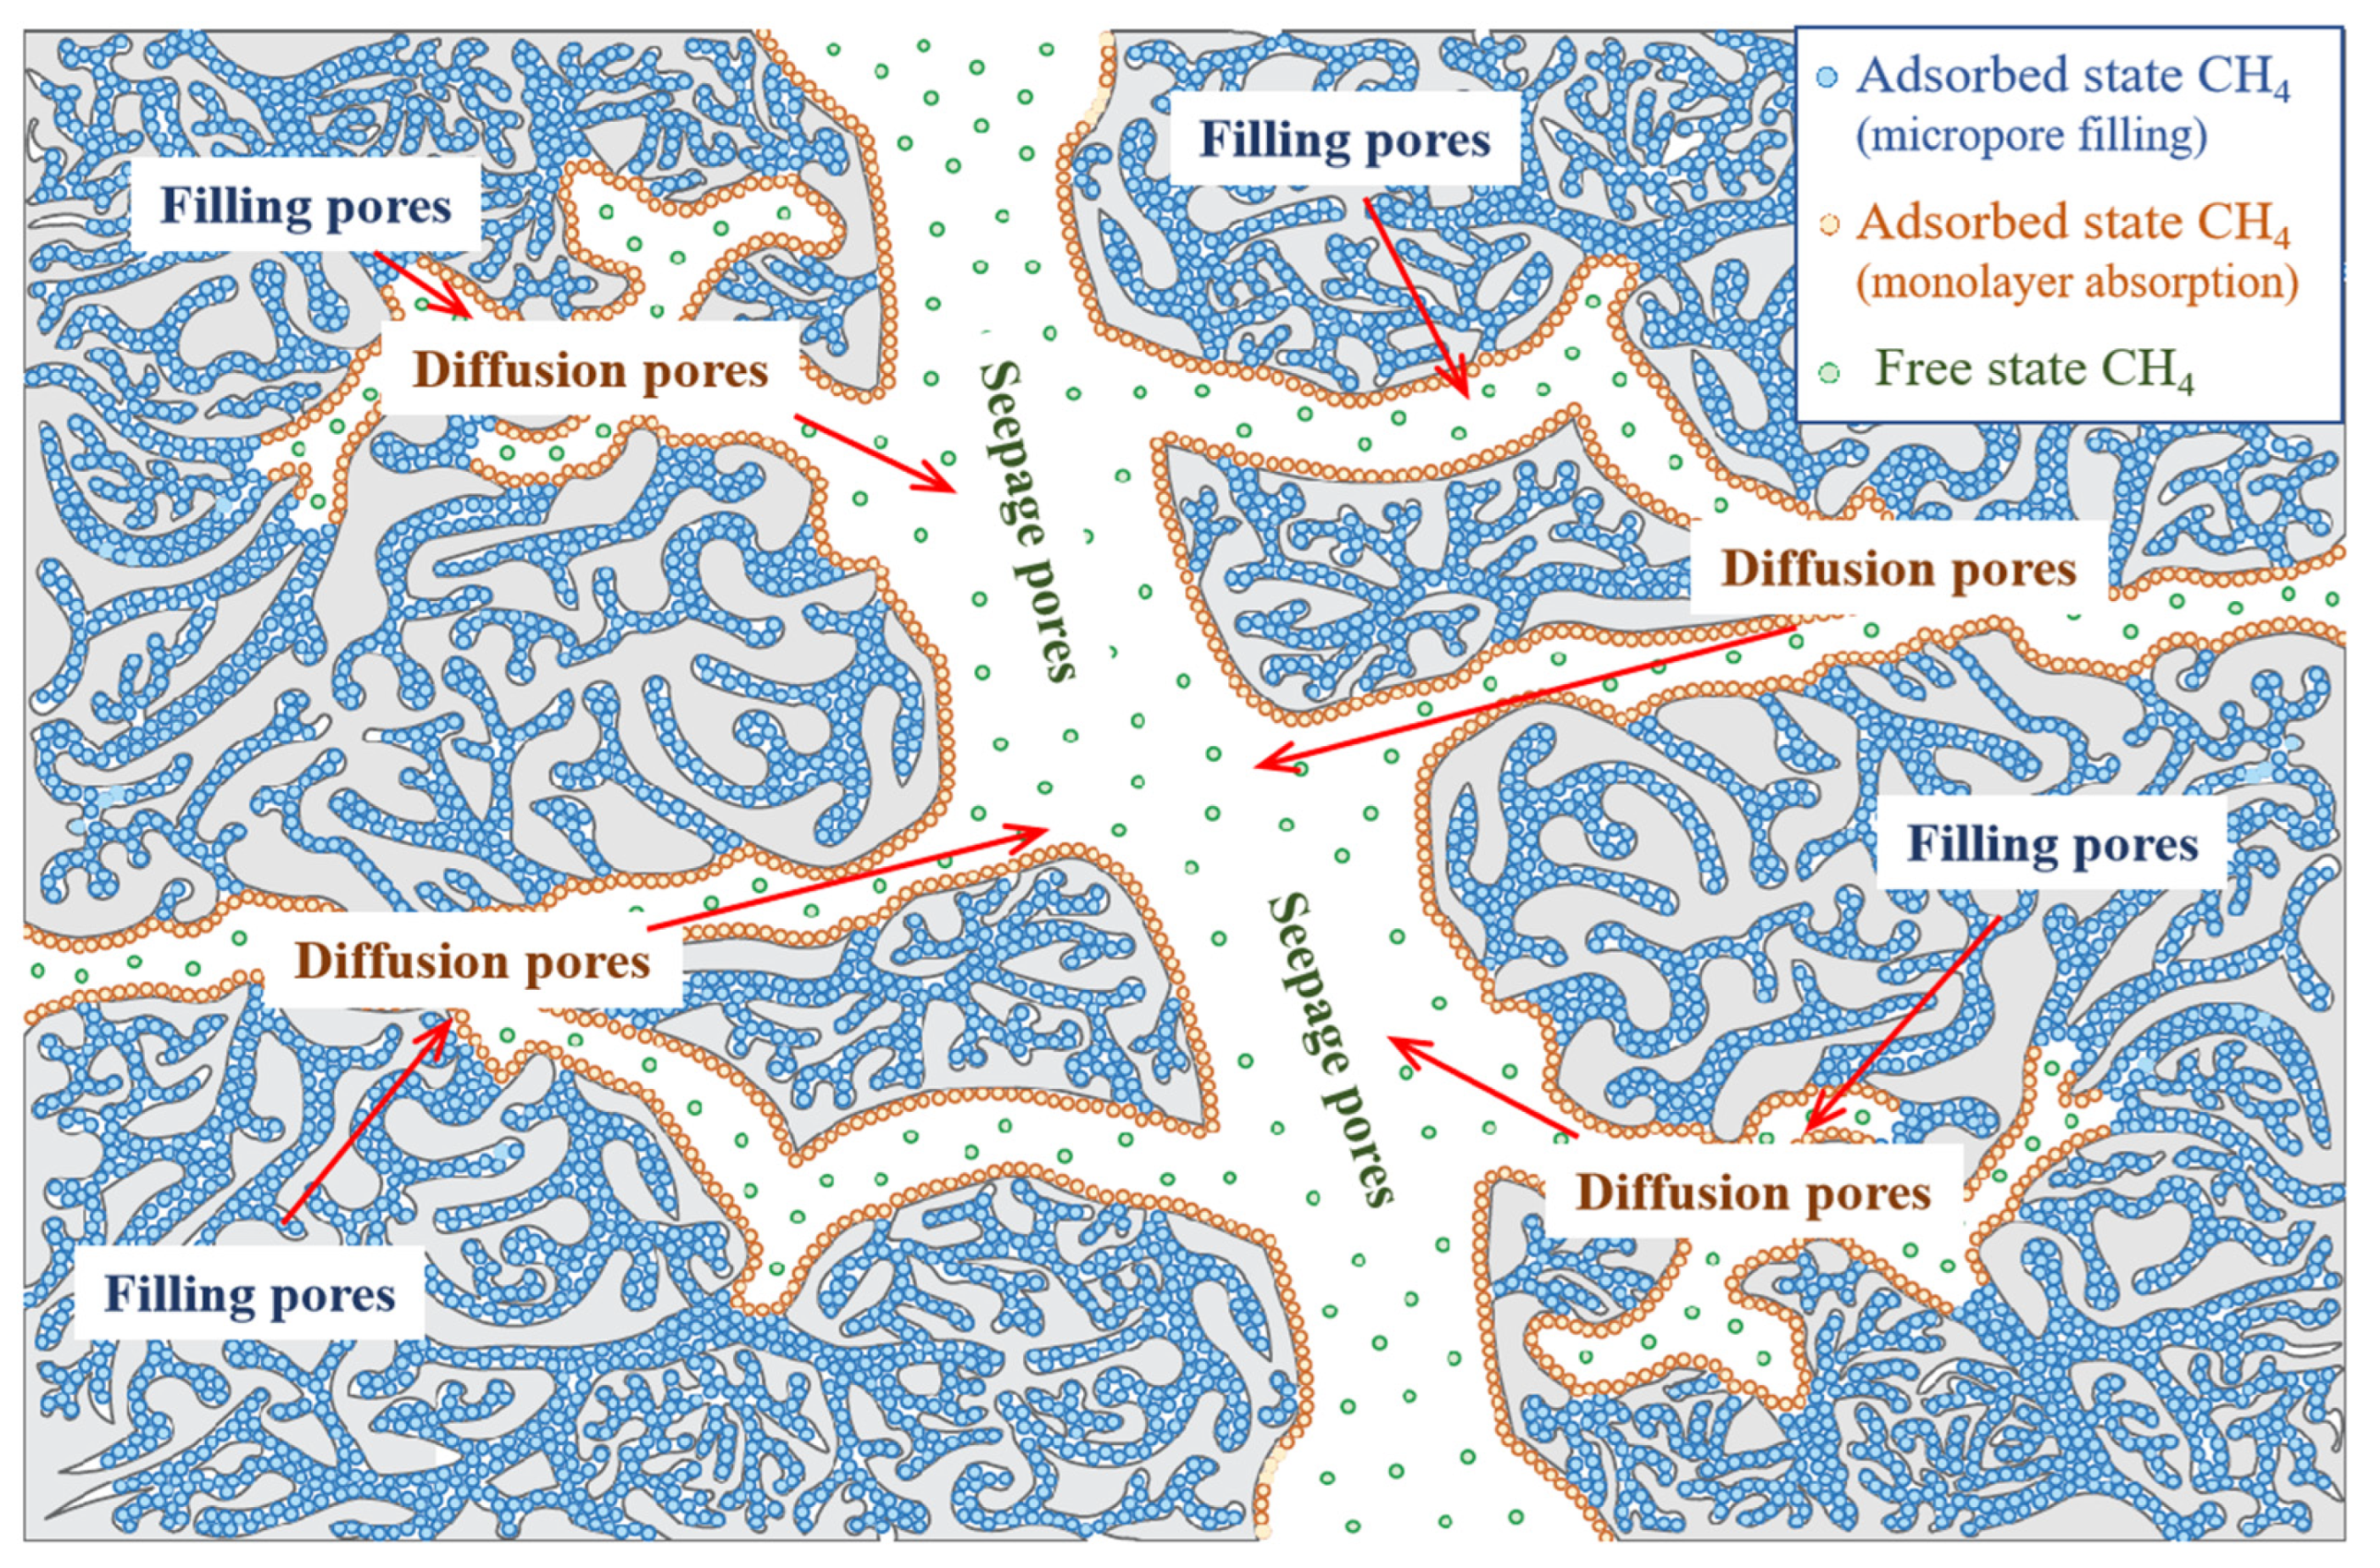
Figure 1. Schematic diagram of CH4 distribution in different pores under equilibrium [33].
Mathematics 13 02931 g001
Figure 2. Influence of different adsorption behaviors on CH4 adsorption capacity; (a) micropore filling; (b) monolayer adsorption [2].
Mathematics 13 02931 g002
Figure 3. Schematic diagram of slit pore structure with different sizes.
Mathematics 13 02931 g003
Figure 4. Lowest energy configurations of CH4 molecules in the slit pore structure under different pressure conditions.
Mathematics 13 02931 g004
Figure 5. Isothermal adsorption data of CH4 with slit pore structures of different sizes: (a) 0.419–0.825 nm; (b) 0.905–1.466 nm; (c) 1.619–2.418 nm; (d) 2.618–4.040 nm.
Mathematics 13 02931 g005
Figure 6. Experiment apparatus: (a) Schematic diagram of KDXJ-II system [56]; (b) Schematic of pressure-time variation during CH4 adsorption isotherm determination [59].
Mathematics 13 02931 g006
Figure 7. LPGA-N2 (77 K) adsorption/desorption isotherms of different coal samples: (a) XTR sample; (b) 11110Y sample; (c) QNY sample; (d) XQY sample.
Mathematics 13 02931 g007
Figure 8. LPGA-CO2 (273 K) adsorption isotherms of different coal samples: (a) XTR sample; (b) 11110Y sample; (c) QNY sample; (d) XQY sample.
Mathematics 13 02931 g008
Figure 9. Relationship between measured adsorption isothermal data and theoretical adsorption isotherm; (a) XTR sample; (b) 11110Y sample; (c) QNY sample; (d) XQY sample.
Mathematics 13 02931 g009
Figure 10. CH4 adsorption capacity and proportion in pores of different sizes for XTR coal samples; (a) 0.38–0.45 nm; (b) 0.45–0.52 nm; (c) 0.52–0.59 nm; (d) 0.59–0.66 nm; (e) 0.76–0.82 nm; (f) >1.5 nm.
Mathematics 13 02931 g010
Table 1. CH4 adsorption characteristic parameters of slit pore structures with different sizes.
r (nm)νmi,r
(cm3/cm3)
KrnrR2r (nm)νmo,r
(cm3/m2)
PL,r (MPa)R2
0.419500.70.0192.0440.99711.6190.2112.1070.9997
0.4694470.0182.1240.99771.8190.2092.2750.9999
0.519400.20.0182.2810.9982.040.2072.2520.9997
0.574368.40.0262.3660.99822.2190.2052.2160.9998
0.719393.60.0612.2380.99942.4180.2021.9770.9998
0.825396.60.0662.3090.99972.6180.2011.9890.9999
0.905373.30.0882.1820.99962.8190.2022.1760.9997
0.994348.80.1281.9840.99963.040.22.1390.9997
1.101339.90.1841.7850.99973.5180.1981.9330.9998
1.24321.10.231.6650.99984.040.1982.1370.9984
1.353297.60.2421.6370.9998
1.466278.50.2551.6070.9998
Table 2. Basic physical parameters of coal samples with different metamorphic degrees.
Sample NumberSampling LocationIndustrial Analysis
Mad (%)Ad (%)Vdaf (%)FCad (%)
XTRXintian coal mine 4 coal seam0.848.334.9686.39
11110YPingmei 13th mine 15–17 coal seams0.5110.7716.3174.29
QNYQinan coal mine 10 coal seam0.557.6433.6160.98
XQYQingqing coal mine 7 coal seam1.496.2937.2657.92
Table 3. Pore volume parameters in different size ranges of different coal samples.
Coal Sample
Serial Number
Segmental Pore Volume (×10−3 cm3/g)
XTR11110YQNYXQY
0.38–0.4512.4331.3190.9937.650
0.45–0.524.1644.6502.3772.794
0.52–0.5918.83710.8749.27411.860
0.59–0.6615.94810.3618.97310.910
0.66–0.766.6894.8174.2225.292
0.76–0.823.2792.9581.7492.956
0.82~0.923.5282.7452.1933.715
0.92–1.034.3393.8152.6553.913
1.03–1.143.8802.9782.1653.026
1.14–1.263.6682.7241.9982.853
1.26–1.373.5662.5671.9202.899
1.37–1.503.5042.4871.8802.679
>1.503.7172.6921.9943.102
Table 4. CH4 adsorption characteristic parameters of slit pores with different sizes at 30 °C.
Pore Size (nm)DA Adsorption ModelPore Size (nm)Langmuir Adsorption Model
V0 (cm3/cm3)KnVL (cm3/m2)PL (MPa)
0.415505.1100.0192.0381.6190.2112.107
0.485432.0810.0182.1741.8190.2092.275
0.555379.5440.0232.3362.0400.2072.252
0.625377.2340.0382.3212.2190.2052.216
0.710392.0300.0582.2462.4180.2021.977
0.789395.5640.0642.2852.6180.2011.989
0.868383.9980.0782.2402.8190.2022.176
0.972354.8310.1182.0323.0400.2002.139
1.084341.3510.1751.8173.5180.1981.933
1.198326.7510.2161.7014.0400.1982.137
1.315305.5120.2381.646
1.437283.4040.2511.615
1.500216.6150.2421.634
Disclaimer/Publisher’s Note: The statements, opinions and data contained in all publications are solely those of the individual author(s) and contributor(s) and not of MDPI and/or the editor(s). MDPI and/or the editor(s) disclaim responsibility for any injury to people or property resulting from any ideas, methods, instructions or products referred to in the content.