Abstract
Pansharpening is a method of image fusion that combines a panchromatic (PAN) image with high spatial resolution and multispectral (MS) images which possess different spectral characteristics and are frequently obtained from satellite sensors. Despite the development of numerous pansharpening methods in recent years, a key challenge continues to be the maintenance of both spatial details and spectral accuracy in the combined image. To tackle this challenge, we introduce a new approach that enhances the component substitution-based Adaptive IHS method by integrating the YUV color model along with weighting coefficients influenced by the multispectral data. In our proposed approach, the conventional IHS color model is substituted with the YUV model to enhance spectral consistency. Additionally, Lanczos interpolation is used to upscale the MS image to match the spatial resolution of the PAN image. Each channel of the MS image is fused using adaptive weights derived from the influence of multispectral data, leading to the final pansharpened image. Based on the findings from experiments conducted on the PairMax and PanCollection datasets, our proposed method exhibited superior spectral and spatial performance when compared to several existing pansharpening techniques.
Keywords:
remote sensing; pansharpening; Lanczos interpolation; component substitution; YUV model; IHS; image upscaling MSC:
68U10; 65D18
1. Introduction
High-resolution multispectral satellite imagery is increasingly utilized across various image processing applications due to its exceptional spatial and spectral diversity. These applications encompass change detection, target recognition, classification, the creation of a background for mapping, visual image analysis, land cover segmentation, and numerous other tasks, wherein high-resolution multispectral satellite imagery is essential [1]. Nevertheless, generating such images with a single sensor device is not feasible. The primary reason for this limitation is attributed to the constraints of the signal-to-noise ratio (SNR).
Panchromatic (PAN) images exhibit excellent spatial resolution but limited spectral detail, whereas multispectral (MS) images emphasize complementary features. Both PAN and MS images are generated by remote sensing technologies. Modern satellite sensors typically fall into two distinct categories. The initial category consists of spectral sensors that create MS images, which are noted for their low spatial resolution and high spectral detail. The subsequent category includes sensors that produce PAN images featuring high spatial resolution but reduced spectral detail. Notable examples of such remote sensing systems include QuickBird, SPOT, IKONOS, TRW Lewis, and EO-1 [2,3,4].
Due to limitations in physical capabilities, acquiring high spatial resolution MS images with MS sensors is quite challenging. To tackle the issue of producing high-resolution MS images, a technique known as pansharpening is utilized, which focuses on merging MS and PAN images. Pansharpening is a method designed to create high-resolution multispectral images by combining data from both panchromatic and multispectral sensors. The core concept of pansharpening involves integrating the spatial data from the PAN image, which is lacking in the MS image, with the spectral information from the MS image. As a result, pansharpening methods can be classified within the broader category of data fusion frameworks.
Images obtained using pansharpening techniques have been increasingly used in various fields in recent years. In the past twenty years, there has been significant research into pansharpening techniques, which can be divided into four primary categories. Historically, pansharpening techniques were initially divided into two main classes: multiresolution analysis (MRA) and component substitution (CS). The third class emerged from advancements in methods using compressed sensing and machine learning techniques, such as deep learning. The fourth class includes hybrid approaches that combine methods from the previous three classes.
In CS-based methods, the first step typically involves replacing the upsampled MS image with various components, using the PAN image to substitute the spatial component [5]. Approaches that fall under this category include the Brovey [6], PCA [7], Gram–Schmidt [8], and IHS [9] transformations.
The key idea of MRA-based approaches lies in extracting details by decomposing the PAN image into its structural components. However, recent studies have revealed certain limitations of MRA-based approaches. These methods tend to be computationally complex, and in practice, full decomposition of the PAN image is not always necessary. As a result, the design of low-pass filters is used to extract spatial details from the PAN image more efficiently [10]. Therefore, MRA-based approaches can also be classified under spatial filtering techniques.
In research focused on MRA, various filters have been proposed, including Gaussian filters [11], box filters [12], wavelet decomposition methods [13,14], nonlinear filters [15], and evaluation procedures based on deconvolution frameworks [16].
In recent years, there has been a growing body of research on pansharpening approaches that utilize machine learning techniques. For instance, ref. [17] proposed a supervised and unsupervised combined fusion network (SUFNet) for high-resolution pansharpening. The proposed approach addresses the issue of insufficient accuracy in fully exploiting the spatial and spectral information of PAN and MS images, based on the scale-invariant hypothesis.
In [18], a novel zero-shot semi-supervised pansharpening strategy was presented, which leverages the advantages of both supervised and unsupervised learning. This method necessitates only one pair of PAN and low-resolution MS images for both training and evaluation. It addresses some of the drawbacks associated with traditional supervised and unsupervised learning techniques. While conventional convolutional neural networks (CNNs) can capture nonlinear relationships, they might yield less than optimal outcomes when there is a mismatch between the training and testing datasets. Furthermore, a limited number of training images or a scarcity of reference images is identified as a significant limitation.
Additionally, the DUCD (Deep Unfolding Convolutional Dictionary) network, which was developed in [19], is part of this class of methods. Its goal is to enhance the network’s interpretability and to make better use of the complementary information between MS and PAN images. Another illustration is the “Zero-Sharpen” technique, which was first presented in [20] and reduces scale differences and allows for applicability across different satellite platforms by combining the benefits of deep learning and variational optimization.
CS and MRA techniques are used in hybrid approaches, which are regarded as the fourth class of pansharpening methods [21,22,23]. Along with the method suggested in [24,25], which combines MRA and CNN, this class also contains approaches that merge MRA, CNN, and sparse modeling [26].
This paper makes the following contributions:
- Adaptive pansharpening based on the YUV color model: This study introduces a novel pansharpening method in which the conventional IHS model is replaced with the YUV color model. By integrating the intensity component of the PAN image into the Y channel, the proposed approach reduces color distortions and enhances spectral fidelity.
- Improved spatial detail preservation through Lanczos interpolation: To match the spatial resolution of MS and PAN images, Lanczos interpolation is employed. Compared to bilinear and bicubic interpolation, Lanczos better preserves edges and fine structures while minimizing blurring and block artifacts, thereby enabling more effective utilization of PAN spatial details in the fusion process.
- Adaptive spectral weights for balanced fusion: For each MS band, adaptive weighting coefficients are calculated to ensure an optimal balance between spatial and spectral information during the fusion process. Unlike traditional IHS methods that often introduce distortions due to equal or fixed weights, the adaptive weighting strategy improves both spectral fidelity and spatial consistency.
- Superior performance on benchmark datasets: The proposed approach is extensively evaluated on the PairMax and PanCollection datasets. The experimental results show that it consistently outperforms state-of-the-art pansharpening methods, achieving higher values in the PSNR, SSIM, SAM, ERGAS, and QNR metrics. These results confirm the robustness, generalization ability, and computational efficiency of the proposed method across diverse urban and natural scenes.
2. Materials and Methods
CS-based methods are thought to be the most computationally efficient of the pansharpening methods mentioned above. The primary reason is that the CS-based approaches’ capacity to retain high spatial information is one of its fundamental advantages. A technique to lessen spectral distortion while maintaining spatial features was put forth in [27]. The method creates a new spatial component for better pansharpening by introducing an optimization-based framework known as GIHS-TV.
The IHS approach is a traditional pansharpening technique that employs PAN and MS channels in place of RGB channels. It fuses PAN and MS images by transitioning from the RGB color model to the HSI model and then reverting from HSI back to RGB. In this transformation of color models, the intensity component of the pansharpened image retains enhanced spatial details. Nonetheless, a significant drawback of this method is the potential emergence of spectral distortions in the resulting fused image. To address this issue, several enhancements to the standard IHS method have been suggested.
For instance, ref. [28] introduced a technique that enhances spectral resolution when compared to the traditional IHS method. The fundamental concept of this method is to attain greater spectral accuracy by employing adaptive coefficients. In [29], a refined version of the technique put forth in [27] was detailed. This upgraded method determines the quantity of spatial detail incorporated into each MS channel based on the object edges in the PAN and MS images, as well as the relative ratios among the MS channels, utilizing a weight matrix.
Furthermore, the significant aspect of a nonlinear component was incorporated into a pansharpening approach in [30]. The primary distinction between this approach and the conventional IHS method is the assumption that the intensity component is situated on a hyper-ellipsoidal surface instead of a hyperspherical one.
Inaccurate detail infusion for each MS channel and a weak relationship between PAN and MS images can lead to spectral and spatial distortions when pansharpening is applied to generate high-resolution MS images. Ref. [5] proposed a method that combines adaptive-channel details and mixed intensity to tackle these issues. The objective of this approach is to maintain the gradient information from the PAN image while generating a mixed intensity image that closely correlates with the MS image. By setting the intensity and the gradient limitations between the source images and the blended intensity image, a mixed intensity model is created to accomplish this.
Hybrid pansharpening methods that integrate IHS-based techniques with other appTabroaches have also been suggested. For example, a method combining the IHS and Smoothing-Filter-Based Intensity Modulation (SFIM) algorithms was introduced in [31]. This method allows for the production of image segments with high spatial resolution by combining the superior spatial details from IHS with the more accurate spectral data from SFIM.
The techniques discussed earlier rely on IHS (Intensity-Hue-Saturation) approaches. The main concept of this method is that multispectral (MS) images are presumed to be in the RGB color model and are initially transformed into the IHS color model. In the following step, the intensity component is treated as the PAN image and is substituted with the actual PAN image. The third phase involves converting the IHS image back to the RGB color model. In this paper, we introduce a novel pansharpening method derived from the fundamental principles of IHS-based approaches.
3. Generalized IHS Transformation
In image processing, there are two main reasons for using color models. The first important reason is related to human visual perception: the human eye can distinguish thousands of different color shades but only about twenty shades of gray. The second reason is that color is a key feature in object recognition and segmentation.
In IHS methods, the RGB color model of three-channel images is transformed into the IHS color model, where the intensity, hue, and saturation components are separated. In the IHS color model, intensity serves as the primary characteristic of monochrome images and is easier to interpret. This model separates intensity information from color information.
The conversion from the RGB color model to the IHS color model follows a linear process. The general form of this transformation is expressed as follows:
If intensity is considered as the -axis in the Cartesian coordinate system, then the variables and represent the and -axes, respectively. Here, , , and are the corresponding values obtained from the channels of the given MS image. According to the IHS color model, the hue () and saturation () components are defined as follows:
In the next step, the inverse transformation is performed. Here, the intensity is replaced with , and the process is carried out as follows:
where , , and are the corresponding values of the fused image in the RGB color model. In the Generalized IHS method, directly computing Equations (1) and (2) is computationally complex. To simplify the calculation of Equation (2), it can be rewritten using Equation (1) as follows:
where represents the detail residuals. In the next step, is replaced with the high-resolution PAN image . The intensity component is replaced with the PAN image , which is generated based on histogram-based adaptation, and is expressed as follows:
where and are the standard deviations of the intensity component and the original PAN image , and and are the mean values of the intensity component and the original PAN image , respectively. As a result, Equation (3) can be rewritten as follows:
As a result of replacing with the high-resolution PAN image, we obtain . Using this, Equation (5) can be expressed as follows:
The canonical form of Equation (6) is written as follows:
where represents the resized hyperspectral or MS image of the th channel.
Similar to many other image fusion methods, a key issue with the Generalized IHS method is that it may lead to changes in image color during the fusion process. This results in the problem of color distortion.
4. Proposed Method
During the first phase, it is essential to think about resizing the MS image. Interpolation techniques are employed to adjust the size of the MS image. By selecting appropriate interpolation techniques, it is possible to minimize the problem of data redundancy as much as possible. Interpolation is one of the methods used to solve problems such as image upscaling, downscaling, rotation, and geometric distortion correction. The essence of this method lies in repetitive discretization. Commonly used interpolation methods include, bilinear, nearest neighbor, and bicubic interpolation techniques [32]. In the proposed method, Lanczos interpolation is suggested for enlarging the image size.
4.1. Lanczos Interpolation for Image Upscaling
There are several types of image interpolation techniques, and the efficiency of a method is determined by its ability to preserve visual differences for each pixel during the scaling process. Bicubic interpolation may introduce certain artifacts. These artifacts may include image blurring and ringing effects [31]. Lanczos interpolation can be used to mitigate such issues.
The Lanczos kernel filter incorporates the function. The oscillatory nature of this function is a key feature during image resizing, as it allows for the preservation of the sharp edges and fine details of objects in the image during the scaling process.
Lanczos interpolation demonstrates higher effectiveness compared to other interpolation methods. Since it is based on the sinc kernel, it provides near-optimal results for image reconstruction from discrete samples. By contrast, bicubic and bilinear interpolation methods do not possess such ideal reconstruction properties. Moreover, Lanczos interpolation better preserves edges and fine structures, which in turn allows for a more effective utilization of the spatial details contained in the PAN image during the fusion process. By comparison, bilinear interpolation often results in noticeable blurring, while nearest-neighbor methods tend to introduce block artifacts.
The one-dimensional function of the Lanczos interpolation kernel is defined as follows:
The general form of the one-dimensional special window function in the Lanczos interpolation kernel is expressed as follows:
where i.e., belongs to the set of natural numbers.
In images, Lanczos interpolation is performed based on the convolution operation. The Lanczos kernel convolution operation has the following property [33]:
From this property, it follows that the two-dimensional function of the Lanczos kernel can be computed using the one-dimensional kernel function. In practical image-related tasks, Lanczos filters with , and is commonly used.
The application of the two-dimensional Lanczos kernel with to a given image is expressed as follows:
where and .
For , the two-dimensional Lanczos kernel is calculated as follows:
where and .
By reducing the kernel radius in Lanczos interpolation, that is, by applying it in the form of n = 3 or n = 2, artifacts such as “ringing” can be significantly mitigated. The results of applying Lanczos interpolation and other interpolation methods for enlarging multispectral (MS) images are presented in Table 1. Furthermore, local oscillations can be smoothed by applying guided or bilateral filtering before and after the interpolation stage.

Table 1.
Results of applying interpolation methods for enlarging multispectral image dimensions. The best results are written in bold.
4.2. Conversion from RGB to YUV Color Model
As noted above, instead of converting to the HSI color model, as in the IHS-based approach, the proposed method transitions to the YUV color model. The digital representation of the YUV color model is known as the YCbCr format. In this color space, the Y component contains only the luminance (brightness) information of each pixel, while the chrominance (color and saturation) information is represented by the Cb and Cr components, respectively. This color model allows for the luminance component to be preserved with higher precision compared to the chromatic components [34].
Unlike the IHS color model, the YUV color model provides greater accuracy in separating the color components. In the IHS model, the intensity (I) component is strongly coupled with the hue and saturation components, which increases the likelihood of color distortions. By contrast, the YUV model represents luminance (Y) and chrominance components (U and V) in mutually independent orthogonal domains. As a result, the contribution of U and V components to color distortion is minimal, thereby preserving spectral fidelity more effectively. Another fundamental distinction is that the YUV model is more consistent with the human visual system, whereas the IHS substitution is largely empirical in nature.
By integrating the high-frequency spatial details of the PAN image into the Y component, the overall luminance is enhanced, while the U and V components remain unchanged. In the IHS model, however, color distortions are further introduced because the PAN information modifies the intensity component, creating linear interactions with the hue and saturation channels.
When transforming into the YUV color model, there is a potential risk of information loss due to the linear substitution of spectral components. In the proposed method, this issue is mitigated by integrating the PAN information exclusively into the Y component, thereby ensuring spectral fidelity. Since the U and V components are directly derived from the original MS image, the spectral characteristics are preserved. Furthermore, in the subsequent stages of the algorithm, the use of adaptive contributions from each MS band compensates for any potential loss, thus maintaining both spatial and spectral consistency.
The PAN information is integrated only into the Y channel, while the U and V channels are directly taken from the MS image. This helps to reduce the computational cost. Moreover, the transformation into the YUV color model is essentially a linear process, with a computational complexity of . Since the coefficients used in this transformation are constant values, the computational burden does not significantly increase.
The YUV color model consists of one luminance component (Y) and two chrominance difference components (U and V). These components are defined to the RGB components as follows:
The RGB color model is converted to the YUV color model as follows:
Here, the values and are derived from the and components in the YUV color model. These values may vary depending on the specific YUV variant or the standard being used. Common standards include ITU-R BT.2020, ITU-R BT.709, and ITU-R BT.601. According to the ITU-R BT.601 standard, the values of and are as follows:
According to the ITU-R BT.709 standard the following values are used:
According to the ITU-R BT.2020 standard, the following values are used:
In this research, we utilize the ITU-R BT.601 standard. According to Equation (8), the conversion from the RGB color model to the YUV color model can be represented in the following manner:
By using Equation (9), replacing with , and applying the notation , the inverse transformation can be written as follows:
By substituting the high-resolution PAN image obtained from Equation (4) in place of , Equation (11) can be rewritten as follows:
Based on the equality in Equation (8) and using the notations , , , and , Equation (12) can be written in the following form:
The images corresponding to the expected MS channels are represented by the channels , , and .
4.3. Using the Improved Adaptive IHS Method, the Object Boundaries from the PAN Image Are Transferred to the Resulting Image
Based on Equation (9), after determining the intensity component, the resulting image is generated. To obtain the final image, we use Equation (13). However, during the process of merging object boundaries, some information loss may occur. To express the influence in Equation (13), we introduce the weight coefficients , and rewrite the equation as follows:
In [35], instead of using constant values, a function is applied, which is defined as follows:
where denotes the gradient of the PAN image, and and are tuning parameters; represents the emphasis on strong gradient values at object boundaries and enables smoothing within the image, while is used to ensure that the denominator remains non-zero. The method proposed by Perona and Malik [35] for detecting object boundaries was used to compute the image gradient. The tuning parameters were set as and .
By applying the function instead of constant values, Equation (14) can be rewritten as follows:
In [27], it is noted that the main drawback of the Adaptive IHS method, which is considered robust to aliasing and registration errors, is its sensitivity to spectral distortions. Spectral distortions occur as a result of excessive spatial detail being injected into the MS channels. As a result, the spatial clarity of the image produced through the pansharpening technique might not be ideal. Since the object edges in the PAN image are only faintly captured in the MS channel images, adding an equal level of detail to all channels may not yield desirable outcomes.
Based on this analysis, instead of the weight matrix proposed in the Adaptive his method, ref. [29] suggests using individual weights that represent the influence of each channel. The computation of these weights is carried out as follows:
where is the stability coefficient (chosen as ), and and represent the multispectral-induced weights, which are defined as follows:
where and represent the gradients of the MS images. In this study, we use the method proposed by Perona and Malik [35] to compute the gradients of the MS images. The resulting image is produced through the application of the following equation:
The steps of the proposed pansharpening approach are presented in Algorithm 1.
| Algorithm 1 The steps of the proposed pansharpening approach |
| Input data: PAN image, , , MS images; Output data: , , high-resolution MS images; Step 1. Upsample all given , , MS images times using Lanczos interpolation: Step 2. Compute the value of : Step 3. Calculate the intensity : Step 4. Calculate the high-resolution PAN image : Step 5. For each channel, compute the multispectral-induced weights using Equation (15). Step 6. Generate the high-resolution MS images , , with the same dimensions as the PAN image. Step 7. The algorithm is completed. |
As a result, based on the previously outlined steps, a new approach is proposed that relies on the following: utilizing Lanczos interpolation to improve image resolution, transitioning from the IHS color model to the YUV color model, and creating adaptive weight values, as cited in [29].
5. Evaluation Metrics for Assessing the Quality of the Resulting Image
To assess the quality of images produced by the pansharpening techniques, two primary evaluation methods are typically employed. These methods are referred to as reduced resolution (RR) and full resolution (FR), and they vary in terms of the analysis approach.
5.1. Reduced Resolution (RR)
A key feature of the reduced resolution approach is the requirement for reference images. These reference images make it possible to define unified and objective quality metrics. In this approach, the high spatial resolution PAN image and the low-resolution MS images are first resampled to the same size, and the pansharpening method is then applied. Objective and quantitative analyses are carried out by comparing the resulting image with the original MS images.
Within this resolution framework, commonly used quality metrics include ERGAS, SAM, SCC, and the Universal Image Quality Index (UIQI) [36,37].
(1) ERGAS. ERGAS is a quality assessment metric used to evaluate both spatial and spectral fidelity relative to the given MS image. The ERGAS metric is defined as follows:
where is the size of the high spatial resolution image, is the size of the low spatial resolution MS image, is the number of channels, is the root mean square error for each channel of the MS image, and is the mean value for each channel of the given MS image. The optimal value of this quality metric tends toward 0.
(2) SAM. The Spectral Angle Mapper (SAM) serves as a quality assessment tool that measures the similarity of spectral signatures by considering the spectral invariance and synthesis characteristics. Spectral vectors are regarded as multi-dimensional vectors, and the angle between them is computed.
SAM is measured in degrees, with an optimal value approaching 0°, and is computed as follows:
Here, and are the intensity value vectors of two spectral channels, where represents the spectral channel of the reference image, and is composed of the corresponding components from the pansharpened image.
(3) Universal Image Quality Index (UIQI). The term “universal” in the UIQI approach to quality assessment indicates that the metric is independent of the image acquisition device, image type, or imaging conditions. This quality metric is defined as follows:
where and are the standard deviations of images and , respectively, and they evaluate the contrast differences, while and are the mean intensities of images and , representing the changes in brightness. The optimal value of this quality metric approaches 1.
In some cases, image quality is assessed based on spatial variability using a single overall quality value for the entire image. The UIQI metric can be applied to local regions using a sliding window approach. If the method is performed over steps, then the local quality index within the sliding window at step is denoted as . As a result, the overall quality index is calculated as follows:
(4) Spatial Correlation Coefficient (SCC). The SCC quality metric assesses the spatial relationship between a pair of images. The relationship between these images is expressed in the following manner:
where is the value of the th pixel in the th channel of the reference MS image, is the mean value of the th channel of the reference image, is the value of the th pixel in the th channel of the resulting image, and is the mean value of the th channel of the resulting image.
(5) Peak Signal-to-Noise Ratio (PSNR). The peak signal-to-noise ratio is one of the most widely used metrics, which depends on the image dimensions, the maximum gray level of the image, and the mean squared error (MSE). The value of this metric is calculated as follows:
where denotes the maximum gray level of the image and is defined as follows:
where is the bit depth of the pixels and represents the mean squared error. A higher value of PSNR indicates a better image quality.
5.2. Full Resolution (FR)
Full resolution approaches are used to assess image quality in the absence of a reference image. Therefore, visual comparisons or statistical methods are applied in this approach. The original dimensions of the image are preserved, maintaining both its spatial and spectral resolutions. As a result, the evaluation reflects real-world conditions more accurately. Within this resolution framework, commonly used quality metrics include spectral distortion, spatial distortion, and the QNR index.
(1) Spectral Distortion Index (). Spectral distortion () is calculated as the difference between the low-resolution MS images and the fused MS images. To detect spectral distortions, the UIQI values are computed for each channel in both the low- and high-resolution image sets. The difference between the corresponding UIQI values in the two resolutions represents the spectral distortion introduced during the fusion process:
Here, is the low-resolution th MS channel, is the fused MS channel, is the UIQI value between the two images, is the number of channels, and is an integer selected to emphasize large differences. In standard settings, is typically used. The optimal value of this quality metric is 0.
(2) Spatial Distortion Index (. The average absolute difference of UIQI values across all channels is computed in order to determine the spatial distortion . The average spatial distortion between the fused MS and PAN images is represented by , which is derived using the UIQI values determined between each MS band and the PAN image as follows:
where is the downsampled version of the PAN image to match the resolution of the MS data, is the high-resolution PAN image, and is the exponent parameter, typically set to under standard conditions. The optimal value of this quality metric is 0.
(3) Quality No Reference (QNR) Index. The QNR is used as a no-reference quality assessment metric and is calculated as follows:
where represents spectral distortion, and represents spatial distortion. The value of is typically set to 1. Since the optimal values for both and are 0, the optimal value of the quality metric is 1.
6. Data Set
6.1. PairMax Dataset
To study the performance of the proposed approach in the article for reference images, the openly available PairMax dataset proposed in [38] was selected. The PairMax dataset contains images acquired from satellites such as GeoEye-1, WorldView-2, WorldView-3, and WorldView-4, providing both MS and PAN images.
The dataset includes remote sensing images of cities from countries such as the United Kingdom, the United States, Germany, Mexico, Italy, and Sweden. Specifically, it contains images of London, Trenton, Houston, Miami, Sacramento, Munich, Mexico City, Naples, and Stockholm. The images have a radiometric resolution of 11 bits, and the multispectral images consist of either 4 or 8 channels.
The ground sample distance (GSD) for WorldView-3 and WorldView-4 satellites is 0.31 m for PAN images and 1.24 m for MS images. For the GeoEye-1 and WorldView-2 satellites, the GSD is 0.46 m for panchromatic images and 1.84 m for multispectral images.
The spatial resolution of the PAN images is four times higher than that of the MS images. The dataset comprises scenes featuring densely populated urban areas, shaded urban locales, agricultural lands, forested regions, vegetation, and bodies of water. This variety facilitates conducting experiments across different scene types.
6.2. Comparison Methods
To evaluate the effectiveness of the proposed method, it was compared with several established approaches. These include the following methods: CS-based methods, such as BT-H, BDSD-PC, and C-GSA; methods based on MRA, including MTF-GLP-FS, MTF-GLP-HPM-R; variational optimization-based methods, such as SR-D and TV; as well as EXP, an interpolation method using a 23-coefficient polynomial kernel for MS image enhancement.
The images for the reference-available case are presented in Figure 1 and Figure 2, while the images for the reference-unavailable case are shown in Figure 3. The values based on the limited resolution indices of the generated images are provided in Table 2. The results based on the full-resolution analysis are presented in Table 3.
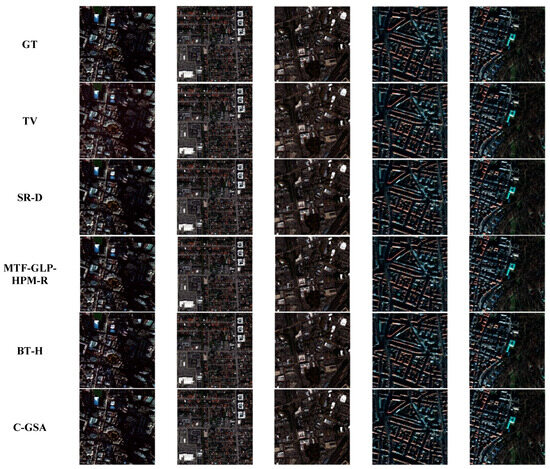
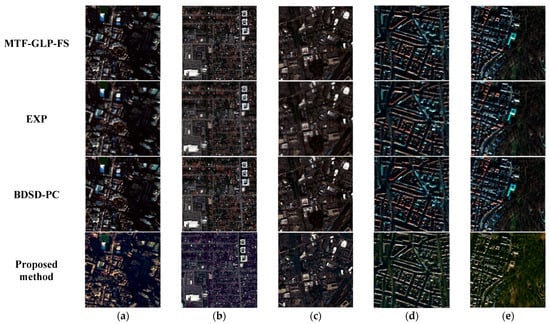
Figure 1.
A visual analysis using natural colors of the assessed methods on the PairMax dataset for reference-available images: (a) GE_Lond_Urb; (b) W2_Miam_Urb; (c) GE_Tren_Urb; (d) W3_Muni_Urb; (e) W3_Muni_Mix.
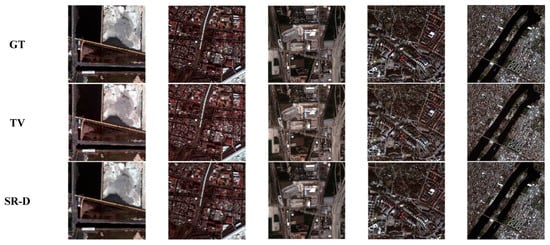
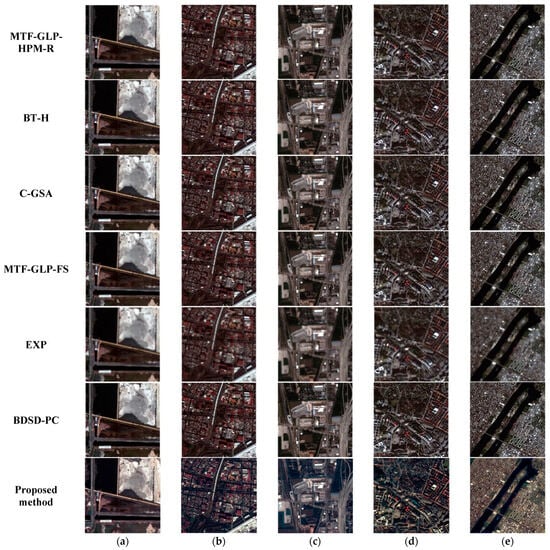
Figure 2.
A visual analysis using natural colors of the assessed methods on the PairMax dataset for reference-available images: (a) W4_Mexi_Nat; (b) W4_Mexi_Urb; (c) Pl_Hous_Urb; (d) Pl_Stoc_Urb; (e) S7_NewY_Mix.
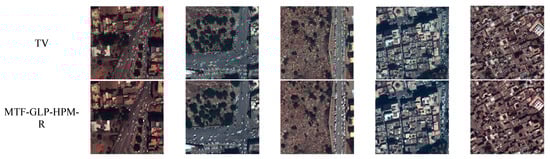
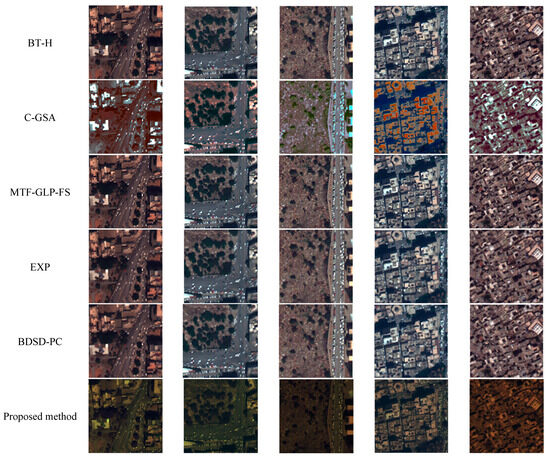
Figure 3.
A visual analysis using natural colors of the assessed methods on the PanCollection dataset for reference-unavailable images.
Table 2.
Values obtained based on the limited resolution indices of the images: (a) TV; (b) SR-D; (c) MTF-GLP-HPM-R; (d) BT-H; (e) C-GSA; (f) MTF-GLP-FS; (g) EXP; (h) BDSD-PC; (i) Proposed method. The best results are written in bold.
Table 3.
Values obtained based on the full-resolution indices of the images. The best results are written in bold.
7. Discussion
The suggested pansharpening technique utilizing the YUV model was evaluated against various established methods, employing both RR and FR metrics for assessing image quality. According to the RR evaluation results, the proposed method achieved superior performance in terms of the Q and SCC for urban and mixed-landscape images, such as GE_Lond_Urb, W2_Miam_Urb, GE_Tren_Urb, and W3_Muni_Mix, outperforming strong baseline methods, like BDSD-PC, MTF-GLP-HPM-R, and BT-H. Notably, the highest SCC values were observed for the GE_Lond_Urb and GE_Tren_Urb images. Furthermore, the highest Q values for the W3_Muni_Mix and W4_Mexi_Urb images indicate the effectiveness of the proposed method in complex urban and heterogeneous landscapes.
The use of the Lanczos interpolation method and adaptive weighting coefficients contributed significantly to preserving the spatial details and reducing the spectral distortion. In the full-resolution (FR) evaluation, the method was assessed using images from the PanCollection dataset and consistently outperformed most of the compared techniques. Although some multiresolution analysis (MRA)-based methods also achieved good quality scores, they were less efficient in terms of execution time.
The proposed method demonstrated a distinct advantage by maintaining high spectral and spatial quality across diverse scenes, as evidenced by an average QNR (Quality with No Reference) index value of approximately 0.95. For instance, the C-GSA method recorded QNR values as low as 0.38 for certain images, despite achieving up to 0.70 on others.
The effectiveness of the method is attributed to the reduction of artifacts through Lanczos interpolation and the use of YUV-based adaptive integration, which ensures the efficient preservation of color and intensity information. The balance between spectral and spatial quality was optimized through the computation of adaptive weighting coefficients.
Future work should address the optimization of the stability coefficient by considering scene-specific tuning for each image. Varying the values may enable further improvements by bringing the evaluation metrics closer to their optimal values for each particular scene.
The average values of each evaluation metric based on the RR and FR results are presented in Figure 4.
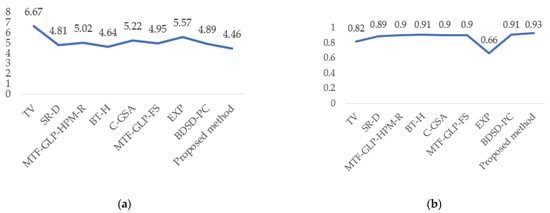
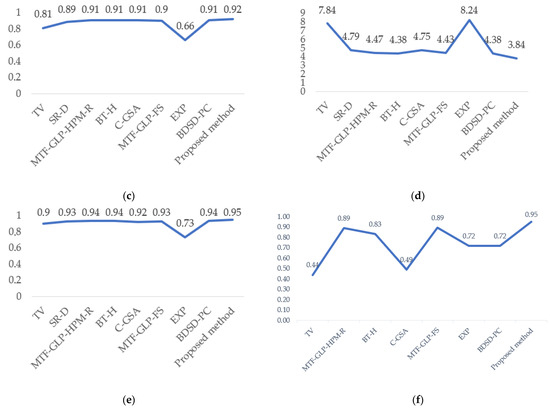
Figure 4.
Graph of average values of reduced-resolution image quality assessment metrics: (a) average values based on the SAM metric; (b) average values based on the Qavg metric; (c) average values based on the Q metric; (d) average values based on the ERGAS metric; (e) average values based on the SCC metric; (f) average values based on the QNR metric.
8. Conclusions and Future Work
In this study, a novel pansharpening method was developed based on the YUV color model. The primary objective of the proposed method is to overcome common limitations observed in many existing pansharpening approaches. The main contribution of this paper lies in the substitution of the Y component with the PAN image during the fusion process, as well as the use of adaptive weights designed to restore spectral fidelity.
The proposed method was evaluated under both reference-based and reference-free conditions. Experiments on the PairMax dataset were conducted for cases with available ground-truth references, while the PanCollection dataset was used to assess performance in the absence of reference images. The experimental results demonstrated that the proposed method outperformed the Brovey and GSA methods in preserving spectral fidelity. Furthermore, high values were recorded for the SCC metric, indicating superior spatial detail retention. The method also proved to be effective across diverse landscape scenarios and showed higher computational efficiency compared to several existing approaches.
Future Work: In the analysis of pansharpening algorithms and in the proposed approach discussed above, the application of optimization methods for selecting the values of balance parameters represents one of the crucial directions. In reference-based evaluations, a high-resolution multispectral image is available that serves as the ideal model for the algorithm’s output. As a result, the difference between the fused image and the reference image can be measured directly and objectively. Therefore, by determining the optimal value of the balance parameter employed in the proposed algorithm, it is possible to influence the quality of the resulting image. The actual performance of the algorithm is determined through the maximization or minimization of the evaluation metrics. Furthermore, this enables drawing conclusions regarding the essential differences of the algorithm in comparison with other approaches. In future work, it may become necessary to investigate the improvement of pansharpening methods through the use of optimization algorithms.
Author Contributions
Conceptualization, S.F. and O.Y.; methodology, O.Y. and E.E.; software, E.E. and Z.M.; validation, O.Y., K.A. and Z.M.; formal analysis, S.F.; investigation, E.E.; resources, K.A.; data curation, Z.M.; writing—original draft preparation, E.E. and K.A.; writing—review and editing, S.F. and O.Y.; visualization, E.E.; supervision, S.F.; project administration, O.Y.; funding acquisition, O.Y. All authors have read and agreed to the published version of the manuscript.
Funding
This research received no external funding. The APC was funded by the authors.
Data Availability Statement
The original contributions presented in this study are included in the article. Further inquiries can be directed to the corresponding authors.
Acknowledgments
The authors express their gratitude to the Digital Technologies and Artificial Intelligence Research Institute and Samarkand State University for providing technical and equipment support during the course of this study.
Conflicts of Interest
The authors declare no conflicts of interest.
References
- Tsukamoto, N.; Sugaya, Y.; Omachi, S. Pansharpening by Complementing Compressed Sensing with Spectral Correction. Appl. Sci. 2020, 10, 5789. [Google Scholar] [CrossRef]
- Zhu, L.; Suomalainen, J.; Liu, J.; Hyyppä, J.; Kaartinen, H.; Haggren, H. A Review: Remote Sensing Sensors. IntechOpen 2018, 19, 19–42. [Google Scholar]
- Fazilov, S.; Yusupov, O.; Radjabov, S.; Eshonqulov, E.; Abdieva, K. Analysis of pansharpening methods for multispectral satellite imagery. In Proceedings of the International Scientific Conference on Modern Problems of Applied Science and Engineering: MPASE2024, Samarkand, Uzbekistan, 2–3 May 2024; Volume 3244. [Google Scholar]
- Yusupov, O.; Eshonkulov, E. Comparative Analysis of Descriptors Construction Methods in Remote Sensing Images. Int. J. Theor. Appl. Issues Digit. Technol. 2023, 6, 102–110. [Google Scholar]
- Meng, X.; Shen, H.; Li, H.; Zhang, L.; Fu, R. Review of the pansharpening methods for remote sensing images based on the idea of meta-analysis: Practical discussion and challenges. Inf. Fusion 2019, 46, 102–113. [Google Scholar] [CrossRef]
- Gillespie, A.R.; Kahle, A.B.; Walker, R.E. Color enhancement of highly correlated images. II. Channel ratio and “chromaticity” transformation techniques. Remote Sens. Environ. 1987, 22, 343–365. [Google Scholar] [CrossRef]
- Kwarteng, P.; Chavez, A. Extracting spectral contrast in Landsat Thematic Mapper image data using selective principal component analysis. Photogramm. Eng. Remote Sens. 1989, 55, 339–348. [Google Scholar]
- Laben, C.A.; Brower, B.V. Process for Enhancing the Spatial Resolution of Multispectral Imagery Using Pan-Sharpening. U.S. Patent 6,011,875 CIIIA, 4 January 2000. [Google Scholar]
- Carper, W.; Lillesand, T.; Kiefer, R. The use of intensity-hue-saturation transformations for merging SPOT panchromatic and multispectral image data. Photogramm. Eng. Remote Sens. 1990, 56, 459–467. [Google Scholar]
- Vivone, G.; Alparone, L.; Chanussot, J.; Mura, M.D.; Garzelli, A.; Licciardi, G.; Restaino, R.; Wald, L. A critical comparison among pansharpening algorithms. IEEE Trans. Ongeoscience Remote Sens. 2015, 53, 2565–2586. [Google Scholar] [CrossRef]
- Aiazzi, B.; Alparone, L.; Baronti, S.; Garzelli, A.; Selva, M. MTF-tailored multiscale fusion of high-resolution MS and pan imagery. Photogramm. Eng. Remote Sens. 2006, 72, 591–596. [Google Scholar] [CrossRef]
- Liu, J.G. Smoothing filter based intensity modulation: A spectral preserve image fusion technique for improving spatial details. Int. J. Remote Sens. 2000, 21, 3461–3472. [Google Scholar] [CrossRef]
- Nunez, J.; Otazu, X.; Fors, O.; Prades, A.; Pala, V.; Arbiol, R. Multiresolution-based image fusion with additive wavelet decomposition. IEEE Trans. Geosci. Remote Sens. 1999, 37, 1204–1211. [Google Scholar] [CrossRef]
- Otazu, X.; Gonza, M.; Fors, O.; Nu, J. Introduction of sensor spectral response into image fusion methods. Application to wavelet-based methods. IEEE Trans. Geosci. Remote Sens. 2005, 43, 2376–2385. [Google Scholar] [CrossRef]
- Restaino, R.; Vivone, G.; Mura, M.D.; Chanussot, J. Fusion of multispectral and panchromatic images based on morphological operators. IEEE Trans. Image Process. 2016, 25, 2882–2895. [Google Scholar] [CrossRef]
- Vivone, G.; Simo, M.; Mura, M.D.; Restaino, R.; Bioucas-Dias, J.; Licciardi, G.; Chanussot, J. Pansharpening based on semiblind deconvolution. IEEE Trans. Geosci. Remote Sens. 2015, 53, 1997–2010. [Google Scholar] [CrossRef]
- Liu, Q.; Meng, X.; Shao, F.; Li, S. Supervised-unsupervised combined deep convolutional neural networks for high-fidelity pansharpening. Inf. Fusion 2023, 89, 292–304. [Google Scholar] [CrossRef]
- Cao, Q.; Deng, L.-J.; Wang, W.; Hou, J.; Vivone, G. Zero-shot semi-supervised learning for pansharpening. Inf. Fusion 2024, 101, 102001. [Google Scholar] [CrossRef]
- Li, Z.; Yuan, G.; Li, J. DUCD: Deep Unfolding Convolutional-Dictionary network for pansharpening remote sensing image. Expert Syst. Appl. 2024, 249, 123589. [Google Scholar] [CrossRef]
- Wang, H.; Zhang, H.; Tian, X.; Ma, J. Zero-Sharpen: A universal pansharpening method across satellites for reducing scale-variance gap via zero-shot variation. Inf. Fusion 2024, 101, 102003. [Google Scholar] [CrossRef]
- Vivone, G.; Addesso, P.; Restaino, R.; Dalla Mura, M.; Chanussot, J. Pansharpening Based on Deconvolution for Multiband Filter Estimation. IEEE Trans. Geosci. Remote Sens. 2019, 57, 540–553. [Google Scholar] [CrossRef]
- Fei, R.; Zhang, J.; Liu, J.; Du, F.; Chang, P.; Hu, J. Convolutional Sparse Representation of Injected Details for Pansharpening. IEEE Geosci. Remote Sens. Lett. 2019, 16, 1595–1599. [Google Scholar] [CrossRef]
- Yin, H. PAN-Guided Cross-Resolution Projection for Local Adaptive Sparse Representation-Based Pansharpening. IEEE Trans. Geosci. Remote Sens. 2019, 57, 4938–4950. [Google Scholar] [CrossRef]
- He, L.; Rao, Y.; Li, J.; Chanussot, J.; Plaza, A.; Zhu, J.; Li, B. Pansharpening via Detail Injection Based Convolutional Neural Networks. IEEE J. Sel. Top. Appl. Earth Obs. Remote Sens. 2019, 12, 1188–1204. [Google Scholar] [CrossRef]
- Yusupov, O.; Eshonqulov, E.; Yusupov, R.; Sattarov, K. Analysis of superpixel segmentation approaches in remote sensing images. AIP Conf. Proc. 2024, 3147, 040026. [Google Scholar] [CrossRef]
- Wang, X.; Bai, S.; Li, Z.; Song, R.; Tao, J. The PAN and ms image pansharpening algorithm based on adaptive neural network and sparse representation in the NSST domain. IEEE Access 2019, 7, 52508–52521. [Google Scholar] [CrossRef]
- Rahmani, S.; Strait, M.; Merkurjev, D.; Moeller, M.; Wittman, T. An adaptive IHS pan-sharpening method. IEEE Geosci. Remote Sens. Lett. 2010, 7, 746–750. [Google Scholar] [CrossRef]
- Zhang, X.; Dai, X.; Zhang, X.; Hu, Y.; Kang, Y.; Jin, G. Improved generalized IHS based on total variation for pansharpening. Remote Sens. 2023, 15, 294. [Google Scholar] [CrossRef]
- Leung, Y.; Liu, J.; Zhang, J. An improved adaptive intensity–hue–saturation method for the fusion of remote sensing images. IEEE Geosci. Remote Sens. Lett. 2013, 11, 985–989. [Google Scholar] [CrossRef]
- Arienzo, A.; Alparone, L.; Garzelli, A.; Lolli, S. Advantages of nonlinear intensity components for contrast-based multispectral pansharpening. Remote Sens. 2022, 14, 3301. [Google Scholar] [CrossRef]
- Jahnavi, M.; Rao, D.R.; Sujatha, A. A Comparative Study Of Super-Resolution Interpolation Techniques: Insights For Selecting The Most Appropriate Method. Procedia Comput. Sci. 2024, 233, 504–517. [Google Scholar] [CrossRef]
- Gonzalez, R.C.; Woods, R.E. Digital Image Processing, 4th ed.; Pearson Education: New York, NY, USA, 2018. [Google Scholar]
- Burger, W.; Burge, M.J. Principles of Digital Image Processing; Springer: London, UK, 2009; Volume 111. [Google Scholar]
- Fisenko, V.T.; Fisenko, T.Y. Computer Processing and Recognition of Images; Saint-Petersburg State University, ITMO: Saint Petersburg, Russia, 2008; 195p. [Google Scholar]
- Perona, P.; Malik, J. Scale-space and edge detection using anisotropic diffusion. IEEE Trans. Pattern Anal. Mach. Intell. 1990, 12, 629–639. [Google Scholar] [CrossRef]
- Yusupov, O.; Eshonqulov, E.; Sattarov, K.; Abdieva, K.; Khasanov, B. Quality assessment parameters of the images obtained with pansharpening methods. AIP Conf. Proc. 2024, 3244, 030081. [Google Scholar] [CrossRef]
- Fazilov, S.K.; Yusupov, O.R.; Abdiyeva, K.S.; Abduraxmonov, M.S.; Qodirov, A.A. Comparative Analysis of Noise Reduction Filters for the Quality Enhancement of Mammography Images. In Proceedings of the 2024 IEEE East-West Design & Test Symposium (EWDTS), Yerevan, Armenia, 13–17 November 2024; pp. 1–5. [Google Scholar]
- Vivone, G.; Mura, M.D.; Garzelli, A.; Pacifici, F. A benchmarking protocol for pansharpening: Dataset, preprocessing, and quality assessment. IEEE J. Sel. Top. Appl. Earth Obs. Remote Sens. 2021, 14, 6102–6118. [Google Scholar] [CrossRef]
Disclaimer/Publisher’s Note: The statements, opinions and data contained in all publications are solely those of the individual author(s) and contributor(s) and not of MDPI and/or the editor(s). MDPI and/or the editor(s) disclaim responsibility for any injury to people or property resulting from any ideas, methods, instructions or products referred to in the content. |
© 2025 by the authors. Licensee MDPI, Basel, Switzerland. This article is an open access article distributed under the terms and conditions of the Creative Commons Attribution (CC BY) license (https://creativecommons.org/licenses/by/4.0/).