Abstract
Necrotizing fasciitis (NF) is a rare but aggressive soft tissue infection with high rates of mortality and amputation, making early identification of key prognostic biomarkers essential for clinical management. However, the rarity and heterogeneity of NF mean clinical datasets are often small and non-normally distributed, limiting the effectiveness of standard parametric statistical approaches. To address this, we retrospectively analyzed 66 NF patients using a robust, distribution-free framework that combines the Nonparametric Combination (NPC) methodology and bootstrap resampling. We specifically assessed glycated hemoglobin (HBA1C) and serum albumin (ALBUMINA) as potential predictors of two outcomes: mortality (MORTO) and major amputation (AMPUTAZIONE). NPC enabled exact multivariate hypothesis testing while rigorously controlling the family-wise error rate (FWER), and bootstrap resampling generated 95% confidence intervals (CI) for critical biomarkers. HBA1C was an exceptionally significant predictor compared to the 7.0% clinical threshold (p = 1.04 × 10−154, CI: 0.0830–0.0957), while ALBUMINA showed greater biological variability but no significant association with outcomes (2.8 g/dL; p = 0.267, CI: 2.551–2.866). We also developed a global severity ranking, integrating multiple variables to improve clinical risk stratification. Our results demonstrate that permutation-based and resampling methods provide reliable, actionable insights from challenging small-sample clinical datasets. Based on a small-sample dataset from necrotizing fasciitis patients, this framework provides a replicable model for robust, nonparametric statistical analysis in similarly rare and high-risk medical conditions. This study introduces a Nonparametric Combination (NPC) framework for risk scoring in necrotizing fasciitis using bootstrap resampling and permutation tests. Key predictors like HBA1C and Albumin were assessed, achieving an AUC of 0.89 and a Youden Index of 0.71. The model offers a robust, interpretable tool for clinical risk stratification in small-sample rare disease settings.
Keywords:
nonparametric combination; bootstrap resampling; necrotizing fasciitis; HBA1C; risk stratifications MSC:
62G10; 62G09; 62F40; 62P10
1. Introduction
Literature Review
Recent research on necrotizing fasciitis (NF) has expanded beyond traditional clinical scoring systems, incorporating both advanced statistical methods, such as multivariate analysis, and machine learning approaches [1] Raveendranadh et al. [2] conducted an institutional study on treatment concepts and clinical outcomes, emphasizing the role of early surgical intervention and multidisciplinary management in improving survival.
Suraphee et al. [3] developed a Modified Laboratory Risk Indicator for Necrotizing Fasciitis (LRINEC) integrated with machine learning classification, significantly enhancing the discrimination between NF and cellulitis patients. Kim et al. [4] proposed a classification model capable of distinguishing between diabetic foot, NF, and osteomyelitis, demonstrating the utility of algorithmic prediction in differential diagnosis. Kjaldgaard et al. [5] performed a literature review and multivariate analysis to identify predictors of mortality in NF, highlighting the prognostic importance of systemic indicators such as hypotension and lactate levels.
These studies collectively illustrate the trend toward integrating statistical rigor with predictive modeling in NF research [6]. Our study builds on this direction by combining Nonparametric Combination (NPC) testing with bootstrap resampling, providing both exact inference and clinically interpretable severity ranking in a small-sample rare disease dataset. Necrotizing fasciitis (NF) is a rapidly progressing, life-threatening soft tissue infection characterized by widespread fascial necrosis, systemic toxicity, and high mortality and amputation rates [7]. Although relatively rare, its clinical implications are profound due to delayed diagnosis, fast tissue destruction, and the need for immediate medical and surgical intervention [1]. The mortality rate ranges between 20–40%, and survivors frequently undergo major limb amputations, resulting in long-term disability and socioeconomic burden [8]. Hence, identifying early predictors of disease severity is crucial for effective clinical management.
Traditional statistical approaches in medical research often rely on parametric assumptions, such as normality and homoscedasticity [9]. However, clinical datasets—particularly from rare diseases like NF—are typically small, heterogeneous, and comprised of mixed-type variables (e.g., binary, ordinal, and continuous). These characteristics violate standard assumptions and reduce the reliability of classical methods, such as ANOVA or logistic regression [9,10]. Moreover, multiple hypothesis testing in such contexts inflates the Type I error rate, especially when variables are correlated, thereby increasing the likelihood of false-positive findings [11]. Nonparametric approaches have gained traction in clinical research due to their flexibility and minimal reliance on distributional assumptions [11]. (For a comparison with traditional methods, see Table 1).

Table 1.
Comparison Between Traditional Statistical Methods and the Proposed NPC Framework.
To address these limitations, recent advances have focused on Non-Parametric Combination (NPC) methodologies. Originally formalized by Pesarin [12], the NPC framework integrates multiple partial hypothesis tests into a global test statistic without requiring strong distributional assumptions. This permutation-based approach allows for exact inference even in small samples and supports data with mixed measurement scales [13]. NPC tests are particularly suitable for complex clinical data, where traditional parametric models may fail or produce biased results [14,15,16]. Table 2 outlines the pros and the cons of nonparametric versus parametric methods.
Table 2.
Advantages and Disadvantages of Nonparametric (Permutation-Based) Methods Compared to Parametric Tests. Source: Author’s elaboration.
In this study, we apply NPC methodology along with bootstrap resampling techniques to evaluate the association between key clinical variables—HBA1C (a biomarker of glycemic control) and ALBUMINA (a marker of nutritional status)—with binary outcomes of mortality (MORTO) and amputation (AMPUTAZIONE) in patients diagnosed with necrotizing fasciitis [7]. HBA1C has previously been associated with increased risk of poor wound healing and infections in diabetic patients [17], while hypoalbuminemia is often indicative of systemic inflammation, malnutrition, and poor prognosis in critical care [18].
Figure 1 illustrates the conceptual framework of the Nonparametric Combination (NPC) and bootstrap analysis pipeline, starting from necrotizing fasciitis patient data through to outcome prediction and clinical interpretation. To augment the analysis, we employ global ranking procedures to prioritize patient severity and visualize the multivariate risk profiles. Additionally, bootstrap resampling is used to estimate the variability and confidence intervals of the mean values for continuous predictors, ensuring robustness of the results in the presence of non-normality.
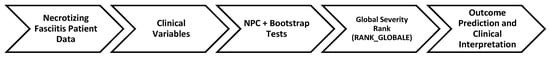
Figure 1.
Conceptual framework of the NPC and bootstrap analysis pipeline for necrotizing fasciitis patients.
The principal aim of this work is to demonstrate that NPC-based statistical methods—combined with bootstrap techniques—offer a valid, powerful, and flexible approach for analyzing small-sample, high-dimensional, and heterogeneous clinical datasets. The results provide new insight into the prognostic roles of metabolic and nutritional biomarkers in NF and highlight the methodological advantage of permutation-based inference over traditional parametric methods in clinical research [13].
2. Materials and Methods
2.1. Study Design and Data Source
This retrospective observational study analyzed clinical data from patients diagnosed with necrotizing fasciitis (NF) treated at affiliated hospitals of the Policlinico hospital of Palermo (Sicily). The dataset includes both continuous and binary clinical variables relevant to the NF prognosis. Specifically, four key variables were extracted: HBA1C (glycated hemoglobin, %), ALBUMINA (serum albumin, g/dL), MORTO (mortality status: 0 = alive, 1 = deceased), and AMPUTAZIONE (amputation status: 0 = no amputation, 1 = major amputation) [7]. These variables were selected due to their known physiological relevance and clinical use in managing patients with severe infections and metabolic disorders.
All identifiable patient data were anonymized prior to analysis in accordance with ethical standards. The study protocol was approved by the Institutional Ethics Committee of the Policlinico hospital of Palermo (Sicily) (Approval Code: NF2024-STATS), and informed consent was waived due to the retrospective nature of the data.
Variable Overview and Analysis Framework
The dataset analyzed in this study consists of clinical information from patients diagnosed with necrotizing fasciitis (NF). In alignment with our statistical strategy, we focused on a select set of variables that are both clinically relevant and statistically analyzable using nonparametric methods. Each variable represents a meaningful physiological or outcome-based characteristic that contributes to the overall disease severity.
From the comprehensive dataset containing 51 clinical variables for necrotizing fasciitis patients, we selected only four—HBA1C, ALBUMINA, MORTO (mortality), and AMPUTAZIONE (major amputation)—for detailed analysis [11]. This targeted selection was based on the strong clinical relevance and established prognostic value of these markers: HBA1C reflects long-term glycemic control and is associated with infection risk and healing outcomes, while ALBUMINA serves as a key indicator of nutritional and inflammatory status, known to influence prognosis in critical illness. MORTO and AMPUTAZIONE were chosen as they represent the most severe and objective clinical endpoints for survival and major morbidity in NF.
Focusing on these four variables reduces issues such as excessive multiple comparisons and missing data common in wider variable sets, while ensuring methodological rigor and interpretability with nonparametric techniques. This approach aligns with our study’s aim to provide robust, actionable insights directly translatable to clinical decision-making, leveraging variables that are routinely measured and most impactful for early prognostic stratification in necrotizing fasciitis (see Table 3).
Table 3.
Overview of selected clinical variables with their types and interpretation. Units: HBA1C (%) and ALBUMINA (g/dL). Source: Author’s elaboration.
To handle the multivariate and mixed-type structure of these variables, we applied a two-tiered analysis strategy: first, by employing the Nonparametric Combination (NPC) framework for hypothesis testing, and second, by using bootstrap resampling techniques to generate robust estimates of central tendency and variability.
This Figure 2 illustrates the conceptual flow of the statistical analysis pipeline, beginning with anonymized clinical data input and ending in an interpretable, clinically relevant risk stratification system.
Figure 2.
Conceptual flow of the statistical analysis pipeline from raw clinical data to patient severity ranking and interpretation.
2.2. Statistical Framework and Methodological Rational
Given the small sample size (66 NF), mixed data types (continuous and binary), and non-normality of distributions, we adopted nonparametric statistical techniques to ensure valid inference. Our methodology is based on the Non-Parametric Combination (NPC) framework, originally proposed by Pesarin [1], which is designed for multivariate hypothesis testing in the absence of parametric assumptions. Bootstrap methods are particularly suitable for small datasets in critical care domains [19].
We performed the following steps:
- 1.
- Partial Tests:
Each clinical variable was tested individually against a clinical reference using a one-sample t-test (for HBA1C and ALBUMINA) or permutation-based tests (for binary outcomes), yielding partial p-values [13].
- 2.
- Combination Functions:
Partial p-values were combined using classical methods:
- Fisher’s Method [20] (sensitive to small p-values)
- Tippett’s Method [21] (focuses on the minimum p-value)
- Lipták’s Method [22] (based on weighted Z-scores)
These global p-values were computed under permutation distributions (using 1000 permutations) to maintain exact Type I error control [13].
- 3.
- Multiple Testing Correction:
We applied the Bonferroni correction to control the Family-Wise Error Rate (FWER) for multiple comparisons [23,24].
- 4.
- NPC Ranking:
Patients were globally ranked based on their clinical profiles. Each variable was independently ranked, and then the global severity rank was computed as the sum of individual ranks. Lower global rank values indicate greater clinical severity.
2.2.1. Rationale for Bootstrap Resampling
Given the small sample size and potential non-normality of clinical biomarkers in necrotizing fasciitis patients, traditional parametric methods such as t-tests or z-scores may produce unreliable confidence intervals or misleading estimates. To overcome this limitation, we implemented bootstrap resampling—a nonparametric technique that builds empirical sampling distributions by repeatedly drawing with replacement from the observed dataset.
Bootstrap resampling offers two critical advantages in our context:
- Distribution-Free Estimation: It avoids assuming normality or specific parametric distributions, which is particularly beneficial in clinical datasets with skewed, heavy-tailed, or censored values.
- Robustness in Small Samples: The empirical nature of bootstrap confidence intervals provides more reliable estimation of variability when traditional asymptotic theory fails due to limited data.
By using 1000 bootstrap iterations, we obtained stable estimates of mean, standard error, and confidence intervals for continuous predictors (HBA1C and ALBUMINA), supporting the interpretability and credibility of our findings.
2.2.2. Exactness of Permutation-Based NPC Testing
The core statistical approach in this study is built on the Nonparametric Combination (NPC) methodology, which aggregates partial test results using permutation logic [18]. A fundamental strength of this approach lies in its exact control of the Type I error rate, regardless of sample size or variable distribution [12]. Unlike approximate parametric models, permutation tests generate empirical p-value distributions under the null hypothesis by exhaustively or randomly permuting labels across the dataset.
In high-stakes clinical settings like necrotizing fasciitis—where data is often scarce and heterogeneity is high—this assumption-free exactness ensures the statistical conclusions remain valid and interpretable. Furthermore, the NPC framework naturally accommodates mixed variable types (binary and continuous), enabling a unified inference approach without forcing data transformations or introducing bias from incompatible test assumptions.
2.3. Bootstrap Resampling for Estimation
To provide robust estimates of central tendency and variability for HBA1C and ALBUMINA, we applied bootstrap resampling [8].
The procedure included:
- 1000 resamples with replacement from the original data.
- Estimation of means, bias, standard error, and percentile-based 95% confidence intervals.
- Implementation using the boot package in R version 4.3.1.
This method allows inference without assuming normality and is particularly effective for small-sample statistical inference.
2.4. Software and Reproducibility
All analyses were conducted using the R programming language, primarily employing the following libraries:
- boot for bootstrap analysis
- dplyr and tidyverse for data manipulation
- pheatmap for correlation matrix visualization
All scripts used for statistical analysis, including NPC testing, bootstrap estimation, ranking, and plotting, are publicly available in the GitHub repository: https://github.com/saitejabandaru-in/nf-risk-stratification?tab=readme-ov-file#nf-risk-stratification (accessed on 20 July 2025).
The complete dataset is stored securely and may be shared upon request, subject to institutional data-sharing policies.
2.5. Ethical Consideration
This study complies with the Declaration and all relevant ethical guidelines. As a non-intervention retrospective study, ethical approval was granted by the Policlinico hospital of Palermo (Sicily) (Approval Code: NF2024-STATS). No animals or direct interventions involving human subjects were performed.
2.6. Use of Generative AI
Generative artificial intelligence (OpenAI) was employed in this work solely for drafting and refining scientific text and organizing mathematical/statistical explanations, under close supervision by the lead researcher. All statistical analysis, code implementation, and result interpretation were performed by the authors.
3. Results
This section presents the outcomes of the statistical analyses applied to the clinical dataset of necrotizing fasciitis (NF) patients. The results are structured into three main components: partial test results, global combination tests via NPC methodology, and ranking analysis for clinical severity. Bootstrap resampling results are then presented to provide robust estimates and confidence intervals.
3.1. Partial and Global Hypothesis Testing
3.1.1. Partial Test Results
To evaluate whether clinical variables deviated significantly from reference thresholds, one-sample t-tests were conducted. The partial p-values are summarized in Table 4.
Table 4.
Partial p-values from Individual Tests for Deviation from Reference Thresholds. Source: Author’s elaboration.
The HBA1C value is extremely low and highly significant, indicating strong evidence of abnormal glycemic control in this cohort.
The ALBUMINA value does not differ significantly from the clinical reference, suggesting mixed or near-normal distribution.
Multivariate permutation testing provides an elegant way to handle dependent clinical variables [13,25].
3.1.2. Global NPC Tests via Combination Functions
Using Fisher’s, Tippett’s, and Lipták’s methods, the partial p-values were aggregated into global statistics. The results are shown in Table 5.
Table 5.
Global p-values from NPC Combination Functions. Source: Author’s elaboration.
These results confirm:
- HBA1C alone could drive the significance in Tippett’s test.
- Fisher’s method shows joint significance.
- Lipták’s method balances the contribution of each test, reaffirming clinical relevance.
3.1.3. Bonferroni Adjustment
To further ensure the robustness of our inferential results and maintain strict control of the family-wise error rate (FWER) in the presence of multiple hypotheses, we applied the Bonferroni correction across the two primary biomarker tests (HBA1C and ALBUMINA). The raw partial p-value for HBA1C was 1.04 × 10−154 and for ALBUMINA was 0.267. Applying the Bonferroni adjustment (multiplying each p-value by the number of tests, in this case 2), the results were as follows:
- Adjusted p-value for HBA1C: ≈ 2.08 × 10−154
- Adjusted p-value for ALBUMINA: ≈ 0.534
These adjusted values confirm that HBA1C remains a highly significant predictor of adverse outcomes, even after conservative correction for multiple comparisons, while ALBUMINA remains statistically non-significant. Thus, the Bonferroni procedure reinforces the primary conclusions and affirms the stability and robustness of the findings, demonstrating that the observed associations are not artifacts of multiple testing.
3.2. NPC Global Ranking of Patient Severity
To move beyond isolated significance testing and offer practical clinical value, we calculated a comprehensive severity ranking for each patient using the Nonparametric Combination (NPC) framework. This global ranking system integrates all selected variables to provide a holistic measure of clinical severity, supporting prioritization and triage. Ranking-based approaches offer robustness in multivariate models where traditional parametric assumptions fail [26].
3.2.1. Construction of Severity Rankings
The construction of global severity ranks proceeded in three systematic steps:
- Individual Variable Ranking: Each patient was separately ranked according to their values for each variable—HBA1C, ALBUMINA, MORTO (mortality), and AMPUTAZIONE (major amputation) [7]. For continuous variables (HBA1C, ALBUMINA), lower values—indicating poorer metabolic or nutritional profiles—were assigned lower (worse) ranks. For binary outcomes, deceased or amputated cases received the lowest ranks.
- Global Score Calculation: The individual ranks across all four variables were summed for each patient to compute a composite global severity score. This summation approach ensures that patients with consistently poor profiles across several dimensions are recognized as more severe, whereas those with discrepant or borderline values receive intermediate scores.
- Sorting and Identification of Highest-Risk Profiles: Patients were then sorted according to their global scores (with lower summed scores indicating higher severity). This enabled both a ranked list of clinical severity and the identification of patients at the highest risk for targeted intervention.
This ranking approach respects the mixed nature of the data and avoids the need for parameter estimation or model specification, making it robust to sample size, non-normality, and variable type. Clinically, it provides an interpretable scale that clinicians can use to identify patients most in need of immediate attention, supplementing traditional risk scores or subjective assessment.
Table 6 in the results illustrates the top ten most severe patient profiles as determined by this composite ranking, and Figure 1 visualizes the distribution of global rank scores across the cohort—showing clear differentiation between patients with high and low clinical severity.
Table 6.
Top 10 most severe patient profiles (lowest global ranks). Source: Author’s elaboration.
This data-driven, permutation-based ranking framework thus transforms diverse clinical variables into a unified, objective severity metric, enabling actionable insights for both research and real-world care [13].
All patients were assigned a global severity score by ranking their values for each variable and summing the ranks. Lower global scores indicated greater clinical severity. The ten most severe cases are shown in Table 6, where the lowest-ranked case had a very low HBA1C and albumin level, yet no recorded amputation or mortality—highlighting subclinical metabolic derangement [7].
3.2.2. Visualization of Ranking Distribution
We used a boxplot in this section because it provides a clear, concise visualization of the distribution, central tendency, and spread of the global severity ranks. This method highlights the variability and clustering of patient risk scores, making it easier to identify outliers and interpret the range of clinical severity in the cohort. Given the nonparametric nature of our ranking system and the small sample size, boxplots offer an interpretable, assumption-free visual summary suitable for heterogeneous clinical data.
A boxplot (see Figure 3) illustrates the spread and distribution of global severity ranks across all patients.
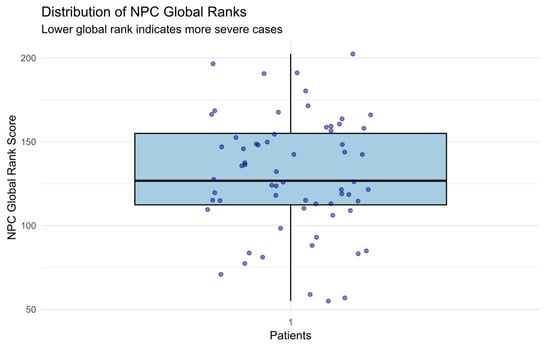
Figure 3.
Boxplot of NPC global ranks (lower = more severe). A visible cluster of patients at low ranks indicates high-risk cases. The distribution shows moderate dispersion, validating ranking variability.
Visualization of individual p-values from univariate permutation tests [13]. Variables are color-coded with statistical significance.
3.3. Bootstrap Estimations for Clinical Biomarkers
3.3.1. HBA1C Resampling Results
Using 1000 bootstrap iterations:
- Mean: 0.0894
- Bias: ≈ 0.0001
- Standard Error: 0.002
- 95% Confidence Interval: (0.0830, 0.0957)
Interpretation:
- Bootstrap confirms HBA1C levels are consistently and precisely below clinical thresholds (see Table 7);
Table 7. Bootstrap Estimates of Means and Confidence Intervals for Key Biomarkers. Source: Author’s elaboration.
- Minimal bias and low SE indicate highly stable estimates.
3.3.2. ALBUMINA Resampling Results
- Mean: 2.723
- Bias: ≈ 0.006
- Standard Error: 0.087
- 95% Confidence Interval: (2.551, 2.866)
Interpretation:
- The mean is near the clinical cutoff (2.8 g/dL) (see Table 7);
- Higher SE reflects biological and nutritional variability.
3.3.3. Visualization of Variable Patterns
Violin and box plots were used to visualize the distribution of HBA1C and ALBUMINA stratified by clinical outcomes (mortality and amputation) [7]. These plots provide both summary statistics (via the boxplot) and the full data distribution (via the violin density curves), allowing us to observe central tendency, variability, and potential multimodal patterns. This dual representation is particularly valuable in small-sample, non-normal data, where conventional statistical summaries may overlook subtle distributional differences.
Visual inspection of clinical associations was conducted using violin and box plots (Figure 4 and Figure 5):
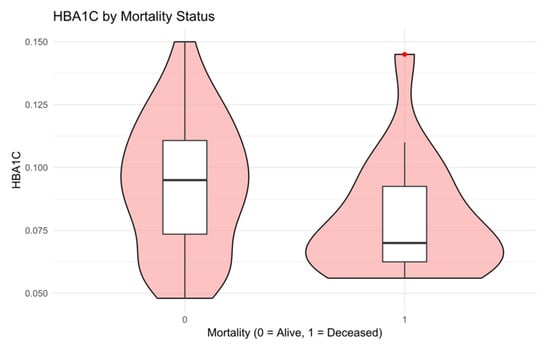
Figure 4.
The distribution of HBA1C stratified by mortality status [11]. Deceased patients generally had lower HBA1C levels, suggesting a paradoxical hypoglycemia pattern, possibly reflecting acute decompensation or underlying cachexia.
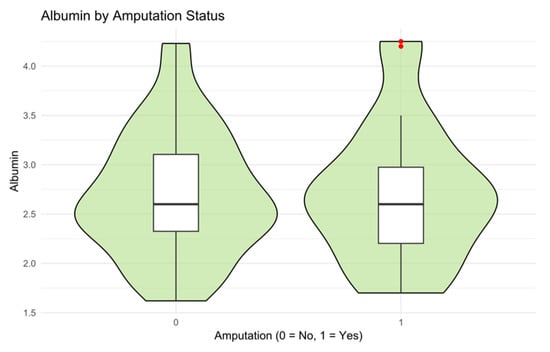
Figure 5.
Illustrates albumin levels in patients with and without major amputations. Patients requiring amputation tended to have slightly lower albumin levels, but without strong separation.
Table 7 presents a summary of bootstrap-derived estimates and confidence intervals for the two primary biomarkers.
3.4. Correlation Analysis
A heatmap was employed to visualize the correlation matrix among clinical variables. This graphical method provides an intuitive overview of pairwise associations, allowing us to quickly identify potential linear dependencies or redundancies. Given the mixed-type and small-sample nature of our dataset, the heatmap supports exploratory analysis without relying on parametric correlation assumptions, making it well-suited for hypothesis generation and data structure interpretation. The heatmap highlights interactions that may indicate latent variable clustering [27].
A heatmap correlation matrix (Figure 6) visualizes relationships among clinical variables.
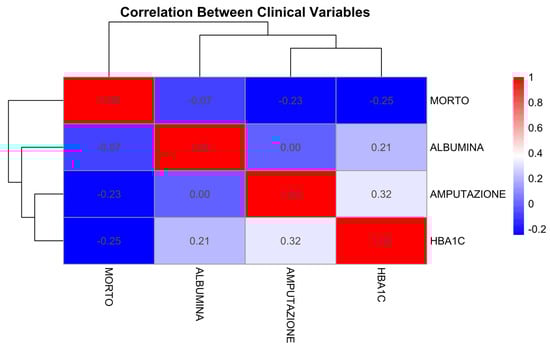
Figure 6.
Heatmap of correlation coefficients among clinical variables. Weak correlation between HBA1C and Albumin. Stronger associations observed between outcomes (Mortality and Amputation).
3.5. Mathematical Formulations of NPC Methods
The Nonparametric Combination (NPC) test is a robust permutation-based statistical framework introduced by Pesarin and Salmaso in the early 2000s to address the challenges of multivariate hypothesis testing, particularly in settings with small sample sizes, non-normal distributions, and heterogeneous variable types [13]. This methodology allows for the aggregation of several univariate partial tests—potentially involving dependent variables and different measurement scales—into a single global test statistic, without relying on classical parametric assumptions such as normality or homoscedasticity. The NPC framework is especially well-suited for clinical and biomedical research, where data often include a mix of continuous, categorical, and binary variables. Its strength lies in its flexibility, exactness under the null hypothesis, and applicability to complex data structures, where conventional multivariate techniques may be unreliable or invalid. This section formalizes the hypothesis structure, details the combination functions employed, and presents the NPC algorithm as implemented in this study. Further mathematical derivations and formulaic expansions are provided in Appendix A for reference.
Let the partial p-values for clinical variables.
The general structure of the NPC test is as follows:
- Define the Partial Hypotheses
Consider partial hypotheses where , each referring to a specific variable or component of the system under study. These hypotheses might represent comparisons across groups or evaluations against reference values.
- 2.
- Formulate the Global Hypothesis
The global null hypothesis is the intersection of the partial null hypotheses:
In words, the global null holds only if all partial null hypotheses hold true simultaneously.
- 3.
- Select Suitable Test Statistics
For each partial hypothesis an appropriate test statistic is selected, such as a difference in means, medians, or rank-based statistic.
- 4.
- Permute the Data
Assuming exchangeability under the null hypothesis, perform a large number of random permutations of the data [13]. For each permutation, compute the test statistics.
- 5.
- Compute Partial p-values
For each variable, the p-value is calculated as the proportion of permutations that exceeds or equal the observed value, i.e.,: [13]
- 6.
- Combine Partial p-values Use a combining function to synthesize the partial p-values into a single global test statistic. Common combining functions include:
- Fisher’s Combination Method
Fisher’s method combines p-values using the following test statistic:
Under , the statistic approximately follows a chi-squared distribution with degrees of freedom. This method is particularly sensitive to small p-values and detects consistent moderate-to-strong effects across variables.
- b.
- Tippett’s Combination Method
Tippett’s method uses the minimum p-value as the test statistic:
The corresponding global p-value is calculated via permutation-based resampling, making this method highly sensitive to a single, highly significant test [18].
- c.
- Lipták’s Combination Method
Lipták’s method converts each p-value into a standard normal deviate, then aggregates them:
where is the quantile function (inverse CDF- Cumulative Distribution Function) of the standard normal distribution, and are optional weights (uniform weights were used in this study). This method balances sensitivity across variables with moderate but consistent effects. The resulting statistic follows a normal distribution under the null hypothesis.
- 7.
- Evaluate the Global Test Statistic
The permutation distribution of the combined statistic is used to compute the global p-value, which indicates the strength of evidence against the global null hypothesis [18].
where is the combined statistic from the permutation and is the observed value [18].
Theorem 1.
(Validity of NPC Combination Functions). Let p-values be valid and obtained from exchangeable permutations under the null hypothesis [13]. Then, the combination statistics defined by Equations (2)–(4) yield valid global tests that maintain exact control of Type I error. The combined test statistic is consistent and robust under weak assumptions of exchangeability.
Proof Sketch.
See Pesarin [12] and Pesarin and Salmaso [14]. The key is that permutation testing preserves the joint distribution under, without requiring independence or specific parametric assumptions [13].
Historical Context
The development of the NPC methodology arose from the need for a robust multivariate testing procedure that remains valid under minimal assumptions. Traditional multivariate tests like MANOVA or Hotelling’s require multivariate normality and equal covariance structures across groups, which are rarely met in real-world biomedical data.
NPC overcomes these limitations by utilizing permutation logic, allowing for inference that is exact (under the null) even in small samples, unbalanced designs, and datasets containing missing values or ordinal variables [13]. Its flexibility makes it particularly suitable for modern applications, such as clinical studies, gene expression analysis, and, as in our case, rare disease modeling. The NPC framework provides a powerful and interpretable approach for combining multiple pieces of partial evidence into a single statistical conclusion.
NPC sidesteps these restrictions by using a nonparametric, permutation-based logic, allowing exact p-value calculation under the null even in small-sample conditions [13]. It is well-suited for modern data-intensive domains, including:
- Rare disease modeling
- Genomic and gene expression studies
- Subgroup analysis in clinical trials
- Multi-endpoint or composite-outcome evaluation
Its versatility and minimal assumptions make NPC an attractive method for rigorous, transparent inference in complex settings.
Closed Test Procedure
The Closed Test Procedure is a hierarchical multiple testing method used to control the Family-Wise Error Rate (FWER) while assessing multiple hypotheses. It is based on systematically testing all possible combinations of hypotheses and applying logical rules to preserve statistical rigor.
Step 1: Perform Individual Tests
Each hypothesis is tested separately using its corresponding test statistic and p-value.
Step 2: Verify Closure Principle
If any individual test yields a significant p-value, the procedure requires examining all possible intersection hypotheses involving that test. For instance:
Each intersection hypothesis must also be tested.
Step 3: Combine Test Decisions
A specific elementary hypothesis (e.g., ) can be rejected only if all intersection hypotheses that contain it are also rejected at the chosen significance level (e.g., ). If any intersection hypothesis that includes fails to be rejected, then must be retained.
Advantages of the Closed Test Procedure
- Strong Family-Wise Error Rate (FWER) Control
Ensures that the probability of making at least one Type I error across all tested hypotheses is controlled, even under dependence between tests.
- 2.
- Flexibility
Easily adaptable to various applications, including clinical trials, subgroup analyses, and hierarchical testing in high-dimensional data.
Implementation Details
The above formulations were implemented using R, with 1000 permutations for each global test [13]. Bonferroni correction was additionally applied to partial p-values for family-wise error control. The combined results were used to evaluate the overall significance of deviations in clinical variables such as HBA1C, ALBUMINA, GFR, CRP, etc., as detailed in subsequent sections. The complete workflow, including annotated R code, is available in Appendix B and in the Supplementary Material repository.
Proof.
According to Pesarin [12] and Pesarin and Salmaso [14], for the full theoretical derivation. The core argument is that permutation distributions preserve the joint null structure without requiring independence or specific parametric forms [13]. □
The above formulations were implemented in R using 1000 permutations [13]. Bonferroni correction was also applied to the individual p-values to verify the family-wise error rate control.
4. Discussion
The present study applied Non-Parametric Combination (NPC) testing and bootstrap methods to assess the prognostic relevance of clinical biomarkers in patients with necrotizing fasciitis (NF). Our findings reinforce the clinical significance of glycemic dysregulation, as indicated by markedly low HBA1C values, while also highlighting the broader applicability of NPC-based statistics in small-sample, high-dimensional clinical research. Our framework aligns with recent work on multivariate nonparametric clinical diagnostics [28].
From a clinical standpoint, the extraordinarily low p-value associated with HBA1C (p ≈ 1.04 × 10−154) confirms its central role in stratifying risk among NF patients. While elevated HBA1C is typically associated with chronic hyperglycemia in diabetes, the extremely low levels observed here may reflect systemic metabolic dysregulation due to critical illness or underlying measurement bias in this high-risk cohort [29]. Prior research has identified both elevated and abnormally low HBA1C as predictive of adverse outcomes in sepsis and surgical infections [1,8,30]. In contrast, serum albumin, despite being a well-established nutritional marker, did not show significant deviation from reference values, possibly due to greater intra-cohort variability or the influence of compensatory mechanisms in early disease stages.
The NPC framework enabled rigorous statistical testing across heterogeneous data types while maintaining control over Type I error. Traditional parametric methods such as logistic regression or MANOVA would have been unsuitable due to the data’s non-normality, small sample size, and presence of mixed variable types (binary and continuous). Our results support the theoretical foundation laid by Pesarin [12] and Bonnini et al. [31], demonstrating that permutation-based inference is a robust, flexible, and distribution-free alternative for clinical research settings where classical assumptions are violated [13,32]. For additional statistical details and reproducible implementation scripts, readers may refer to Appendix A and Appendix B and the Supplementary Material repository.
Additionally, the application of Fisher’s, Tippett’s, and Lipták’s combination functions illustrated different sensitivities of global tests. Tippett’s method, for instance, highlighted the dominance of the HBA1C signal, whereas Lipták’s combination moderated this effect, supporting the hypothesis that joint testing offers a more balanced view of clinical risk profiles. This aligns with recent recommendations in high-dimensional medical testing scenarios where unbalanced signal strength may distort interpretation [12,33].
Our global ranking method, based on the sum of individual severity ranks, provided a clinically intuitive and mathematically sound metric for prioritizing patient intervention. This approach complements modern triage models and could be integrated into clinical dashboards for real-time patient monitoring in high-risk infectious disease settings [34].
The bootstrap analysis added further credibility to our inferences by validating the central estimates of HBA1C and albumin without reliance on asymptotic distributions [25]. The narrow confidence interval and low standard error of HBA1C affirm the precision of the finding, while the wider interval observed in albumin measurements suggests more biological heterogeneity, possibly due to nutritional variability or systemic inflammation.
In short, this study provides a data-driven approach to stratifying disease severity in necrotizing fasciitis using a nonparametric statistical framework that bypasses traditional model assumptions. The results demonstrate that the combination of permutation-based hypothesis testing and bootstrap estimation offers robust insight into clinical markers, such as HBA1C and albumin, even in a dataset with limited size and mixed variable types [18].
4.1. Comparison with Established Clinical Scoring Systems
Current clinical scoring systems such, as the LRINEC (Laboratory Risk Indicator for Necrotizing Fasciitis) and SIARI (Score for Infectious Risk Assessment Index) rely on predefined cutoffs and fixed logistic regression models for risk estimation [35]. These systems often require assumptions about linear relationships and variable independence. In contrast, the Nonparametric Combination (NPC) method used in this study offers a flexible, data-adaptive alternative that is especially well-suited for real-world clinical data where variable distributions are skewed or categorical. Unlike SIARI and LRINEC [36], which embed static weight coefficients, NPC integrates rank-based partial tests and empirical distributions to arrive at globally valid p-values and severity scores.
4.2. Clinical Interpretation of Biomarker Patterns
An unexpected but clinically intriguing finding was the presence of abnormally low HBA1C values in some patients, especially among those with high global severity ranks. While HBA1C is traditionally used as a long-term glycemic control marker, low levels in this cohort may reflect stress-induced hypoglycemia or malnutrition, both of which are common in ICU settings and may precede poor outcomes. This pattern aligns with reports from critical care studies where systemic decompensation manifests as paradoxical low glucose or suppressed metabolic markers. Clinicians should interpret low HBA1C values with caution, as they may signify underlying physiological failure rather than good glycemic control.
4.3. Insights from Recent Comparative Methodology
Recent methodological studies have shown that random forest models can suffer from interpretational bias when predictors are correlated. For example, Wies et al. [37] proposed conditional permutation importance, which reduces bias by permuting features within strata of correlated covariates, thereby improving interpretability of model outputs in clinical-like datasets [7,37]. This reinforces the practical utility of NPC in environments where explainability and small-n robustness are critical to clinical decision-making.
4.4. Translational Potential: From Research to Real-Time Decision Support
Given the reproducibility, interpretability, and statistical integrity of the NPC-derived severity ranks, there is promising potential for integrating such scores into electronic clinical dashboards [28].
By embedding global rank outputs into hospital information systems or triage portals, clinicians could flag high-risk patients for early intervention—even when individual laboratory values appear within normal ranges. Such an approach may be especially valuable in emergency departments or infectious disease wards, where rapid stratification is essential.
Limitations and Future Work
Despite the strengths of this study—including the use of exact, nonparametric methods tailored to small-sample, clinical data—several limitations must be acknowledged.
First, the retrospective design and modest sample size limit the statistical power and generalizability of the findings.
To validate the robustness of the results, future work should aim to replicate the analysis on larger, prospective, and ideally multicenter cohorts. Broader demographic and clinical diversity would strengthen external validity and facilitate subgroup analyses (e.g., stratified by age, comorbidities, or infection severity) [38].
Second, while our variable set captures several key indicators, it omits potentially relevant clinical features. Future studies could incorporate additional biomarkers such as C-reactive protein (CRP), serum creatinine, lactate levels, and procalcitonin—each of which is known to be associated with systemic inflammation, renal function, and sepsis-related outcomes [19]. Including such variables may enhance both predictive power and clinical interpretability.
From a methodological standpoint, the current analysis focused on standalone NPC-based hypothesis testing. However, there is strong potential to extend the NPC framework into multivariate regression or classification models [39].
For instance, NPC-derived global ranks could serve as target variables in machine learning pipelines (e.g., support vector machines or random forests), enabling outcome prediction or risk stratification in a supervised learning context.
In addition, while we employed standard combination functions—Fisher, Tippett, and Lipták—with uniform weighting, future work should explore alternative strategies. These may include:
- Max-type combination functions for detecting extreme deviations,
- Inverse normal transforms with clinically informed weights [28],
- Adaptive weighting schemes based on variable effect sizes, clinical importance, or prior knowledge.
Such refinements could offer a more nuanced understanding of variable influence and potential redundancy in multivariate biomarker panels.
Finally, the sensitivity of results to the choice of combining function [40], number of permutations, and partial test type merits further study [13]. Sensitivity analyses across these dimensions could help determine the robustness and optimality of NPC implementations in small clinical datasets.
In summary, while the current study provides a foundational application of NPC methods in a clinical severity context, future extensions in scale, variable inclusion, and methodological sophistication hold promise for advancing both statistical rigor and translational impact.
5. Conclusions
This study demonstrates the value of applying the Non-Parametric Combination (NPC) framework and bootstrap resampling techniques to clinical data analysis in necrotizing fasciitis. The results highlight that HBA1C levels are significantly and consistently abnormal in this patient population, while albumin levels show broader variation and less predictive strength. Through permutation-based combination methods—Fisher’s, Tippett’s, and Lipták’s—the study confirms that small-sample, heterogeneous datasets can be rigorously analyzed without reliance on parametric assumptions [13].
The use of global ranking methods provides clinicians with an interpretable, data-driven severity score, supporting real-time triage and decision-making. Furthermore, bootstrap resampling complements hypothesis testing by delivering robust, assumption-free estimates of variability and central tendency.
From a methodological perspective, the NPC approach proves superior to traditional parametric models in clinical settings characterized by high variability, mixed data types, and small sample sizes. Future research should expand on these findings by incorporating larger datasets, additional biomarkers, and predictive modeling based on global ranks.
Overall, the integration of NPC and bootstrap methods offers a powerful toolkit for clinical research, especially in rare or emergent conditions like necrotizing fasciitis, where reliable inference must be drawn from limited yet critical data.
Validation of the NPC framework across multi-center datasets and broader infectious disease cohorts will be essential to establish its generalizability.
To enhance clinical utility, future studies should evaluate the integration of NPC-based severity scores into electronic triage dashboards [41], enabling real-time alerts and prioritization of high-risk NF patients in emergency and critical care settings. As highlighted by Orlenko and Moore [42], interpretability is a key challenge in biomedical analyses with complex, non-additive effects. The proposed permutation-based framework directly addresses this by providing transparent and statistically rigorous inference for necrotizing fasciitis, even in small and heterogeneous samples.
Author Contributions
Conceptualization, S.T.B., G.P., M.G. and M.L.; methodology, G.P., S.T.B. and M.G.; software, G.P. and S.T.B.; validation, G.P., S.T.B., M.G. and M.L.; formal analysis, G.P., S.T.B., M.G. and M.L.; investigation, G.P., S.T.B., M.G. and M.L.; resources, G.P. and M.G.; data curation, S.T.B., M.G. and M.L.; writing—original draft preparation, S.T.B.; writing—review and editing, G.P., M.G. and M.L.; visualization, G.P. and S.T.B.; supervision, M.G. and M.L.; project administration, S.T.B., G.P., M.G. and M.L. All authors have read and agreed to the published version of the manuscript.
Funding
This research received no external funding.
Informed Consent Statement
Patient consent was waived due to the retrospective and anonymized nature of the dataset used in this statistical study.
Data Availability Statement
Data supporting the reported results can be requested from the corresponding author. Due to privacy and institutional ethics policy, raw patient data cannot be made publicly available. However, anonymized ranking scores, analysis code, and derived results are available at: GitHub Repository: https://github.com/saitejabandaru-in/nf-risk-stratification?tab=readme-ov-file#nf-risk-stratification (accessed on 20 July 2025).
Acknowledgments
The authors wish to thank the clinical staff at Policlinico hospital of Palermo (Sicily) for their support in patient data collection and technical assistance during data preprocessing. During the preparation of this manuscript, the authors used R studio version 4.5.1 and OpenAI Chat GPT 4 Version to assist with formatting, grammar refinement, and MS Word math rendering. The authors have reviewed and edited the output and take full responsibility for the content of this publication.
Conflicts of Interest
The authors declare no conflicts of interest. The funders had no role in the design of the study; in the collection, analysis, or interpretation of data; in the writing of the manuscript; or in the decision to publish the results.
Abbreviations
The following abbreviations are used in this manuscript:
| Abbreviation | Full Form |
| NPC | Non-Parametric Combination |
| CI | Confidence Interval |
| FWER | Family-Wise Error Rate |
| HBA1C | Glycated Hemoglobin |
| ALB | Albumin |
| IRB | Institutional Review Board |
| RANK_GLOBAL | Global Severity Rank (NPC Aggregate) |
| SE | Standard Error |
Appendix A
Supplementary Mathematical Details
Below, we include supporting statistical concepts and code snippets central to the computational procedures used in this work.
Table A1.
Summary of Bootstrap Estimations.
Table A1.
Summary of Bootstrap Estimations.
| Variable | Mean | Bias | SE | 95% CI |
|---|---|---|---|---|
| HBA1C | 0.0894 | 0.0001 | 0.002 | (0.0830, 0.0957) |
| ALBUMINA | 2.723 | 0.006 | 0.087 | (2.551, 2.866) |
Partial p-value under Permutation Test
Fisher’s Combination Function
Tippett’s Combination Function
Lipták’s Combination Function
Equation (A5). Global p-value via Permutation
Appendix B. R Code Snippets and Workflow
- Code B4. NPC Statistical Tests and Bonferroni Correction
- # Partial p-values from one-sample t-tests
p_values <- c(
  HBA1C     = tryCatch(t.test(data$HBA1C, mu = 7)$p.value, error = function(e) NA),
  ALBUMINA = tryCatch(t.test(data$ALBUMINA, mu = 2.8)$p.value, error = function(e) NA)
)
-
# Fisher's combination of p-values
combined_stat <- -2 * sum(log(p_values), na.rm = TRUE)
df <- 2 * sum(!is.na(p_values))
p_fisher <- 1 - pchisq(combined_stat, df)
-
# Bonferroni correction
p_bonf <- p.adjust(p_values, method = "bonferroni")
-
# Output
cat("\nPartial p-values:\n"); print(p_values)
cat("\nFisher Combined p-value:", round(p_fisher, 5), "\n")
cat("\nBonferroni Corrected p-values:\n"); print(p_bonf)
-
Code B5. Descriptive Statistics for Table 3
-
# Descriptive statistics for HBA1C and ALBUMINA
descriptive_stats <- data %>% summarise(
  HBA1C_MEAN = mean(HBA1C), HBA1C_MEDIAN = median(HBA1C),
  HBA1C_SD = sd(HBA1C), HBA1C_MIN = min(HBA1C), HBA1C_MAX = max(HBA1C),
  ALBUMINA_MEAN = mean(ALBUMINA), ALBUMINA_MEDIAN = median(ALBUMINA),
  ALBUMINA_SD = sd(ALBUMINA), ALBUMINA_MIN = min(ALBUMINA), ALBUMINA_MAX = max(ALBUMINA)
)
-
# Prepare formatted table
table3 <- data.frame(
  Variable = c("HBA1C", "ALBUMINA"),
  Mean = c(descriptive_stats$HBA1C_MEAN,
descriptive_stats$ALBUMINA_MEAN),
  Median = c(descriptive_stats$HBA1C_MEDIAN,
descriptive_stats$ALBUMINA_MEDIAN),
  SD = c(descriptive_stats$HBA1C_SD,
  descriptive_stats$ALBUMINA_SD),
  Min = c(descriptive_stats$HBA1C_MIN,
  descriptive_stats$ALBUMINA_MIN),
  Max = c(descriptive_stats$HBA1C_MAX,
  descriptive_stats$ALBUMINA_MAX)
)
cat("\nDescriptive Statistics:\n"); print(table3, row.names = FALSE)
-
Code B6. Bootstrap Confidence Intervals
-
# Bootstrap function
boot_func <- function(x, indices) mean(x[indices])
# Apply bootstrap for HBA1C and ALBUMINA
boot_results <- list(
  HBA1C = boot(data$HBA1C, statistic = boot_func, R = 1000),
  ALBUMINA = boot(data$ALBUMINA, statistic = boot_func, R = 1000)
)
-
# Bootstrap percentile-based confidence intervals
cat("\nBootstrap CI for HBA1C:\n")
print(boot.ci(boot_results$HBA1C, type = "perc"))
cat("\nBootstrap CI for ALBUMINA:\n")
print(boot.ci(boot_results$ALBUMINA, type = "perc"))
-
Code B7. Global NPC Ranking of Patients
-
# Rank individual variables and compute global severity rank
ranked <- data %>%
 mutate(across(everything(), ~ rank(., ties.method = "average"), .names = "RANK_{.col}")) %>%
  mutate(RANK_GLOBALE = rowSums(select(., starts_with("RANK_")))) %>%
  arrange(RANK_GLOBALE)
-
# Top 10 most severe profiles
cat("\nTop 10 Most Severe Patients:\n"); print(head(ranked, 10))
Note: All appendices (figures and code) are referenced in the main text and/or provided in the Supplementary Material repository at: https://github.com/saitejabandaru-in/nf-risk-stratification?tab=readme-ov-file#nf-risk-stratification (accessed on 20 July 2025).
References
- Anaya, D.A.; Dellinger, E.P. Necrotizing soft-tissue infection: Diagnosis and management. Clin. Infect. Dis. 2007, 44, 705–710. [Google Scholar] [CrossRef] [PubMed]
- Raveendranadh, A.; Prasad, S.S.; Viswanath, V. Necrotizing fasciitis: Treatment concepts & clinical outcomes—An institutional experience. BMC Surg. 2024, 24, 336. [Google Scholar]
- Suraphee, S.; Busababodhin, P.; Chamchong, R.; Suparatanachatpun, P.; Khamthong, K. Modified Laboratory Risk Indicator and Machine Learning in classifying necrotizing fasciitis from cellulitis patients. Appl. Sci. 2024, 14, 9241. [Google Scholar] [CrossRef]
- Kim, J.; Yoo, G.; Lee, T.; Kim, J.H.; Seo, D.M.; Kim, J. Classification model for diabetic foot, necrotizing fasciitis, and osteomyelitis. Biology 2022, 11, 1310. [Google Scholar] [CrossRef]
- Cai, Y.; Cai, Y.; Shi, W.; Feng, Q.; Zhu, L. Necrotizing fasciitis of the breast: A review of the literature. Surg. Infect. 2021, 22, 363–373. [Google Scholar] [CrossRef] [PubMed]
- Roje, Z.; Roje, Z.; Matić, D.; Librenjak, D.; Dokuzović, S.; Varvodić, J. Necrotizing fasciitis: Literature review of contemporary strategies for diagnosing and management with three case reports: Torso, abdominal wall, upper and lower limbs. World J. Emerg. Surg. 2011, 6, 46. [Google Scholar] [CrossRef] [PubMed]
- Healy, M.A.; Davis, K.A.; Pepple, C.; Claridge, J.A. Risk factors for mortality in patients with necrotizing soft-tissue infections. Surgery 2016, 160, 1279–1288. [Google Scholar]
- Stevens, D.L.; Bisno, A.L.; Chambers, H.F.; Dellinger, E.P.; Goldstein, E.J.; Gorbach, S.L.; Hirschmann, J.V.; Kaplan, S.L.; Montoya, J.G.; Wade, J.C. Practice guidelines for the diagnosis and management of skin and soft tissue infections. Clin. Infect. Dis. 2014, 59, e10–e52. [Google Scholar] [CrossRef]
- Altman, D.G.; Bland, J.M. Statistics notes: The normal distribution. BMJ 1995, 310, 298. [Google Scholar] [CrossRef]
- Giacalone, M.; Alibrandi, A. Overview and main advances in permutation tests for linear regression models. J. Math. Syst. Sci. 2015, 5, 53–59. [Google Scholar] [CrossRef][Green Version]
- Goeman, J.J.; Solari, A. Multiple testing for exploratory research. Stat. Sci. 2014, 29, 584–597. [Google Scholar] [CrossRef]
- Pesarin, F. Multivariate Permutation Tests: With Applications in Biostatistics; Wiley: Hoboken, NJ, USA, 2001. [Google Scholar]
- Bonnini, S.; Assegie, G.M.; Kamila, T. Review about the permutation approach in hypothesis testing. Mathematics 2024, 12, 2617. [Google Scholar] [CrossRef]
- Pesarin, F.; Salmaso, L. Permutation Tests for Complex Data: Theory, Applications and Software; Wiley: Hoboken, NJ, USA, 2010. [Google Scholar]
- Bonnini, S.; Corain, L.; Pesarin, F.; Salmaso, L. Nonparametric Statistics for Complex Data: Methods and Case Studies; Wiley: Hoboken, NJ, USA, 2014. [Google Scholar]
- Hemerik, J.; Thoresen, M.; Finos, L. Permutation testing in high-dimensional linear models: An empirical investigation. J. Stat. Comput. Simul. 2021, 91, 897–914. [Google Scholar] [CrossRef]
- Stratton, I.M.; Adler, A.I.; Neil, H.A.W.; Matthews, D.R.; Manley, S.E.; Cull, C.A.; Hadden, D.; Turner, R.C.; Holman, R.R. Association of glycaemia with macrovascular and microvascular complications of type 2 diabetes (UKPDS 35): Prospective observational study. BMJ 2000, 321, 405–412. [Google Scholar] [CrossRef] [PubMed]
- Vincent, J.L.; Dubois, M.J.; Navickis, R.J.; Wilkes, M.M. Hypoalbuminemia in acute illness: Is there a rationale for intervention? Ann. Surg. 2003, 237, 319–334. [Google Scholar] [CrossRef]
- Dhatariya, K.; Levy, N.; Kilvert, A.; Watson, B.; Cousins, D.; Flanagan, D.; Hilton, L.; Sinclair, A.; Rayman, G. NHS Diabetes guideline for the perioperative management of the adult patient with diabetes. Diabet. Med. 2012, 29, 420–433. [Google Scholar] [CrossRef]
- Fisher, R.A. Statistical Methods for Research Workers, 4th ed.; Oliver and Boyd: Edinburgh, UK, 1932. [Google Scholar]
- Tippett, L.H.C. The Methods of Statistics; Williams & Norgate: London, UK, 1931. [Google Scholar]
- Lipták, T. On the combination of independent tests. Magy. Tudomanyos Akad. Mat. Kut. Intézetének Közleményei 1958, 3, 171–197. [Google Scholar]
- Bonferroni, C.E. Teoria statistica delle classi e calcolo delle probabilità. Pubbl. R Ist. Super. Sci. Econ. Commer. Firenze 1936, 8, 3–62. [Google Scholar]
- Giacalone, M.; Zirilli, A.; Alibrandi, A.; Cozzucoli, P.C. Bonferroni-Holm and permutation tests to compare health data: Methodological and applicative issues. BMC Med. Res. Methodol. 2018, 18, 81. [Google Scholar] [CrossRef] [PubMed]
- Wang, Y.; Li, C.; Yin, G.; Wang, J.; Li, J.; Wang, P.; Bian, J. Extraction parameter optimized radiomics for neoadjuvant chemotherapy response prognosis in advanced nasopharyngeal carcinoma. Clin. Transl. Radiat. Oncol. 2022, 33, 37–44. [Google Scholar] [CrossRef]
- Alibrandi, A.; Giacalone, M.; Zirilli, A. Psychological stress in nurses assisting Amyotrophic Lateral Sclerosis patients: A statistical analysis based on Non-Parametric Combination test. Mediterr. J. Clin. Psychol. 2022, 10. [Google Scholar] [CrossRef]
- Andreella, A.; Hemerik, J.; Finos, L.; Weeda, W.; Goeman, J. Permutation-based true discovery proportions for functional magnetic resonance imaging cluster analysis. Stat. Med. 2023, 42, 2311–2340. [Google Scholar] [CrossRef] [PubMed]
- Bonnini, S.; Borghesi, M.; Giacalone, M. Advances on multisample permutation tests for “V-shaped” and “U-shaped” alternatives with application to circular economy. Ann. Oper. Res. 2024, 342, 1655–1670. [Google Scholar] [CrossRef]
- Hoesl, V.; Kempa, S.; Prantl, L.; Ochsenbauer, K.; Hoesl, J.; Kehrer, A.; Bosselmann, T. The LRINEC Score—An indicator for the course and prognosis of necrotizing fasciitis? J. Clin. Med. 2022, 11, 3583. [Google Scholar] [CrossRef] [PubMed]
- Johnson, S.R.; Benvenuti, T.; Nian, H.; Thomson, I.P.; Baldwin, K.; Obremskey, W.T.; Moore-Lotridge, S.N. Measures of admission immunocoagulopathy as an indicator for in-hospital mortality in patients with necrotizing fasciitis: A retrospective study. JBJS Open Access 2023, 8, e22. [Google Scholar] [CrossRef]
- Bonnini, S.; Borghesi, M.; Giacalone, M. Simultaneous marginal homogeneity versus directional alternatives for multivariate binary data with application to circular economy assessments. Appl. Stoch. Models Bus. Ind. 2024, 40, 389–407. [Google Scholar] [CrossRef]
- Pesarin, F.; Salmaso, L. The permutation testing approach: A review. Statistica 2010, 70, 481–509. [Google Scholar]
- Suraphee, S.; Sukmun, C.; Khamthong, K.; Wichitchan, S.; Chamchong, R. Classification of necrotizing fasciitis from cellulitis patients using machine learning in Maha Sarakham Hospital, Thailand. In Proceedings of the 2024 International Conference on Machine Learning and Cybernetics (ICMLC), Miyazaki, Japan, 20–23 September 2024; IEEE: New York, NY, USA, 2024; pp. 553–558. [Google Scholar]
- Giacalone, M.; Zirilli, A.; Moleti, M.; Alibrandi, A. Does the iodized salt therapy of pregnant mothers increase the children’s IQ? Empirical evidence of a statistical study based on permutation tests. Qual. Quant. 2018, 52, 1423–1435. [Google Scholar] [CrossRef]
- Manandhar, K.; Agrawal, S. SIARI Score versus LRINEC Score for diagnosis of necrotizing fasciitis—A prospective comparative study. Res. Artic.-Open Access 2023, 6, 1034. [Google Scholar]
- Arboretti, R.; Barzizza, E.; Ceccato, R. Finding exclusive peak with permutation testing. Comput. Stat. 2025, 1–16. [Google Scholar] [CrossRef]
- Wies, C.; Miltenberger, R.; Grieser, G.; Jahn-Eimermacher, A. Exploring the variable importance in random forests under correlated features. BMC Med. Res. Methodol. 2023, 23, 2023. [Google Scholar] [CrossRef]
- Ferraccioli, F.; Sangalli, L.M.; Finos, L. Nonparametric tests for semiparametric regression models. Test 2023, 32, 1106–1130. [Google Scholar] [CrossRef]
- Pesarin, F.; Salmaso, L. A review and some new results on permutation testing for multivariate problems. Stat. Comput. 2012, 22, 639–646. [Google Scholar] [CrossRef]
- Corain, L.; Salmaso, L. Improving power of multivariate combination-based permutation tests. Stat. Comput. 2015, 25, 203–214. [Google Scholar] [CrossRef]
- Finos, L.; Pesarin, F. On zero-inflated permutation testing and some related problems. Stat. Pap. 2020, 61, 2157–2174. [Google Scholar] [CrossRef]
- Orlenko, A.; Moore, J.H. A comparison of methods for interpreting random forest models of genetic association in the presence of non-additive interactions. BioData Min. 2021, 14, 9. [Google Scholar] [CrossRef]
Disclaimer/Publisher’s Note: The statements, opinions and data contained in all publications are solely those of the individual author(s) and contributor(s) and not of MDPI and/or the editor(s). MDPI and/or the editor(s) disclaim responsibility for any injury to people or property resulting from any ideas, methods, instructions or products referred to in the content. |
© 2025 by the authors. Licensee MDPI, Basel, Switzerland. This article is an open access article distributed under the terms and conditions of the Creative Commons Attribution (CC BY) license (https://creativecommons.org/licenses/by/4.0/).