1. Introduction
Complex networks can serve as models for complex systems and have recently gained significant attention [
1,
2,
3,
4]. Measurement of the complexity of these networks through the fractal dimension has drawn attention to different methods such as the volume dimension (VD) [
4,
5,
6,
7,
8], which involves determining the average number of nodes within a ball of radius
r to compute the fractal volume. Modifying the original definition of the VD [
5,
6], the approach in [
4] replaces the mass of the nodes inside the ball with the degree of these nodes.
Recent studies have examined how entropy-based measures, particularly the Deng entropy, reveal scaling behaviors in uncertain systems. The Deng entropy builds on the Shannon entropy within the context of Dempster–Shafer theory and effectively captures uncertainty in belief distributions, making it suitable for modeling imprecise information. The study [
9] indicated that the maximum value of belief distributions under maximum Deng entropy follows a power law relationship with the scale of the information space. These findings suggest a link between entropy measures and the analysis of scale-free or self-similar structures seen in complex networks.
The concept of information dimension is essential to understanding the probabilistic structure of chaotic systems and complex networks [
10,
11,
12,
13,
14]. Unlike traditional fractal dimensions, which focus on geometric scaling, the information dimension quantifies how information in a probability distribution changes with resolution [
15] or how the Basic Probability Assignment (BPA) changes with the size of the power set [
16]. It is particularly relevant for analyzing chaotic attractors, where probability distributions display self-similar fractal characteristics. The information dimension complements the metric entropy (Kolmogorov–Sinai entropy), which limits the rate at which information can be gained from measurement sequences. This relationship connects the concepts of probabilistic uncertainty, fractality, and dynamical complexity. Various algorithms can be used to experimentally determine these quantities, providing essential tools for characterizing uncertainty and complexity in real-world systems.
Models that convert belief structures into probabilities are useful for decision making under uncertainty. The BPA or mass function is the prerequisite for handling uncertainty within Dempster–Shafer theory [
17]. The latter has been extended to complex evidence theory [
18] to introduce a complex distance [
19] and a complex Deng entropy [
20]. Furthermore, the BPA has been expanded to introduce a transient mass function [
17].
A practical method is the Ordered Visibility Graph with Weighted Probability (OVGWP) [
21], which creates a weighted network based on the BPA of the Dempster–Shafer theory. It utilizes the belief entropy to measure information in focal elements, then ranks them and transforms probabilities based on the network’s degree and the weights of its edges. This approach enhances our understanding of uncertainty by taking both belief values and the number of focal elements into consideration, showcasing the value of complex networks and entropy in managing information.
The fractal property is recognized as one of the key structural features of complex networks, reflecting their self-similarity across scales [
22]. This property is typically quantified through the fractal dimension, which characterizes the power law relationship between the number of boxes needed to cover a network and the size of the boxes. A wide range of network covering algorithms have been developed to estimate this dimension, addressing the NP-hard nature of the covering problem [
23]. Beyond global measures, local and multi-fractal dimensions [
24,
25,
26] have also been introduced to explore the node-level structure and heterogeneity in scaling. These approaches have demonstrated practical relevance in various real-world systems, including transportation, social, sensor, and financial networks. Such findings reinforce the fractal dimension as a powerful tool for understanding the architecture and function of complex systems.
The study of complex networks has revealed that various systems share common structural characteristics. In addition to well-known properties such as scale-free behavior and the small-world effect, an essential characteristic is fractality or self-similarity [
27]. This property indicates that a part of the network resembles the whole network. Utilizing a renormalization process, recent research [
28] has shown that these networks display a well-defined fractal scale. This discovery aids in understanding the emergence of power law degree distributions and suggests a shared self-organization dynamic across different types of networks [
29]. Measuring the fractal properties of complex networks helps us to understand their structure and behavior. Traditional methods, such as the box-covering algorithm, are often too complex to be used effectively. Therefore, the VD has emerged as a practical alternative.
Previous work has demonstrated that the fractal dimension can be understood through information measures, where the Shannon entropy establishes a direct connection between the scaling of probabilities and the dimensionality of a system [
30]. Some studies have expanded the framework to include generalized entropies, such as those of Rényi, Tsallis, and Kaniadakis, leading to the concept of generalized fractal dimensions [
31,
32]. These approaches demonstrate that entropy not only quantifies disorder, but also encodes the scaling laws that underlie self-similar structures. The entropic formulation of dimension serves as a connection between geometric complexity and probabilistic uncertainty, allowing for deeper insights and a better understanding of both concepts. Nie [
33] examined the dimensions of a financial correlation-based network, explicitly using the VD to characterize its structural complexity. Additionally, they established a connection between the Rényi index and the VD, offering a tool for evaluating the structure of financial networks.
The Volume Dimension
A fundamental question in statistical mechanics is how the behavior of a model depends on the dimensionality of the system. This phenomenon has been widely studied in the context of discrete regular lattices, where various processes demonstrate a significant dependence on spatial dimensions. In recent years, this type of analysis has expanded beyond regular lattices to encompass complex networks, including social, biochemical, and information networks. This expansion has highlighted the need for a suitable definition of dimension for these networks, which allows us to study properties that depend on physical space, such as the extensive behavior of certain potentials.
Shanker [
5] proposed an extension of the concept of dimension for complex networks, which is typically applied to regular networks. This approach focuses on measuring how the volume, defined as the average number of nodes within a certain distance (measured by the shortest path) from a specific node, changes as that distance increases [
5]. This relation is expressed as follows:
where
denotes the VD,
k is a geometric constant, and
is the distance. In practice, each node of the network becomes the “center” from which nodes that are at a distance of
are counted. This counting process is performed in the interval
, where
is the diameter of the network. The result is a matrix
where
N is the number of nodes. This matrix is then averaged by columns, resulting in the mean number of nodes vs.
. Finally, non-linear regression is performed on these points to estimate
k and
. This relationship between volume and distance helps to define the dimension as the exponent that characterizes the growth of the volume with increasing distance. In this way, the definition broadens the concept of dimension from physical systems to more complex structures, enabling deeper analysis of their properties and behaviors.
The VD provides a method for characterizing the fractal properties of complex networks by examining how the number of nodes within a specific distance increases as a function of the distance. This approach effectively reflects scaling behaviors while avoiding the computational challenges associated with the box-covering method. A new approach to the volume concept has been proposed that considers the structural heterogeneity of networks through the node degree [
4]. This definition measures volume as the sum of node degrees, capturing the significance of highly connected nodes (hubs). The volume dimension based on node degree (VDND) is defined as follows:
where V(
) is the average degree of the nodes within a distance
and
is the VDND [
4]. The governing exponent introduces a new fractal dimension that reflects local connectivity and the network’s overall structure. The VDND is correlated with the shortcut density in small-world networks, like the Newman–Watts model [
4]. It increases with the probability of adding random edges and the fixed neighborhood range, making it sensitive to structural disorder. This approach complements earlier definitions of dimension in complex networks, serving as a tool for analyzing scaling properties in such networks.
While the classical definition of VD primarily focuses on the spatial distribution of nodes, the volume VDND additionally quantifies the contribution of edges. However, these methods fail to account for the uncertainty and imprecision that are often present in complex systems. The approach proposed in this work introduces a VD that is based on the concept of mass functions, incorporating the belief structure of Dempster–Shafer theory. This new perspective extends beyond geometric or degree-based scaling by examining how uncertainty is distributed throughout the network, offering an approach to characterize the structural complexity of both real and synthetic networks.
The remainder of this paper is organized as follows:
Section 2 introduces the notion of a mass function, the Deng entropy, and the VDMF for a complex network. In
Section 3, we present the proposed methodology.
Section 4 discusses the results regarding the VDFMs for nodes and edges in both real and synthetic networks. Finally,
Section 5 provides the conclusions of this work.
2. Preliminaries
In this section, some basic foundations are presented.
2.1. Mass Function
In the context of evidence theory, a mass function is an extension of a probability distribution. A frame of discernment, denoted by
[
34], and its power set
are the key elements of the mass function defined as follows:
The mass function, also called a basic probabilistic assignment, satisfies the following two conditions:
where
A contains the focal elements of
.
2.2. Deng Entropy
In the context of evidence theory, the Deng entropy has been introduced to measure the uncertainty of a mass function [
16,
35]. It is defined as follows:
where
is the mass function of the set of focal elements and
is its cardinality. The Deng entropy is composed of non-specificity and discord terms, as can be seen on the right-hand side of Equation (
6), where the non-specificity term
measures the cost of finding the correct solution among multiple alternatives [
35].
The mass function is defined as follows [
36]:
and it has been proven that the Deng entropy reaches its maximum at [
36]
In the Deng entropy, the belief of each focal element is divided by the term , which represents the potential number of states in A.
2.3. Volume Dimension of Mass Function
Definition 1. Given a frame of discernment X, its power set , the focal elements , and a mass function , the volume of a mass function (VMF) is defined as follows: In particular, the VMF provides the magnitude of the focal elements according to their cardinality.
Property 1. When a mass function degenerates to a probability distribution, the elements of A are singletons; that is, for and . Then, In this case, the VMF degenerates into the sum of the probabilities.
Remark 1. When the cardinality of the set of focal elements is sufficiently large, the VMF is approximately the non-specificity term of the Deng entropy given in Equation (6), which means that In this equation, represents the potential number of states in minus ∅. The impact of ∅ can be neglected when is sufficiently large; thus, we can rewrite Equation (11) as follows: 2.4. Volume Dimension of the Mass Function for a Complex Network
A mass function for nodes has recently been introduced in [
37,
38,
39]:
as well as a mass function for edges in complex networks [
40]:
where
are the focal elements (in this context, the boxes that cover the networks),
is the number of nodes,
is the number of edges of the network,
denotes the number of nodes in a box, and
is the number of edges in a box that include
(i.e., are the edges within the box) and
(i.e., the edges that leave the box). As the outputs of the box-covering algorithm are mutually exclusive subsets of nodes and edges, Equations (
13) and (
14) meet the conditions of Equation (
5).
Definition 2. Derived from Equation (9) and using the mass function of nodes, Equation (13), we can define the VMF for nodes in a complex network as follows:where is the number of boxes computed using the box-covering algorithm [41], and and are as defined previously. Definition 3. Similarly, from Equations (9) and (14), we can define the VMF for edges in a complex network as follows:where , , , , and are as defined previously. The classical VD (Equation (
1)) and VDND (Equation (
2)) are assumed to asymptotically follow a power law. Thus,
where
d can be the classical VD (
) or the VDND (
).
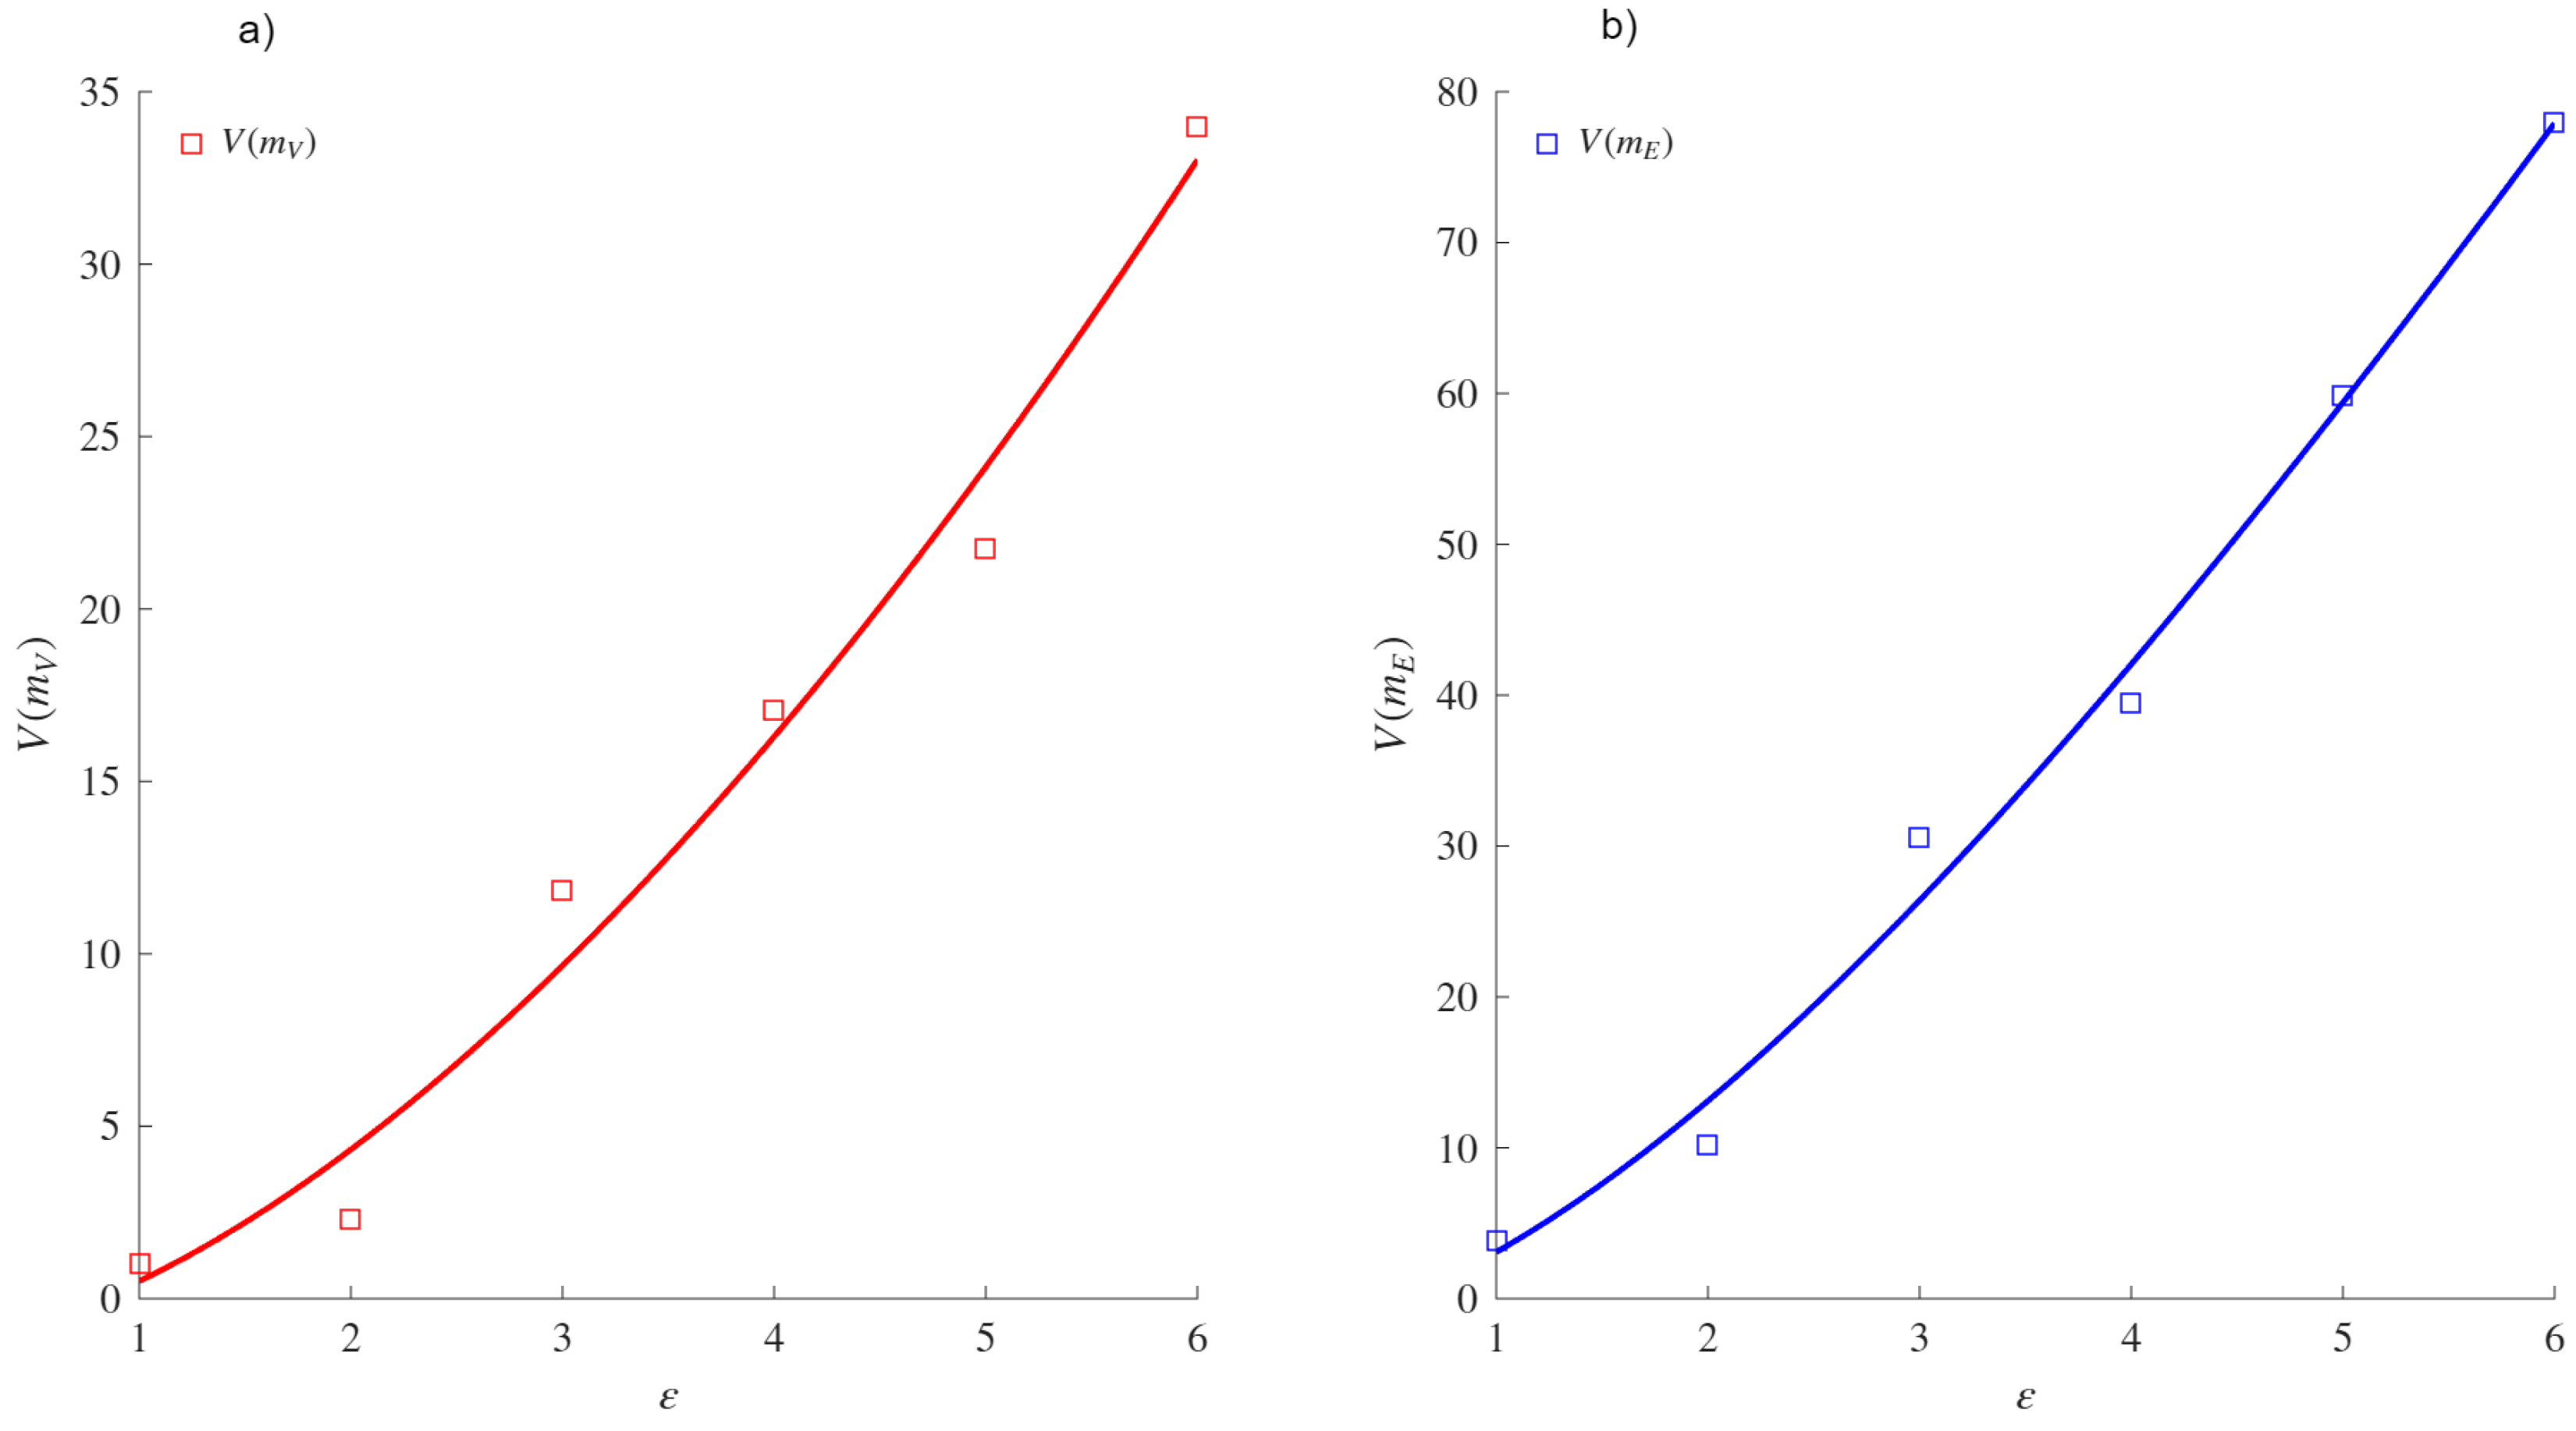
However, this asymptotic relationship does not hold for the mass function of nodes, Equation (
13), as demonstrated in [
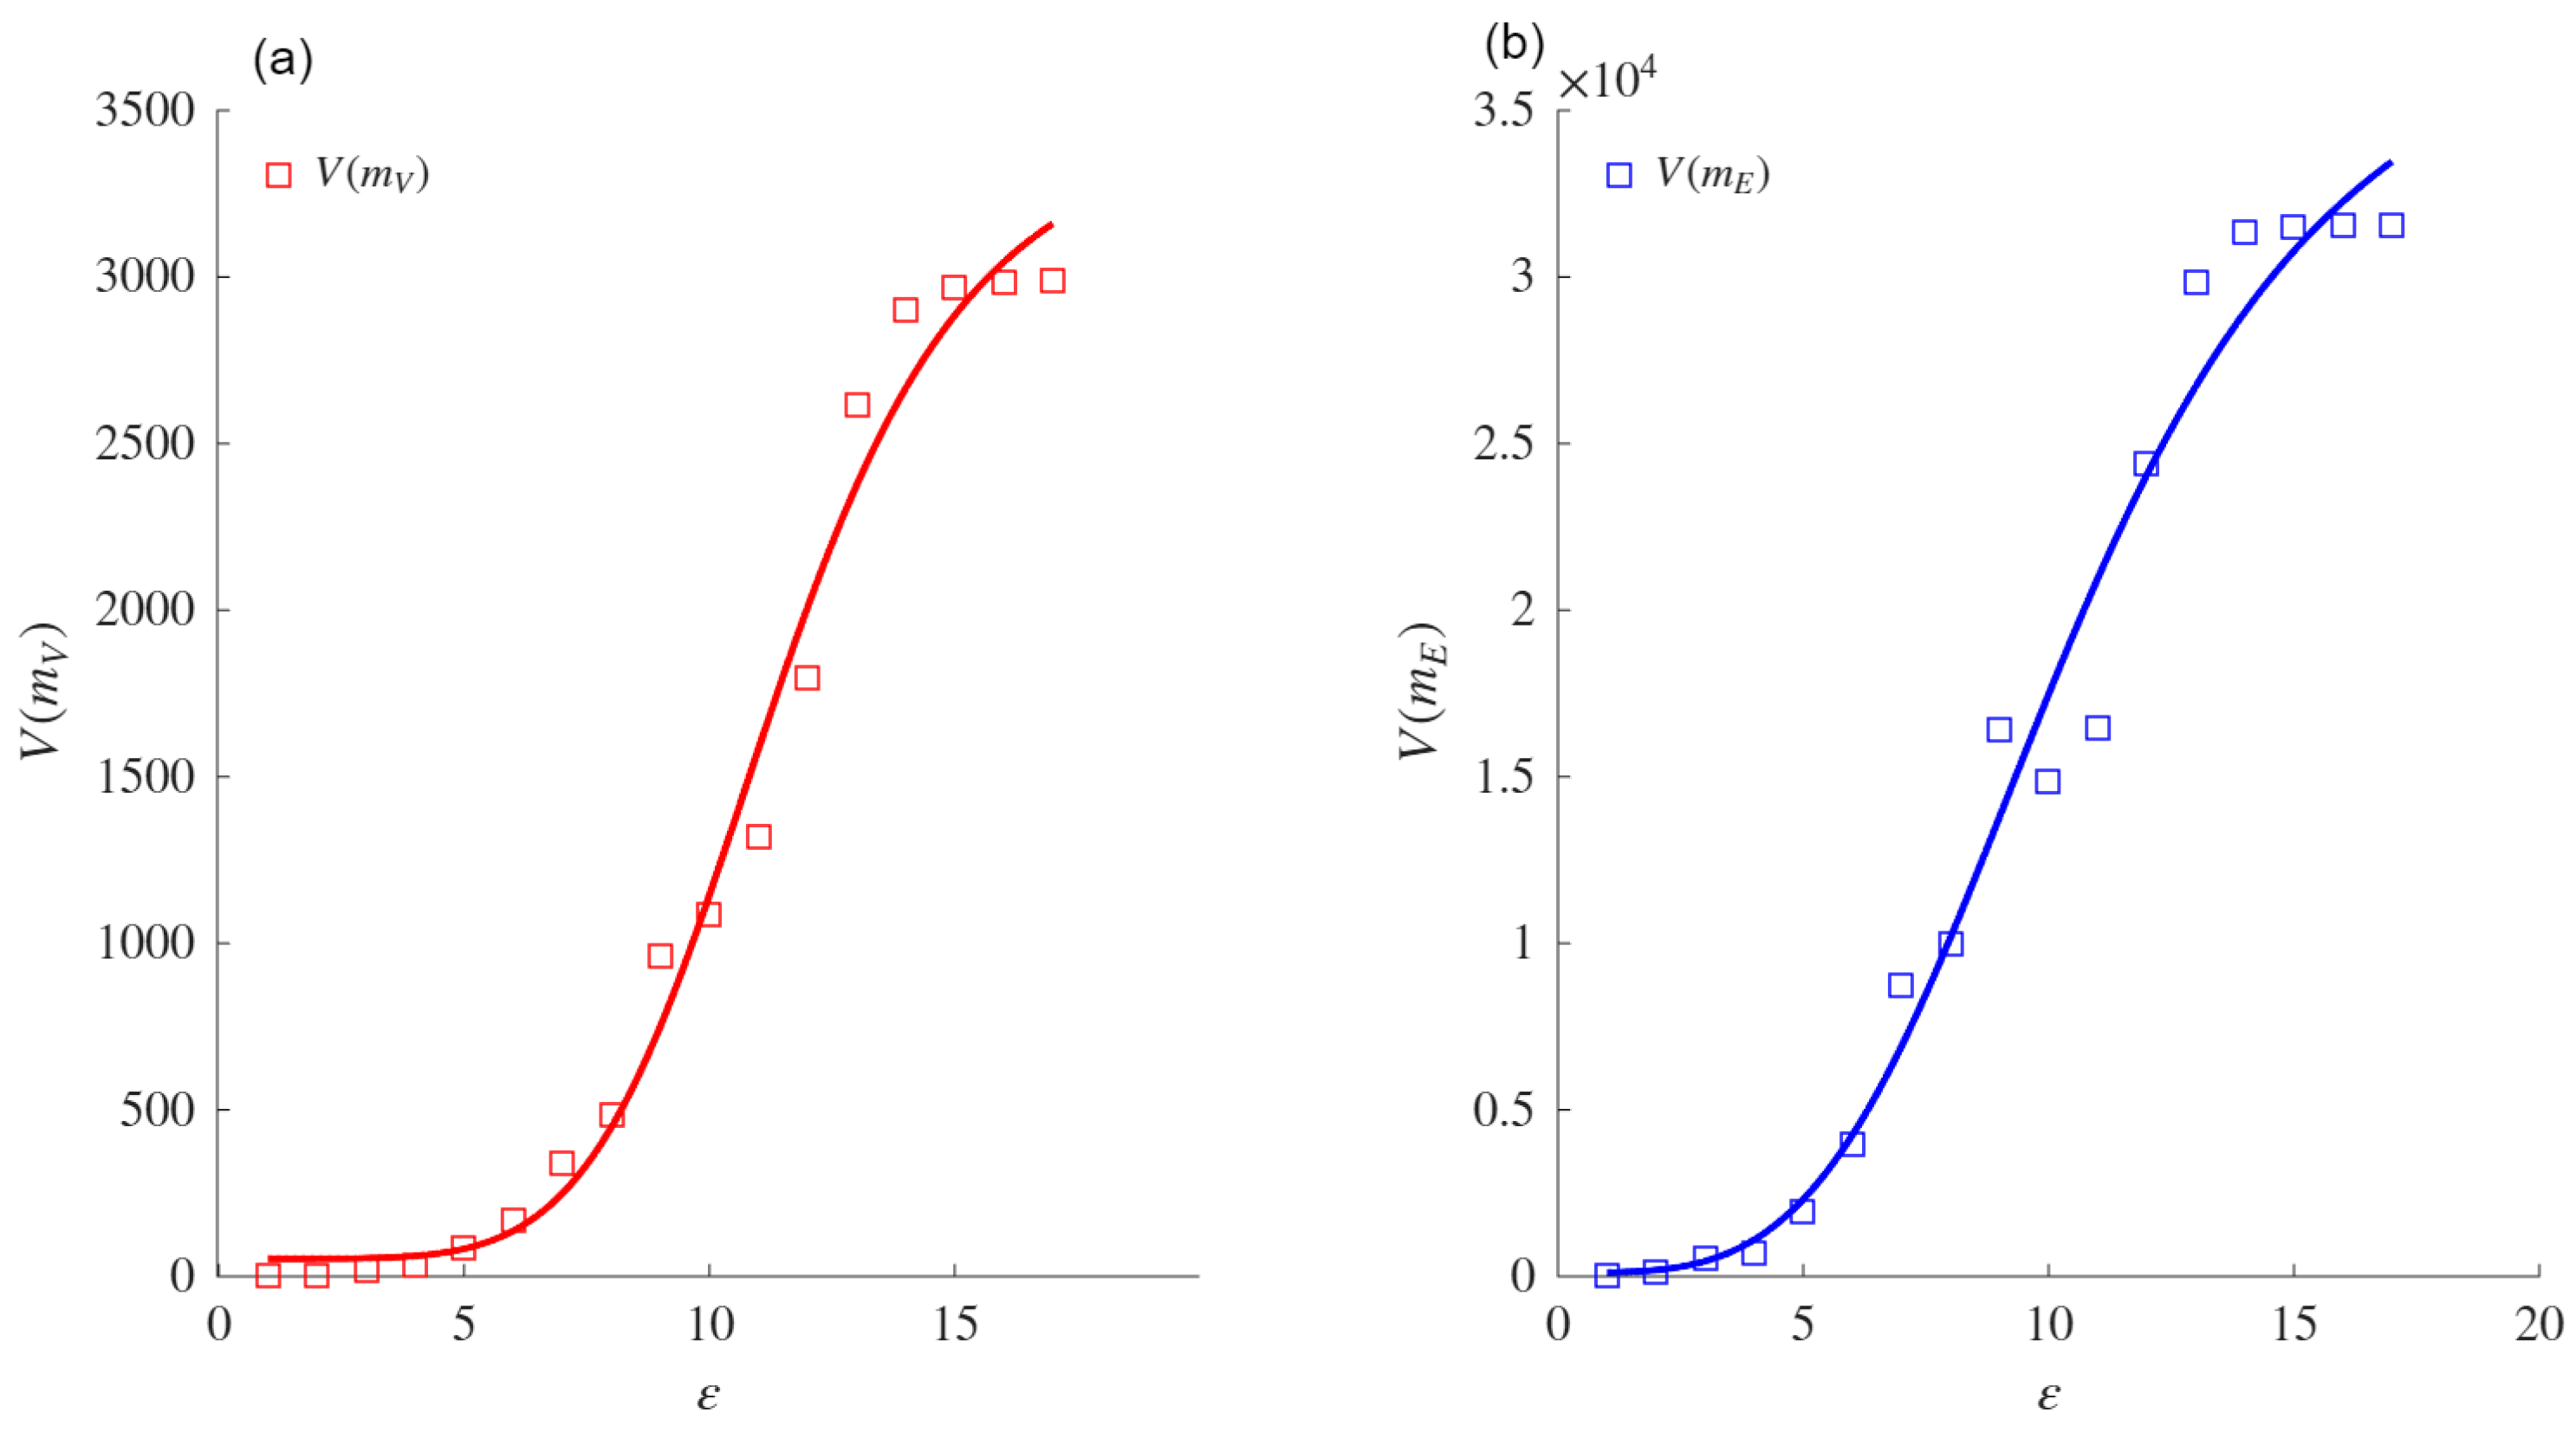
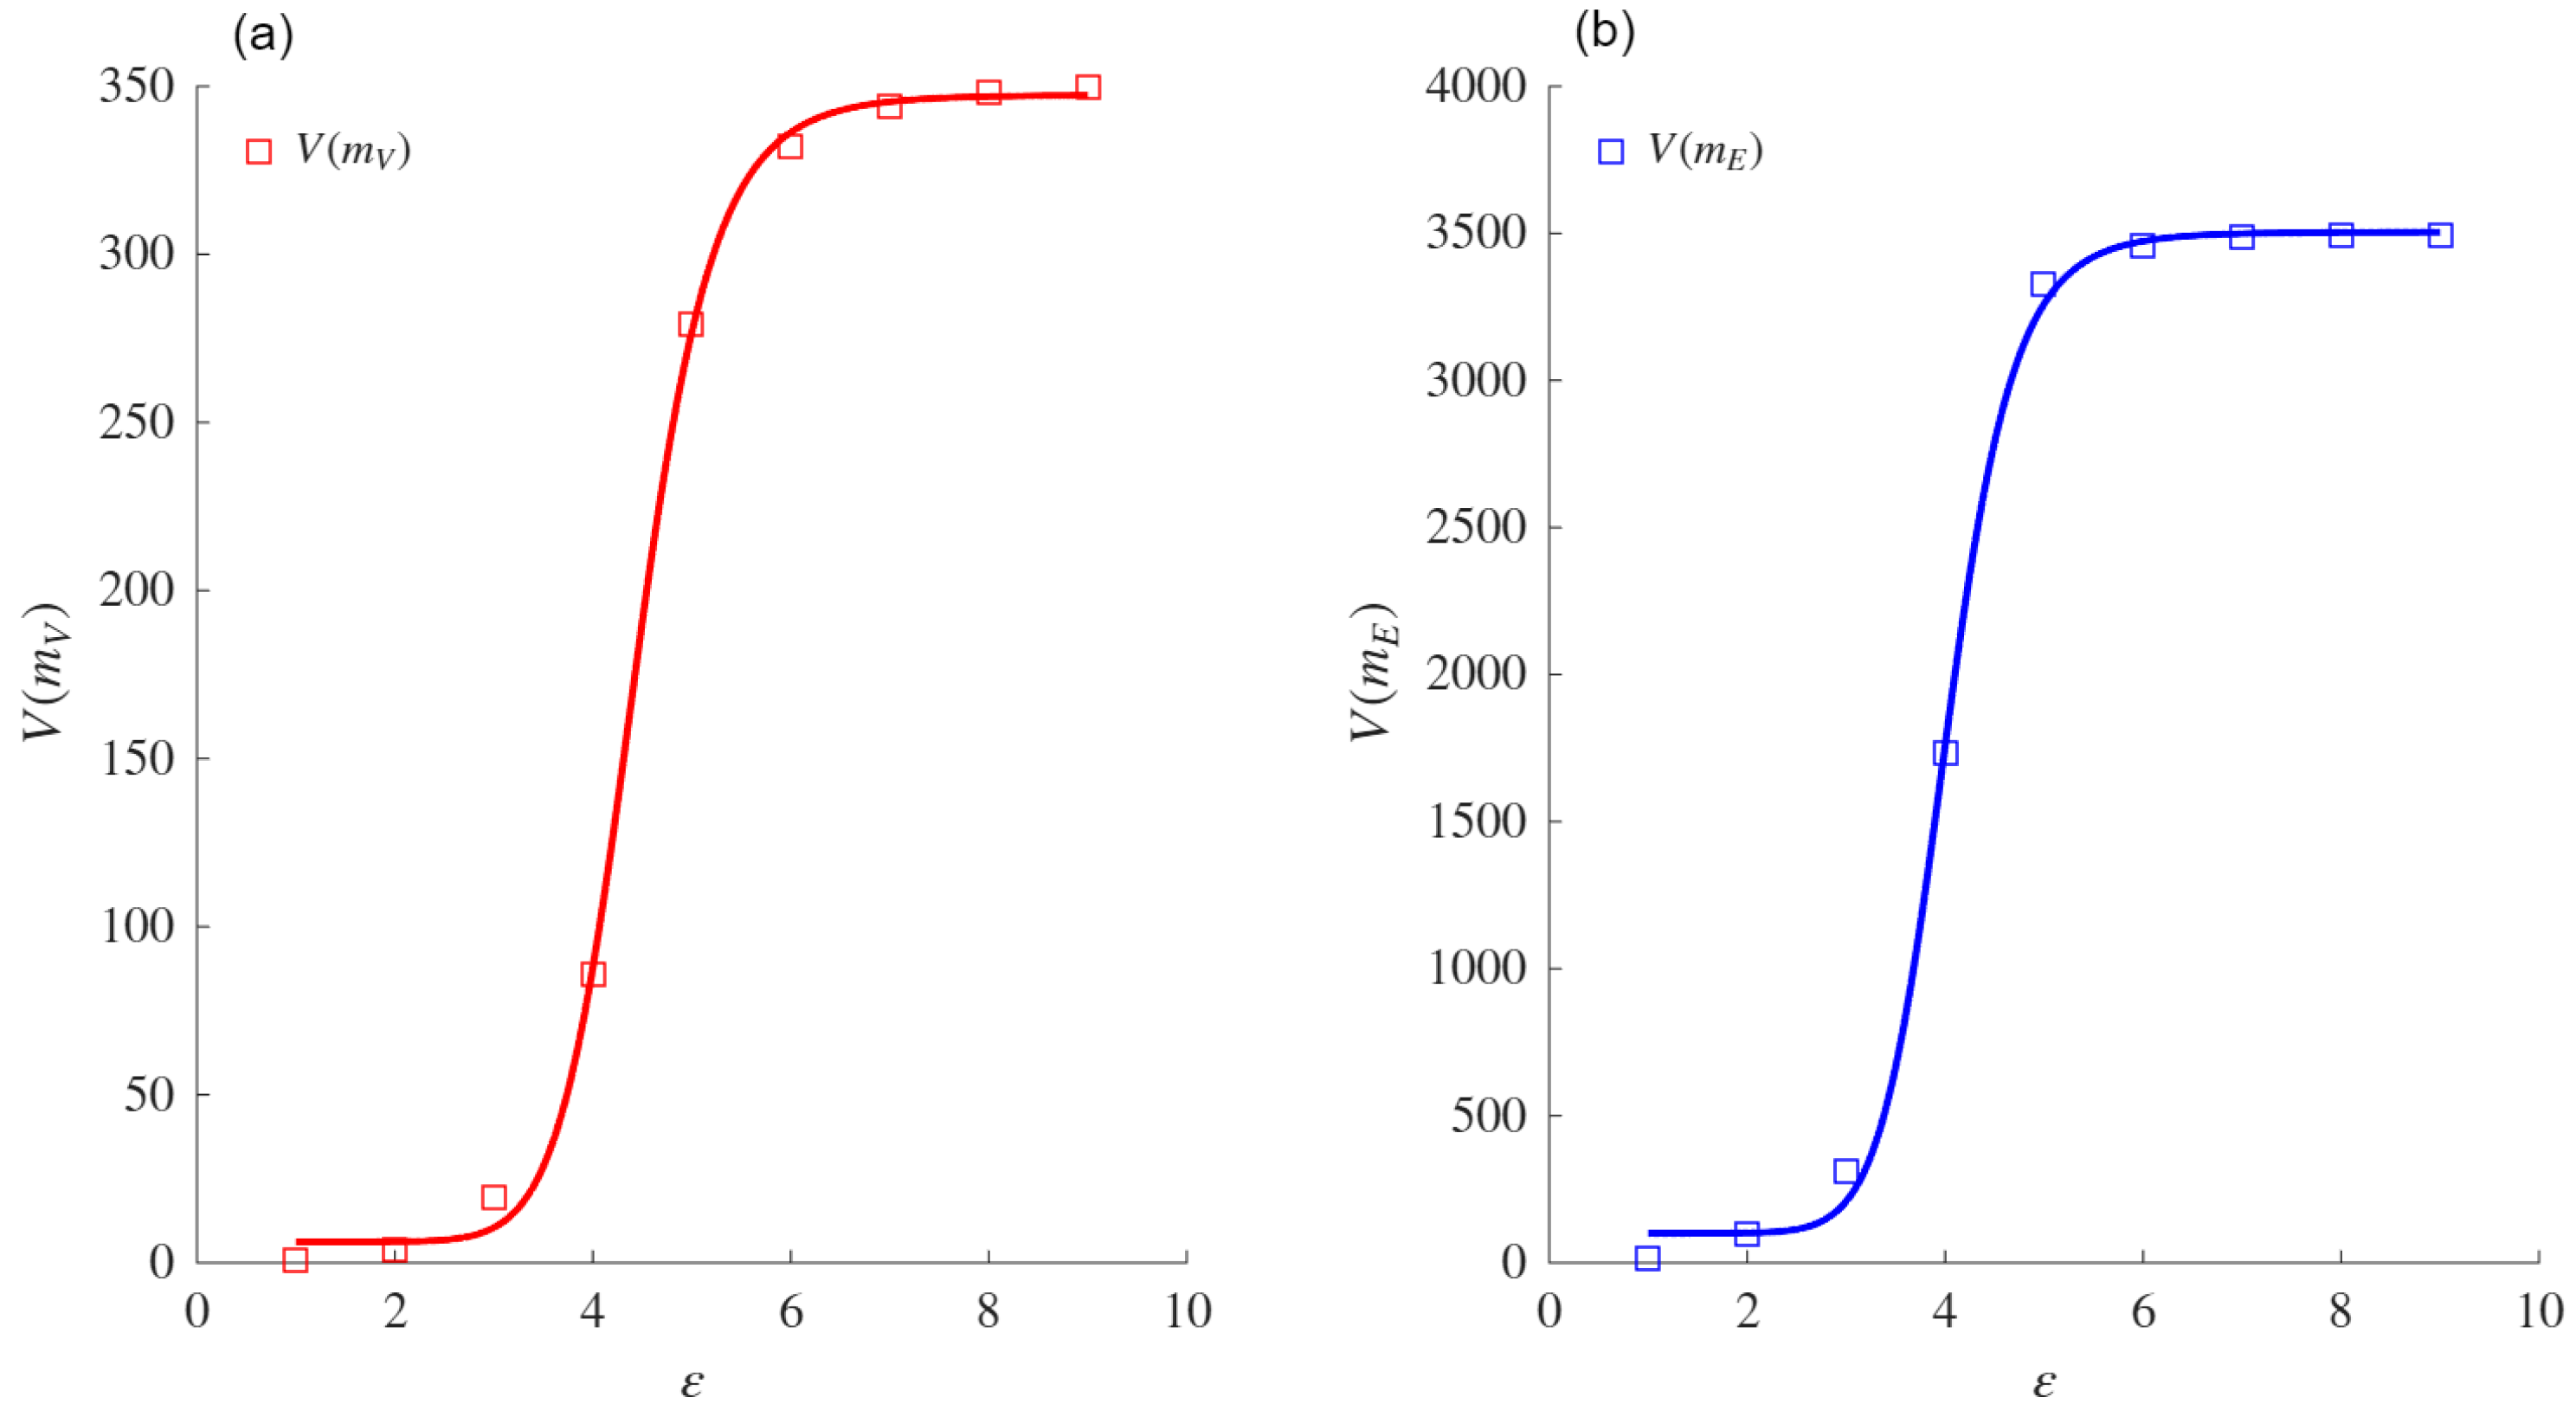
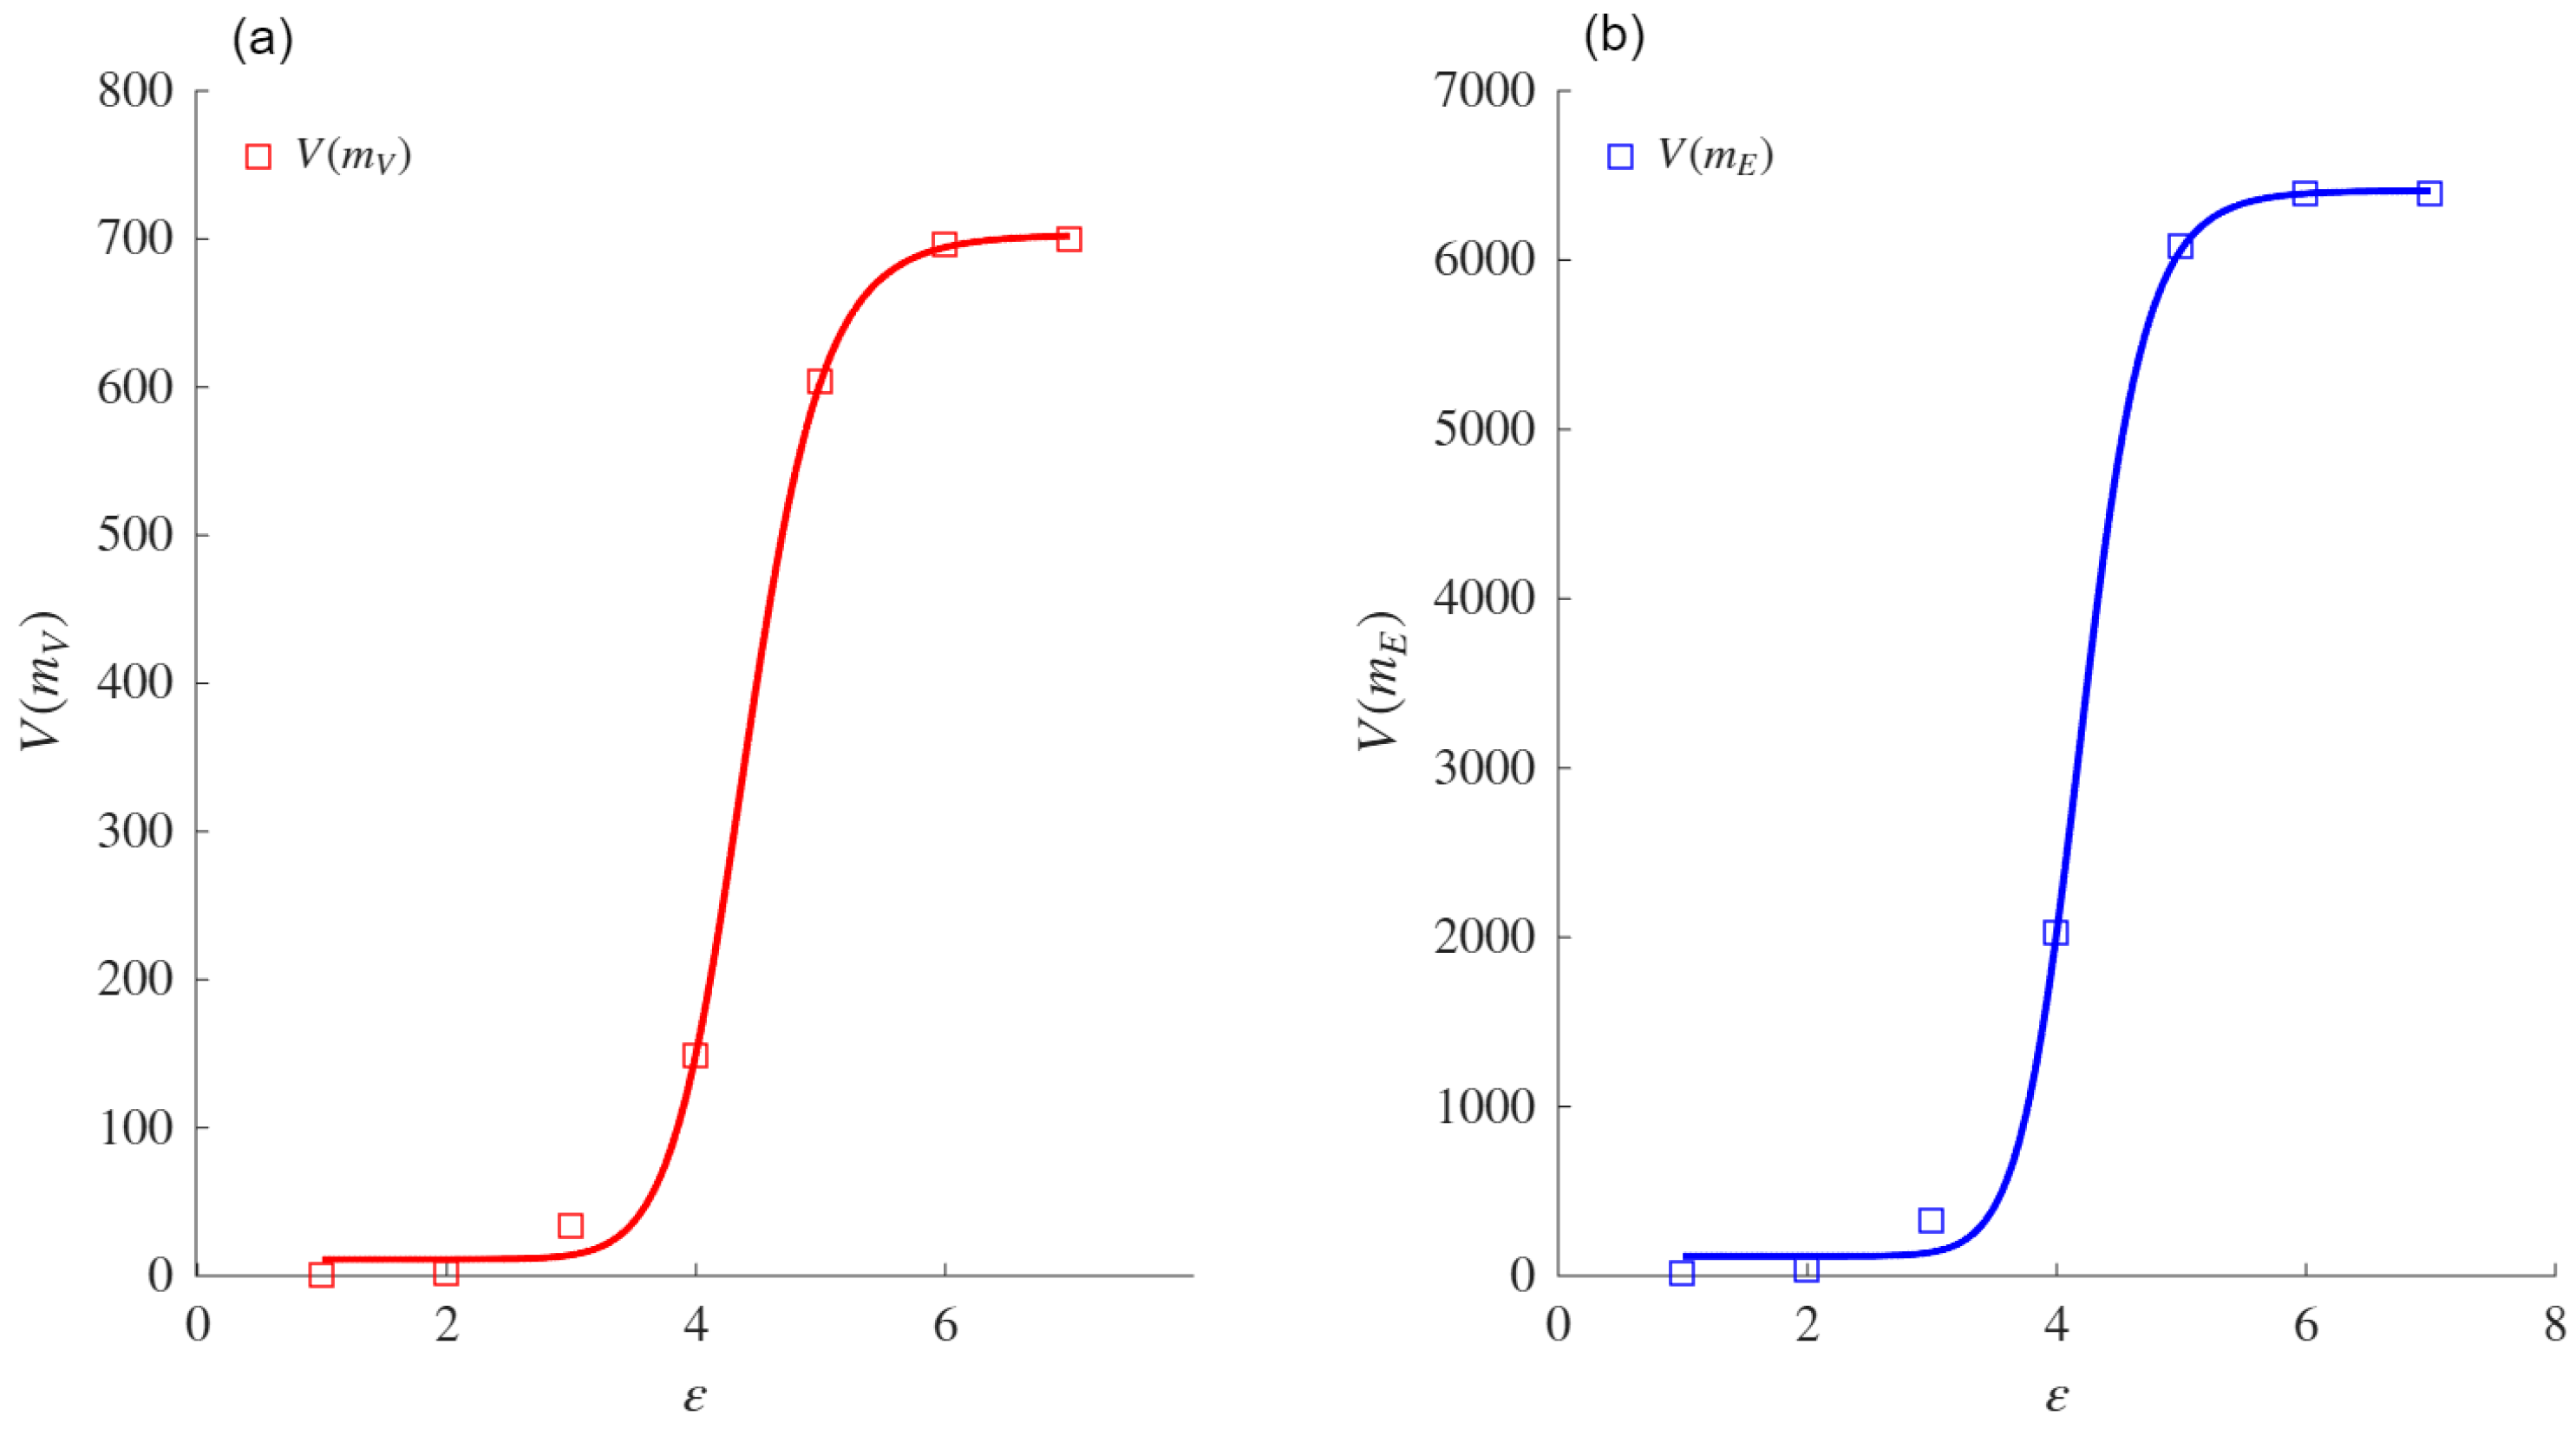
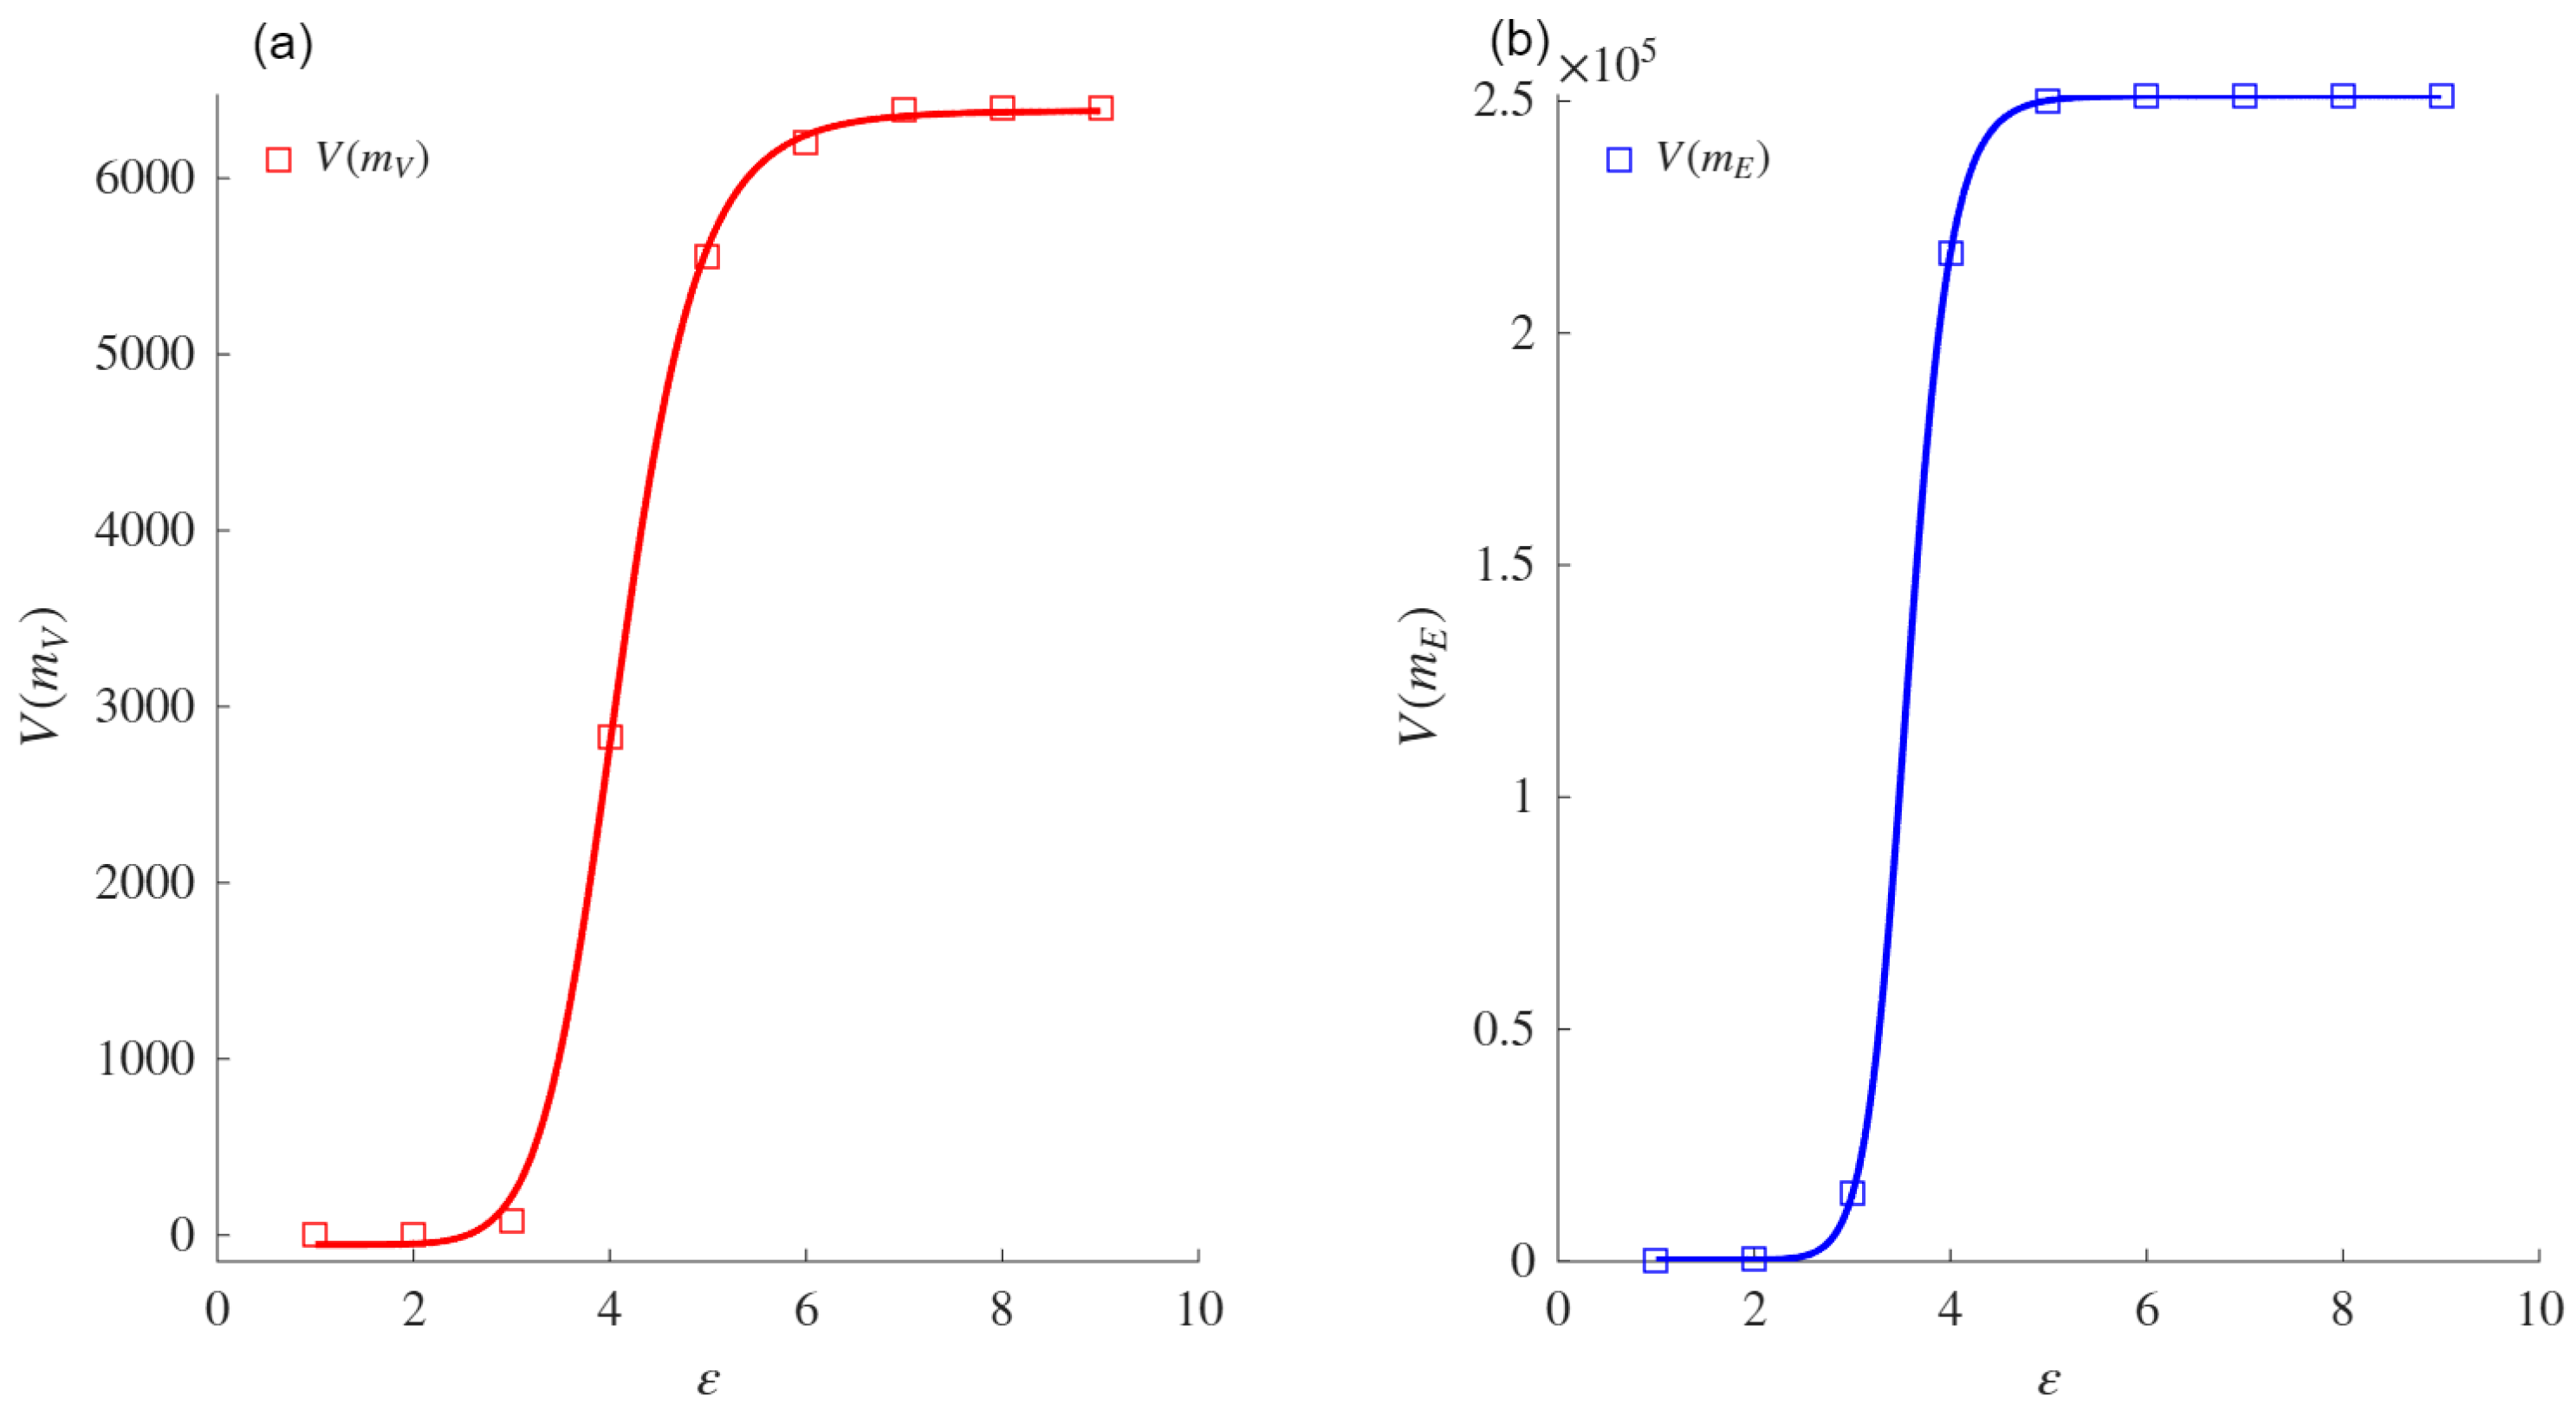
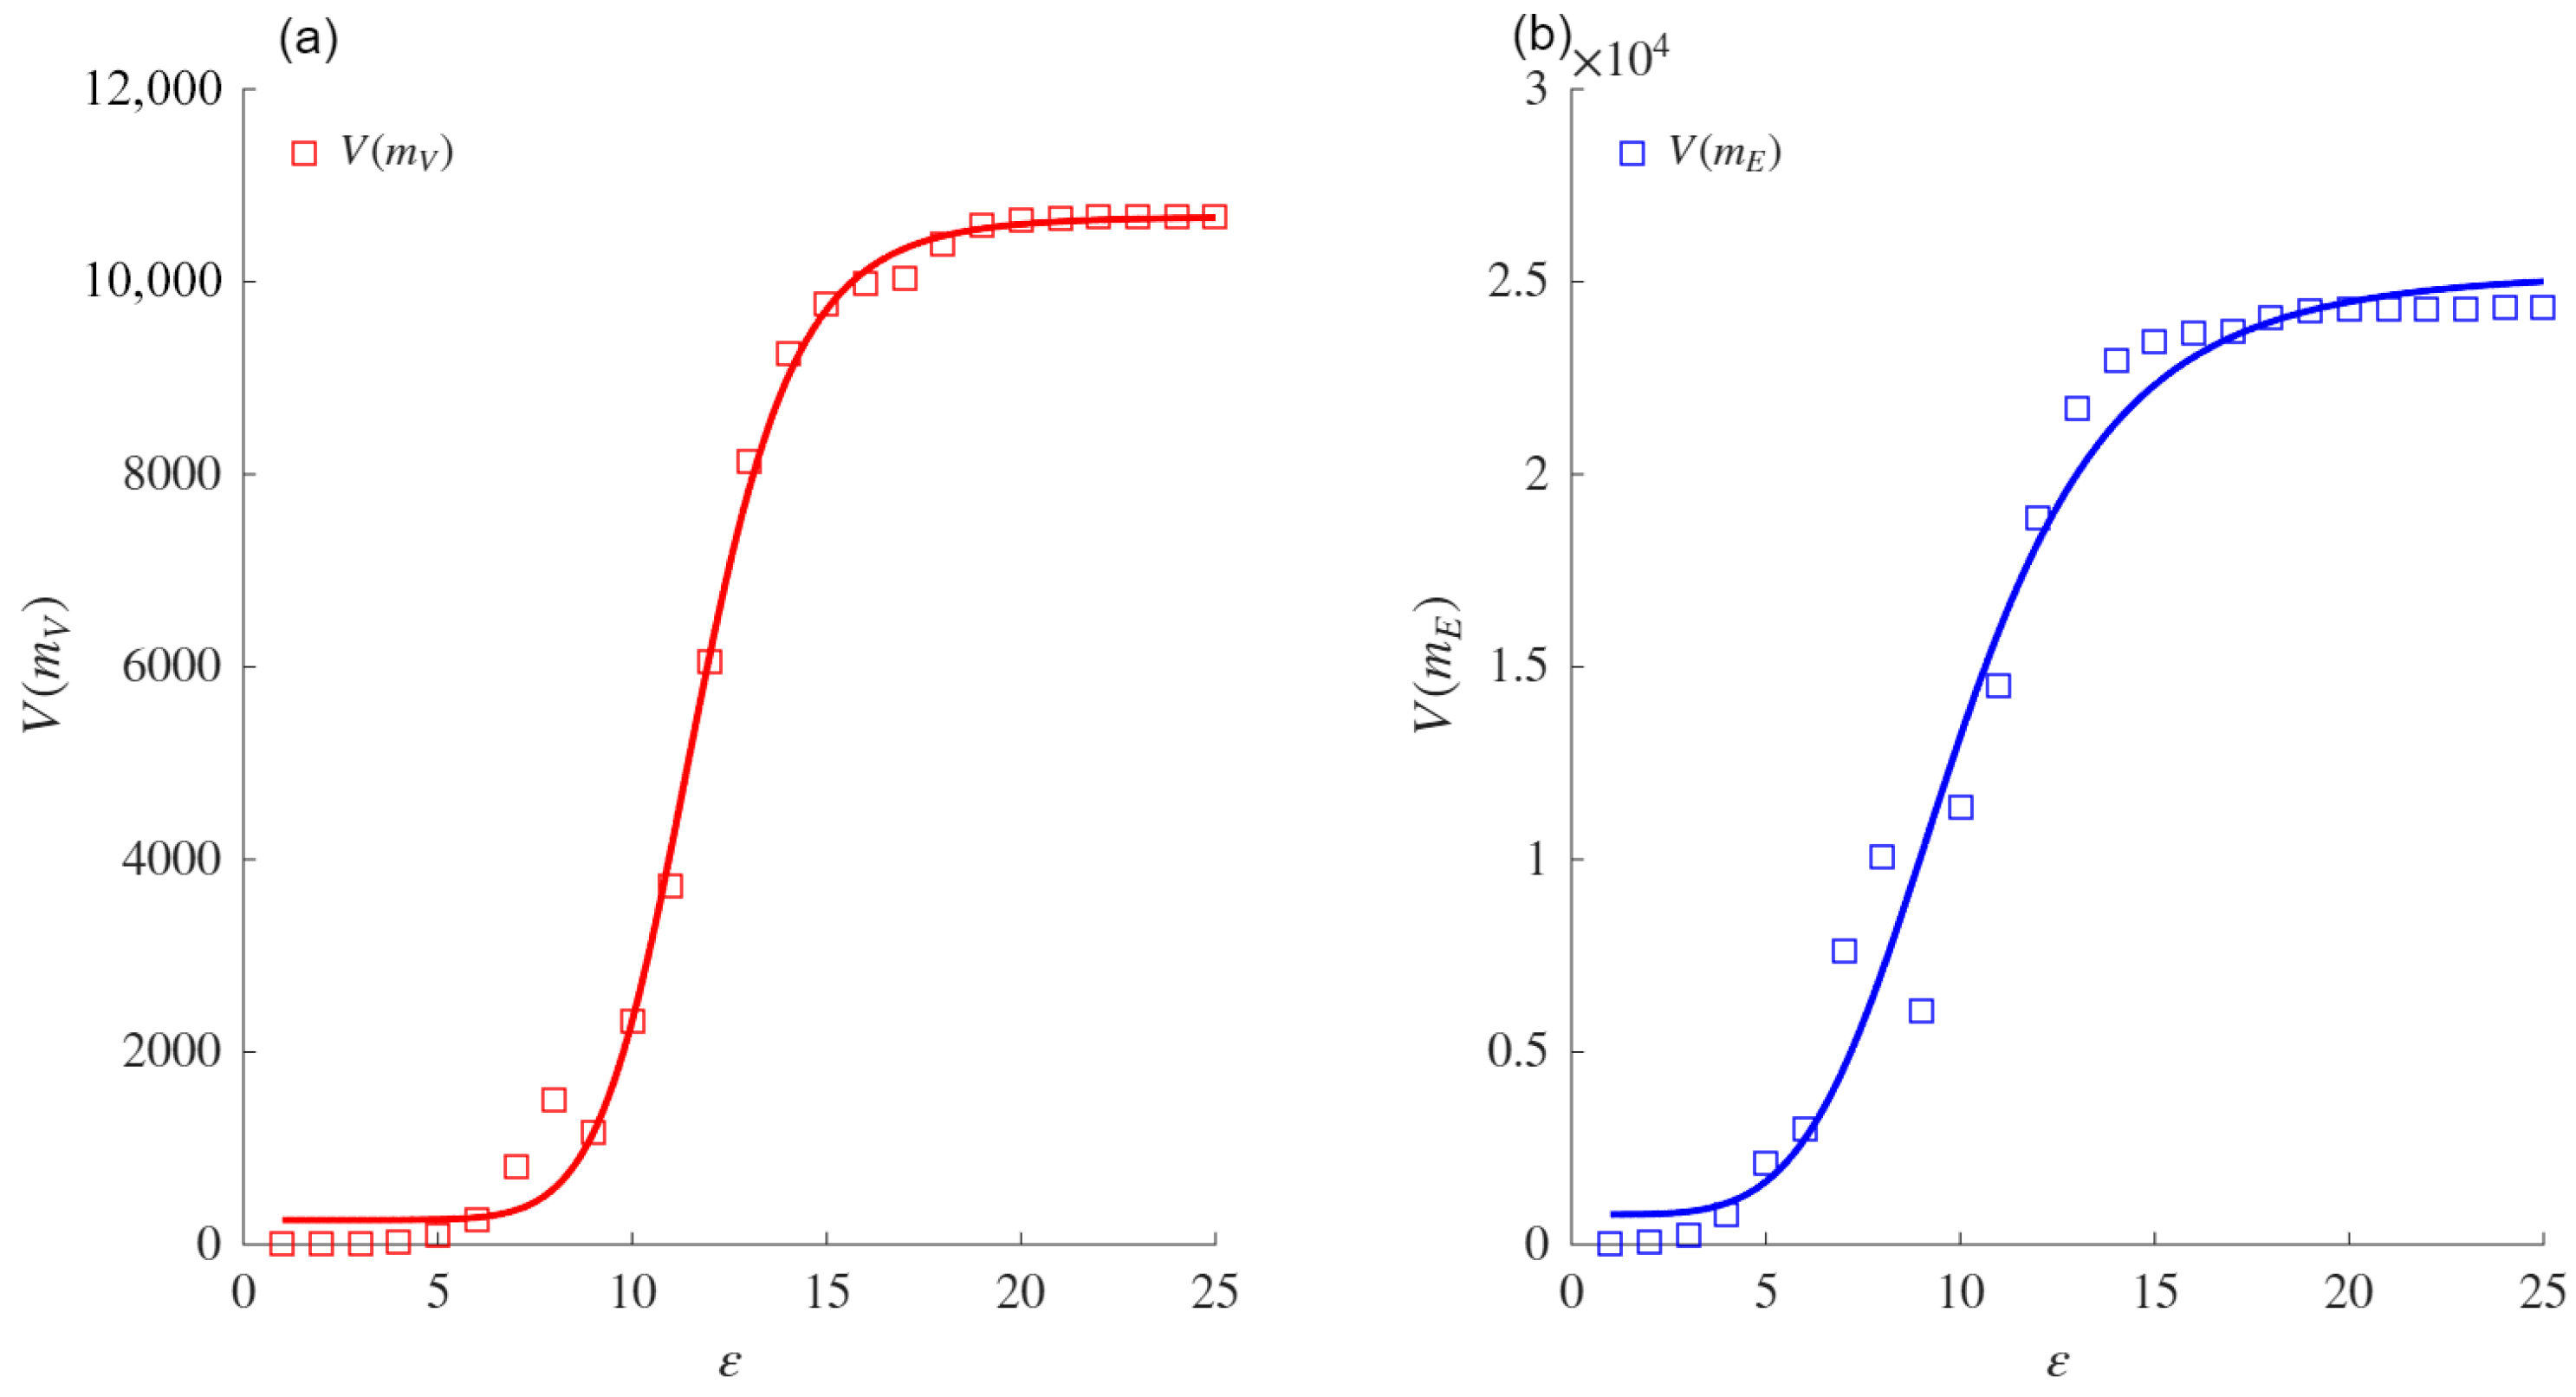
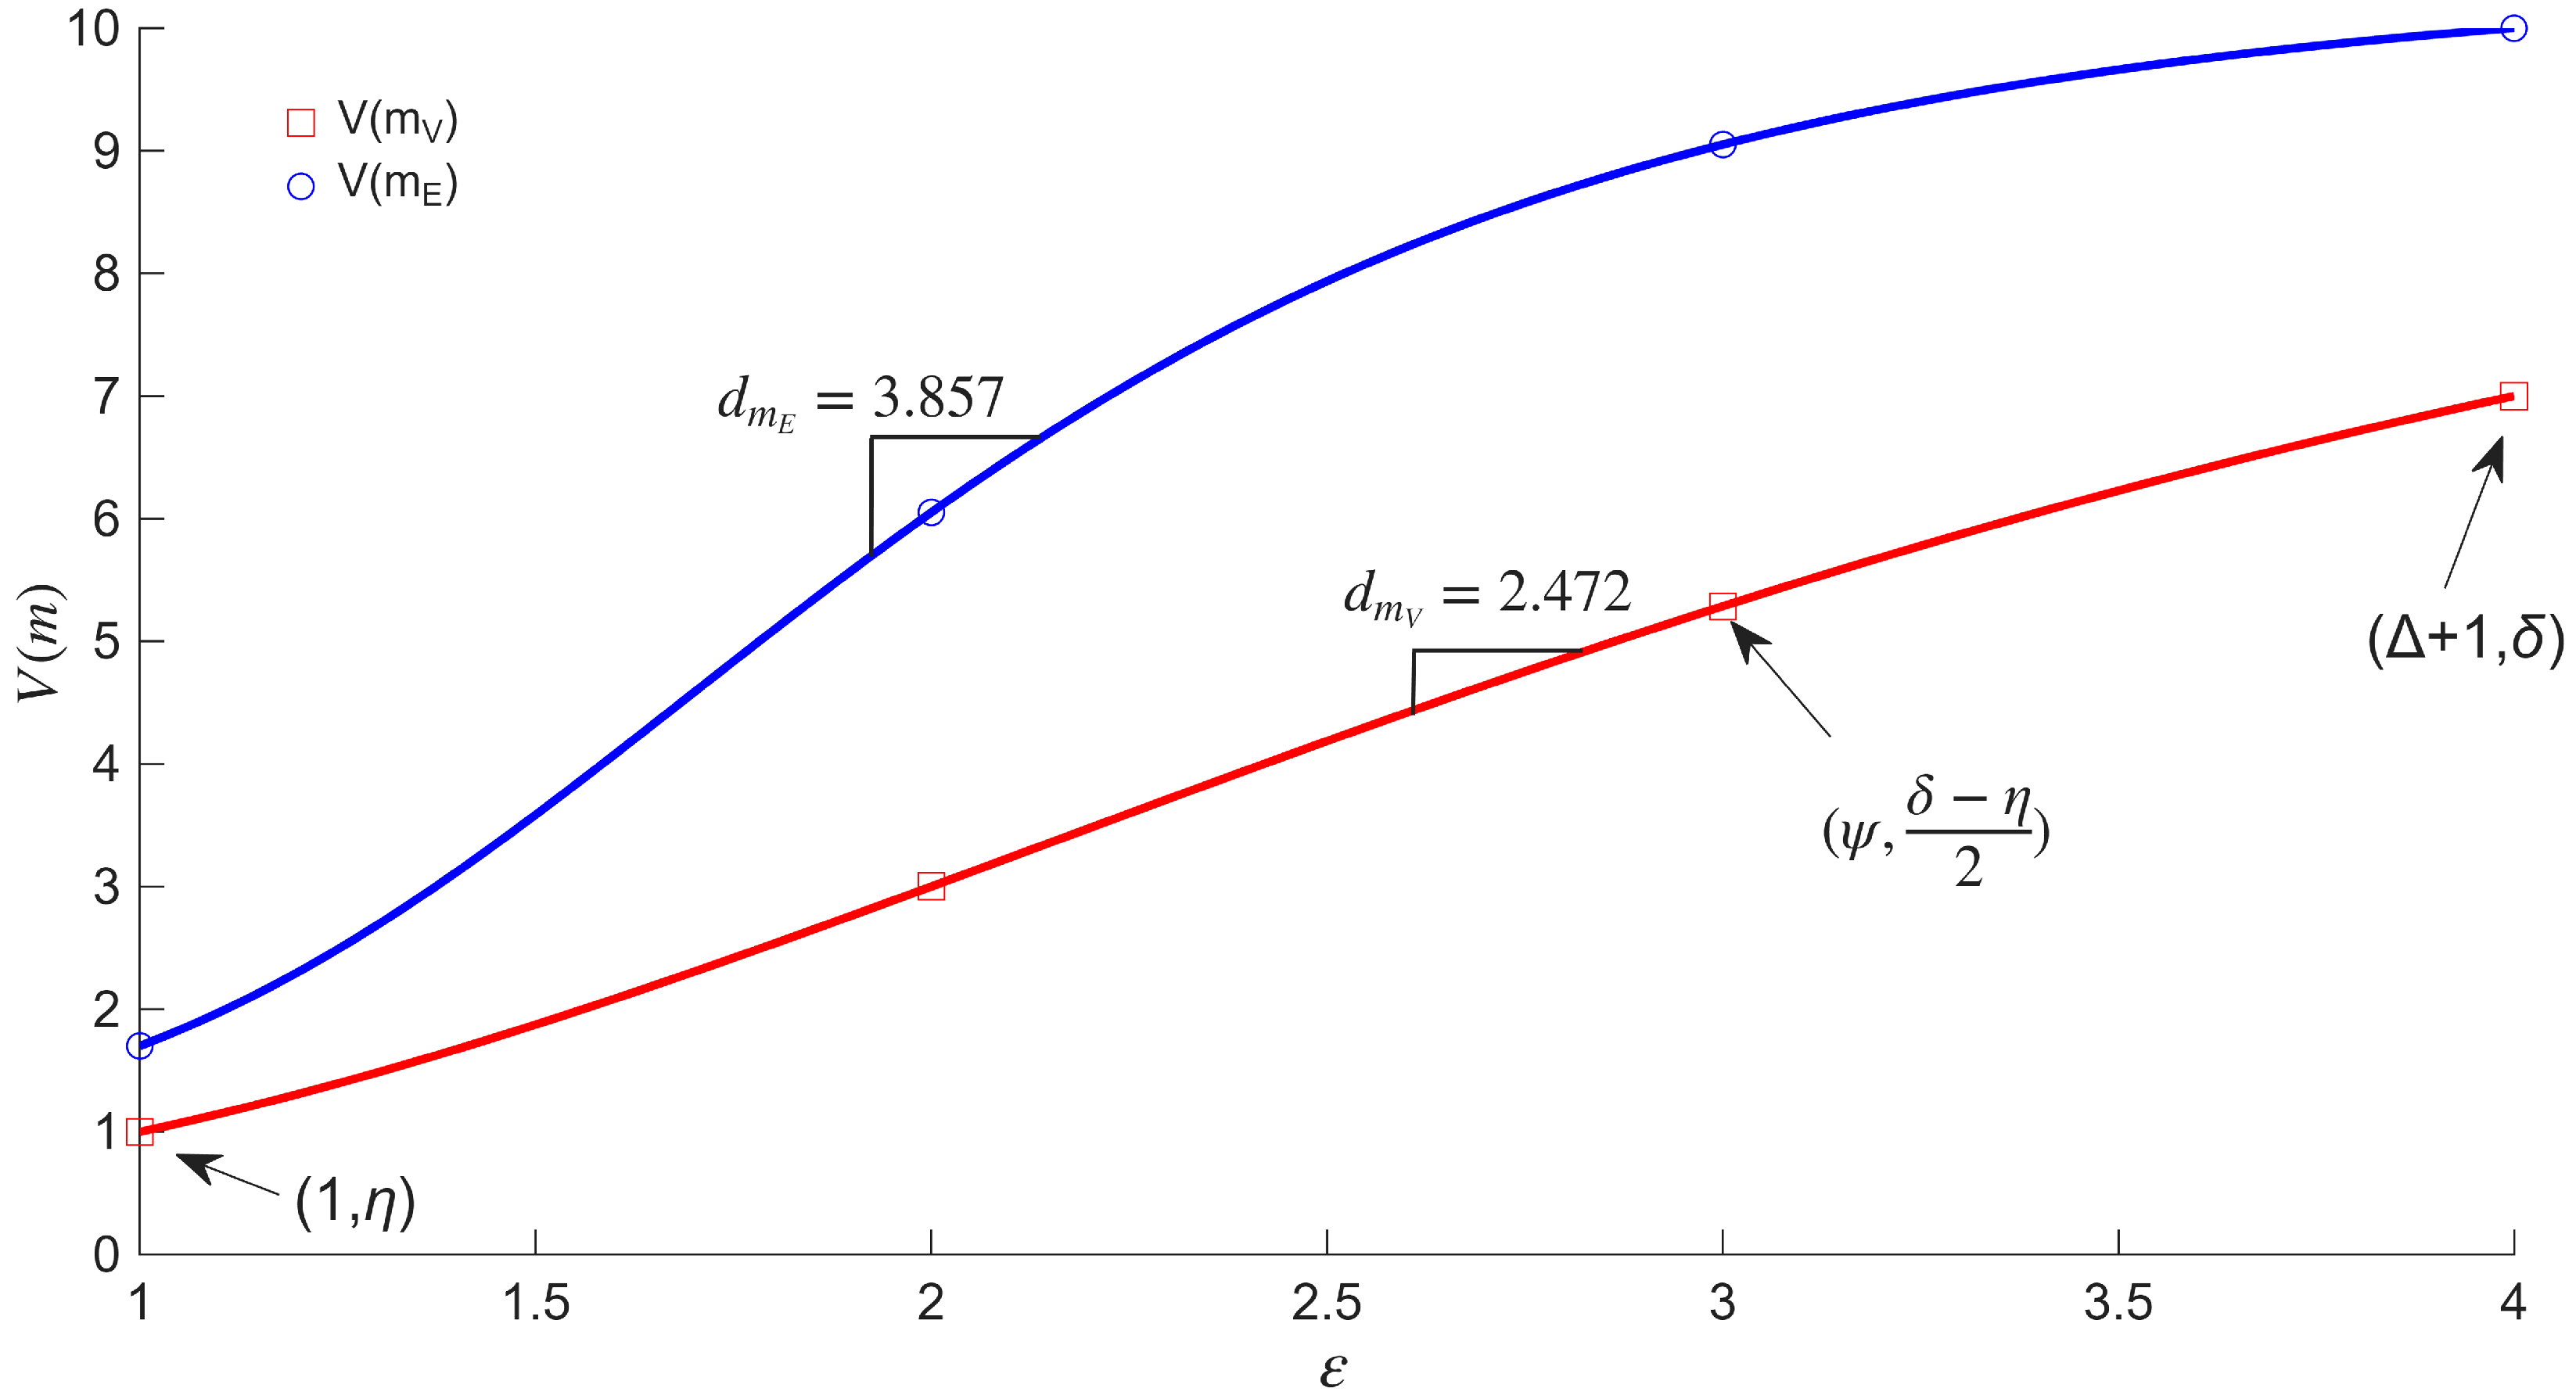
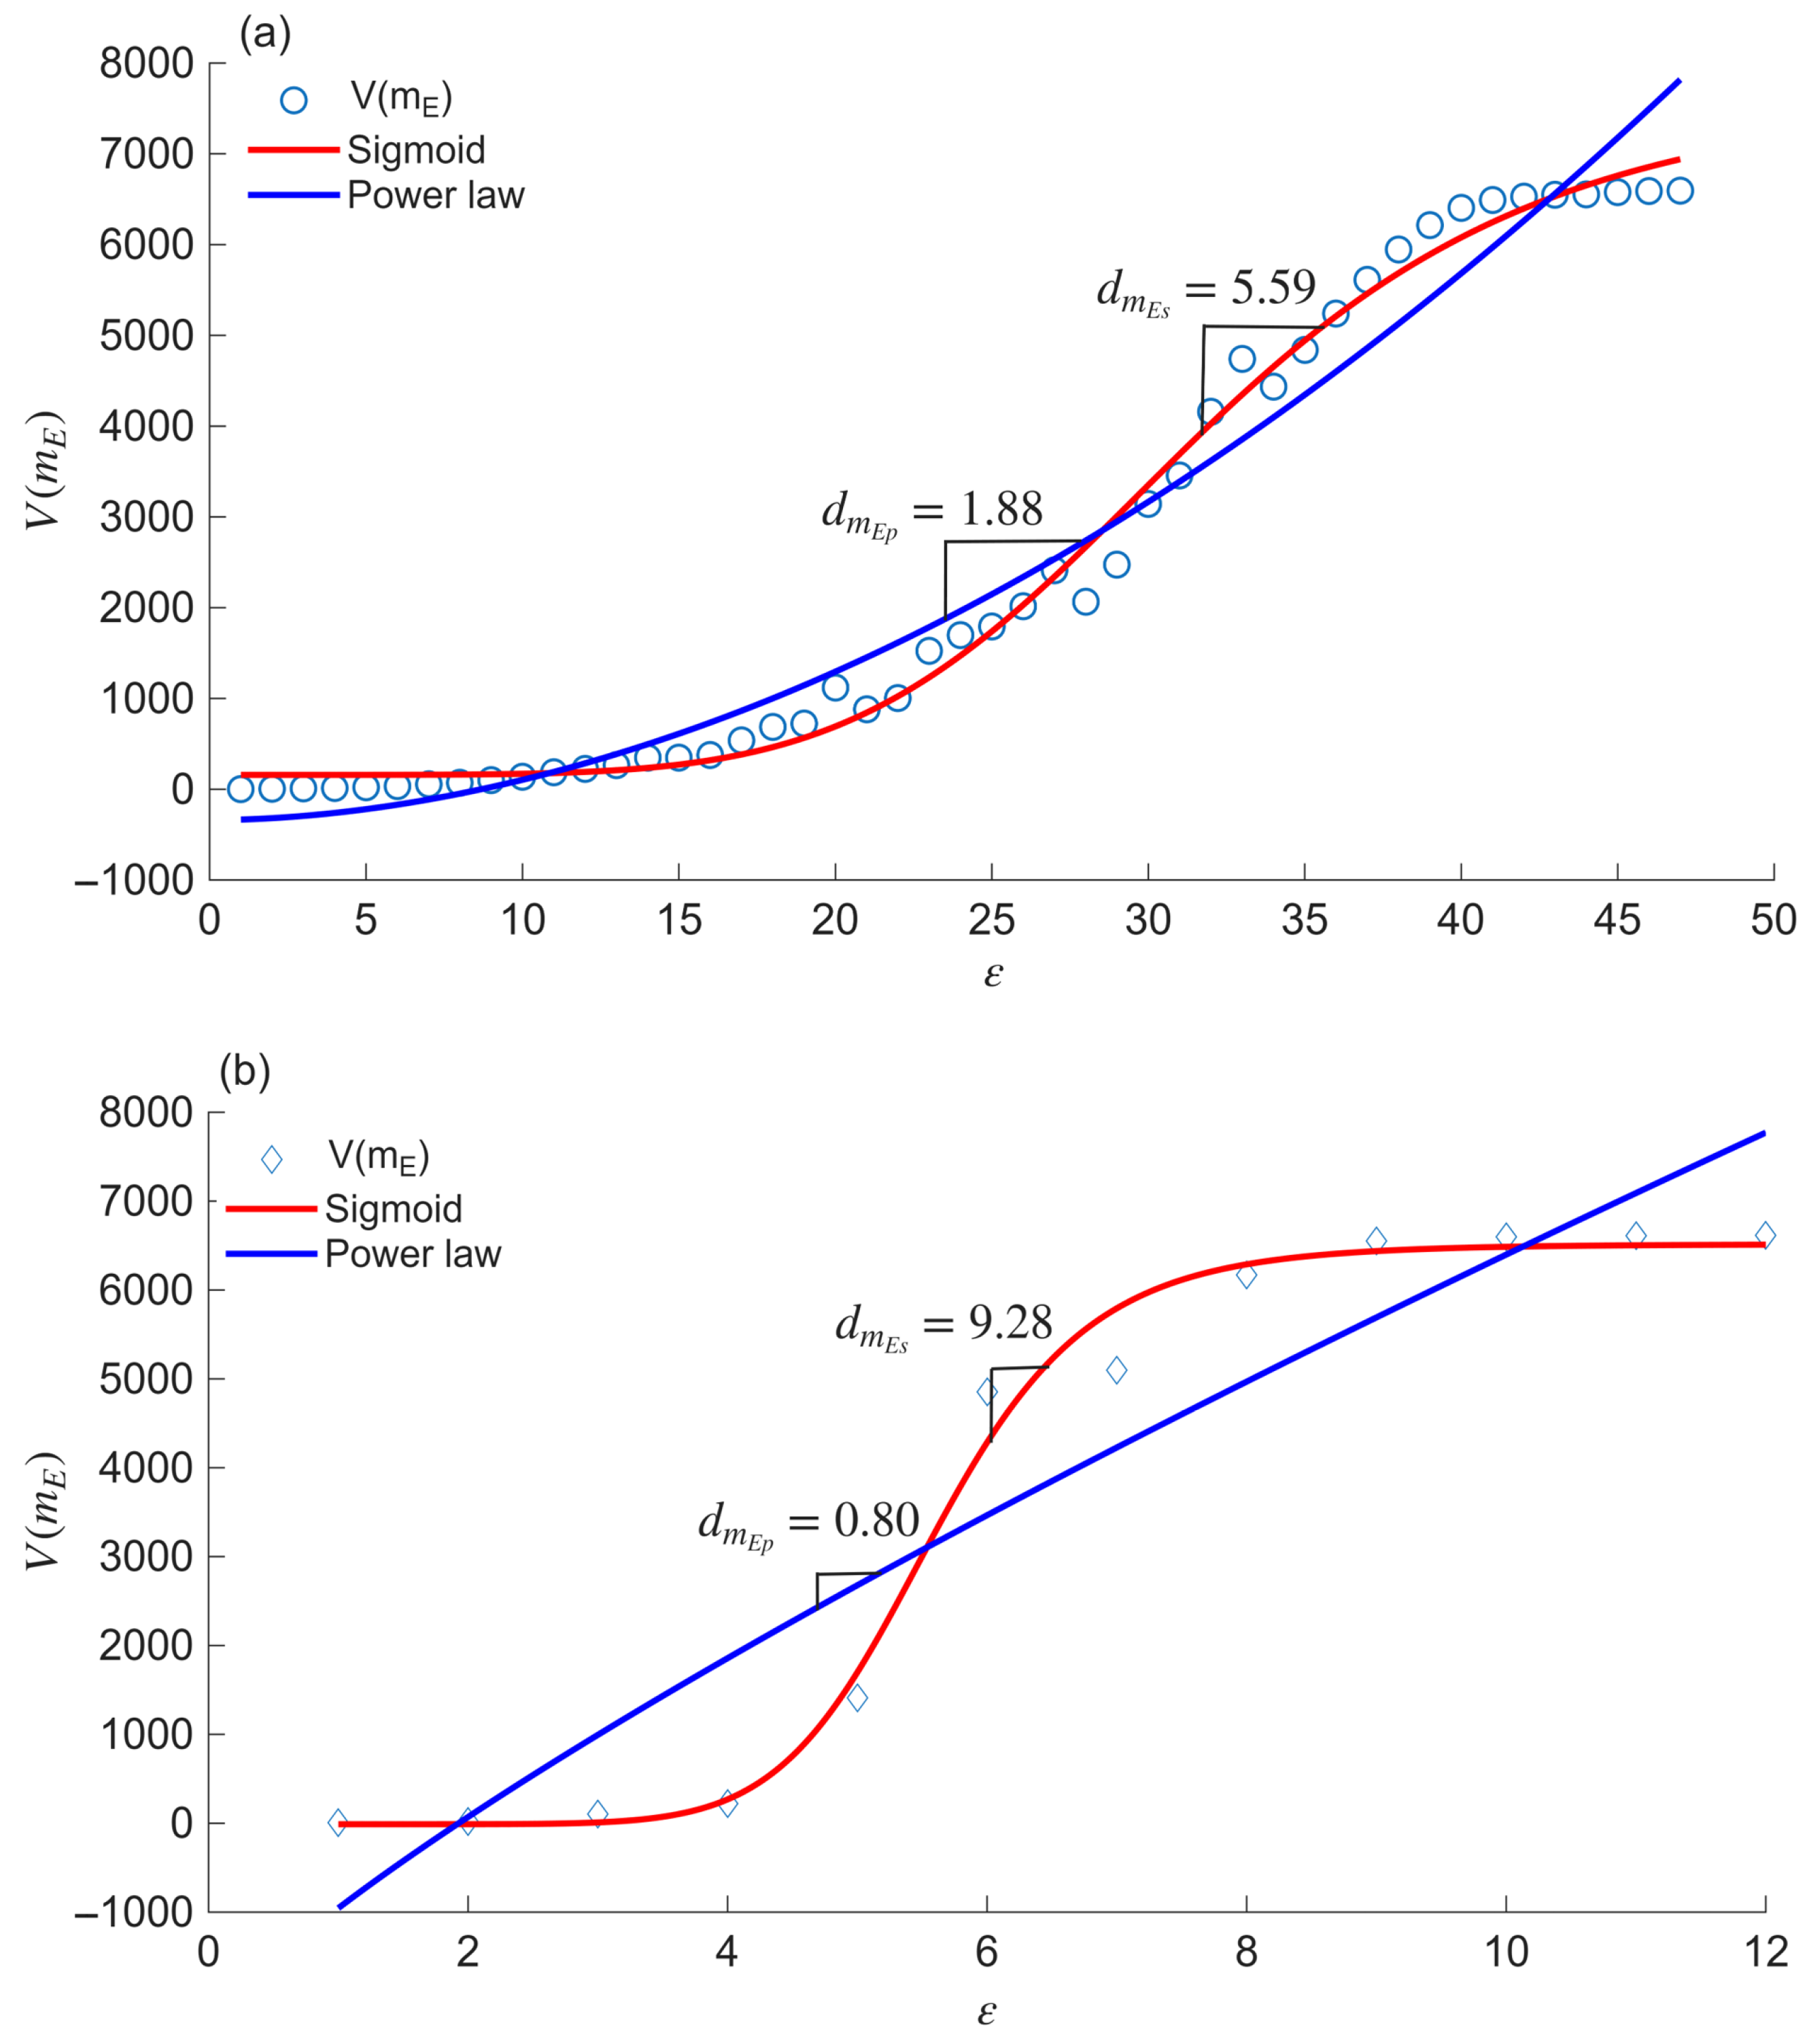
38]. Thus, we introduce the volume dimension of the mass function (VDMF) for a complex network based on a sigmoid asymptote of Equations (
13) and (
14) as follows:
where
m is the given mass function,
is the size of the boxes to cover the network of diameter
(i.e.,
), and
and
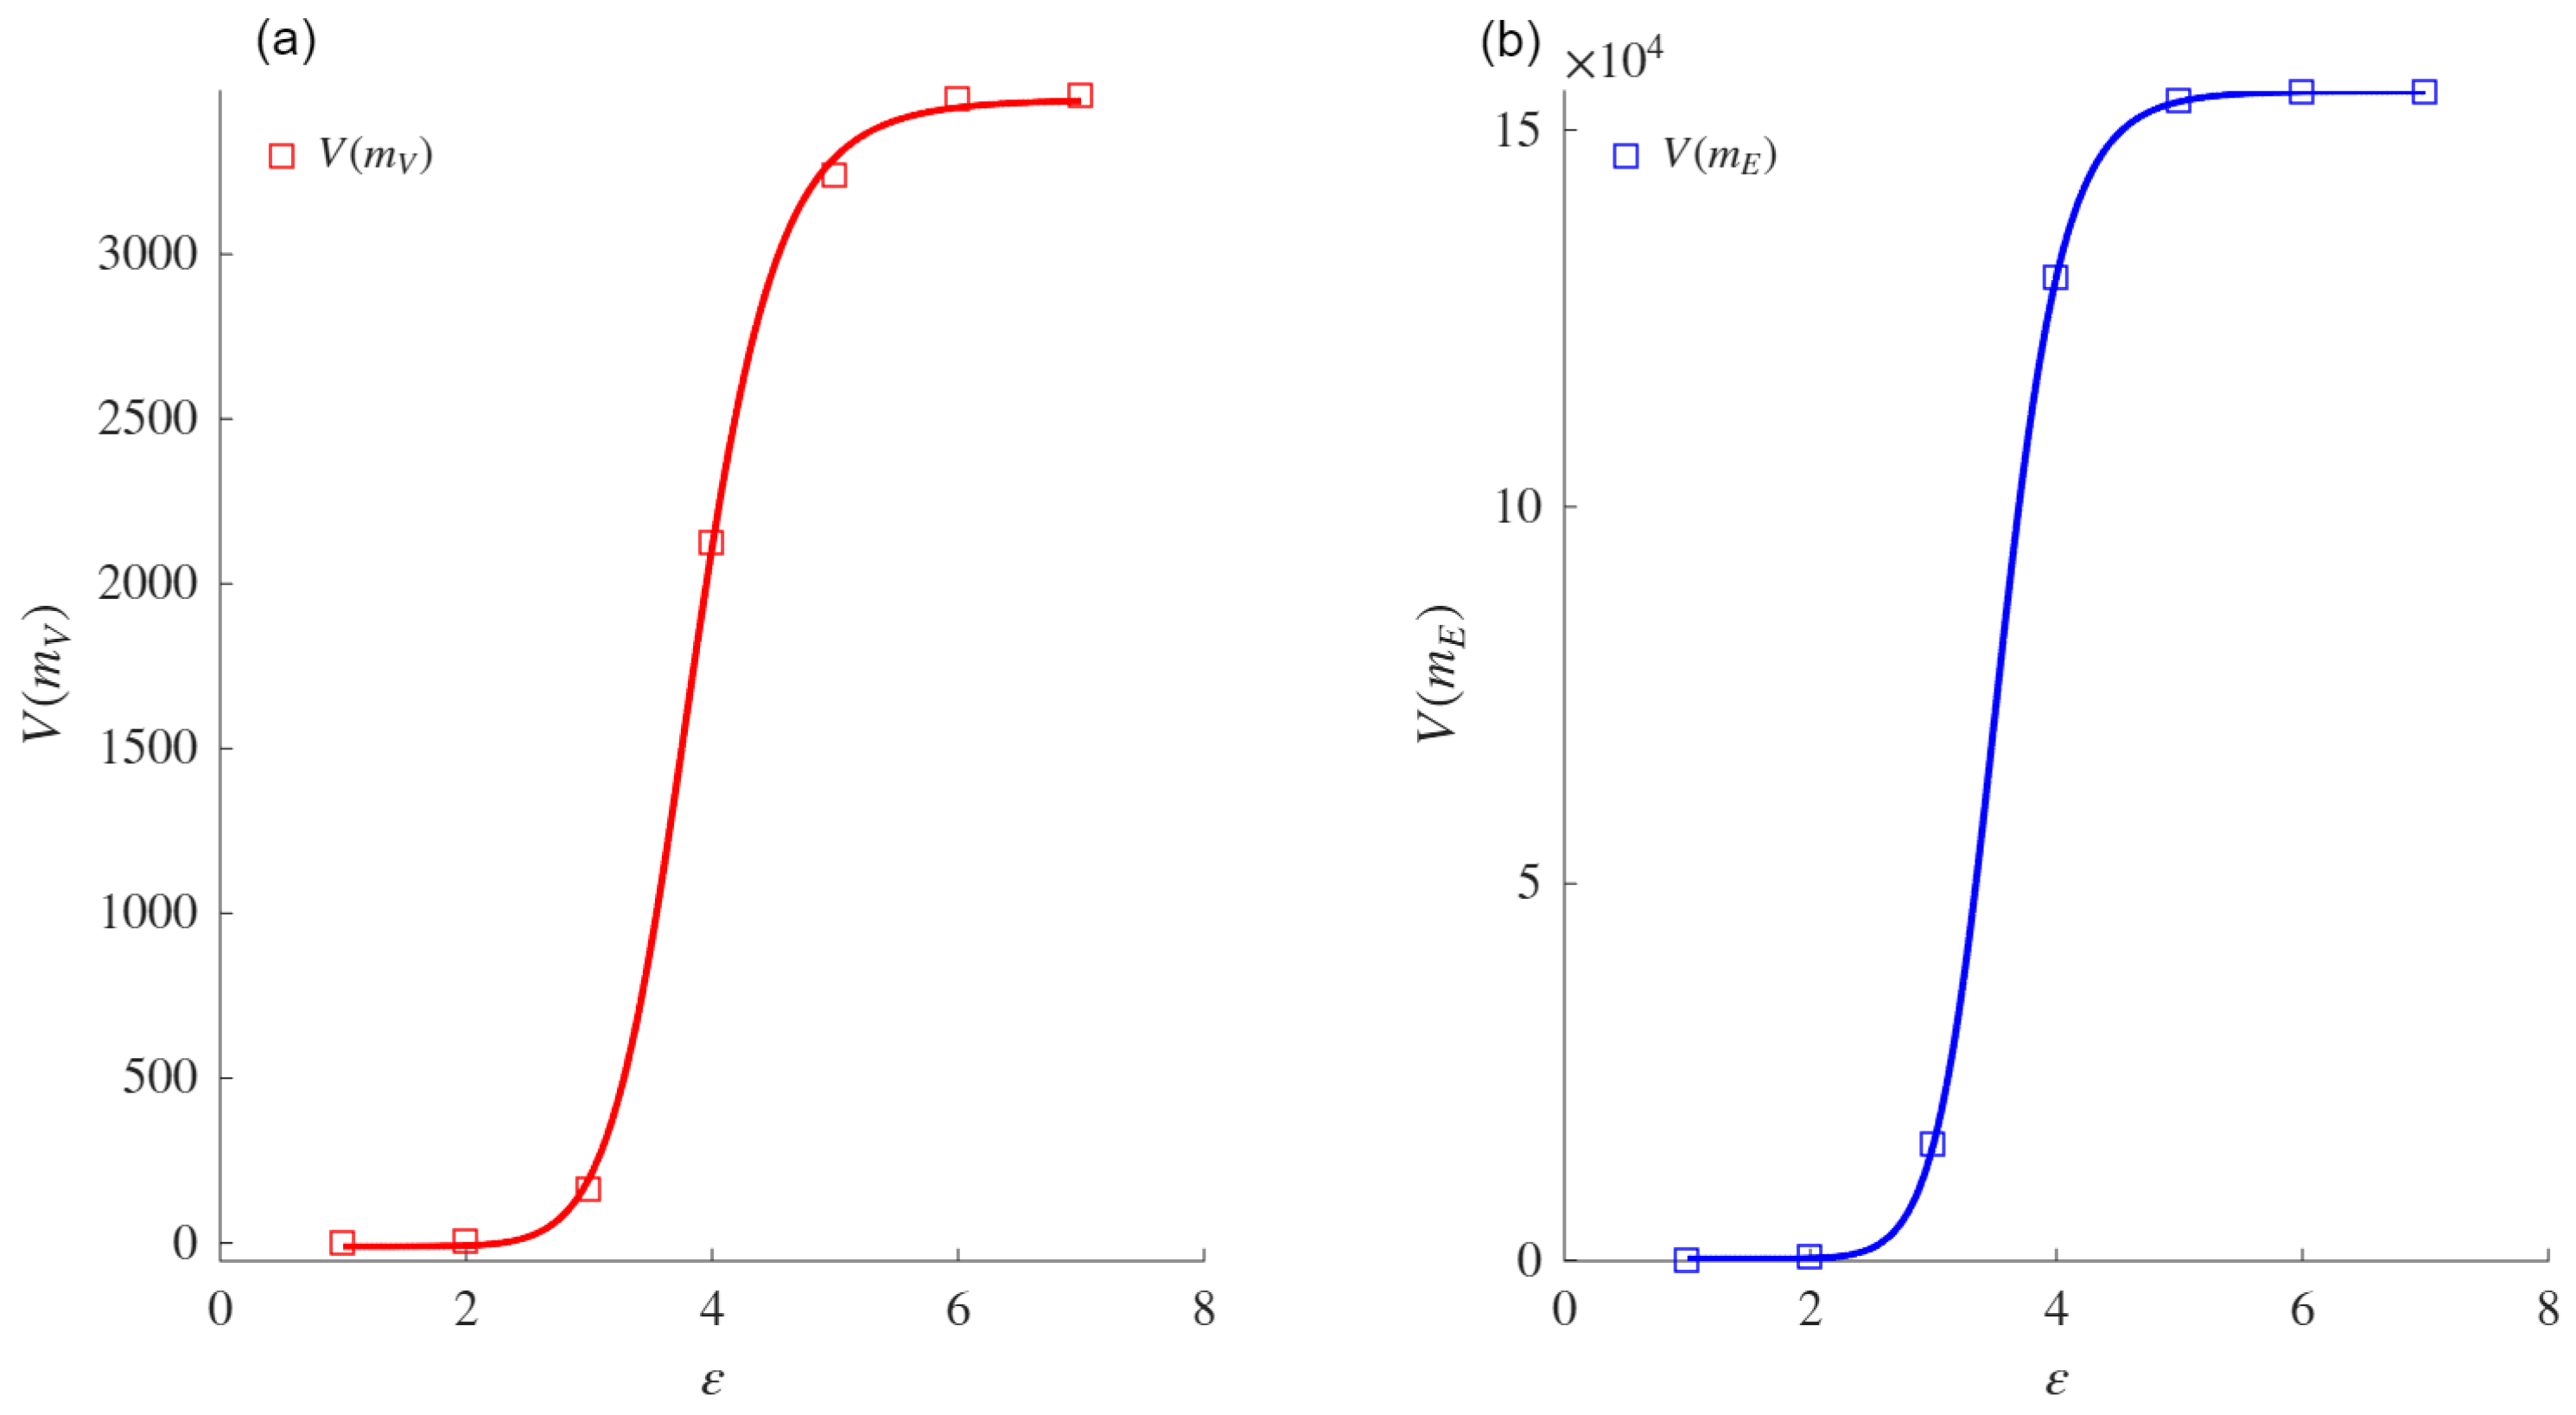
are the asymptotic values for
and
, respectively; these two points are shown in
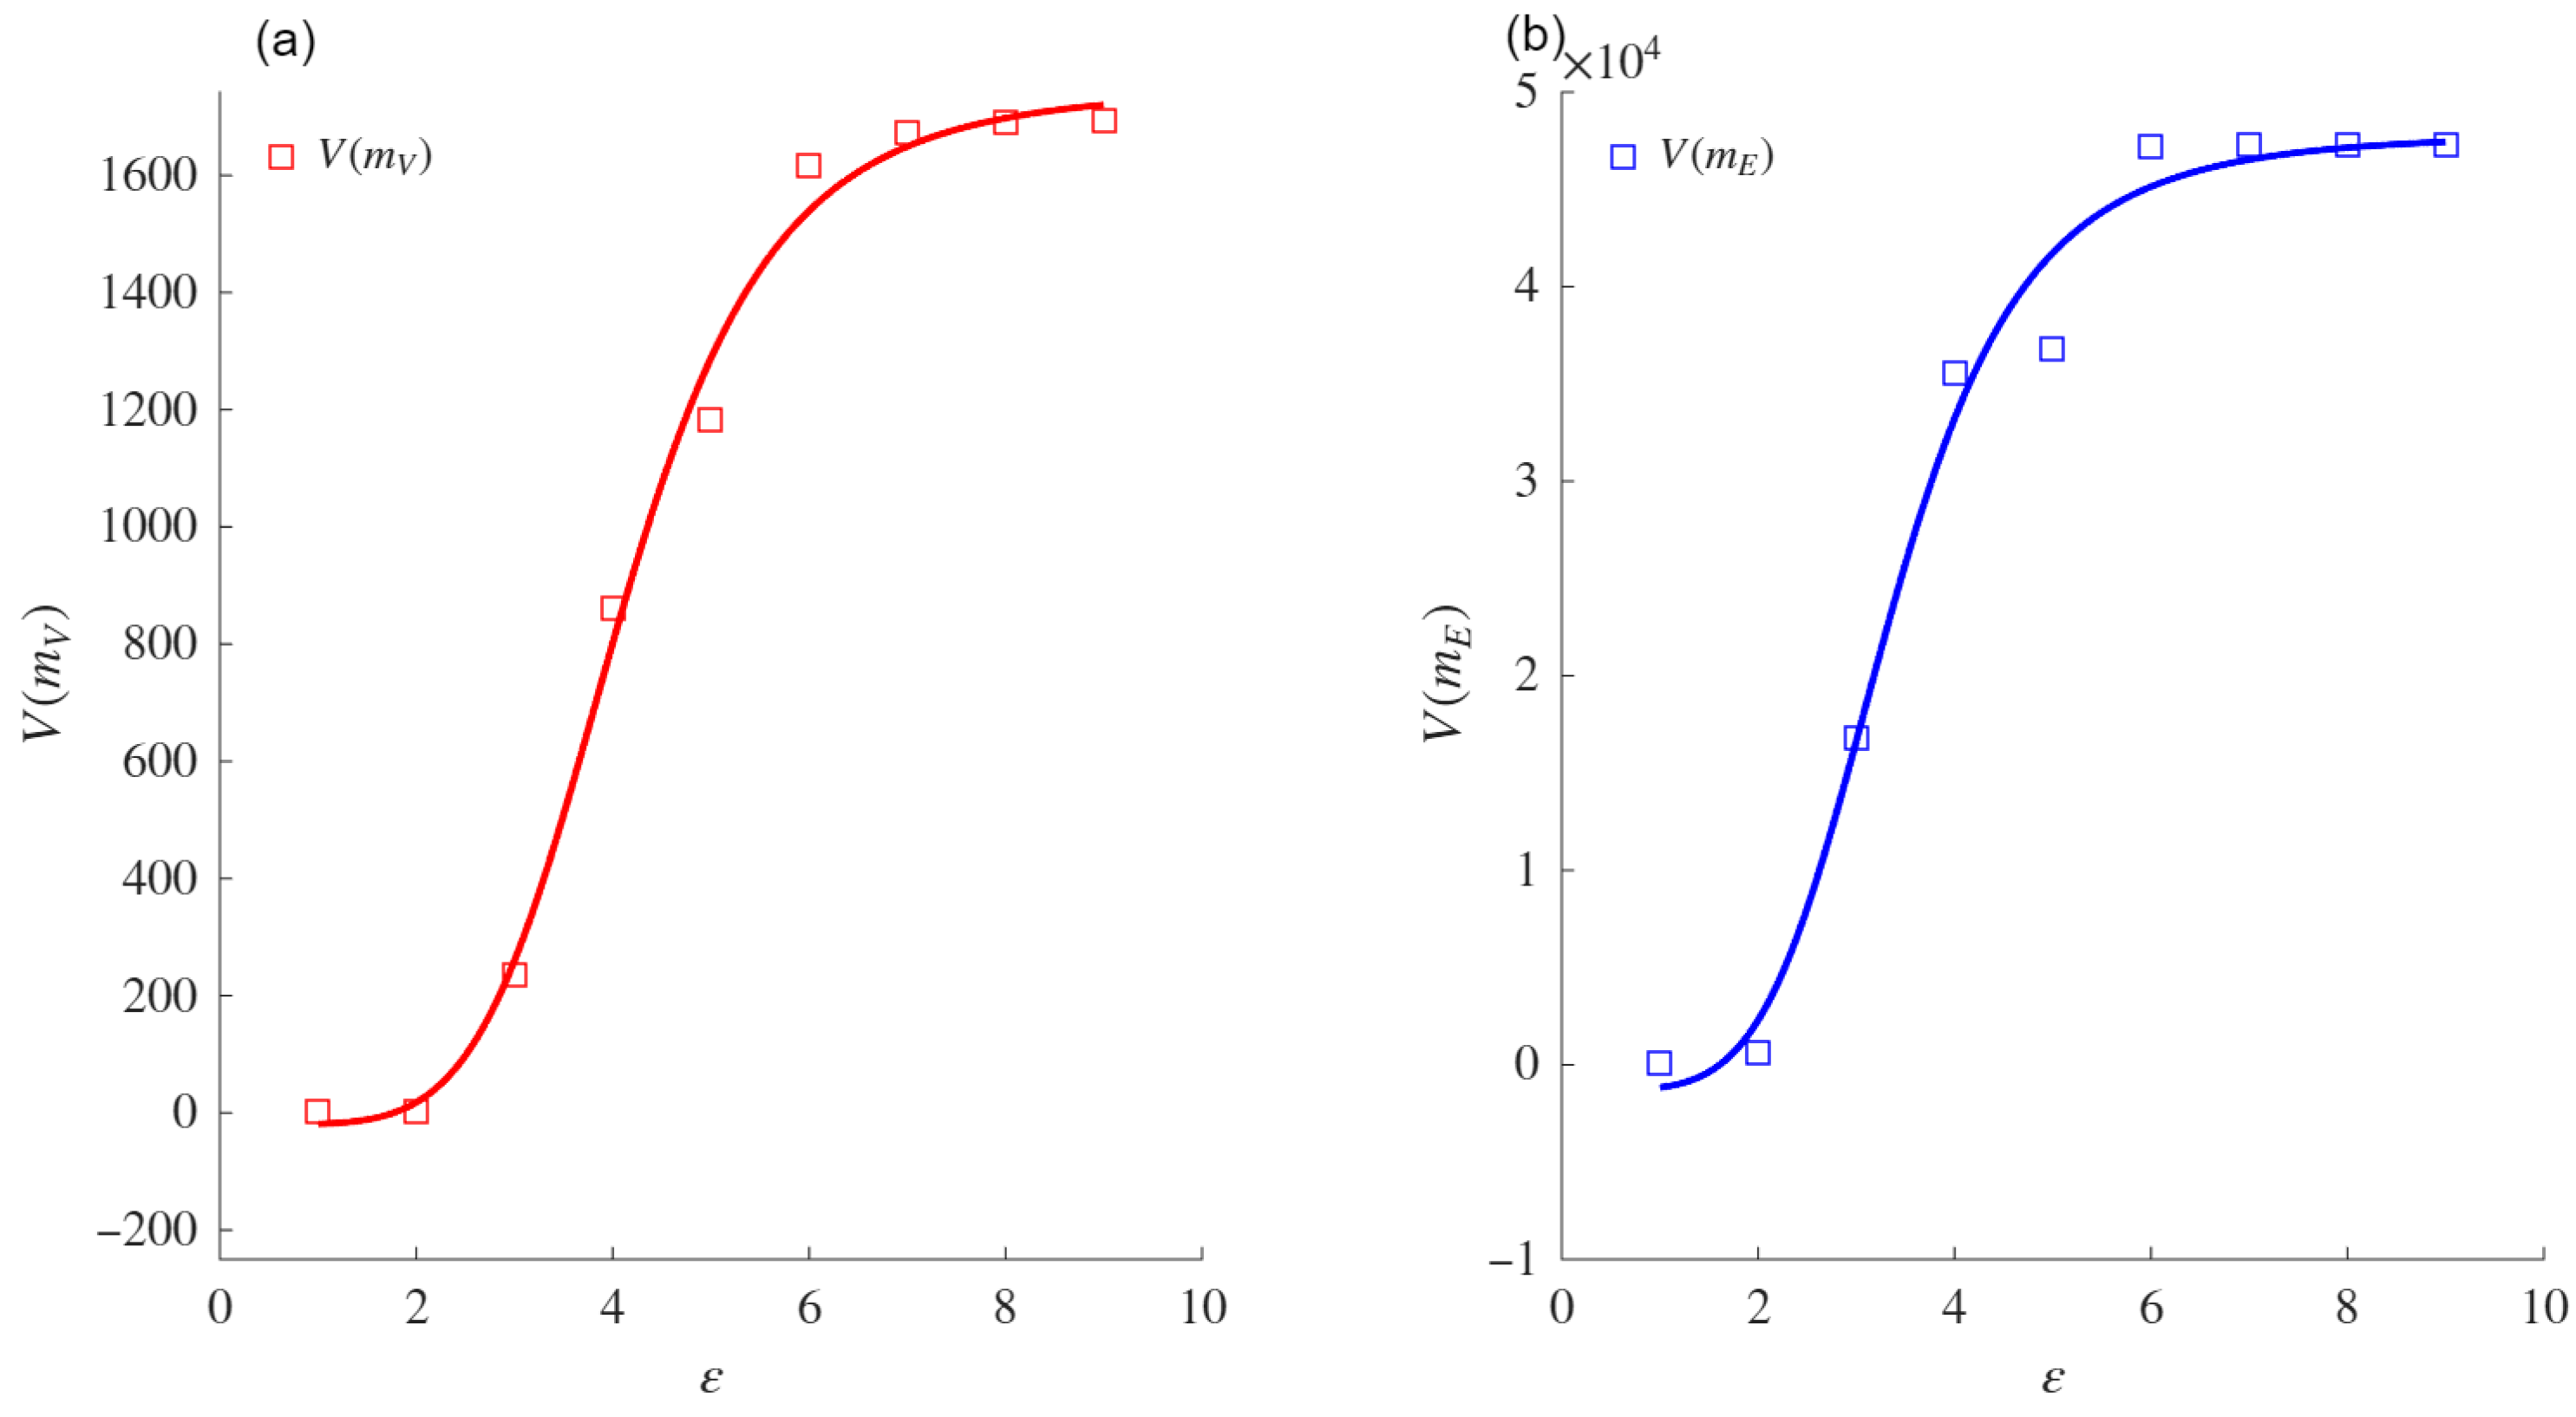
Figure 1. Furthermore,
is the inflection point that produces half of the VMF; that is,
. These parameters are shown in
Figure 1.
On the other hand,
Figure 2 shows that for low values of the diameter (
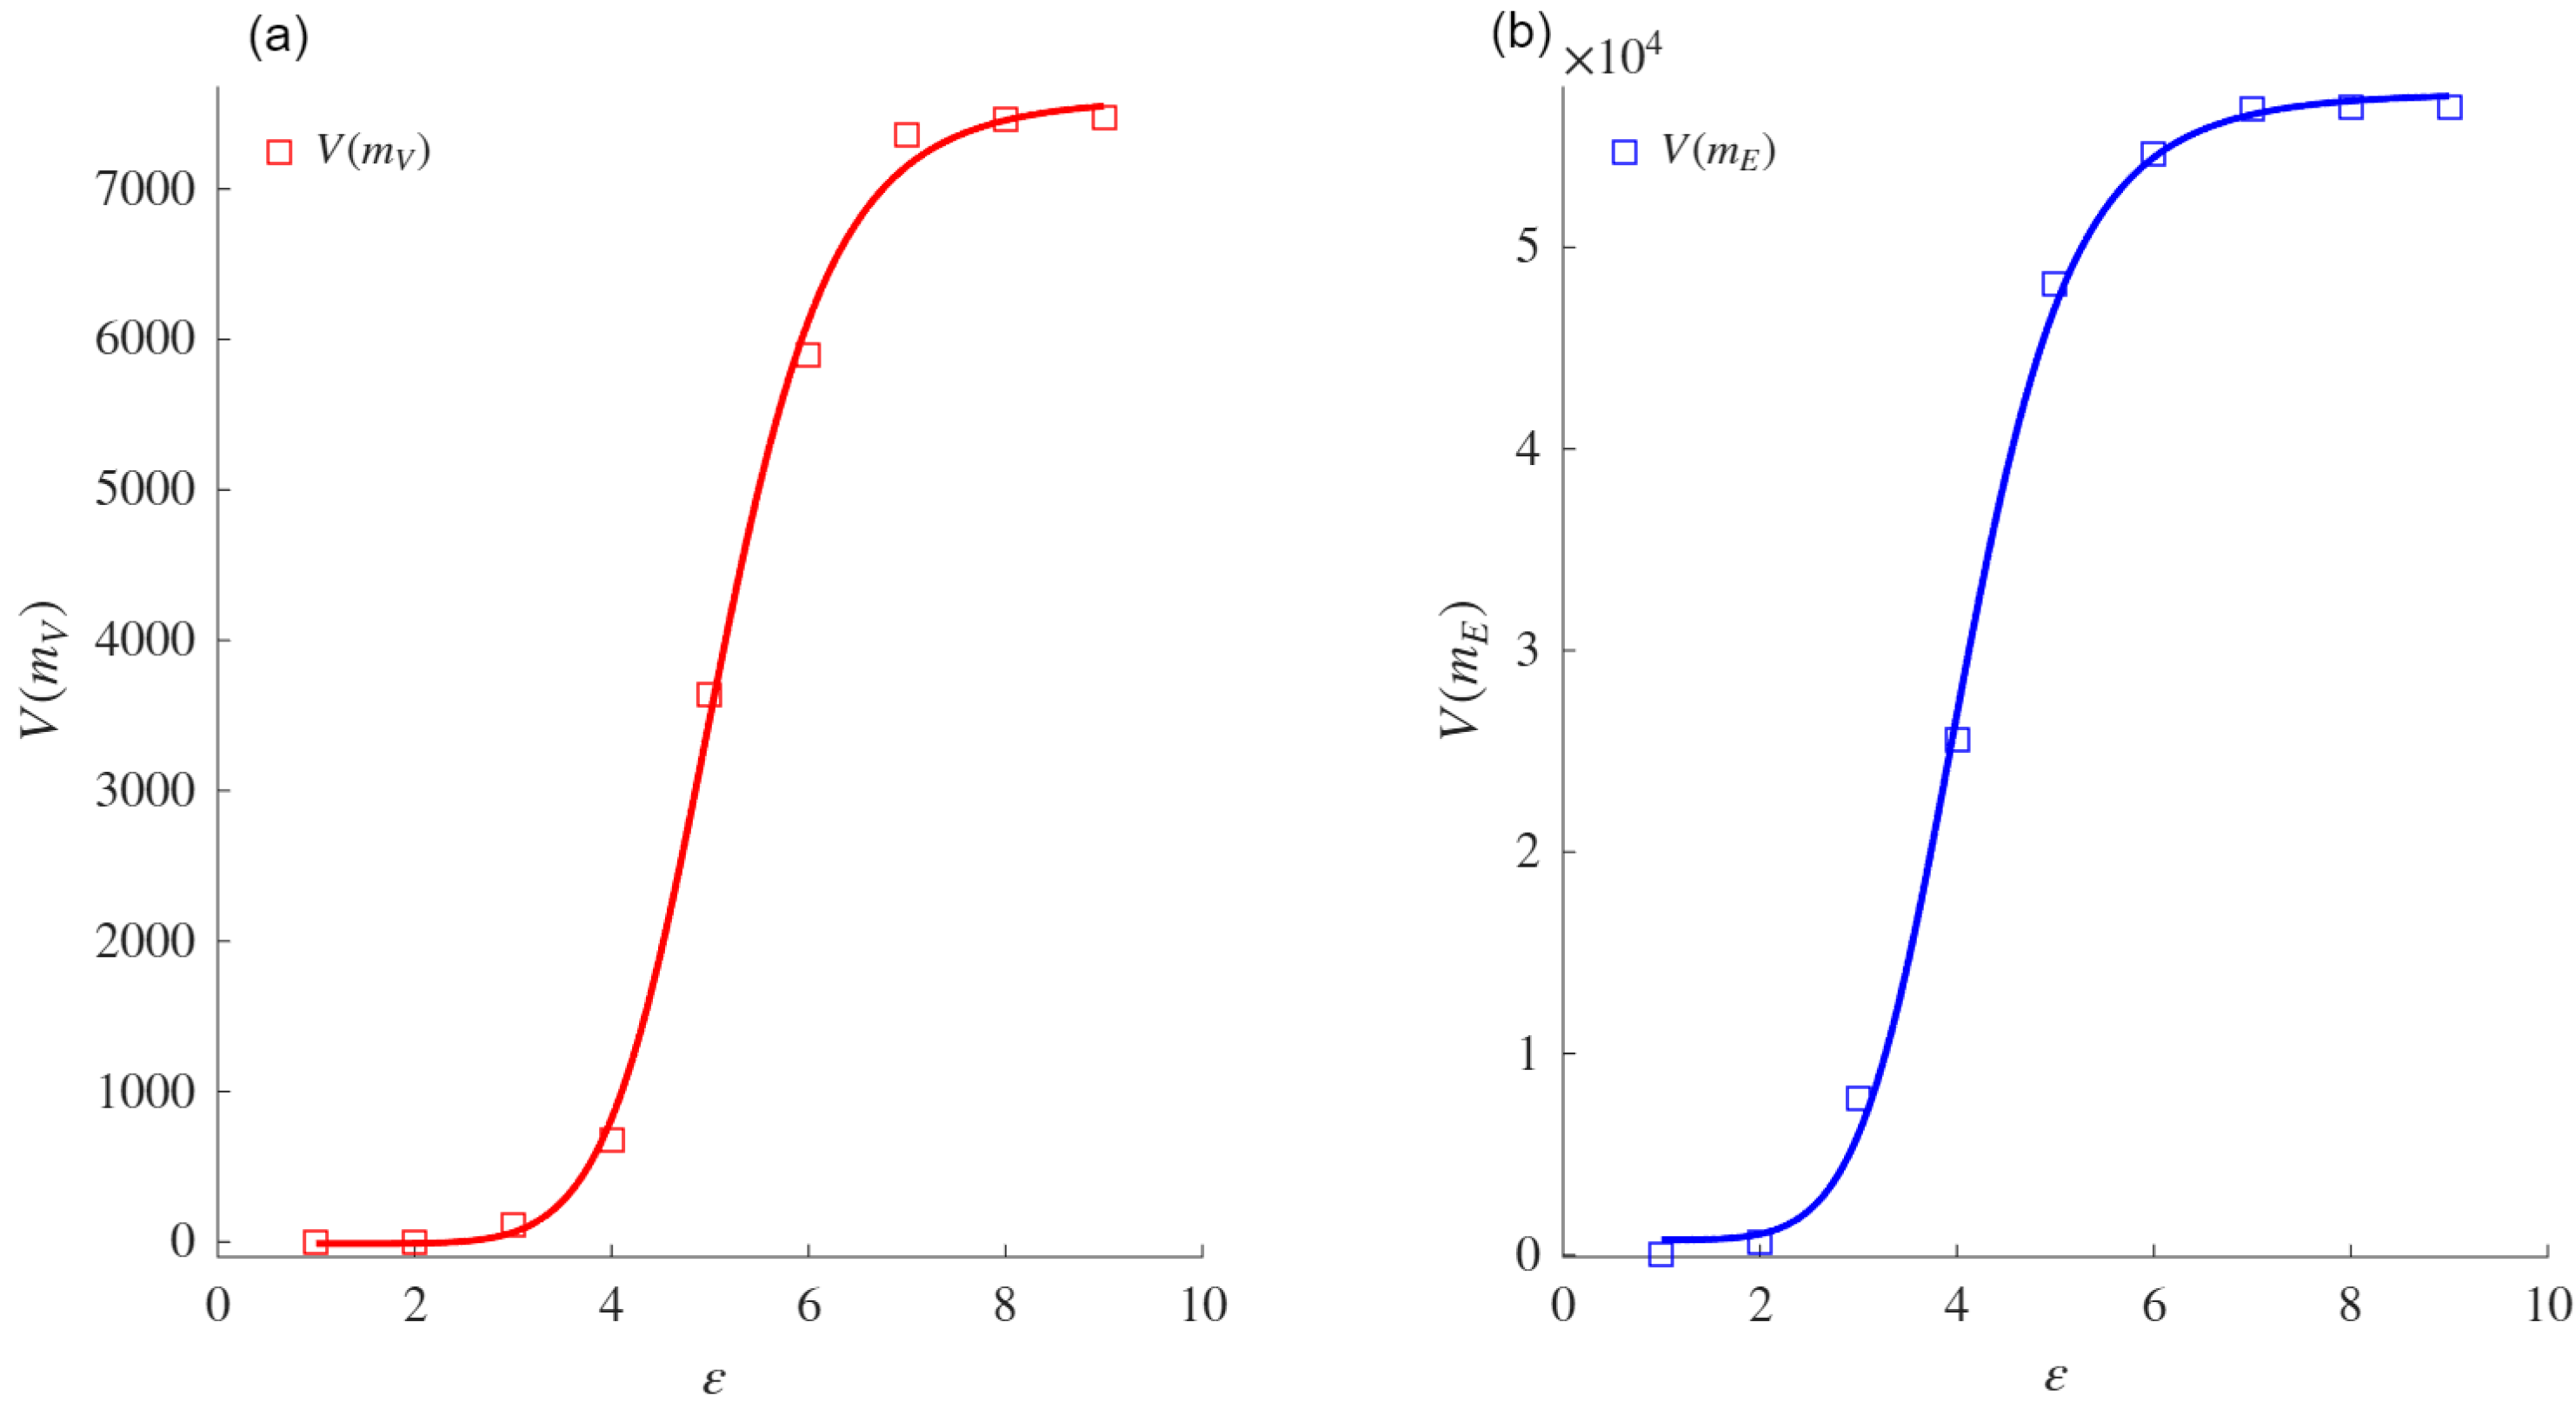
) of boxes or focal elements, the mass (measured by the nodes within them) is low. For example, for
, the number of nodes in each box is always one and, so, the number of boxes is equal to the number of nodes in the network. As
increases, the diameter of the boxes increases and, intuitively, the number of nodes within them increases. The nodes are finite; thus, when the size of the boxes approaches their maximum (i.e., the diameter of the network), the nodes tend to be concentrated in one box. These extreme cases are the lower (
) and upper (
) bounds of the sigmoid asymptote. Furthermore, the behavior of the number of nodes in each box as the box size (
) increases is similar to that exhibited by a growing population with limited resources, which can also be modeled using a sigmoid asymptote.
Definition 4. We assert that from Equation (18), the VDMF for a complex network is defined as follows:where is the VMF, and η, δ, and ψ are defined as above. When , each node or edge of the given network belongs to one box, the volume of mass function satisfies the Property 1, and so . Furthermore, in the extreme case when , one box contains all nodes or edges, such that the volume of the mass function is , where N is the total number of nodes () or edges ().
Next, we present numerical examples of the VMF and its VDMF for complex networks.
2.5. Brief Examples
Example 1. Consider a frame of discernment and mass function , . According to Equation (9), ; furthermore, the non-specificity term is Example 2. Consider a frame of discernment and mass function m()=1/5, m()=1/5. Thus, , while the non-specificity term is =30. This result demonstrates the convergence of the VMF with the non-specificity term as the size of the focal elements becomes sufficiently large.
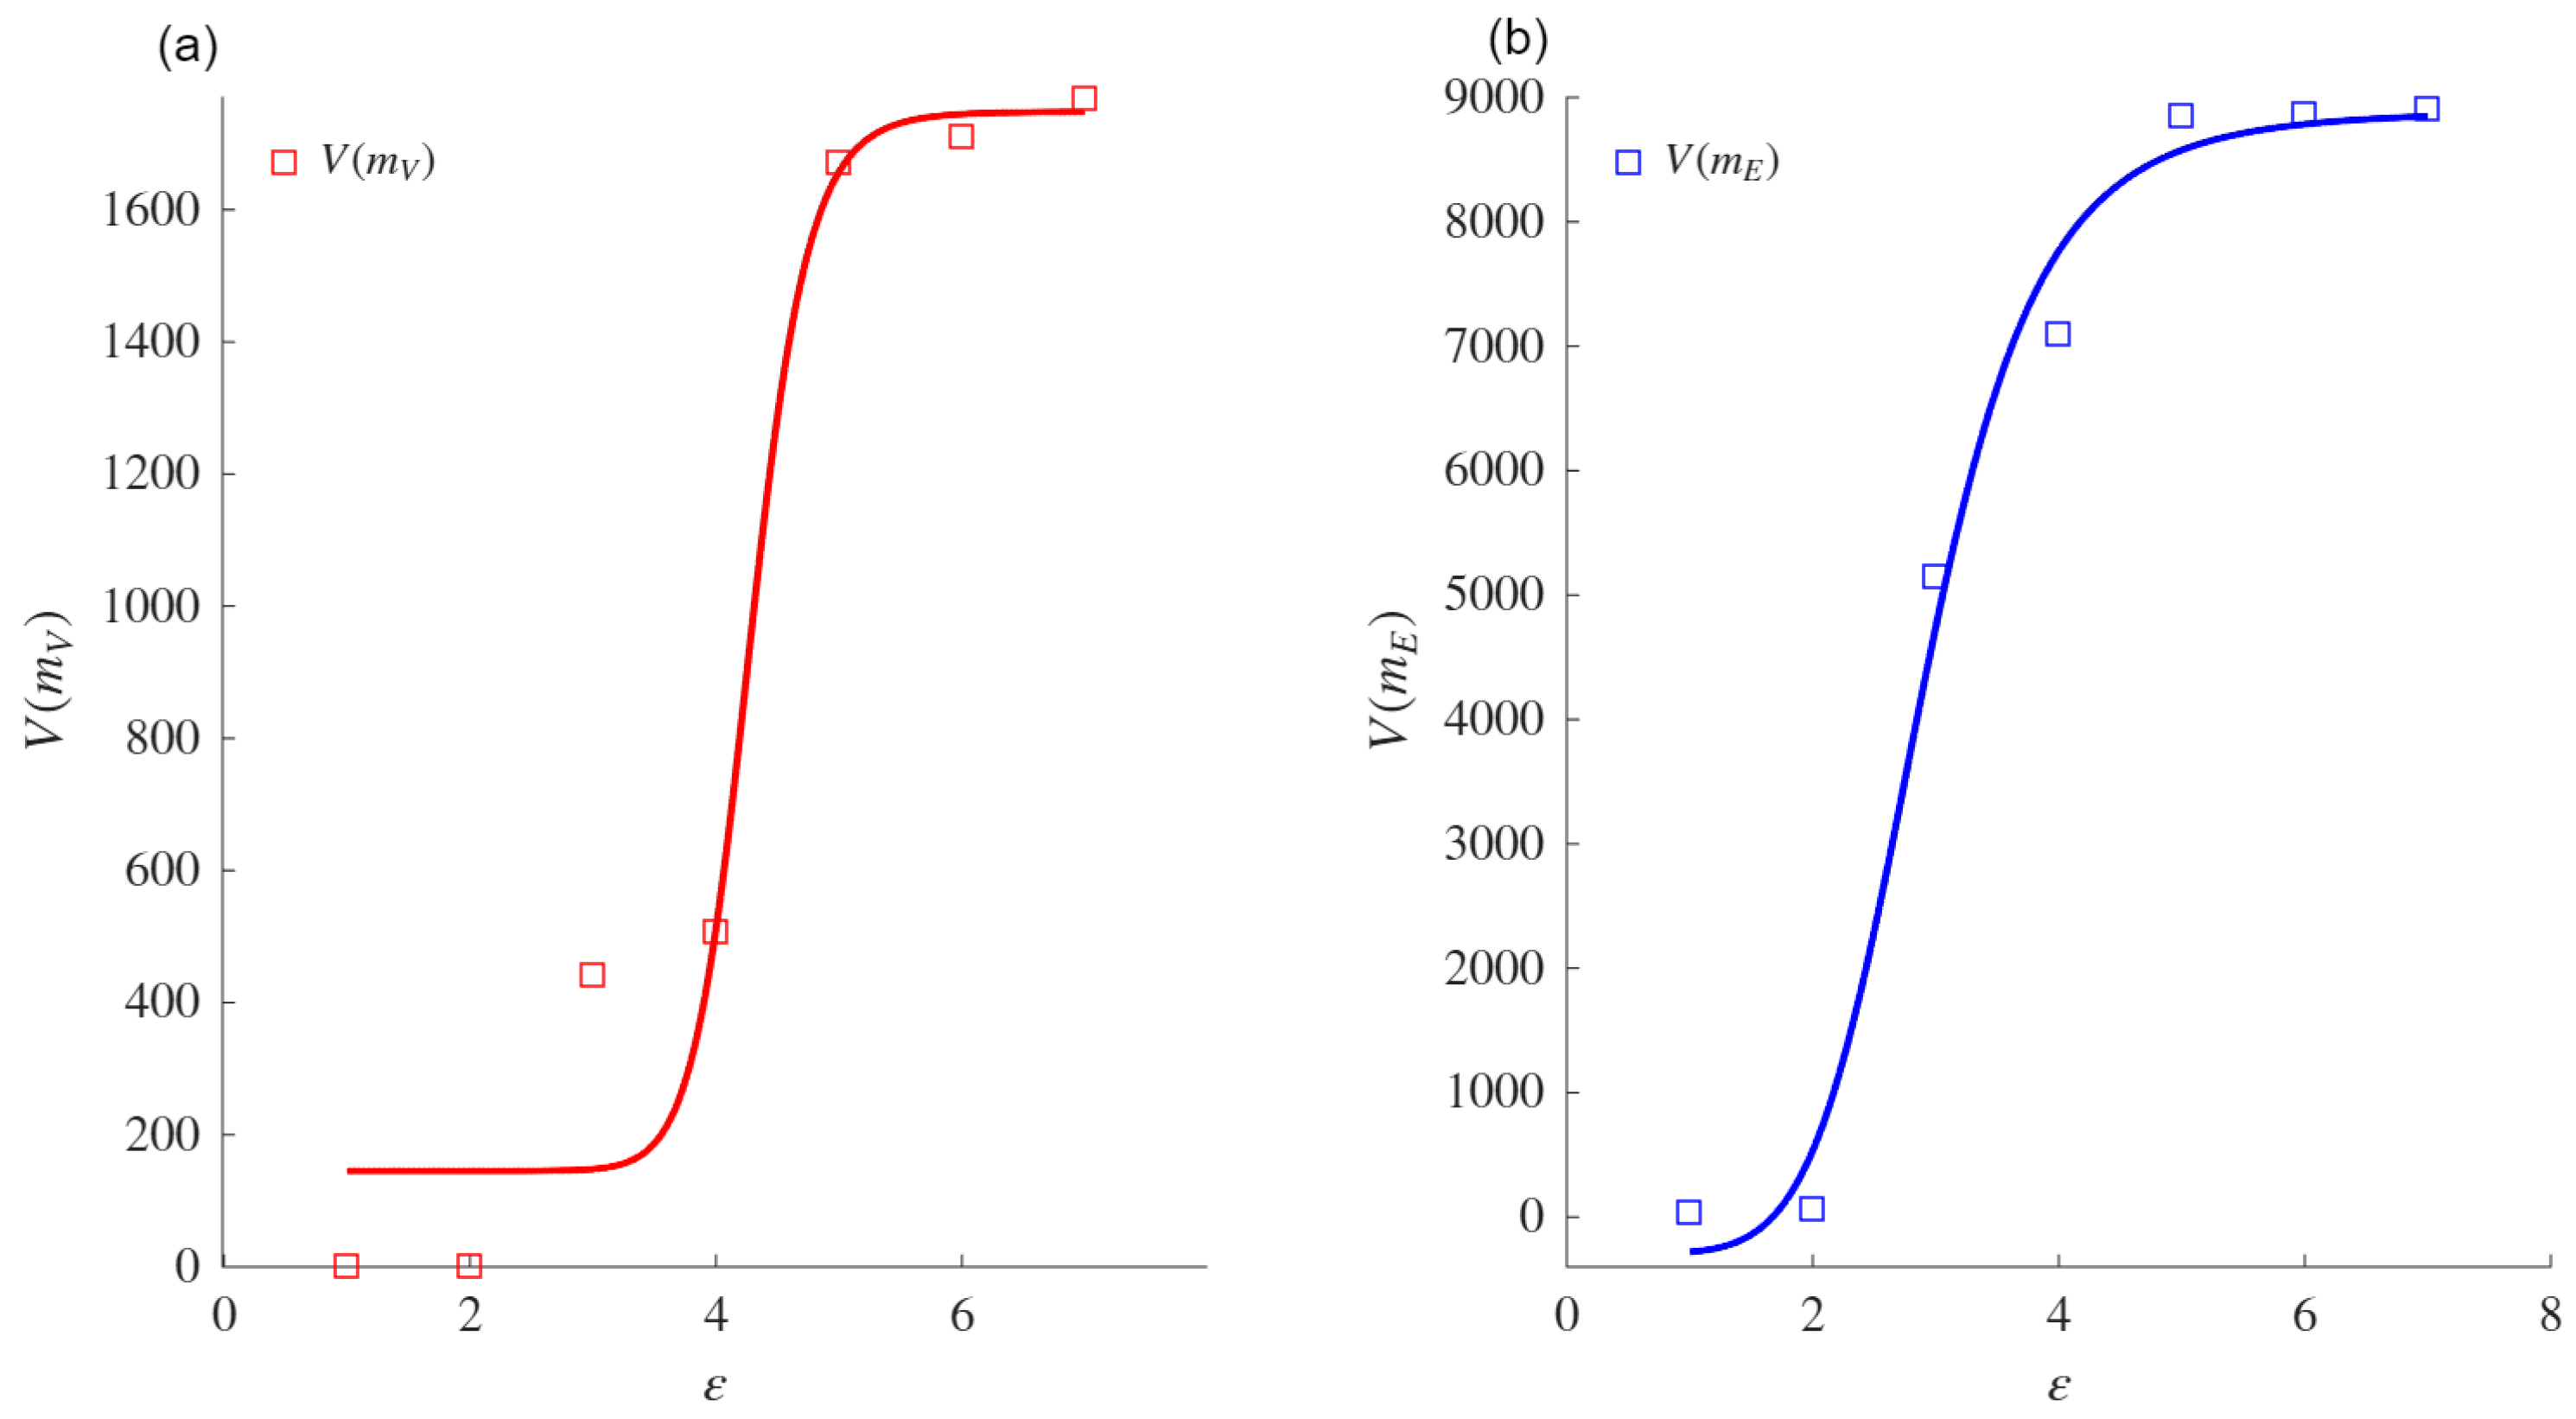
Example 3. Consider the frame of discernment to be the nodes of the network shown in Figure 2. The box-covering algorithm determines the focal elements by computing boxes of a given diameter . For our example, the focal elements are given in Table 1. Note that the focal elements depend on the size of the boxes (ε). For the trivial case when , the focal elements are the singletons . Similarly, for the other trivial case, , the only focal element is X. The focal elements with are shown in Figure 2a, and those with are shown in Figure 2b. The nodes in the same color belong to the same focal element , as can be seen from Table 1. For details of how the box-covering (greedy coloring) algorithm computes the focal elements (boxes), the reader is referred to [41]. The VMF of nodes is calculated using Equations (15) and (16) is used for the VMF of edges. The VMF of edges for focal elements obtained with is only composed of =. On the other hand, for , . The remaining results are shown in Table 1. The VDMF of the VMFs for nodes Equation (
15) and edges Equation (
16) is obtained by performing non-linear regression with the sigmoid asymptote Equation (
18).
Figure 1 shows that
and
.
3. Methodology
To validate our proposal, we analyzed 27 real-world networks from various contexts, including social, technological, and biological domains.
Table 2 lists the diameter, the number of nodes, edges, and the cluster coefficient (CC) for each network.
Table 2.
Number of nodes, edges, diameter, and cluster coefficient of real-world networks.
Table 2.
Number of nodes, edges, diameter, and cluster coefficient of real-world networks.
| Network | Full Name | Nodes | Edges | Diameter | CC |
|---|
| ACF | American college football [42,43] | 115 | 613 | 4 | 0.403 |
| BCEPG | Bio-CE-PG [44,45] | 1692 | 47,309 | 8 | 0.447 |
| BGW | Bio-grid-worm [44,45] | 16,259 | 762,774 | 12 | 0.195 |
| CEN | C. elegant neural network [43,46] | 297 | 2148 | 5 | 0.292 |
| CNC | Ca-netscience [44,45] | 379 | 914 | 17 | 0.741 |
| COL | SocfbColgate88 [44,45] | 3482 | 155,044 | 6 | 0.267 |
| DRO | Drosophilamedulla1 [44,45] | 1770 | 33,635 | 6 | 0.264 |
| DS | Dolphins social network [43,47] | 62 | 159 | 8 | 0.259 |
| ECC | E. coli cellular network [48,49] | 2859 | 6890 | 18 | 0 |
| EM | Email [43,50] | 1133 | 5451 | 8 | 0.220 |
| IOF | Infopenflights [44,45] | 2905 | 30,442 | 14 | 0.456 |
| JM | Jazz-musician [43,51] | 198 | 2742 | 6 | 0.617 |
| JUN | Jung2015 [44,45] | 2989 | 31,548 | 16 | 0.527 |
| LAS | Lada Adamic’s network [52,53] | 350 | 3492 | 8 | 0.491 |
| LDU | Labanderiadunne [44,45] | 700 | 6444 | 6 | 0.104 |
| MAR | Marvel [44,45] | 19,365 | 96,616 | 11 | 0 |
| MIT | SocfbMIT [44,45] | 6402 | 251,230 | 8 | 0.272 |
| PAIR | Pairdoc [44,45] | 8914 | 25,514 | 14 | 0.141 |
| PG | Power grid network [43,46] | 4941 | 6594 | 46 | 0.080 |
| PGP | Techpgp [44,45] | 10,680 | 24,340 | 24 | 0.266 |
| POW | Powerbcspwr10 [44,45] | 5300 | 13,571 | 49 | 0.088 |
| PRI | SocfbPrinceton12 [44,45] | 6575 | 293,307 | 9 | 0.237 |
| TC | Topology of communications [53,54] | 174 | 557 | 7 | 0.141 |
| USAA | USA airport network [44,45] | 500 | 2980 | 7 | 0.617 |
| WHO | TechWHOIS [44,45] | 7476 | 56,943 | 8 | 0.489 |
| YEAST | Protein interaction [55,56] | 2223 | 7046 | 11 | 0.138 |
| ZCK | Zachary’s karate club [43,57] | 34 | 78 | 5 | 0.571 |
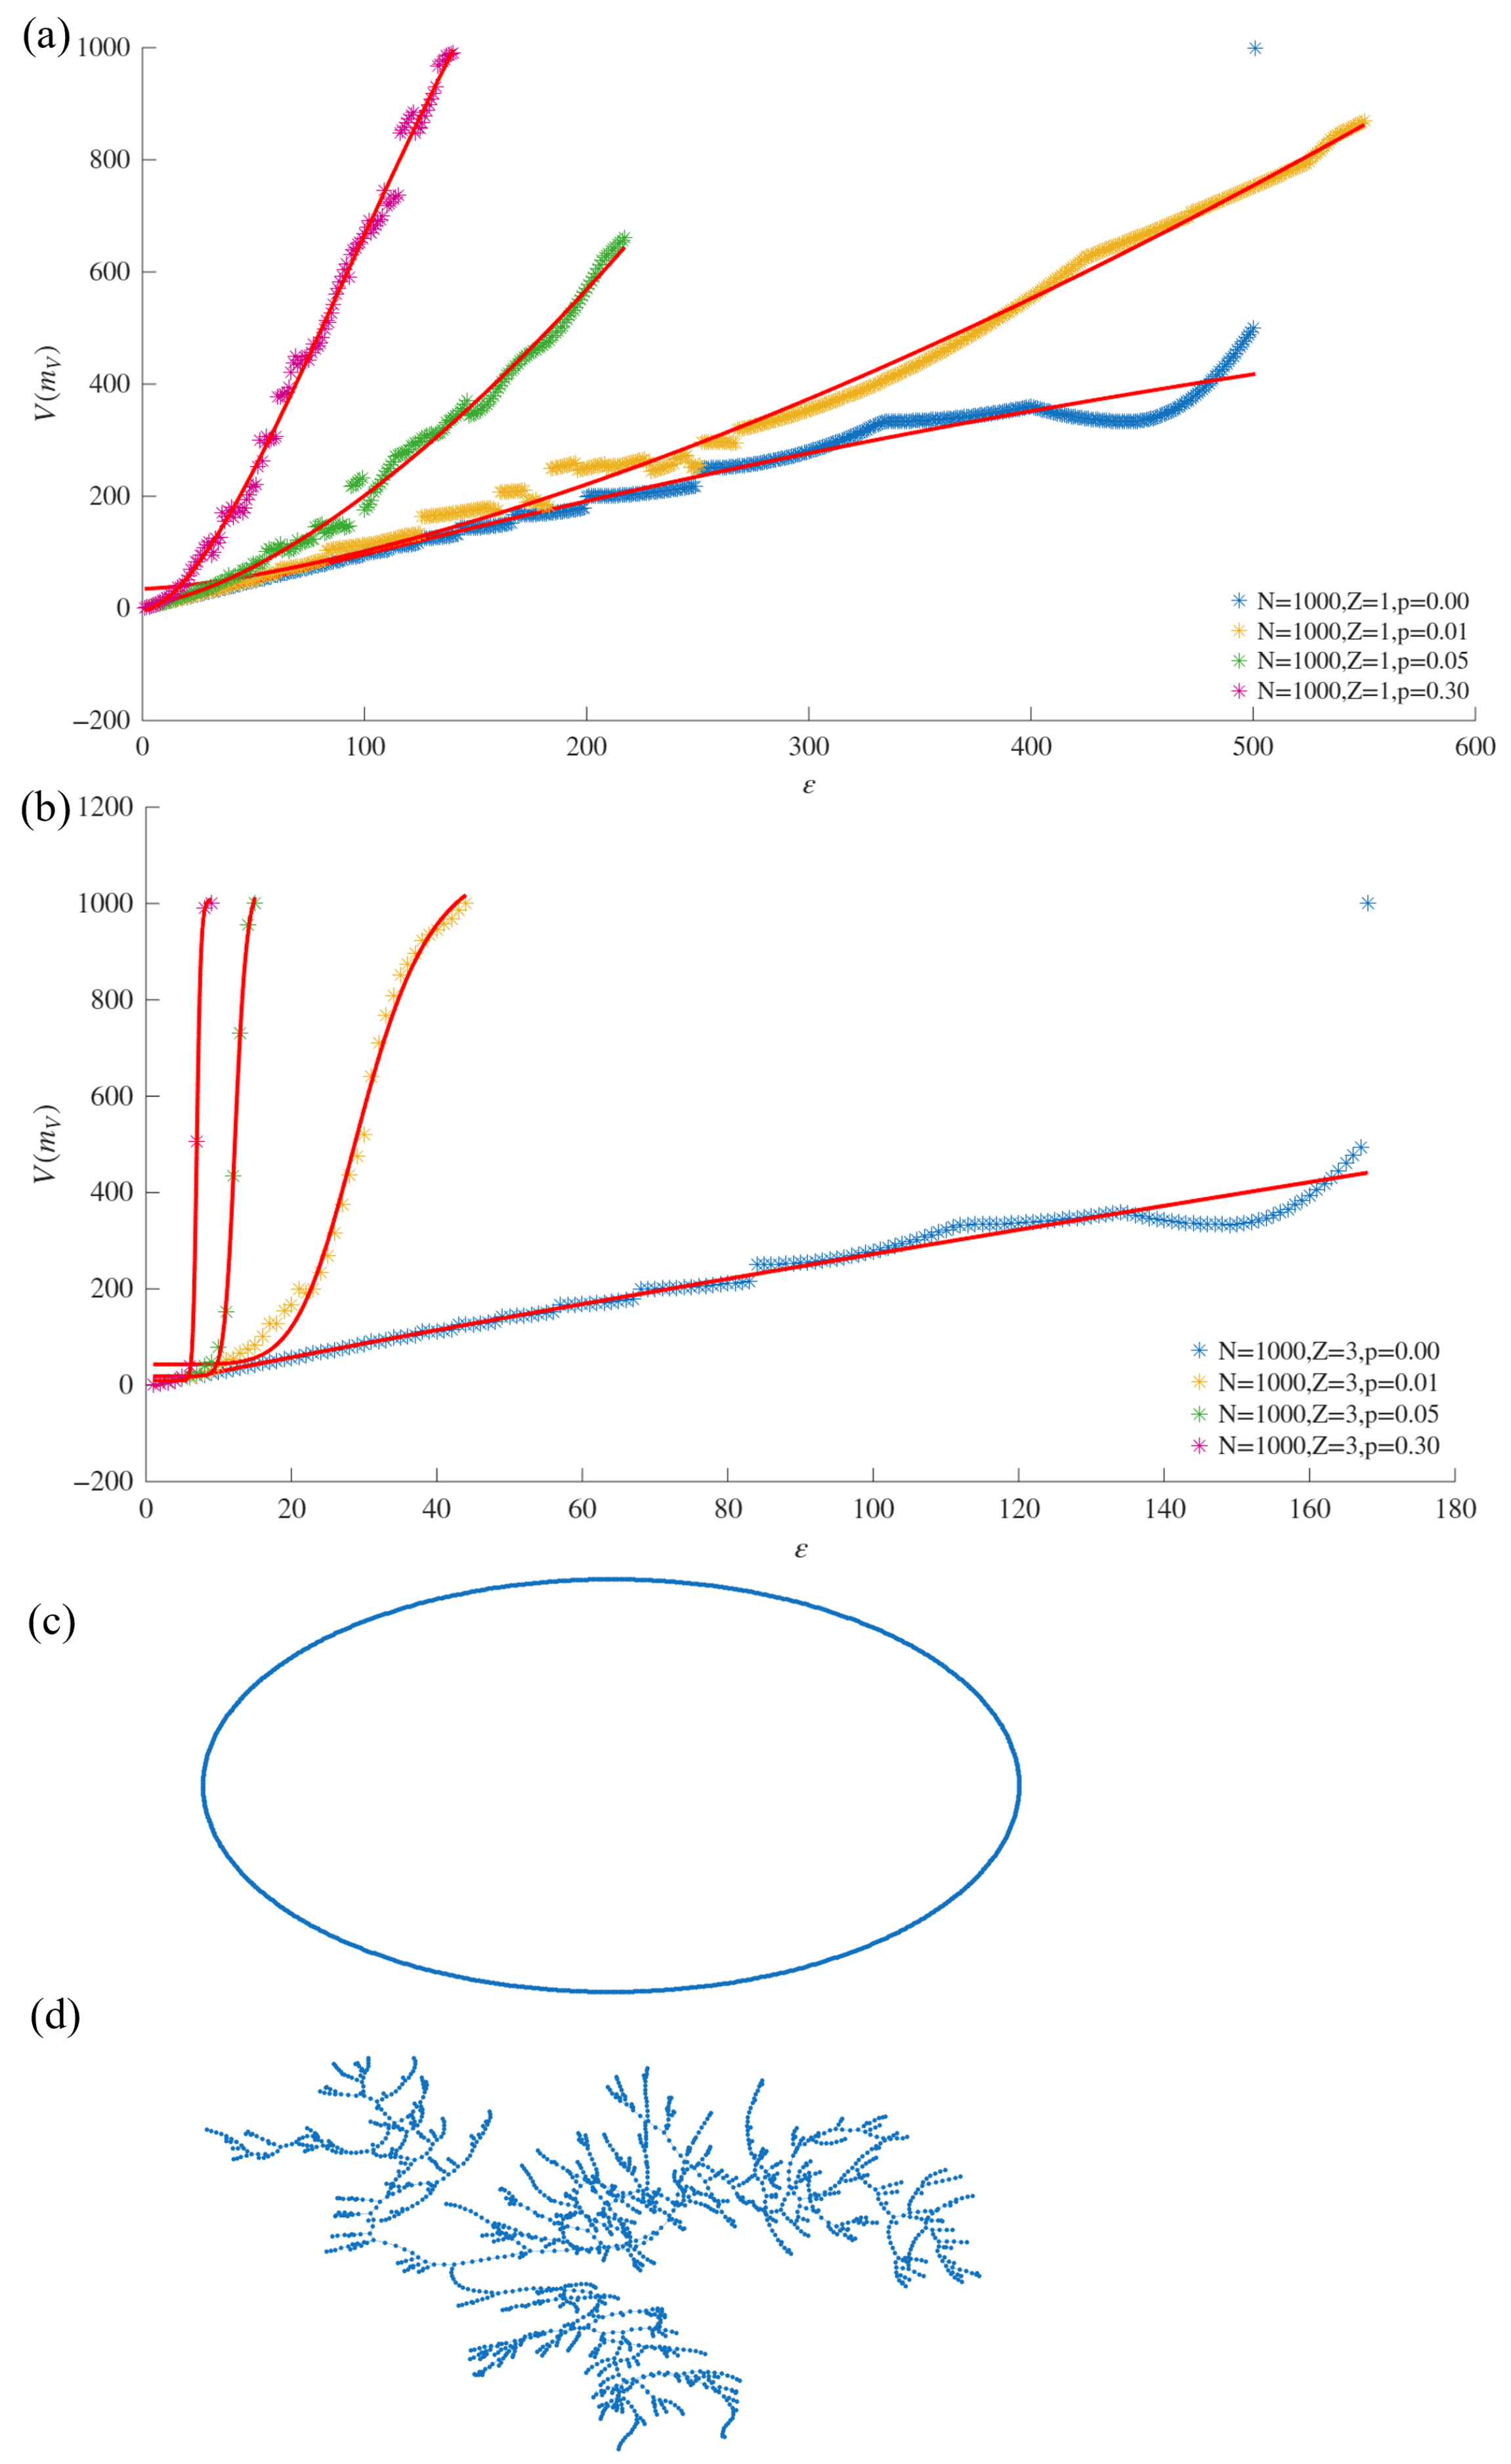
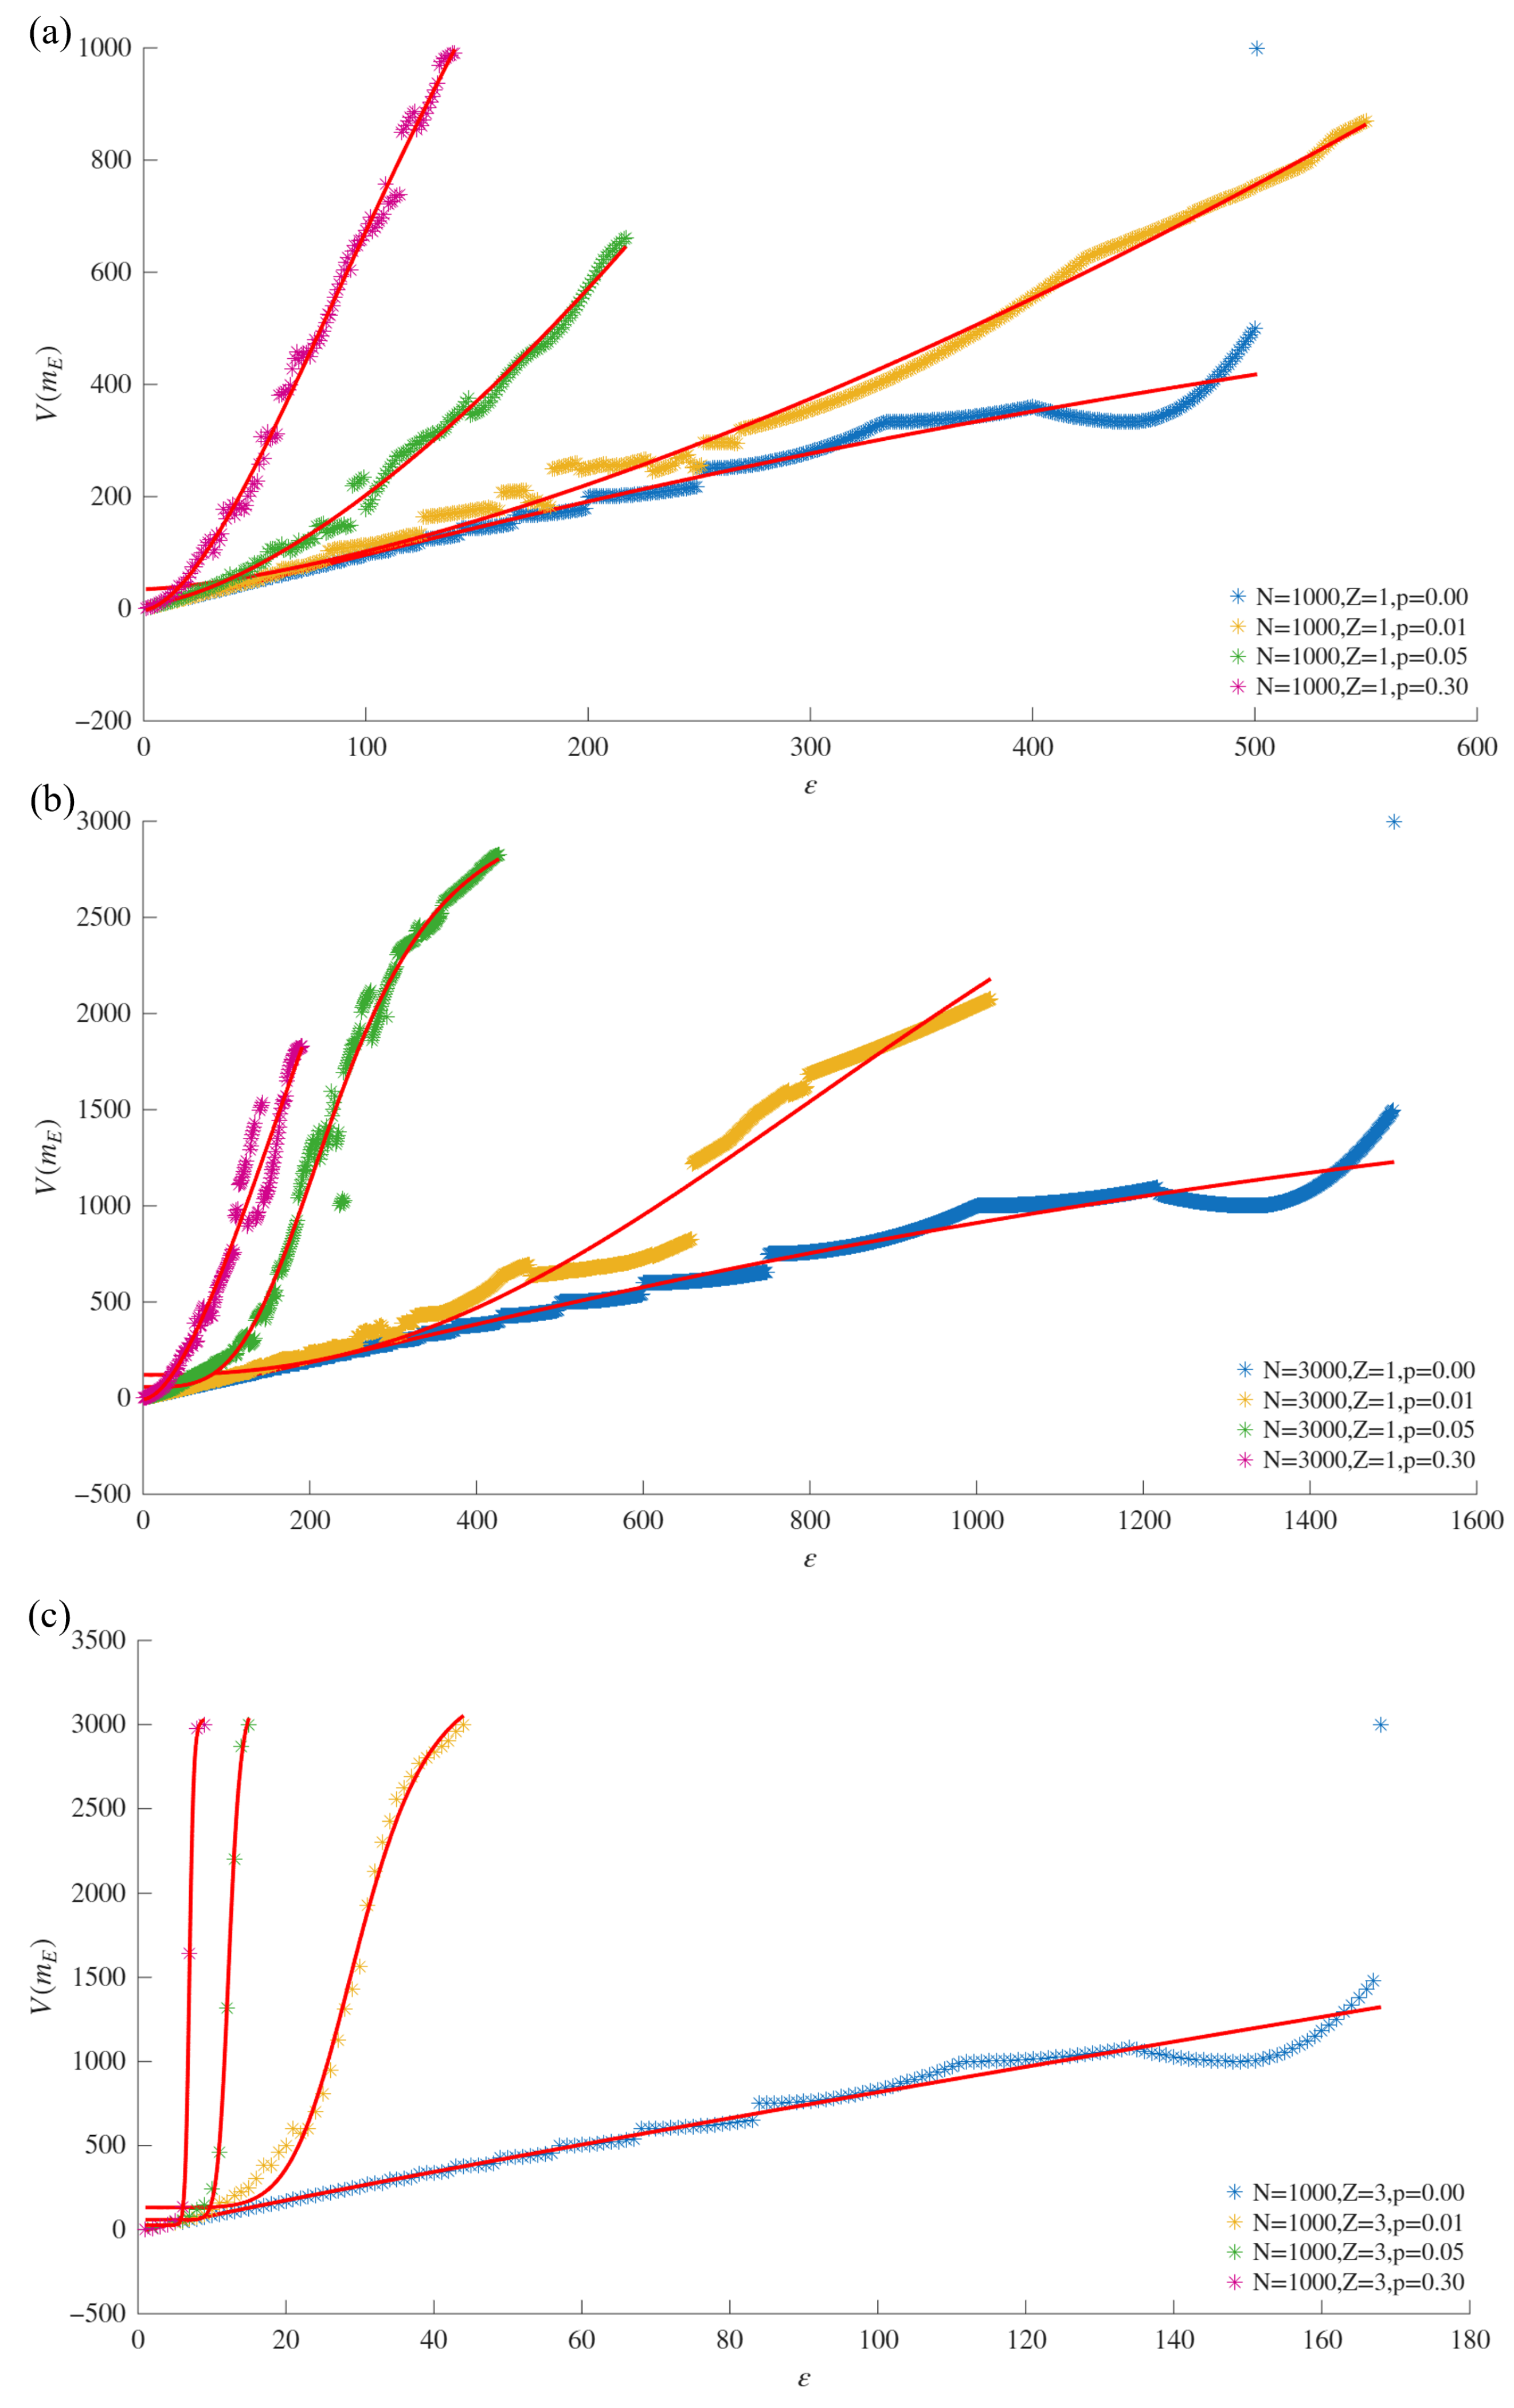
The validation process was also applied to synthetic networks generated using the Watts and Strogatz (WS) model for small-world networks [
46]. The WS model was selected as it allows us to tune the number of nodes and the average node degree. Key parameters include the number of nodes (
N), average node degree (
), and rewiring probability (
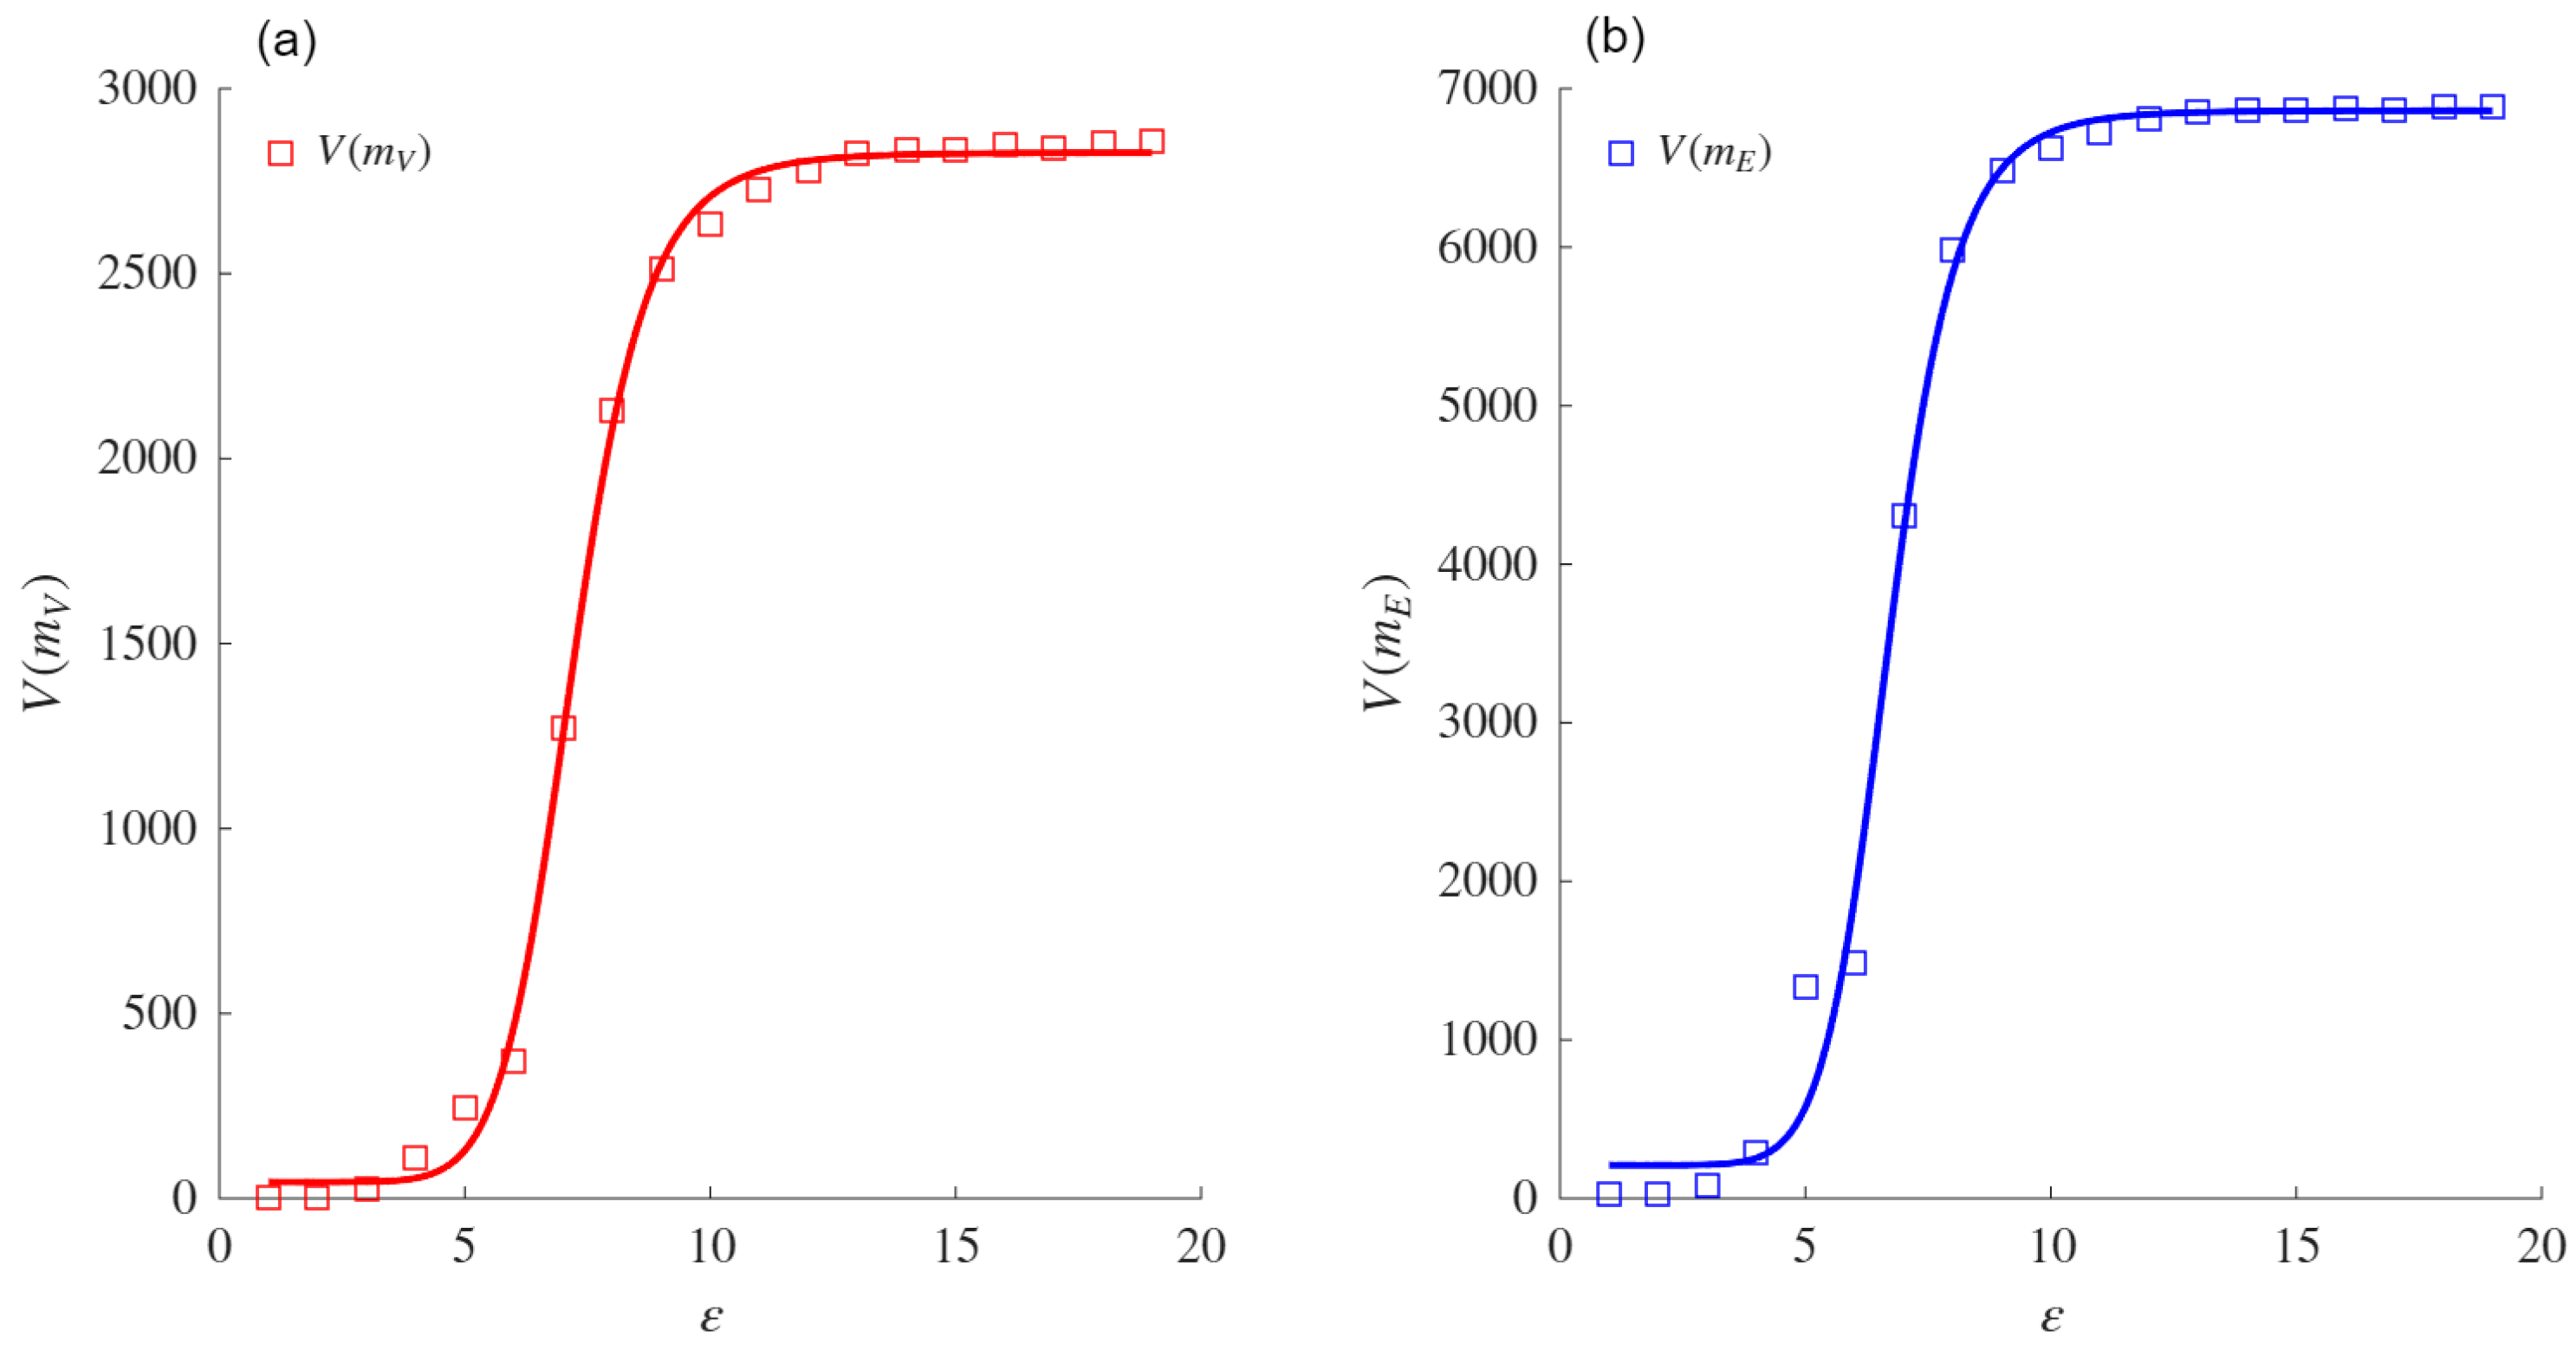
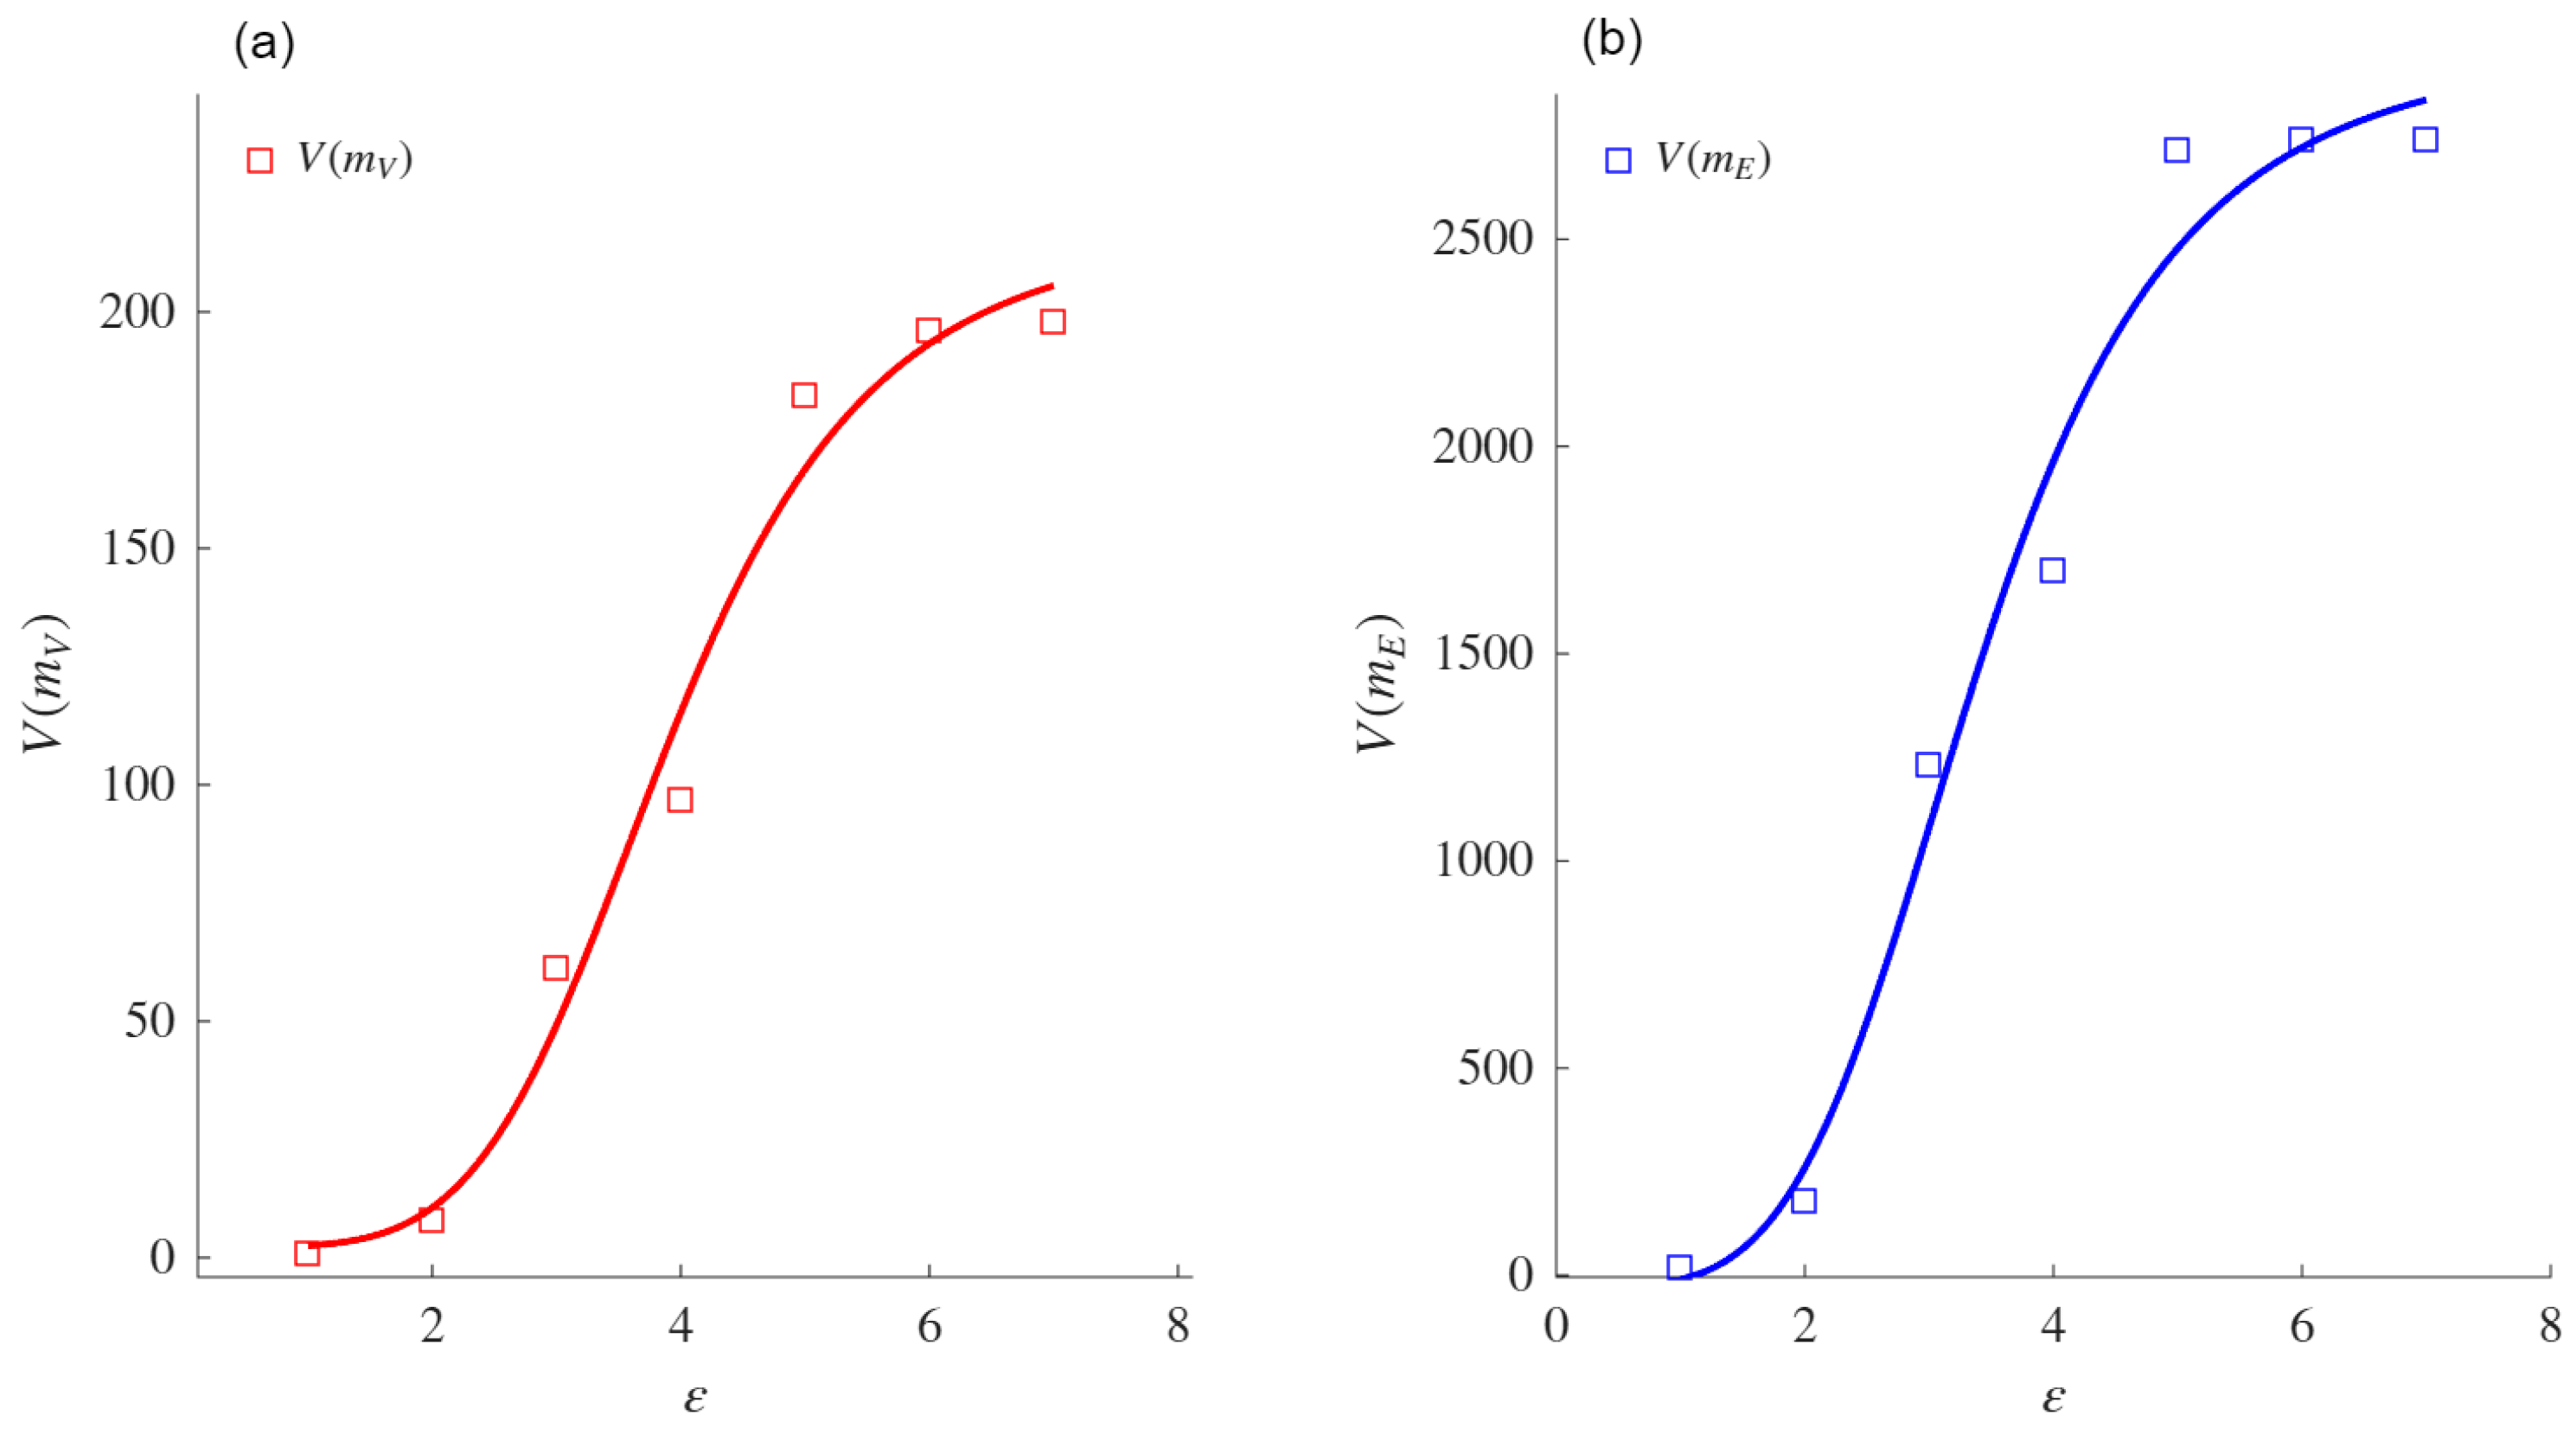
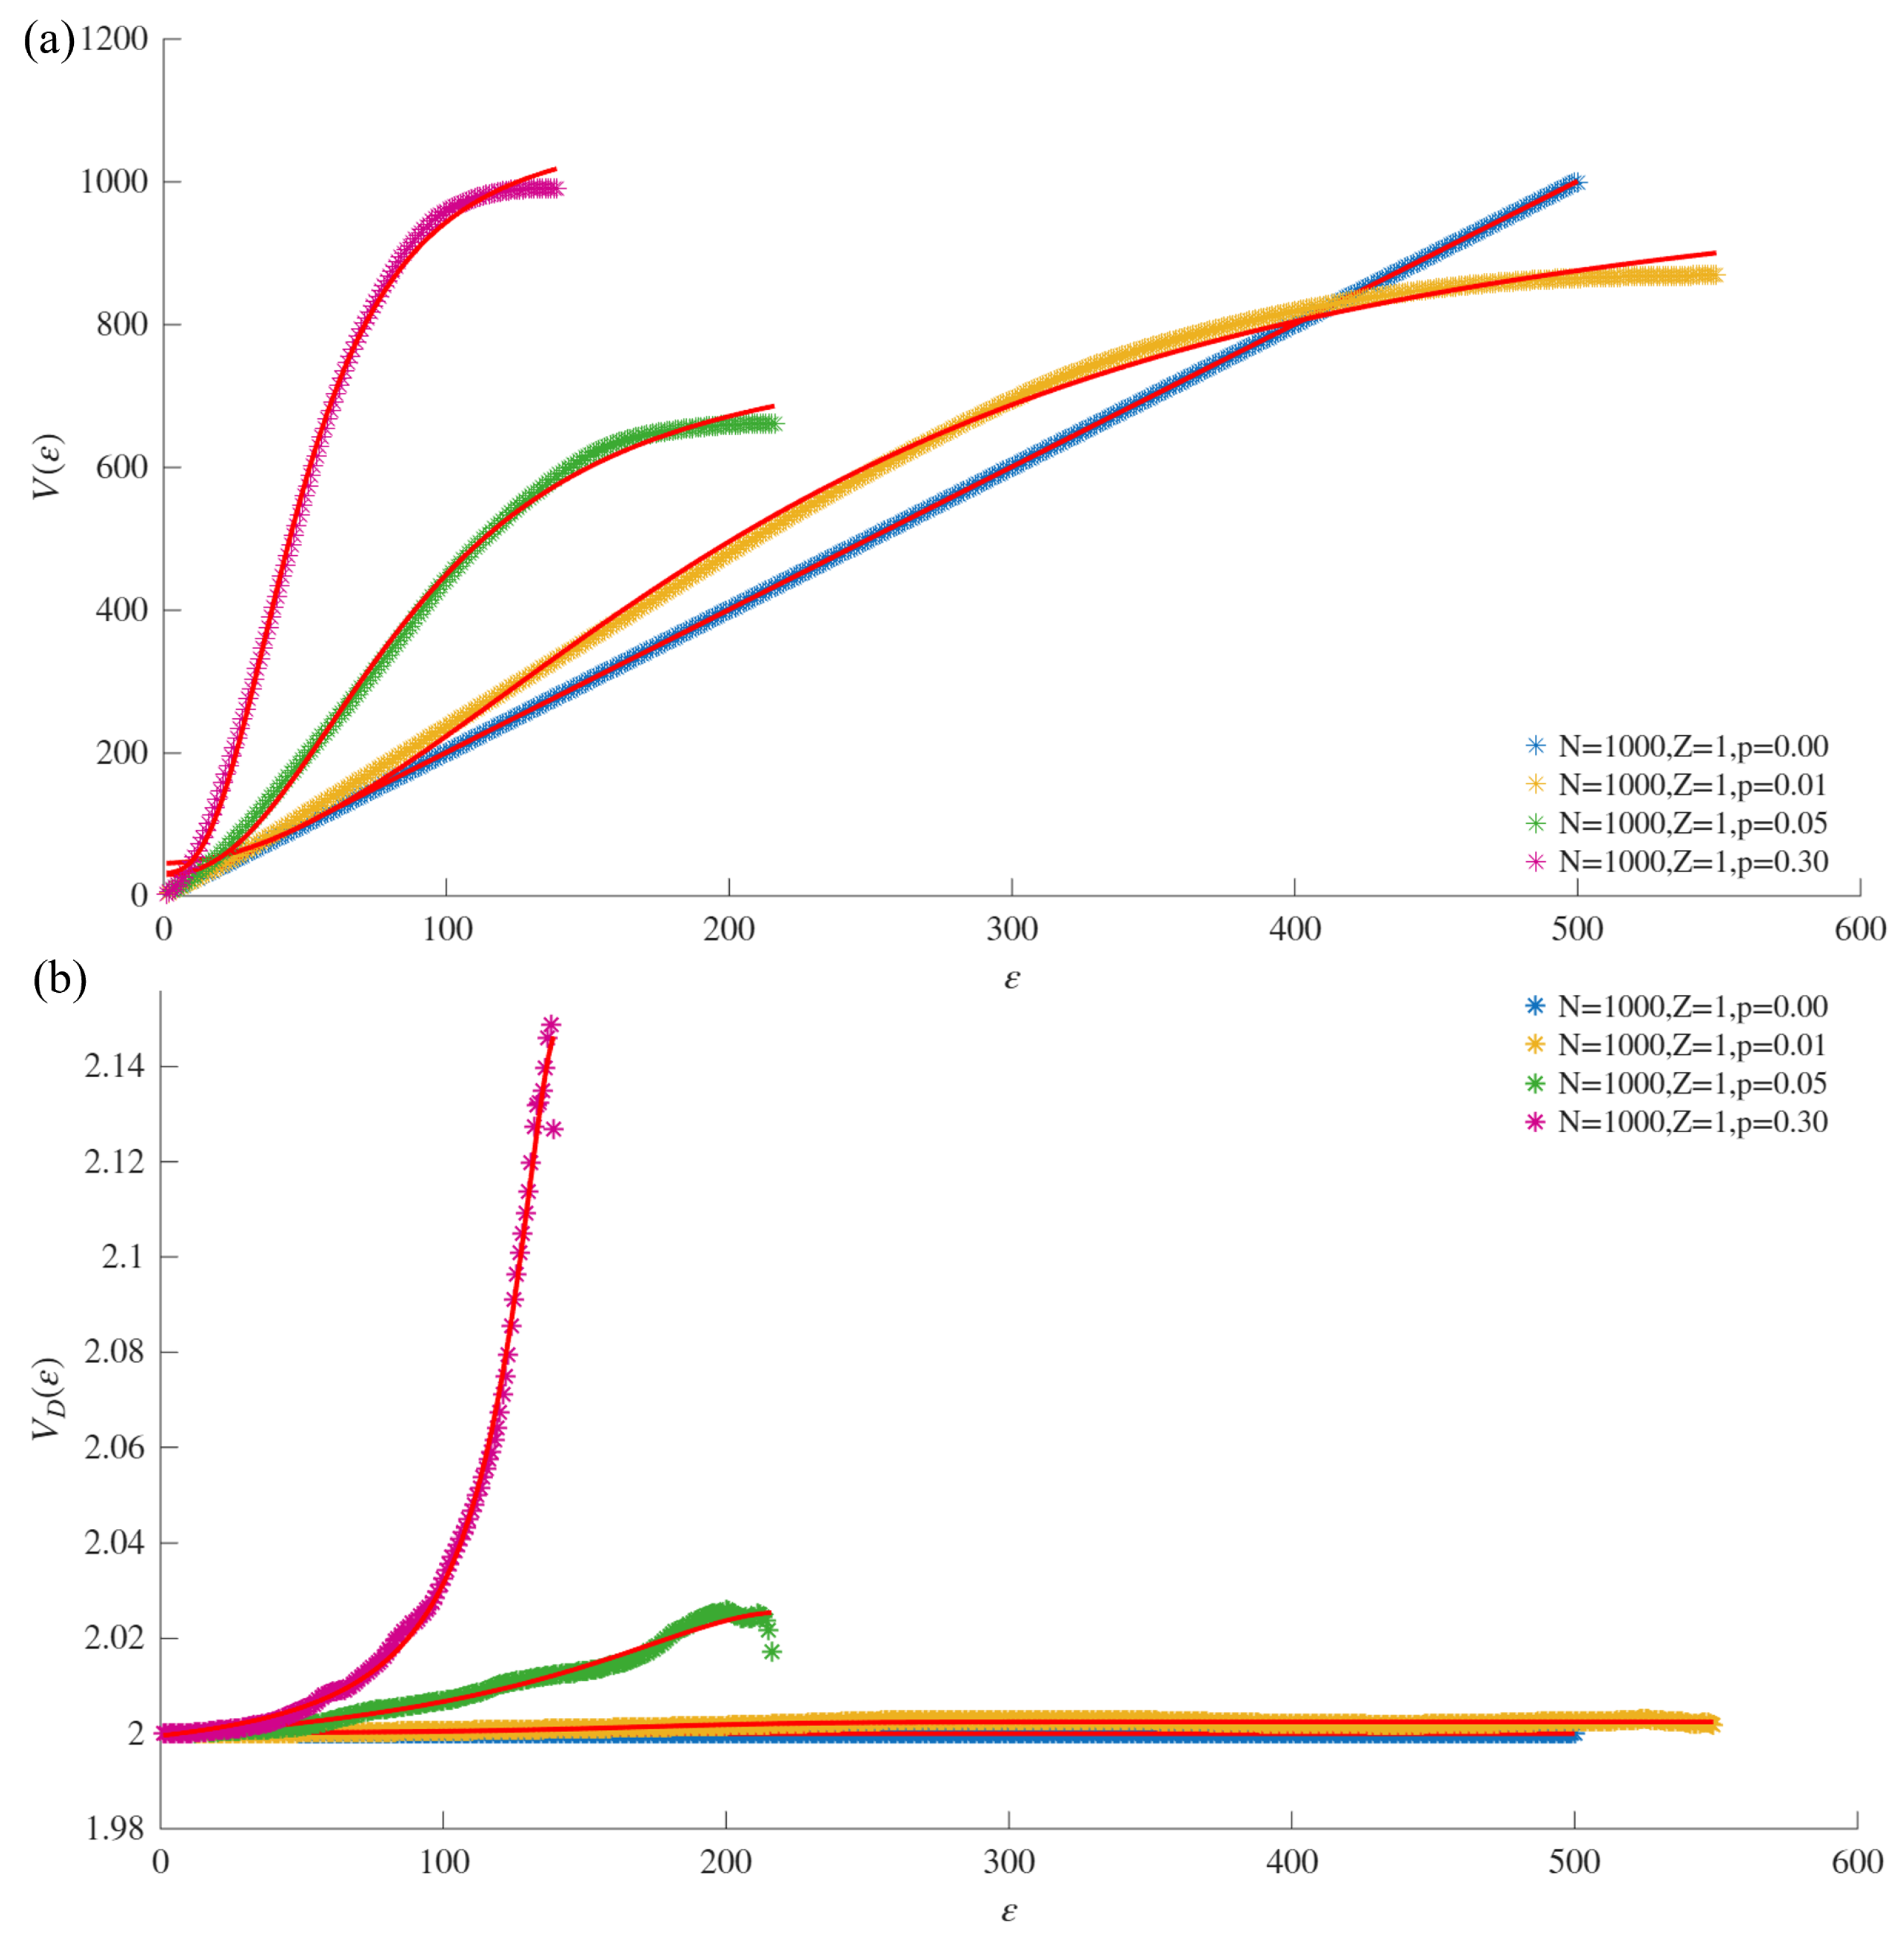
p). The WS model was used to generate 12 networks with the parameters shown in
Table 3. Each row shows the varying
p values, while
N and
Z remain fixed.
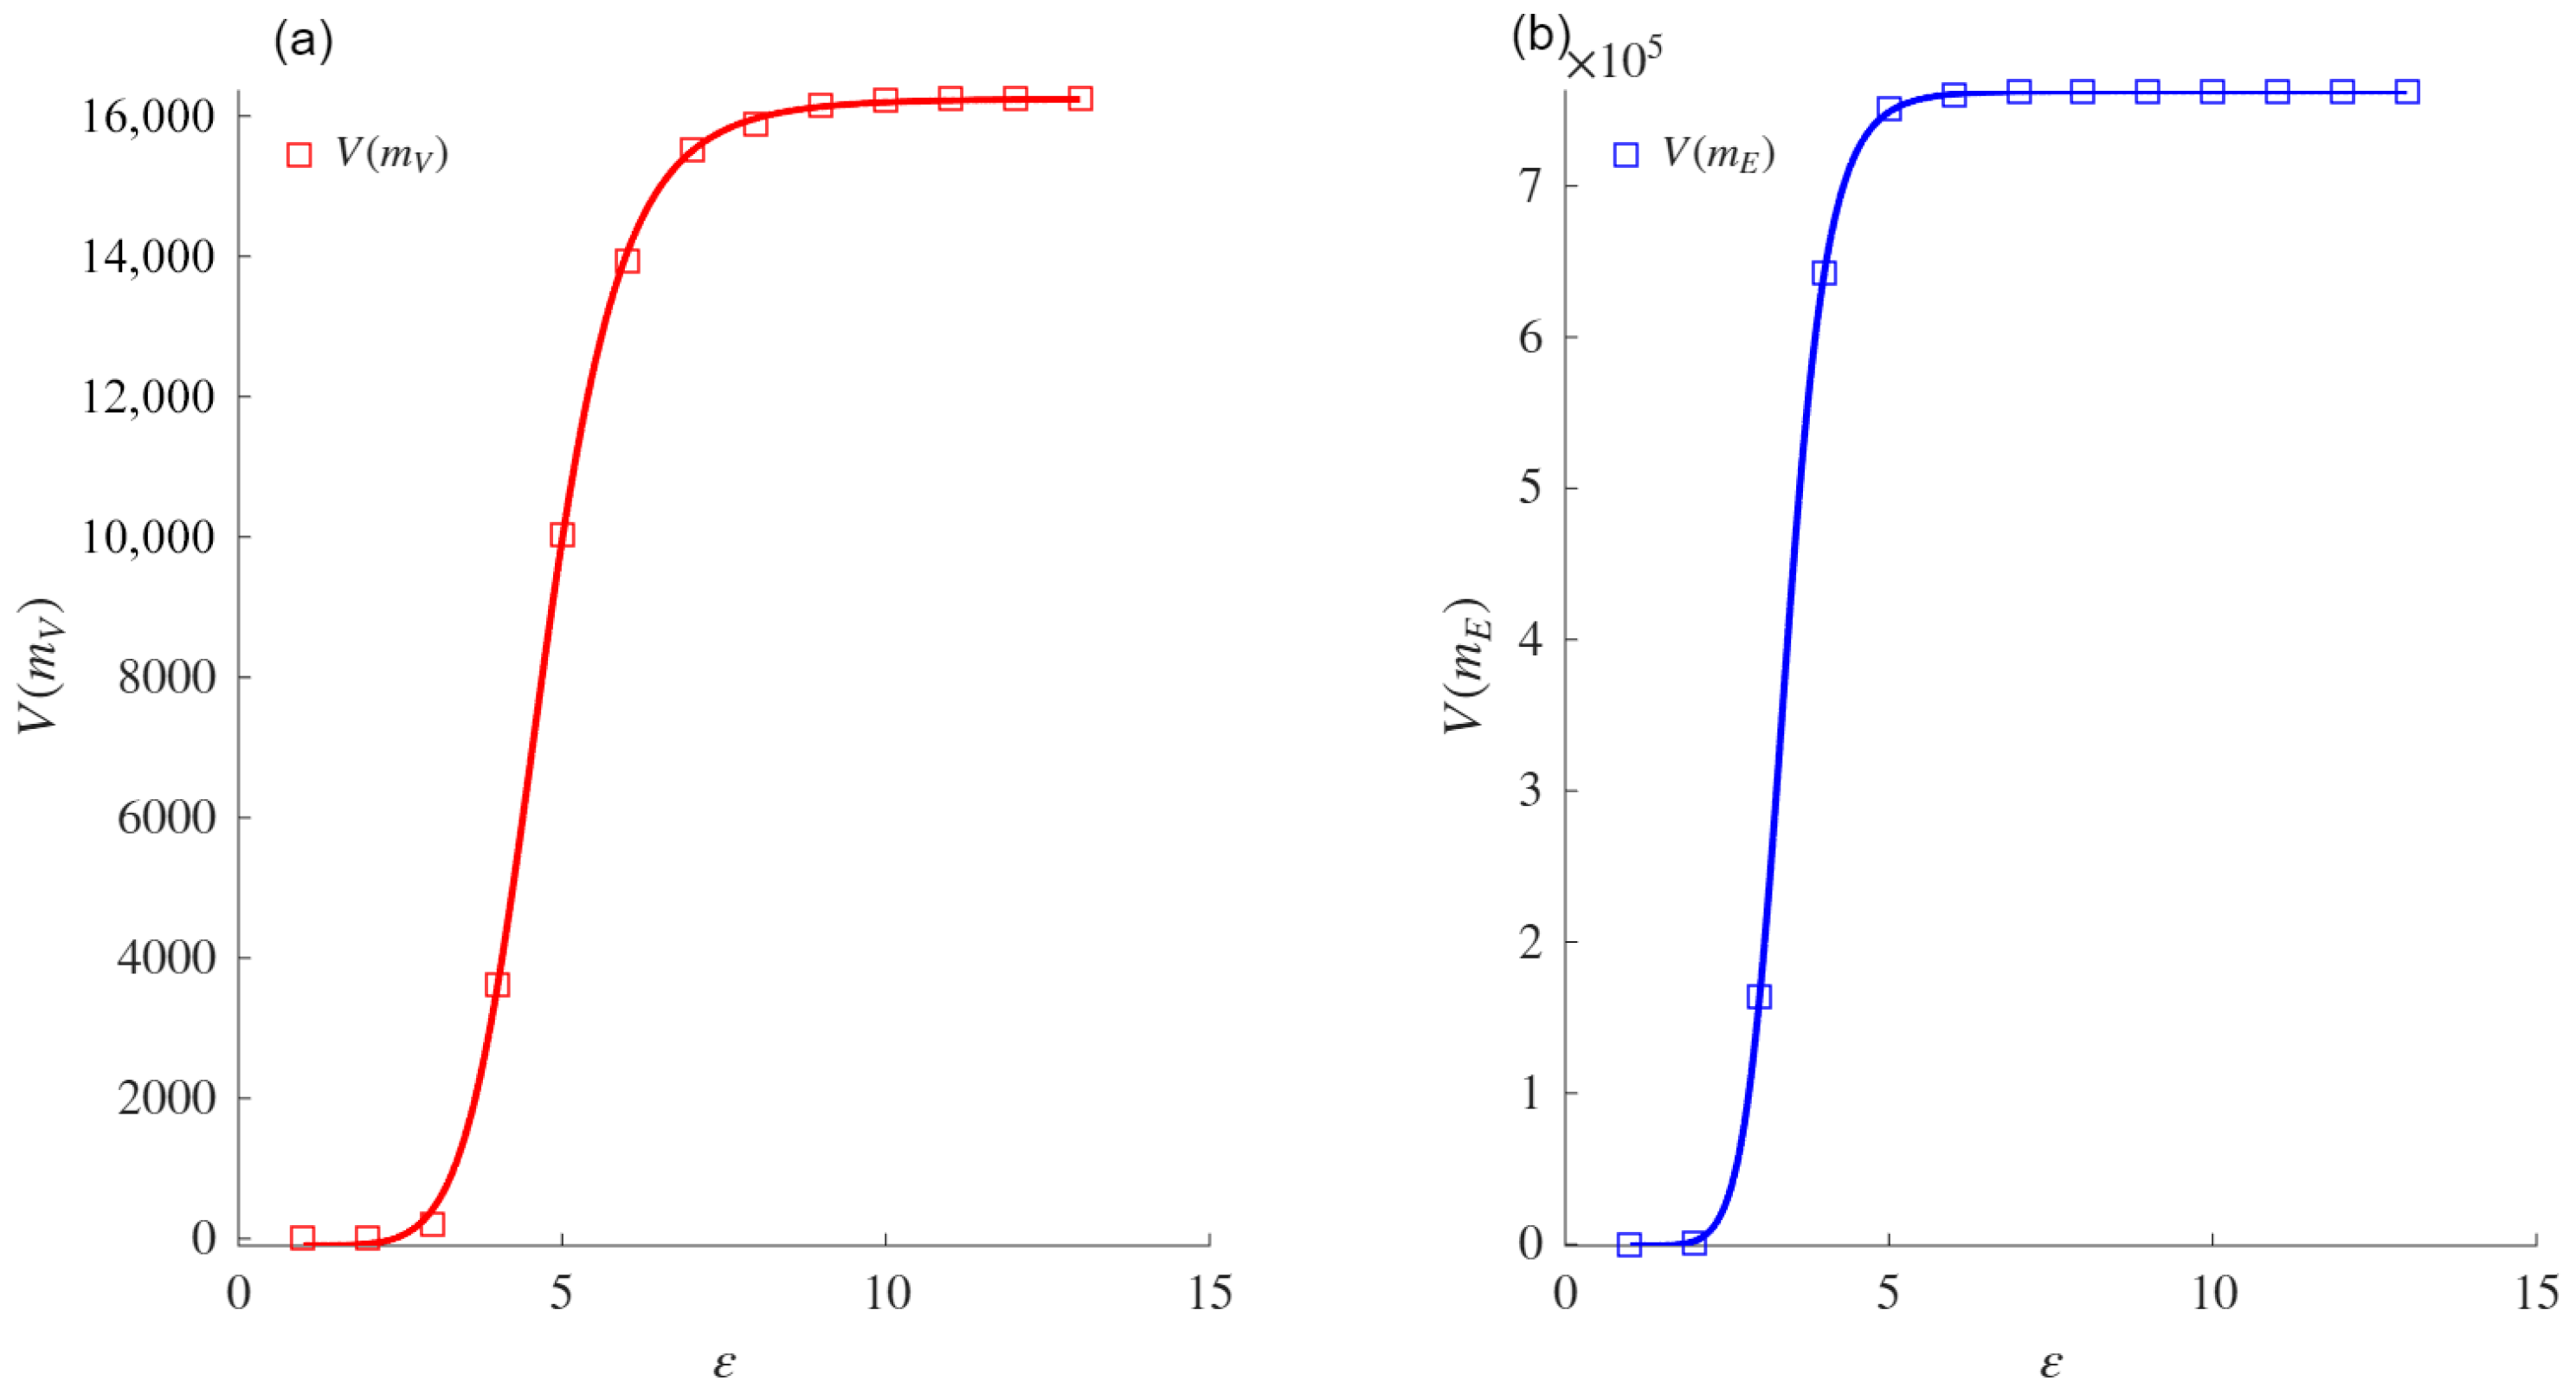
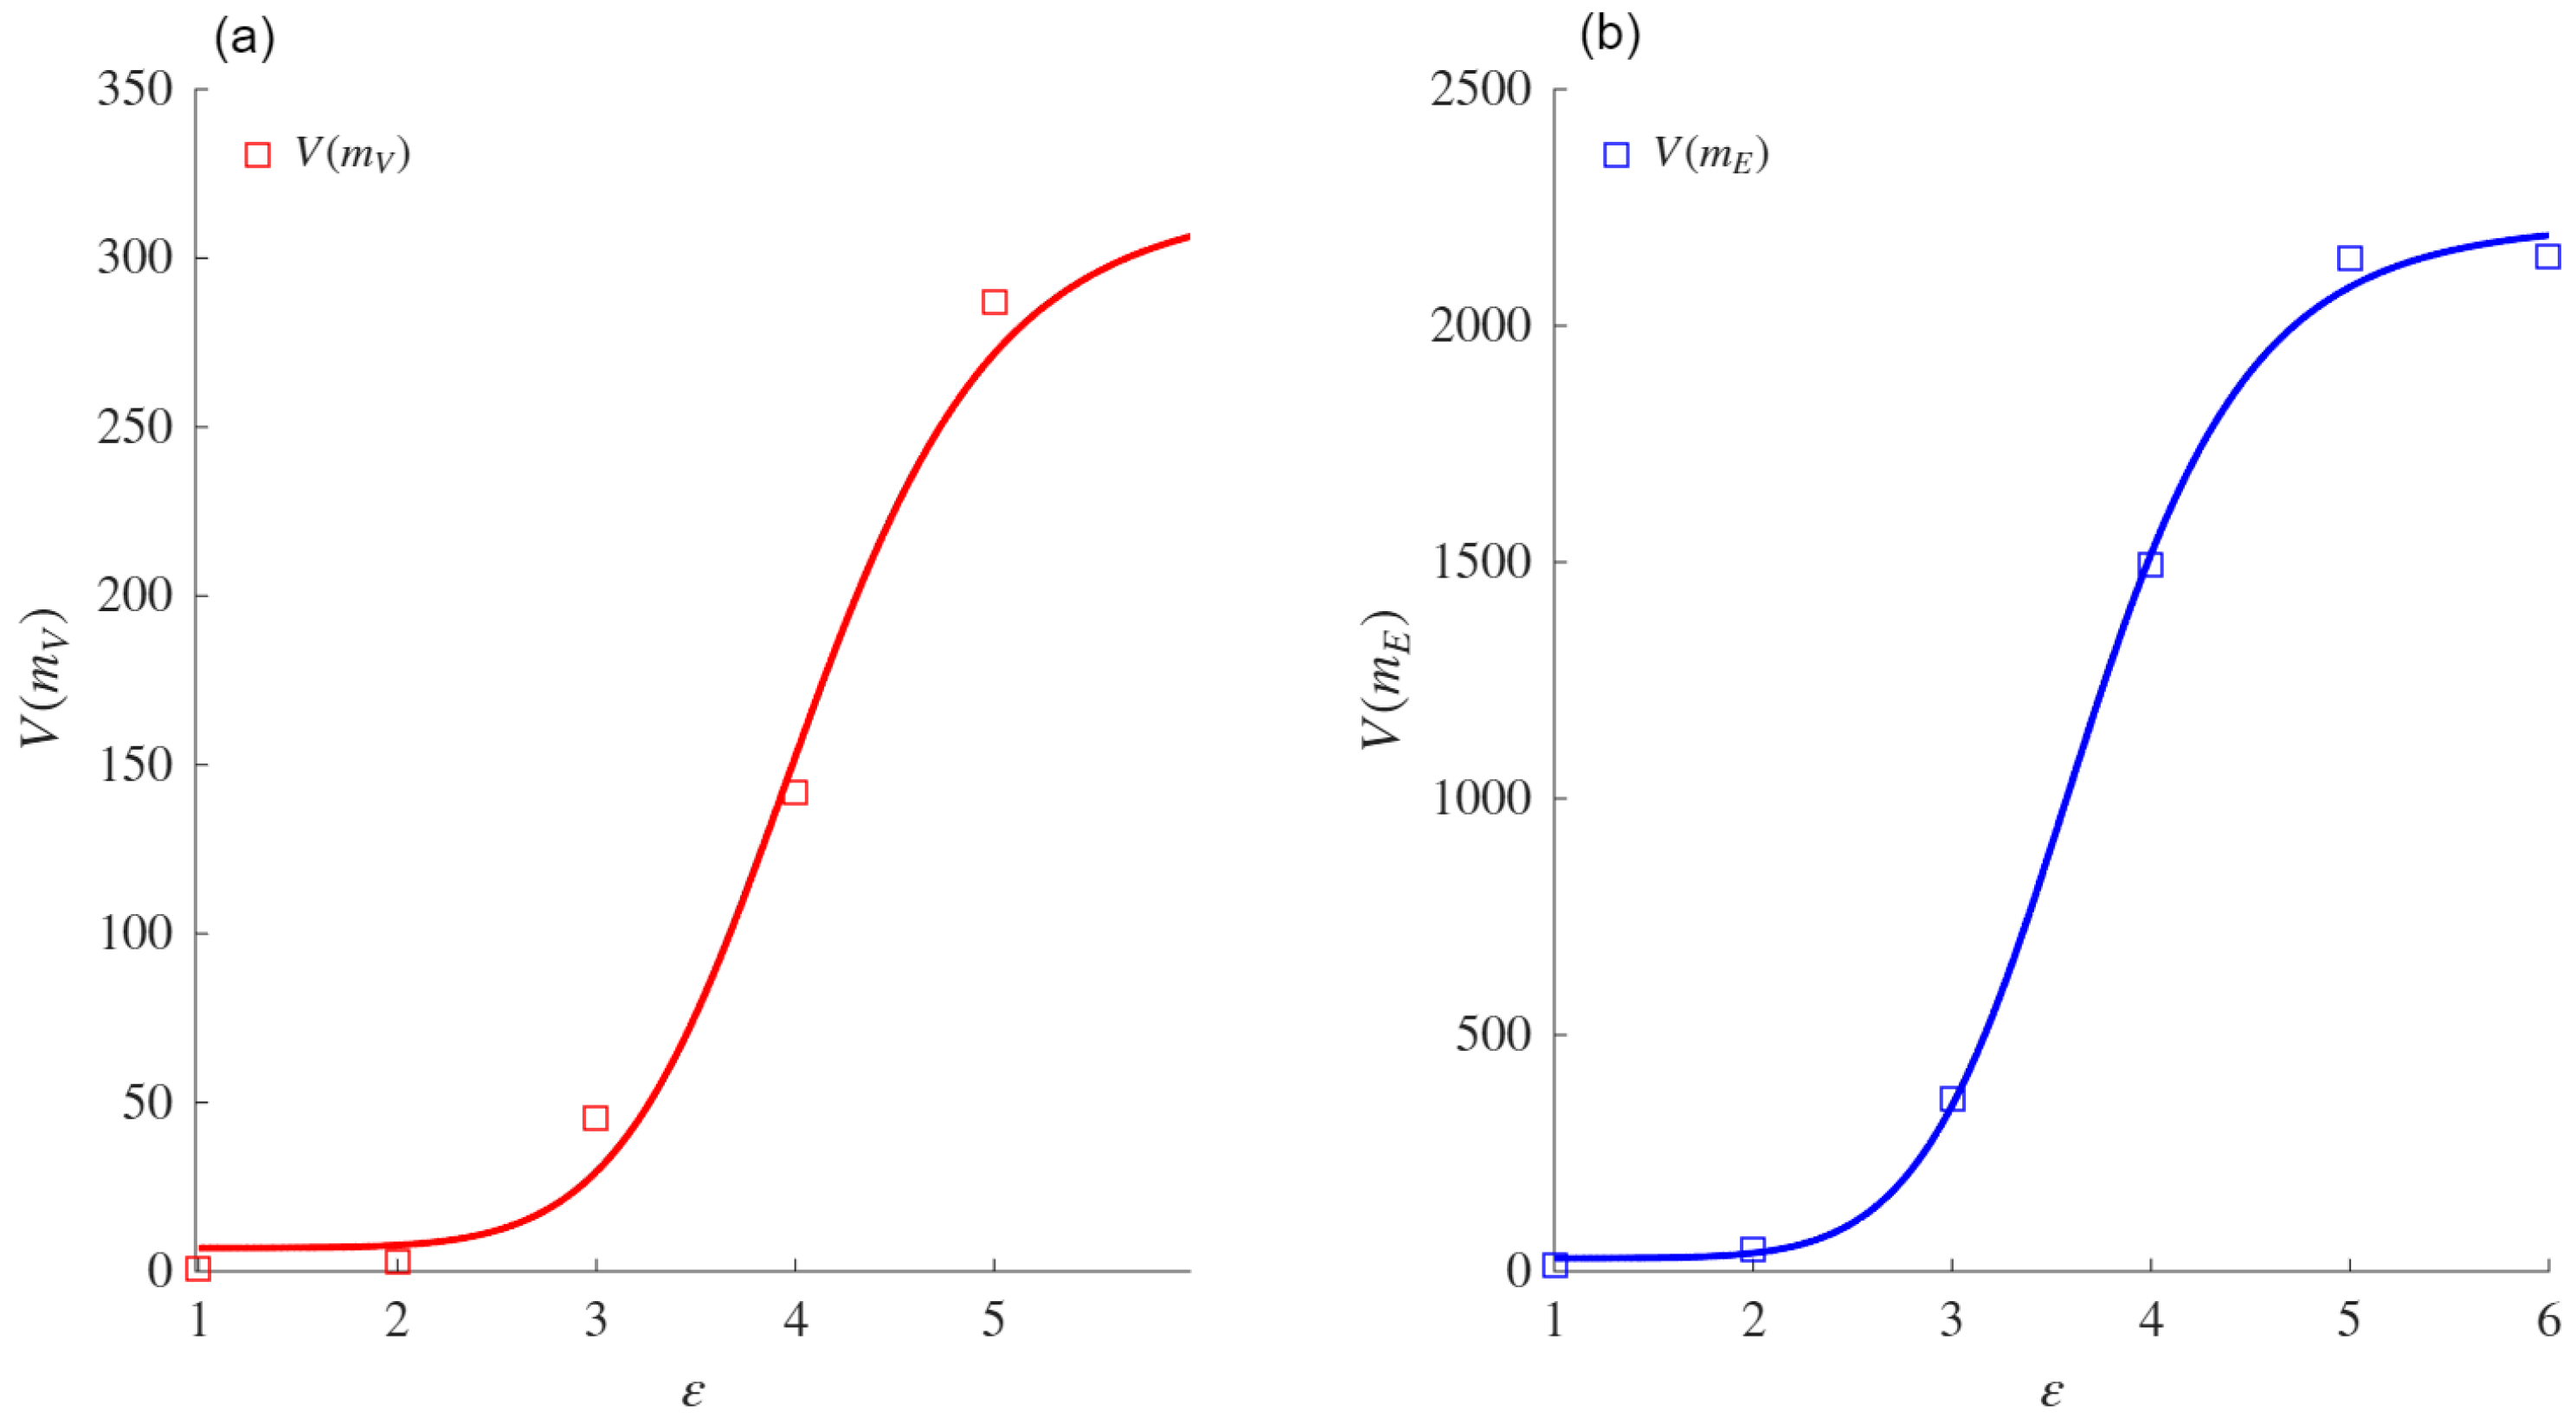
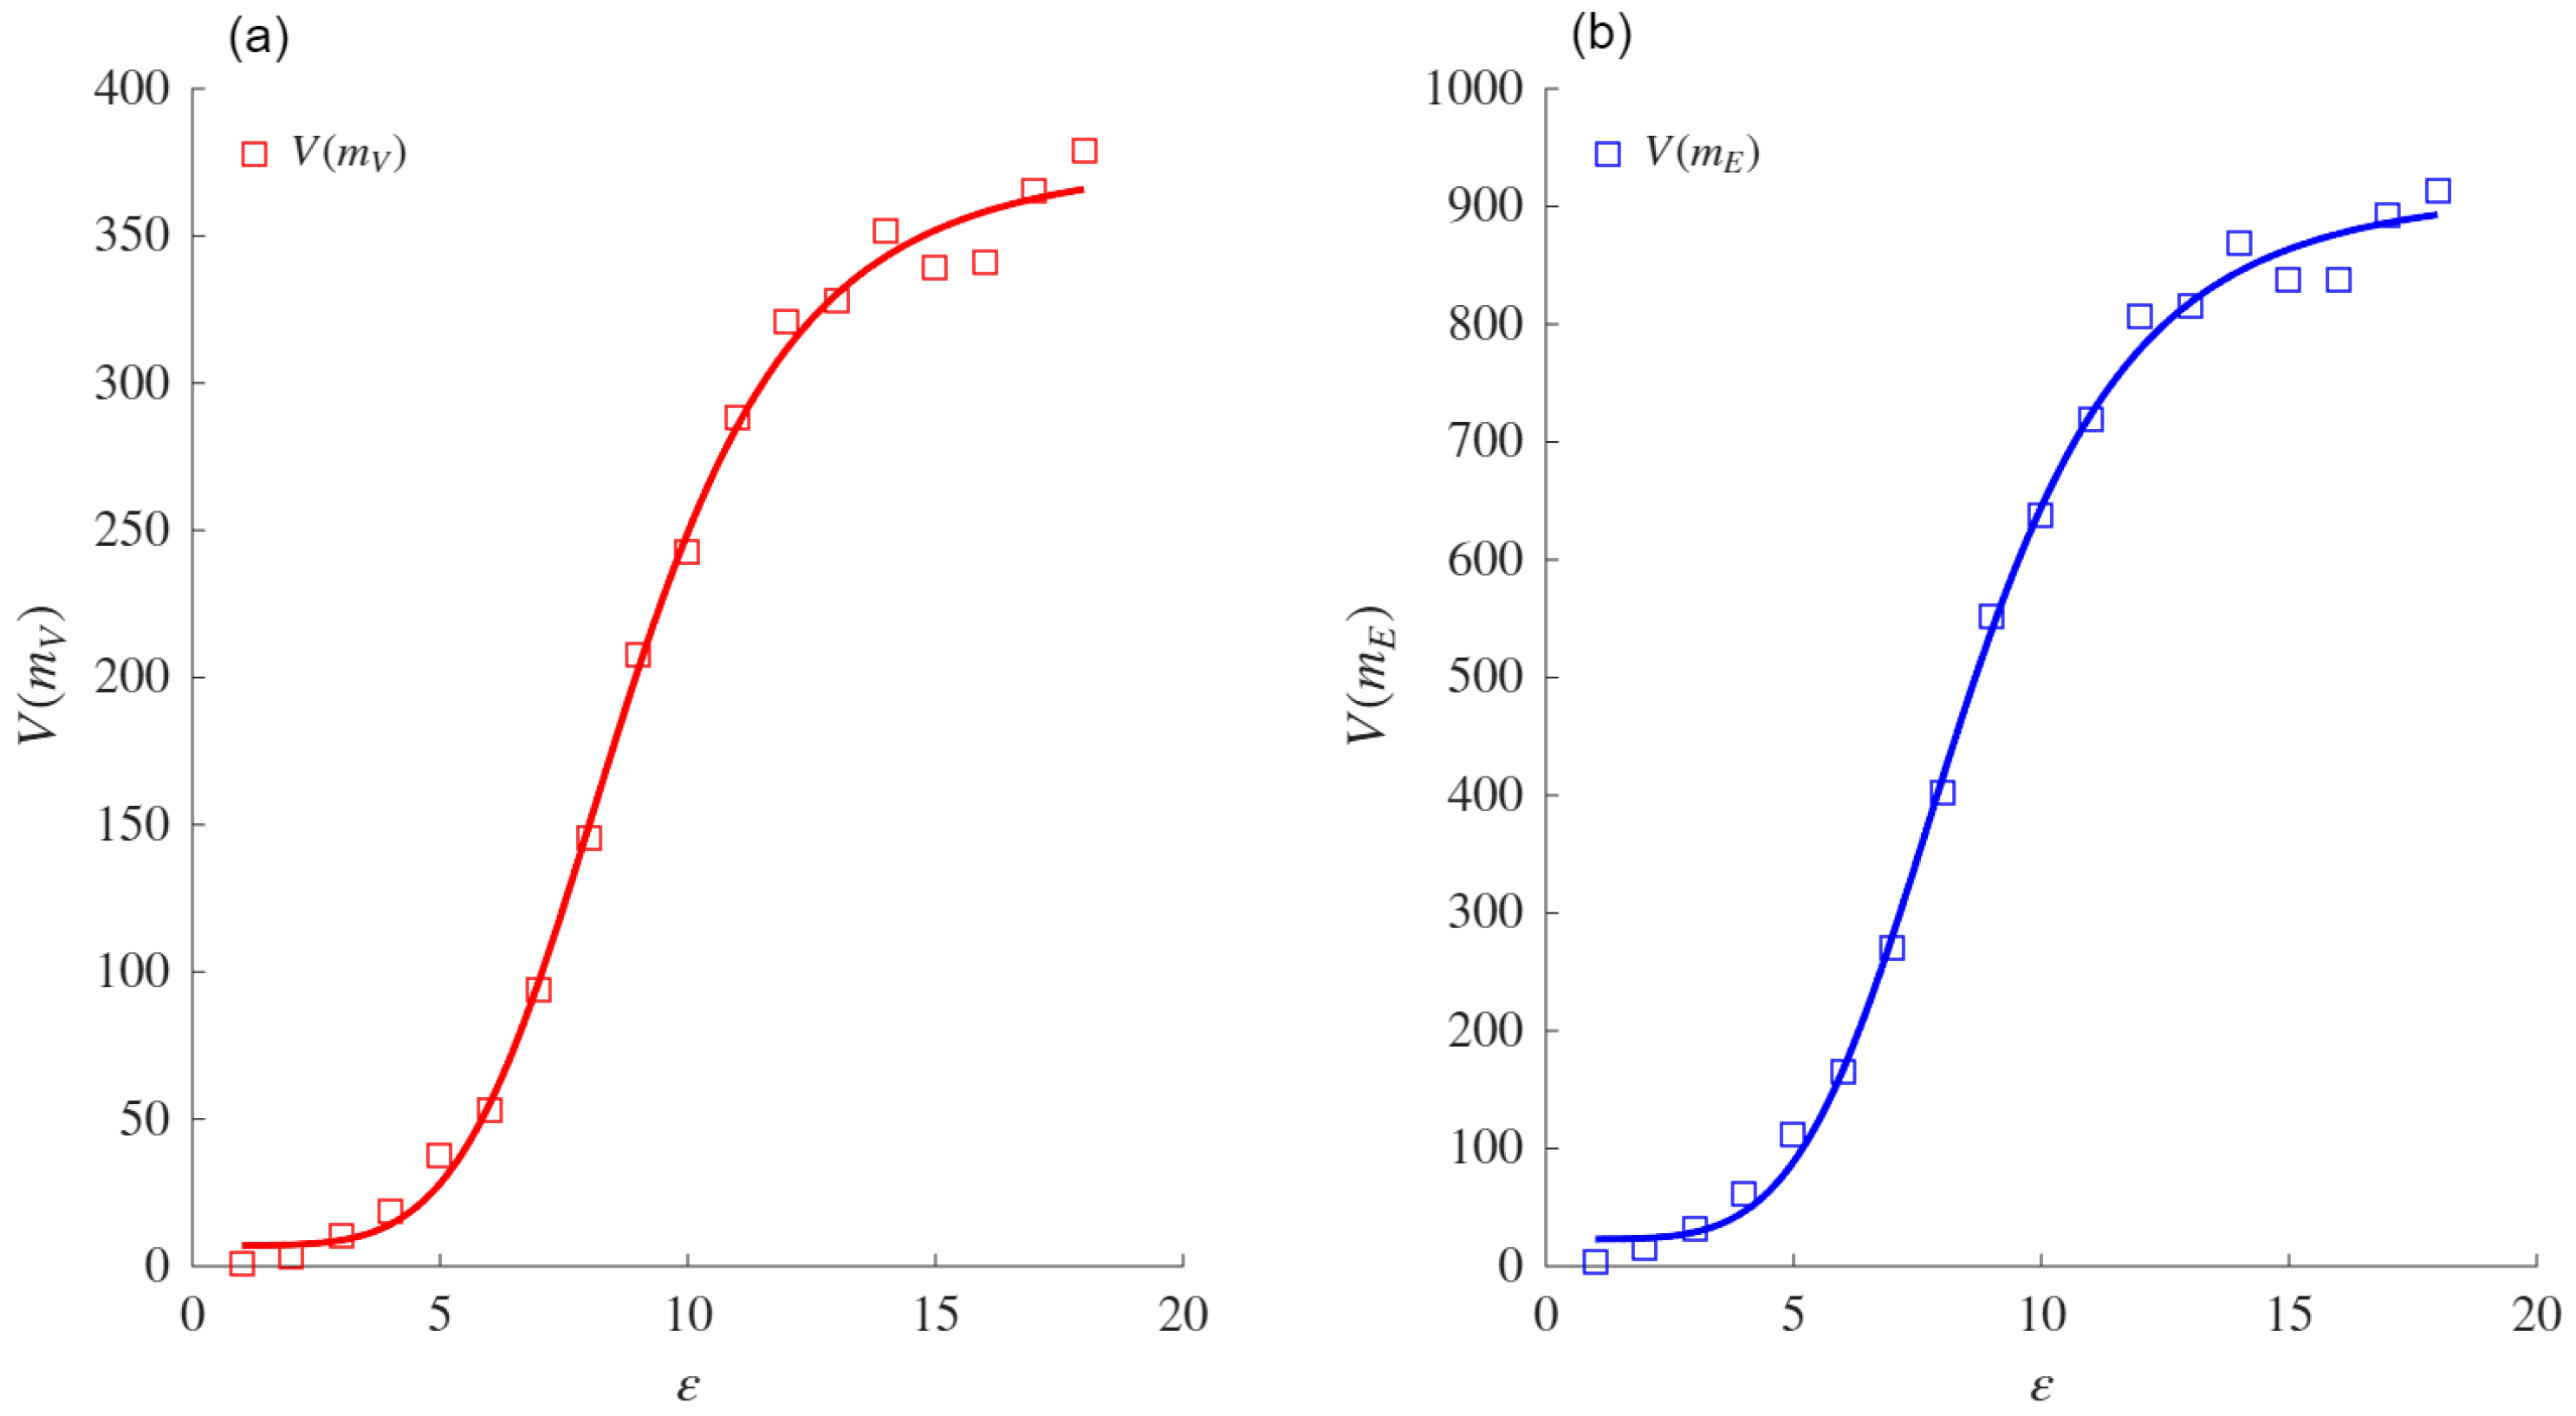
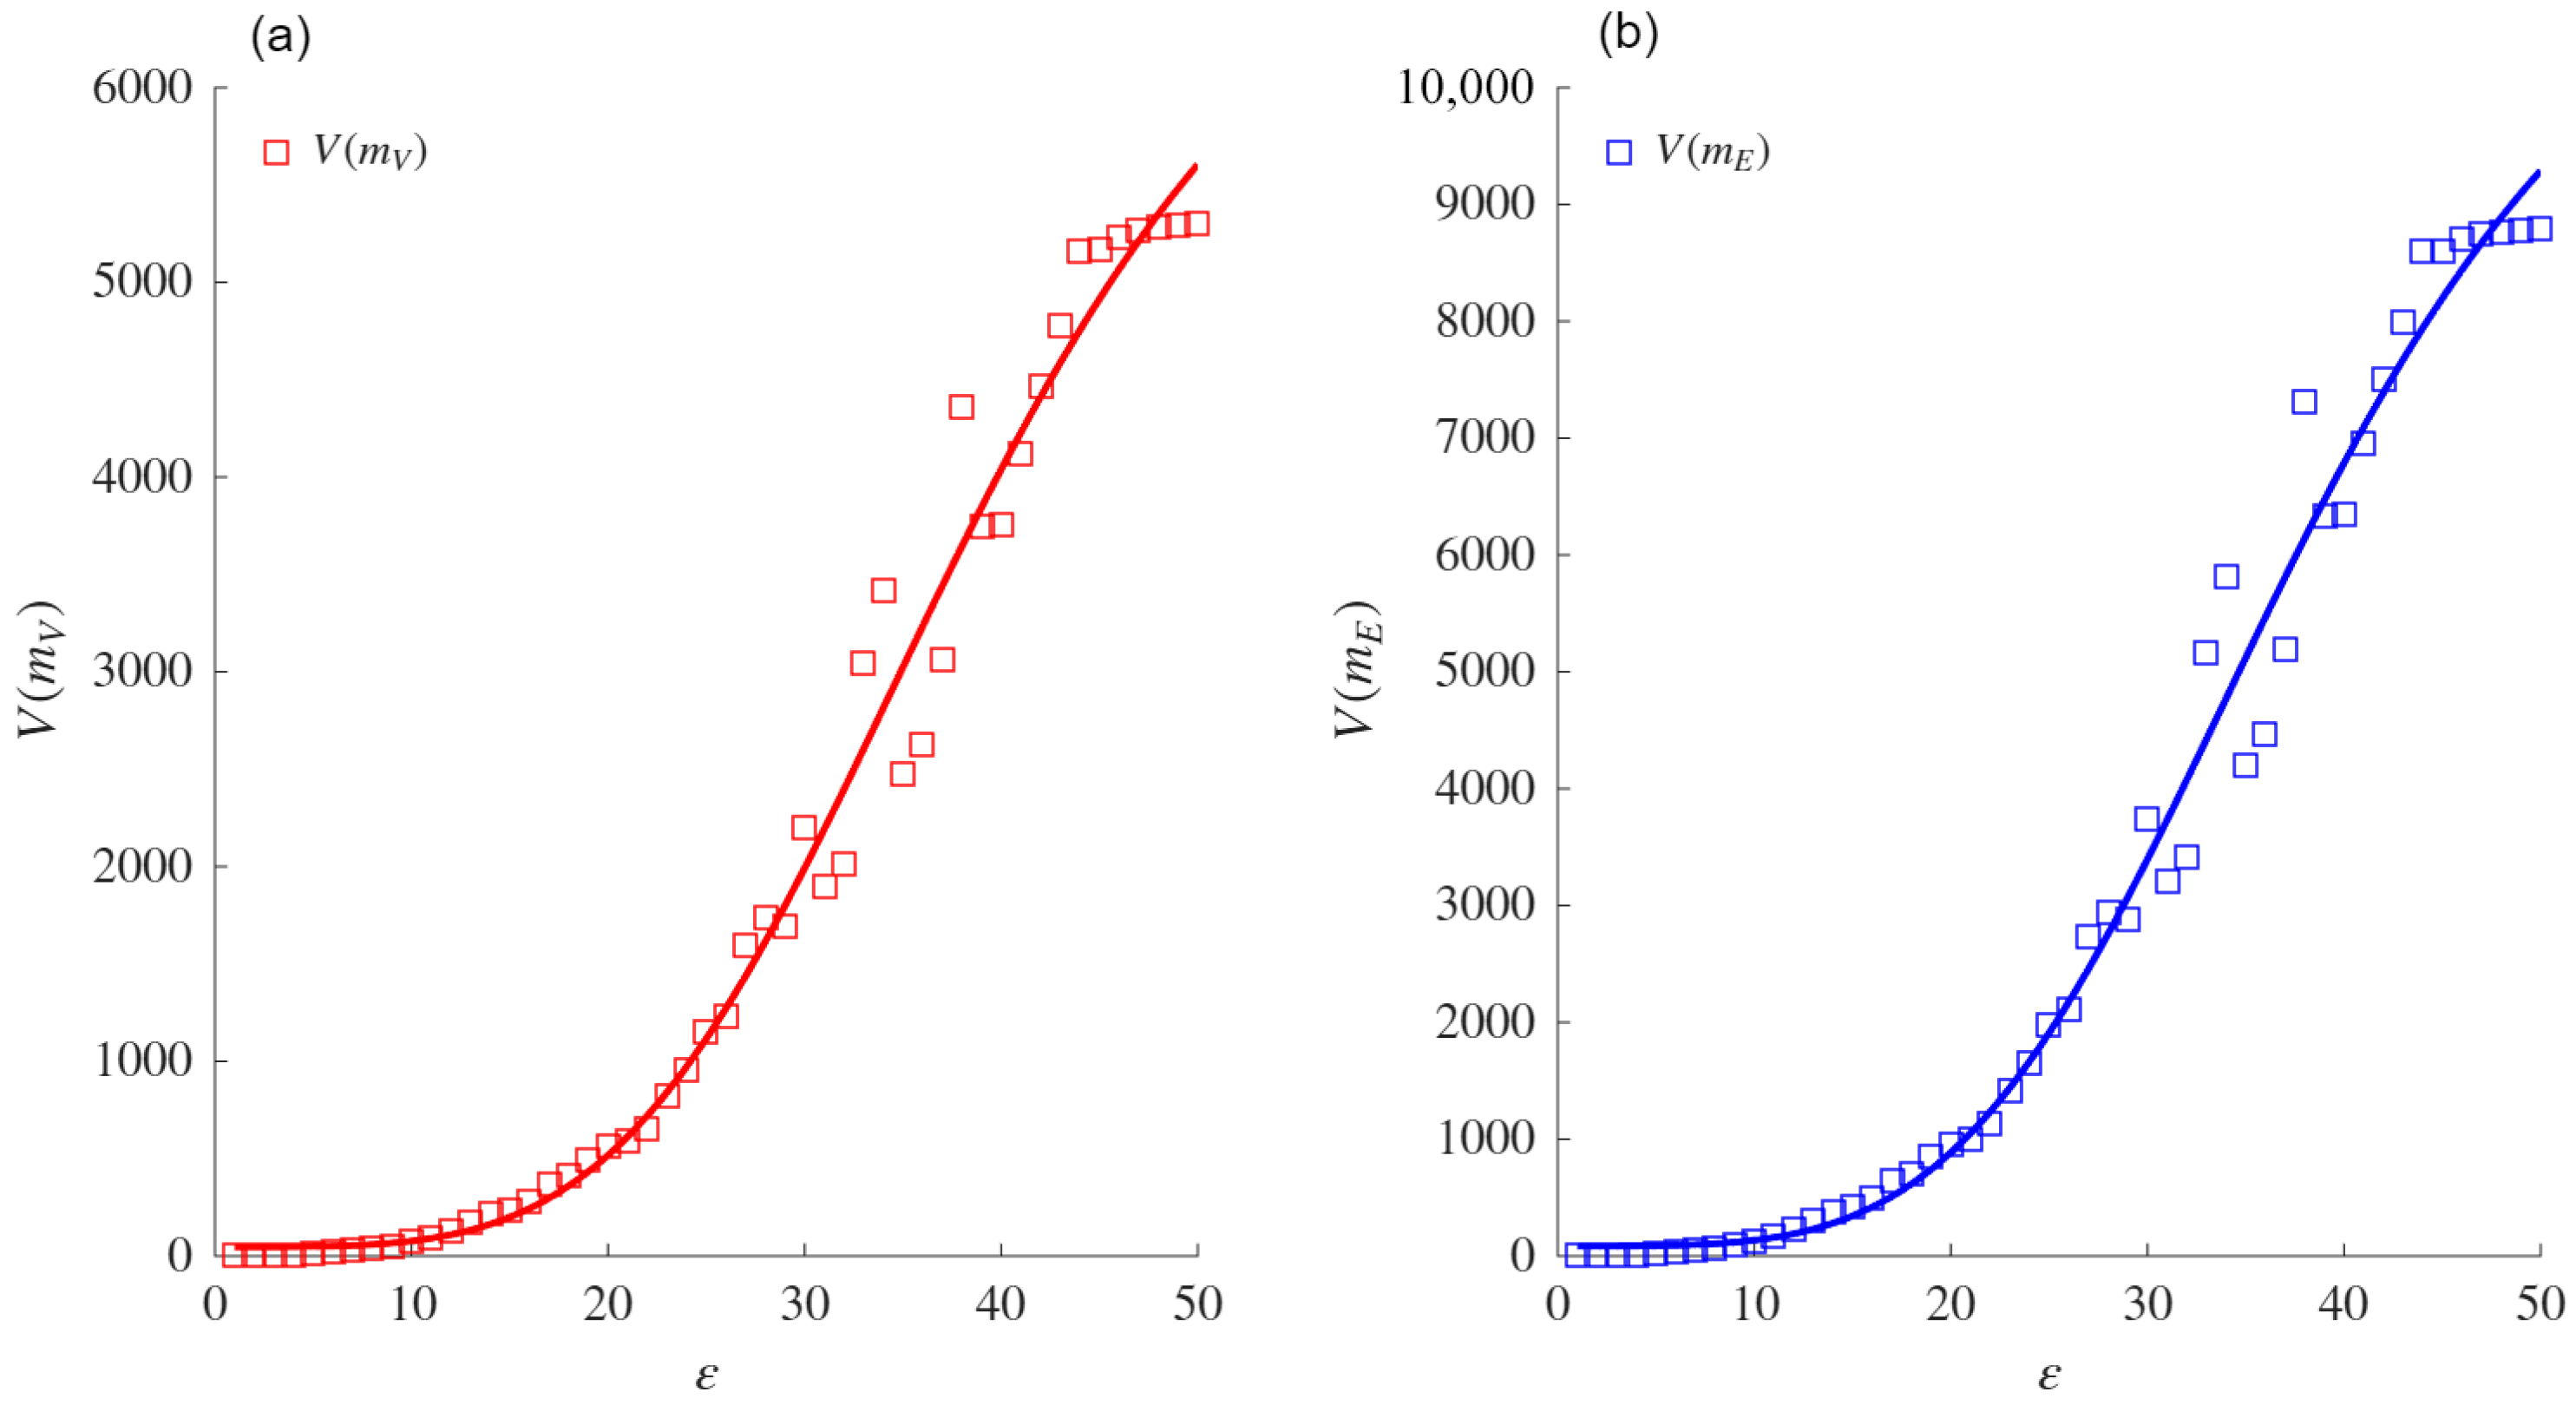
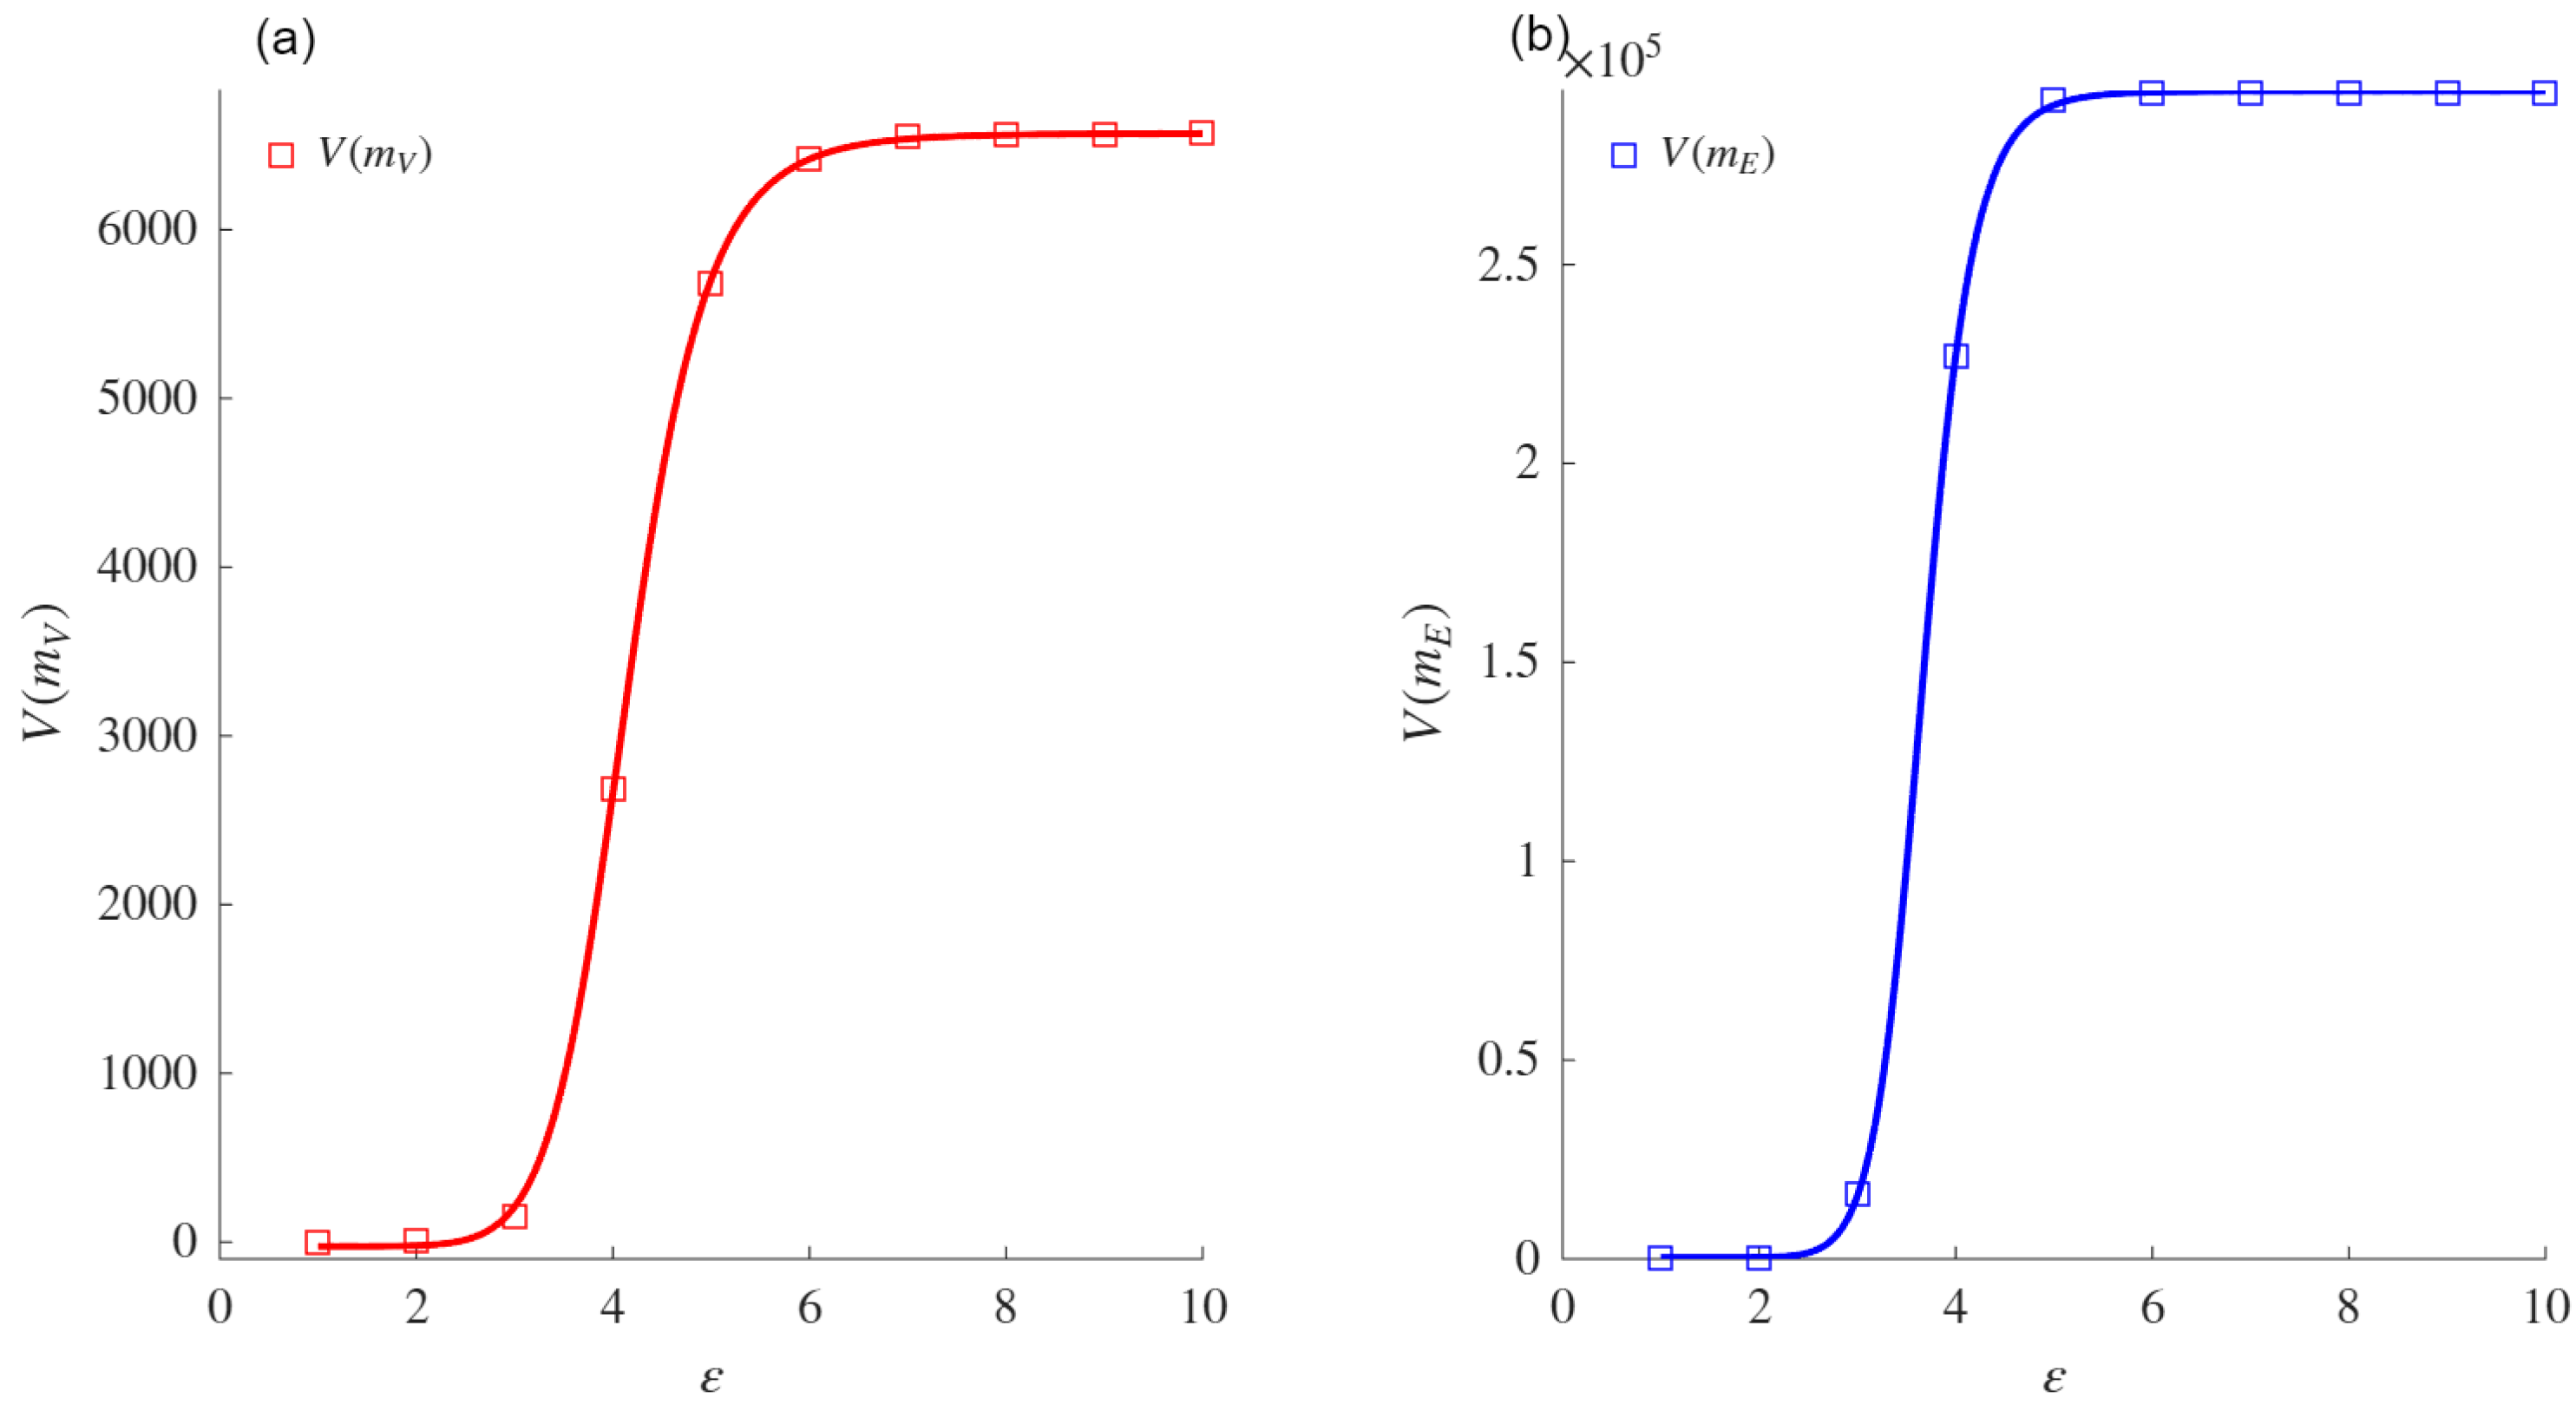
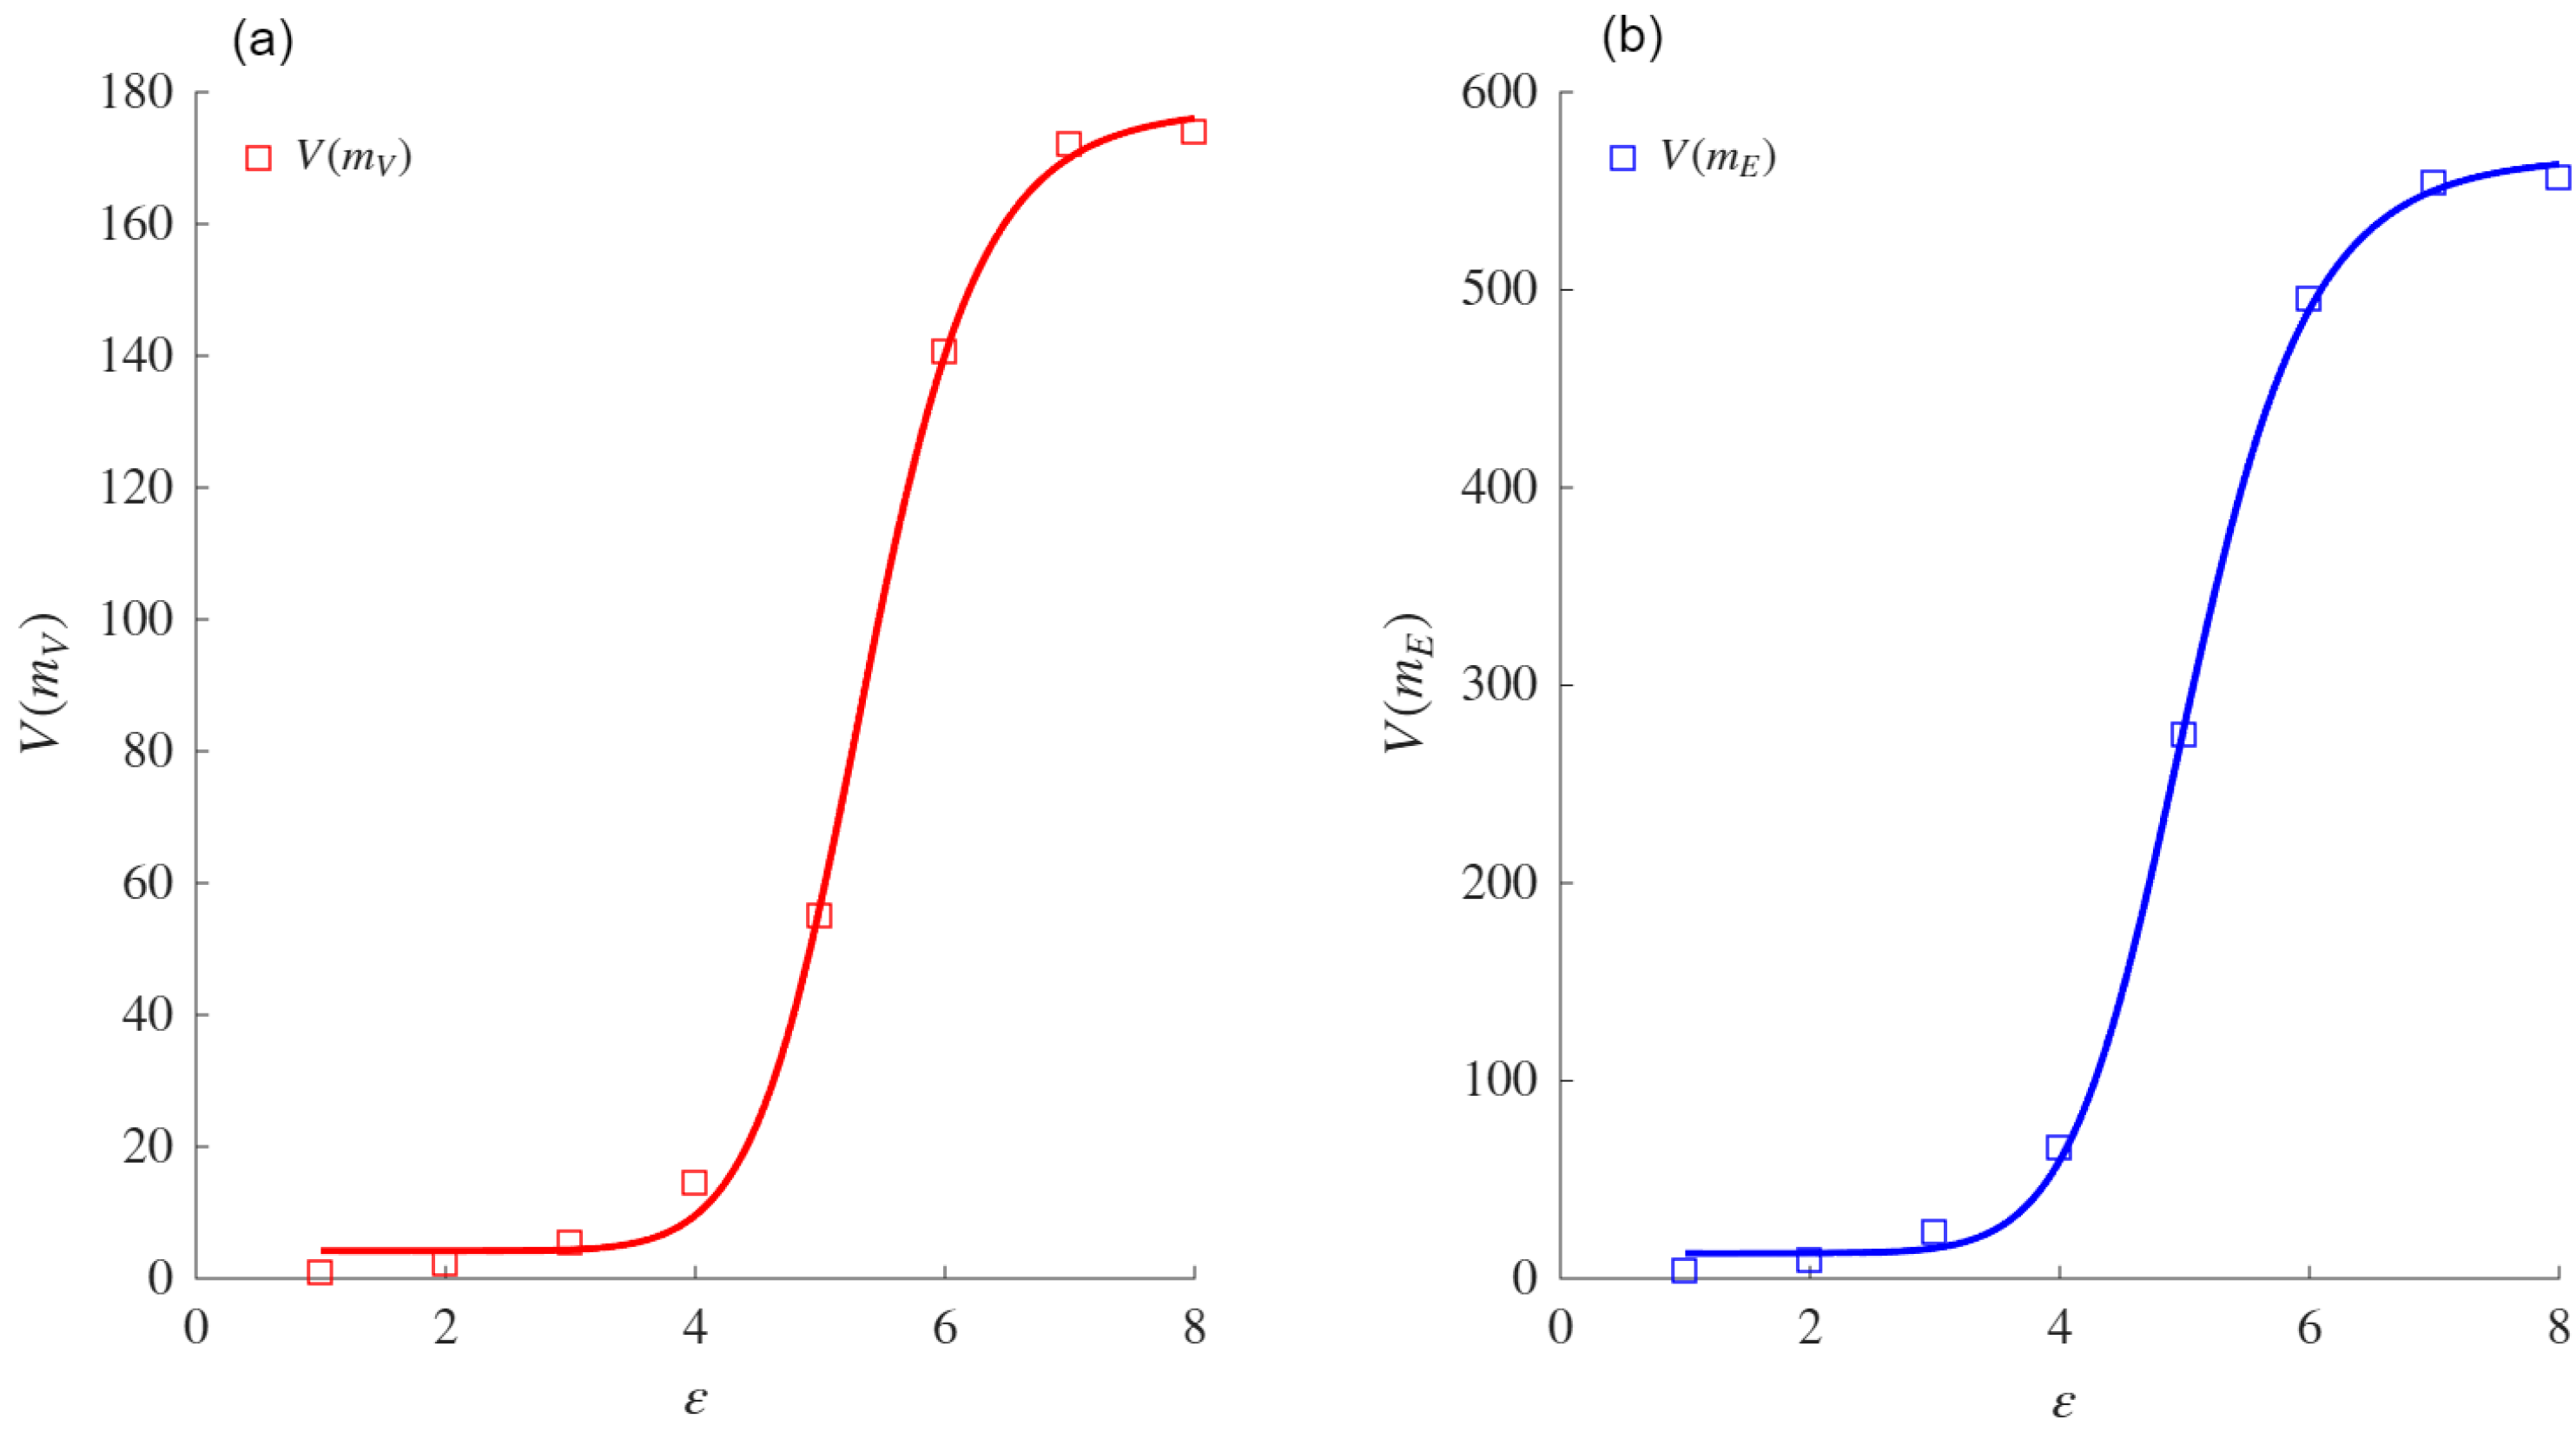
For these real and synthetic networks, the sigmoid asymptote Equation (
18) and power law asymptotes Equations (
1) and (
2) were compared using the AIC [
58], following which the optimal model was selected. In this process, the AIC was computed for each of Equations (
18) and (
1), then the minimum AIC is chosen to obtain
AIC =
min(
), where
corresponds to the AIC for each evaluated model. Note that Equations (
1) and (
2) are both power law asymptotes and differ only in the way the volume of the network is computed; thus, we refer only to the power law asymptote in Equation (
1). The model with
AIC = 0 was chosen over the others if the
AIC of the remaining models was at least 2. In contrast, there was no difference in choosing one of those that obtained
AIC < 2; this criterion enables the choice of a model that better fits the VMF while also being less complex (in terms of the number of parameters). This procedure was also employed to test the fit of the sigmoid and power law asymptotes to VD
and VDND
.
5. Conclusions
This research presents a new definition for the VD, which is based on the traditional concept of the VD but is extended by employing the definition of a mass function. The relationship between the proposed VD and the non-specificity term of the Deng entropy was also presented. The formulation of the VDMF was extended by incorporating mass functions for the nodes and edges, thereby capturing the structural characteristics of complex networks.
The sigmoid asymptote is proposed as a model to compute the VDMFs for the nodes and edges. Experiments conducted on both real and synthetic networks showed that this asymptote provides a better fit than the power law asymptote when fitting the VMFs for both nodes and edges. The comparison was performed using the AIC, which measures the fit while penalizing models based on their number of parameters. Exceptions were noted for specific networks (e.g., ZCK and MAR), in which both asymptotes performed similarly or the power law aymptote was slightly favored due to its simpler formulation. When the power law asymptote obtained a better evaluation based on the AIC, the VDs obtained from both mass functions coincided with those obtained using the sigmoid asymptote. These results support the conjecture that the sigmoid asymptote is equivalent for such networks.
The VD and VDND calculated in real networks using the sigmoid asymptote were higher than those obtained with the power law asymptote. This difference highlights the sensitivity of the sigmoid-based formulation to variations in network heterogeneity and connectivity patterns. The comparative analysis also confirmed that the fit of the sigmoid asymptote to the VD and VDND is superior to that of the power law asymptote, reinforcing its reliability in measuring structural complexity.
In the context of WS networks, the experimental results demonstrated that the VDMF values for the nodes and edges increased with the rewiring probability (p) and the average degree (Z), reflecting the topological changes induced by these parameters. Therefore, the sigmoid asymptote was shown to better fit the VDMFs for the nodes and edges when compared with the classical power law asymptote.
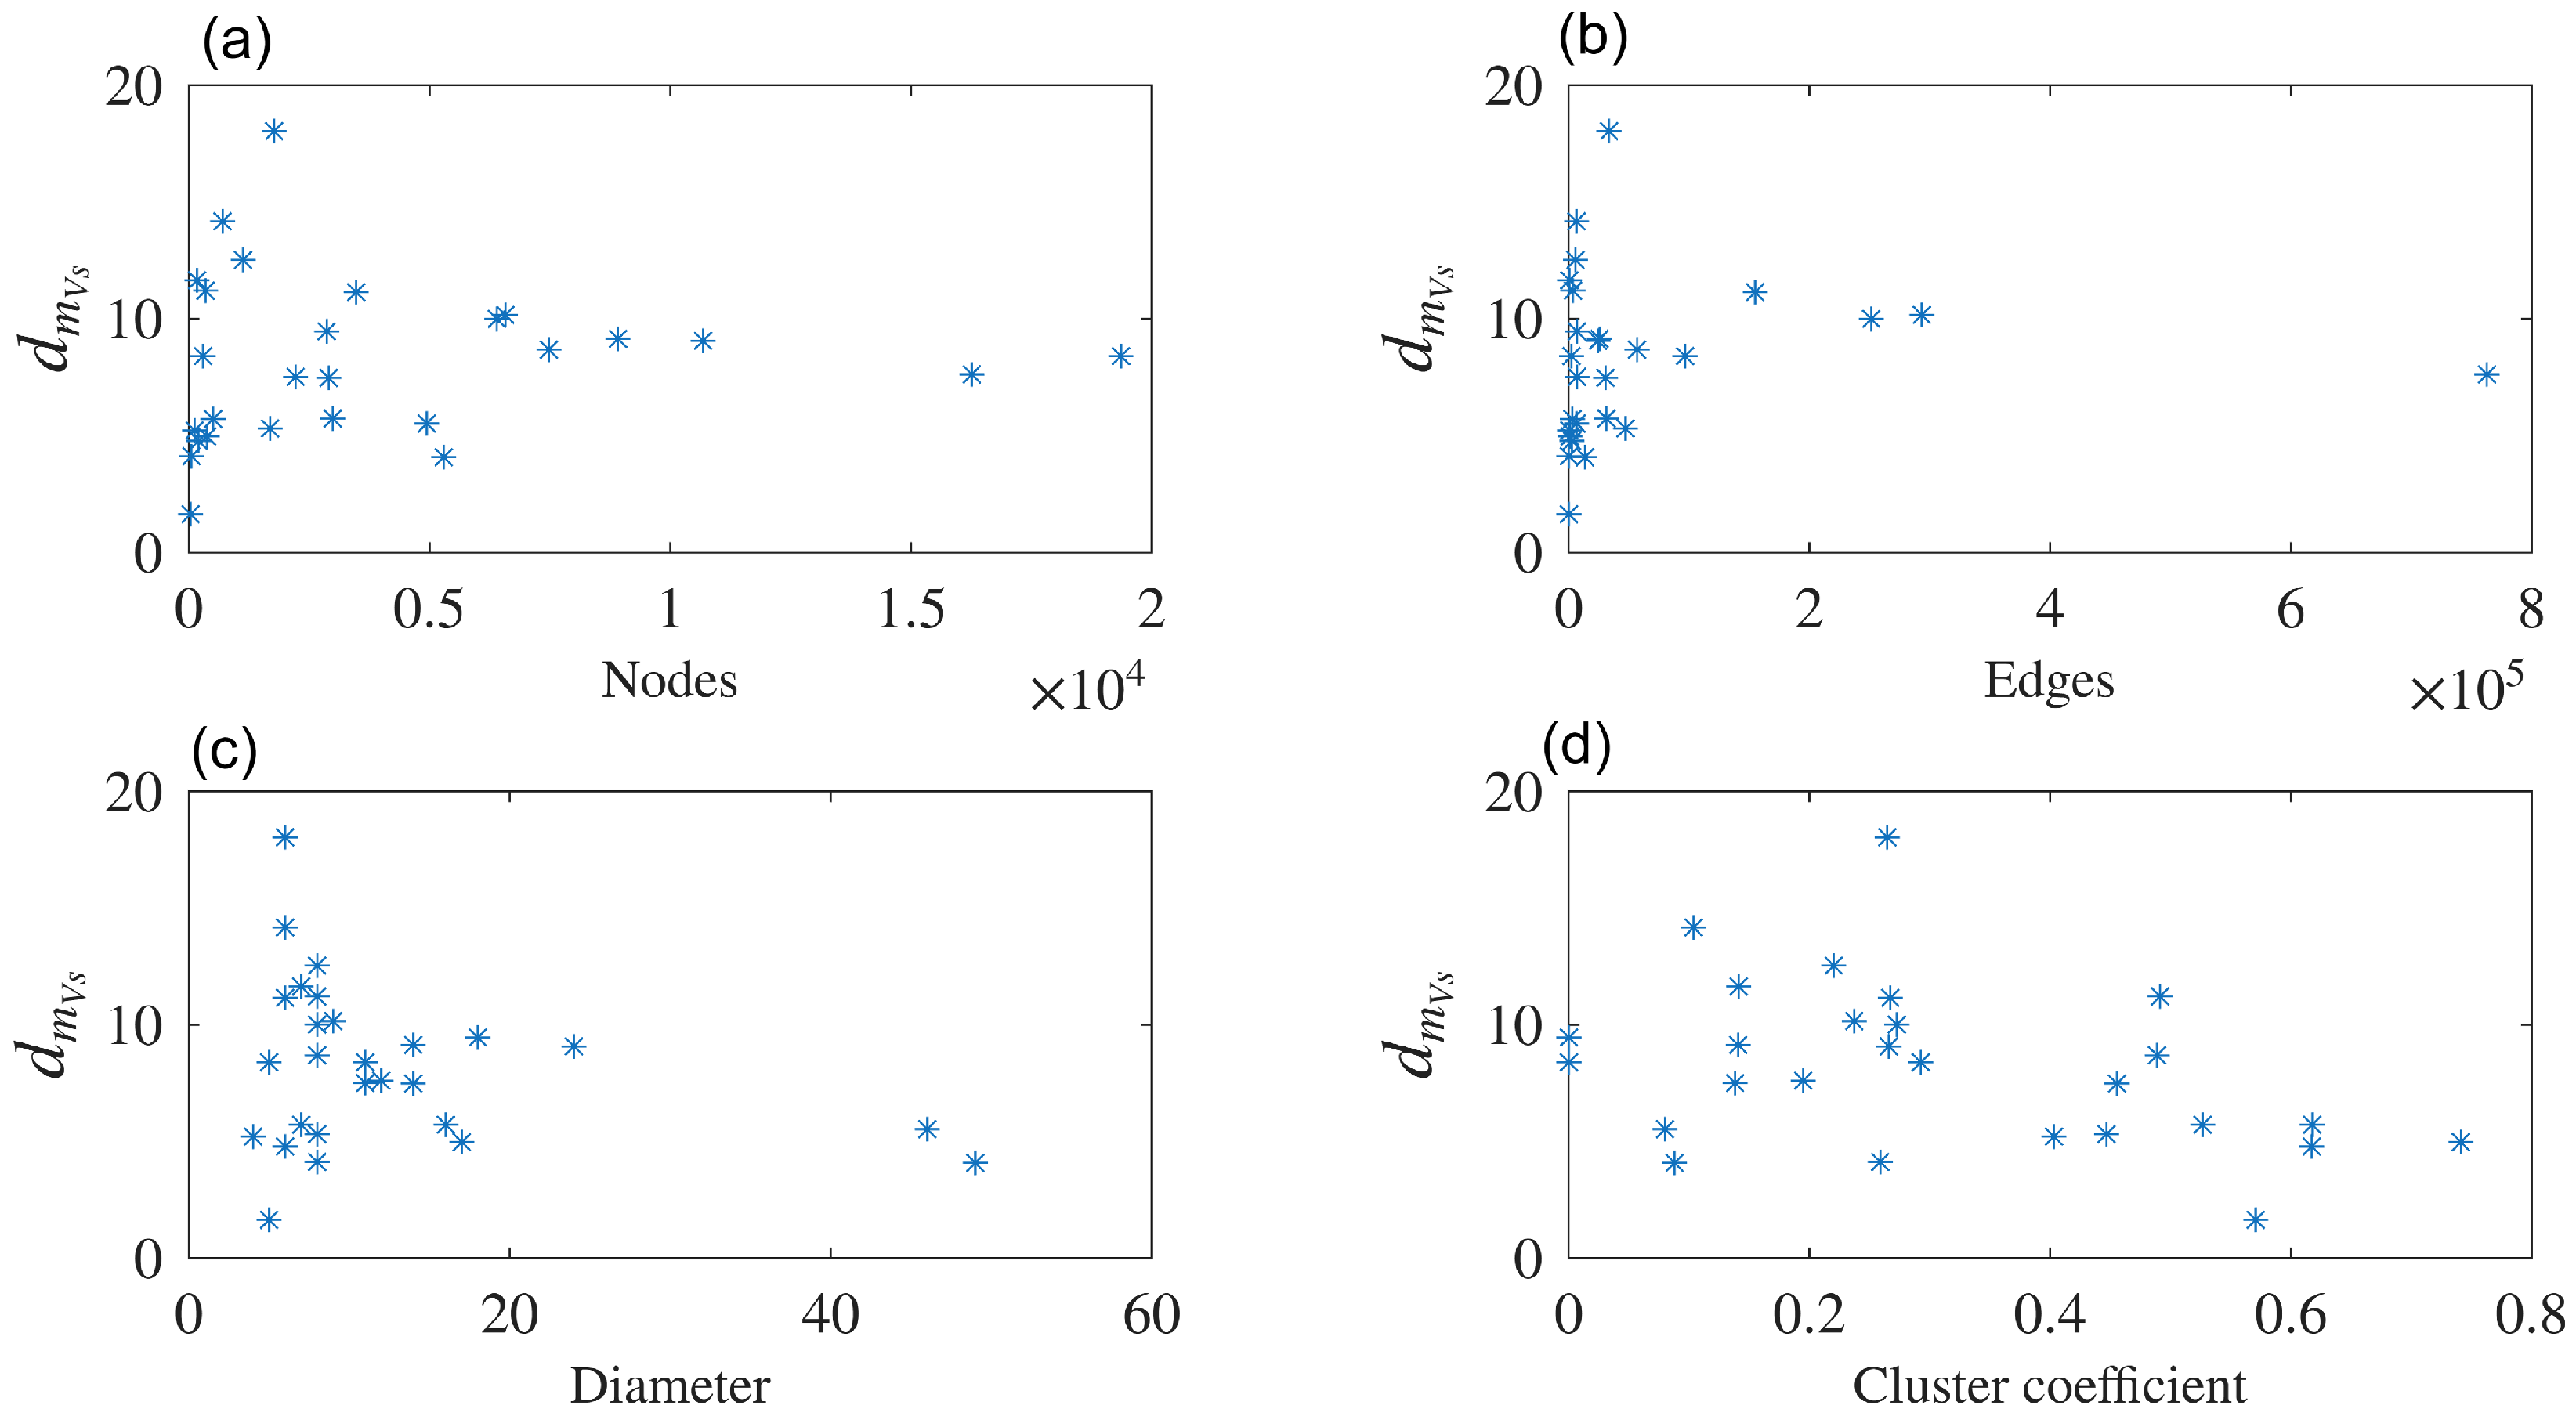
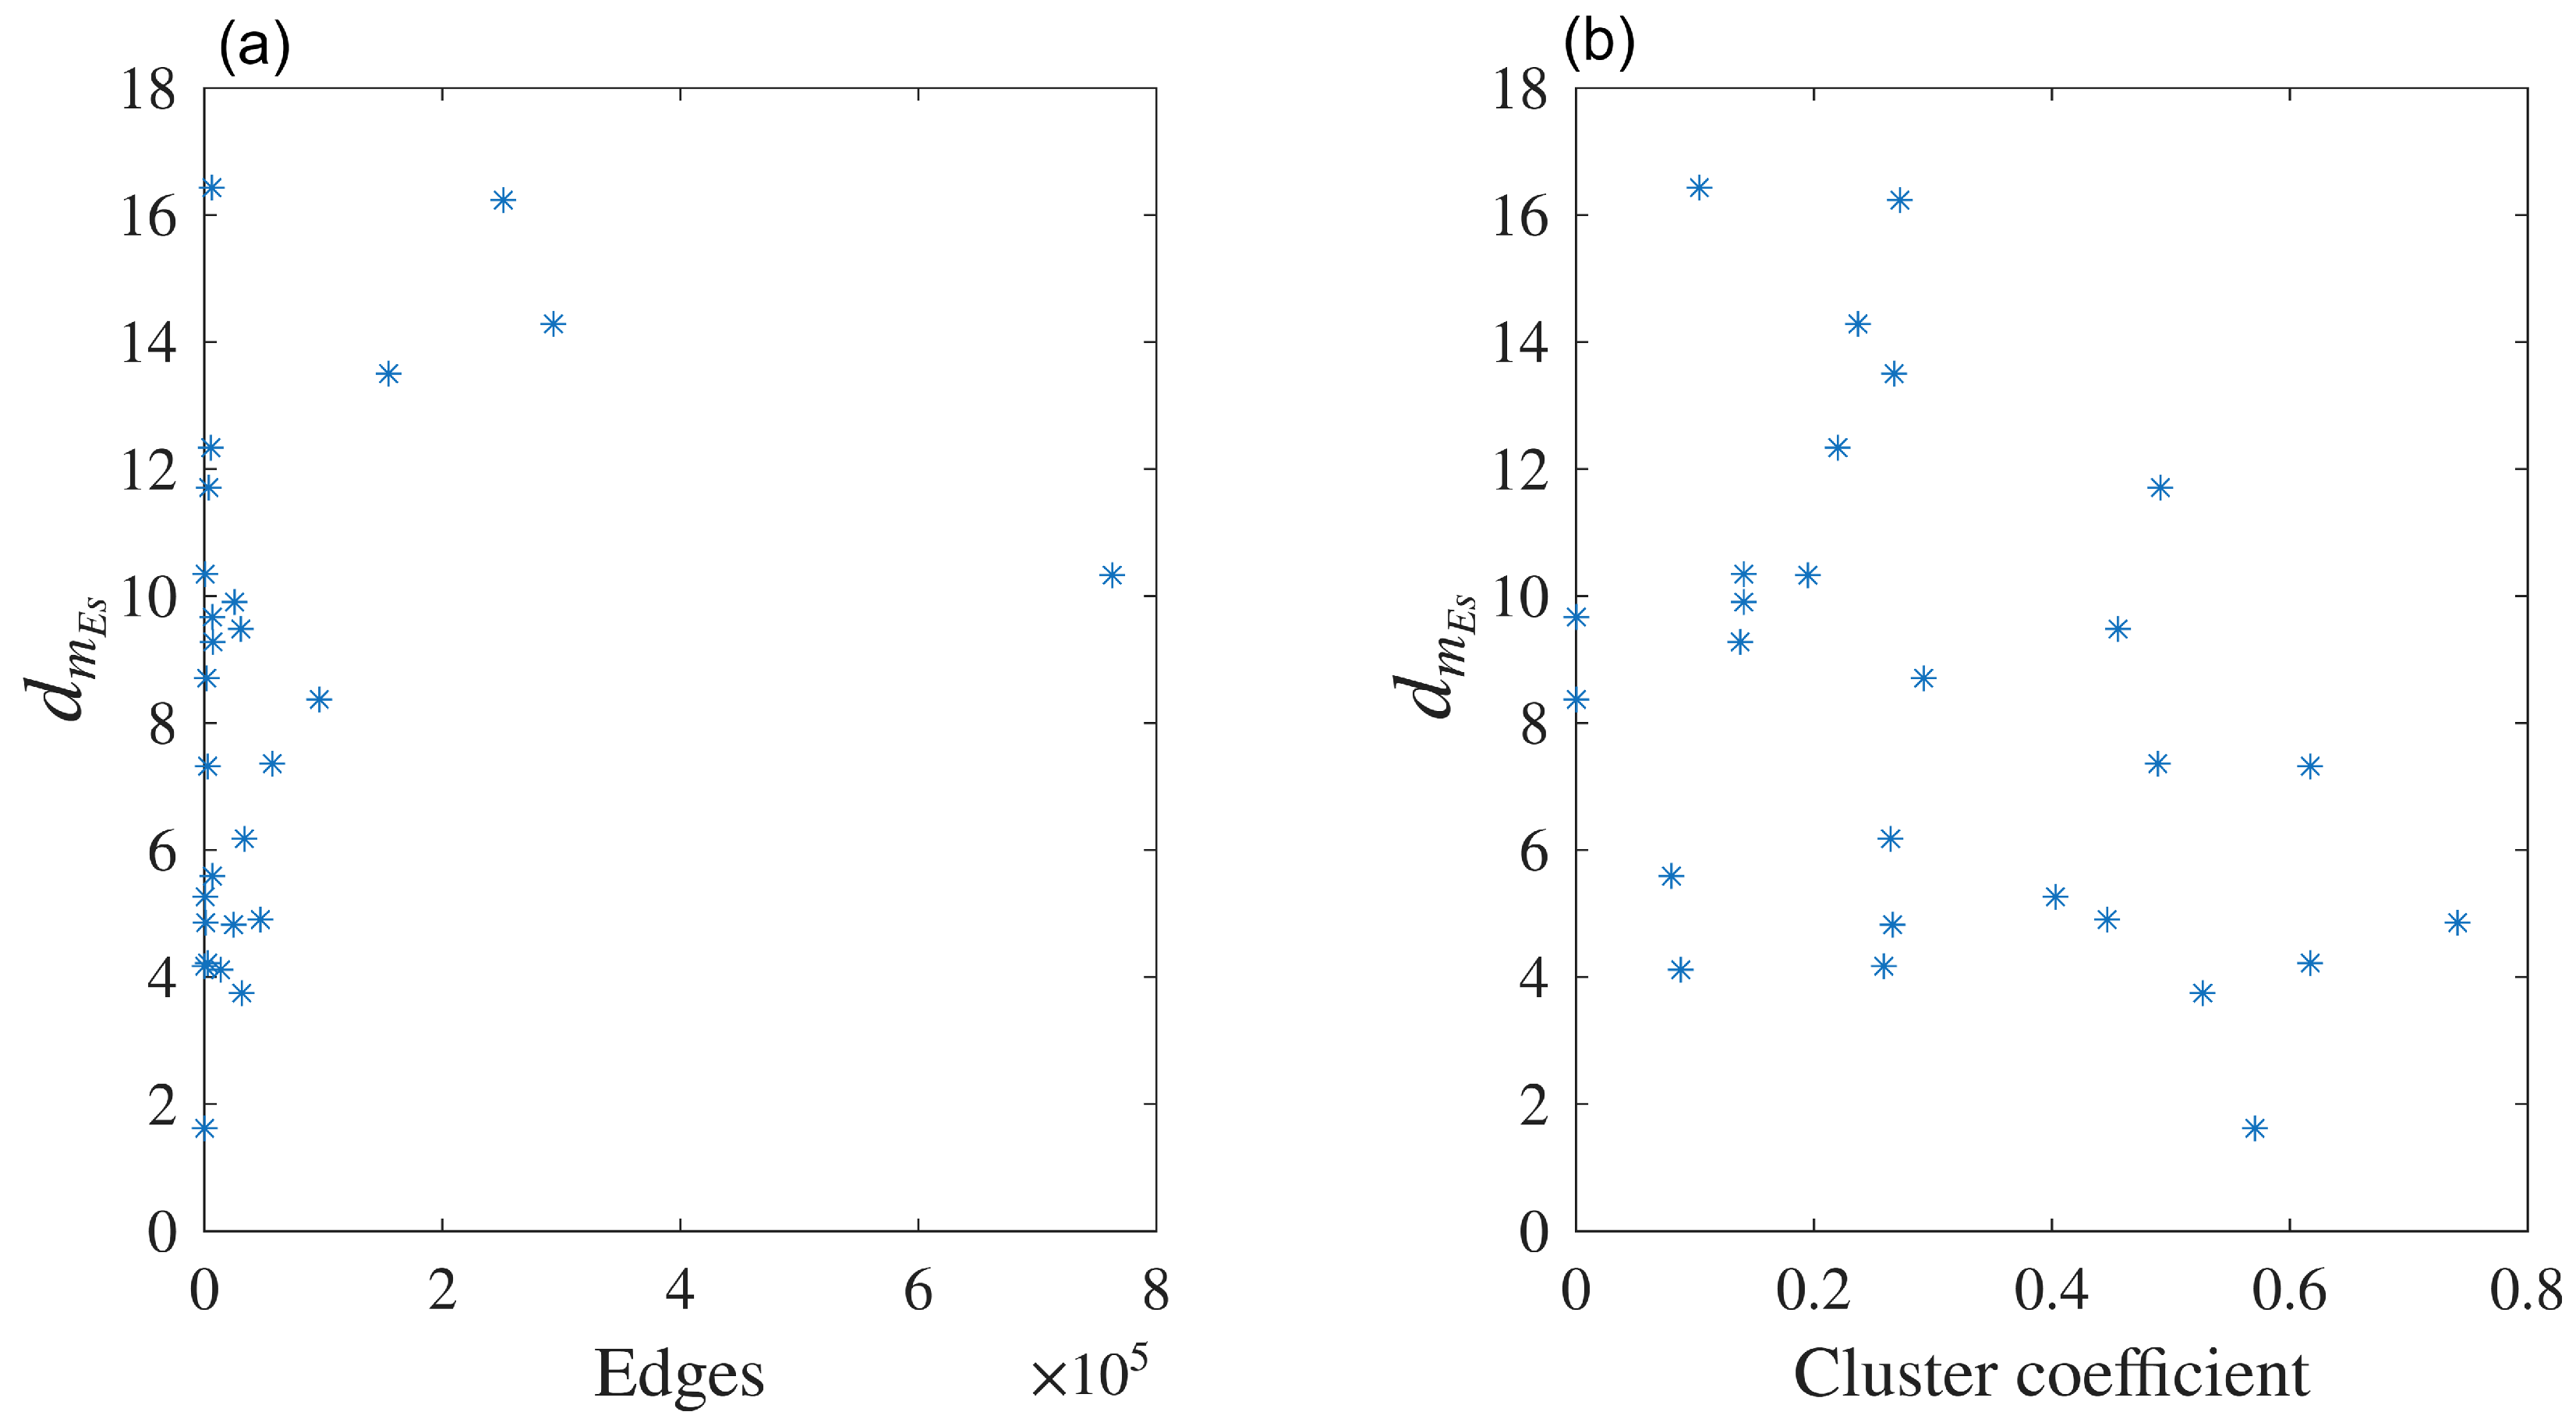
Although the definitions of the classical VD () and VDMF for the nodes are similar, the values obtained in our experiments differed for real and WS networks. The previous conclusions were identical to those with the VDND and the VDMF for the edges , providing evidence that the proposed model can be considered as a different measure to quantify the complexity of the networks. Furthemore, the VDMF for the nodes was found to be correlated with the cluster coefficient, and the VDMF for the edges was correlated with the number of edges and cluster coefficient of the network.
This research will be extended to the use of the VDMF for the nodes in the context of community detection. The box-covering algorithm aggregates nodes according to the box size (
), and the issue of identifying the best size could be solved by proving
=
,
, where the inflection point
is a potential value of
allowing for determination of communities in the network covered by the boxes. Furthermore, the classification of networks using the VMFs for nodes and edges will be compared with a recent method based on the Deng entropy [
40].

