Article

A Numerical Investigation of Plastic Energy Dissipation Patterns of Circular and Non-Circular Metal Thin-Walled Rings Under Quasi-Static Lateral Crushing

1
Zhejiang Academy of Special Equipment Science, Hangzhou 310018, China
2
Zhejiang Key Laboratory of Special Equipment Safety Technology, Hangzhou 310023, China
*
Author to whom correspondence should be addressed.
These authors contributed equally to this work.
Mathematics 2025, 13(15), 2527; https://doi.org/10.3390/math13152527
Submission received: 7 July 2025 / Revised: 1 August 2025 / Accepted: 3 August 2025 / Published: 6 August 2025
(This article belongs to the Special Issue Numerical Modeling and Applications in Mechanical Engineering)

Abstract

This paper presents a combined theoretical, numerical, and experimental analysis to investigate the lateral plastic crushing behavior and energy absorption of circular and non-circular thin-walled rings between two rigid plates. Theoretical solutions incorporating both linear material hardening and power-law material hardening models are solved via numerical shooting methods. The theoretically predicted force-denting displacement relations agree excellently with both FEA and experimental results. The FEA simulation clearly reveals the coexistence of an upper moving plastic region and a fixed bottom plastic region. A robust automatic extraction method of the fully plastic region at the bottom from FEA is proposed. A modified criterion considering the unloading effect based on the resultant moment of cross-section is proposed to allow accurate theoretical estimation of the fully plastic region length. The detailed study implies an abrupt and almost linear drop of the fully plastic region length after the maximum value by the proposed modified criterion, while the conventional fully plastic criterion leads to significant over-estimation of the length. Evolution patterns of the upper and lower plastic regions in FEA are clearly illustrated. Furthermore, the distribution of plastic energy dissipation is compared in the bottom and upper regions through FEA and theoretical results. Purely analytical solutions are formulated for linear hardening material case by elliptical integrals. A simple algebraic function solution is derived without necessity of solving differential equations for general power-law hardening material case by adopting a constant curvature assumption. Parametric analyses indicate the significant effect of ovality and hardening on plastic region evolution and crushing force. This paper should enhance the understanding of the crushing behavior of circular and non-circular rings applicable to the structural engineering and impact of the absorption domain.

1. Introduction

The crushing of cylindrical structures has been extensively studied for two main causes: structural integrity maintenance and energy absorption applications. In the context of structural integrity, the lateral crushing analysis of pipes focuses on understanding mechanisms of indentation and rupture damage [1,2], assessing the remaining load-carrying capacity after damage [3], and estimating the fatigue life of dented pipes [4]. As reported by Lam [5], the third-party excavation and corrosion accounts for approximately 75% of incidents in gas transmission pipelines. Additionally, potential threats such as ship collision [6,7], pipeline dropping during installation [8], and anchor impacts [9] pose significant risks to offshore platforms and undersea pipelines. For example, Firouzsalari and Showkati [10] investigated the quasi-static lateral crushing of long free-spanned pipelines subject to axial preloaded forces. They found that the presence of axial force reduced the crushing force. A similar dynamic impact scenario was experimentally studied by Zeinoddini et al. [11], who notably used disk springs to compensate for the short-time axial force magnitude variation. Similarly, Zhi et al. [12] used a bladder accumulator instead to maintain the axial force magnitude over a short duration.
Despite the detrimental damage due to crushing, by large plastic dissipation, circular tubes or short-width circular rings are commonly used in energy absorption applications to dissipate the kinetic energy. In such cases, the energy absorption capacity and force-displacement response are the primary considerations, rather than the material damage to the structure itself. For instance, Santosa et al. [13] conducted both experimental and numerical FEM analyses on the axial crushing of beams with cross-sections filled with aluminum foam, focusing on the total absorbed energy.
The circular ring has been frequently employed in energy absorption applications due to its nearly constant crushing force over a large displacement range and its large dissipated energy amount. For example, Baroutaji et al. [14] studied the crushing behavior of short-width circular rings between two rigid plates with functionally graded thickness distribution. Innovatively, the 3D additive manufacturing technique of selective laser melting (SLM) was utilized to produce the rings of non-uniform thickness with residual stress reduced carefully by heat treatment. Niknejad and Javan [15] theoretically analyzed the absorbed energy of circular metal tubes during crushing by a wedge-shaped indenter. Using a rigid plastic formulation, they estimated the total energy dissipation; however, their approach provided a prediction of the averaged force instead of the detailed force-displacement relationships. Wang et al. [16] extended this work [15] by a dynamic analysis, treating cross-sectional moments as generalized forces and deriving a 1D dynamic governing equation using the Hamiltonian principle. To account for linear hardening, the plastic hinge length was artificially assigned as four times the material thickness [16].
In addition to the circular ring, recent studies have explored the use of elliptic rings which have demonstrated the advantages of longer stroke and more constant force over larger displacement ranges. Morris et al. [17] conducted a quasi-static experiment and finite element analysis (FEA) on nested circular and non-circular rings and observed a softening phase during the crushing of elliptic rings. Notably, the elliptic rings in their experiments were formed by plastically cold-forming the circular ring, a process that inevitably introduced residual stresses. Wu and Carney [18] performed an initial collapse analysis of braced elliptic rings using classic upper and lower bound theorems to determine the initial collapse load. They found that elliptical shapes exhibited larger collapse strokes and increased energy dissipation per unit mass. Baroutaji et al. [19] conducted experimental tests and FEM analyses on the lateral crushing of non-circular rings (not perfectly elliptical) which were cold-formed into oblong shapes by two inserted cylindrical bars at the top and bottom. They also employed the response surface method to maximize the energy absorption capacity. More recently, Yang K et al. [20] proposed a way of connecting two elliptic rings by inner flat connections to avoid the splash of tubes during dynamic crushing and conducted a rigid plastic analysis on the “self-locked” elliptic rings. Yang X et al. [21] innovatively combined an elliptic ring and circular ring into a nested tube system, and a rigid-perfectly plastic analysis by a linear hardening material model was adopted to extract the force and displacement response, which indicated that the nested system is extremely stable for the plateau force. An alternative nested system by combining elliptic rings and corrugated tubes was proposed by Wu et al. [22], and high energy absorption efficiency was observed in experimental tests.
Despite extensive numerical and experimental research on the rings, there are only a few theoretical analyses in the literature. For example, DeRuntz and Hodge [15] developed a four-hinge model to predict the crushing force of a circular ring compressed between two rigid plates without accounting for material hardening. This model was later used by Palmer and Martin [23] to predict the energy absorption of a collapsed pipe (with circular cross-sections) under external pressure, specifically in the context of buckle propagation. Yan et al. [24] adopted this four-hinge 2D ring model, coupled with axial membrane strain, to analytically study the indentation process of pipelines subject to lateral wedge impact in the presence of external pressure.
This work is illuminated by the valuable contributions about plastic crushing behaviors of circular and elliptic rings from Reid and Reddy [25] and Liu et al. [26]. Reid and Reddy [25] demonstrated that the neglect of the material hardening led to a significantly under-estimated crushing force of a circular ring compressed between two plates when experimental results are compared. They developed a plastic model, which was solved analytically by the elliptical integrals. A key observation from Reid and Reddy [25] was that the length of the plastic region initially increased and smoothly decreased during deformation, based on the fully plastic cross-sectional resultant moment derived from the yielding stress (referred to as the M0 criterion in this paper). However, their study [25] was limited to circular rings. For elliptic rings, recently Liu et al. [26] modified Reid and Reddy’s formulation [25] to include the ovality effect, allowing for the analysis of the elliptic ring crushed between plates based on the linear hardening model. Liu et al. [26] interestingly assigned the length of the plastic region proportional to a rotation angle during deformation. Also, although the theoretical formulation [25] predicts a “first increases, then smoothly decreases” pattern for circular rings, no quantitative comparison of fully plastic region length between FEA and theoretical models is found in the literature.
Thus, this paper addresses this gap by comparing the theoretical predictions with the active yielding region obtained from FEA in ABAQUS. The results unexpectedly indicate that the fully plastic criterion (M0 criterion [25]) significantly over-estimates the plastic region length from FEA. Thus we propose a modified criterion based on the highest moment during loading history, which significantly improves estimation accuracy. In the literature, experimental specimens of elliptic rings are typically produced by cold-forming circular rings [17]. This process inevitably introduces residual stresses and results in imperfect elliptic shapes making it challenging to directly compare experimental and theoretical results. Additionally, existing theoretical formulations [25,26] are limited to the linear hardening material models. To address these issues, this paper employs CNC milling to produce precise elliptic shapes, minimizing residual stresses and ensuring geometric accuracy. Furthermore, Ludwik’s material model, which incorporates non-linear power-law hardening, is adopted in theoretical formulation. Linear hardening is treated as a special case within this framework, enabling a simple analytical solution by elliptic integrals. Finally by adopting a constant initial curvature assumption at the bottom plastic region, purely analytical solutions without solving differential equations are formulated to allow efficient force-displacement relation prediction.
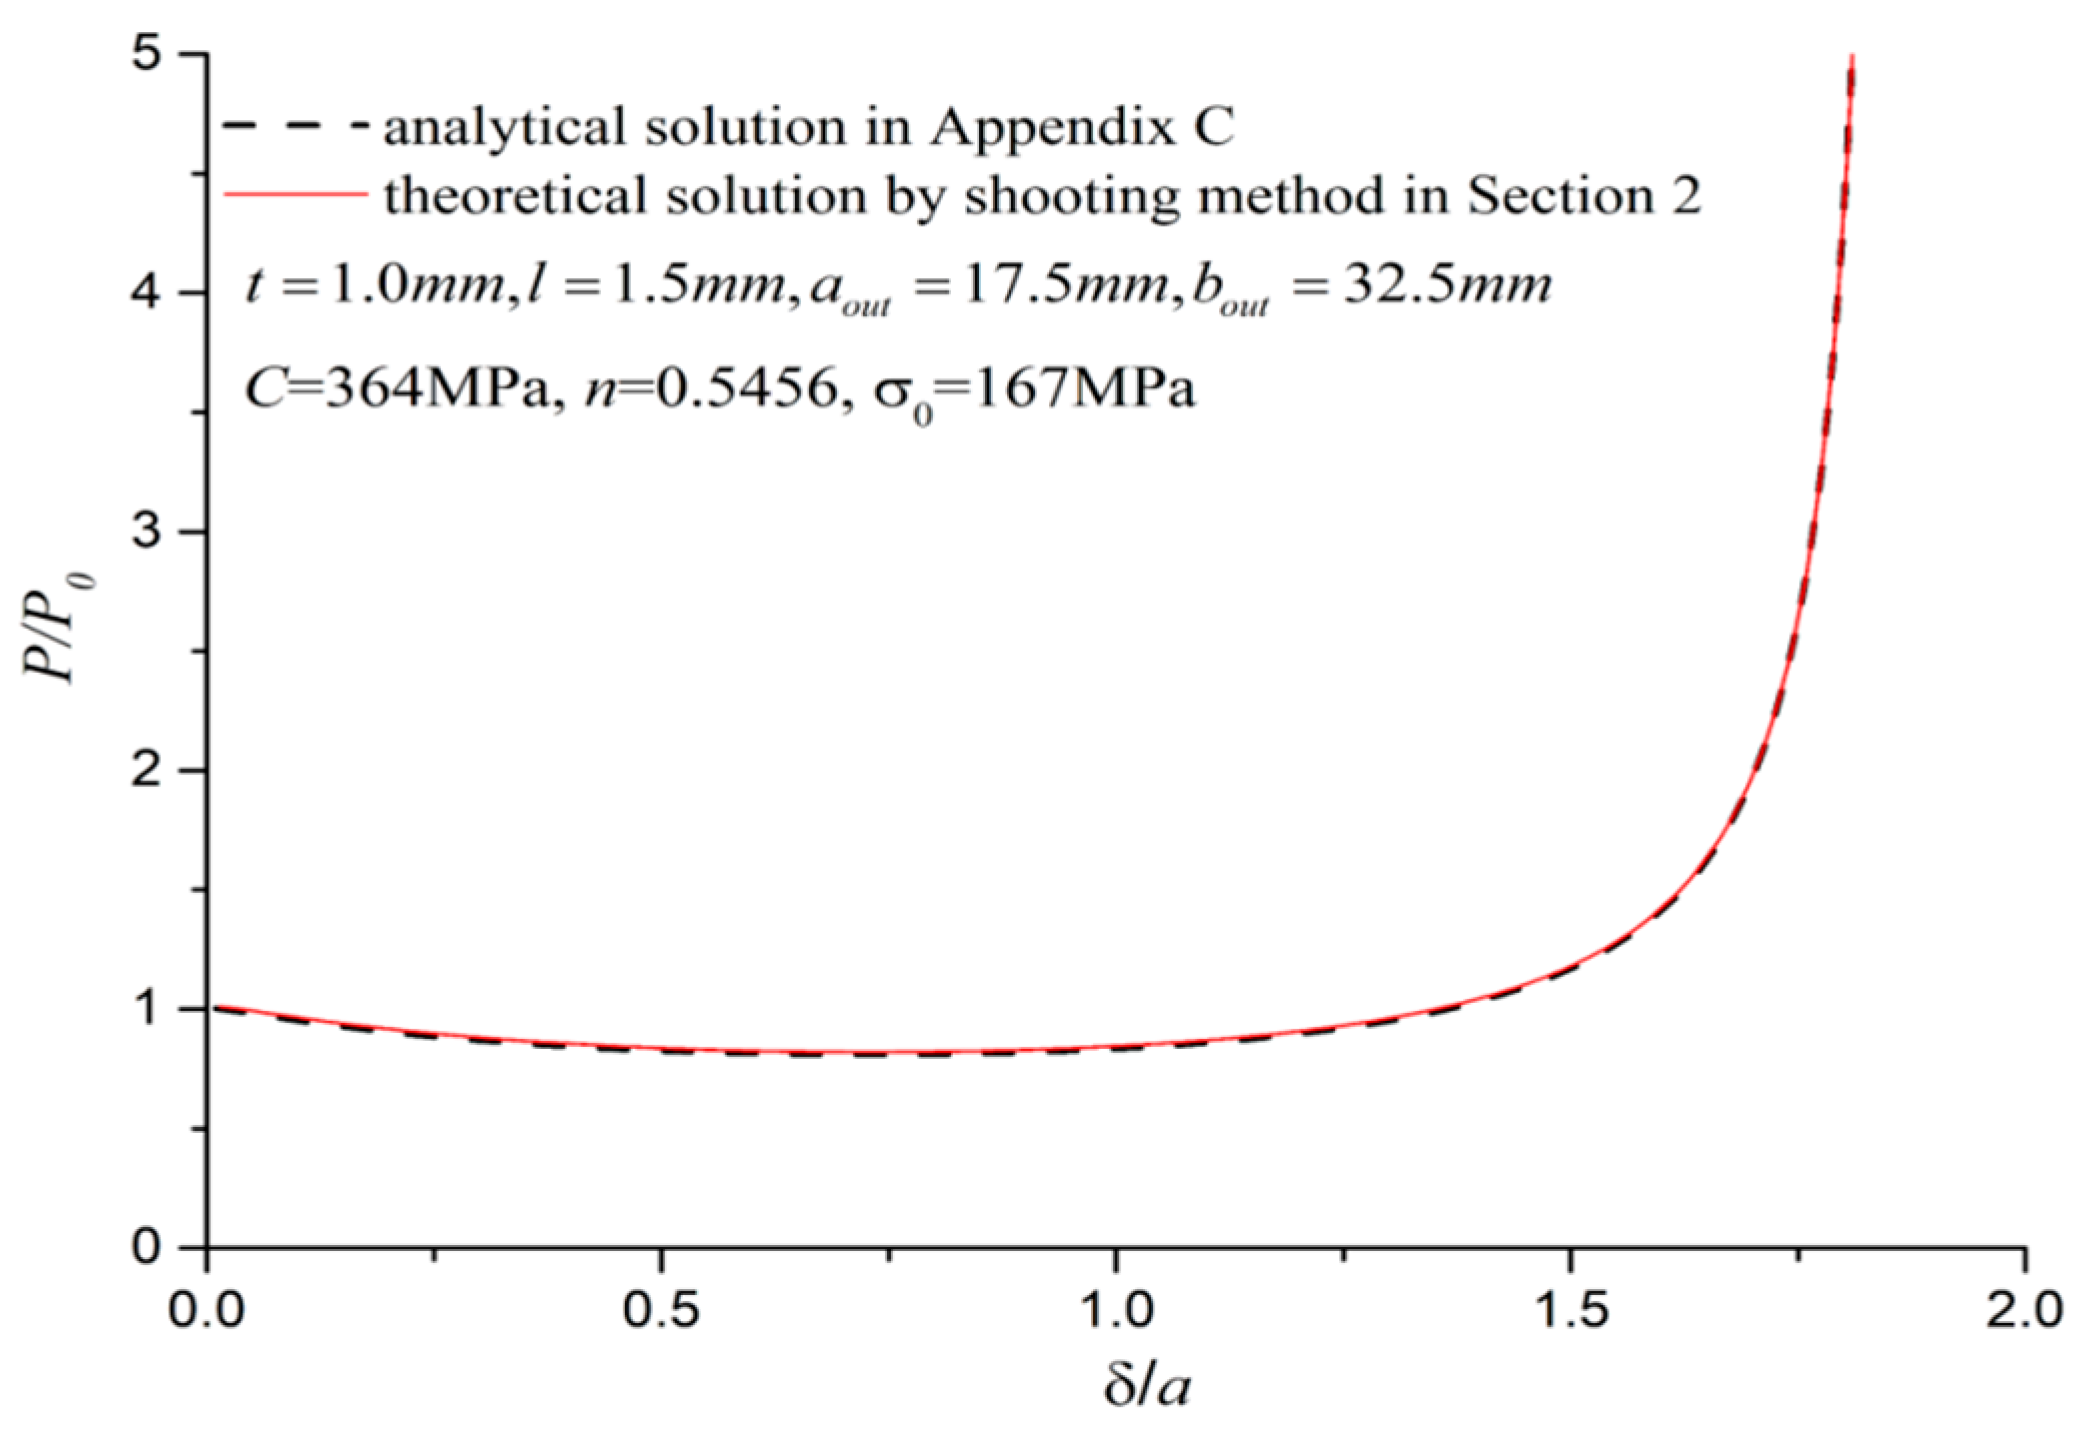
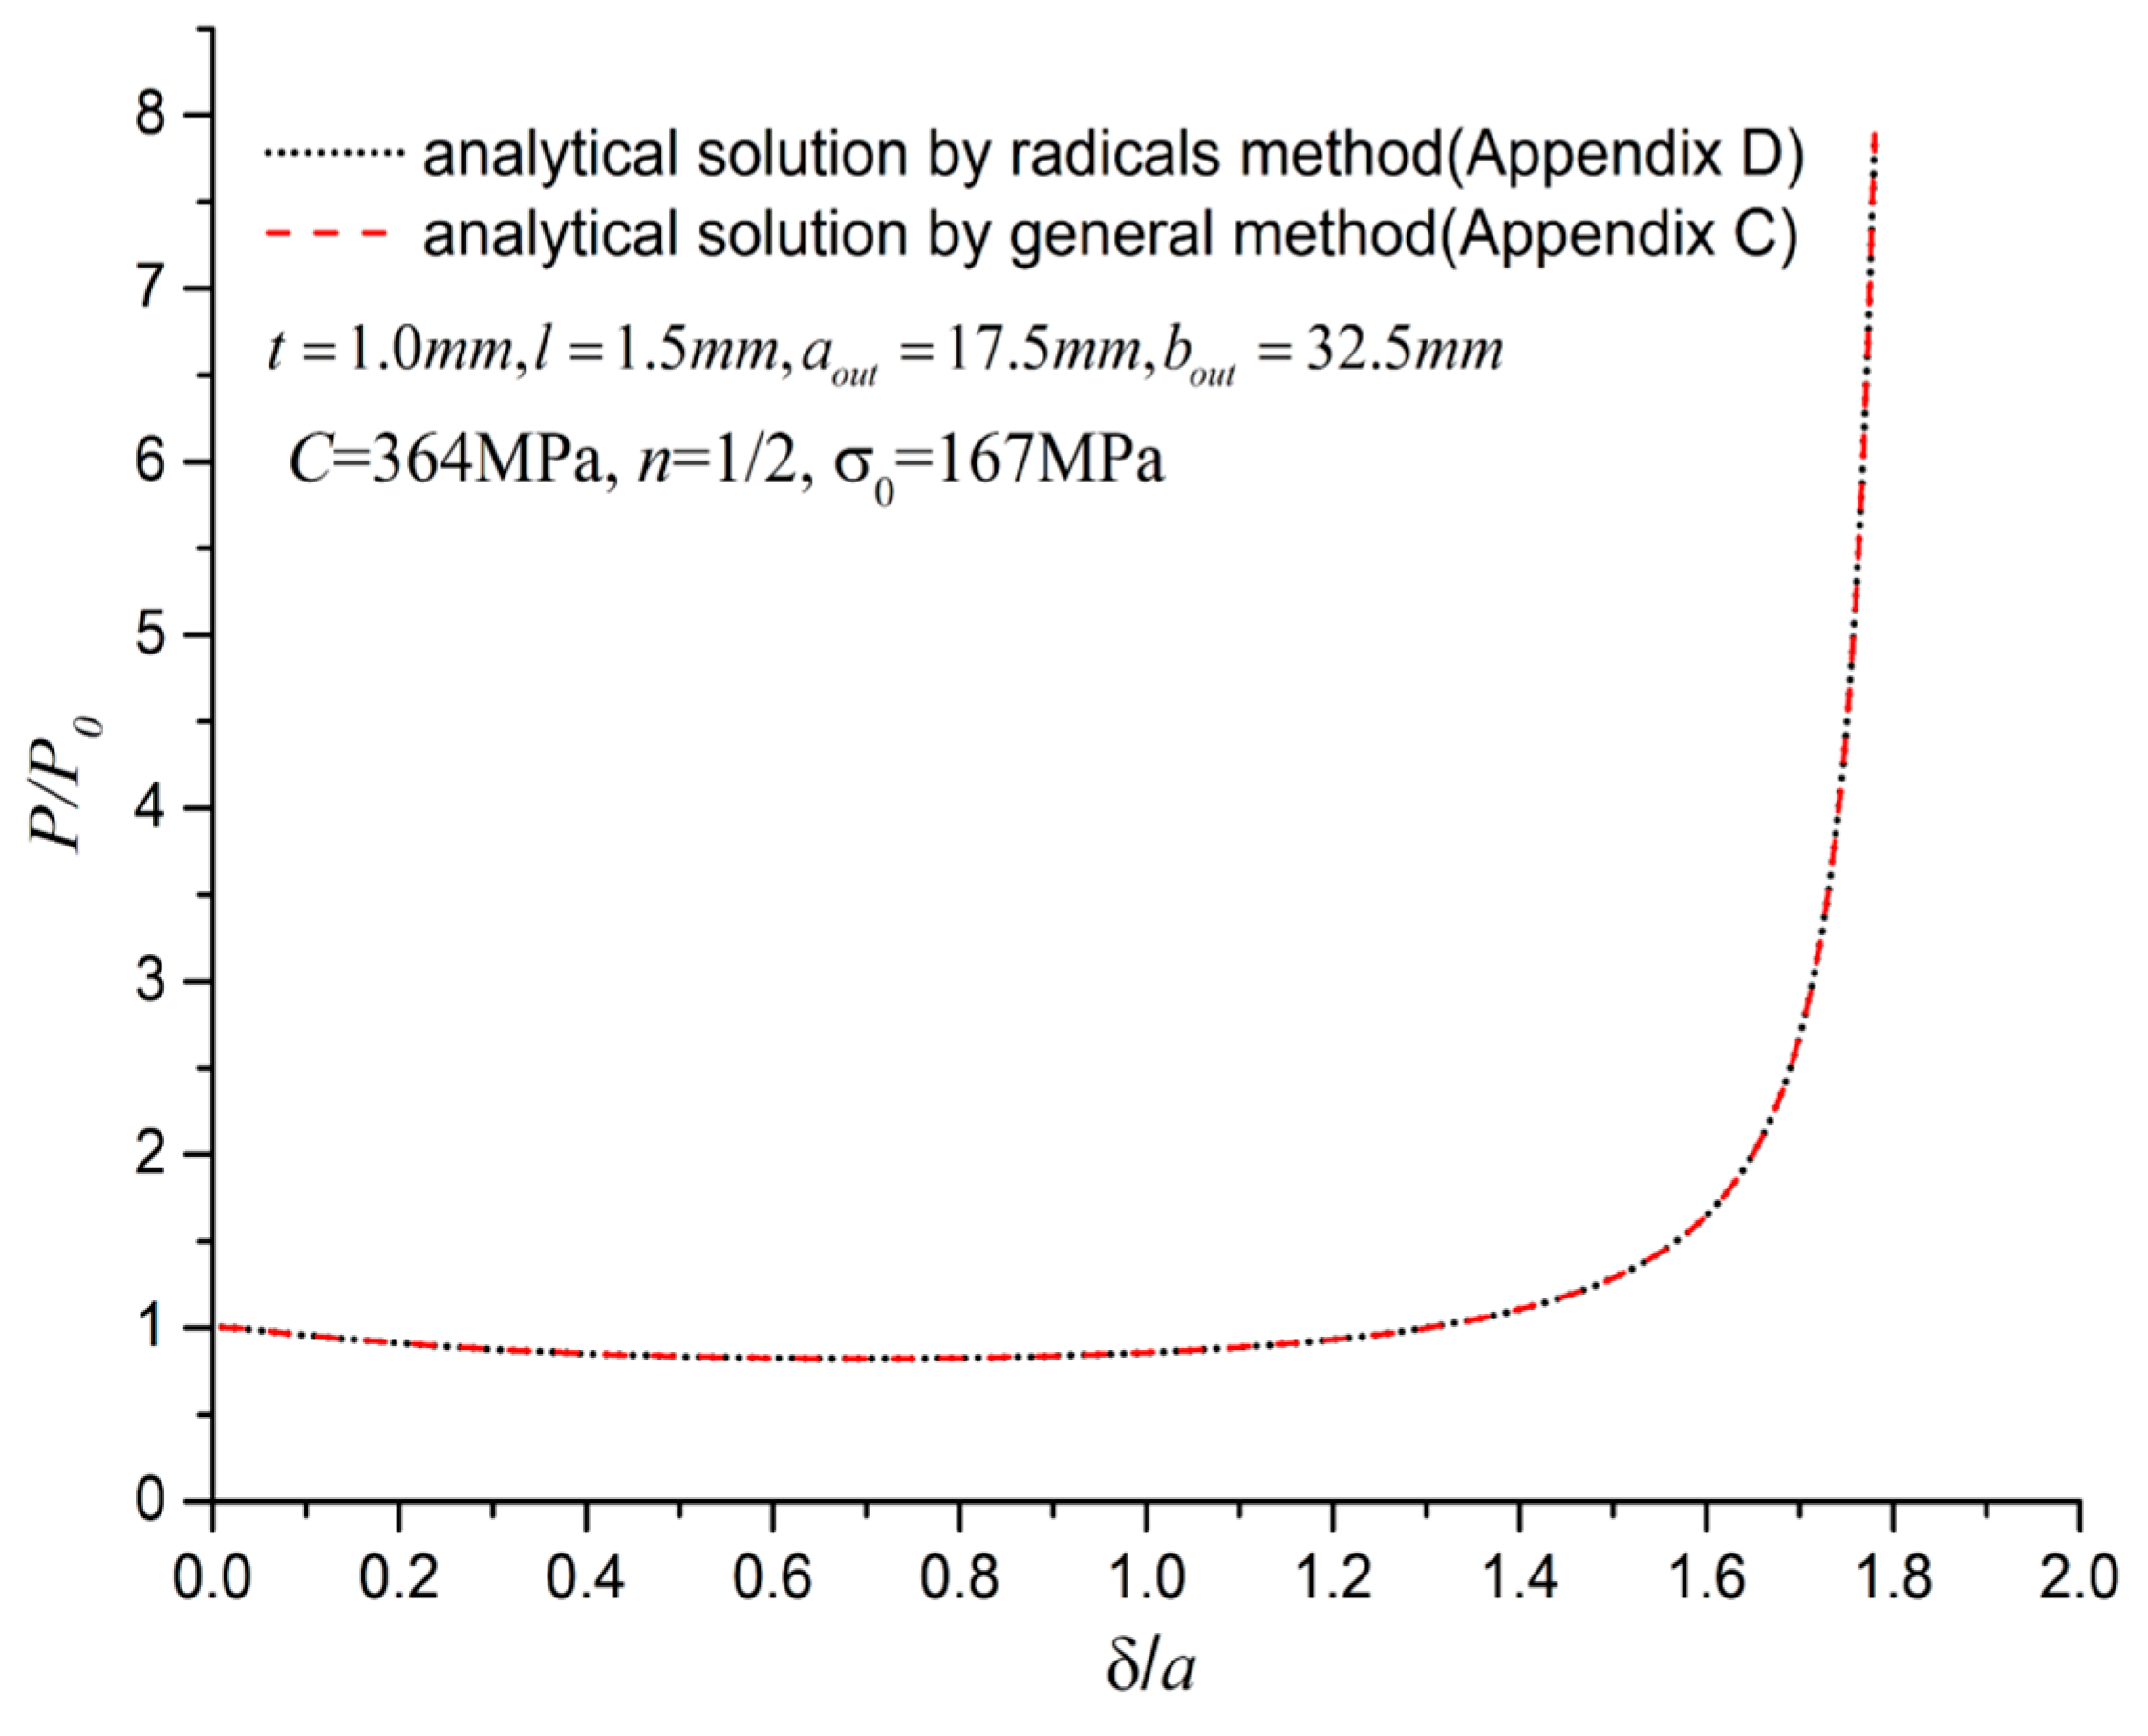
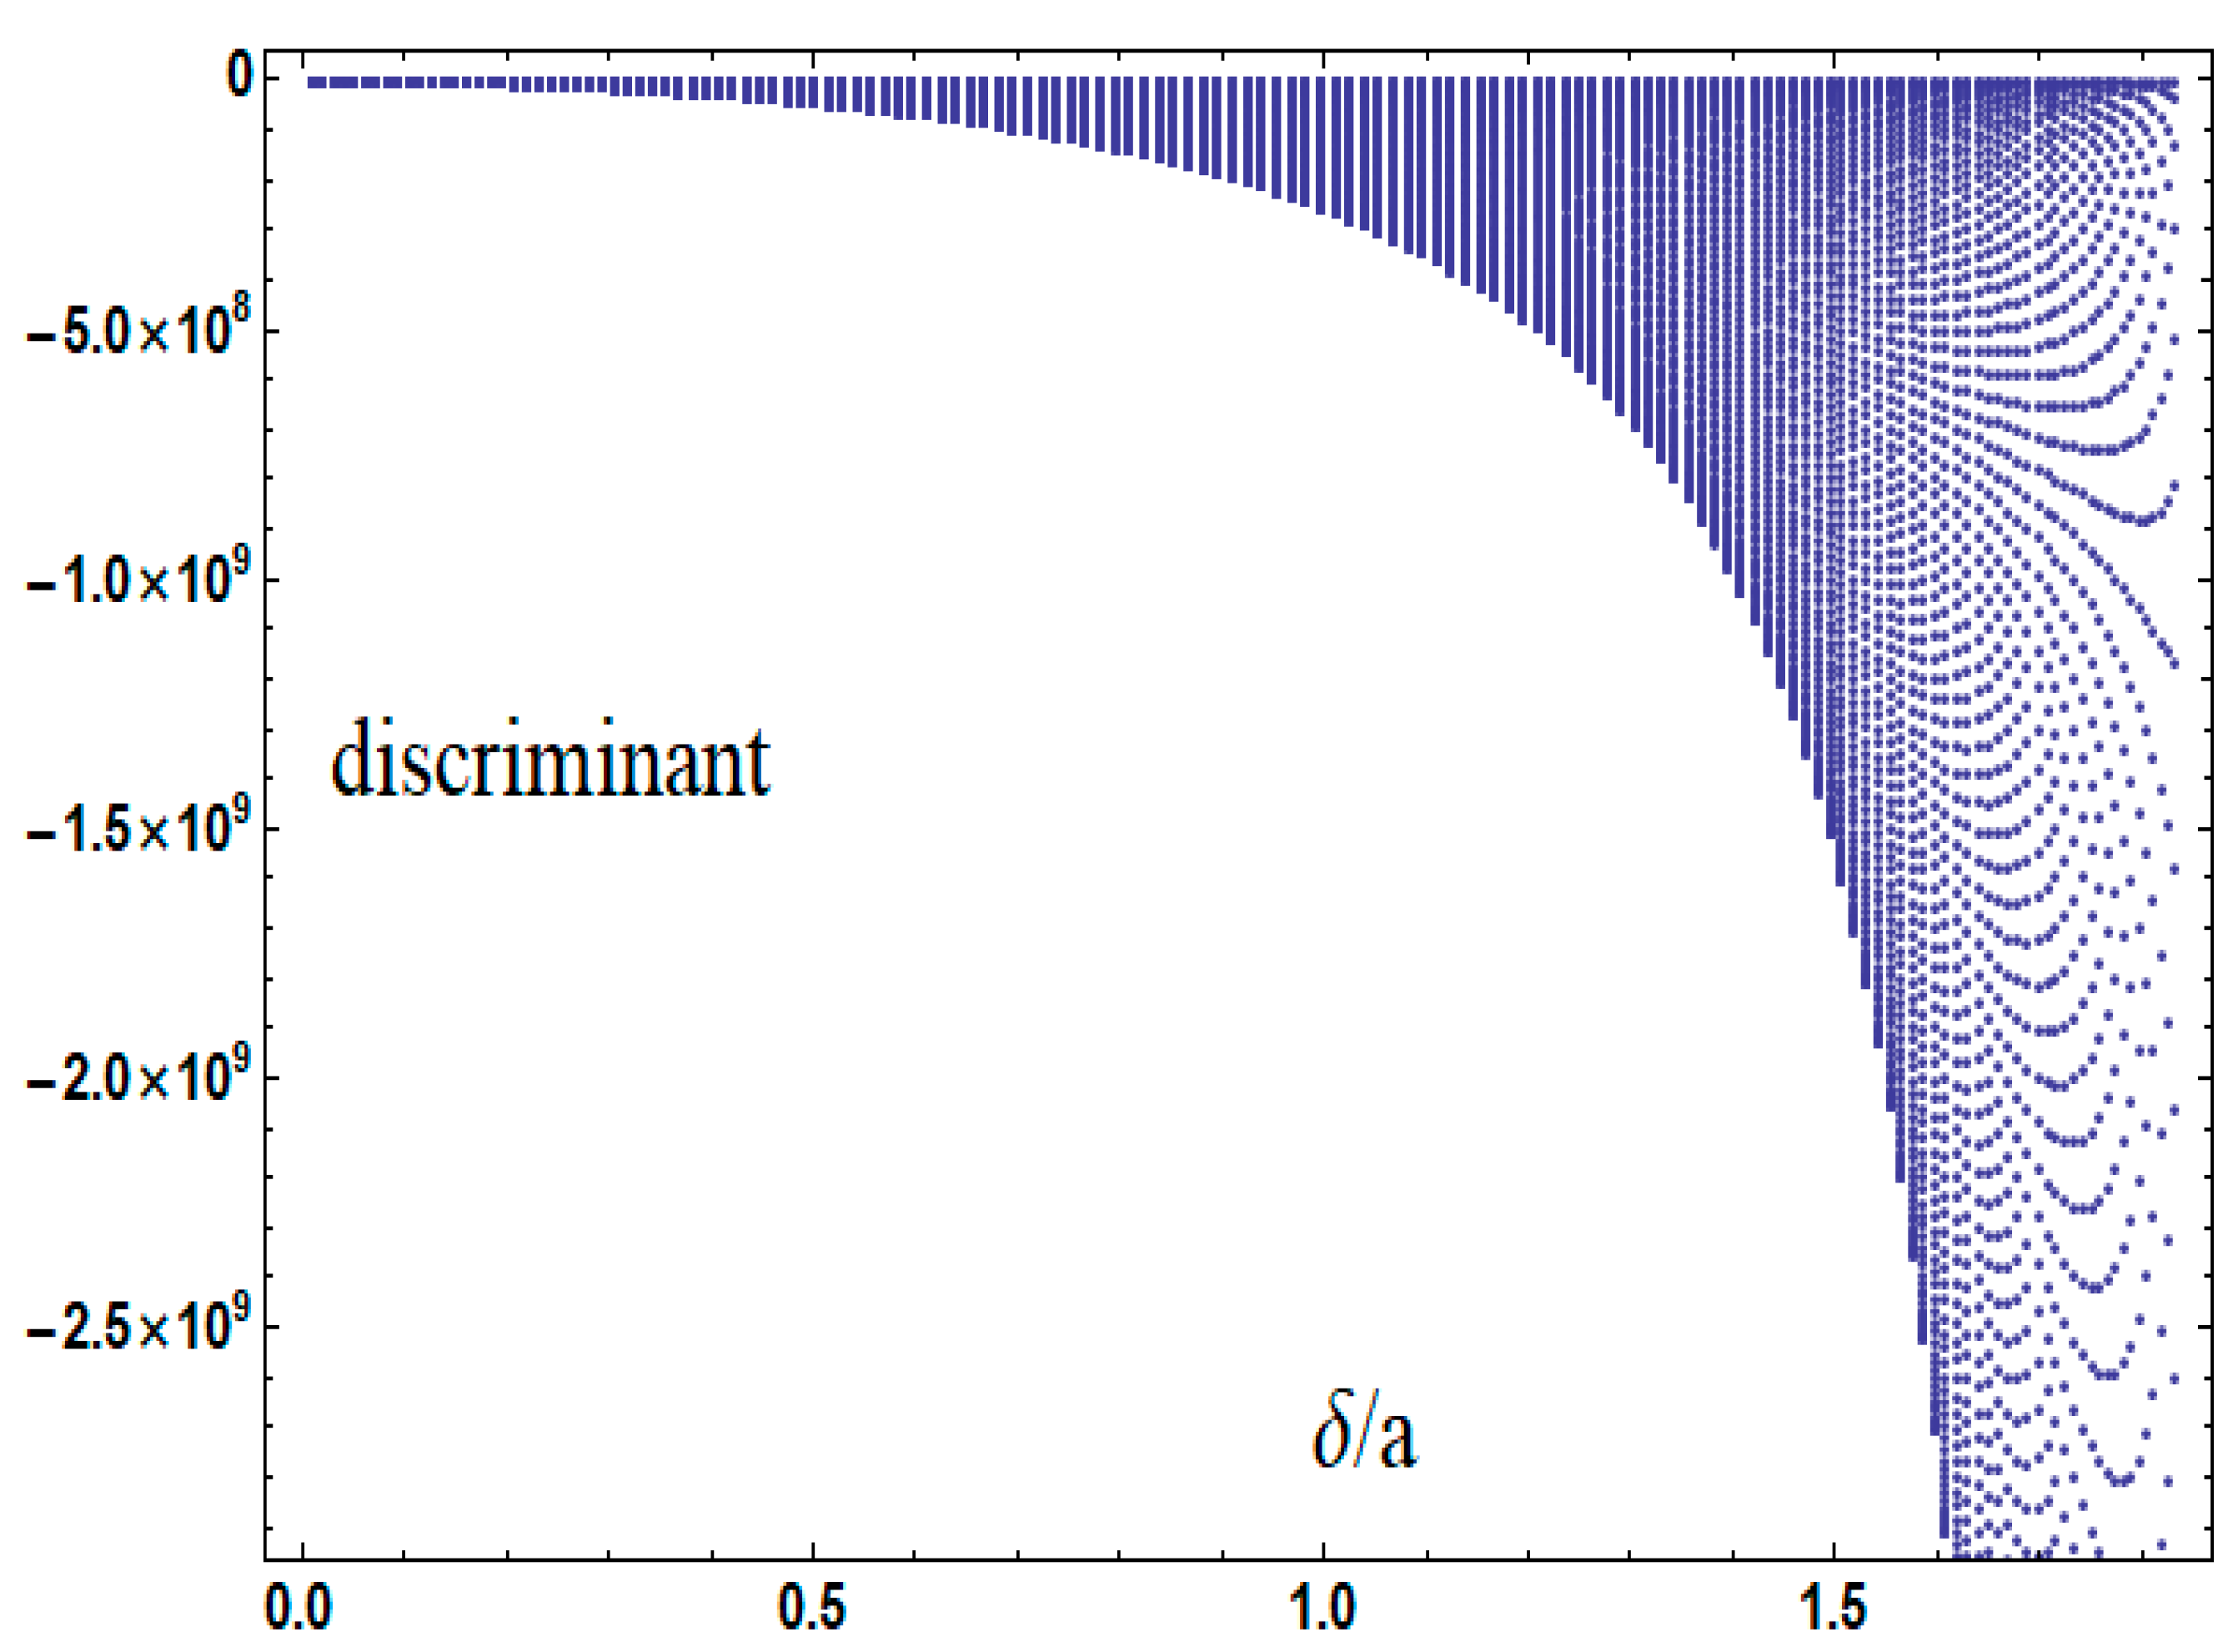
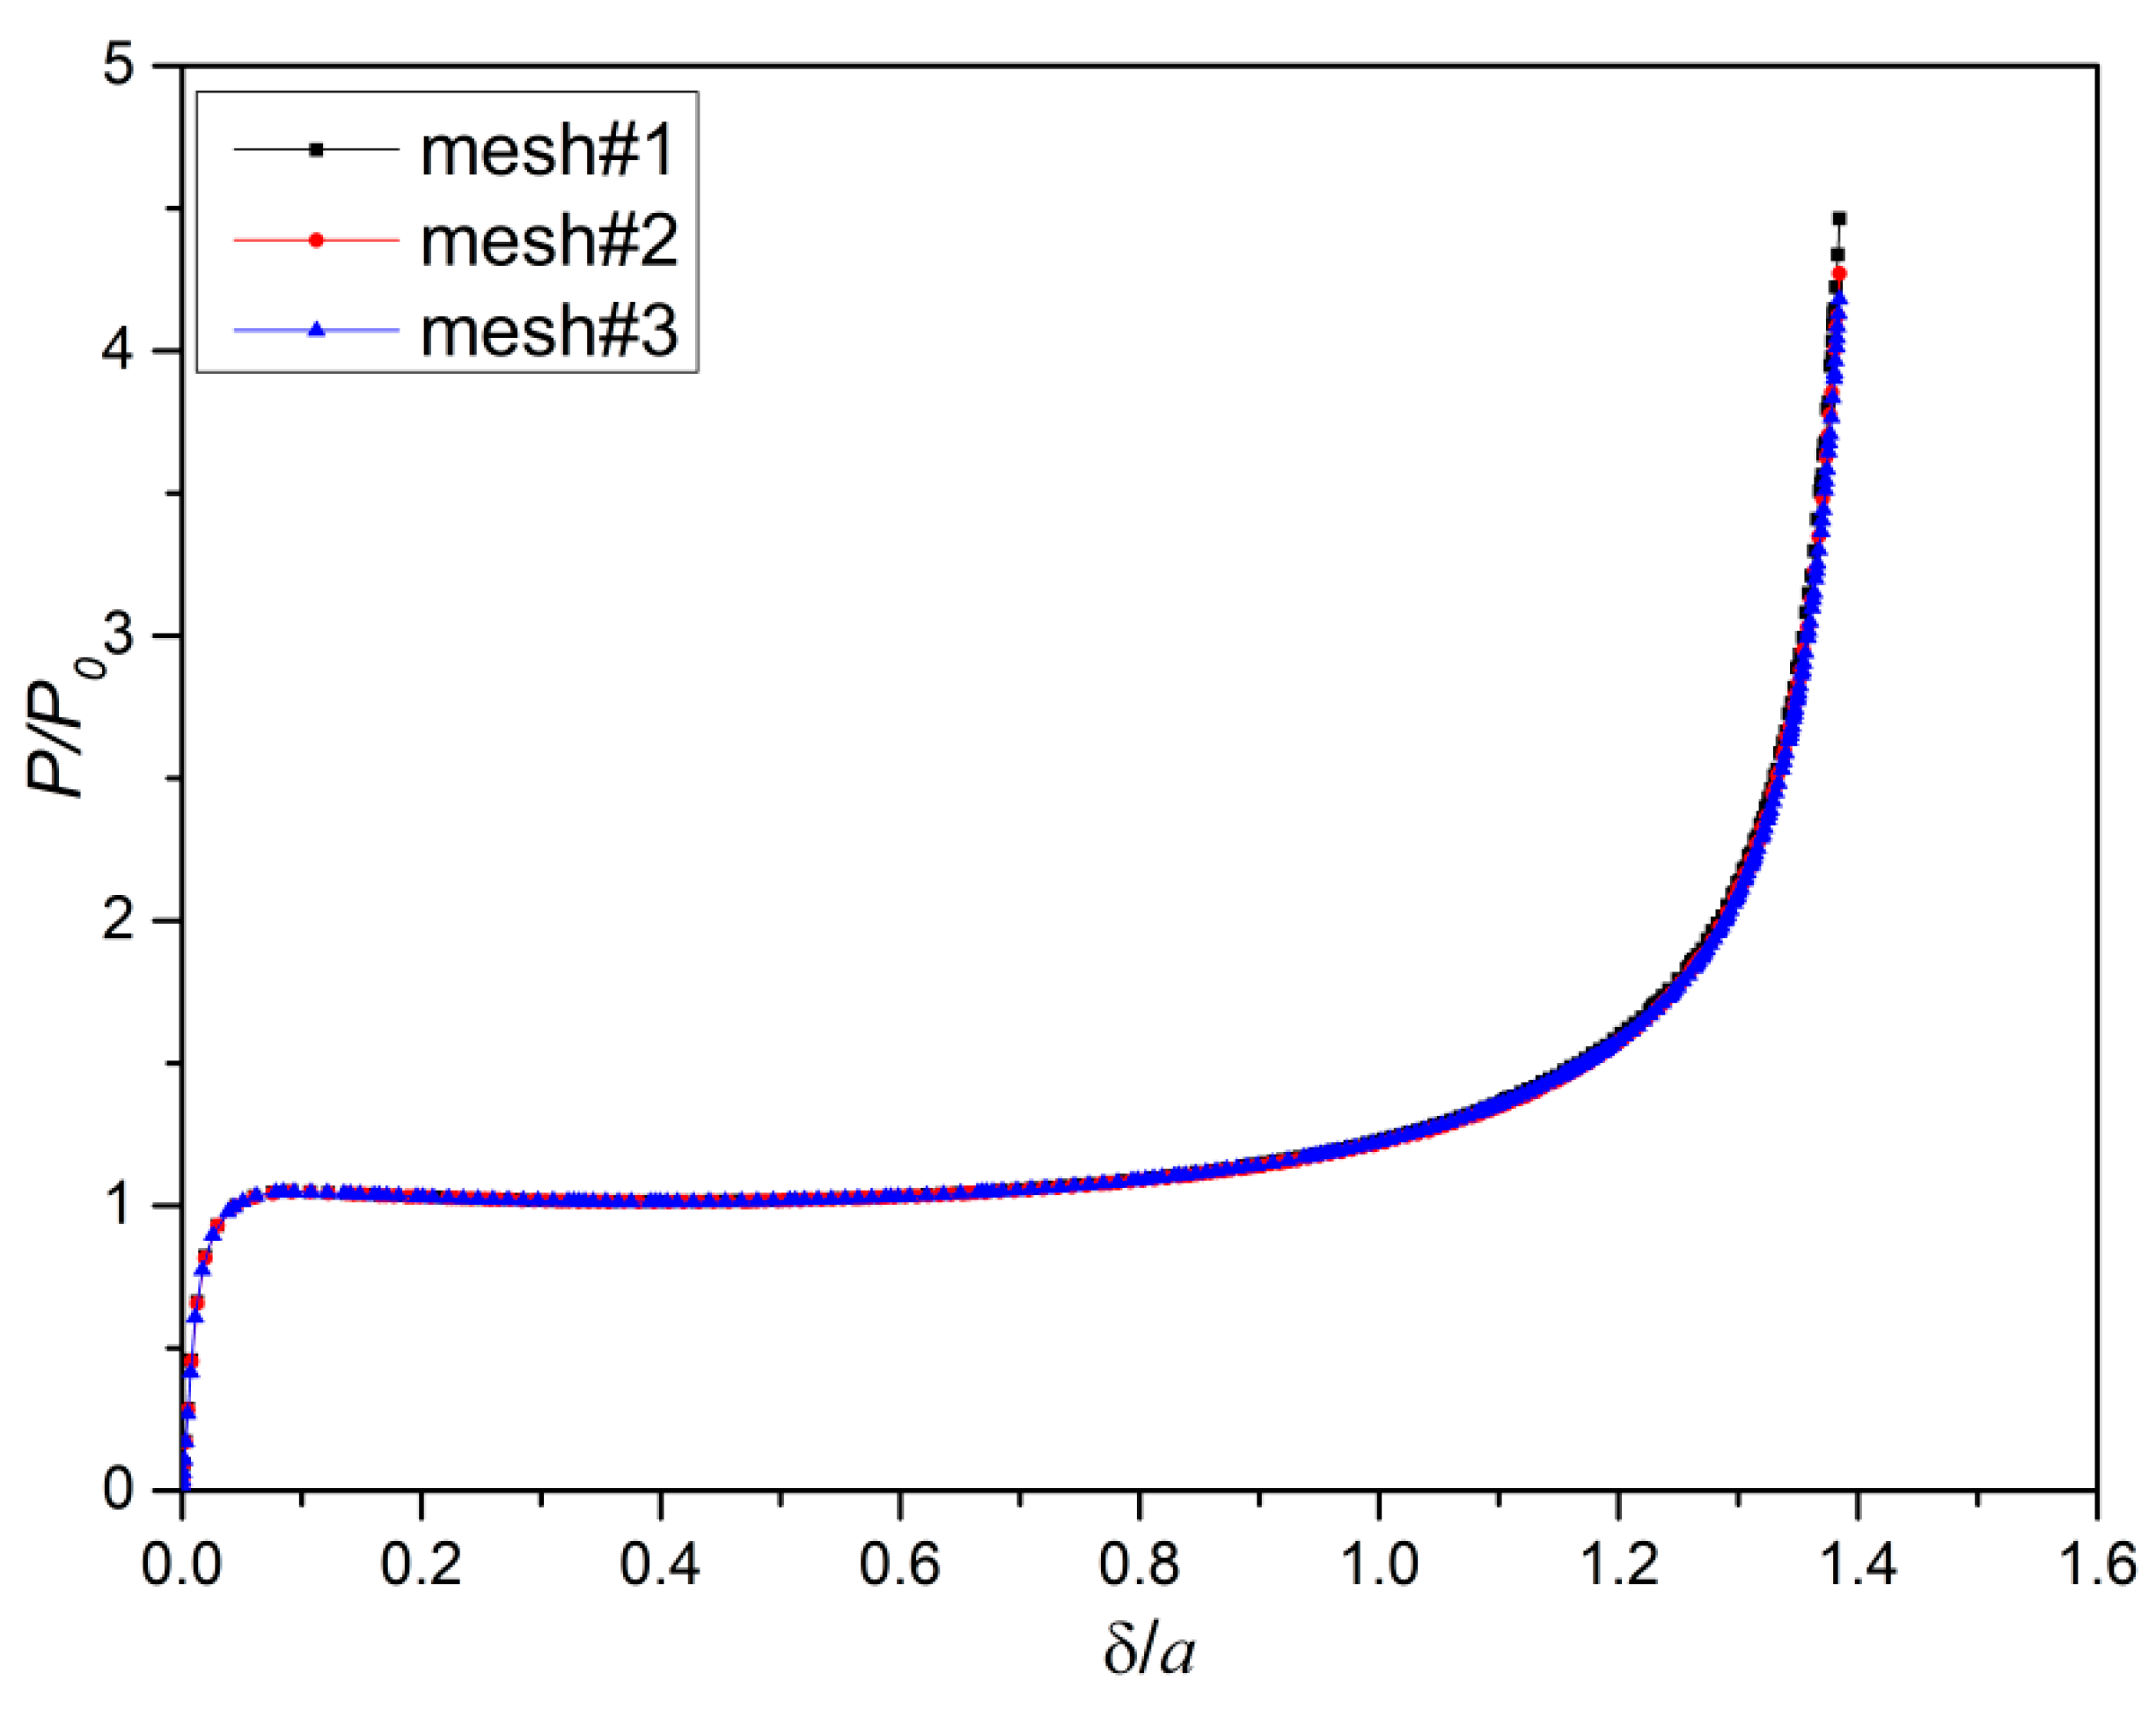
This paper is structured as follows: Section 2 presents the general theoretical fully plastic model formulation solved by shooting method by following the theoretical framework of Reid and Reddy [25] and Liu et al. [26] by extension from linear hardening model to general power-law hardening model; Section 3 discusses the experimental results and Section 4 analyzes the collapse mechanism through FEA, theoretical and experimental comparisons including the evolution of plastic regions. Section 5 provides corresponding force-displacement results for the special case of linear hardening. Section 6 proposes a robust extraction of fully plastic region length from FEA and discusses the theoretical estimation of plastic region length, and also the plastic energy dissipation distribution between the bottom and upper plastic region quantitatively. Section 7 presents analytical elliptic integral-based solutions for the linear hardening case. Section 8 conducts parametric analyses to further explore the behavior of non-circular rings. Appendix A presents some geometric analysis; Appendix B presents Castigliano’s second theorem-based initial elastic phase analysis; Appendix C presents the constant curvature assumption-based analytical solutions without necessity to solve differential equations for general hardening exponent; Appendix D presents analytical solutions for special hardening exponent 1/2 by using radicals; Appendix E presents the mesh independence check of FEA.
This paper aims to enhance the understanding of the crushing behavior of non-circular rings, with applications in structural integrity and energy absorption.

2. Theoretical Fully Plastic Model of Crushing Elliptic Ring Between Flat Plates

2.1. General Formulation by Ludwik’s Material Model

Considering an elliptic ring crushed between two parallel plates in Figure 1a, the ring has a horizontal semi-axis of length a and a vertical semi-axis of length b with a ratio h = b / a . The upper and lower plates are rigid. The dotted curve represents the corresponding circle tangent to the ellipse at point A with an angular coordinate θ . The arc-length coordinate is denoted as s, which is geometrically described using the incomplete elliptic integral of the second kind E ( θ | e 2 ) = [ 0 , θ ] 1 e 2 sin 2 θ d θ by s = b E ( θ | e 2 ) where e = 1 a 2 / b 2 is the eccentricity of the ellipse.
By symmetry, a quarter-model is analyzed, as shown in Figure 1b. Point C is a tangent point to the upper plate, while points A and D are the end points. The plastic hinge moment due to initial yielding stress is given by M 0 = 1 / 4 σ 0 t 2 l , where t is the thickness, σ 0 is the yielding stress, l is the width of the ring. Assuming the existence of a moving plastic hinge at C and a fixed plastic hinge at A, deformed arc A B of length s 0 is the extent of the plastic hinge, where the moment at B is equal to M 0 . Arc D B is assumed to be rigid. Due to material hardening, s 0 is non-zero (see also Reid and Reddy [25]). The moving plastic hinge C is assumed to have a fixed moment M 0 . The existence of theoretical top moving and lower plastic hinge regions is clearly validated through the visualization of the active yielding zones (where instantaneous plastic yielding occurs) in FEA (e.g., see Figures 8, 9, 11 and 12 in this paper).
At arc AB as depicted in Figure 1d, the vertical force magnitude is P/2. Consequently, the shear force is P / 2 sin ϕ . The moment balance at s yields Equation (1) where M ( s ) is the cross-section resultant moment along coordinate s and ϕ is the normal vector’s angle about the X axis with differentiation notation = d / d s .
M = P / 2 sin ϕ
The Ludwik’s material model σ ( ε p ) = σ 0 + C ε p n is employed, with C and n as material parameters where ε p is the circumferential plastic strain. Assuming inextensible middle axis and thus neglecting the membrane strain, ε p = z Δ k where Δ k is the curvature change and z is the spatial coordinate in thickness direction. By integration over z, the expression of the cross-sectional moment is given by Equation (2).
M ( s ) = 2 [ 0 , t / 2 ] σ ( ε p ) z l d z = 2 [ 0 , t / 2 ] ( σ 0 + C ε p n ) z l d z = σ 0 l t 2 4 + 2 1 n C t n + 2 Δ k n l 2 + n = M 0 + 2 1 n C t n + 2 Δ k n l 2 + n
When n = 1 (linearly hardening case), Equation (2) reduces to the conventional linear hardening model in the literature [25,26]:
M ( s ) = M 0 + E p I Δ k
where E p (equal to C) is the plastic modulus and I = t 3 l / 12 is the moment of inertia.
The curvature change Δ k at s is related to the angles ϕ , ϕ 0 by
Δ k ( s ) = ϕ ( s ) ϕ 0 ( s )
where ϕ 0 is the angle of the normal vector about axis X in the undeformed configuration (see Figure 1a). Thus, Equations (1), (2) and (4) together yield the following:
K ( ϕ ϕ 0 ) n 1 ( ϕ ϕ 0 ) = P / 2 sin ϕ
where K = 2 1 n C t 2 + n n l / ( 2 + n ) . Note that for a perfectly circular ring ϕ 0 = 0 identically since it has a fixed curvature, while for an elliptic ring ϕ 0 0 .
Equation (5a) reduces to E p I ( ϕ ( s ) ϕ 0 ( s ) ) = P / 2 sin ϕ in the special linear hardening case. By relation d s / d θ = b 1 e 2 sin 2 θ and ϕ 0 = a b ( a 2 sin 2 θ + b 2 cos 2 θ ) 3 / 2 ,
ϕ 0 = ( e 2 ( 3 + h 2 ) + 4 ( 1 + h 2 ) + 3 e 2 ( 1 + h 2 ) cos ( 2 θ ) ) ( sec θ ) 2 tan θ 2 a 2 h ( 1 + e 2 ( sin θ ) 2 ) 2 ( h 2 + ( tan θ ) 2 ) 2 .
To solve Equation (5a), the angle continuity condition and curvature continuity condition at point B (see Figure 1b) are imposed as Equations (6) and (7):
ϕ ( s 0 ) = α + ϕ 0 ( s 0 )
ϕ ( s 0 ) = ϕ 0 ( s 0 )
where α is the rotation angle of the rigid arc DB.
By representing the undeformed configuration as ( x , y ) = ( a cos θ , b sin θ ) , some geometric analysis implies Equations (8a) and (8b).
ϕ 0 ( s 0 ) = arctan ( a / b tan θ 0 )
ϕ 0 ( s 0 ) = a b / [ a 2 ( sin θ 0 ) 2 + b 2 ( cos θ 0 ) 2 ] 3
To complete the description, a moment equilibrium analysis on the arc BC (see Figure 1c) yields the following:
P L = 4 M 0
where L is the horizontal distance between point B and the tangent point C.
Due to the rigidity assumption of arc DB, as derived in Appendix A, L can be represented by Equation (10).
L = a cos α cos θ 0 b sin α sin θ 0 a ( 1 h 2 ) sin α cos α ( h 2 ( sin α ) 2 + ( cos α ) 2 ) / ( ( 1 h 2 ) 2 ( sin α ) 2 ( cos α ) 2 + h 2 )
The denting displacement δ (crushing distance, see Figure 1b) could be shown in Appendix A to be represented as follows:
δ = A 1 + A 2 + A 3 ( cos α ) 2 + ( sin α ) 2 h 2 [ 0 , s 0 ] cos ϕ d s
where A 1 , A 2 , A 3 are represented as follows:
A 1 = a ( cos α ) 2 ( h + cos θ 0 sin α 2 ( 1 + h 2 ) 2 [ 1 + h 2 + ( 1 + h 2 ) cos 2 α ] 1 / 2 ( sin α ) 2 ) ; A 2 = a h ( cos α 2 h ( 1 + h 2 + ( 1 + h 2 ) cos 2 α ) 1 / 2 + h 2 ( sin α ) 2 + h cos θ 0 ( sin α ) 3 ) ; A 3 = a h [ ( cos α ) 3 ( 1 + sin θ 0 ) + cos α ( sin α ) 2 ( 1 + h 2 sin θ 0 ) ] .
This theoretical formulation is solved by the shooting method in Section 2.2 and verified by experiments and FEA in Section 4. We comment further that due to symmetry and force and moment equilibrium, point D in Figure 1b has no reaction force and thus the resultant internal force is zero, and the cross-section internal moment is constant along the DC segment. The contact is assumed to be a point contact at tangent point C, which is validated by an FEA contact pressure visualization in Section 6.5.

2.2. Solution by Numerical Shooting Method

The theoretical formulation is solved by the shooting method, which converts the boundary condition problem to an equivalent initial value problem using the Newton–Raphson iteration. For convenience, the independent variable θ is used instead of arc-length s as Equations (5b), (8a) and (8b) are based on θ.
Five variables are introduced as y 1 = ϕ ,   y 2 = d ϕ / d s ,   y 3 = [ 0 , s ] sin ϕ d s ,   y 4 = [ 0 , s ] cos ϕ d s ,   y 5 = s where differentiation with respect to θ yields the first order ordinary differential equation system (initial value problem with θ as the “time” variable) as in Equations (13a)–(13e).
d y 1 / d θ = y 2 b 1 e 2 sin 2 θ
d y 2 / d θ = ( P 2 sin y 1 K ( y 2 ϕ 0 ) n 1 + ϕ 0 ) b 1 e 2 ( sin θ ) 2
d y 3 / d θ = s i n   y 1 · b 1 e 2 sin 2 θ
d y 4 / d θ = c o s   y 1 · b 1 e 2 sin 2 θ
d y 5 / d θ = b 1 e 2 sin 2 θ
Set initial conditions y 1 0 = 0 , y 2 0 = c , y 3 0 = 0 , y 4 0 = 0 , y 5 0 = 0 , where c is unknown together with two other unknowns ( θ 0 and P). Thus, for each specified angle α , there are three unknowns c , θ 0 , P with three boundary conditions (Equations (8a), (8b) and (9) at θ = θ 0 ). Of course, for specific α , if ( c , θ 0 , P ) is known, the initial value problem could be solved via the Runge–Kutta algorithm through the ode45 solver in Matlab software 2018. So we firstly guess some values of ( c , θ 0 , P ) and then use Newton–Raphson iteration to correct them until the three boundary conditions are simultaneously satisfied (convergence) for each α . During the iterations, under parameters ( c , θ 0 , P ) , the extent of non-satisfactions of these three conditions (“residual”) is represented as a three-dimensional column vector (by taking the difference rhs-lhs of Equations (8a), (8b) and (9) at θ = θ 0 where rhs is the right-hand side and lhs is the left-hand side of the equations).
Newton–Raphson iteration is illustrated briefly: (1) obtain the residual arrays (denote by r 0 , r 1 , r 2 , r 3 respectively) for four sets of parameters ( c , θ 0 , P ) , ( c + d c , θ 0 , P ) , ( c , θ 0 + d θ 0 , P ) , ( c , θ , P + d P ) where d c , d θ 0 , d P are artificially assigned small enough quantities (e.g., 1 × 10⁻⁴); (2) the approximate 3 × 3 matrix Jacobian matrix J = [ 1 / d c ( r 1 r 0 ) , 1 / d θ 0 ( r 2 r 0 ) , 1 / d P ( r 3 r 0 ) ] ; (3) Obtaining the corrections [ δ c , δ θ 0 , δ P ] = J 1 r 0 by matrix inversion, update c c + δ c , θ 0 + δ θ 0 , P + δ P . Repeat the above iteration until convergence of parameters.
After convergence, the denting displacement δ is obtained by substituting converged values of θ 0 into Equation (11). Incrementing angle α from zero value yields continuous variation in denting displacement δ and load P. Although the shooting method coupled with Newton–Raphson iteration for solving boundary value problems is conventional (see also our previous work [27]), in our case, there is some subtlety in numerically implementing Equation (13b) since y 2 ϕ 0 < 0 may lead to complex values (non-real numbers) when −1 < n – 1 < 0. Thus, in practice, y 2 ϕ 0 is replaced by | y 2 ϕ 0 | to circumvent this problem, which trick does not affect the converged result since y 2 ϕ 0 0 inside the plastic hinge region arc AB.

3. Experiments of Crushing Elliptic Rings

3.1. Apparatus and Geometric Parameters

Experimental specimens are manufactured by CNC milling from 1.5 mm thick aluminum plates, as shown in Figure 2. A total of five experiments (exp#1, …, exp#5, each repeated twice) were conducted with the parameters listed in Table 1. The outer surface of each ring has a precise elliptic shape with horizontal and vertical semi-axis lengths a o u t , b o u t , respectively, and the inner surface is created by offsetting the outer surface by a constant distance, ensuring uniform thickness t. During production, the inner surface was milled first. An elliptic cap was milled and used to secure the inner surface, after which the outer surface was milled. The use of CNC milling, as opposed to cold-forming circular ring through compression, was chosen to minimize residual stress and to ensure precise control over the specimen’s elliptic shape (see Figure 2).
The experimental crushing apparatus (see Figure 3) consists of the following components: a force sensor(with a measurement range of −50~50 N for exp#4, #5 and −200~200 N for exp#1, #2, #3), an LVDT displacement sensor (range: 0~100 mm), an upper acrylic plate fixed to the head of the force sensor, a bottom acrylic plate, and a movable plate attached to the vertical frame for mounting the force sensor. The rings are crushed by slowly actuating the movable plate to move downward. Force and displacement signals are synchronously collected using a Python script (Python 3.9) on a computer.

3.2. Deformation Patterns

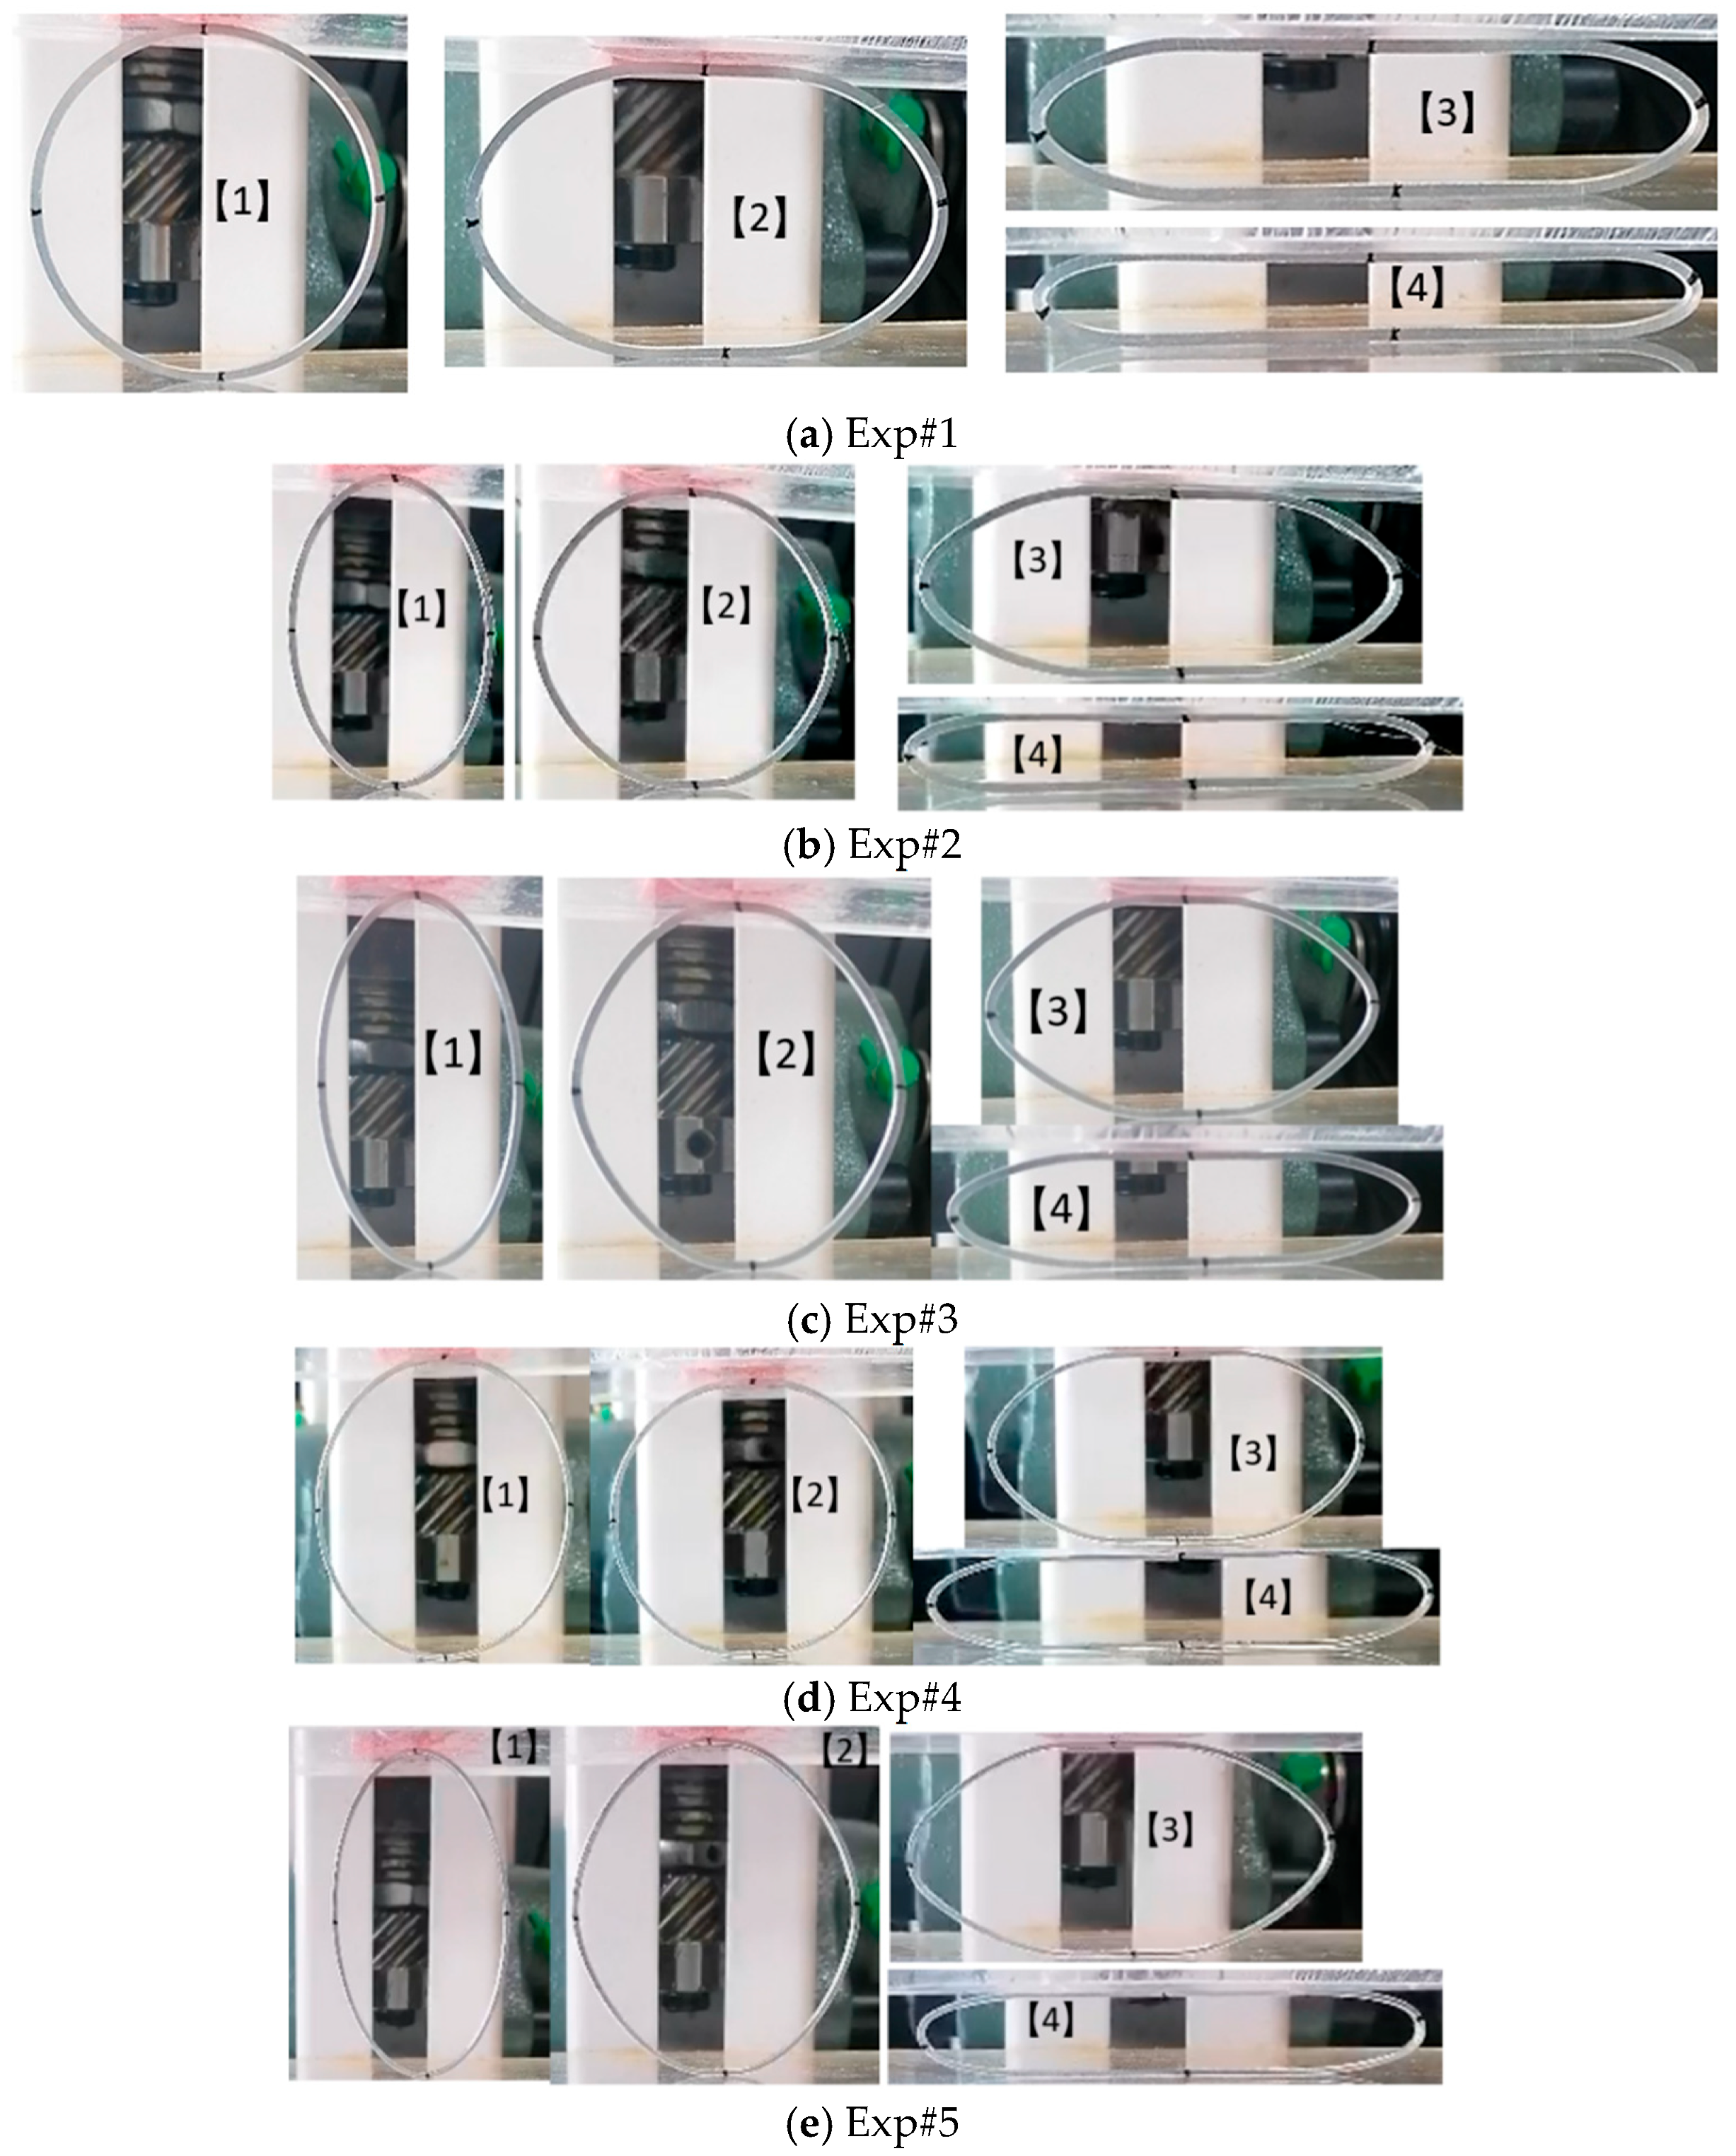
Figure 4 shows the deformation sequences for exp#1, …, exp#5.
In exp#1, the ring was initially circular (phase 1). As crushing progressed, the upper and lower parts flattened and continuously extended until phase 4, while the left and right portions became significantly bent.
In exp#2, the ring was initially taller (than in exp#1) and elliptic (phase 1). During deformation in phase 2, it became rounder, and the upper and lower portions extended as crushing continued. Exp#3 featured a ring taller than that in exp#2. Similar re-rounding and crushing patterns were observed with the flat portion’s length not increasing significantly during the re-rounding stage. Exp#4 and Exp#5 involved thinner rings (t = 1.0 mm), but the deformation patterns were similar. From these experiments, it is evident that the deformation of elliptic rings occurs in two distinct stages: (1) an initial re-rounding phase without significant enlargement of the flat portion and (2) a later phase characterized by significant enlargement of the flat portion and strong bending of the left and right portions.

4. Collapse Mechanism Analysis for General Cases

4.1. Material Model and FEM

Three uniaxial tensile tests were conducted using an Instron (Shanghai, China) machine (205kn-5985). The true stress–true strain curves are shown in Figure 5a. The results from the three tests are consistent, and a simple regression analysis was performed to fit the data to the Ludwik material model σ = σ 0 + C ε p n (dashed line in Figure 5a), where σ 0 = 167   M P a , C = 364   M P a , n = 0.5456 (non-linear hardening material parameters used throughout this paper except in Section 8), ε p = ε ε 0 is plastic strain, ε is the total strain, and ε 0 = 0.279 % is the yielding strain. These material parameters were substituted into the theoretical model. FEA models were developed using CPS4R elements with isotropic material hardening based on the true stress–true strain curve in ABAQUS (see Figure 5b). CPS4R are 4-node bilinear plane stress quadrilateral 2D continuum elements; each node has two translative degrees of freedom; each element has only one Gauss integration point (reduced integration) to allow faster computation and be less prone to shear locking [28]. The mesh independence check was conducted for force-displacement response and robust extraction of FEA plastic region length in Appendix E. Structural meshes (see also Figure 13) are used with 8 layers of elements in the thickness direction. General “static”-type step in ABAQUS is used. Due to the short width of the rings, a 2D plane stress analysis was conducted to reduce the computational time cost. Due to symmetry, a 1/4 model was used, and the FEA is terminated once the crushing displacement reaches 90% of b o u t (thus, in FEA throughout this paper, δ / b o u t = 0.9 ). Crushing was modeled using contact pairs between the rigid plates and the outer surface of the ring. Symmetric boundary conditions were applied to the two ends. To prevent non-physical self-intersection, an artificially rigid line and its contact pair with the inner surface of the ring were introduced. Geometric nonlinearity Nlgeom was enabled, and the rigid upper plate was moving downward to simulate crushing. Elastic modulus = 70 GPa (aluminum).

4.2. Comparisons and Verification

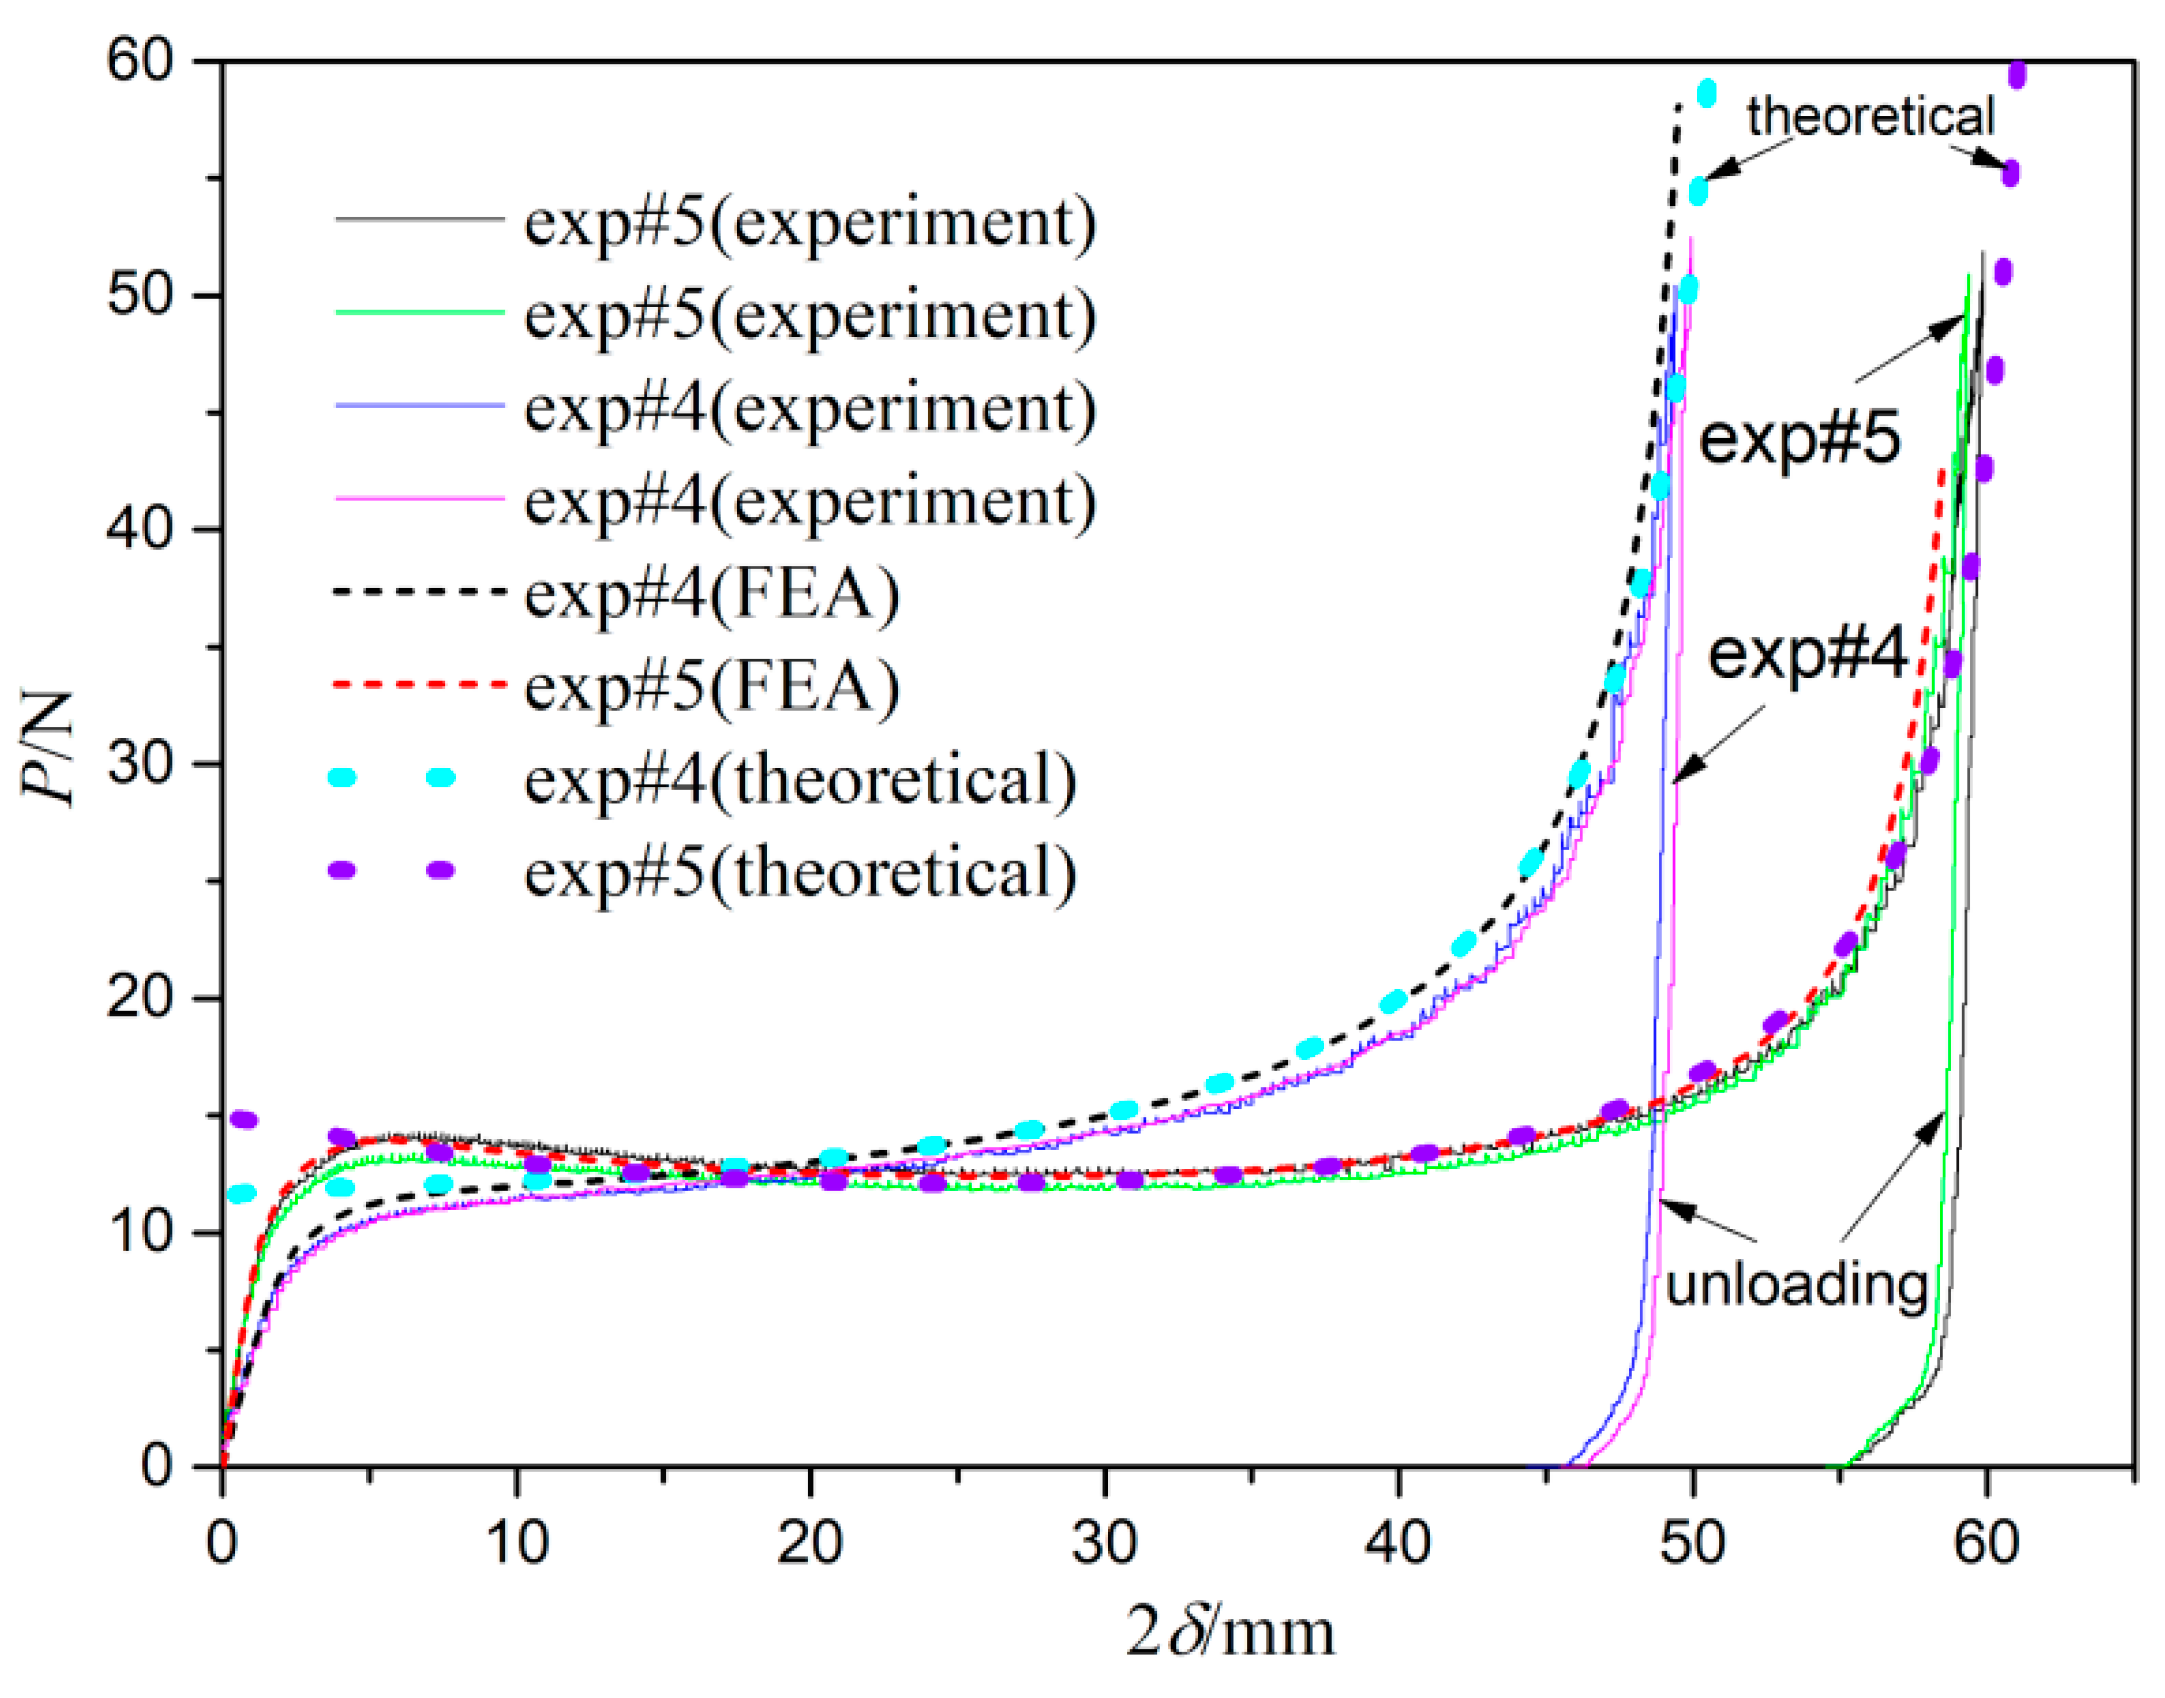
Figure 6 and Figure 7 present the force-displacement curves from experiments, FEA, and theoretical formulation for the thicker case (exp#1, exp#2, and exp#3) and thinner case (exp#4 and exp#5), respectively. Figure 6b provides a locally amplified plot of the shadowed area in Figure 6a. Good agreement is observed between the experimental, FEA, and theoretical results, except for the initial elastic phase. This discrepancy is expected, as the theoretical formulation Is based on a rigid-plastic model that neglects elasticity. However, the initial elastic phase can be accurately predicted using an exact closed-form solution from Castigliano’s theorem as demonstrated in Appendix B.
In Figure 6a, exp#1, exp#2, and exp#3 have height-to-width ratios h = b / a 1.0 ,   1.5 ,   1.8 , respectively.
For exp#1 (circular ring), the force (P) initially increases steeply and elastically. When P reaches approximately 20 N, the rate of increase slows down, and an almost linear relationship between force and crushing displacement is observed in this range 2 δ [ 5   m m , 30   m m ] . However, when 2 δ exceeds 30 mm, P begins to increase more rapidly and reaches about 150 N steeply at a displacement of approximately 43 mm. During the experiment, the upper plate is then slowly lifted, and the ring undergoes unloading. Interestingly, the unloading path exhibits an initially straight and steep decrease, followed by a curved and slower decrease as the force diminishes. This unloading pattern is consistent across all experiments, as shown in Figure 6 and Figure 7.
For exp#2 (h ≈ 1.5), compared to exp#1, the force P increases more steeply during the initial elastic phase, reaching a larger value of approximately 30 N. After this phase, P remains nearly constant until 2 δ = 30 mm. Beyond this point, P increases slowly when 2 δ [ 30   m m , 45   m m ] and then accelerates sharply, reaching 150 N before being unloaded.
For exp#3 (h ≈ 1.8), after the steepest initial elastic increase to about 33 N, the force does not increase or remain constant as in exp#1 and exp#2. Instead, it decreases slowly until 2 δ is about 25 mm. The force then begins to increase slowly until 2 δ = 50 mm, after which it accelerates sharply, similar to the other experiments.
These observations highlight the advantage of elliptic rings in energy absorption applications. Specifically, elliptic rings exhibit longer stroke lengths with a nearly constant force over a larger range of displacements. This is a key desired property [19] for energy absorption applications, e.g., to avoid excessively large reactive forces that could harm human drivers when an out-of-control car is decelerated by a ring structure on the road.
Similar results are observed in Figure 7 for thinner rings. For exp#5 (with h ≈ 1.8), the force-displacement curve exhibits a softening phase (decreasing force) for 2 δ [ 5   m m , 30   m m ] , followed by a slowly increasing phase when 2 δ [ 30   m m , 50   m m ] . In contrast, for exp#4 (with h ≈ 1.2), the force increases monotonically. Both the softening and increasing patterns are captured with high accuracy by both theoretical results and FEA results.

4.3. Evolution of Plastic Region

To the best of our knowledge, there has been no detailed analysis of the plastic region evolution in FEA for the ring crushing problem. Previous related studies [25,26] assumed theoretical moving plastic hinges at the upper and lower parts and fixed plastic hinges in the left and right parts without direct verification. In this study, the evolution of the moving hinges and fixed plastic hinges is directly visualized as active yielding regions defined as regions where plastic dissipation instantaneously occurs in Abaqus software (6.13).
Figure 8 and Figure 9 illustrate the evolution of plastic regions (highlighted in blue to indicate actively yielding regions) during deformation for exp#4 (h ≈ 1.2) and exp#5 (h ≈ 1.8), respectively.
In Figure 8 (exp#4), the collapse mechanism begins with the development of a plastic hinge at the crown point when δ / a = 0.09 , while no fully plastic region exists at the right end initially. This is due to the initial stress levels reaching the yielding condition first at the crown point, as shown in Appendix B. The developed plastic hinge is not stationary; it moves horizontally to the right side, creating an enlarging flat portion. At δ / a = 0.27 , a stationary, non-moving fully plastic region develops at the right end. At δ / a = 0.48 , the stationary region is relatively long. However, as deformation continues, at δ / a = 0.69 the stationary region shrinks, resulting in a significantly reduced size (compared to the previous δ / a = 0.48 case). The moving hinge continues to shift horizontally, while the stationary region becomes notably shorter at δ / a = 0.80 , 1.00 .
Similar results are observed in Figure 9 (exp#5), where the crown point initially develops a moving hinge that shifts to the right throughout. At δ / a = 0.60 , the plastic region is relatively long, but its length continuously shrinks as δ / a = 0.92 , 1.27 , 1.52 , eventually resulting in a very small region at 1.52.
In summary, the collapse mechanism is evident when (1) a plastic hinge first develops at the crown point; (2) the hinge then moves horizontally, creating an enlarging flat portion, while a fixed plastic region emerges at the lateral sides; (3) as deformation progresses, the size of the fixed plastic region shrinks significantly, eventually becoming very small size, while moving hinge maintains an almost constant but small size.

5. Collapse Mechanism Analysis for Linear Hardening Cases

When C = Ep and n = 1, the Ludwik material model reduces to the conventional linear hardening model [25,26]. FEA using linear isotropic hardening, and a theoretical analysis was conducted. The parameters were E p = 1500   M P a ,     σ 0 = 269   M P a (linear hardening material parameters used throughout this paper except in Section 8), l = 5   m m , t = 1.5   m m for h = 1.0 ,   1.2 ,   1.4 ,   1.6 [26]. Elastic modulus = 200 GPa.
The comparison of FEA results and theoretical results is shown in Figure 10. The initial phase of the theoretical result is derived from an elastic analysis in Appendix B. The slope of the force-displacement curve during the initial phase decreases as h increases. The load P is normalized by P 0 = σ 0 t 2 l / a by the classic four plastic hinge model for small deformations (see [25,26]).
For a circular ring (h = 1.0), P/P0 increases steeply to 1.0 and then continues to grow monotonically in an accelerated manner, reaching P/P0 = 6 at δ / a = 0.9. For h = 1.2, P/P0 also increases to 1.0, but grows more slowly compared to the case of h = 1.0. However, when h = 1.4, P/P0 remains almost constant when δ / a [ 0.1 , 0.6 ] and then grows slowly when δ / a [ 0.6 , 1.0 ] before transitioning to accelerated growth. For h = 1.6, consistent with results in Section 4, P/P0 initially decreases (softening phase) and then grows very slowly until accelerated growth occurs. Notably, P/P0 remains around 1.0 over a long displacement range δ / a [ 0.1 , 1.2 ] verifying the advantage of the elliptic ring in providing a longer stroke with nearly constant force resistance. The theoretical results, including the initial phase, agree well with the FEA results. Only at very large deformations, theoretical results slightly underestimate the force level.
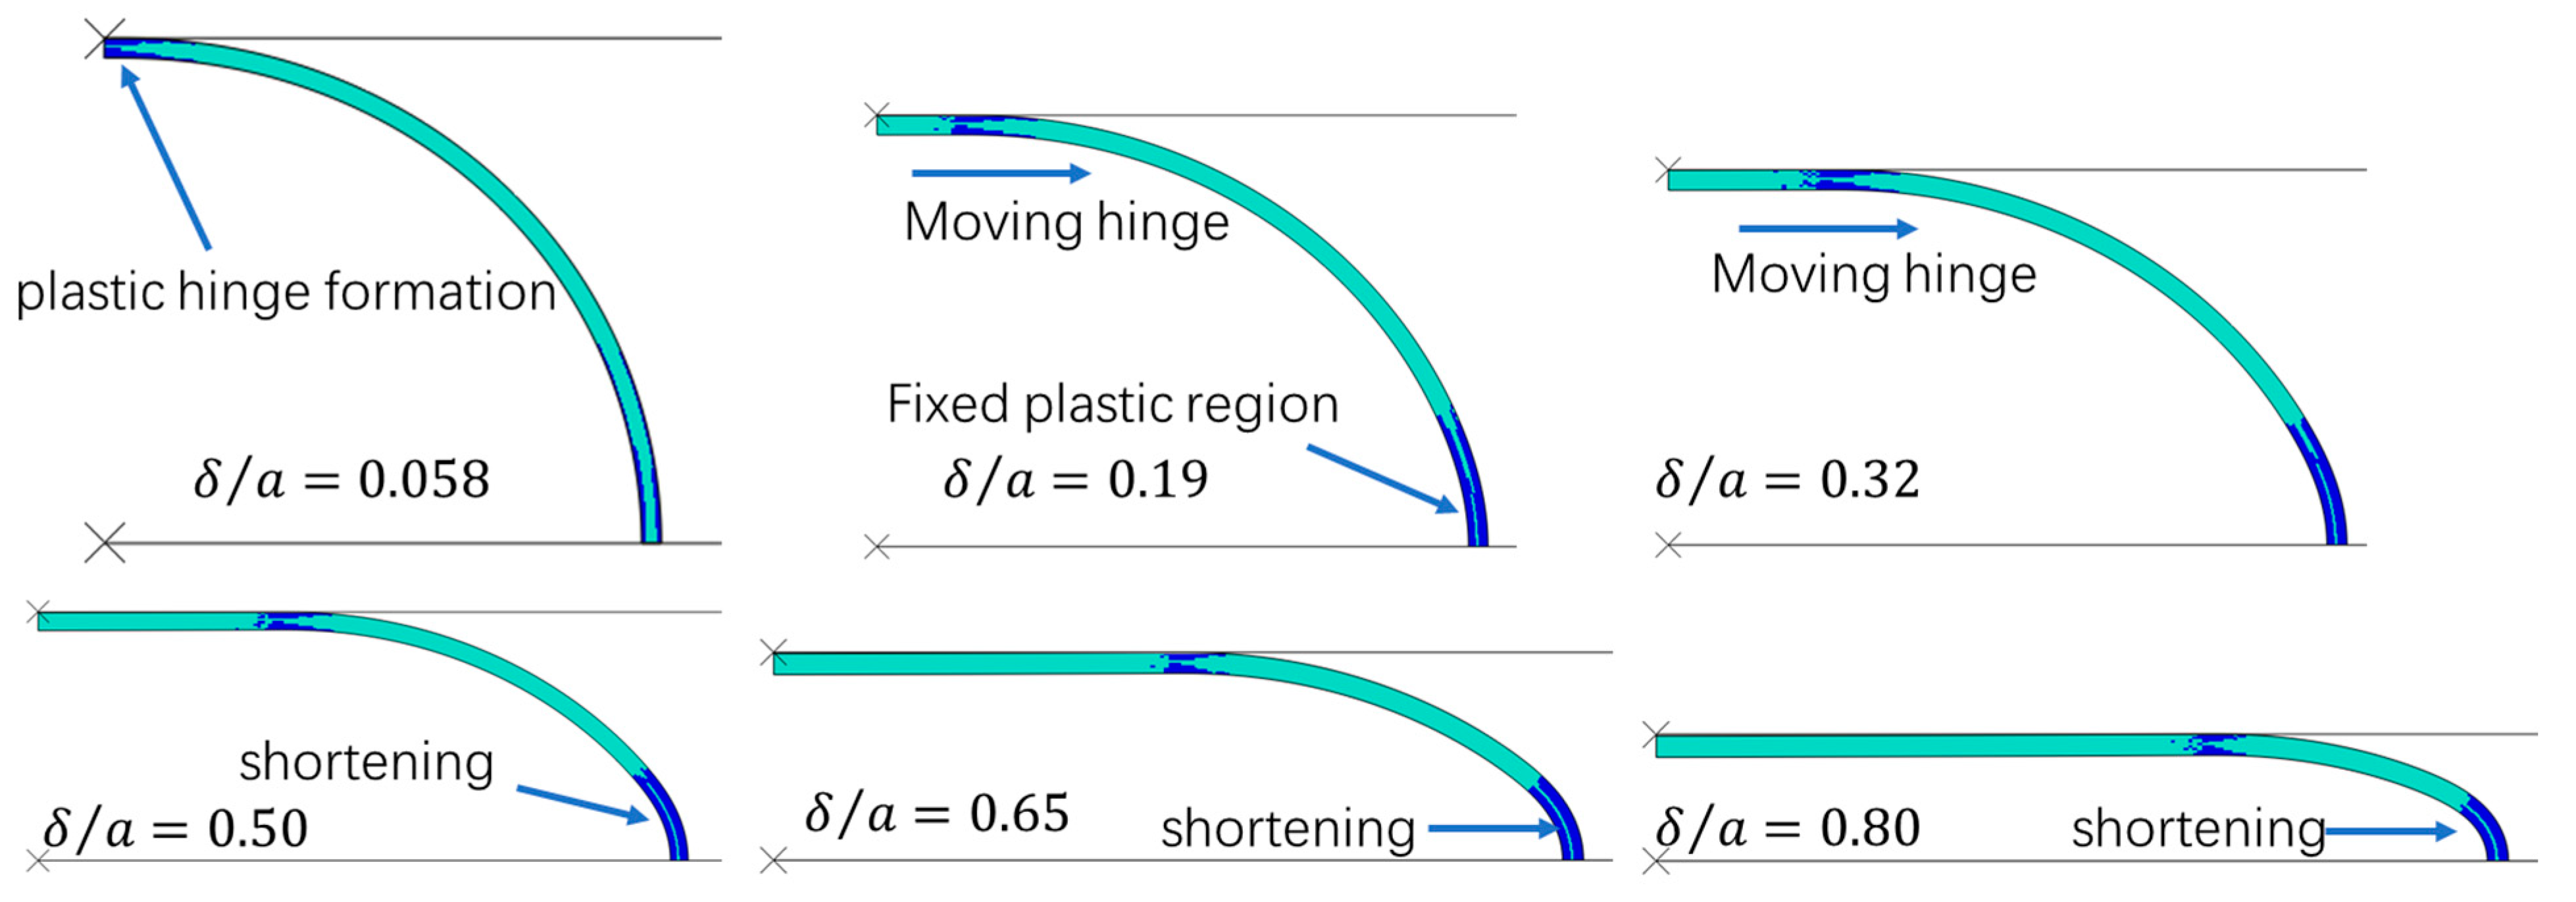
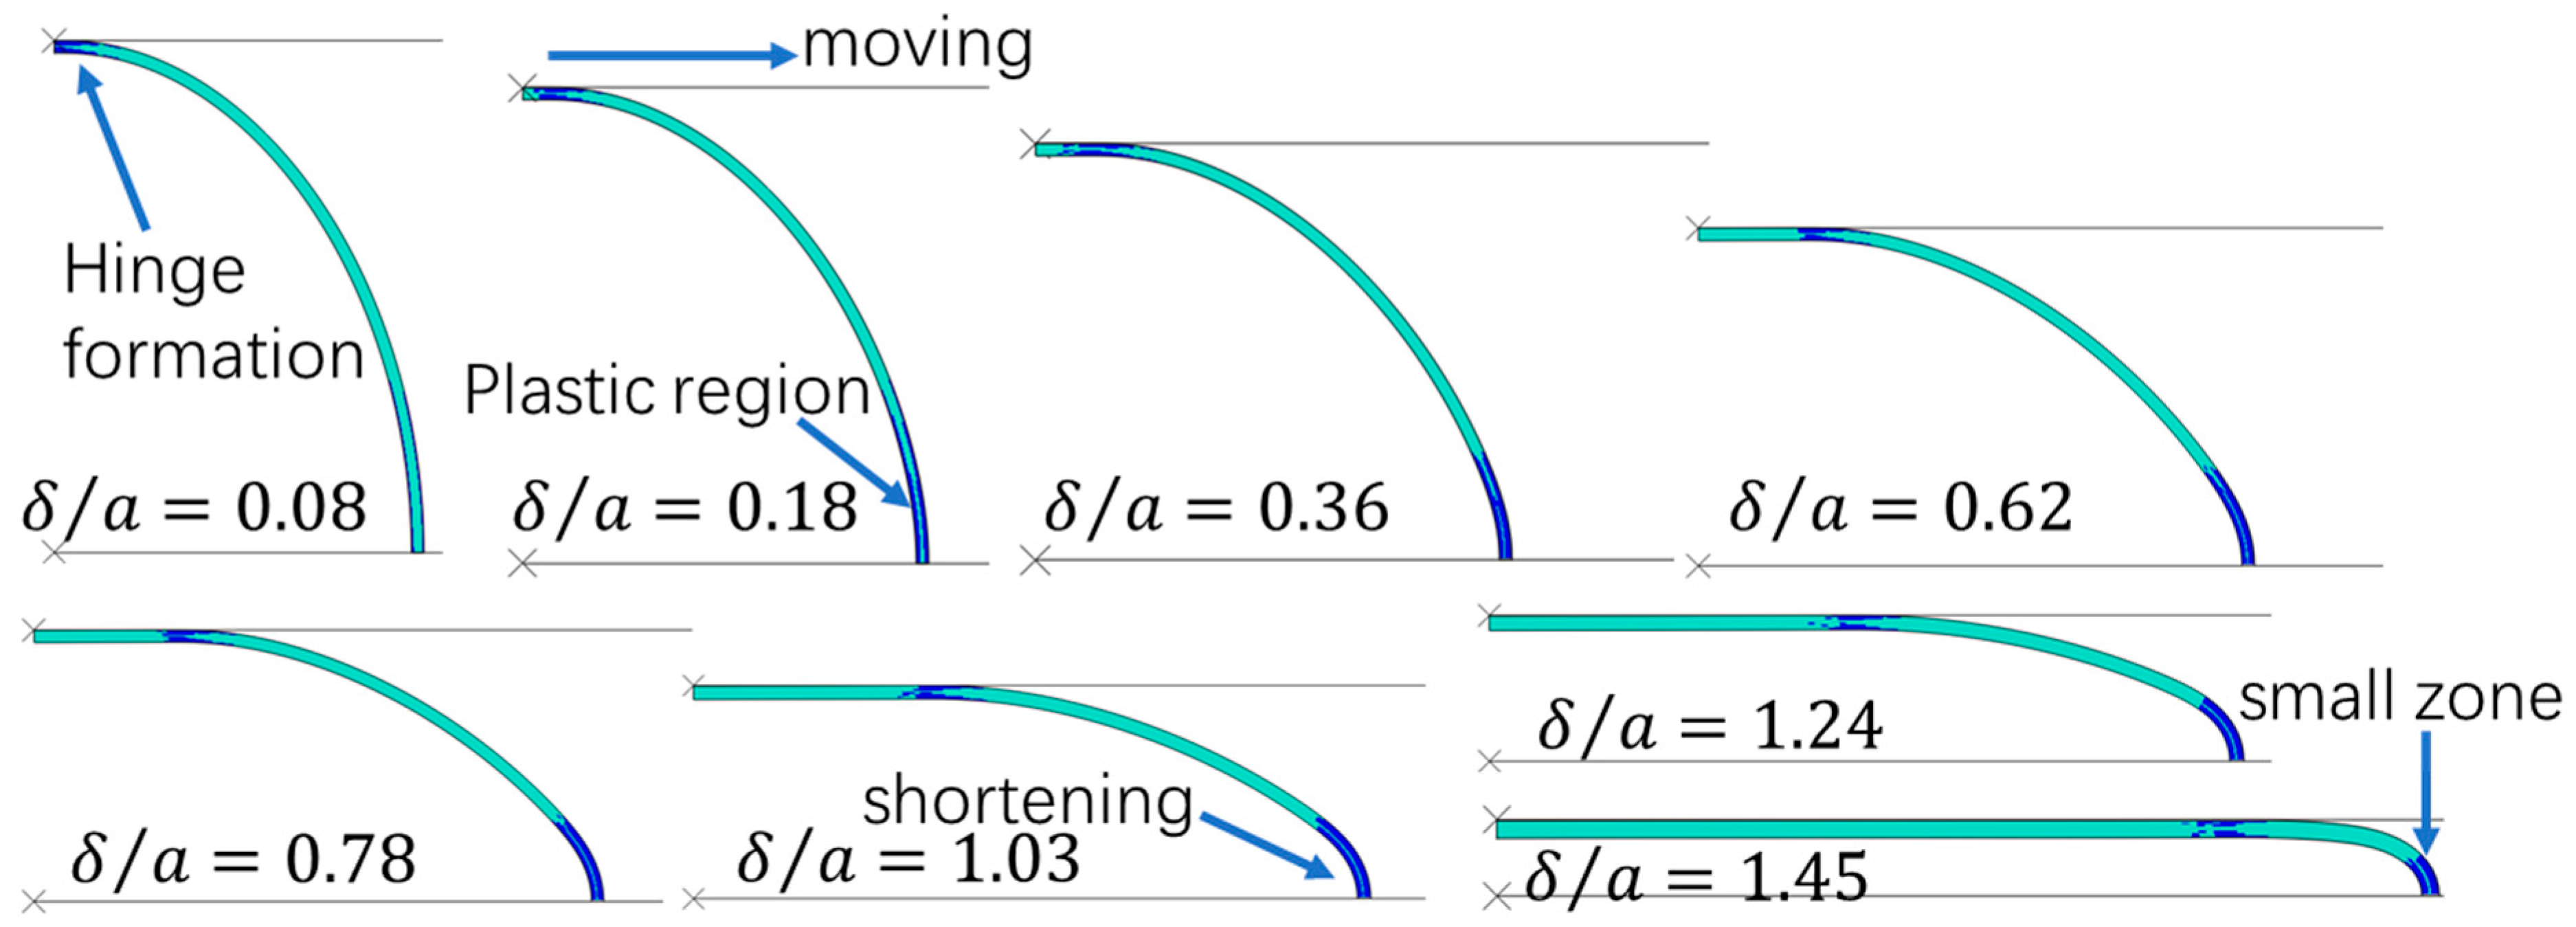
Figure 11 and Figure 12 present visualizations of the active yielding regions from FEA for the circular case (h = 1.0) and the elliptic case (h = 1.6), where instantaneous plastic dissipation occurs at areas highlighted in blue. In Figure 11 (circular case), when δ / a = 0.058 , a plastic hinge forms at the crown point. Similarly, in Figure 12 (elliptic case), when δ / a = 0.08 , the plastic hinge also forms at the crown point. Again, as in Figure 8 and Figure 9, this behavior is not coincidental and is fully explained in Appendix B through a moment distribution analysis during the initial elastic phase. In Figure 11, after the formation of the plastic hinge, the hinge moves horizontally, accompanied by the continuous extension of a flat portion. A fixed plastic region of considerable length emerges at the right-lower area at δ / a = 0.19 . At δ / a = 0.50 the fixed plastic region starts to shrink in size. For the elliptic case in Figure 12, in contrast, the extension of the flat region is slower than in the circular case: when δ / a = 0.78 the flat portion’s length is about a 1/4 of the whole length, whereas in Figure 11, at δ / a = 0.50 the flat portion’s length is about 1/3 of the whole length. This observation aligns with the experimental results in Figure 4 (compare the flat portions in exp#1 and exp#4 for clarity). In Figure 12, at δ / a = 0.18 , a fixed plastic region develops at the right-lower areas and continuously shrinks (comparing the results at δ / a = 1.03 and 0.65) and finally becomes quite small when δ / a = 1.45 .
When compared with results in Section 4.3, these discussions demonstrate that the patterns of plastic region evolution are consistent regardless of the hardening model.

6. Plastic Region Length Prediction by Theoretical Estimation

From the FEA results in Section 4 and Section 5, for elliptic rings crushed between two parallel plates, there are top horizontally moving plastic hinges whose sizes remain nearly constant during deformation. However, the lower stationary plastic regions once developed are initially large in length but continuously shrink in size, eventually becoming very small. This pattern of plastic region length variation was previously discussed theoretically by Reid and Reddy [25] for perfectly circular rings, where the authors demonstrated an initial increase followed by a subsequent shrinkage in length by directly studying the theoretical plastic hinge (denoted as s0 in our notation in Section 2). This approach is equivalent to using the moment criterion M = M0 to determine the plastic region. However, in this paper, it is shown that this criterion significantly over-estimates the plastic region length obtained from FEA. To address this, we propose the modified criterion based on the highest moment during the deformation history by a careful study of the theoretical moment distribution evolution patterns in the plastic hinge region s [ 0 , s 0 ] . We remark that bending moment M could be larger than M 0  due to material hardening since M 0 is defined by initial yielding stress σ 0 and by material hardening, the stress could exceed the yielding stress significantly.

6.1. Proposed Robust Extraction Method of Fully Plastic Region Length in FEA

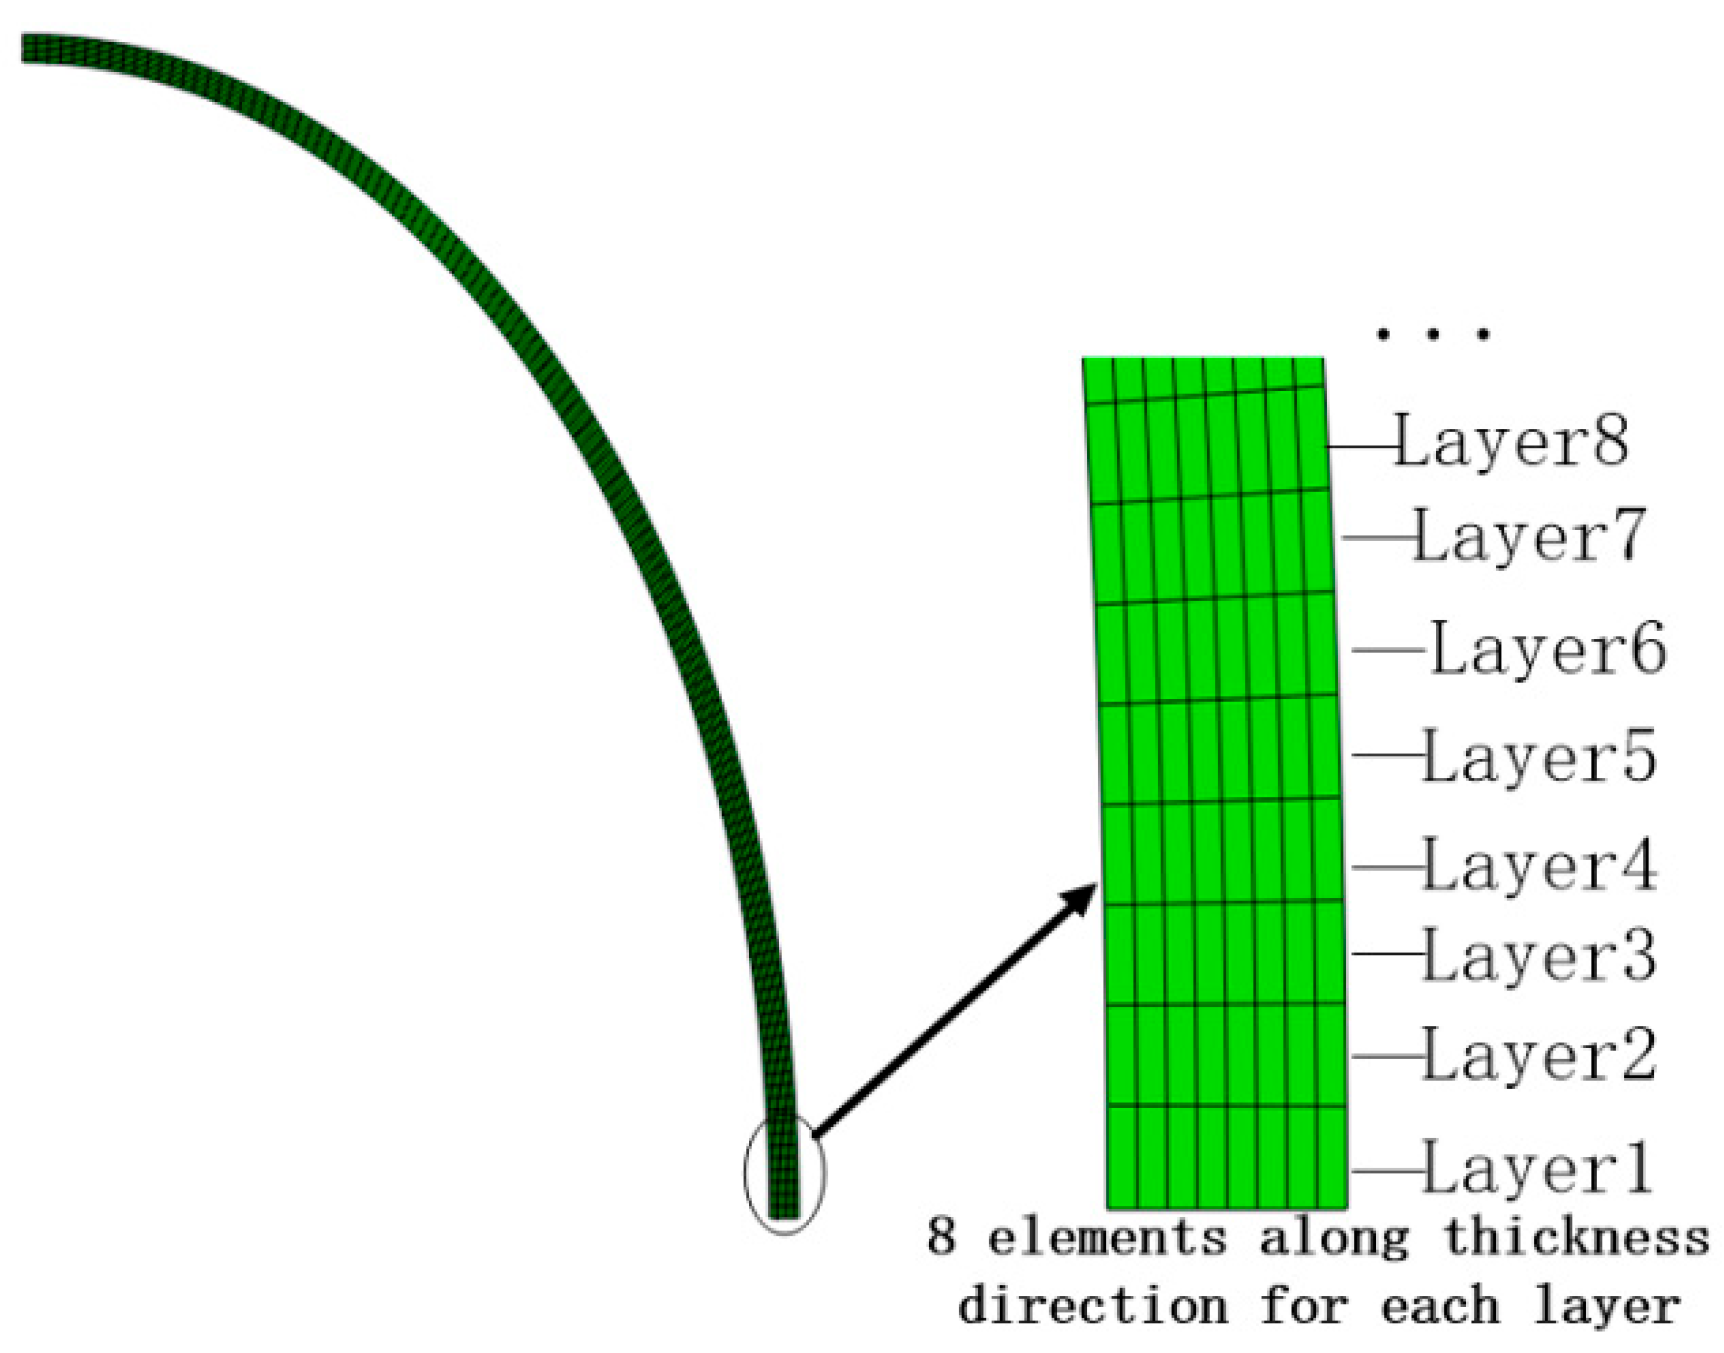
In order to obtain the fully plastic region length (denoted by s p l ) from FEA, circumferentially, the structural elements are indexed by layer 1, layer 2, layer 3, etc., as shown in Figure 13. The programmable steps are listed below.
Step (1). Calculate the centroid coordinate O i of all elements of the i-th layer in the undeformed configuration. Set the bottom reference coordinate as O 0 = ( a , 0 ) (see the Cartesian coordinate system in Figure 5).
Step (2). After each increment of the static step, for each layer i = 1 ,   2 ,   3 , , count the number N i of “active yielding” elements (with “AC Yield” field value equal to 1 in Abaqus) [28];
Step (3). Set a threshold integer N t h r e s h o l d . Define layer i as “fully plastic” if the N i N t h r e s h o l d ;
Step (4). If layer 1 is not fully plastic, then assign s p l = 0 , otherwise, check for layer 1, layer 2, …, layer m sequentially until layer m + 1 is not fully plastic, then the fully plastic length is assigned as s p l = i = 1,2 , , m d ( O i , O i 1 ) where d ( O i , O i 1 ) is the Euclidean distance between two points O i , O i 1 .
The above step (1), …, step (4) enables automatic and efficient extraction of the fully plastic regions’ length variation in FEA as crushing displacement δ / a increases. We remark that all length extraction procedures are automatically performed via Python coding under the Python Development Environment (PDE) provided by ABAQUS software (6.13).
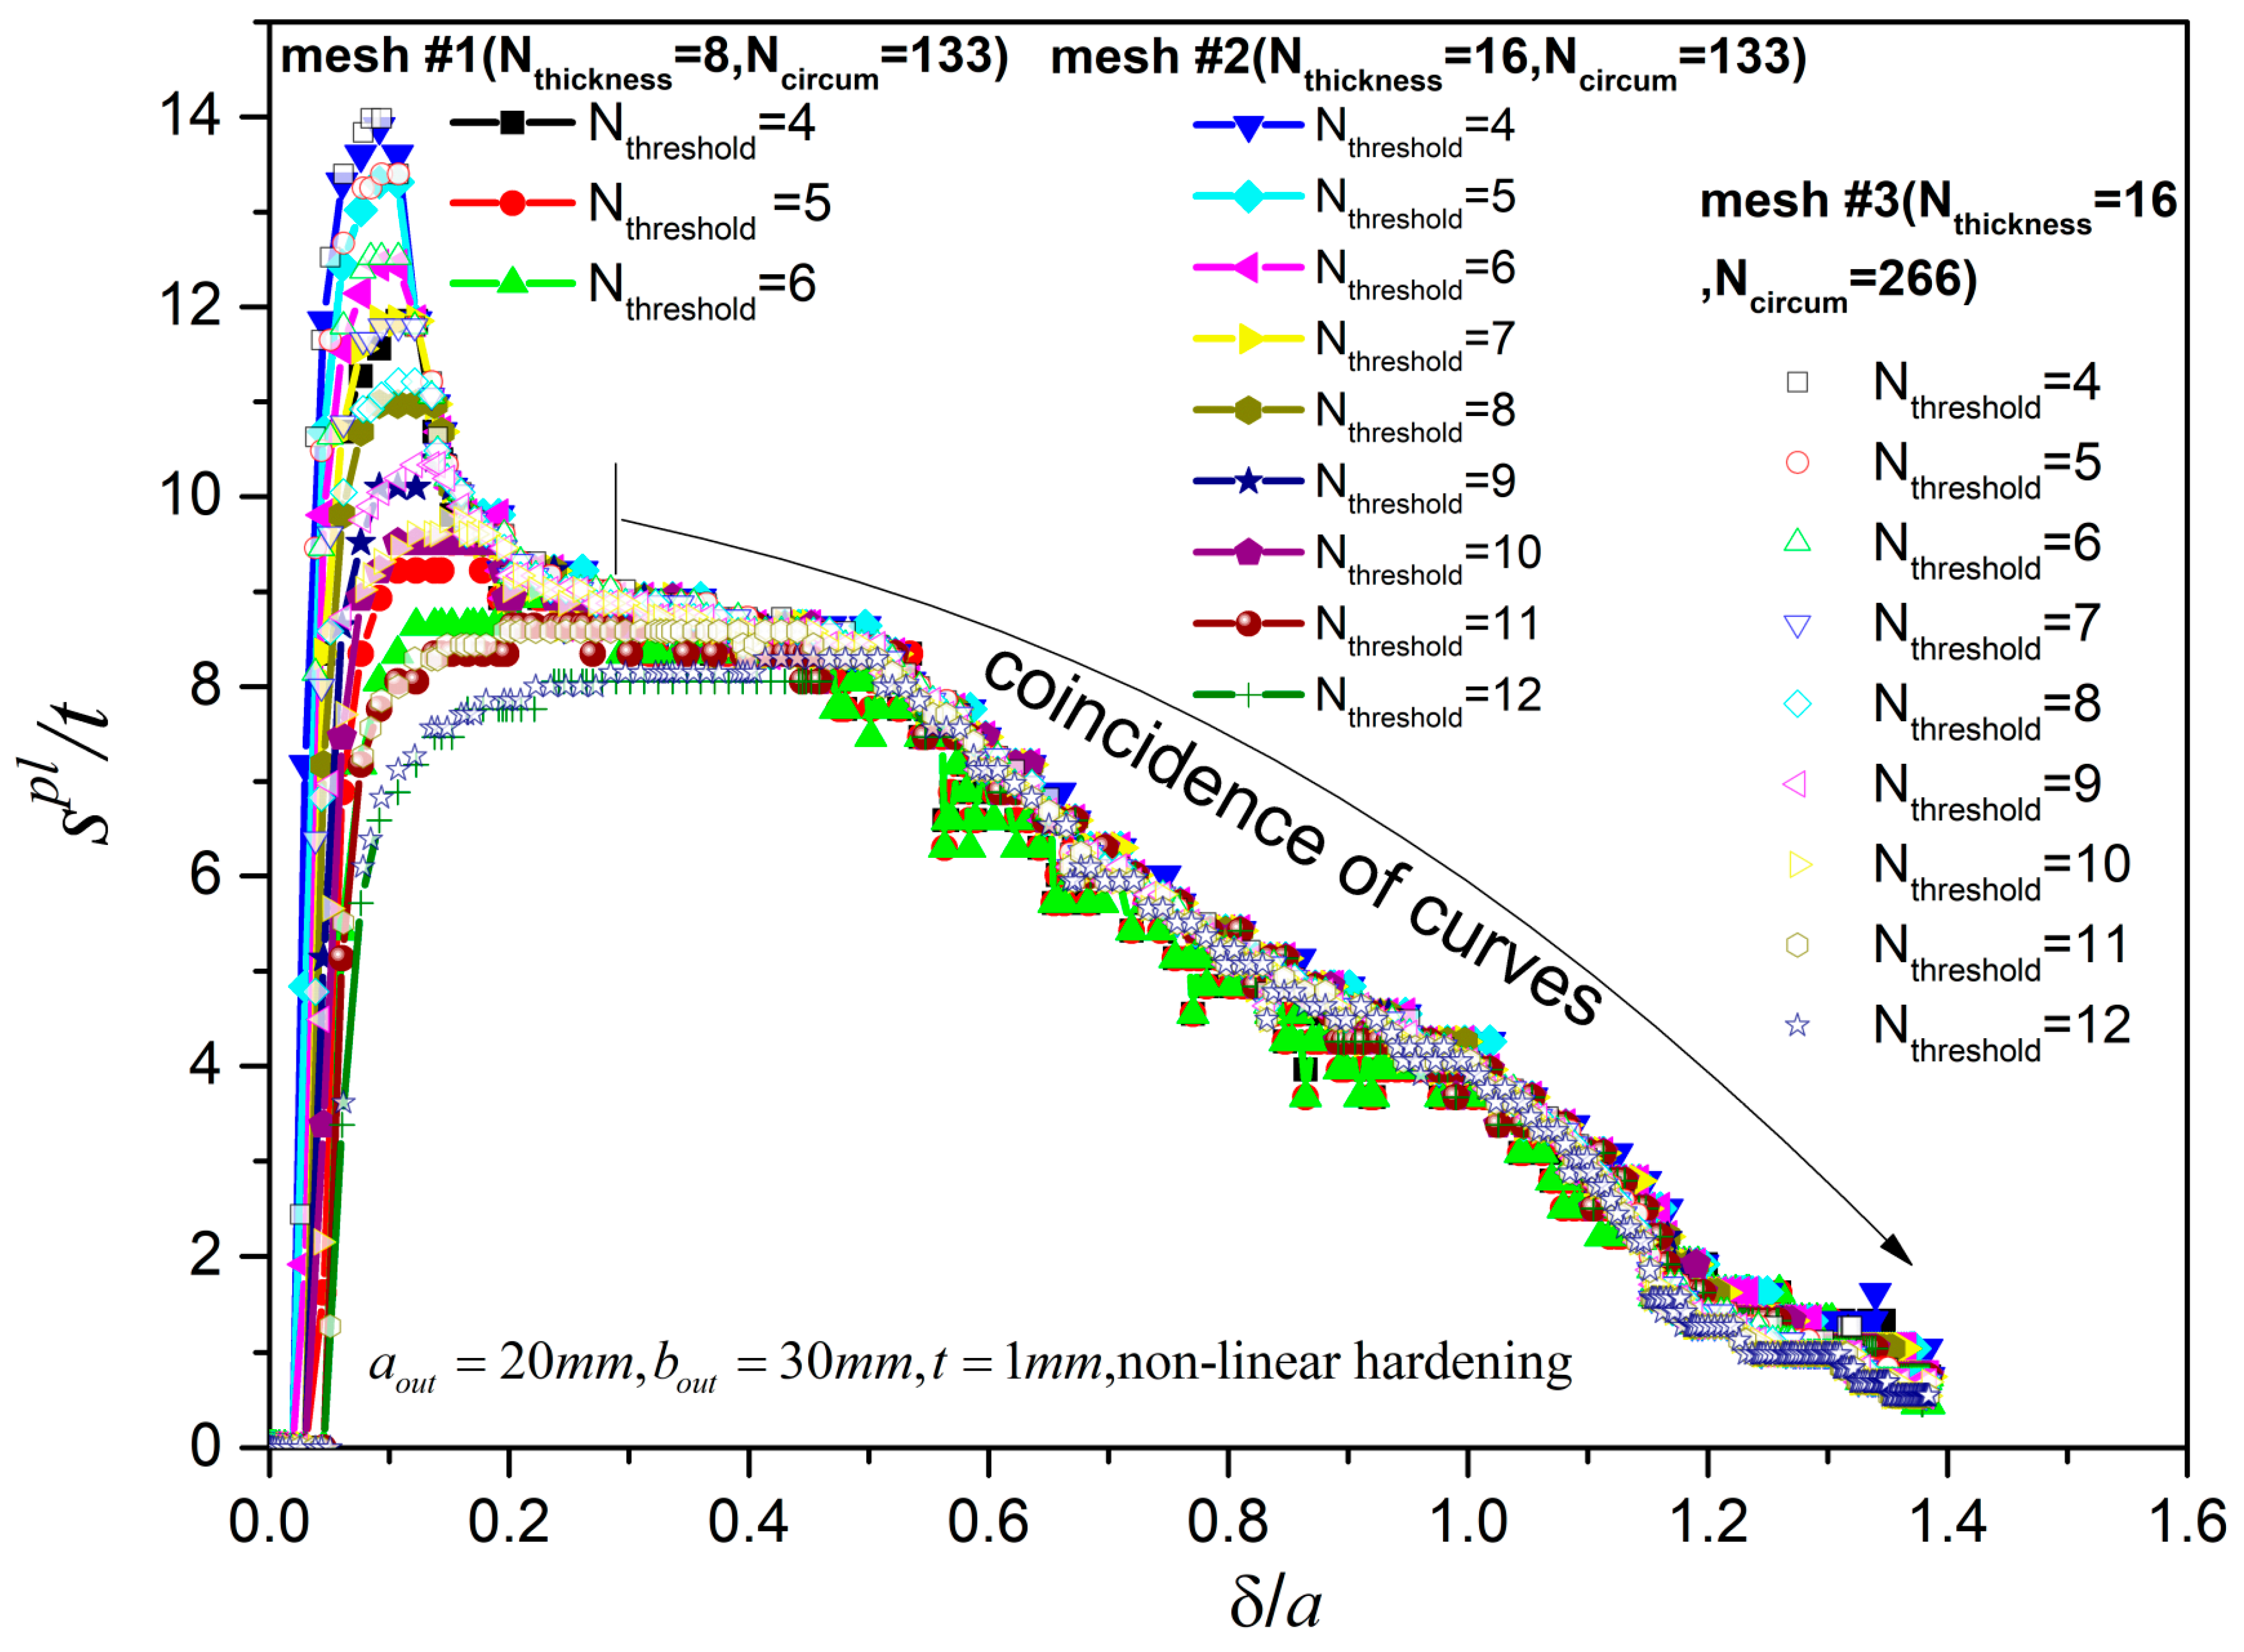
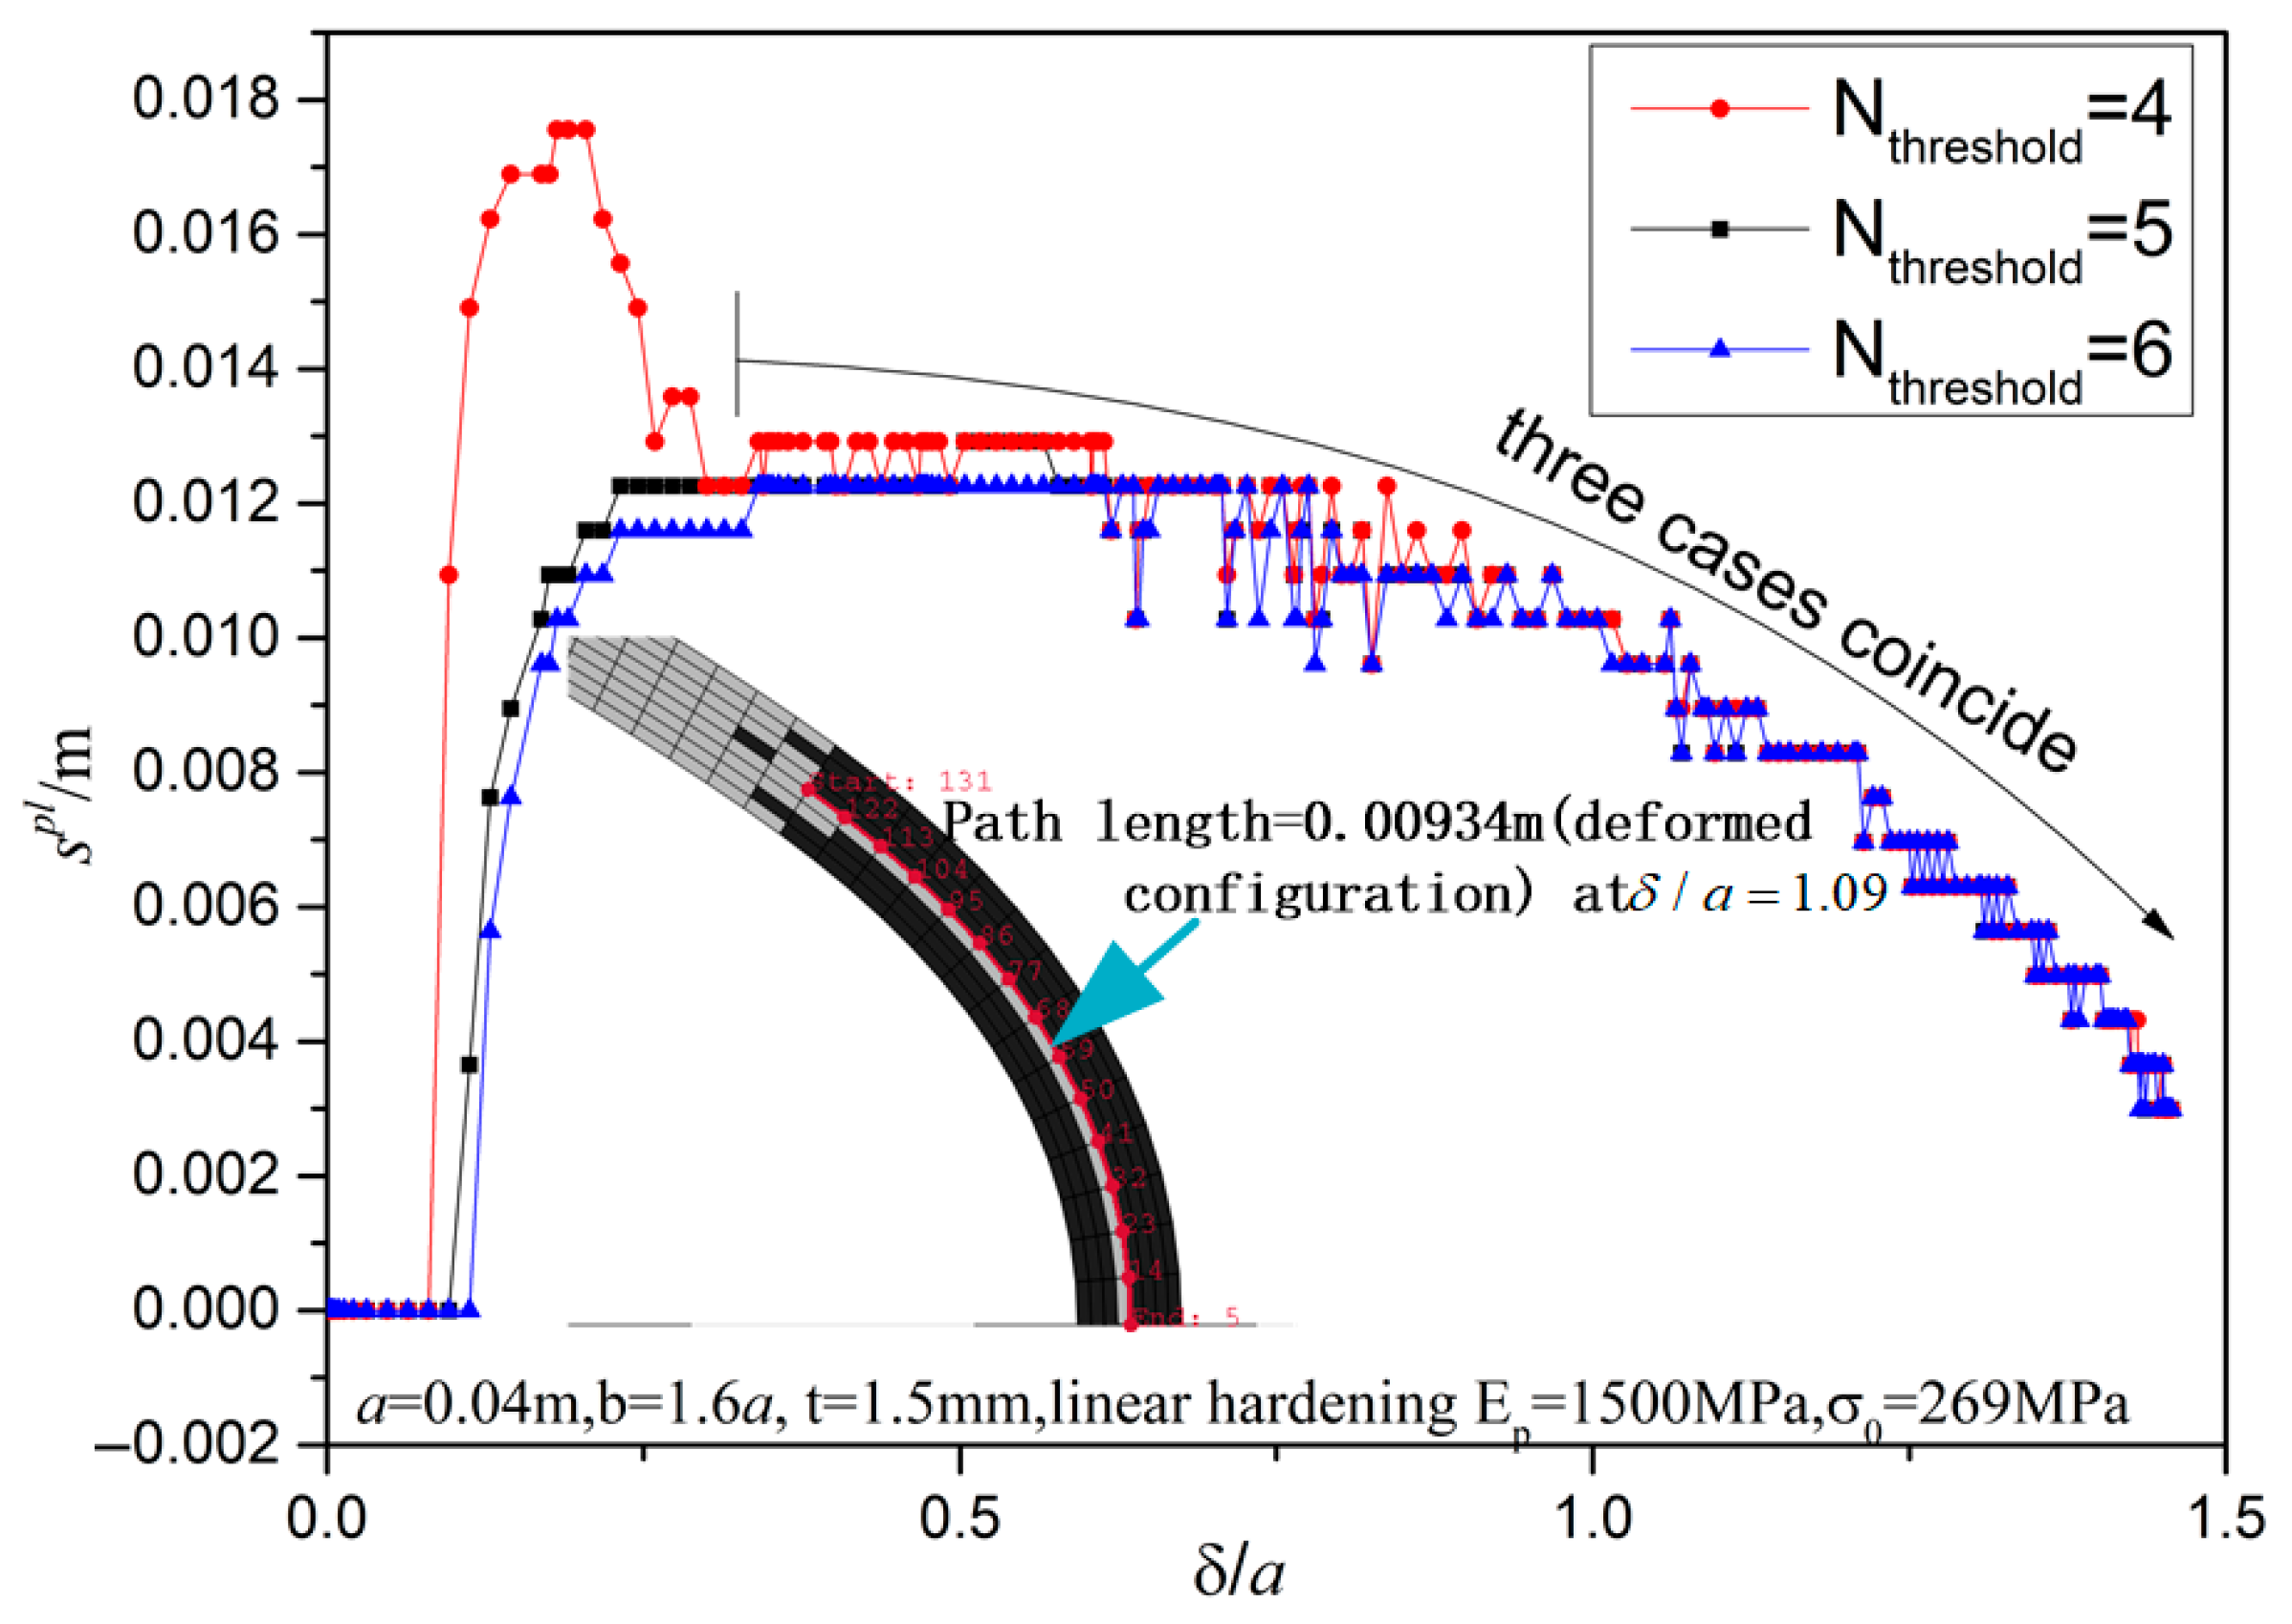
Before proceeding further, the robustness of these steps are shown in Figure 14 for N t h r e s h o l d = 4, 5, 6 with geometric parameters a = 0.04m, b = 1.6a, t = 0.0015m and linear hardening modulus Ep = 1500 MPa and σ0 = 269 MPa. For N t h r e s h o l d = 4, 5, 6, s p l = 0 when δ / a is small since initially the deformation is elastic and all curves almost coincide when δ / a > 0.3. For example for s p l increases steeply to about 0.018 m and then decreases to about 0.012 m when δ / a ≈ 0.3 and then gradually decreases as δ / a increases. For N t h r e s h o l d = 5, 6, the curves agree very well for all δ/a values. Initially s p l only increases to 0.012 m (smaller than the value 0.018 m for N t h r e s h o l d = 4). Of course, since the curvature-induced strain is small at the middle thickness points and thus theoretically in FEA the central layers in thickness direction may always remain elastic (see defined meshes in Figure 14: one layer in thickness direction is not plastic), and thus, it is not reasonable to set N t h r e s h o l d = 8. For example, at δ / a = 1.09, the deformed configuration at the bottom region is presented as the defined meshes in Figure 14 with black-colored actively yielding elements. Manually creating a path by connecting the middle-thickness related nodes and the path’s total length = 0.00934 m, and if the top layer is dropped, the resulting path’s total length = 0.00868 m. Thus, the averaged length is ( 0.00934 + 0.00868 ) / 2 = 0.00901     m , while the corresponding s p l = 0.00895   m for N t h r e s h o l d = 4 ,   5 ,   6 , which agrees very well.
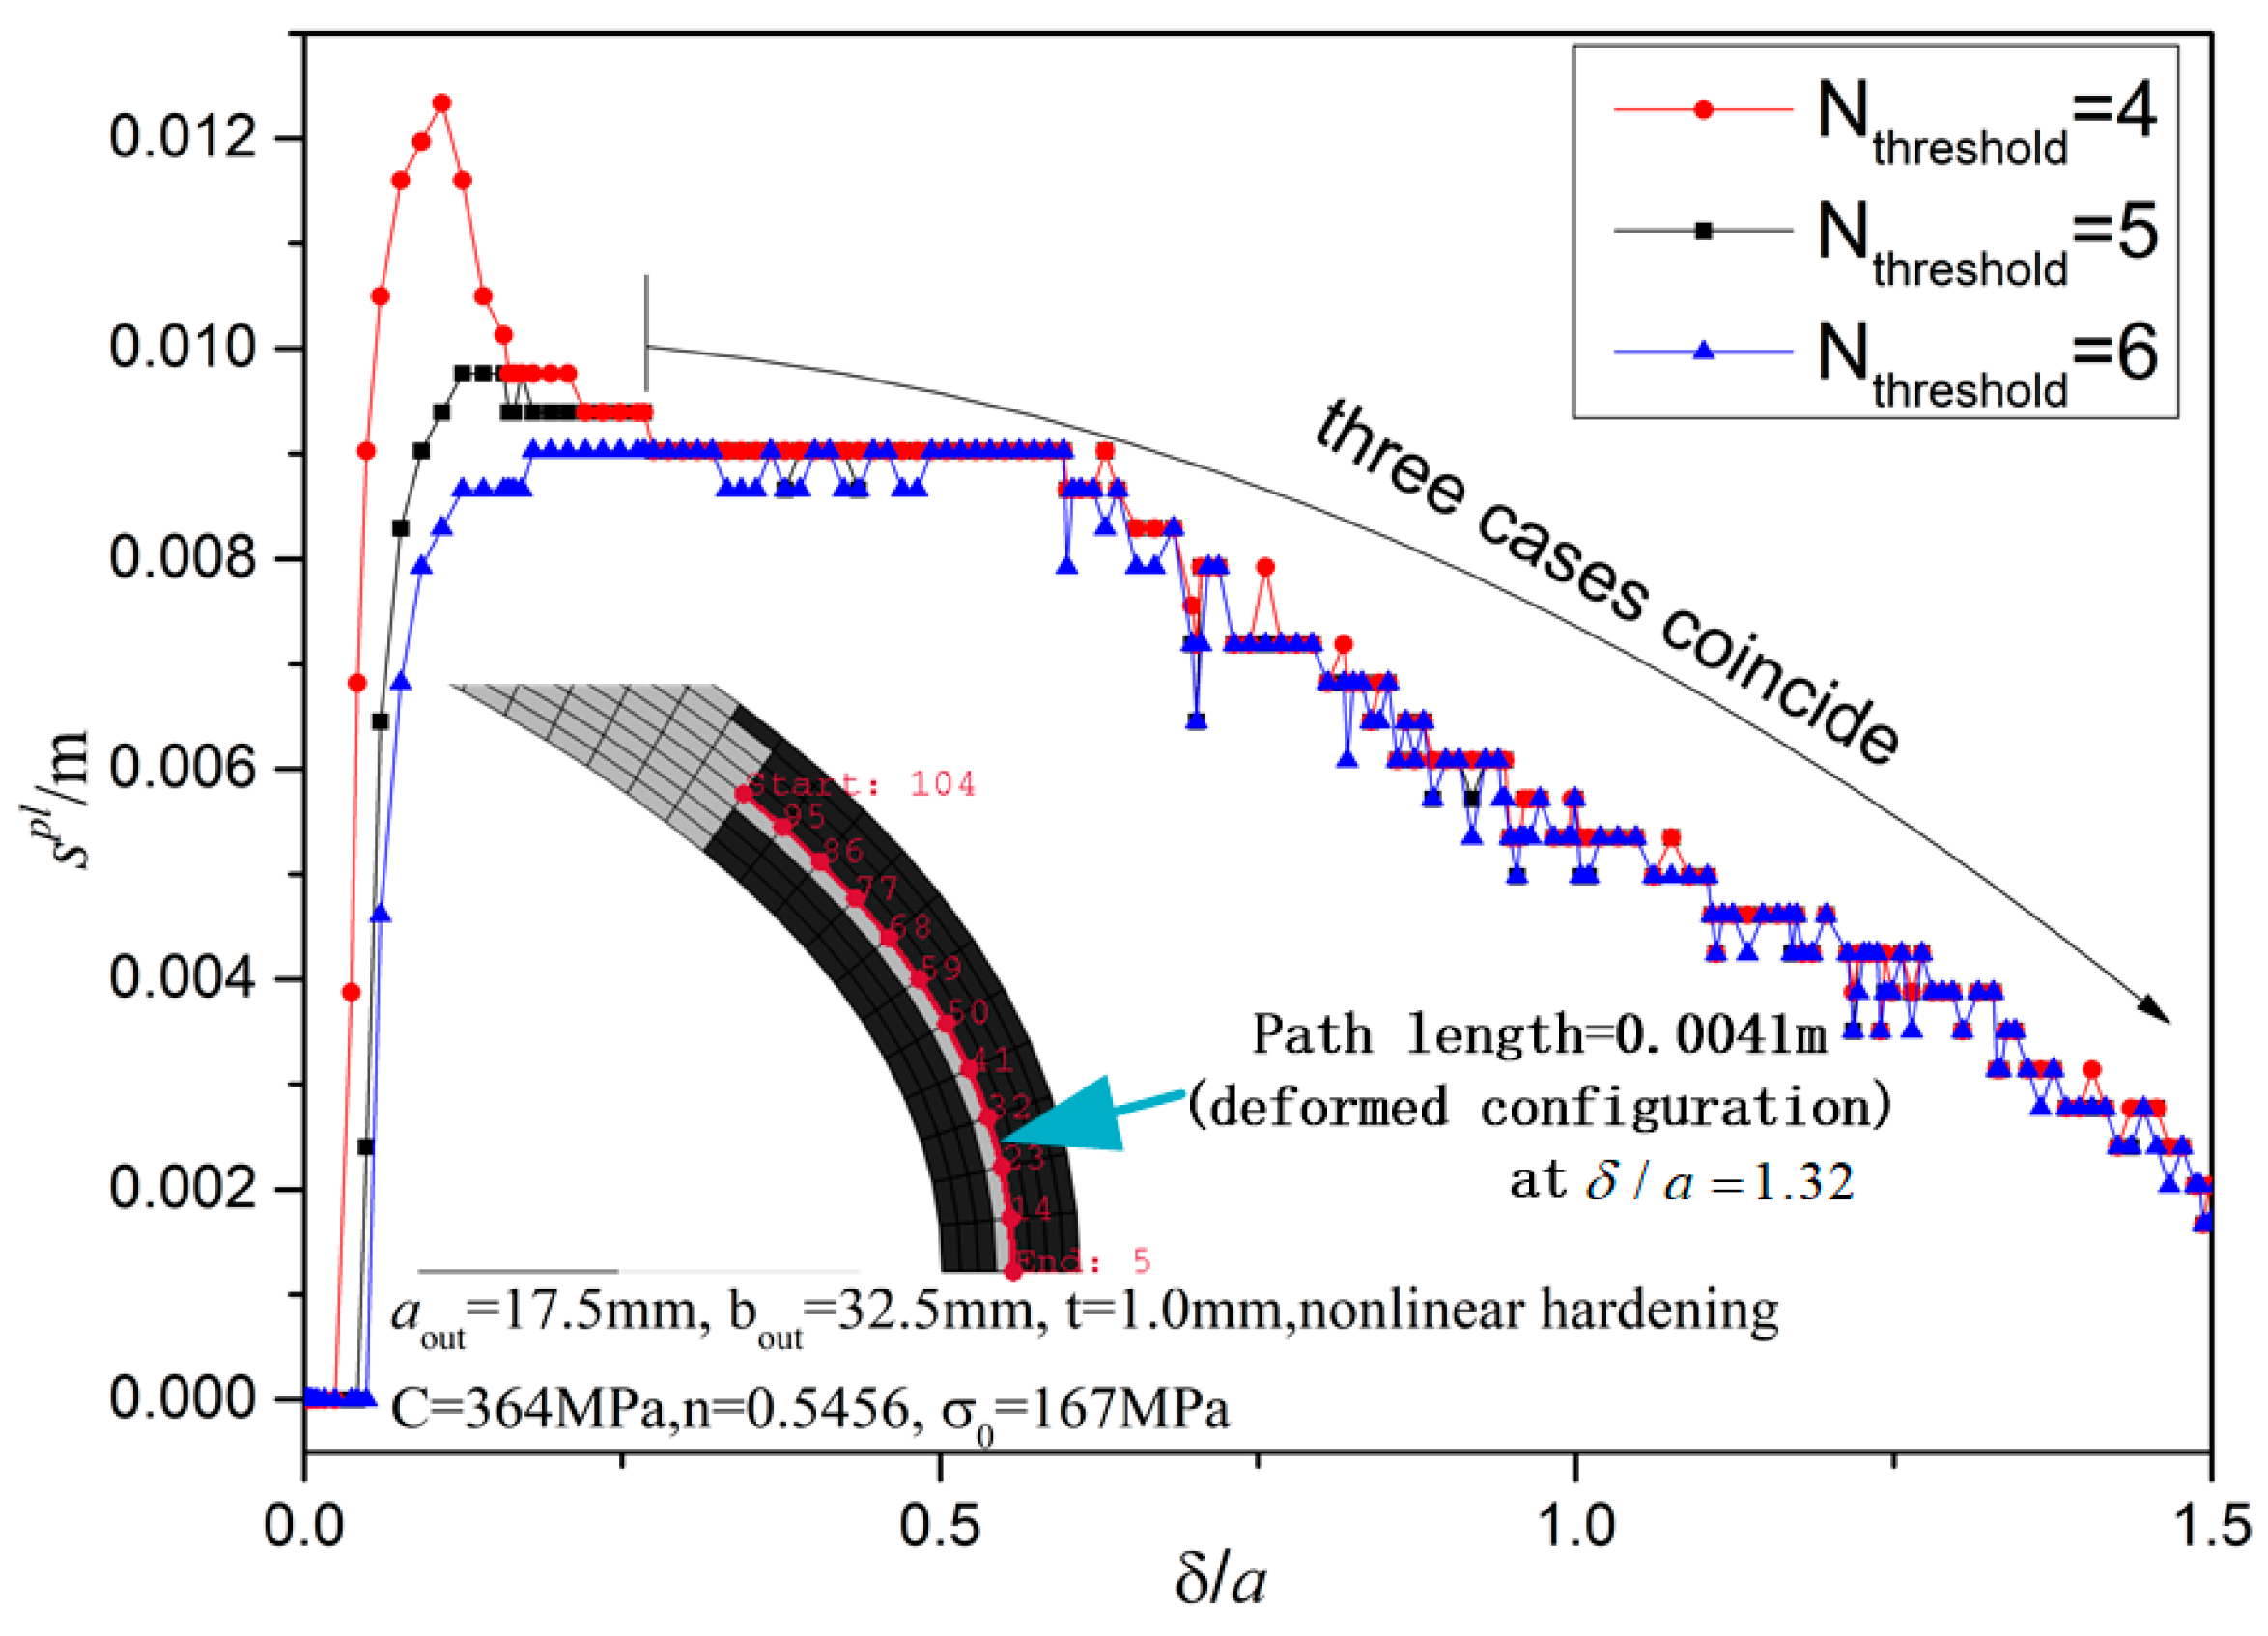
Figure 15 presents an example with the non-linear hardening model. Similarly, all three curves ( N t h r e s h o l d = 4,5 , 6 ) coincide when δ / a > 0.25 and initially s p l = 0 due to elasticity; the smaller N t h r e s h o l d has a larger s p l when δ / a < 0.25 ; generally, the curves of N t h r e s h o l d agree well for all δ / a Also particularly the deformed configuration at the bottom region is presented at δ / a = 1.32 and the length of the manually created path is 0.0041 m and if excluding the top layer, the length is 0.0037 m. The averaged value 0.0039 m agrees well with the automatically extracted length 0.00388 m.
Setting a smaller N t h r e s h o l d compromises the condition of “fully” plastic, and setting N t h r e s h o l d 8 may not be reasonable since the middle thickness layer should be elastic (see defined meshes in Figure 13 and Figure 14). Thus, N t h r e s h o l d = 5 is chosen throughout this paper afterwards(except in Appendix E) and the discussion here shows the robustness of our proposed automatic extraction method of fully plastic region length.

6.2. Proposed Theoretical Prediction Method of Fully Plastic Region Length

The detailed procedure for the theoretical prediction of the bottom fully plastic region length is proposed here. By the theoretical method in Section 2, s 0 depends on crushing displacement δ and thus, s 0 ( δ ) is a function of δ . Interestingly, representing the fully plastic region length by s 0 (regarded as the M 0 criterion) results in large unacceptable overestimation when FEA results are compared. We thus consider the unloading effect and propose the modified criterion as follows: at displacement level δ , a point s [ 0 , s 0 ] is plastic if M ( s ; δ ) = m a x τ δ M ( s ; τ ) where M ( s ; δ ) , M ( s ; τ ) and means cross-sectional resultant moments at displacement δ , τ respectively. This modified criterion excludes the points where its moment is smaller than the highest moment in the loading history(thus, some unloading must have occurred at this point previously).
Thus, a possible automatic algorithm for extraction of theoretical fully plastic region length is proposed as follows:
Step (1): choose s m a x larger than all possible s0 (one may just set s m a x = 10 t since typically s 0 / t < 10 ); choose a large integer N, subdivide the interval [ 0 , s m a x ] into N many sub-intervals evenly with division points j s m a x / N for j = 1, 2, …, N;
Step (2): For each denting displacement level δ and each j, sample M ( j s m a x / N ; δ ) from the theoretical results (see Section 2.2) and if j s m a x / N s 0 , just assign M ( j s m a x / N ; δ ) = M 0 ;
Step (3): For each displacement level δ , increment j as j = 0, 1, 2, …, N sequentially and check whether M ( j s m a x ; δ ) M ( j s m a x / N ; τ ) for all τ δ : if it is true for all j, then fully plastic region length is returned as s 0 ( δ ) ; otherwise fully plastic region length is returned as j s m a x / N when the first violation occurs.

6.3. Verification of the Proposed Theoretical Modified Criterion Method for Fully Plastic Region Length Prediction

Figure 16 presents the fully plastic region length predictions for a non-linear hardening material model with four cases (circular in case 1 and elliptic in case 2, case 3, and case 4). As mentioned before N t h r e s h o l d = 5 is used for automatic FEA extraction.
Taking case 1 for example, as δ / a increases from zero, both curves of M 0 criterion and modified criterion have normalized lengths s p l / t steeply increasing initially and coincide exactly before reaching the maximum point. After the maximum point, in modified criterion case, s p l / t suddenly decreases almost linearly (i.e., the slope of the curves changes abruptly and jumps from zero to negative values just at the maximum point). However, in conventional M 0 criterion case, after maximum point, s p l / t smoothly decreases, where the decrease is initially quite slow until δ / a = 0.7 . And an accelerated decrease is observed afterwards. The automatically extracted length from FEA has constant zero value when δ / a is small (since FEA considers the elasticity, while the theoretical models disregard elasticity); after FEA length reaches the maximum (slightly larger than 8), it decreases almost in a linear manner and agrees well with the modified criterion curve closely. Thus the conventional M 0 criterion is unacceptably over-estimating the lengths and this justifies the validity of our proposed modified criterion method. By connecting the maximum point and the end point ( h , 0 ) , the constructed straight line (see Figure 16, case 1) agrees well with both modified criterion curve and FEA results which again confirms the linear decrease pattern after maximum point is passed. The same observation can be made for the other three cases obviously.
We study the theoretical moment distribution here for insights into the problem. Figure 17 presents the moment distribution for s [ 0 , s 0 ] when crushing displacement increases where M = M / l for case 2. Obviously, at s = s 0 , M = 1 / 4 σ 0 t 2 (the horizontal dotted line in Figure 17 and, of course, s 0 varies as δ / a increases, where at δ / a = 0.01 , the curve terminates at s = s 0 6 , while at δ / a = 0.46 the curve terminates at s = s 0 8 . One key observation is that for δ / a = 1.11 , M > 80  N at s = 0 which value is larger than M = 73  N for δ / a = 1.00 at s = 0 , while when s/t = 3, M of δ / a = 1.11 is less than M of δ / a = 1.00 . Thus, physically at s = 0 , from δ / a = 1.00 to 1.11, the material is still loaded with a larger moment. However, some unloading must happen at s / t = 3 . Thus, loading and unloading occur simultaneously when deformation is large. This is not the case when deformation is small; considering the curves of δ / a = 0.01 ,   0.05 ,   0.14 , the moment is always increasing for any s. We postulate that this feature is the cause of over-estimation of plastic region length by M 0 -criterion-based curve in Figure 16, and this motivated our proposal of a modified criterion based on the highest moment in loading history to account for the unloading effect.
The corresponding results for the linear hardening material model are presented in Figure 18 below, where case 1 (circular, h = 1.0 ) and case 2 ( h = 1.2 ), case 3 ( h = 1.4 ), and case 4 ( h = 1.6 ) are compared. The patterns are identical: both modified criterion and M 0 criterion solution coincide again before maximum points and M 0 criterion-based s p l / t is slowly decreasing after maximum points, while the modified criterion-based s p l / t abruptly decreases much faster after maximum points. The FEA results agree well with the modified criterion-based results (interestingly upper-bounding the FEA points roughly) and the conventional M 0 curves significantly over-estimate the lengths. The straight lines connecting maximum points and end point ( h , 0 ) are plotted and it serves as tight lower bounds of the FEA points confirming once again that the fully plastic region length should decrease almost linearly when maximum points are passed. Taking h = 1.0 case as example, in FEA, the initial length remains constantly zero due to elasticity and then it climbs to about 6.5 and then decreases almost linearly; interestingly when δ / a = 0.905 is slightly increased to δ / a = 0.915 , during this 1% increment, the structure suddenly develops a global plastic region occupying a large area of the ring (see “active yielding” subfigure in Figure 18a). This sudden appearance of the global plastic region is not observed in the elliptic counter-parts (see “active yielding” subfigures in case 2, case 3, case 4 when δ / a = 1.096 ,   1.27 ,   1.45 respectively) and this shows that circular rings may distinctly differ from the elliptic rings in terms of plastic dissipation modes especially when δ / a is large.
The above comparisons completely verify our proposed modified criterion method for fully plastic region length prediction. Interestingly for all considered cases the maximum s p l / t < 10 which rationalizes the choice of s m a x = 10 t in step (1) of the theoretical length computation algorithm in Section 6.2.
Figure 19 presents moment distributions for various δ / a in the corresponding linear hardening case for the circular ring (Figure 18a) and the elliptic ring (Figure 18d). The result is similar to that in the non-linear hardening case. For example, in Figure 19b, the initial moments are monotonically increasing for all s until δ / a 0.89 . Then, for smaller s , the moments are still monotonically increasing, while for larger s the moments are decreasing. There are two interesting features: (1) the overall moment magnitudes in h = 1.6 case seem smaller than those in h = 1.0 case; (2) generally, the moment curve terminates at larger s/t when h = 1.6 than when h = 1.0 case. This explains the cause of key advantages of elliptic rings in energy absorption, where longer stroke with a smaller force level.

6.4. Evolution Patterns of Upper and Lower Plastic Regions in FEA

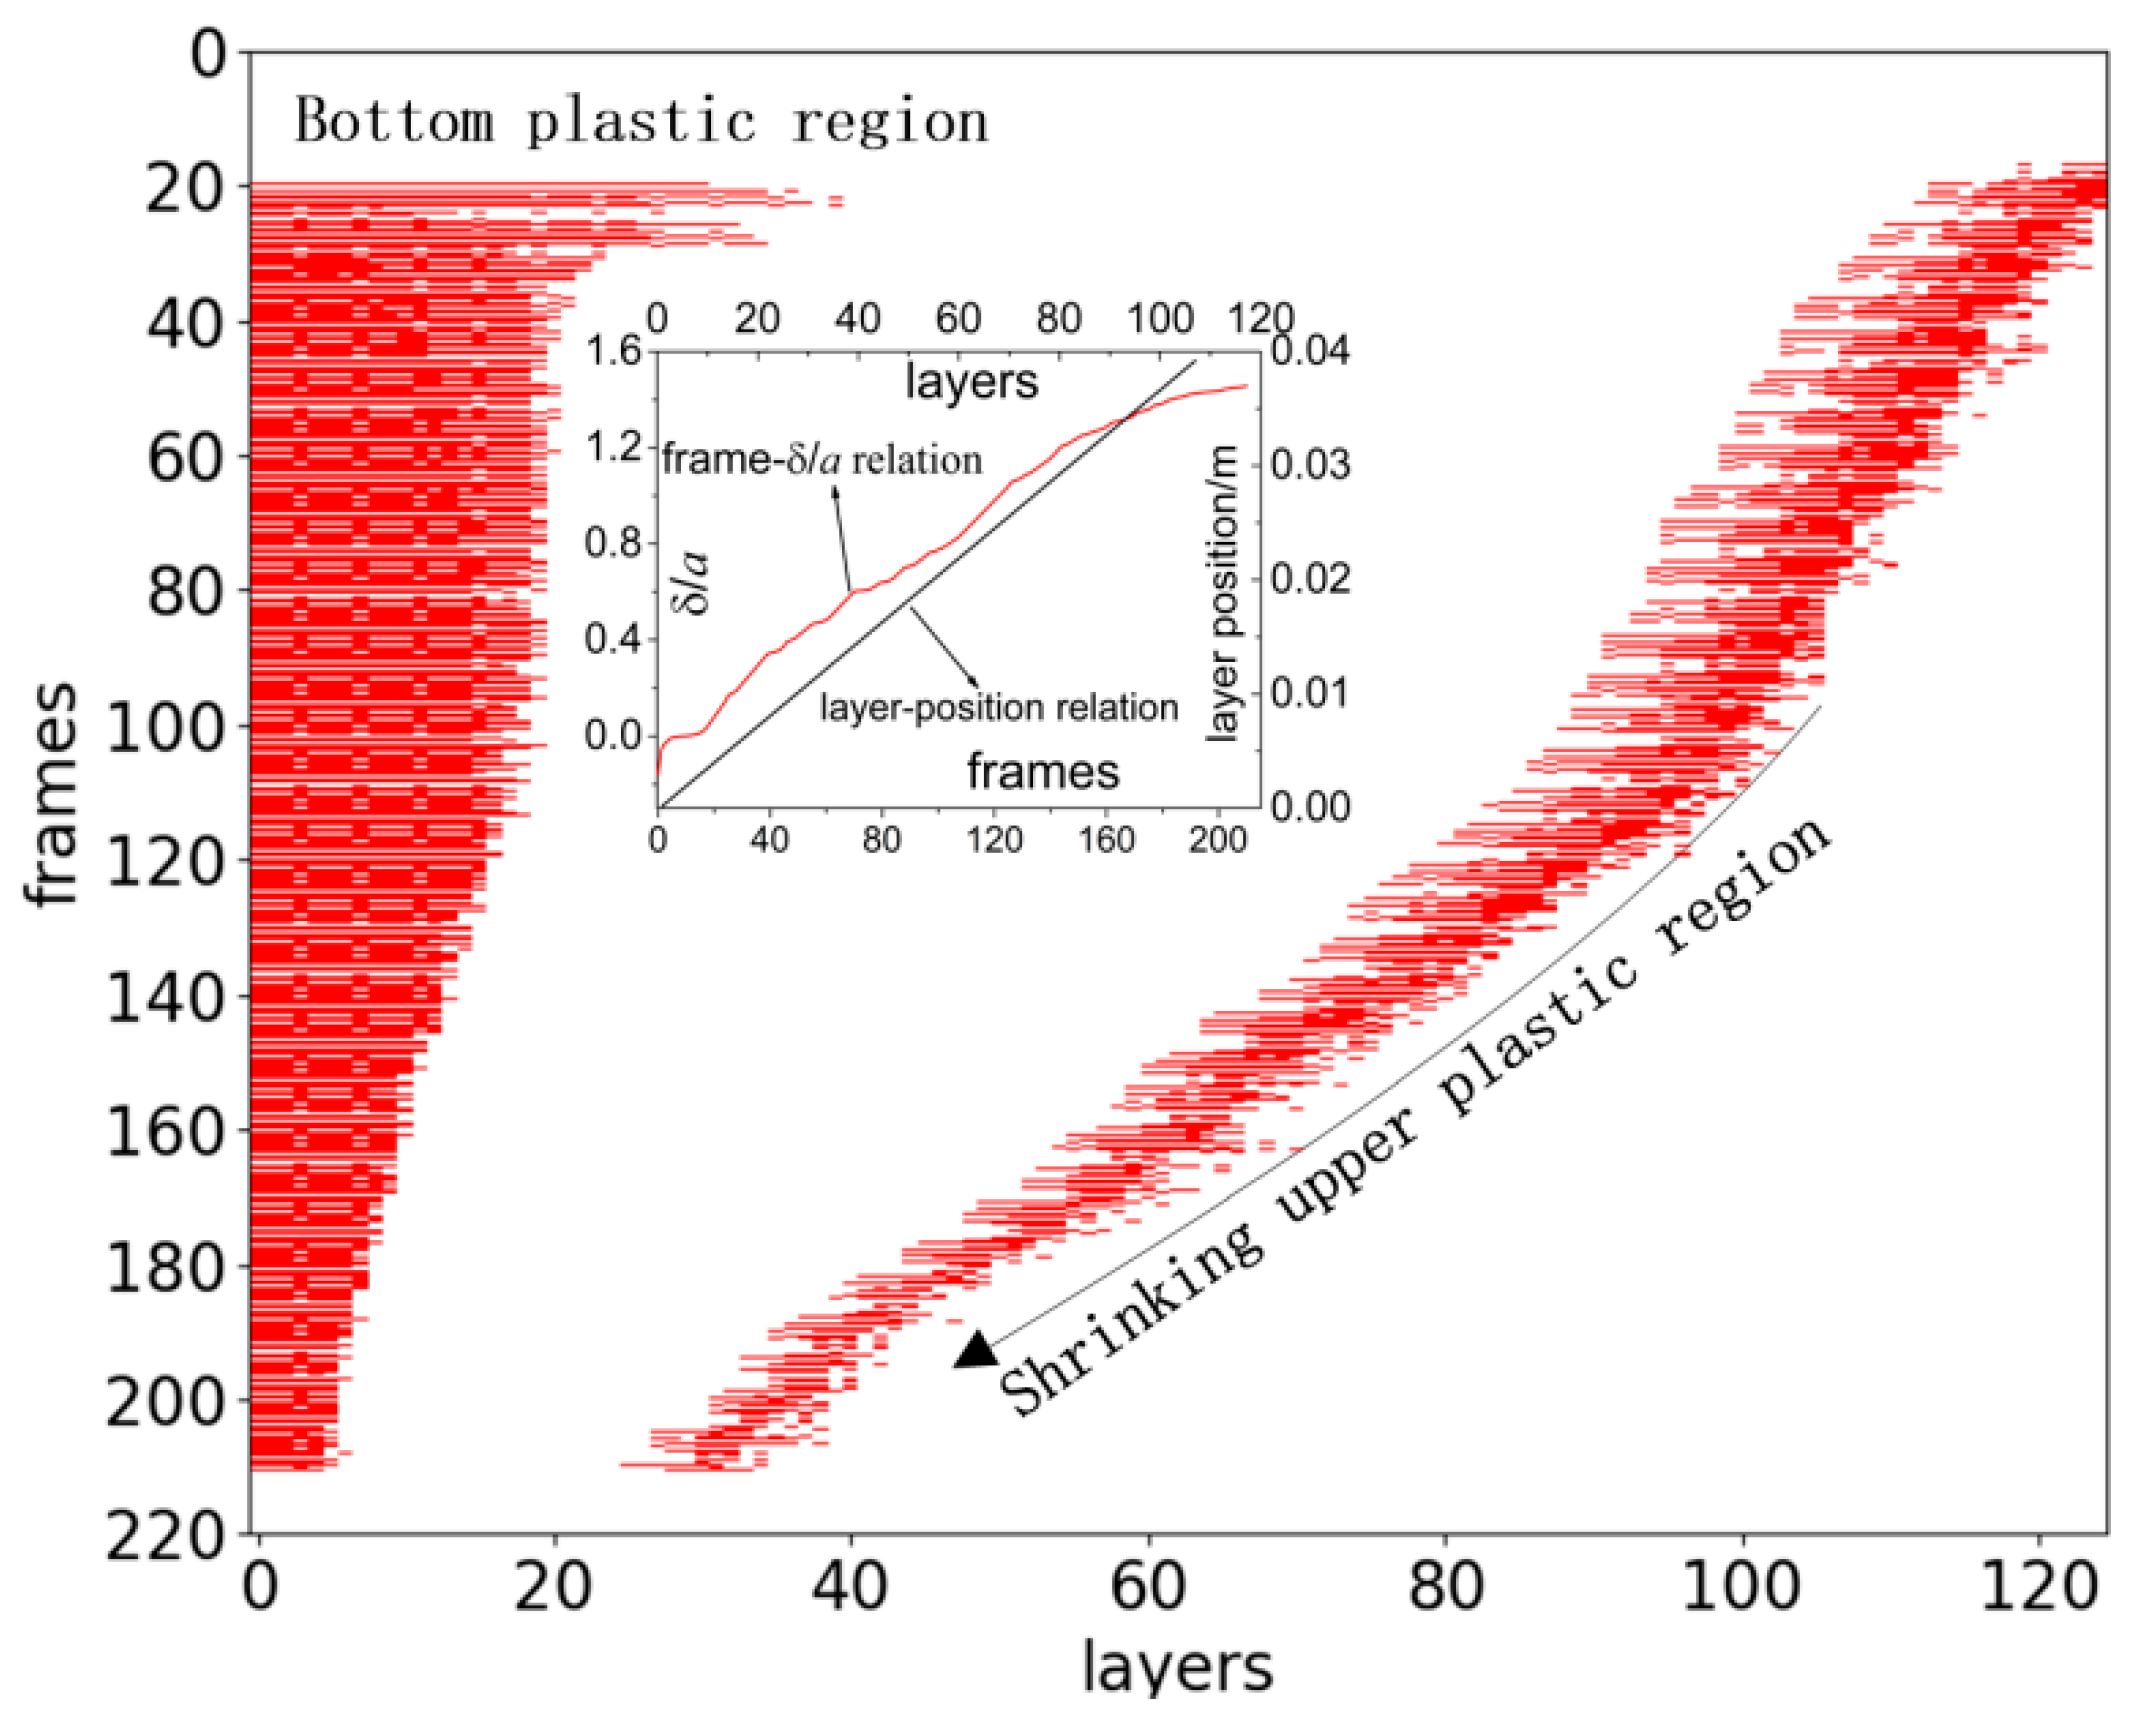
Figure 20 presents how plastic regions (actively yielding regions) evolve as δ / a increases in FEA for the non-linear hardening model. As described in Section 4.1 and Section 6.1, 8 elements are generated in the thickness direction, and each circumferential layer 1, layer 2, … consists of eight elements (Section 6.1). Thus, for each frame (i.e., each increment of the FEA crushing step (see Hibbit et al. [28])), a matrix of row number eight and column number equal to the number of circumferential layers could be constructed by assigning entry value 1 for actively yielding elements and entry value 0 for other elements. Then all frames’ matrices (after appending a blank row to separate frames for each frame) are concatenated in the row direction to form a matrix with row number equal to nine times the frame numbers and column number equal to the number of circumferential layers. The resulting matrices are visualized in Figure 20 and the subfigures show the correspondence between frame numbers and δ / a values and between layer numbers and each layer’s centroid’s arc-length distance (denoted as layer position) to the end ( a , 0 ) point.
Taking Figure 20a as an example, when the frame number initially increases from zero (frame zero means undeformed configuration), no actively yielding region exists; then the top region actively yields first (with relatively smaller area) immediately followed by a large-area active yielding region at bottom region; the actively yielding region then shrinks significantly to less than 20 layers when frame number >100 when δ / a is just above 0.5 (see subfigure in Figure 20a); the shrinkage of the bottom yielding region continues till the end; the upper plastic regions are translating towards the end point ( a , 0 ) and its size is much smaller than the bottom region’s size. By comparing the sizes of the upper plastic regions at frame 20 and frame 270 together, the upper region’s length becomes smaller. At the final frames, a global plastic region emerges suddenly (the deformed configurations at frame 150 and frame 270 are presented as subfigures in Figure 20a to show the global plastic region’s appearance). This visualization also shows the difference between fully plastic region (Section 6.1, Section 6.2 and Section 6.3) and the actively yielding region here: for example at frame about 20, there are about 60 layers having at least one element in thickness direction to actively yield; checking the subfigure in Figure 20a, the total circumferential length is about 0.012 m; however, the maximum fully plastic region length from Figure 16a is about 0.008 m much (much smaller than 0.012 m). However, we show in Section 6.6 that, interestingly, the plastic dissipated energy is almost exclusively due to the fully plastic regions and thus, the theoretical plastic model (dealing only with fully plastic models) is meaningful, even though the actively yielding regions may be much longer than fully plastic regions.
Figure 20b presents the corresponding results for elliptic rings, and there are some distinct differences: (1) the size of the top moving/translating plastic region is shrinking significantly; and (2) no sudden appearance of the global plastic region at the final stages. The other patterns are similar to the circular counterpart: the bottom region is large around frame 20 and then its size decreases to about 25 layers (remains almost constant from frame 30 to frame 70); afterwards, its size decreases almost linearly to a small value at frame 180.
Figure 21 presents the similar plastic region evolution patterns for the linear hardening model with h = 1.6 (case 4 in Figure 18d). The upper plastic region is also shrinking. In the linear hardening case, the bottom plastic region covers constantly 20 layers (approximately) from frame 40 to frame 110 and then decreases almost linearly.

6.5. A Theoretical Interpretation of Why the Upper Plastic Region Significantly Shrinks in the Elliptic Ring

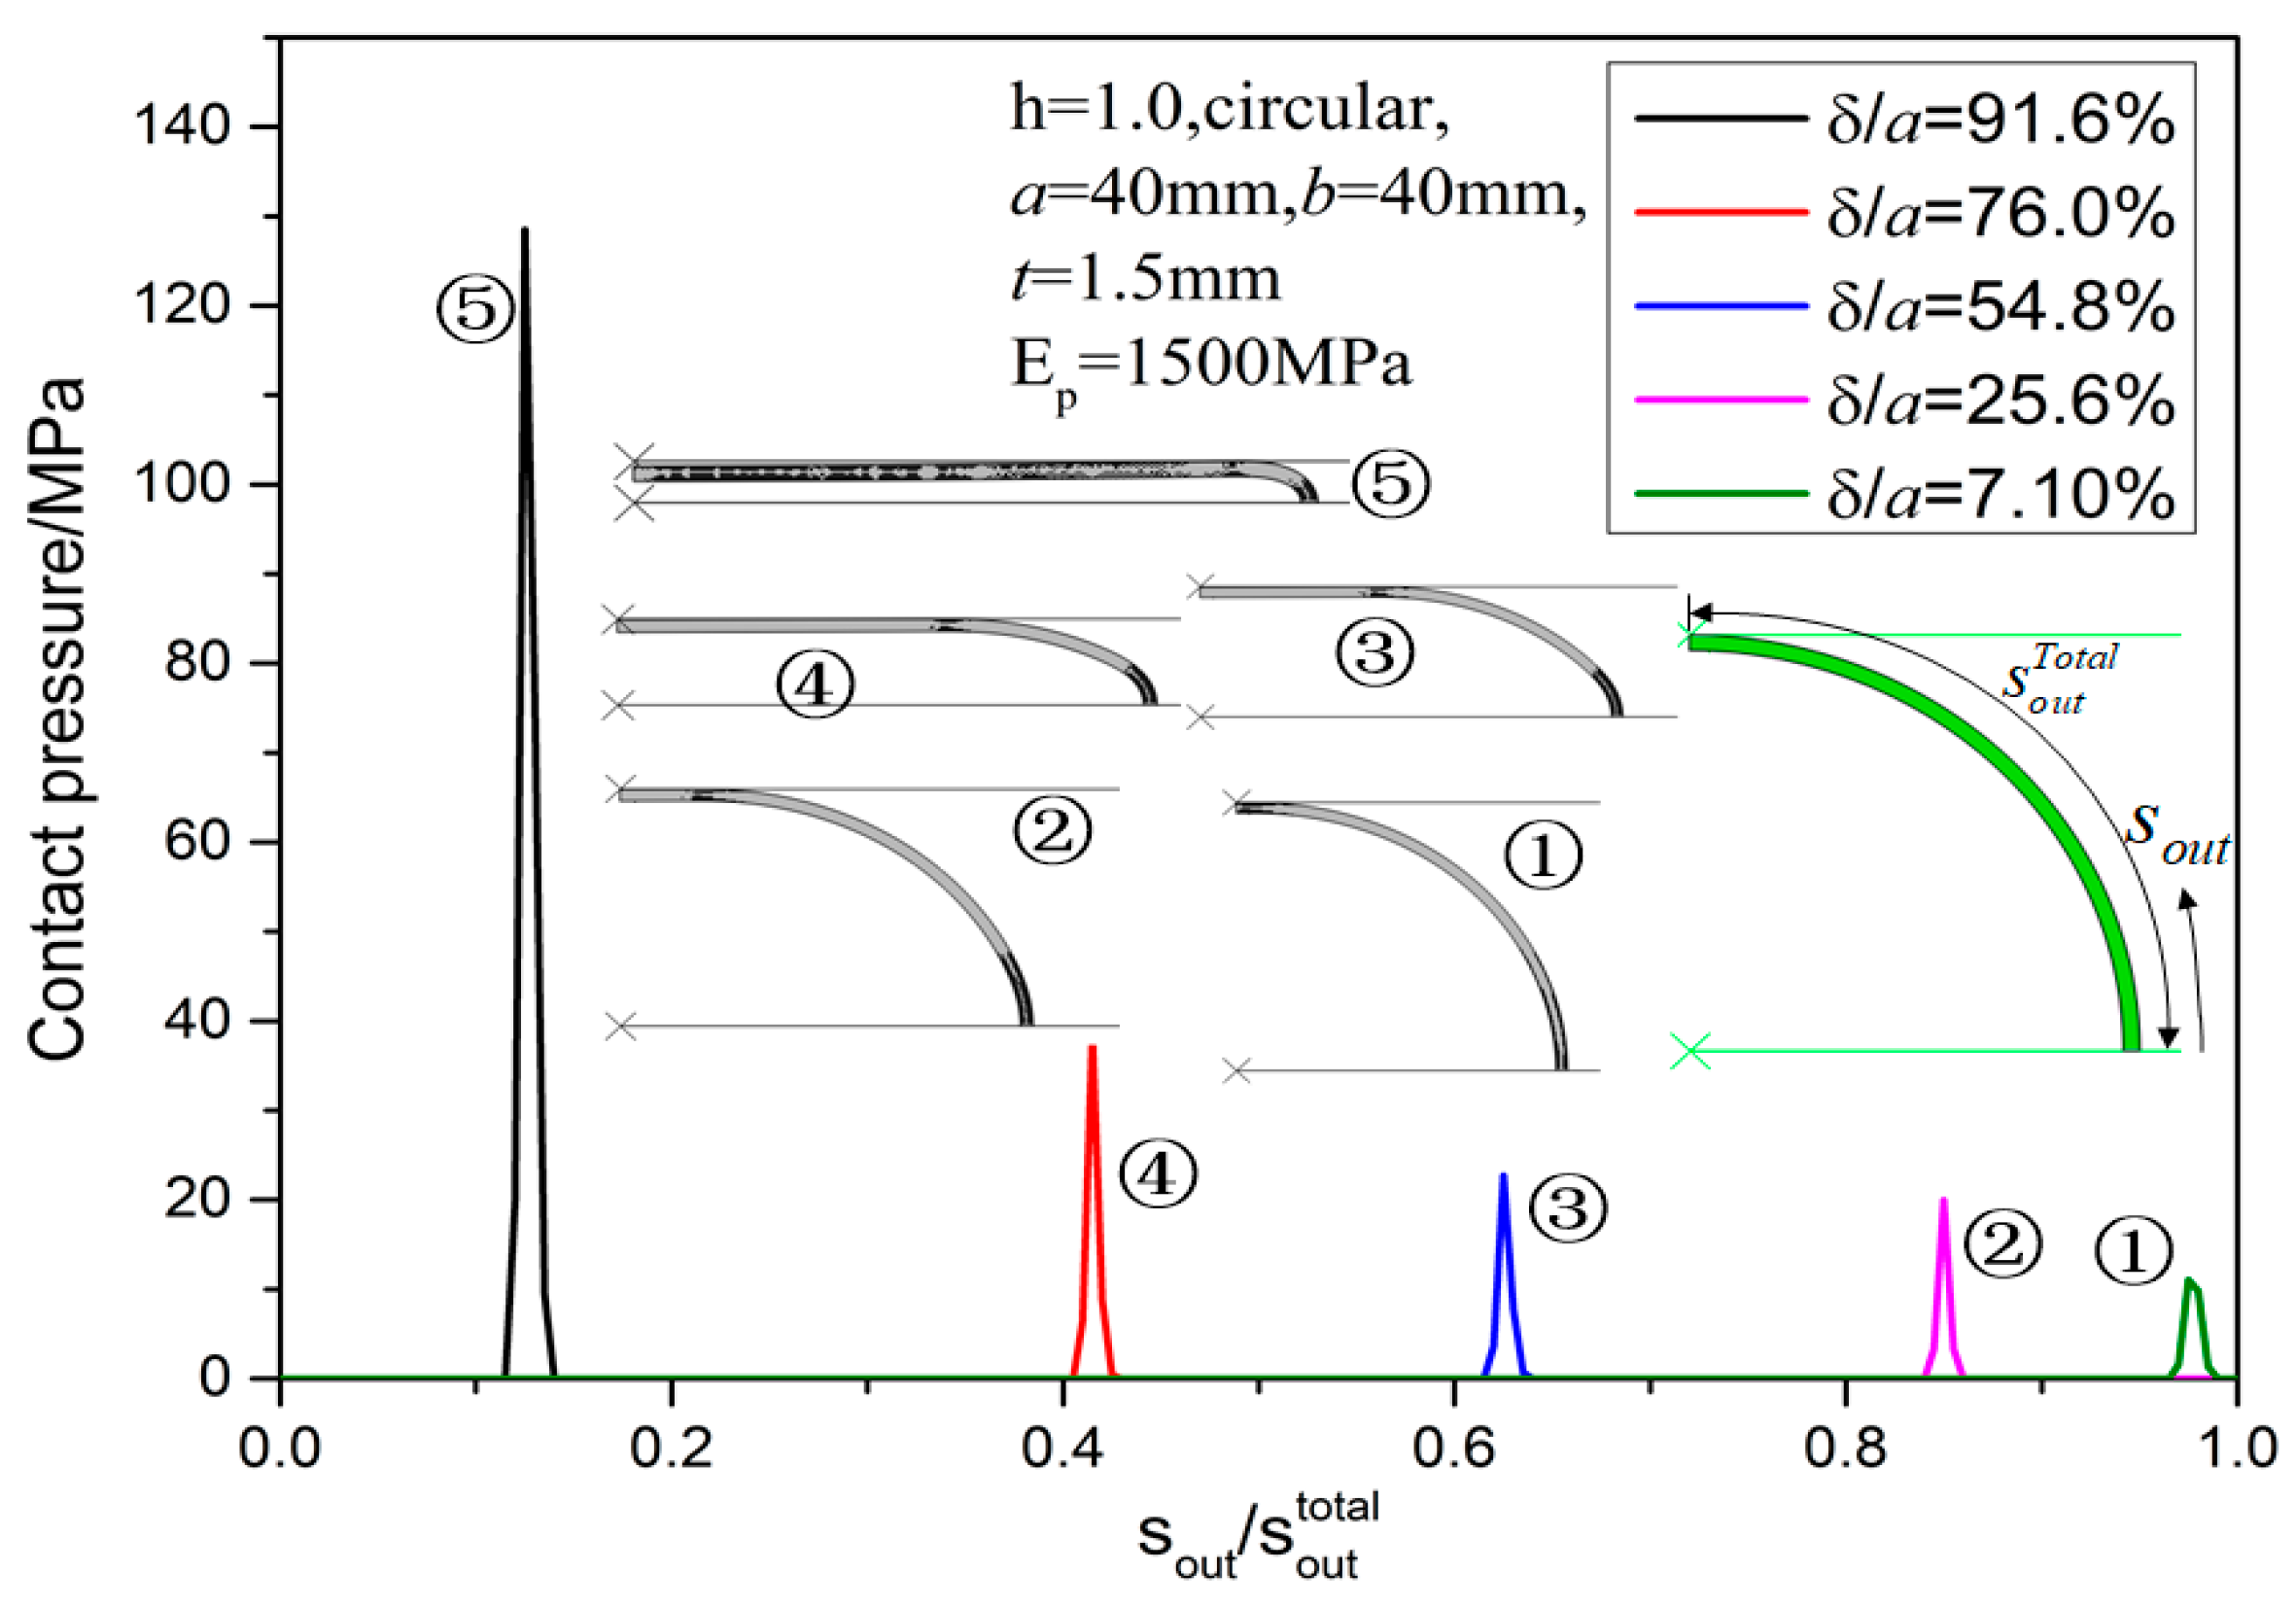
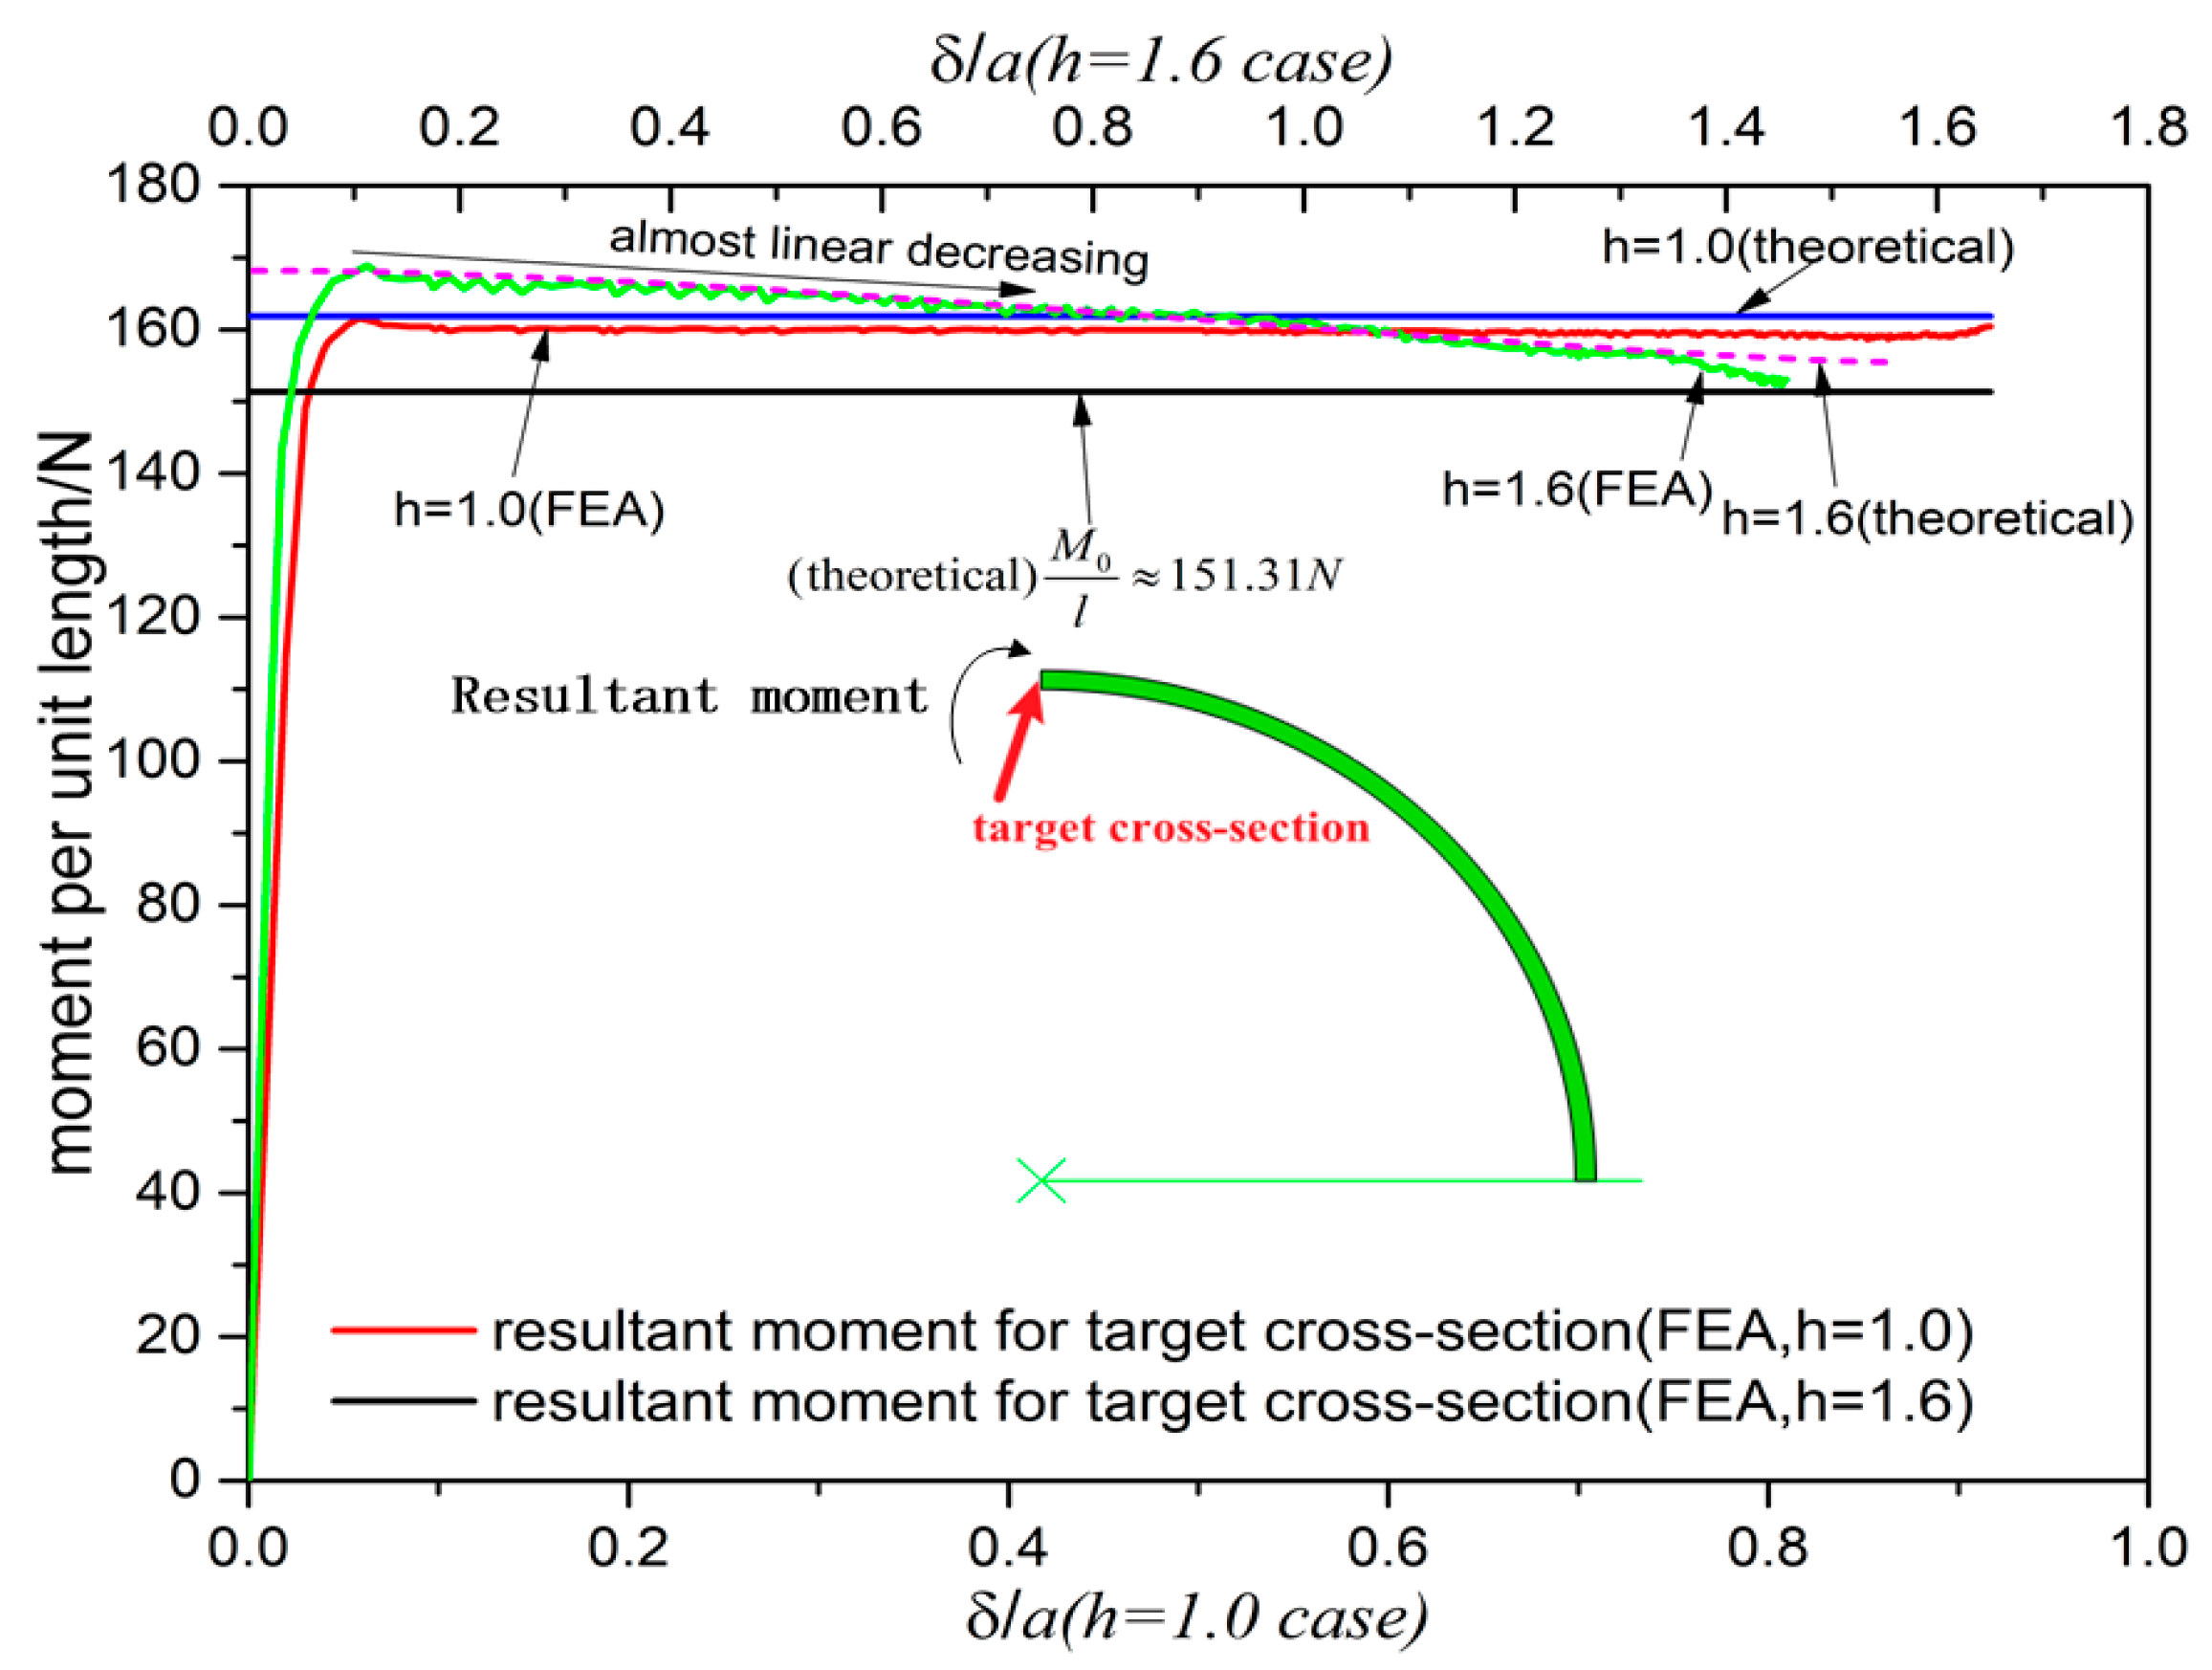
As previously stated in Section 6.4, significant size shrinkage is observed for the upper moving plastic region in elliptic rings. We present a theoretical interpretation of this fact by investigating the target cross-section’s resultant moment variations as crushing displacement increases. The reader may be curious about the fact that from all deformed configurations in FEA (e.g., see Figure 8, Figure 9, Figure 11 and Figure 12) and also experiments (see Figure 4), the upper regions are flattened into straight segments. However, in the theoretical model (see Figure 1), arc D B is assumed to be rigid and thus, arc D C remains curved (i.e., not flattened) and why does the theoretical model still work well? This question could possibly be answered by visualizing the contact pressure evolution pattern from FEA (see Figure 22). In Figure 22 (also subfigures) collecting all nodes of outer edge sequentially into a path with arc-length coordinate s o u t ( s o u t T o t a l is the total arc-length of outer edge), then the contact pressure field output “CPRESS” in ABAQUS [28] is extracted along this path for δ / a = 7.10 % ,   25.6 % ,   54.8 % ,   76.0 % ,   91.6 % . From Figure 22, although the upper plate seems to contact the ring at flattened segments, the contact pressure is only non-zero at moving narrow regions(after detailed checking, their length-to-thickness ratio are about 1). Thus, indeed there are no contacts at the large flattened straight segments in FEA except at the narrow contact region (of about-thickness length) at the right ends of the segments, which fact verifies the assumption of point contact at a single tangential point C in Figure 1 and the general validity of the theoretical model in Figure 1. By simple force and moment balance analysis and the no contact condition above, the flattened line segments have constant resultant moments for all cross-sections in the flattened segment, excluding the contact points. Thus, the resultant moments for all such cross-sections are equal to that of the target crown cross-section (see subfigure in Figure 23) and in ABAQUS [28] a “free cut” technique was used to obtain the resultant moment of the target crown cross-section for various crushing displacements. The resultant moment of target crown cross-section is visualized in Figure 23 for circular ( h = 1.0 , case 1 in Figure 18a) and elliptic ( h = 1.6 , case 4 in Figure 18d) cases, as follows:
(1) In circular case, the resultant moment (for unit axial length) increases to about 160 N steeply when δ / a < 0.1 and kept almost constant;
(2) In elliptic case, the resultant moment (for unit axial length) steeply increases to about 170 N and evidently linearly decreases to about 150 N at δ / a 0.8 .
Very interestingly the above resultant moment could be predicted almost exactly (see Figure 23 for direct comparisons) by theoretical formula of moment at contact point C (see Figure 1):
M / l = σ 0 t 2 / 4 + E p t 3 / 12 × Δ k
where Δ k = ( 1 + h 2 + ( 1 + h 2 ) cos 2 α ) 3 / 2 / ( 2 2 a h 2 ) (see Appendix A for derivation) and α is the rotation angle (see Figure 1) of the theoretical model.
Thus, the resultant moment at the left side of the narrow contact region (equal to the value of target crown cross-section) is larger than M 0 / l = 151.31   N . Since it remains elastic (no active yielding) at the right side of the narrow contact region, there is an abrupt moment drop around the narrow contact region from M / l to M 0 / l . Intuitively we postulate that the plastic region length should be larger when this drop is larger. This explains the significant shrinkage of moving plastic regions observed in Figure 21. This discussion extends the previous research for circular ring by Reid and Reddy [25] who dealt with the bottom region exclusively.
Figure 22. Contact pressure evolution.
Mathematics 13 02527 g022
Figure 23. Crown cross-section’s resultant moment evolution.
Mathematics 13 02527 g023

6.6. Plastic Energy Dissipation Patterns from FEA and Theoretical Models

From the previous discussions, circular and elliptic rings have upper (moving) and bottom (fixed) plastic regions.
Two rarely discussed but essential questions concerning the energy absorption properties (since the elliptic ring crushing is mainly used in energy absorption applications) include
(1) How much plastic energy is dissipated due to the moving plastic region and the bottom fixed plastic region, respectively?
(2) How much plastic energy is dissipated in the fully plastic region compared to the bottom plastic region?
The previous method in Section 6.1 robustly identified the fully plastic region by setting N t h r e s h o l d = 5 and similarly the bottom plastic region here is identified by following the same method but using N t h r e s h o l d = 1 (i.e., one circumferential layer is plastic if at least one element in thickness direction is actively yielding) and all actively yielding elements excluding those in bottom plastic region are called lying in the upper plastic region in FEA. To calculate the total plastic energy dissipated, use E L P D field output (see ABAQUS [28]) for extracting the total plastic energy dissipated. An incremental approach is adopted for FEA: after k-th increment (frame), identify the bottom plastic region (or fully plastic region) related elements by the just-described method and obtain the sum of E L P D of these elements, respectively, at k-increment (denoted as E L P D k ) and k − 1-th increment (denoted as E L P D k 1 ); then the difference E L P D k E L P D k 1 is the incremental plastic energy dissipated at k-th increment for bottom plastic region (or fully plastic region) and the summation over all previous increments yields the plastic dissipation at bottom region E b o t t o m p d (or at fully plastic region E F P p d ); also taking the history output ALLPD (total plastic dissipation of the whole FEM, see Abaqus manual [28], denoted as E t o t a l p d ), then subtraction yields the plastic dissipation at the upper region; the external work is obtained by integrating the crushing force-crushing displacement curves as W in FEA. The corresponding theoretical results are also presented for comparison, as follows:
(1) External work ( W ) is obtained by integrating the force-displacement curves by W = 0 δ P ( δ ) / ( 2 l ) d δ ;
(2) The plastic dissipated energies calculated by E u p p e r P D = M 0 / l α and E b o t t o m P D = W E u p p e r P D .
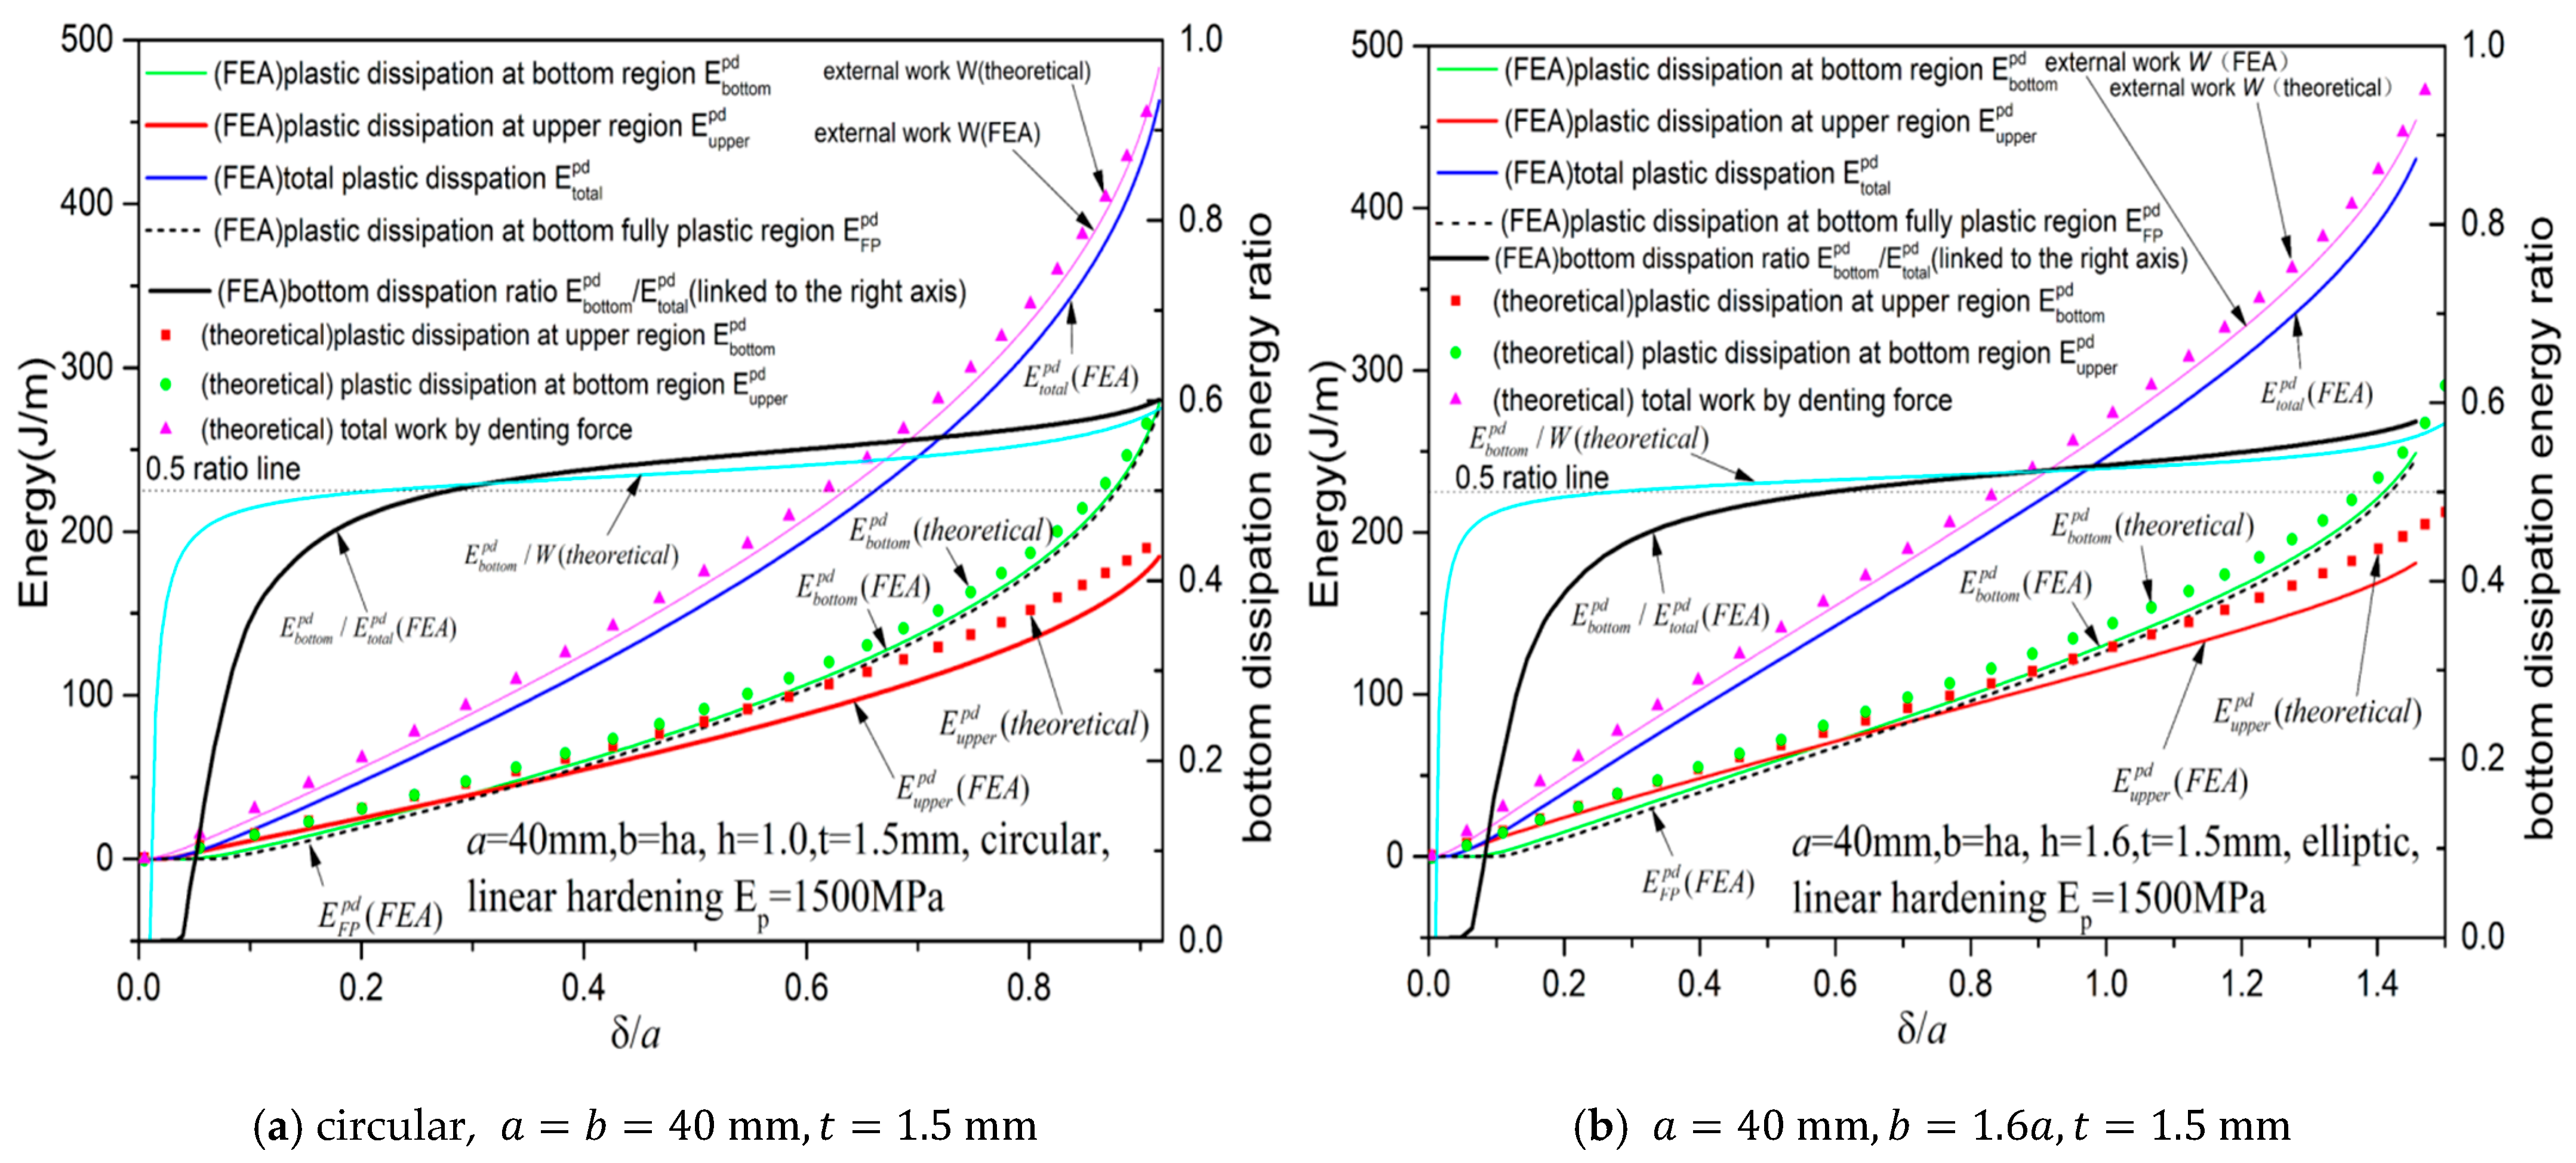
Figure 24 presents the related energies comparisons E u p p e r p d = E t o t a l p d E b o t t o m p d between FEA and theoretical results for non-linear hardening material for circular case (Figure 24a) and elliptic case (Figure 24b). Evidently, the theoretical results agree very well with FEA results.
Taking the circular case (Figure 24a) as an example, external works (of unit axial length) W ( F E A ) and W ( t h e o r e t i c a l ) increase from zero linearly and then after δ / a = 0.5 accelerated increase to around 140 J/m is observed. The total plastic energy E t o t a l p d W tightly meaning stored elastic energy, is very small when plastically dissipated energy is compared verifying the neglect of elastic deformation in the theoretical model (Section 2). The theoretical model predicts bottom plastic dissipation ( E b o t t o m p d ) and upper plastic dissipation ( E u p p e r p d ) agreeing well with the FEA results: both E b o t t o m p d and E u p p e r p d seemingly coincide initially and grow from zero to 20 J/m until δ / a 0.4 and when δ / a increases further, E b o t t o m p d > E u p p e r p d . However, indeed the FEA ratio E b o t o m p d / E t o t a l p d (linked to the right axis in Figure 24a) steeply increases to 0.5 when δ / a 0.3 and monotonically increases to about 0.58 when δ / a = 0.9 , indicating that the upper plastic dissipation only dominates when δ / a is small. A similar conclusion of the theoretical ratio E b o t t o m p d / W could be drawn, where it steeply increases to 0.5 when δ / a 0.17 and then monotonically increases. Interestingly from FEA results, E F P p d curve almost coincides with the E b o t t o m p d curve meaning that bottom region dissipation is exclusively due to fully plastic region verifying the theoretical model again since it uses fully plastic assumption (Section 2). The ratio (<0.6) shows that bottom region dissipation is at most 1.5 times the upper region dissipation. Similar observations are made for elliptic case (Figure 24b), the theoretical model slightly over-estimates the bottom region dissipation ( E b o t t o m p d ) and under-estimates the upper region dissipation ( E u p p e r p d ); the total works agree very well.
Figure 25 presents the corresponding results for the linear hardening material case for circular case (Figure 25a) and elliptic case ( h = 1.6 , Figure 25b). Interestingly, in this case, when non-linear hardening cases are compared (Figure 24), the difference between external work W (FEA) and total plastic dissipation E t o t a l p d (FEA) is larger, meaning stored elastic energy is larger. So although theoretical model slightly over-estimates the E b o t t o m p d and E u p p e r p d simultaneously, the W ( t h e o r e t i c a l ) still agrees well with W ( F E A ) tightly. Both ratios E b o t t o m p d / E t o t a l p d (FEA) and E b o t t o m p d / W (theoretical) are above 0.5 when δ / a > 0.3 , always monotonically increasing as δ / a increases and remains smaller than 0.6. The ratio (<0.6) shows that bottom region dissipation is at most 1.5 times the upper region dissipation as in the non-linear hardening case.

7. Analytical Solution When ϕ0″ Is Neglected in Linear Hardening Model

If the linear hardening material model is adopted and ϕ 0 term is neglected, Equation (5a) ϕ ϕ 0 = k 2 sin ϕ is reduced into a form readily solved analytically by elliptic integrals:
ϕ = k 2 sin ϕ
where k = P / ( 2 E p I ) . Thus, Equation (15) is only valid if ϕ 0 is negligible compared to ϕ . Equation (15) resembles the one-degree-of-freedom oscillation equation of conservative systems which is integrable by multiplying both sides by ϕ . It yields the following:
ϕ 2 / 2 = k 2 cos ϕ + D
where D is a constant from integration determined by
D = 1 2 ϕ 0 ( s 0 ) 2 k 2 cos ( α + arctan ( a / b × tan θ 0 ) )
where Equation (8b) is substituted for ϕ 0 ( s 0 ) .
Then Equation (16) is solvable by elliptic integrals by transforming into the following:
d s d ϕ = 1 2 ( k 2 cos ϕ + D )
Then s could be represented as a function of ϕ as follows:
s ( ϕ ) = 1 2 k 2 2 1 + H F ( ϕ 2 | 2 1 + H )
where F ( ϕ | m ) = [ 0 , ϕ ] ( 1 m sin 2 θ ) 1 / 2 d θ is the incomplete elliptic integral of the first kind and H = D/k2. Then, the following conditions should be imposed: (1) s ( α + arctan ( a / b tan θ 0 ) ) = s 0 , (2) s 0 = b E ( θ 0 | e 2 ) and (3) P / 2 L = 2 M 0 (condition (2) and (3) are identical to those in Section 2.1). Then, there are three conditions along with three unknowns s 0 , θ 0 , P for each specified angle α . Thus, the solution could be found by some routine zero root-finding technique. The denting displacement by Equation (11) is also expressible by elliptic integrals as follows:
[ 0 , s 0 ] cos ϕ ( s ) d s = [ 0 , ϕ ( s 0 ) ] cos ϕ 2 k 2 ( cos ϕ + H ) = 1 2 k 2 [ 0 , ϕ ( s 0 ) ] cos ϕ cos ϕ + H d ϕ = 2 | k | 1 1 + H ( ( 1 + H ) E ( ϕ ( s 0 ) 2 | 2 1 + H ) H × F ( ϕ ( s 0 ) 2 | 2 1 + H ) ) = 2 | k | 1 1 + H ( ( 1 + H ) E ( α + arctan ( a / b × tan θ 0 ) 2 | 2 1 + H ) H × F ( α + arctan ( a / b × tan θ 0 ) 2 | 2 1 + H ) )
In Equation (19), elliptic integrals of the first and second kind are evaluated to generate the denting displacement.

Comparisons Among FEA, Theoretical, and Analytical Solutions

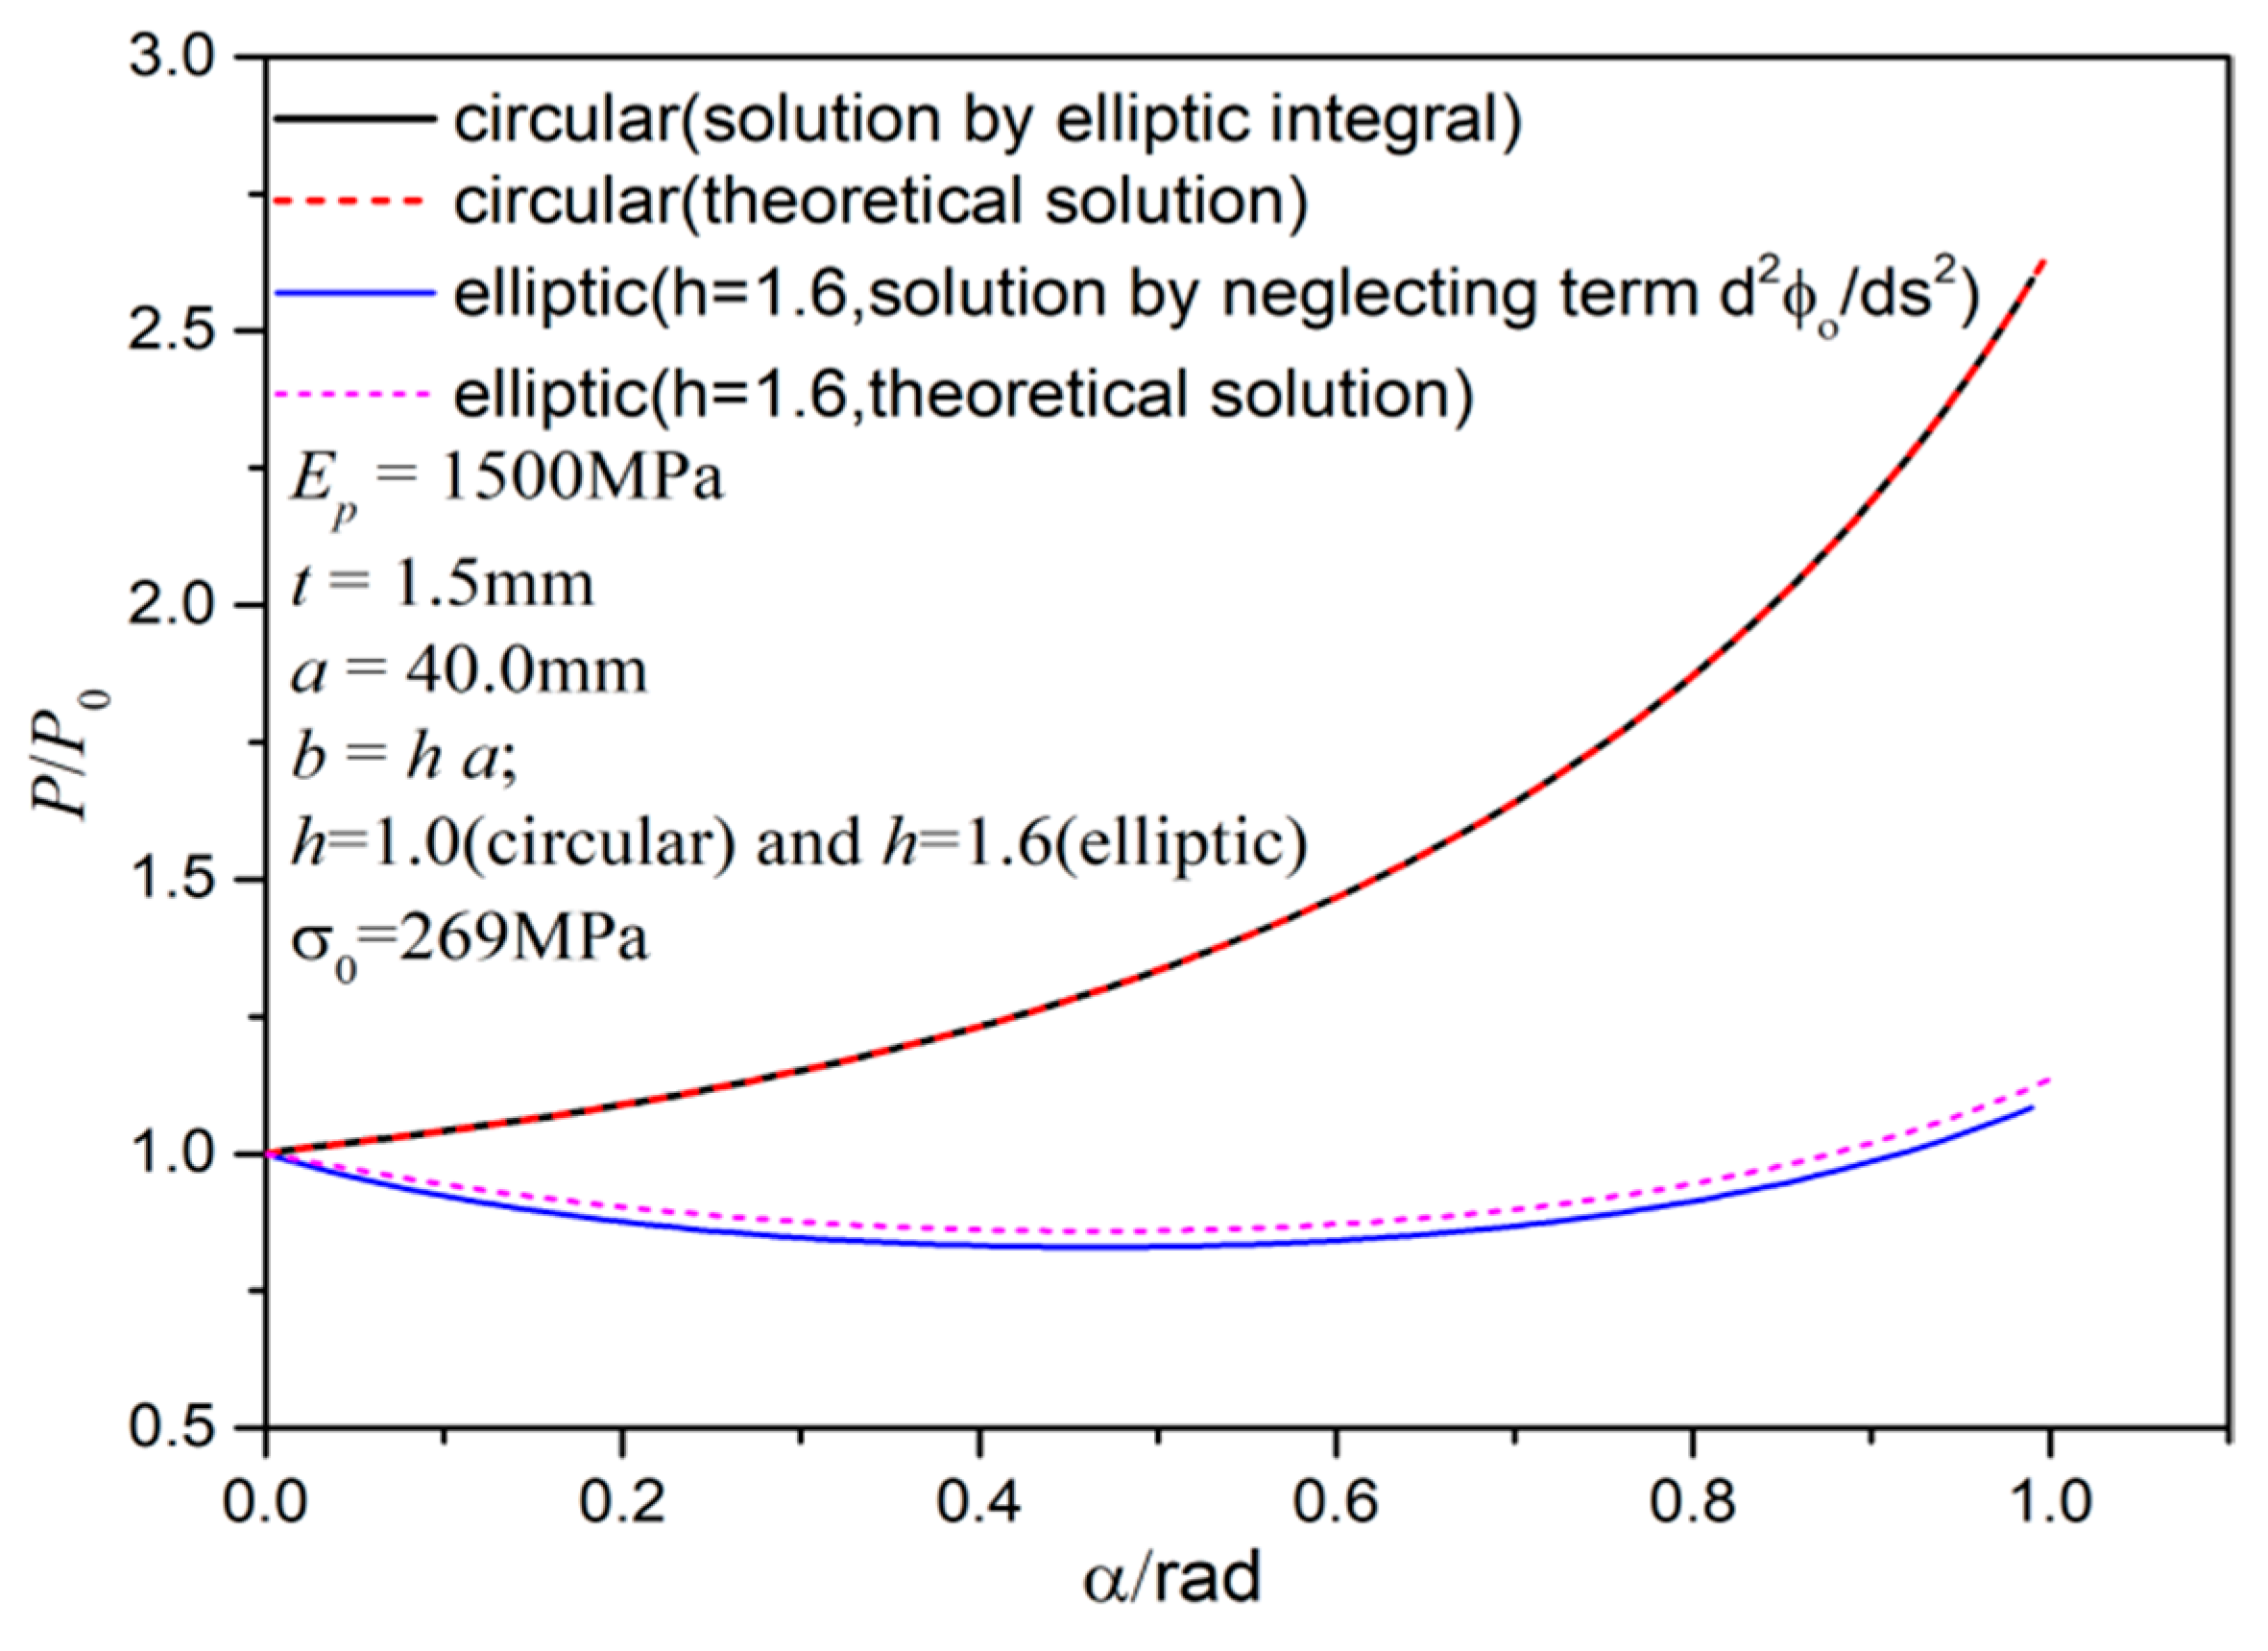
In Figure 10, the analytical solutions in Section 7 are verified by comparing with the theoretical solution using the method in Section 2 and the corresponding FEA results. The validity of the neglect of ϕ 0 was completely unjustified in the literature [26] and this paper fills this gap by comparing ϕ 0 and ϕ . This formulation takes plastic hinge length s0 as an unknown, while the work [26] artificially assigned this length proportional to the rotation angle α . From discussions in Section 6, this length is always first increasing and then decreasing. Thus, there is no any proportional relationship between s0 and α since α is monotonically increasing during deformation.
Figure 26 presents P/P0 variations for various   α in circular case (h = 1.0) and elliptic case (h = 1.6) by linear hardening parameters E p = 1500   M P a ,   σ 0 = 269   M P a ,   l = 5   m m ,   t = 1.5   m . In the circular case, the analytical solution by elliptic integral is identical to the theoretical solution in Section 2 since circular ring has ϕ 0 = 0 . Thus, they agree exactly in Figure 26. While in the elliptic case (h = 1.6) the elliptic integral solution, neglecting ϕ 0 slightly under-estimates P/P0 values. So, the neglect of ϕ 0 leads to only small errors.
Figure 27 presents a more direct justification by comparing ϕ and ϕ 0 . In Figure 27a, ϕ 0 increases from zero to the maximum value and then decreases to zero when s increases. The maximum value of ϕ 0 is about 900 rad/m2. Considering the smallness of s0 (typically ≈ 0.01 m in Figure 27b,c), ϕ 0 for s [ 0 , s 0 ] is in the order of 100 rad/m2 which is very small compared to ϕ in Figure 27b,c, where typically the magnitudes are in the order of 10,000 rad/m2. Thus, the neglect of ϕ 0 should yield an error in the order of 1%, which in fact is consistent with observations in Figure 26.

8. Parametric Analysis

We present a parametric analysis of the hardening parameters on the plastic region length and the force-displacement curves. Figure 28a,b shows the effect of Ep on crushing forces by the theoretical linear hardening model (by the method described in Section 2) for the circular case and elliptic case, respectively. In both cases, the increase in Ep leads to an increase in force magnitude. In Figure 28a, the increase in force magnitude is faster at larger Ep. Interestingly, in the elliptic case (Figure 28b), the force is decreasing in the early phase for smaller Ep (the softening behavior), while for larger Ep, the force is monotonically increasing.
With the same parameters as in Figure 28 and Figure 29a,b present the corresponding theoretical plastic region lengths by linear hardening model (by methods in Section 6) for various Ep for the elliptic ring (h = 1.6) and circular ring, respectively. The s0 is the length from conventional M0 criterion and sm is the length from the proposed modified criterion. Evidently, for both cases, sm is identical to s0 before the maximum point, and afterwards sm decreases almost linearly much faster than the decrease of s0. Only when δ / a is large, sm decreases in an accelerated manner. The larger Ep leads to larger s0 and sm evidently. Comparison between Figure 29a,b indicates that the plastic region length is larger for elliptic rings and smaller for circular rings.
Figure 30a (elliptic) and Figure 30b (circular) show the theoretical plastic region lengths for the power-law material model for various coefficients C, where C = rCref, Cref = 364 MPa (the same as in experimental measurement in Figure 5a) in four cases r = 0.5, 1.0, 1.5, and 2.5. All curves share similar trends, including the lengths, which are initially increasing and then decreasing with sm curves deviating from s0 curves at maximum points. By comparing Figure 30 with Figure 29 (linear hardening case), the lengths reach a maximum at smaller δ / a and also the initial increase is steeper, while the decrease is flatter. Figure 31 shows the effect of material parameter C on force-displacement curves for the elliptic ring of h = 1.4 (by the theoretical method in Section 2). Similarly, as in Figure 28, a larger C leads to a larger force magnitude. The monotonicity could be altered too, where for smaller C at r = 0.5 the force is initially decreasing (softening); however, for larger C at r = 2.5 the force is monotonically increasing without softening behavior. This discussion confirms the important role of material hardening on both crushing force and the plastic region evolution.
9. Conclusions

This paper presents a combined theoretical, numerical and experimental investigation of the crushing behavior of elliptic rings between two parallel plates. A theoretical formulation by the rigid plastic model is presented, allowing general power-law material hardening, which includes the linear hardening as a special case. This formulation extends the formulations by Reid and Reddy [25] and Liu et al. [26] for the linear hardening model to the general power-law hardening model. An insightful investigation on the evolution of the plastic region was carried out by the active yielding region in FEM by ABAQUS, which not only confirms the existence of two separate plastic regions but also allows the direct comparison of plastic region length with theoretical predictions. Then, the unexpected over-estimation of plastic region length by the conventional M0 criterion is identified, and a modified criterion is established to greatly improve the length estimation accuracy. Finally, we presented a parametric study by theoretical model and briefly discussed the analytical solution of the problem in the special linear hardening case and its errors by elliptic integrals. Also, analytical solutions for general non-linear hardening material are presented by adopting a constant initial curvature assumption at the bottom plastic region without solving differential equations. The main conclusions are listed as follows:
(1)
The theoretical, numerical, and experimental results agree well (see Figure 6 and Figure 7) concerning force-displacement curves. All results exhibit the softening behaviors when ovality (i.e., h) is significant. When h is larger, the force is either almost constant or slowly varying for a large range of displacements. In the final deformation phase, the force increases dramatically for all cases.
(2)
The active yielding region visualization could illustrate clearly the evolution of plastic regions. There is a horizontally moving top plastic hinge of small size, resulting in a continuously enlarging flat portion. Moreover, there is a fixed plastic region of larger size at the bottom whose size varies significantly during deformation and continuously shrinks to a small size when the crushing displacement is large.
(3)
The length of the bottom fully plastic region in FEA could be robustly automatically extracted by the proposed method, allowing a direct quantitative comparison between the theoretical predictions and FEA results. The length (i.e., s0) predicted by the conventional M0 criterion is smoothly varying and is slowly decreasing after the maximum value. However, this significantly over-estimates the length from FEA. The proposed modified criterion based on the highest moment during loading history is proposed to account for unloading. This modified criterion leads to a faster and almost linear decrease in the plastic region length after the maximum point is passed, and it agrees well with FEA results (see Figure 16 and Figure 18).
(4)
An analytical solution by using elliptic integrals is formulated by neglecting some terms in the linear hardening case. Some comparisons of ϕ 0 and ϕ show that the error in neglect of ϕ 0 is in the order of 1% (see Figure 27).
(5)
The crown cross-section’s resultant moment(FEA) is accurately predicted by theoretical calculation, and this moment (higher than M0) is almost constant for circular rings and significantly decreases for elliptic rings, offering a possible interpretation of top plastic region shrinkage for elliptic rings (see Figure 23).
(6)
An automatic identification method of the bottom and upper plastic regions in FEA is proposed. The theoretical model could predict the plastic energy dissipation distribution very accurately when FEA results are compared. For δ / a > 0.3 , the bottom region dissipates more energy than the upper region. Furthermore, the bottom plastic dissipation is exclusively due to the fully plastic region in FEA, which fact justifies the theoretical model based on the fully plastic assumption.
(7)
From parametric studies in the linear hardening case, theoretically, the increase in plastic modulus Ep leads to higher crushing forces and longer plastic regions. Similarly, in the power-law hardening case, theoretically, the increase in parameter C leads to higher crushing forces and longer plastic regions. Furthermore, the monotonicity of force-displacement curves could be altered, and the softening behaviors of elliptic rings could disappear when hardening parameters are large enough.
(8)
Analytical solutions without solving differential equations for the general non-linear hardening exponent n by adopting a constant-curvature assumption at the bottom plastic regions agree well with the full theoretical solutions. For the special case of the hardening exponent n = 1 / 2 , the analytical solutions by radicals could be formulated accurately.
This paper serves to enhance the understanding of energy absorption and plastic dissipation patterns of circular and non-circular metal rings under lateral crushing.
Limitations: This paper is only applicable to thin-walled rings. For thick-walled rings, generally, the interactions between cross-section resultant moment and resultant membrane force should be accounted for [29], and the material hardening and these interactions further complicates theoretical formulations. We leave the thick-walled case and its tests to future research. This paper is only about crushing of initially stress-free rings and CNC milling was used to manufacture the test specimens to ensure geometric accuracy; if the rings are manufactured by cold-forming processes (difficult to ensure the elliptic rings’ geometric accuracy), initially before crushing, there are residual stresses (see, e.g., [17,19] for the related experimental studies and FEA); to our best knowledge, there are no theoretical/analytical studies about this case and thus we leave it for future research.

Author Contributions

Conceptualization, S.Y.; Methodology, S.Y.; Formal analysis, S.Y.; Investigation, S.Y.; Resources, C.G.; Data curation, S.Y., S.G., P.T. and W.Z.; Writing—original draft, S.Y.; Visualization, S.Y.; Validation, S.Y.; Funding acquisition, S.Y.; Writing-review and editing, S.Y.; Writing-manuscript revision, S.Y. All authors have read and agreed to the published version of the manuscript.

Funding

This research was funded by Pioneer and Leading Goose R&D Program of Zhejiang (No. 2023C03187) and the Key Technology Project of Zhejiang Provincial Administration for Market Regulation (No. ZD2025011) and Zhejiang Provincial Natural Science Foundation of China under Grant (No. LQN25A040022, No. LQ21E050001).

Data Availability Statement

The original contributions presented in this study are included in the article. Further inquiries can be directed to the corresponding author.

Conflicts of Interest

The authors declare no conflict of interest.

Nomenclature

ahorizontal semi-axis length
bvertical semi-axis length
hRatio h = b/a
θangular coordinate (see Figure 1a)
sarc-length coordinate (see Figure 1a) and correlated with θ by s = b E ( θ | e 2 )
Eincomplete elliptic integral of second kind defined by E ( ϕ | m ) = [ 0 , ϕ ] ( 1 m sin 2 θ ) 1 / 2 d θ
Fincomplete elliptic integral of first kind defined by F ( ϕ | m ) = 0 ϕ ( 1 m sin 2 θ ) 1 / 2 d θ .
eeccentricity of ellipse e = 1 a 2 / b 2
M0cross-sectional fully plastic moment M 0 = σ 0 t 2 l / 4
M cross-sectional resultant moment per length equal to M / l
Nthresholdlower bounding integer (=5 throughout except in Section 6.1 and Appendix E) for FEA plastic region extraction
σ0yielding stress of material
tthe thickness of the ring
lthe width of the ring
s0arc-length of lower fixed plastic hinge region (see Figure 1b)
θ0the angular coordinate corresponding to s0 by s 0 = b E ( θ 0 | e 2 )
Pmagnitude of vertical crushing force
P0 P 0 = σ 0 t 2 l / a used to normalize P
ϕthe outer normal vector’s angle about X-axis during deformation (see Figure 1d)
ϕ0the outer normal vector’s angle about X-axis before deformation (see Figure 1a)
differentiation with respect to arc-length coordinate, = d / d s
δcrushing displacements (see Figure 1b)
αrotated angle of rigid part in theoretical model (see Figure 1b)
Lhorizontal distance between upper tangent point and end point of plastic hinge region (see Figure 1b,c)
zthickness-directional coordinate (zero at middle thickness points)
Δkcurvature change at points of middle axis of the ring
εpcircumferential plastic strain
n, chardening factor C and exponent n in Ludwik’s material model by σ ( ε p ) = σ 0 + C ε p n
Eplinear plastic hardening modulus, E p = C ( n = 1 )
I I = t 3 l / 12 is moment of inertia of cross-sections
K n < 1 and K = E p I if n = 1

Appendix A. Derivation of L and δ in Equations (10) and (11)

By geometric analysis [26], since arc B D is assumed rigid, B D is still of elliptic shape but after some rotation and translations. After rotation by angle α, the deformed point (x, y) is related to the undeformed point ( x cos α + y sin α , x sin α + y cos α ) satisfying the standard elliptic equation after superimposition of some translation not affecting the relative distance:   ( x cos α + y sin α ) 2 / a 2 + ( x sin α + y cos α ) 2 / b 2 = 1 .
Then, since it is quadratic in y, a closed-form solution is attainable as follows:
y ( x ) = h a 2 ( h 2 ( sin α ) 2 + ( cos α ) 2 ) x 2 / ( h 2 ( sin α ) 2 + ( cos α ) 2 ) + ( 1 h 2 ) x sin α cos α / ( h 2 ( sin α ) 2 + ( cos α ) 2 )
Taking dy/dx = 0, it yields the following:
x c r = a ( 1 h 2 ) sin α cos α ( h 2 ( sin α ) 2 + ( cos α ) 2 ) / ( ( 1 h 2 ) 2 ( sin α ) 2 ( cos α ) 2 + h 2 )
The original point (0, b) after rotation by angle α becomes ( b sin α , b cos α ) and thus the horizontal distance between point C and D in Figure 1b is x cr + b sin α . In order to get L, we only need to obtain the horizontal distance of points B and D. In the undeformed configuration in Figure 1a, point D has coordinate (0, b) and point B has coordinate ( a cos θ 0 , b sin θ 0 ) . The vector DB = ( a cos θ 0 , b sin θ 0 ) b ) . After rotation by angle α , the vector becomes ( a cos θ 0 cos α ( b sin θ 0 b ) sin α , a cos θ 0 sin α ( b sin θ 0 b ) cos α . Thus, horizontal distance of BD after deformation is a cos θ 0 cos α ( b sin θ 0 b ) sin α yielding the expression of L in Equation (10):
L = a cos θ 0 cos α b sin θ 0 sin α x c r
In order to get δ , we need the vertical distance of points C and D which is just y ( x cr ) b cos α where y(x) is from Equation (A1). Thus, in summary,
δ = b ( y ( x c r ) b cos α ) + ( a cos θ 0 sin α + ( b sin θ 0 b ) cos α ) [ 0 , s 0 ] cos ϕ d s
Explicitly the expression of Equation (A3) gives Equations (11) and (12).
The curvature at the contact x cr for rotation angle α is obtained by the following formula:
d 2 y / d x 2 ( 1 + ( d y / d x ) 2 ) 3 / 2 = ( 1 + h 2 + ( 1 + h 2 ) cos 2 α ) 3 / 2 2 2 a h 2

Appendix B. Initial Elastic Phase Analysis

Timoshenko and Gere [30] presented initial elastic deformation results for circular ring (e = 0) under a set of two opposite point loads by Castigliano’s theorem. We need to consider e 0 case for elliptic rings in this paper. Figure A1 shows the 1/4 elliptic ring and boundary conditions. At crown point there is vertical force P ¯ = P / 2 and unknown moment M ¯ . The cross-section’s resultant moment is equal to M ( θ ) = P ¯ a cos θ + M ¯ . The total elastic strain energy is E ¯ = b / ( 2 EI ) [ 0 , π / 2 ] ( M ¯ + P ¯ a cos θ ) 2 1 e 2 sin 2 θ d θ where E is elastic modulus. The well-known Castigliano’s theorem implies E ¯ / M ¯ = 0 since there is no rotation at the crown point, leading to M ¯ = P ¯ a [ 0 , π / 2 ] cos θ 1 e 2 sin 2 θ d θ / [ 0 , π / 2 ] 1 e 2 sin 2 θ d θ and δ = E ¯ / P ¯ gives the crushing displacement. Finally, after some simplification, it yields the following:
δ P = b a 2 2 E I [ 0 , π / 2 ] cos 2 θ 1 e 2 sin 2 θ d θ [ 0 , π / 2 ] cos θ 1 e 2 sin 2 θ d θ 2 [ 0 , π / 2 ] 1 e 2 sin 2 θ d θ
The result has been verified in Figure 10. Interestingly, to show why the fully plastic region first appears at the crown point in Figure 8, Figure 9, Figure 11 and Figure 12, the moment distribution is plot for various θ by
M ~ ( θ ) = M ( θ ) / ( a P ¯ ) = cos θ [ 0 , π / 2 ] cos θ 1 e 2 sin 2 θ d θ / [ 0 , π / 2 ] 1 e 2 sin 2 θ d θ
In Figure A2, distribution M ~ ( θ ) is plotted and evidently M ~ ( 0 ) , M ~ ( π / 2 ) have opposite signs and | M ~ ( 0 ) | < | M ~ ( π / 2 ) | and thus, the plastic hinge should first appear at θ = π / 2 (i.e., the crown points).
Figure A1. Schematic of the 1/4 elliptic ring.
Mathematics 13 02527 g0a1
Figure A2. The distribution.
Mathematics 13 02527 g0a2

Appendix C. Analytical Solution Method for Hardening Exponent n ≠ 1

In Section 7, we presented the analytical solution for the special linear hardening case, i.e., n = 1 by dropping the term ϕ 0 by using elliptic integrals of the first and the second kind only. However, generally for non-linear hardening case ( n 1 ), this formulation by elliptic integrals is not possible. In order to make an analytical solution possible in a general case, we proposed a mild assumption of constant curvature in the plastic region (i.e., assuming ϕ 0 ( s ) a / b 2 for s [ 0 , s 0 ] ) to formulate an “unexpected and interesting” analytical solution method for general n here. We outline the method here. The general governing Equation (5a) for n 1 is rephrased as follows:
K ¯ d ( ϕ ϕ 0 ) n / d s = P / 2 × sin ϕ
where K ¯ = K / n and K = 2 1 n C t 2 + n nl / ( 2 + n ) .
Then we multiply both sides of Equation (A7) by ϕ as follows:
K ¯ d ( ϕ ϕ 0 ) n d s ϕ = P / 2 × sin ϕ × ϕ
and the left hand side of Equation (A8) yields the following:
K ¯ d ( ϕ ϕ 0 ) n d s ϕ = K ¯ n n + 1 d ( ϕ ϕ 0 ) n + 1 d s + K ¯ ϕ 0 d ( ϕ ϕ 0 ) n d s
Then integrate both sides of Equation (A8) as follows:
[ 0 , s ] K ¯ d ( ϕ ϕ 0 ) n ϕ d s d s = K ¯ n n + 1 ( ϕ a b 2 ) n + 1 + K ¯ a b 2 ( ϕ a b 2 ) n = P cos ϕ / 2 + D
where assumption ϕ 0 a / b 2 has been used and D is a constant from integration. By continuity at s = s 0
D = K ¯ n n + 1 ( ϕ ( θ 0 ) a / b 2 ) n + 1 + K ¯ a / b 2 × ( ϕ ( θ 0 ) a / b 2 ) n P / 2 × cos ( ϕ ( θ 0 ) )
where ϕ ( θ 0 ) = ab / [ a 2 sin 2 θ 0 + b 2 cos 2 θ 0 ] 3 and ϕ ( θ 0 ) = α + arctan ( a / b θ tan θ 0 ) .
Thus, Equation (A9) is an algebraic equation of ϕ a / b 2 for each ϕ and thus, denote x ( ϕ ) as the root of the corresponding equation:
K ¯ n / ( n + 1 ) × x n + 1 + K ¯ a / b 2 × x n P / 2 × cos ϕ D = 0
Then, by d ϕ / ds = a / b 2 + x ( ϕ ) , it yields ds = d ϕ / ( a / b 2 + x ( ϕ ) ) and integration yields the following:
s 0 = 0 α + arctan ( a / b × tan θ 0 ) 1 / ( a / b 2 + x ( ϕ ) ) d ϕ
Equations (A11) and (A12), along with two other equations s 0 = bE ( θ 0 | e 2 ) and PL = 4 M 0 , form a complete set of equations to be analytically solved for the three unknowns P ,   s 0 ,   θ 0 by conventional FindRoot function in Mathematica software 9.0 without necessity to solve differential equations (see shooting methods in Section 2.2, where ordinary differential systems are solved numerically as a comparison). Thus, the analytical solution here is much more efficient than the shooting methods (Section 2.2). Finally, use the integral [ 0 , s 0 ] cos ϕ ( s ) ds = [ 0 , ϕ ( θ 0 ) ] cos ϕ / ( a / b 2 + x ( ϕ ) ) d ϕ and Equation (11) to obtain the denting displacements.
A possible explanation of the validity of the assumption ϕ 0 ( s ) a / b 2 is given below: as shown in Figure 8, Figure 9, Figure 11 and Figure 12, the bottom plastic region’s length is generally much smaller than the 1/4 perimeter of an elliptic ring and a / b 2 is just the initial curvature at the bottom point of the 1/4 ring; thus, the initial undeformed curvature ϕ 0 should not vary significantly at the small plastic region.
In order to validate this analytical solution, in Figure A3, we compare the full theoretical solution by method in Section 2.2 and the analytical solution here in terms of crushing displacement δ / a versus crushing force P / P 0 where P 0 = σ 0 t 2 l / a for non-linear power-law hardening models. Evidently although that analytical solution is very time-efficient (no solution of differential equations is needed), it agrees very well with the full theoretical solution. This comparison shows that the assumption of ϕ 0 ( s ) a / b 2 in the bottom plastic region is plausible.
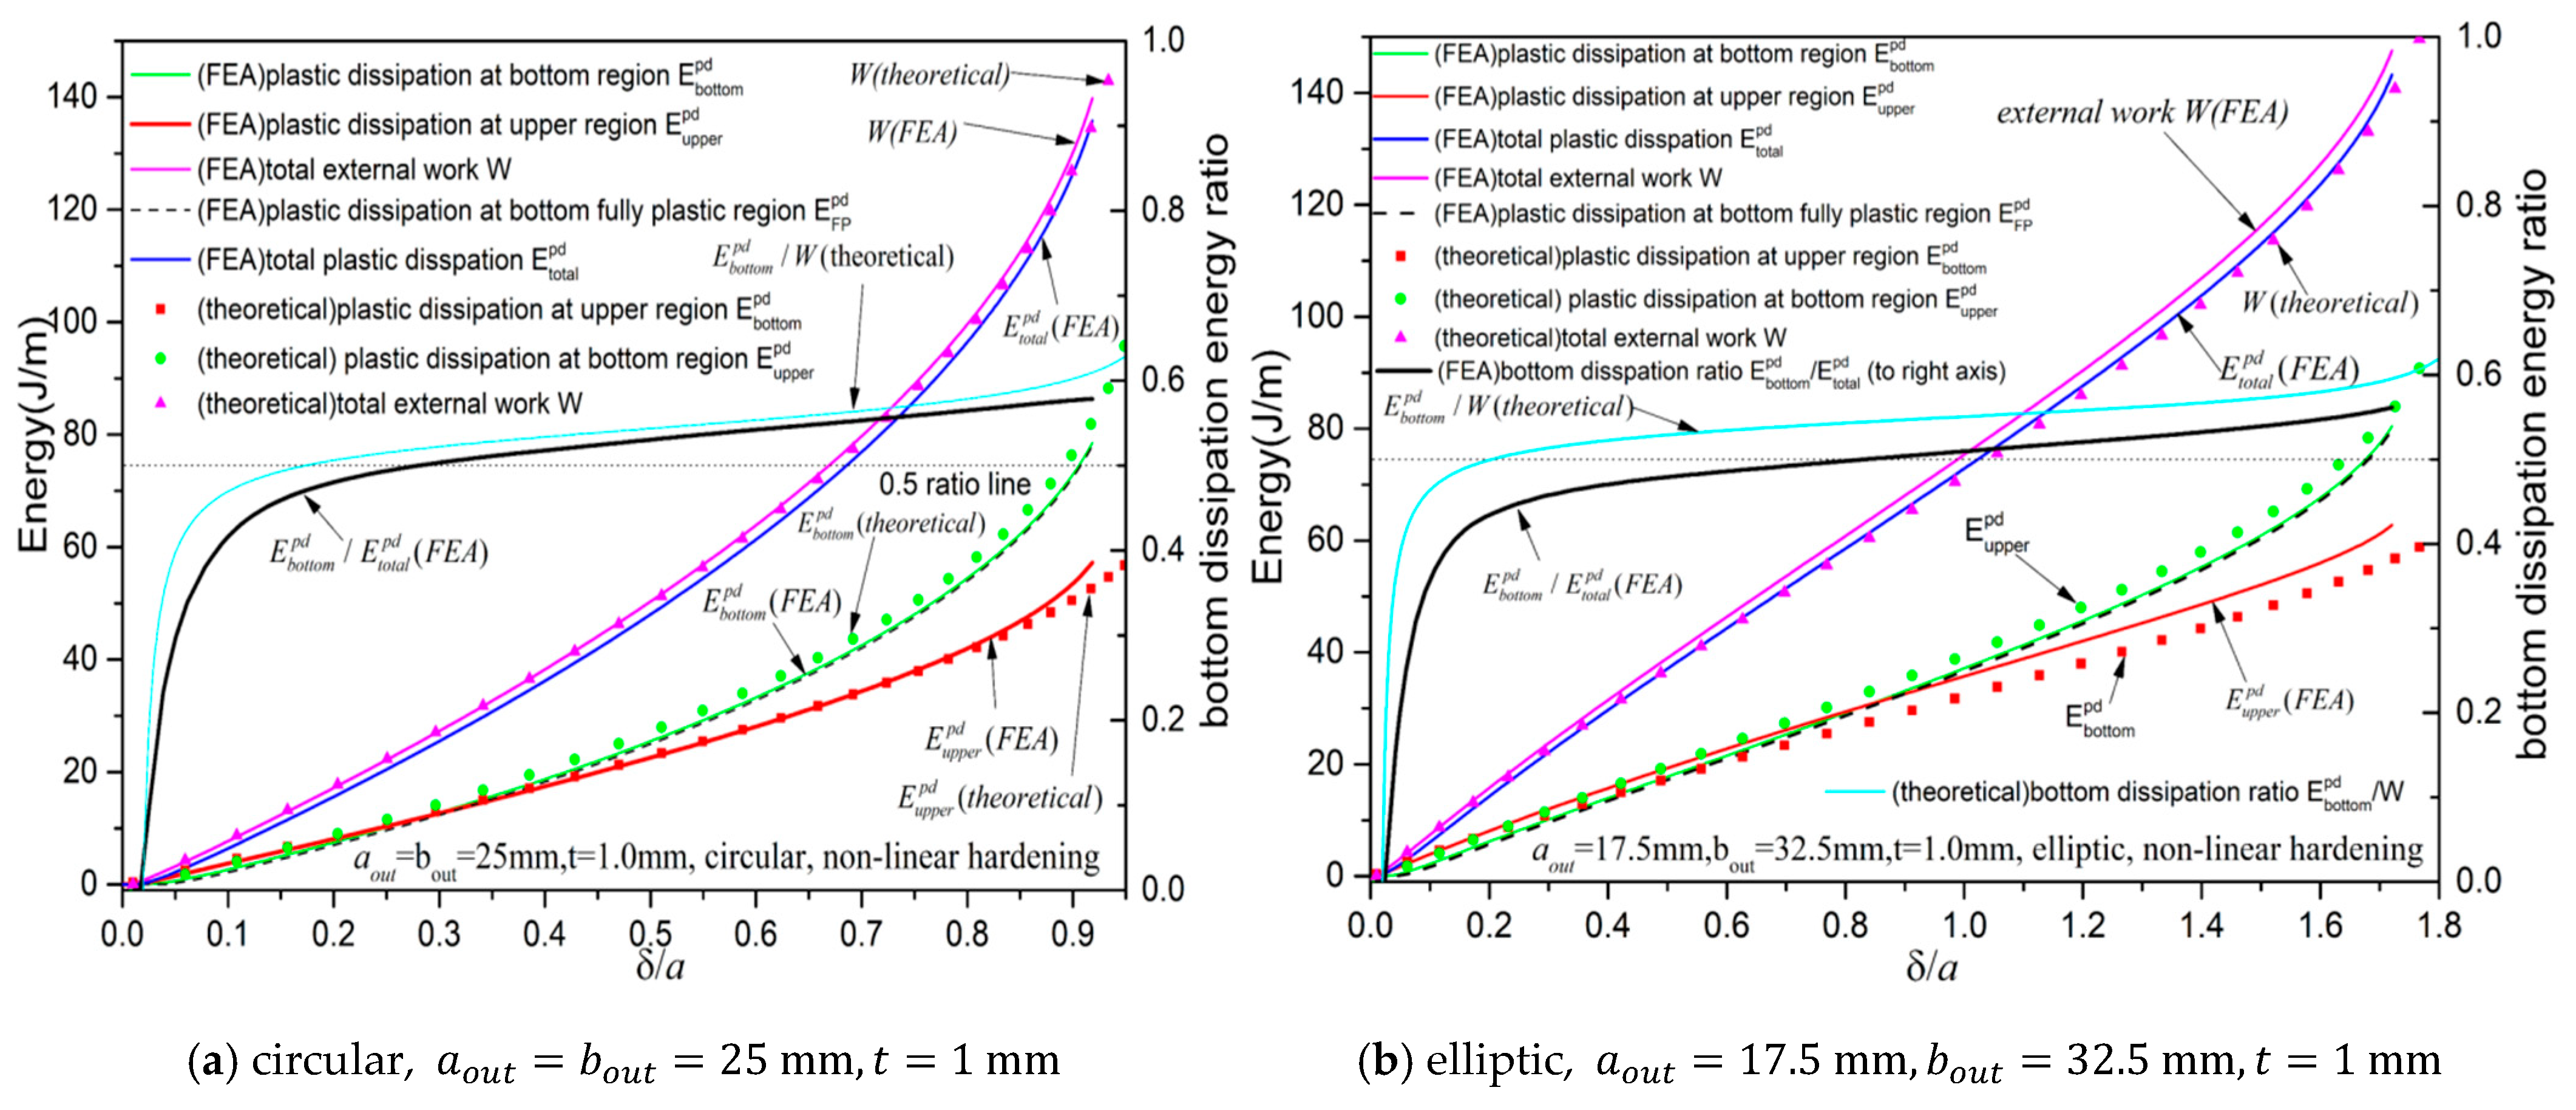
Figure A3. Comparison between analytical solutions (Appendix C) and theoretical solutions (Section 2.2).
Mathematics 13 02527 g0a3

Appendix D. Analytical Solution by Radicals for the Special Case n = 1/2

In Section 7 and Appendix C, analytical solutions are formulated for n = 1 (by elliptical integrals) and n 1 (solving implicit Equation (A11)). Interestingly when n = 1 / 2 , Equation (A11) becomes a cubic polynomial of y = x as follows:
y 3 + 3 a / b 2 × y = 3 P cos ϕ / ( 2 K ¯ ) + 3 D / K ¯
Introducing A = 3 a / b 2 and B = 3 P cos ϕ / ( 2 K ¯ ) + 3 D / K ¯ , the cubic polynomial over y can be solved exactly by radicals as follows:
r 1 = 2 3 1 / 3 A ( 9 B + 3 4 A 3 + 27 B 2 ) 1 / 3 + ( 9 B + 3 4 A 3 + 27 B 2 ) 1 / 3 2 1 / 3 × 3 2 / 3
r 2 = ( 1 + i 3 ) A 2 2 / 3 × 3 1 / 3 ( 9 B + 3 4 A 3 + 27 B 2 ) 1 / 3 ( 1 i 3 ) ( 9 B + 3 4 A 3 + 27 B 2 ) 1 / 3 2 × 2 1 / 3 × 3 2 / 3
r 3 = ( 1 i 3 ) A 2 2 / 3 × 3 1 / 3 ( 9 B + 3 4 A 3 + 27 B 2 ) 1 / 3 ( 1 + i 3 ) ( 9 B + 3 4 A 3 + 27 B 2 ) 1 / 3 2 × 2 1 / 3 × 3 2 / 3
Thus, there are three roots r 1 , r 2 , r 3 possible, and there are two cases: (a) there is only one real root and two conjugate complex roots, and (b) there are three real roots. From the classical theory of cubic equations, case (b) occurs when the discriminant ( 4 A 3 + 27 B 2 ) > 0 and case (a) occurs when the discriminant ( 4 A 3 + 27 B 2 ) < 0 . Thus root r 1 is always real and we thus assume that y = r 1 is the root of Equation (A13). Then we simultaneously solve for three equations simultaneously by a simple FindRoot functionality in mathematica to get P ,   s 0 ,   θ 0 :
( 1 )   s 0 = bE ( θ 0 | e 2 ) ;
2   PL = 4 M 0 ;
3   s 0 = 0 α + arctan ( a / b × tan θ 0 ) d ϕ a / b 2 + ( r 1 ( ϕ ) ) 2 .
Of course the integral [ 0 , s 0 ] cos ϕ ( s ) d s = 0 α + arctan ( a / b × tan θ 0 ) cos ϕ d ϕ a b 2 + ( r 1 ( ϕ ) ) 2 along with Equation (11) is used to obtain the denting displacements. This analytical solution method by radicals (Appendix D) is validated against the general analytical solution (Appendix C) for the special case n = 1 / 2 in Figure A4 with geometric parameters t = 1.0   mm ,   l = 1.5   mm ,   a out = 17.5   mm ,   b out = 32.5   mm and hardening parameters C = 364   MPa ,   n = 1 / 2 ,   σ 0 = 167   MPa . The agreement between the two analytical solutions is exact in Figure A4. This shows the choice of r 1 instead of r 2 ,   r 3 as the representative root of Equation (A13) is valid.
Figure A4. Comparisons of the analytical solutions.
Mathematics 13 02527 g0a4
Since the occurrence of case (a) or case (b) can be checked directly by the discriminant, Figure A5 plots the discrete plot of the discriminant for each δ / a ( ϕ is sampled uniformly to form 101 samples in closed interval [ 0 , α + arctan ( a / b × tan θ 0 ) ] for each rotation angle α ). All discriminants are negative and thus the case (a) occurs definitely and  r 2 , r 3 are conjugate complex roots and only r 1 is the real root (fortunately verifying the choice of r 1 instead of r 2 ,   r 3 in Equation (A19)). Since n ( 0 ,   1 ] in metal plasticity and radical-based solution should satisfy x n + 1 = x nm for some m = 2 ,   3 ,   4 or m = 1 / 2 ,   1 / 3 ,   1 / 4 , since only linear, quadratic, cubic and quartic polynomials can be solved by radicals. Thus n + 1 = nm implies n = 1 / ( m 1 ) . Substitution of m = 2 ,   3 ,   4 gives n = 1 ,   1 / 2 ,   1 / 3 . Other choice of m makes n negative. Thus the method via radicals can be applied to only three special cases n = 1 / 3 ,   1 / 2 ,   1 in metal plasticity.
Figure A5. Discriminants are negative for each δ / a level.
Mathematics 13 02527 g0a5

Appendix E. Mesh Independence Check

By default, in the thickness direction, eight elements were assigned as described in Section 4.1. Thanks to the valuable suggestion that mesh independence check should be conducted for plastic region length extraction from one anonymous reviewer, here we explicitly present some mesh-independence checks for both force-displacement curves and the plastic region length extraction methods in Section 6.1. With parameters a o u t = 20   m m ,   b o u t = 30   m m ,   t = 1   m m with non-linear hardening material properties σ 0 = 167   M P a ,   C = 364   M P a ,   n = 0.5456 (same as in Figure 16c), three meshes including mesh#1 ( N t h i c k n e s s = 8 , N c i r c u m = 133 ), mesh #2 ( N t h i c k n e s s = 16 ,   N c i r c u m = 133 ), and mesh #3 ( N t h i c k n e s s = 16 ,   N c i r c u m = 266 ) are used for the same FEM where N t h i c k n e s s means the number of elements in thickness direction and N c i r c u m means the number of elements in the circumferential direction of the 1/4 ring model (see Figure 5b). Figure A7 presents local visualization of three meshes. Thus, mesh densities of mesh #1, mesh#2, and mesh#3 increase. Figure A6 presents the comparison of crushing force-normalized displacement curves for these three meshing cases and evidently the curves coincide showing the meshing independence for force-displacement response.
Figure A8 shows the FEA’s fully plastic region lengths extracted using the plastic length extraction method described in Section 6.1 for various N t h r e s h o l d values and these three meshing cases (see Section 6.1 for definitions). For mesh #1, N t h i c k n e s s = 8 and N t h r e s h o l d = 4 ,   5 ,   6 are assigned; for mesh #2, mesh #3, N t h i c k n e s s = 16 ,   N t h r e s h o l d = 4 ,   5 , ,   12 are assigned. Evidently, when δ / a < 0.2 (small displacement levels), the results highly depend on the N t h r e s h o l d and of course smaller N t h r e s h o l d leads to a larger length by the determination method in Section 6.1. However, very interestingly, when δ / a 0.3 , all curves almost coincide regardless of different meshes and N t h r e s h o l d values (establishing the robustness of our extraction method). Of course, theoretically “fully plastic” should require N t h r e s h o l d = N t h i c k n e s s ideally; however, since elasticity is included in FEA and FEA is “elastoplastic” instead of “fully plastic”, the middle surfaces of the rings at middle radii are always elastic in FEA (see defined meshes in Figure 14 and Figure 15). Naively setting N t h r e s h o l d close to N t h i c k n e s s should lead to unrealistic underestimation of the plastic length. Also we can not adopt N t h r e s h o l d too small when N t h i c k n e s s is compared since “fully” plastic regions are desired, otherwise it would lead to overestimation of the plastic lengths (see Figure A8 and thus for example N t h r e s h o l d = 4 when N t h i c k n e s s = 16 should be avoided since it leads to significant overestimation when δ / a < 0.2 ). From Figure A8 and previous checks in Figure 14 and Figure 15 and theoretical comparisons in Figure 16 and Figure 18, 70 % N t h i c k n e s s > N t h r e s h o l d > 50 % N t h i c k n e s s may be recommended to guide better manual determination of N t h r e s h o l d in this paper. For example, when N t h i c k n e s s = 8 ,   5.6 > N t h r e s h o l d > 4 (thus, being integer, it leads to N t h r e s h o l d = 5 and this value 5 is used as default value in this paper) and when N t h i c k n e s s = 16 , 11.2 > N t h r e s h o l d > 8 (thus N t h r e s o l d = 9 ,   10 ,   11 are recommended).
Appendix E shows the general mesh independence for force-displacement response and the plastic region extraction method in Section 6.1.
Figure A6. The force-displacement curves for different meshes.
Mathematics 13 02527 g0a6
Figure A7. Local visualization of Mesh#1, Mesh#2, and Mesh#3.
Mathematics 13 02527 g0a7
Figure A8. Robustness of the plastic length extraction method in Section 6.1 for different meshes.
Mathematics 13 02527 g0a8

References

  1. Jones, N.; Birch, R.S. Low-velocity impact of pressurised pipelines. Int. J. Impact Eng. 2010, 37, 207–219. [Google Scholar] [CrossRef]
  2. Travanca, J.; Hao, H. Numerical analysis of steel tubular member response to ship bow impacts. Int. J. Impact Eng. 2014, 64, 101–121. [Google Scholar] [CrossRef]
  3. Zhang, P.; Lan, H. Calculation model for critical depth of kinked dents on pipelines with internal pressure. Int. J. Press. Vessel. Pip. 2024, 209, 105176. [Google Scholar] [CrossRef]
  4. Luo, J.; Zhang, Y.; Li, L.; Zhu, L.; Wu, G. Fatigue failure analysis of dented pipeline and simulation calculation. Eng. Fail. Anal. 2020, 113, 104572. [Google Scholar] [CrossRef]
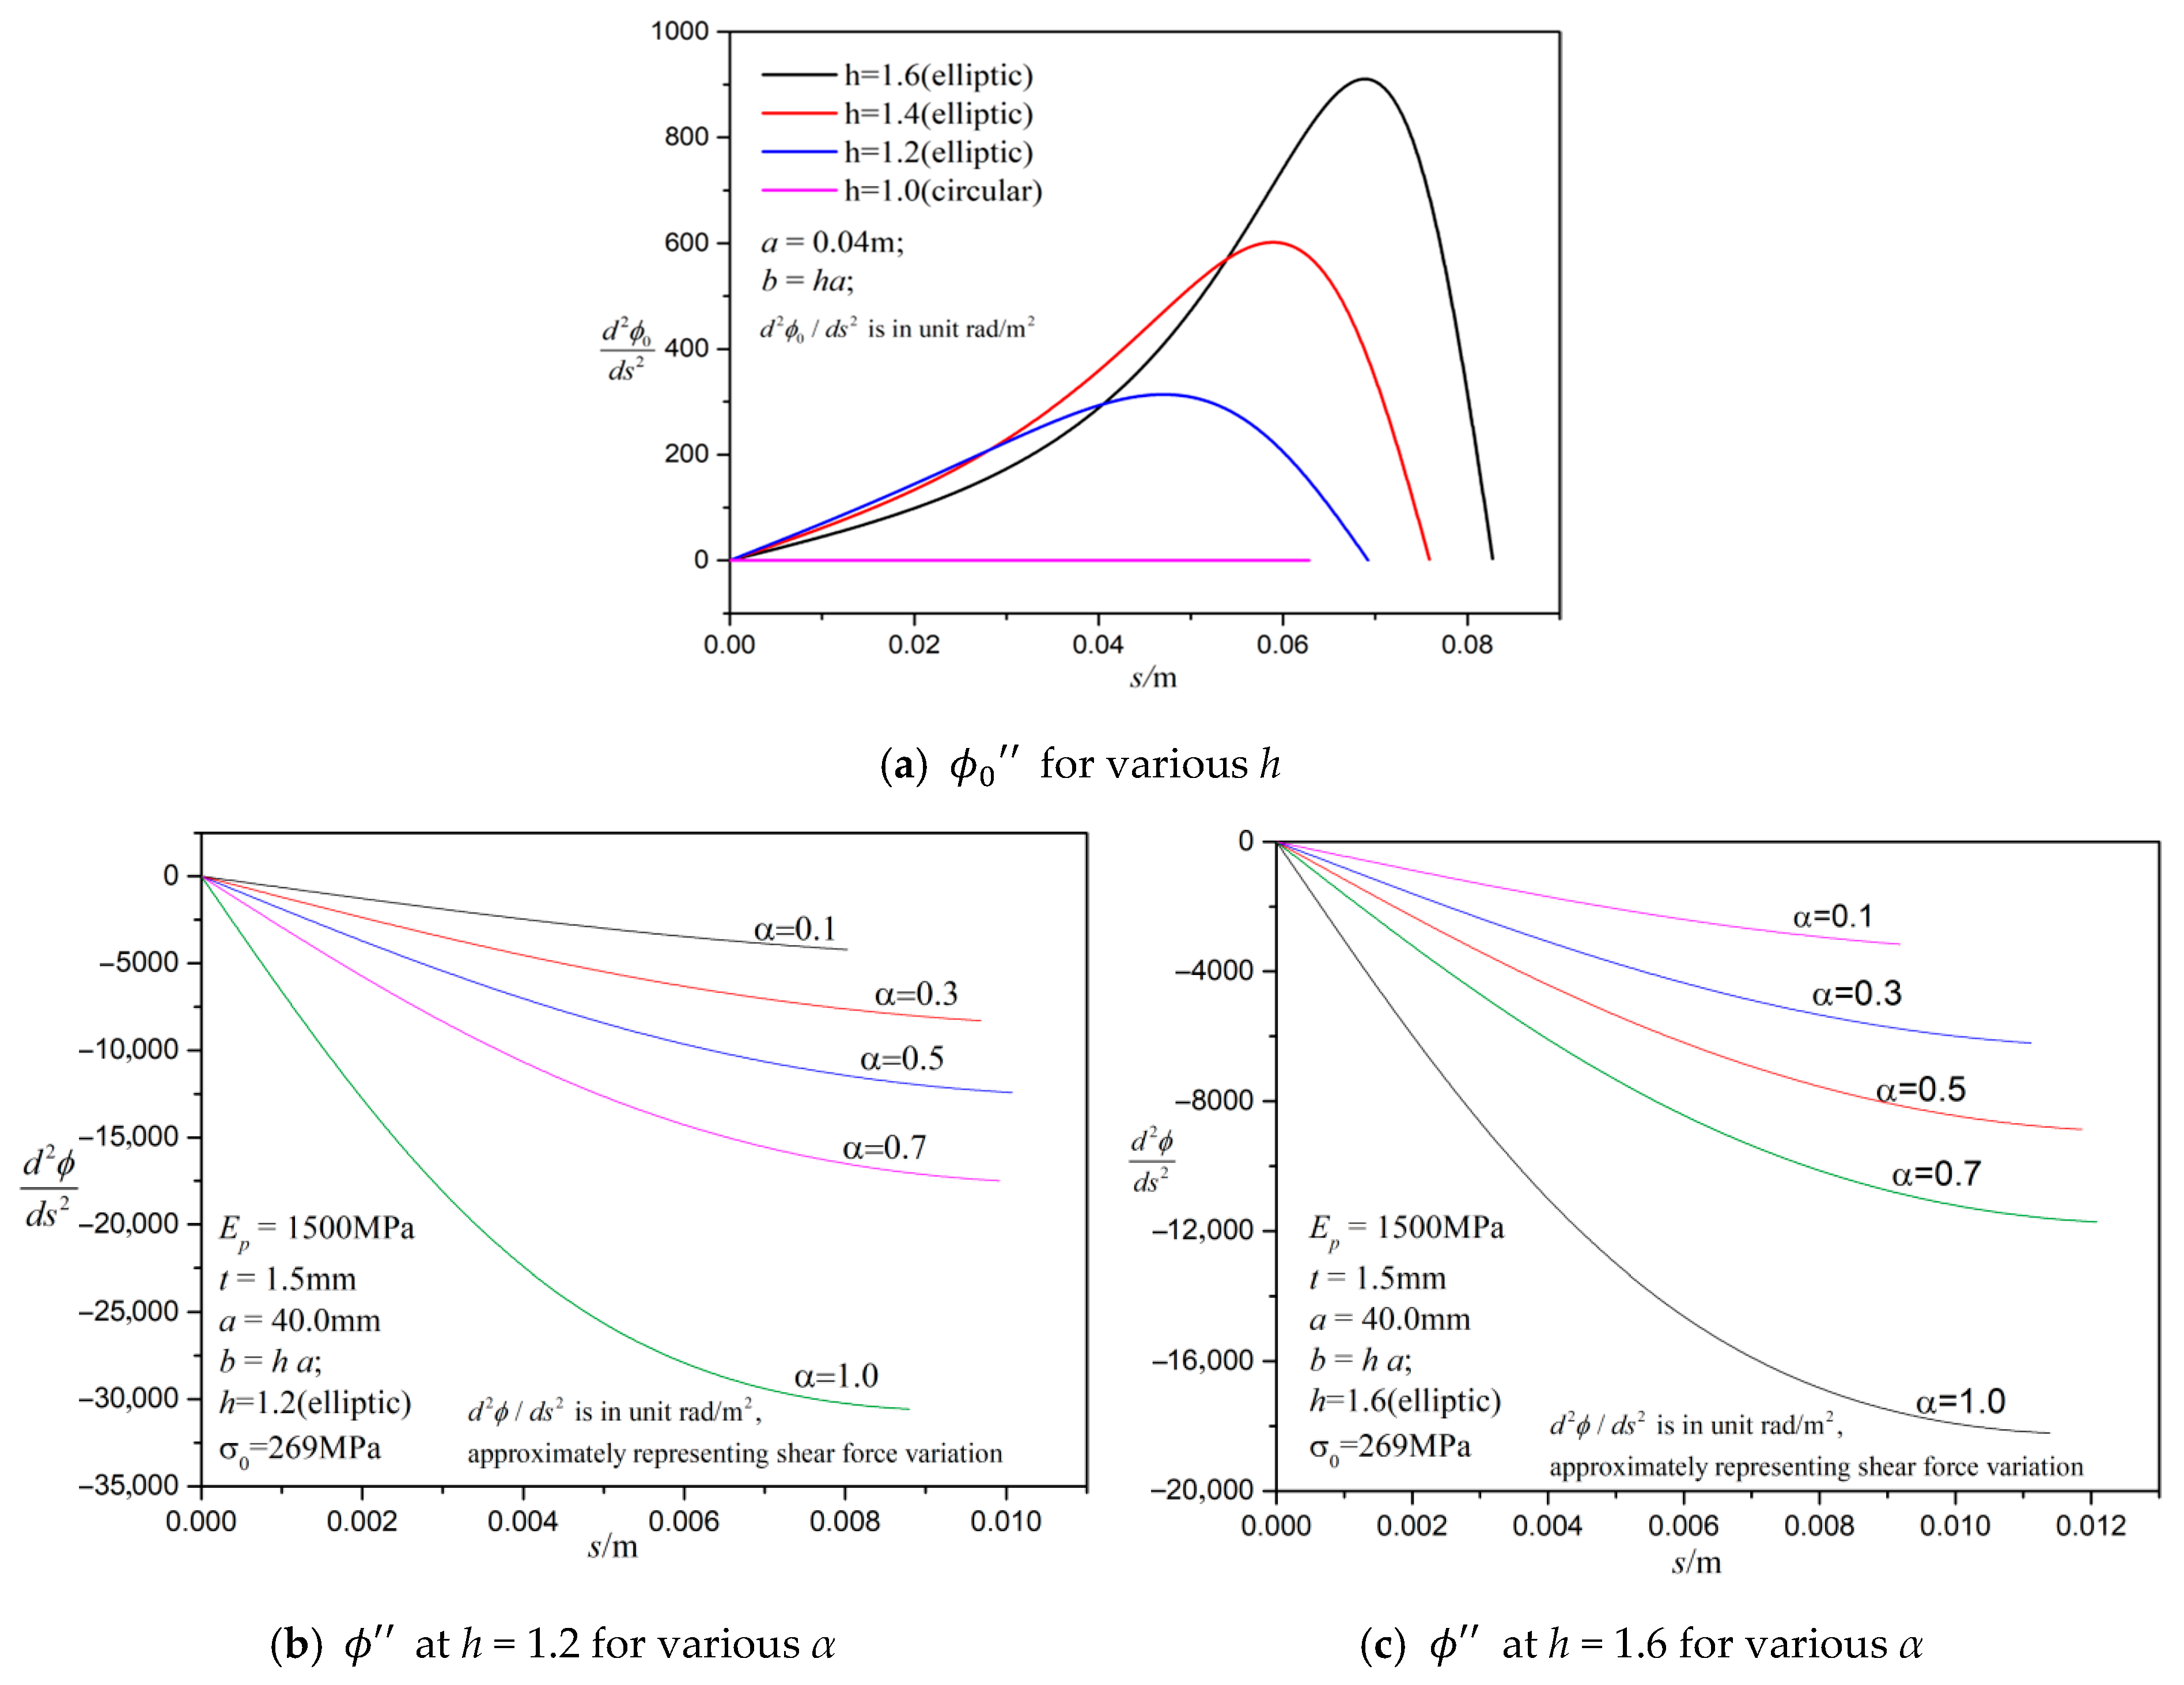
  5. Lam, C.; Zhou, W. Statistical analyses of incidents on onshore gas transmission pipelines based on PHMSA database. Int. J. Press. Vessel. Pip. 2016, 145, 29–40. [Google Scholar] [CrossRef]
  6. Storheim, M.; Amdahl, J. Design of offshore structures against accidental ship collisions. Mar. Struct. 2014, 37, 135–172. [Google Scholar] [CrossRef]
  7. Ellinas, C.P.; Walker, A.C. Damage on offshore tubular bracing members. IABSE colloquium, Copenhagen 1983, 42, 253–261. [Google Scholar]
  8. Palmer, A.; Touhey, M.; Holder, S.; Anderson, M.; Booth, S. Full-scale impact tests on pipelines. Int. J. Impact Eng. 2006, 32, 1267–1283. [Google Scholar] [CrossRef]
  9. Yu, J.X.; Zhao, Y.Y.; Li, T.Y.; Yu, Y. A three-dimensional numerical method to study pipeline deformations due to transverse impacts from dropped anchors. Thin-Walled Struct. 2016, 103, 22–32. [Google Scholar] [CrossRef]
  10. Firouzsalari, S.E.; Showkati, H. Investigation of free-spanned pipeline behavior due to axial forces and local loads. J. Constr. Steel Res. 2013, 86, 128–139. [Google Scholar] [CrossRef]
  11. Zeinoddini, M.; Parke, G.A.; Harding, J.E. Axially pre-loaded steel tubes subjected to lateral impacts: An experimental study. Int. J. Impact Eng. 2002, 27, 669–690. [Google Scholar] [CrossRef]
  12. Zhi, X.D.; Zhang, R.; Fan, F.; Huang, C. Experimental study on axially preloaded circular steel tubes subjected to low-velocity transverse impact. Thin-Walled Struct. 2018, 130, 161–175. [Google Scholar] [CrossRef]
  13. Santosa, S.P.; Wierzbicki, T.; Hanssen, A.G.; Langseth, M. Experimental and numerical studies of foam-filled sections. Int. J. Impact Eng. 2000, 24, 509–534. [Google Scholar] [CrossRef]
  14. Baroutaji, A.; Arjunan, A.; Stanford, M.; Robinson, J.; Olabi, A.G. Deformation and energy absorption of additively manufactured functionally graded thickness thin-walled circular tubes under lateral crushing. Eng. Struct. 2021, 226, 111324. [Google Scholar] [CrossRef]
  15. Niknejad, A.; Javan, Y.T. Circular metal tubes during lateral compression between a V-shape indenter and a platen–Theory and experiment. Proc. Inst. Mech. Eng. Part L J. Mater. Des. Appl. 2015, 229, 318–331. [Google Scholar] [CrossRef]
  16. Wang, H.B.; Yang, J.L.; Liu, H. Lateral crushing of circular rings under wedge impact. Int. J. Appl. Mech. 2016, 8, 1650031. [Google Scholar] [CrossRef]
  17. Morris, E.; Olabi, A.G.; Hashmi, M.S. Lateral crushing of circular and non-circular tube systems under quasi-static conditions. J. Mater. Process. Technol. 2007, 191, 132–135. [Google Scholar] [CrossRef]
  18. Wu, L.; Carney, J.F., III. Initial collapse of braced elliptical tubes under lateral compression. Int. J. Mech. Sci. 1997, 39, 1023–1036. [Google Scholar] [CrossRef]
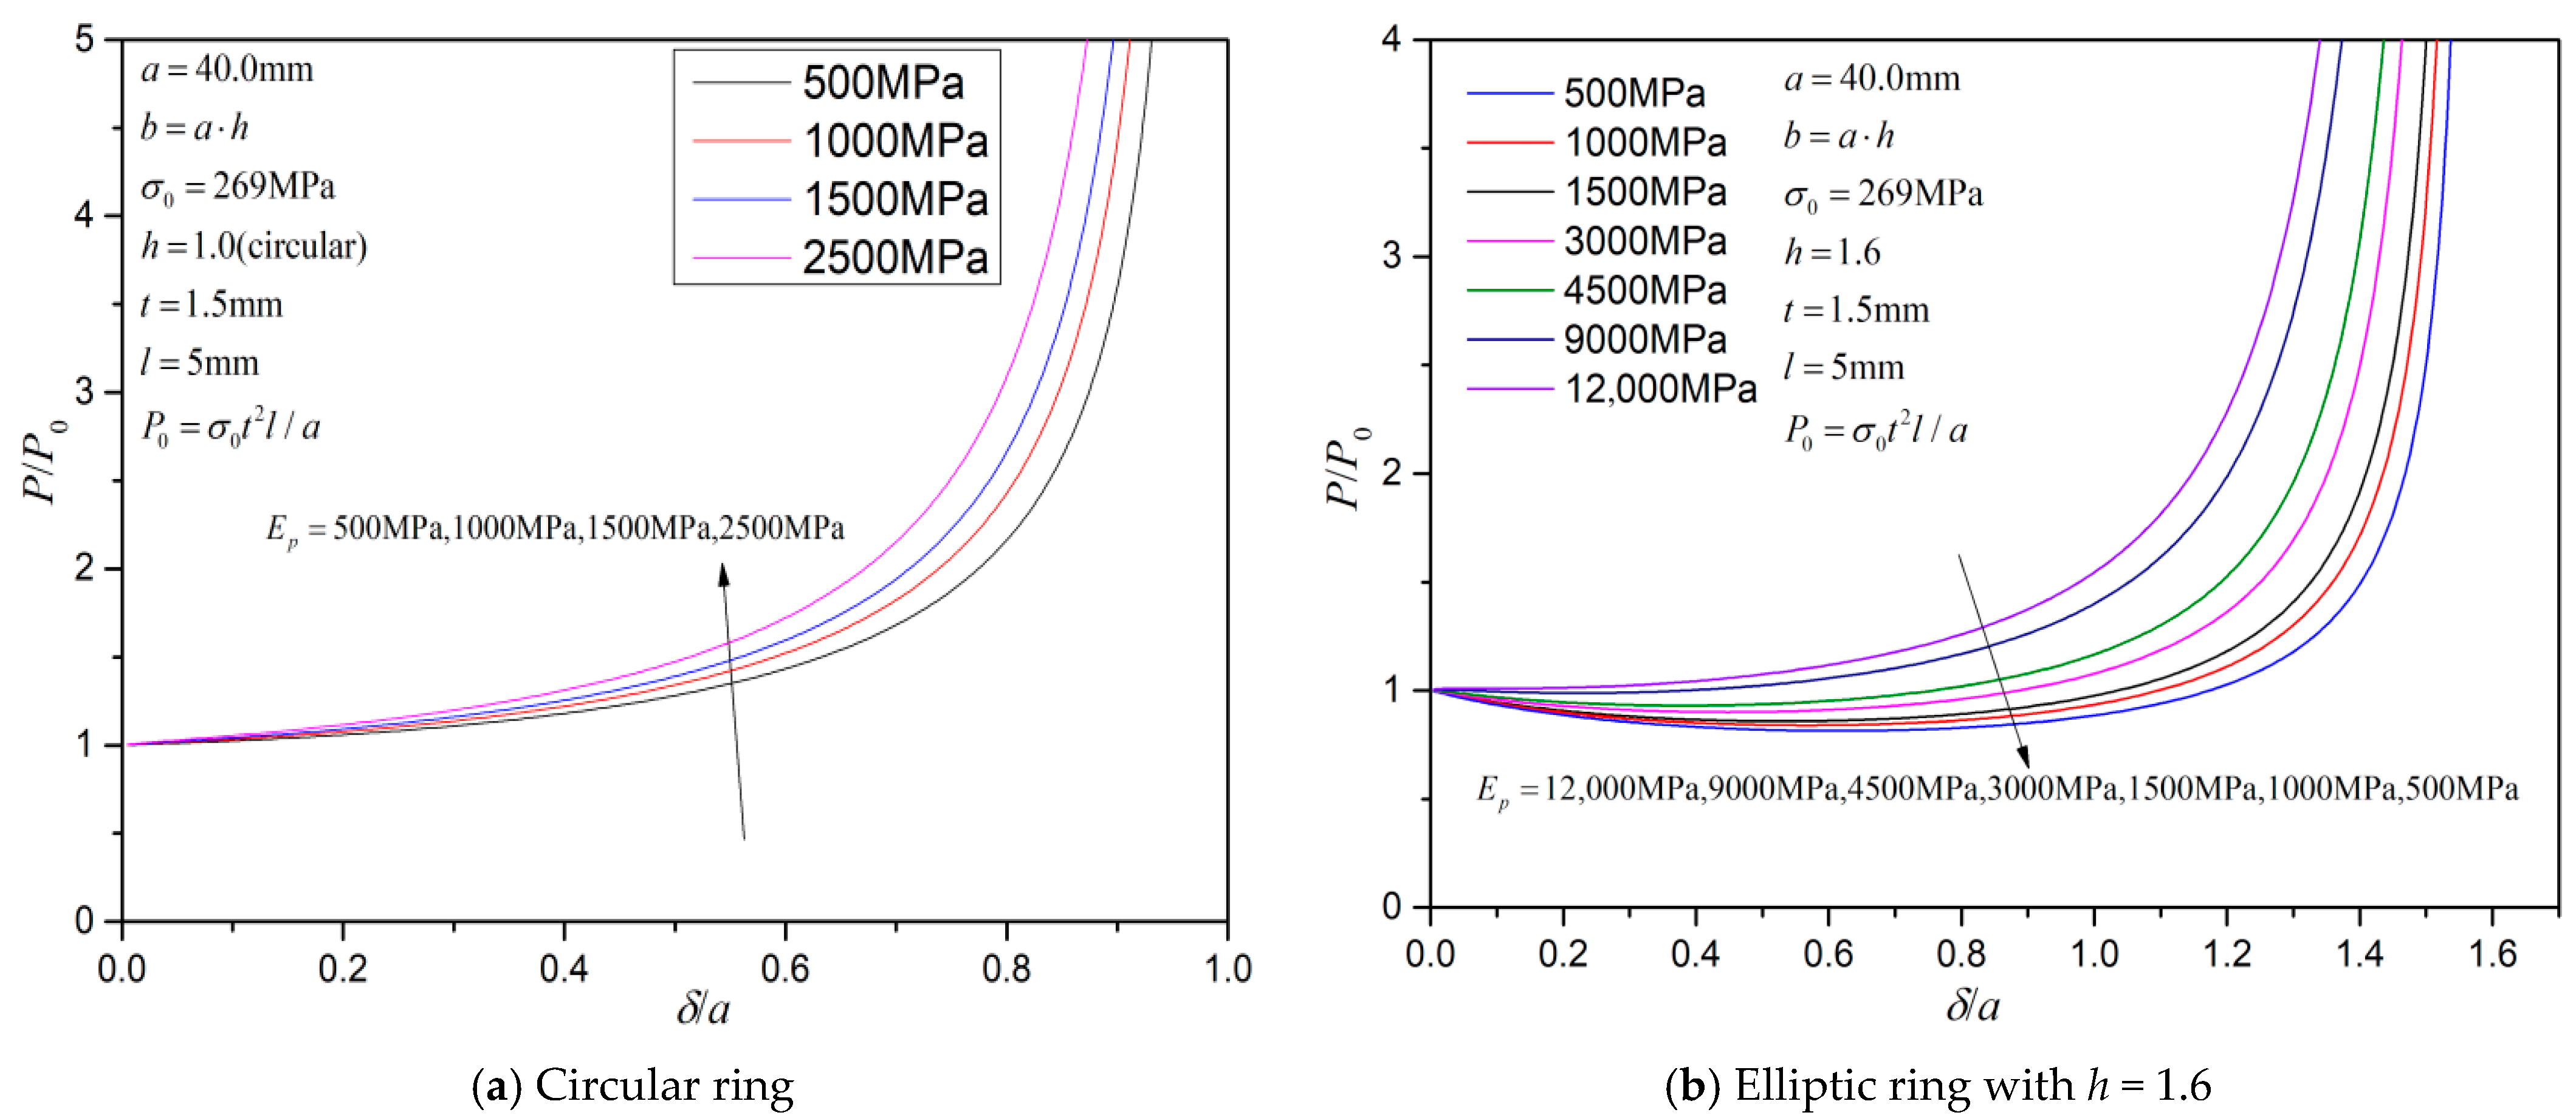
  19. Baroutaji, A.; Morris, E.; Olabi, A.G. Quasi-static response and multi-objective crashworthiness optimization of oblong tube under lateral loading. Thin-Walled Struct. 2014, 82, 262–277. [Google Scholar] [CrossRef]
  20. Yang, K.; Qiao, C.; Xiong, F.; Zhang, L.; Wu, Z.; Chen, Y. Theoretical investigation on the energy absorption of ellipse-shaped self-locked tubes. Sci. China Phys. Mech. Astron. 2020, 63, 294611. [Google Scholar] [CrossRef]
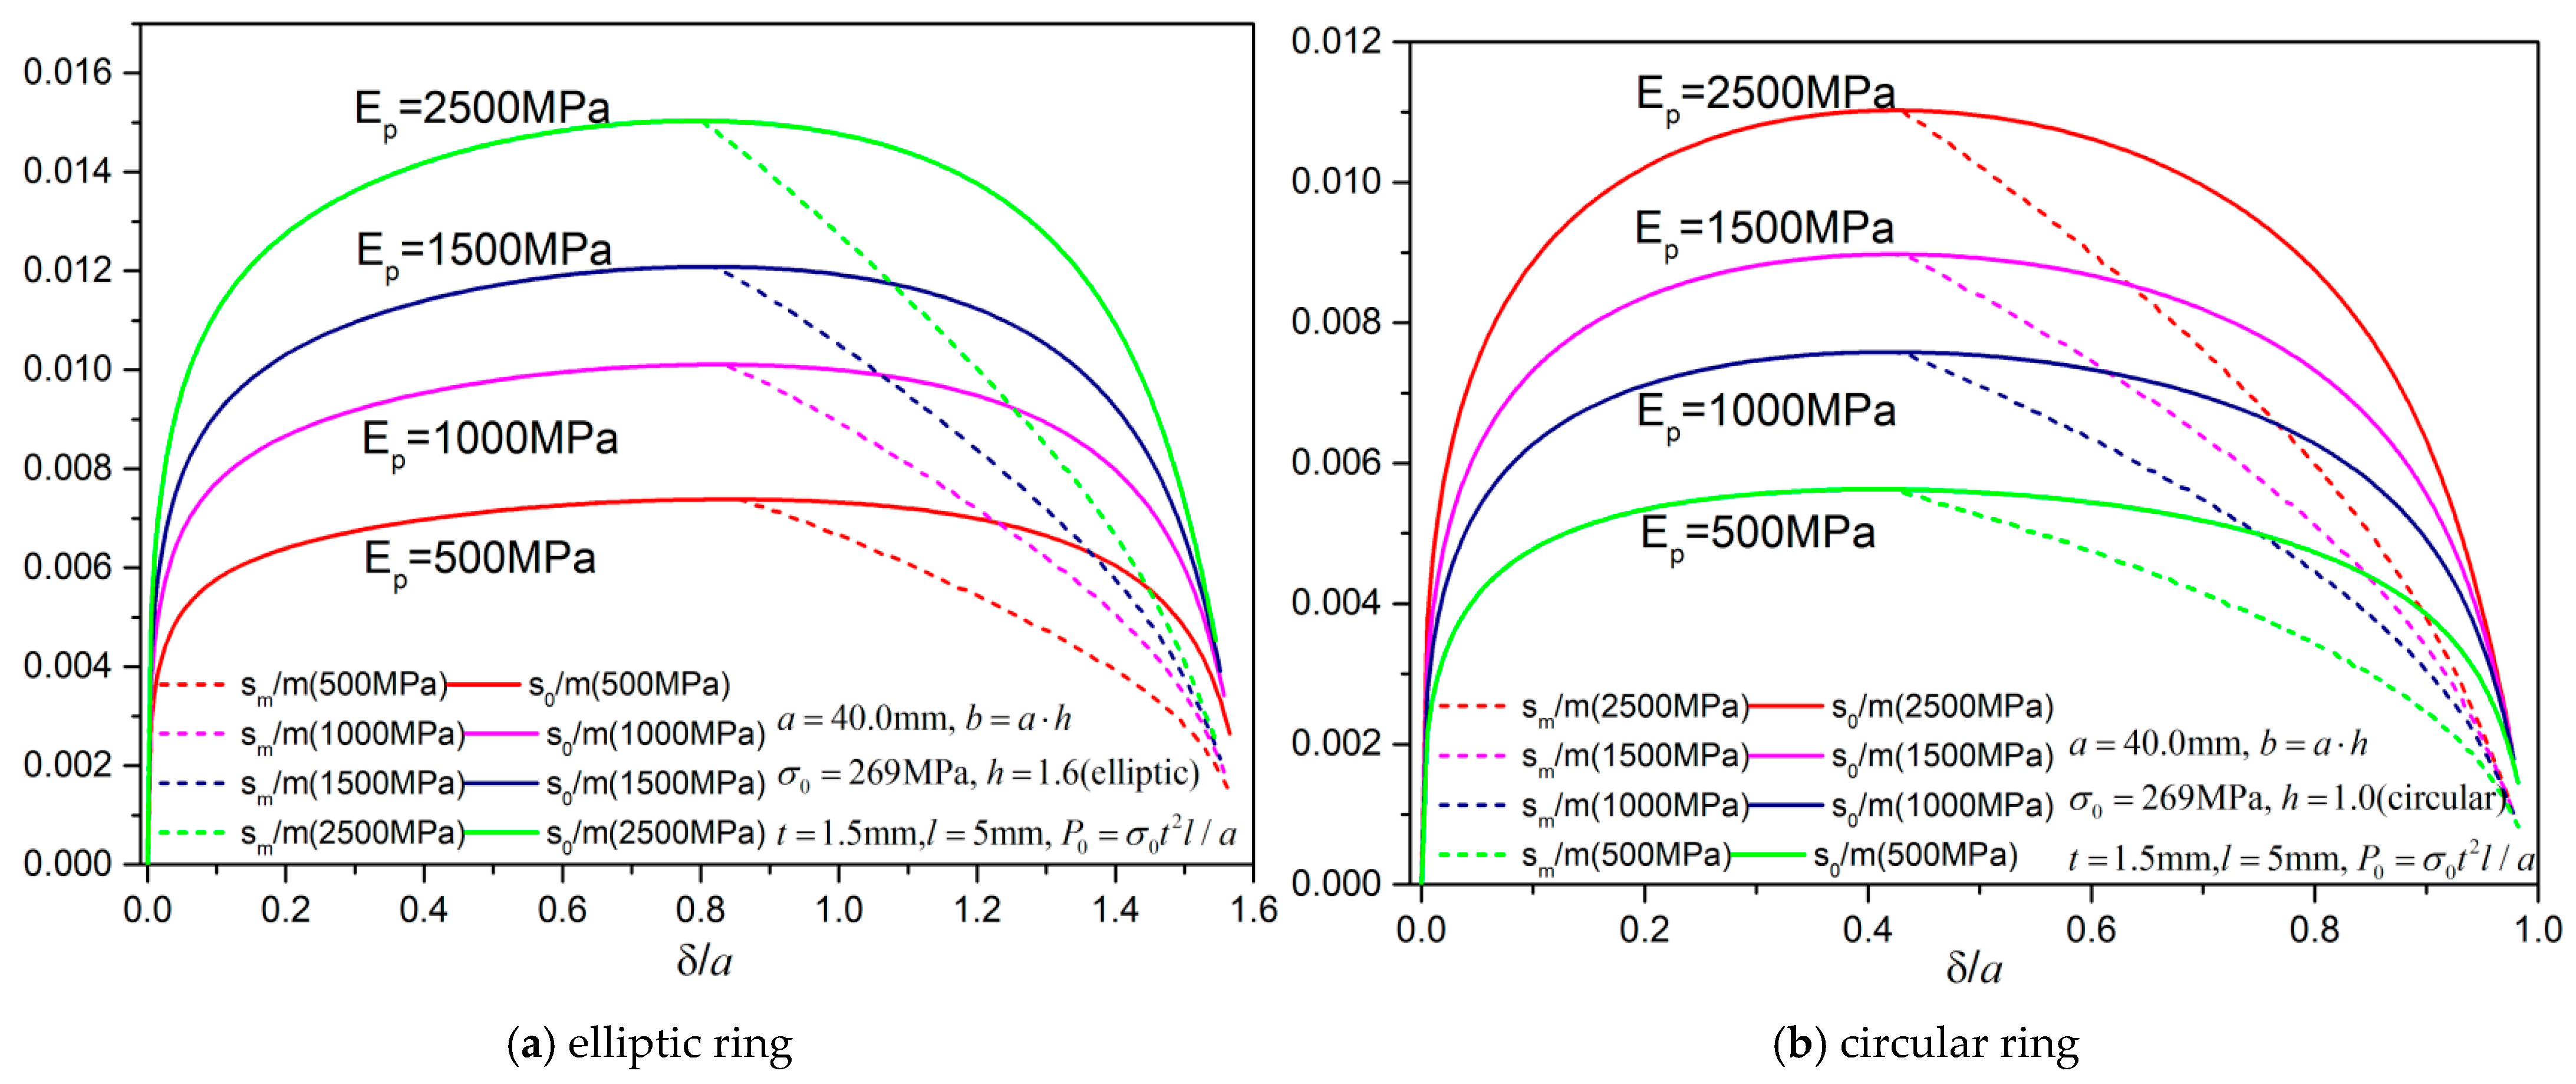
  21. Yang, X.; Ma, J.; Sun, Y.; Yang, J. An internally nested circular-elliptical tube system for energy absorption. Thin-Walled Struct. 2019, 139, 281–293. [Google Scholar] [CrossRef]
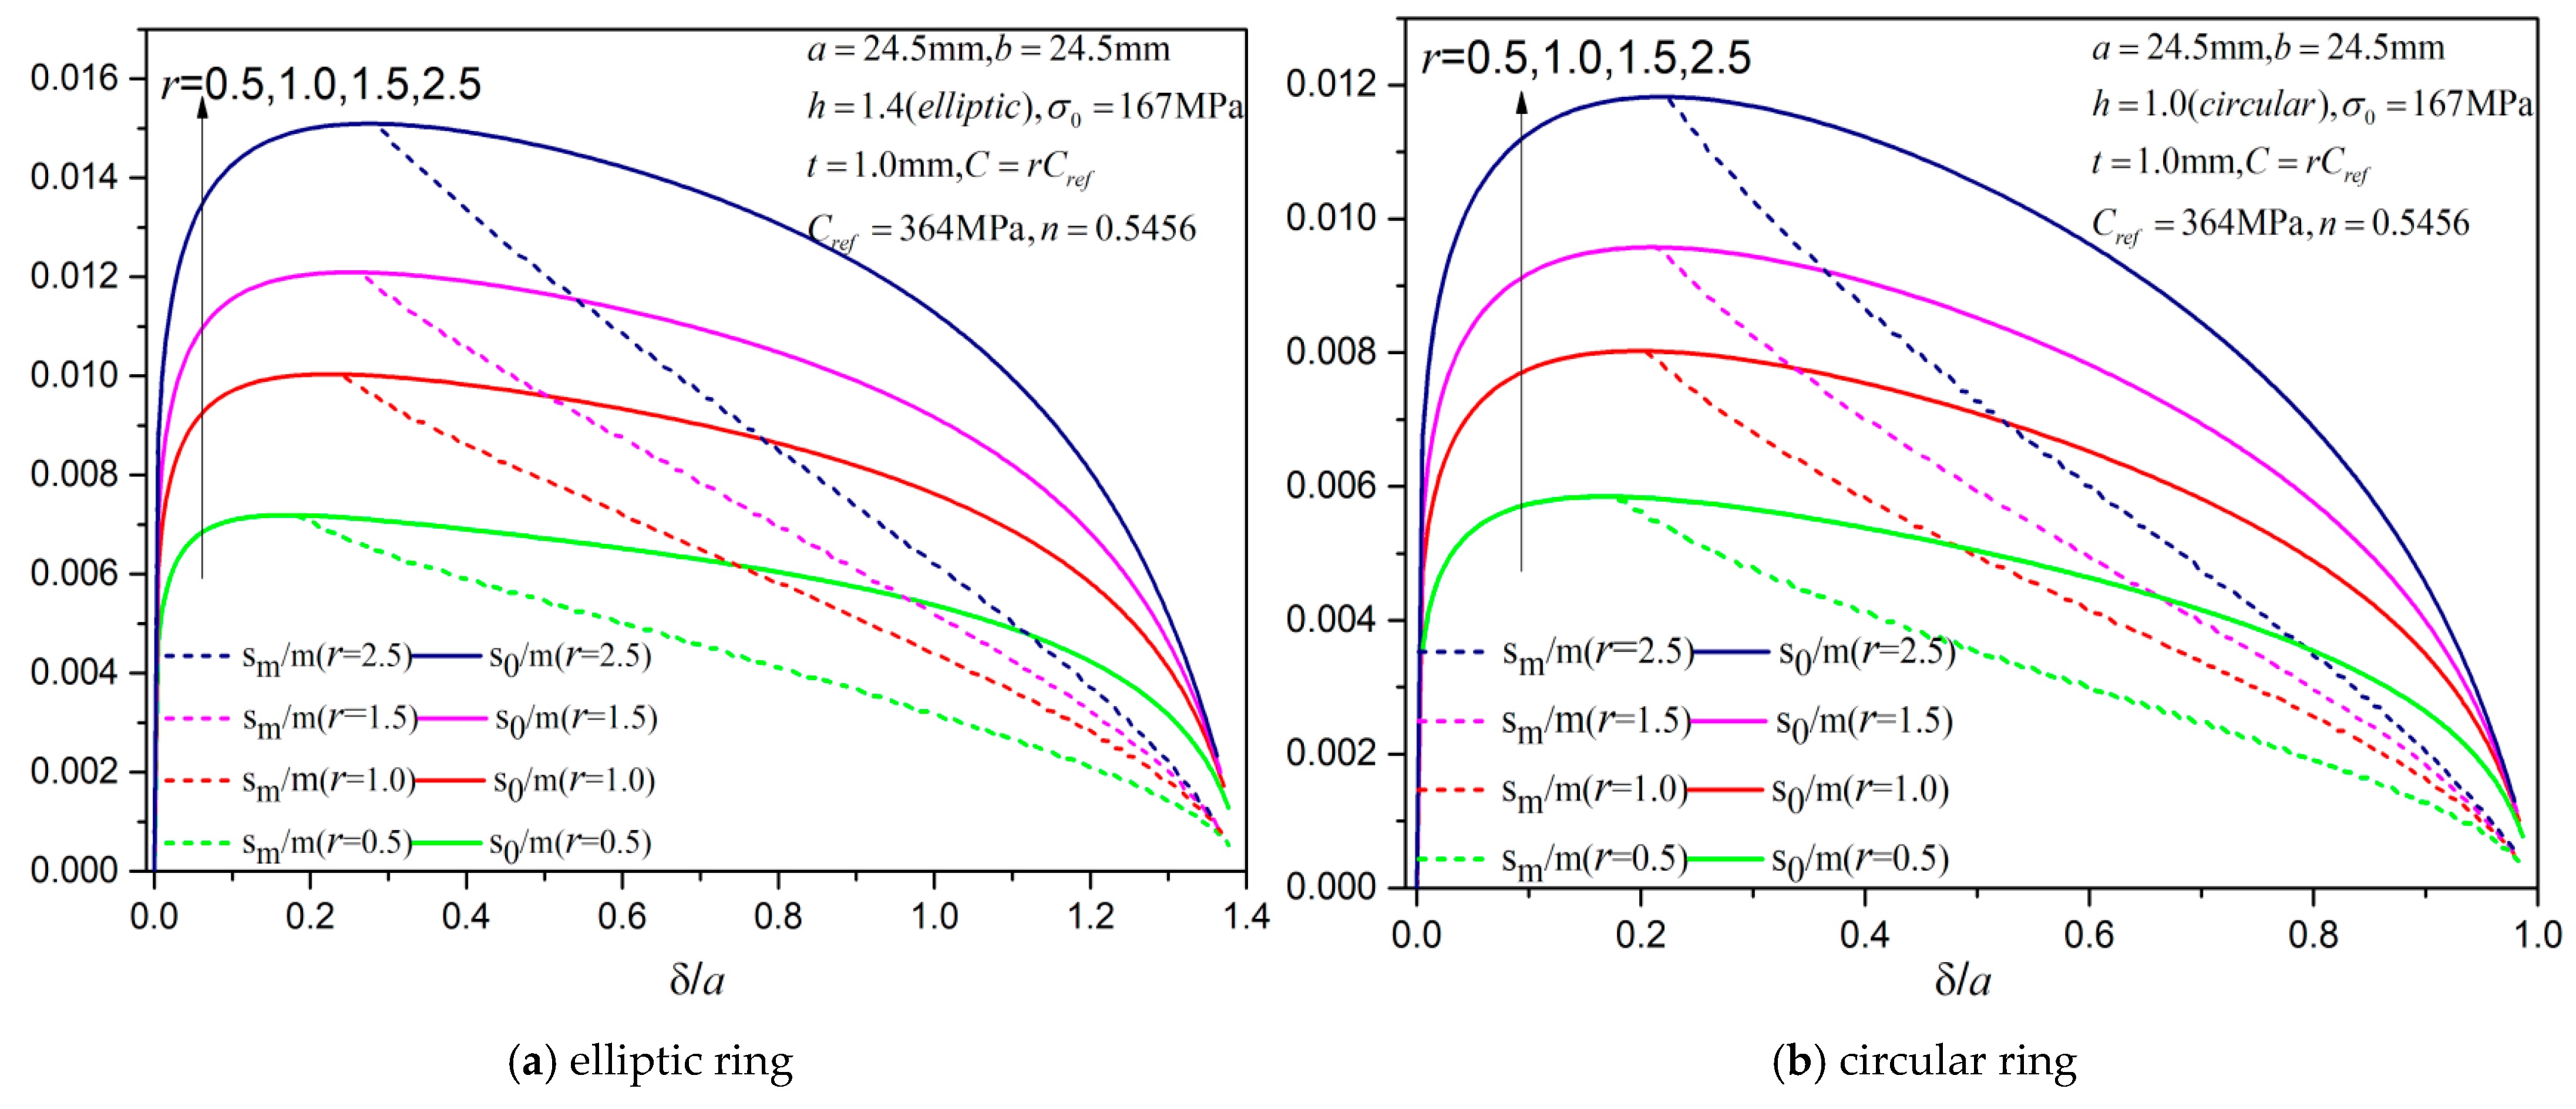
  22. Wu, J.; Zhang, Y.; Li, J.; Lai, X.; Duan, N. Energy absorption characteristics of nested corrugated-elliptical tubes subjected to a lateral crushing load. Compos. Struct. 2022, 297, 115926. [Google Scholar] [CrossRef]
  23. Palmer, A.; Martin, J. Buckle propagation in submarine pipelines. Nature 1975, 254, 46–48. [Google Scholar] [CrossRef]
  24. Yan, S.T.; Shen, X.L.; Jin, Z.J.; Ye, H. On elastic-plastic collapse of subsea pipelines under external hydrostatic pressure and denting force. Appl. Ocean Res. 2016, 58, 305–321. [Google Scholar] [CrossRef]
  25. Reid, S.R.; Reddy, T.Y. Effect of strain hardening on the lateral compression of tubes between rigid plates. Int. J. Solids Struct. 1978, 14, 213–225. [Google Scholar] [CrossRef]
  26. Liu, R.; Wang, H.; Yang, J.; Liu, H.; Sun, Y. Theoretical analysis on quasi-static lateral compression of elliptical tube between two rigid plates. Appl. Math. Mech. 2015, 36, 1005–1016. [Google Scholar] [CrossRef]
  27. Yan, S.T.; Tang, P.; Ling, Z.W.; Chen, Y.G. An analytical investigation of the collapse of asymmetrically corroded pipes under external pressure. J. Zhejiang Univ.-Sci. A 2022, 23, 358–374. [Google Scholar] [CrossRef]
  28. Hibbitt, D.; Karlsson, B.; Sorensen, P. Abaqus/CAE User’s Manual; Hibbitt, Karlsson & Sorensen, Incorporated: New York, NY, USA, 2002. [Google Scholar]
  29. Lu, G.; Yu, T.X. Energy Absorption of Structures and Materials; Elsevier: Amsterdam, The Netherlands, 2003. [Google Scholar] [CrossRef]
  30. Timoshenko, S.P.; Gere, J.M. Theory of Elastic Stability; McGraw-Hill International Book Company: London, UK, 1961. [Google Scholar]
Figure 1. Schematic of elliptic ring crushed between two parallel rigid plates.
Mathematics 13 02527 g001
Figure 2. Experimental specimens of 1.5 mm-thick aluminum plates.
Mathematics 13 02527 g002
Figure 3. Experimental apparatus for crushing rings.
Mathematics 13 02527 g003
Figure 4. Crushing deformations of elliptic rings between two parallel plates.
Mathematics 13 02527 g004
Figure 5. Regression for Ludwik’s material model parameters and FEM.
Mathematics 13 02527 g005
Figure 6. Comparisons of force-displacement curves for exp#1, exp#2, and exp#3.
Mathematics 13 02527 g006
Figure 7. Comparisons of force-displacement curves for exp#4 and exp#5.
Mathematics 13 02527 g007
Figure 8. Plastic region evolution during deformation by FEA for exp#4 (h ≈ 1.2).
Mathematics 13 02527 g008
Figure 9. Plastic region evolution during deformation by FEA for exp#5 (h ≈ 1.8).
Mathematics 13 02527 g009
Figure 10. Force-displacement curves for the linear hardening case.
Mathematics 13 02527 g010
Figure 11. Evolution of the active yielding region from ABAQUS for h = 1.0.
Mathematics 13 02527 g011
Figure 12. Evolution of the active yielding region from ABAQUS for h = 1.6.
Mathematics 13 02527 g012
Figure 13. Circumferential layer definition.
Mathematics 13 02527 g013
Figure 14. The linear hardening case.
Mathematics 13 02527 g014
Figure 15. The non-linear hardening case.
Mathematics 13 02527 g015
Figure 16. Fully plastic region length predictions by criterion, proposed modified criterion, and FEA (non-linear hardening).
Mathematics 13 02527 g016
Figure 17. Theoretical moment distribution variation for s [ 0 , s 0 ] as δ / a increases (case 2).
Mathematics 13 02527 g017
Figure 18. The fully plastic region length predictions by M0 criterion, proposed modified criterion and FEA (linear hardening).
Mathematics 13 02527 g018
Figure 19. Theoretical moment distribution variation for s [ 0 , s 0 ] in linear hardening case.
Mathematics 13 02527 g019
Figure 20. Visualization of plastic region evolution in FEA for the non-linear hardening model.
Mathematics 13 02527 g020
Figure 21. Visualization of plastic region evolution in FEA for the linear hardening model with h = 1.6.
Mathematics 13 02527 g021
Figure 24. Plastic dissipation comparison between FEA and theoretical calculation for the non-linear hardening case.
Mathematics 13 02527 g024
Figure 25. Plastic dissipation comparison between FEA and theoretical calculation for the linear hardening case.
Mathematics 13 02527 g025
Figure 26. Justification for neglect of ϕ 0 by load magnitude.
Mathematics 13 02527 g026
Figure 27. Comparisons of ϕ , ϕ 0 .
Mathematics 13 02527 g027
Figure 28. Force-displacement curves by the linear hardening model for various Ep.
Mathematics 13 02527 g028
Figure 29. Theoretical plastic region length estimation for the linear hardening model.
Mathematics 13 02527 g029
Figure 30. Theoretical plastic region length variations for the power-law material model.
Mathematics 13 02527 g030
Figure 31. Effect of C on the force-displacement curves.
Mathematics 13 02527 g031
Table 1. Geometric parameters of specimens.
ParametersExp#1Exp#2Exp#3Exp#4Exp#5
2aout/mm50.040.035.045.035.0
2bout/mm50.060.065.055.065.0
t/mm1.501.501.501.001.00
Disclaimer/Publisher’s Note: The statements, opinions and data contained in all publications are solely those of the individual author(s) and contributor(s) and not of MDPI and/or the editor(s). MDPI and/or the editor(s) disclaim responsibility for any injury to people or property resulting from any ideas, methods, instructions or products referred to in the content.