1. Introduction
Portfolio optimization under uncertainty remains a central challenge in financial economics, as investors must allocate capital among risky assets whose returns unfold under unpredictable conditions [
1,
2,
3,
4]. The classical mean–variance paradigm, which seeks to balance expected return against variance, assumes precise knowledge of first and second moments of asset returns and often relies on the assumption of elliptical or Gaussian distributions [
5,
6,
7]. Yet, extensive empirical research has documented that estimation error in expected returns and covariances can severely undermine out-of-sample performance, yielding portfolios that perform well in backtests but disappoint in real-world applications [
8,
9,
10]. Moreover, the mean–variance framework’s inherent neglect of higher-order moments and tail behavior limits its ability to protect against extreme market movements. These shortcomings underscore the need for optimization methods that explicitly account for model misspecification and sampling uncertainty while retaining computational tractability.
Emerging equity markets exacerbate these foundational challenges, exhibiting volatility patterns and structural breaks that are both deeper and more abrupt than those observed in developed markets. Return series in emerging markets such as Turkey demonstrate pronounced skewness, excess kurtosis, and frequent regime shifts driven by macroeconomic and geopolitical events [
11,
12,
13,
14,
15]. Compounding the difficulty, the relatively short history of reliable data in these markets elevates estimation risk, and abrupt policy interventions can render historical relationships obsolete almost overnight. In such environments, traditional portfolio rules, calibrated on unstable estimates, may produce allocations that are overly aggressive or insufficiently diversified, leading to disappointing performance precisely when robust protection is most needed [
16,
17]. Addressing these challenges demands an approach that can withstand distributional ambiguity, integrate tail risk considerations, and adapt dynamically to shifting market regimes.
The emergence of robust optimization in finance marked a significant stride toward mitigating the fragility of classical portfolio methods. Recently, distributionally robust optimization (DRO) has enriched the robust optimization literature by embedding statistical distance measures into the uncertainty description [
18,
19,
20]. Parallel efforts explored divergence-based sets—such as Kullback–Leibler and
-divergences—which encapsulate uncertainty in density functions and yield risk-averse allocations that perform robustly even under model misspecification [
21,
22,
23]. While DRO methods improve resilience to distributional errors and can incorporate coherent risk measures, the focus has predominantly been on scalar objectives—expected return or single-dimensional risk measures—leaving richer multivariate preference structures largely unaddressed.
Parallel to the evolution of robust techniques, scholars have pursued the formulation of portfolio choice via partial orders on random vectors, thereby transcending scalar-valued optimization. The theory of cone-based preferences draws on convex cones and vector lattice structures to define investor indifference sets and dominance relations between multivariate return distributions [
24,
25,
26]. Multivariate stochastic dominance criteria further extend this perspective by offering axiomatic ordering of distributions that accounts for entire return profiles and dependence structures [
27,
28,
29]. Such approaches capture nuanced trade-offs among different moments and tail events across assets, affording a more holistic view of risk and reward. However, the computational intractability of vector optimization under general dependence and the absence of mechanisms to address distributional ambiguity have limited adoption in practical portfolio management.
Attempts to integrate multivariate ordering with robustness have yielded important insights but remain nascent. Dentcheva and Ruszczyński developed robust vector optimization models that incorporate worst-case scenarios in stochastic dominance constraints [
30], while Bertsimas and Brown examined multi-dimensional risk measures under uncertainty [
31]. These contributions underscore the potential of combining vector-valued preferences with uncertainty sets, yet they often rely on static cone definitions or assume large-sample properties that are violated in emerging markets with limited data. Crucially, the dynamic interaction between tail dependencies and the geometry of preference cones—essential for capturing extreme co-movements—has not been fully exploited, leaving a methodological gap at the interface of distributional robustness and multivariate preference.
Recent methodological advances have significantly expanded the frontiers of portfolio optimization through sophisticated risk modeling and high-dimensional optimization techniques. The literature on multivariate risk measures has evolved beyond traditional scalar approaches, with Kakouris and Rustem [
32] pioneering the integration of copula-based worst-case conditional value-at-risk frameworks that capture complex dependency structures while maintaining computational tractability. Building on this foundation, Fan et al. [
33] introduced distributionally robust optimization under marginal and copula ambiguity sets, demonstrating that separate modeling of marginal distributions and dependency structures through Wasserstein metrics yields superior out-of-sample performance compared to traditional ambiguity-free approaches. The intersection of machine learning and portfolio optimization has emerged as a particularly active research area, with Zhang et al. [
34] showing that deep learning models can directly optimize portfolio Sharpe ratios without requiring explicit return forecasting, while Shi et al. [
35] formulated portfolio management as a supervised learning problem using multi-relational graph neural networks that incorporate sector correlations and supply-chain information. High-dimensional portfolio optimization has similarly benefited from advanced regularization techniques, with DeMiguel et al. [
36] establishing foundational results on dimension reduction methods and Krzemienowski and Szymczyk [
37] extending conditional value-at-risk to multivariate settings through copula-based approaches. These methodological innovations collectively demonstrate the practical benefits of incorporating sophisticated dependency modeling, distributional uncertainty, and dimensionality reduction into portfolio construction, motivating our development of the DR-MSCO framework as a unifying approach that synthesizes these advances within a coherent mathematical structure.
To bridge this gap, we introduce the Distributionally Robust Multivariate Stochastic Cone Order (DR-MSCO) framework, which unites the strengths of distributionally robust optimization with the flexibility of multivariate cone preferences. DR-MSCO is grounded in measure-theoretic principles and convex analysis, leveraging the Kantorovich formulation of the Wasserstein distance [
38] and the dual representation of coherent risk measures [
39]. By defining ambiguity sets as Wasserstein balls around the empirical distribution of returns, DR-MSCO secures performance guarantees against distributional perturbations within a prescribed transportation cost budget [
40]. This nonparametric approach captures misspecification risk without imposing restrictive moment or tail assumptions.
Simultaneously, DR-MSCO employs adaptive cone structures that reflect evolving investor attitudes toward multiple risk dimensions. These cones, calibrated via data-driven measures of tail dependence, adapt to market regimes, enabling the model to emphasize downside protection or diversification as conditions warrant. Tail risk is explicitly addressed through specialized risk operators that generalize Conditional Value-at-Risk and expectile measures within a multivariate vector-order framework [
41,
42]. Despite the enriched model structure, we show that the resulting optimization problem admits a tractable reformulation as a second-order cone program, ensuring computational feasibility for portfolios of realistic dimension.
Emerging markets, with their elevated volatility, structural breaks, and limited historical observations, constitute an ideal testing ground for DR-MSCO. Borsa Istanbul, in particular, has undergone significant macroeconomic fluctuations and policy shifts between 2021 and 2024, presenting a demanding environment for portfolio strategies. We conduct an empirical study using 23 representative BIST stocks spanning industrial, banking, and consumer sectors, and demonstrate that DR-MSCO consistently outperforms both the classical Markowitz model and standard distributionally robust benchmarks. Specifically, DR-MSCO achieves a Sharpe ratio of 2.18 over the full sample versus 2.09 for Markowitz, exhibits superior crisis-period performance with a Sharpe ratio of 0.95 compared to 0.69, and reduces maximum drawdown by approximately 10%. Moreover, by obviating the need for exogenous diversification constraints, DR-MSCO delivers adaptive allocations that respond organically to shifting risk-return trade-offs.
The remainder of this paper is organized as follows: in
Section 2, we begin with dataset description and empirical motivation using Borsa Istanbul data, establish the economic motivation and conceptual framework for multivariate robust optimization, formally define the Distributionally Robust Multivariate Stochastic Cone Order (DR-MSCO) and its economic structure, develop cone-based stochastic ordering theory with practical BIST examples and regime adaptation mechanisms, introduce Wasserstein ambiguity sets for distributional robustness, specify coherent risk operators, translate cone ordering to portfolio weight optimization, and establish mathematical properties with computational implementation details. In
Section 3, we present comprehensive empirical results including overall performance comparison across optimization strategies, risk-adjusted performance metrics analysis, drawdown and downside risk protection evaluation, crisis period performance assessment, and detailed DR-MSCO portfolio composition characteristics. Finally, in
Section 4, we discuss the theoretical and practical implications of our findings, highlight methodological considerations and implementation insights, and outline directions for future research in distributionally robust portfolio optimization.
2. Methodology
2.1. Dataset Description and Empirical Motivation
Our empirical analysis employs daily price data for twenty-three constituent companies of the Borsa Istanbul (BIST) spanning the period from January 2021 to June 2024, capturing 3.5 years of Turkish equity market dynamics during a particularly turbulent economic environment. This timeframe encompasses the Turkish Lira crisis of 2021–2022, multiple central bank policy regime shifts, and persistent macroeconomic uncertainty that collectively created an ideal laboratory for testing distributional robustness methodologies in emerging market contexts.
The dataset encompasses twelve distinct economic sectors, providing comprehensive representation of the Turkish economy’s industrial structure. Banking and finance represents the largest sector concentration with four companies (TSKB, VAKBN, YKBNK, SAHOL), followed by airlines and transportation (PGSUS, TAVHL, THYAO) and telecommunications (TTKOM, TCELL). Additional sectors include construction and materials, industrials, energy and utilities, food and beverage, textiles and leather, real estate, retail trade, chemicals and petrochemicals, and glass and ceramics. This diversified composition ensures that our analysis captures cross-sectoral heterogeneity in return distributions while avoiding sector-specific biases that could distort portfolio optimization results.
The empirical characteristics of our dataset provide compelling evidence for the theoretical motivations underlying the DR-MSCO framework. Parameter uncertainty manifests prominently across multiple dimensions, with annualized volatilities ranging from 39.9% to 58.1%, representing an 18.2 percentage point spread that underscores the fundamental unreliability of point estimates in emerging market contexts. Similarly, annualized returns exhibit substantial heterogeneity, spanning from 48.7% to 103.7%, demonstrating the inadequacy of single-point return forecasts for portfolio construction. This parameter instability reflects the structural breaks and regime shifts that characterized Turkish financial markets during our sample period, as central bank policy reversals and currency interventions created fundamental uncertainties about return-generating processes.
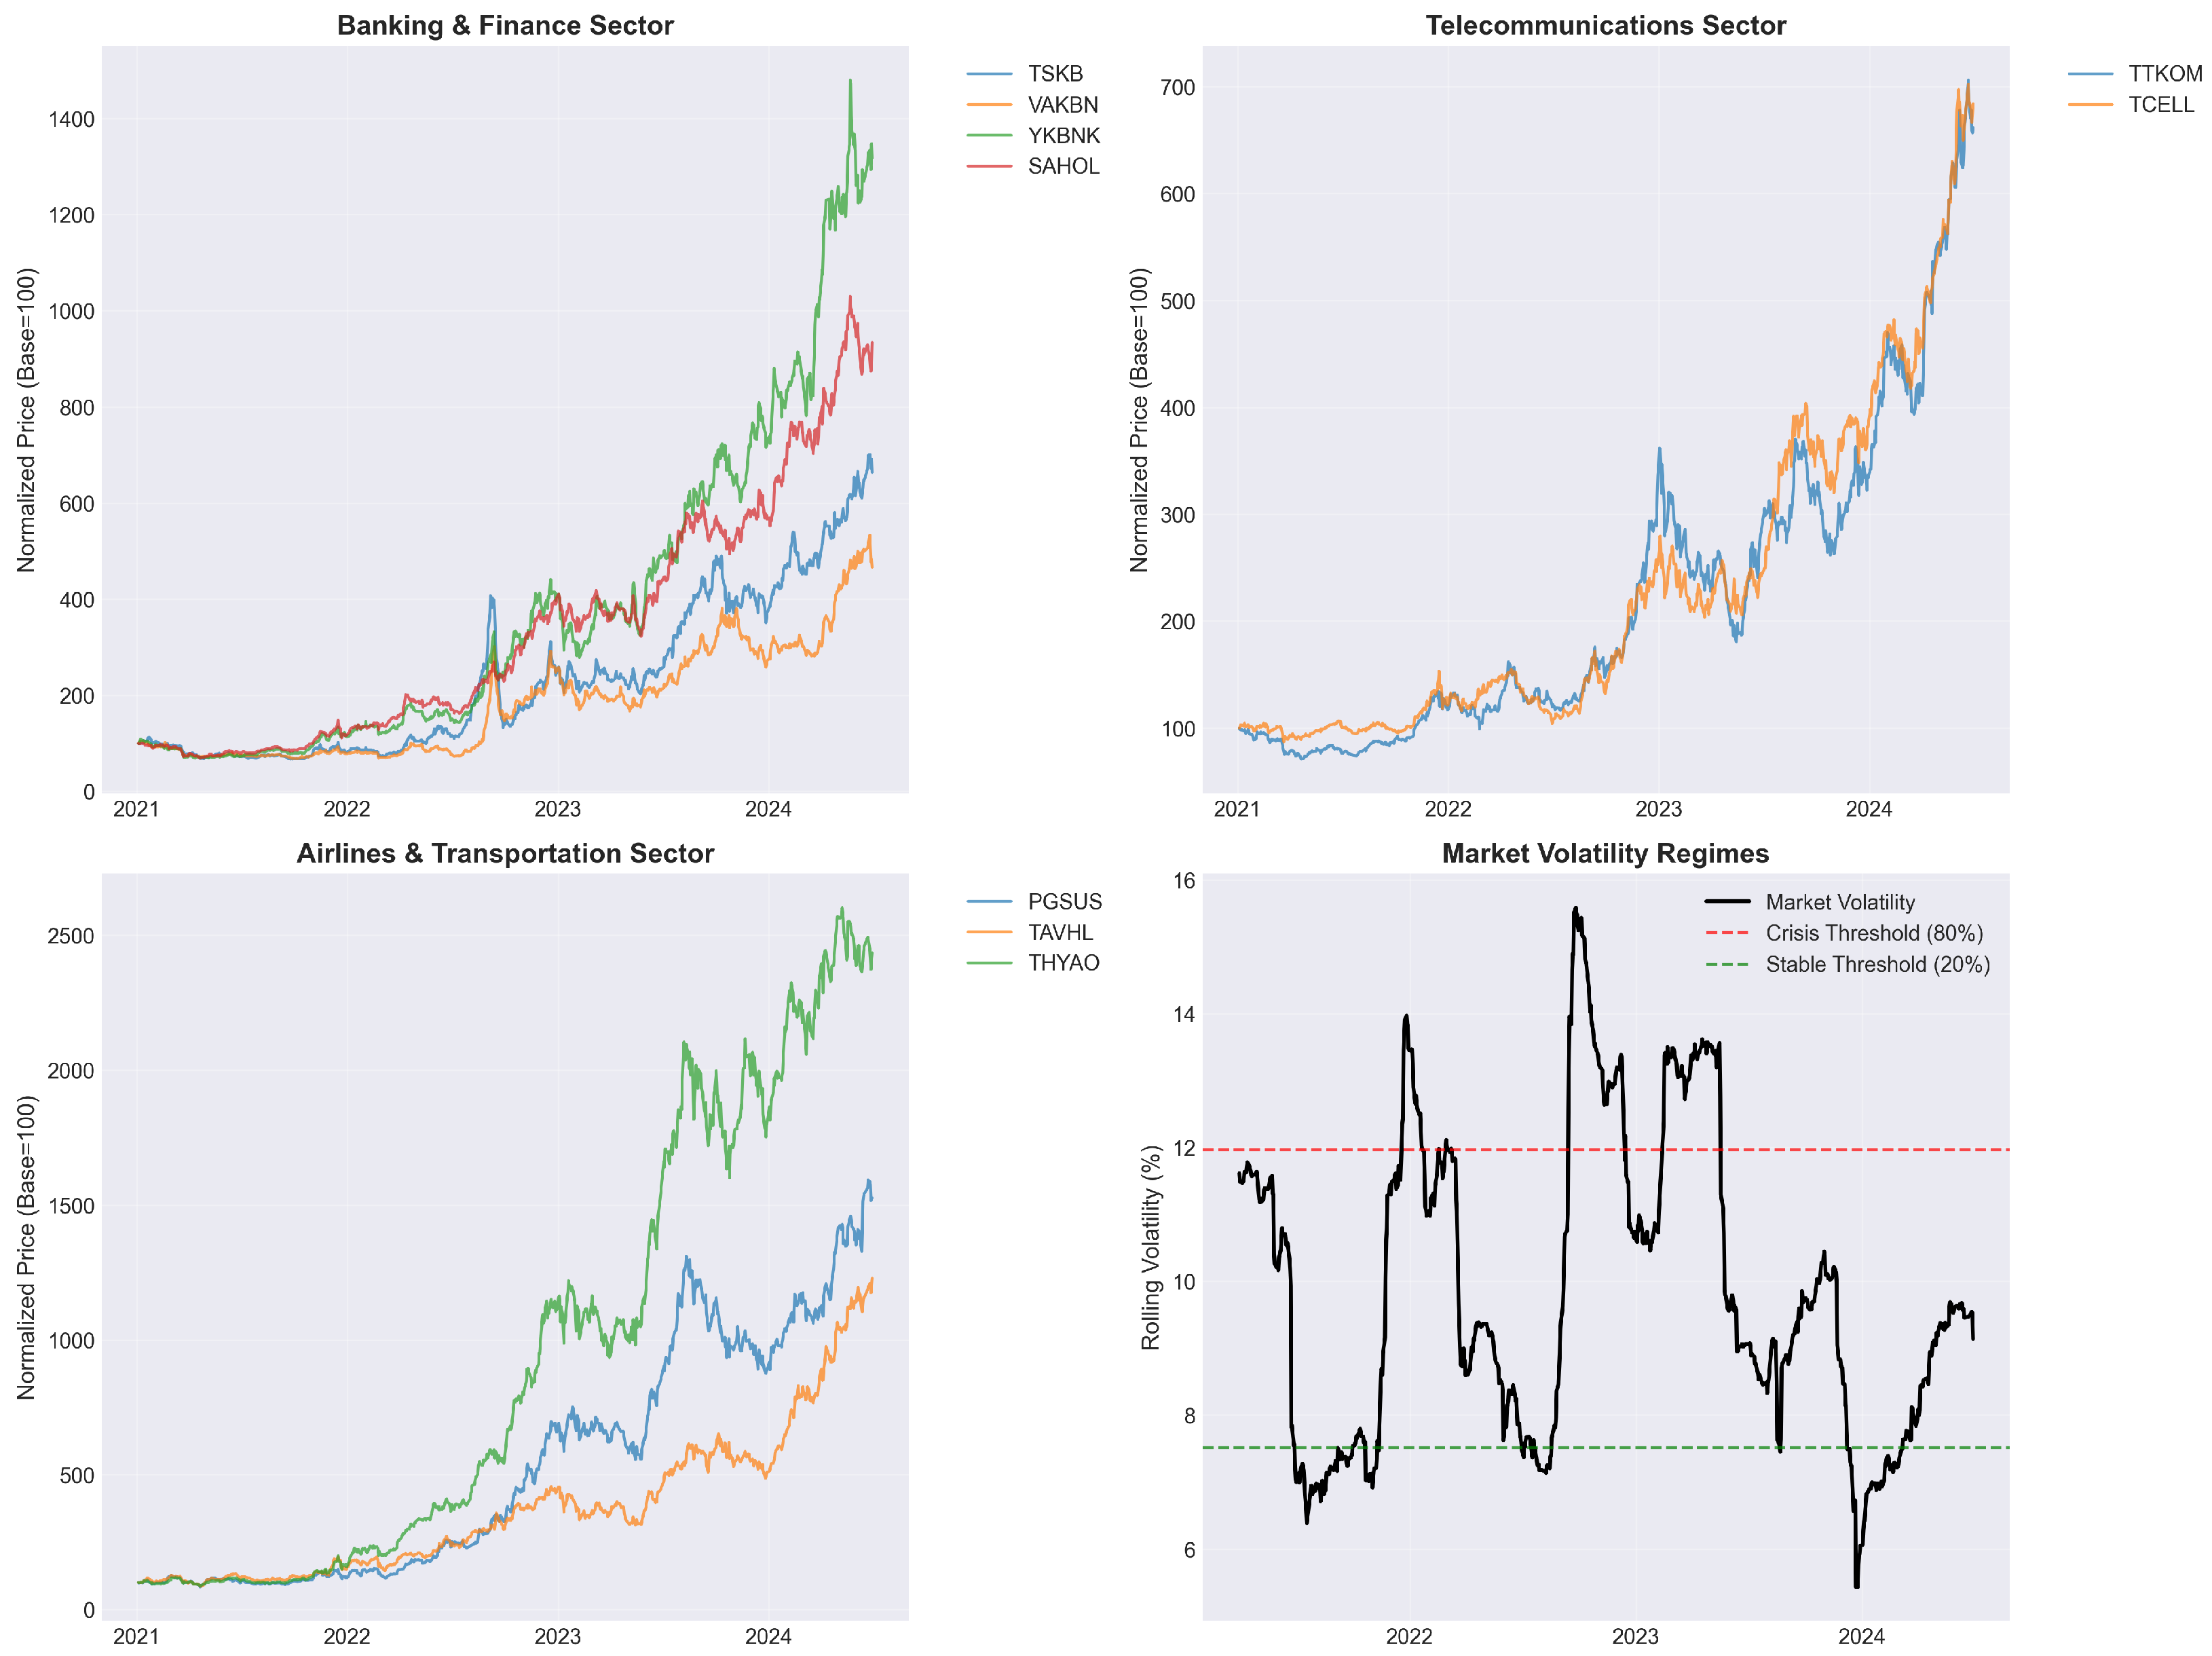
Figure 1 illustrates the dramatic price evolution patterns across major sectors during our sample period. The banking and finance sector exhibits particularly volatile dynamics, with some institutions experiencing normalized price appreciation exceeding 1400%, while others remained relatively subdued. The telecommunications sector demonstrates more moderate but persistent growth trajectories, while the airlines and transportation sector shows explosive growth particularly during 2023–2024. The bottom-right panel reveals the market volatility regime structure, identifying 162 crisis days and 162 stable days based on rolling volatility thresholds. Crisis periods coincide with major macroeconomic events, including the initial Lira depreciation episodes in late 2021, central bank policy reversals in 2022, and renewed uncertainty periods in 2023–2024.
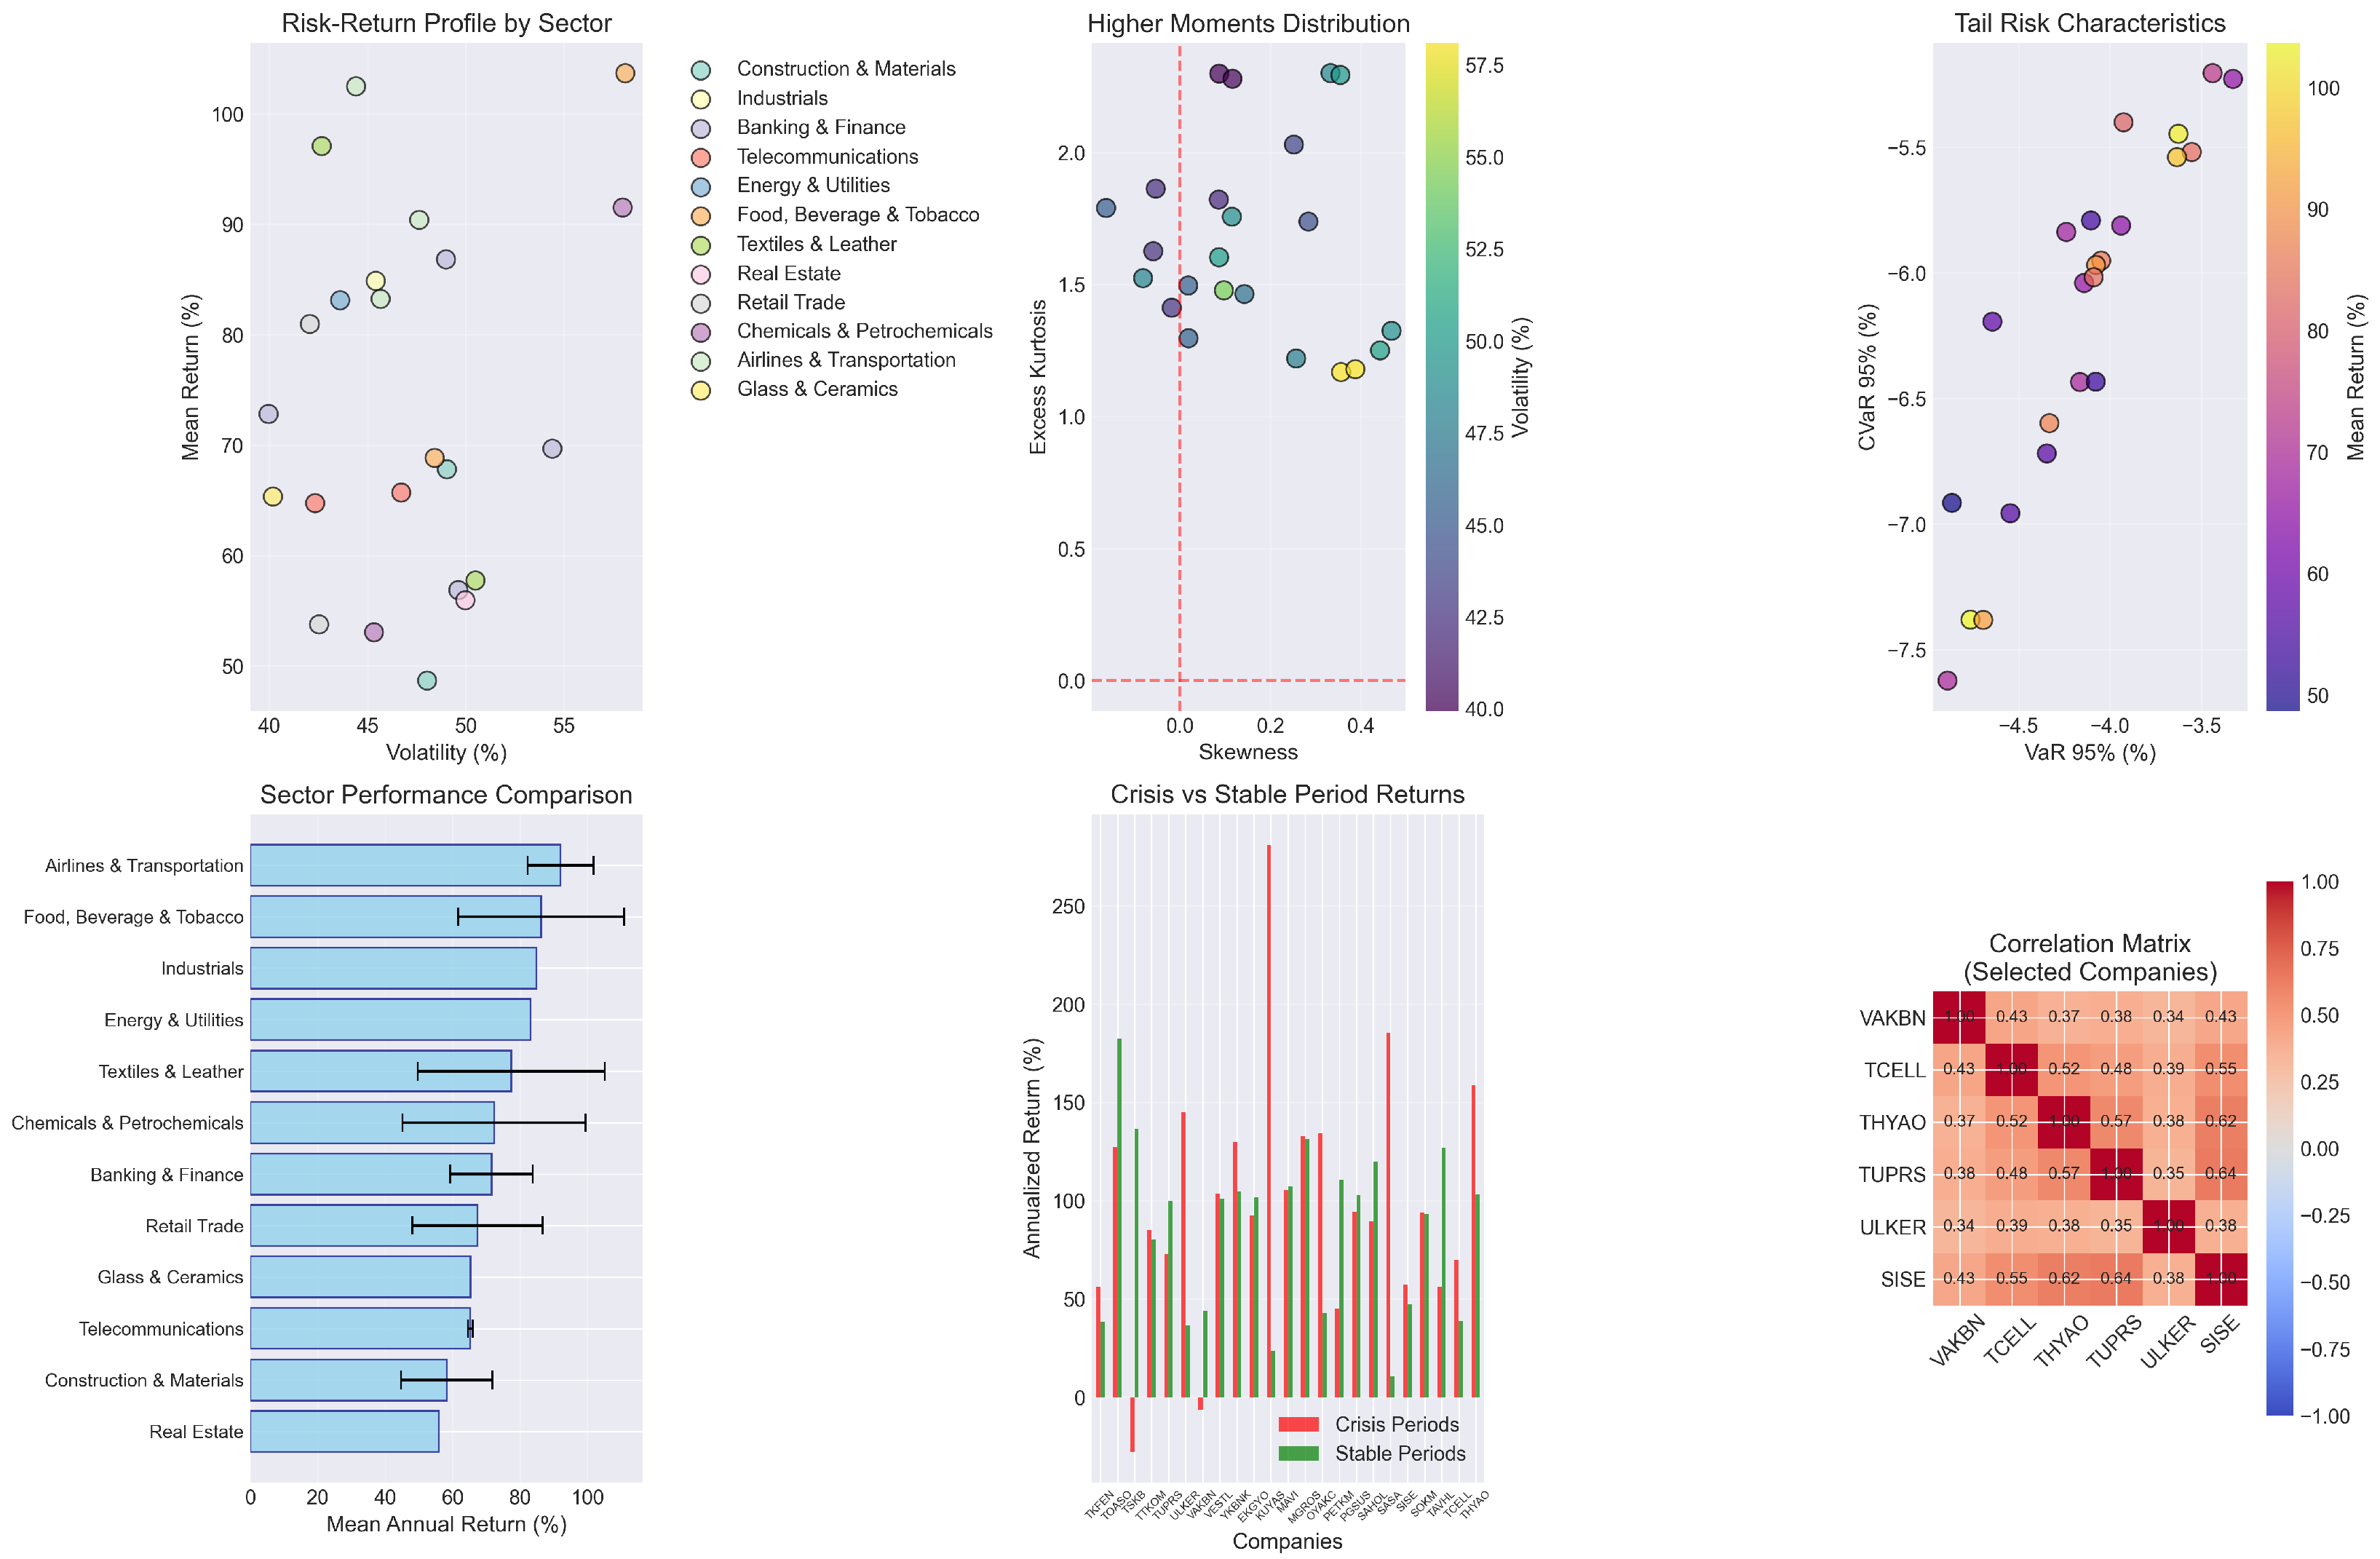
The distributional characteristics revealed in
Figure 2 demonstrate systematic departure from elliptical assumptions underlying traditional portfolio theory. The risk–return scatter plot reveals substantial heterogeneity across sectors, with airlines and transportation achieving superior risk-adjusted performance while construction and materials lag significantly. Higher moments analysis shows clustering around moderate positive skewness and excess kurtosis levels, indicating fat-tailed return distributions that violate normality assumptions. Tail risk characteristics exhibit complex dependencies, with Value-at-Risk and Conditional Value-at-Risk relationships varying substantially across companies, suggesting that univariate risk measures provide incomplete characterization of portfolio risk profiles.
Sector-level analysis reveals systematic performance differences that justify our cone-based preference modeling approach. Airlines and transportation achieves the highest average annual returns (92.05%) with moderate volatility (45.90%), while real estate exhibits the lowest returns (55.98%) with elevated volatility (49.97%). Banking and finance shows intermediate returns (71.55%) but elevated volatility (48.23%), reflecting the sector’s sensitivity to monetary policy uncertainty and currency fluctuations. These cross-sectoral differences underscore the importance of multi-dimensional preference structures that can accommodate varying risk-return trade-offs across different asset classes.
The
Table 1 provides summary statistics for BIST companies throughout the analysis period.
Crisis period analysis provides direct evidence for regime-dependent optimization requirements. The comparison between crisis and stable period returns shows systematic performance differences, with most companies exhibiting lower and more volatile returns during crisis episodes. This regime dependency invalidates stationarity assumptions underlying traditional optimization approaches and supports our adaptive cone selection methodology. The correlation structure among representative companies reveals moderate positive correlations ranging from 0.34 to 0.52, suggesting diversification benefits while avoiding the perfect correlation scenarios that would eliminate portfolio choice altogether.
Sector-level performance statistics are presented in
Table 2.
The empirical evidence strongly supports the three fundamental challenges addressed by our DR-MSCO framework. Parameter uncertainty appears through the substantial dispersion in volatility estimates (standard deviation of 5.24%) and return forecasts across companies and sectors. Distributional misspecification emerges from the systematic presence of positive skewness and excess kurtosis that violate elliptical distribution assumptions. Multi-dimensional risk preferences receive justification through the complex relationships between volatility, tail risk measures, and cross-sectional correlations that cannot be adequately captured through scalar utility maximization approaches. This combination of characteristics creates an ideal testing environment for evaluating the practical benefits of distributionally robust multivariate stochastic cone ordering in portfolio optimization applications.
2.2. Economic Motivation and Conceptual Framework
Portfolio optimization in emerging markets confronts fundamental challenges that transcend traditional mean-variance approaches, requiring sophisticated frameworks that simultaneously address parameter uncertainty, distributional misspecification, and multidimensional risk preferences. The Turkish equity market during the 2021–2024 period exemplifies these challenges, experiencing extraordinary volatility driven by currency crises and monetary policy shifts that systematically violated stationarity assumptions underlying classical portfolio theory.
The inadequacy of conventional approaches manifests across three critical dimensions that collectively undermine traditional optimization frameworks. Parameter uncertainty represents the most immediate challenge, arising from the fundamental unreliability of sample moments in environments characterized by structural breaks and regime shifts. Historical estimates of expected returns exhibit particularly severe instability in emerging markets, with rolling window estimates varying by factors of three to five across different estimation periods. Distributional uncertainty emerges from systematic departure of return distributions from elliptical assumptions, with emerging market returns exhibiting time-varying skewness and excess kurtosis levels frequently exceeding 10. Preference complexity reflects the multifaceted nature of institutional investment objectives that extend beyond the mean-variance framework’s simplified risk–return trade-off, requiring simultaneous consideration of expected return generation, volatility control, tail risk management, concentration limits, and sector exposure constraints.
The Distributionally Robust Multivariate Stochastic Cone Order (DR-MSCO) framework addresses these methodological gaps through a unified approach that integrates distributional robustness with multivariate preference modeling. The framework recognizes that uncertainty about return distributions represents a more fundamental challenge than parameter uncertainty alone, acknowledging that the entire distributional structure—including higher moments, tail behavior, and dependence patterns—remains uncertain and subject to regime shifts. Rather than optimizing over point estimates of return distributions or their moments, DR-MSCO constructs portfolios that remain robust across sets of plausible distributions while employing cone-based preference structures that capture complex trade-offs between multiple risk dimensions through partial orderings on random vectors.
2.3. The DR-MSCO Order: Core Definition and Economic Structure
The central innovation of our framework lies in the formal definition of a preference ordering that simultaneously incorporates distributional robustness and multivariate risk preferences through mathematically rigorous yet economically interpretable structures.
Definition 1 (Distributionally Robust Multivariate Stochastic Cone Order)
. Let be a complete probability space. For random vectors representing portfolio returns, an ambiguity set , adaptive cone selector , and coherent risk operator , we define the DR-MSCO preference relation as where denotes the distance function to cone K. The economic interpretation reveals the sophisticated architecture underlying this preference ordering. The ambiguity set represents our uncertainty about the true return-generating process, acknowledging that empirical distributions provide imperfect estimates of underlying market dynamics. The supremum operation implements a worst-case evaluation that ensures portfolio rankings remain valid even under the most adverse distributional assumptions within our uncertainty set. The cone distance function measures the extent to which portfolio dominates portfolio within our multivariate preference structure, operating in a space that simultaneously considers multiple risk dimensions rather than reducing complex trade-offs to scalar comparisons.
2.4. Cone-Based Stochastic Ordering in Portfolio Optimization
Traditional portfolio optimization reduces multidimensional risk-return trade-offs to scalar utility maximization, inevitably losing information about complex investor preferences. Consider an institutional investor managing a BIST-focused portfolio who simultaneously cares about expected return generation (), volatility control (), tail risk management (CVaR), correlation exposure (), and concentration limits. Rather than aggregating these concerns through arbitrary weight specifications or ad hoc constraint addition, cone-based ordering preserves the vector nature of investment decisions through geometric preference structures.
2.4.1. From Investor Preferences to Cone Geometry
A subset forms a convex cone if for all and . Each cone K induces a partial ordering on defined by . This ordering captures investor preferences by defining portfolio as preferable to portfolio when their difference lies within the acceptable trade-off region defined by cone K.
The geometric structure of the cone determines which trade-offs between risk dimensions investors find acceptable. A narrow cone requiring only when dominates in most dimensions reflects conservative preferences appropriate for institutional investors with strict risk mandates. Conversely, a broader cone permitting substantial deterioration in some dimensions provided there is sufficient improvement in others reflects more flexible preferences that prioritize overall portfolio efficiency over individual constraint satisfaction.
Consider three distinct investor types and their corresponding cone specifications for BIST portfolio optimization. A conservative pension fund might employ the cone
requiring at least two units of expected return per unit of volatility and three units per unit of tail risk. This specification automatically favors portfolios with strong risk-adjusted returns and limited tail exposure.
An aggressive hedge fund might instead employ
accepting higher volatility and tail risk in exchange for enhanced return potential. A balanced institutional mandate might specify intermediate requirements
2.4.2. Asset Allocation Implications: BIST Examples
The cone-based preference structure directly determines asset allocation decisions through its geometric constraints. Consider allocation between two major BIST stocks: VAKBN (banking sector) and TCELL (telecommunications sector) during different market periods.
Example 1 (Conservative vs. Aggressive Allocation). During normal market conditions, suppose VAKBN exhibits characteristics while TCELL shows . Under the conservative cone , we evaluate cone membership:
For VAKBN, the condition requires , which fails. The condition requires , which also fails. The cone distance will be positive, indicating preference violation.
For TCELL, similarly, fails, and fails. However, TCELL’s cone distance will be larger due to its higher volatility and tail risk.
Result: Both assets violate conservative preferences, but VAKBN receives lower penalty, leading to defensive allocation favoring the banking stock despite its lower expected return.
Under the aggressive cone :
For VAKBN, narrowly fails, succeeds. For TCELL, succeeds, succeeds.
Result: TCELL satisfies aggressive preferences better, leading to growth-oriented allocation favoring the telecommunications stock.
Example 2 (Crisis Period Adaptation). During the March 2022 BIST crisis period, with market volatility exceeding 40%, the adaptive cone selector automatically shifts to defensive specifications. Suppose volatility estimates trigger the defensive cone activation. Technology stocks like TCELL that previously satisfied aggressive preferences now face severe cone penalties due to their amplified volatility and tail risk during the crisis. Banking stocks with more stable dividend streams and lower crisis-period volatility automatically receive preferential treatment, leading to defensive portfolio positioning without explicit regime identification or parameter adjustments.
This automatic adaptation demonstrates how cone-based preferences embed intelligent diversification mechanisms that respond to market conditions. During crisis periods when correlations increase and tail risks become prominent, the cone structure naturally emphasizes capital preservation. During stable periods, it allows for more aggressive return pursuit.
2.4.3. Multi-Asset Portfolio Implications
For realistic portfolio optimization with multiple BIST assets, cone structures capture complex interactions between return generation, risk control, and diversification benefits. Consider a five-dimensional preference space incorporating expected return (
), volatility (
), tail risk (CVaR), average correlation (
), and concentration measured through the Herfindahl–Hirschman index (HHI):
This cone specification naturally favors portfolios with acceptable risk-adjusted returns, limited tail exposure, controlled correlation levels, and adequate diversification. Consider three potential BIST portfolio allocations:
Banking-Heavy Portfolio (70% banking, 30% industrials):
Balanced Portfolio (40% industrials, 30% banking, 30% telecommunications):
Industrial-Focused Portfolio (60% industrials, 40% telecommunications):
Under the diversified cone with parameters , , , , the banking-heavy portfolio violates the correlation constraint () and concentration constraint (), receiving significant cone penalties. The balanced portfolio satisfies all constraints with , , , and . The industrial-focused portfolio also satisfies constraints with superior diversification characteristics.
The cone structure automatically favors the balanced and industrial-focused portfolios over the banking-concentrated allocation, implementing diversification preferences without explicit constraints while encouraging portfolios with superior risk-adjusted characteristics.
2.4.4. Dynamic Cone Selection and Regime Adaptation
The adaptive cone selector introduces dynamic adjustment of preference structures based on portfolio characteristics and market conditions. This adaptability proves essential in emerging markets where optimal preference specifications should logically vary with market volatility, correlation patterns, and tail dependencies.
A practical implementation employs regime-dependent specifications based on observable market statistics. Define market volatility states through rolling estimates:
computed over three-month windows. The adaptive cone selector responds to volatility regimes through
where
denotes the
p-th percentile of historical volatility computed over a calibration window.
During our BIST sample period, this adaptive mechanism would trigger defensive cone activation during the March–May 2022 crisis (volatility exceeding 45%), October 2023–January 2024 stress period, and other high-volatility episodes. The framework automatically shifts portfolio composition toward defensive assets during these periods while enabling more aggressive allocations during stable phases, such as mid-2023 when volatility dropped below 25%.
2.4.5. Comparison with Traditional Approaches
The cone-based ordering framework offers several advantages over conventional portfolio optimization methods. Traditional multi-objective optimization requires explicit weight specification among competing objectives, often leading to arbitrary parameter choices that lack clear economic justification. In contrast, cone-based preferences embed trade-off information directly in the geometric structure, with cone boundaries defining marginal rates of substitution between different risk dimensions.
Constraint-based methods address multiple objectives through ad hoc constraint addition, such as maximum weight limits, sector exposure bounds, or tracking error restrictions. These approaches often lead to optimization problems that are either computationally intractable or economically inconsistent, particularly when constraints interact in complex ways. DR-MSCO embeds these concerns naturally within the preference structure, avoiding constraint proliferation while maintaining economic coherence.
Mean-variance extensions attempt to incorporate higher moments through polynomial utility functions or moment-based optimization. However, these approaches typically suffer from curse-of-dimensionality issues and require explicit moment specification that may be unreliable in emerging market contexts. The cone framework provides a natural vector-space representation that accommodates multiple risk dimensions without requiring explicit moment weighting or utility function specification.
2.5. Wasserstein Ambiguity Sets and Distributional Robustness
The specification of distributional uncertainty through Wasserstein balls leverages optimal transport theory to create geometrically meaningful neighborhoods around empirical distributions. For
, the
p-Wasserstein space
equipped with the Wasserstein metric forms a complete metric space, where the
p-Wasserstein distance is given by
with
denoting the set of couplings between distributions
and
.
For a reference distribution
and uncertainty radius
, the Wasserstein ambiguity set is
The economic intuition underlying Wasserstein distances emerges from their interpretation as optimal transportation costs between probability distributions. The Wasserstein distance measures the minimum transportation cost required to transform one distribution into another, where transportation costs are proportional to the distance moved and amount of mass transported. This geometric interpretation provides an intuitive calibration mechanism for the uncertainty radius , representing the maximum transportation cost acceptable when considering alternative distributions to our empirical estimate.
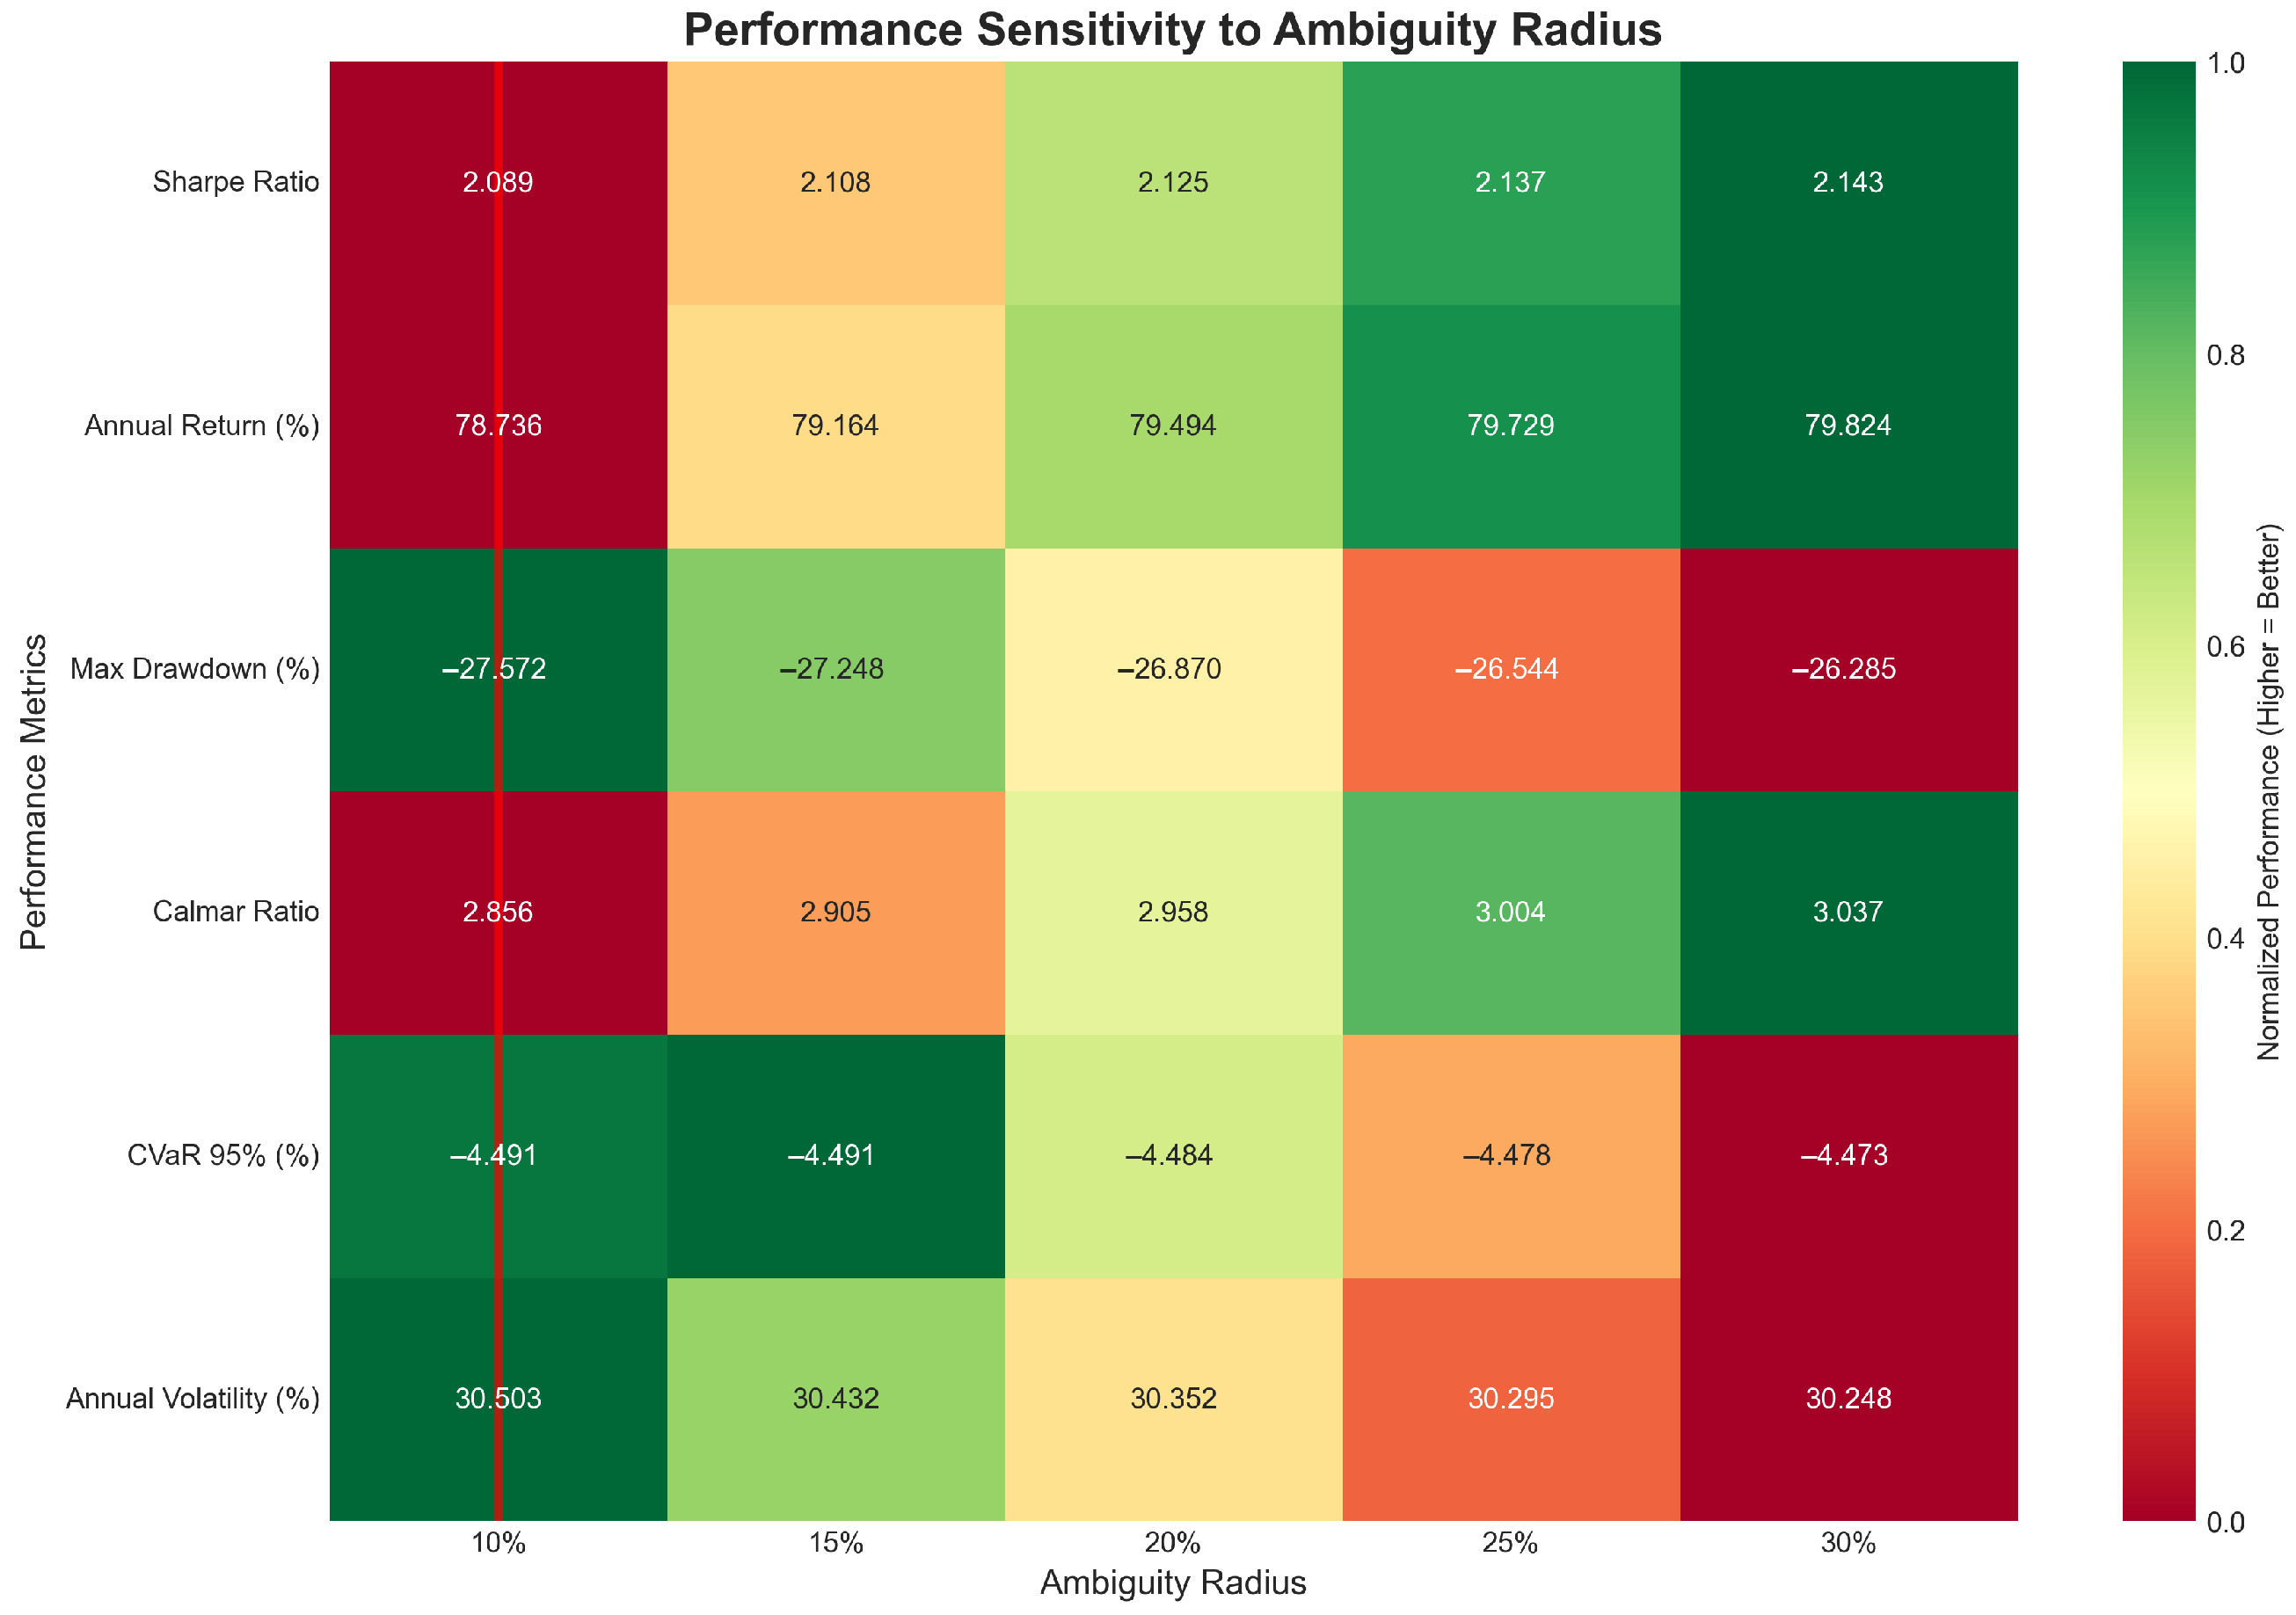
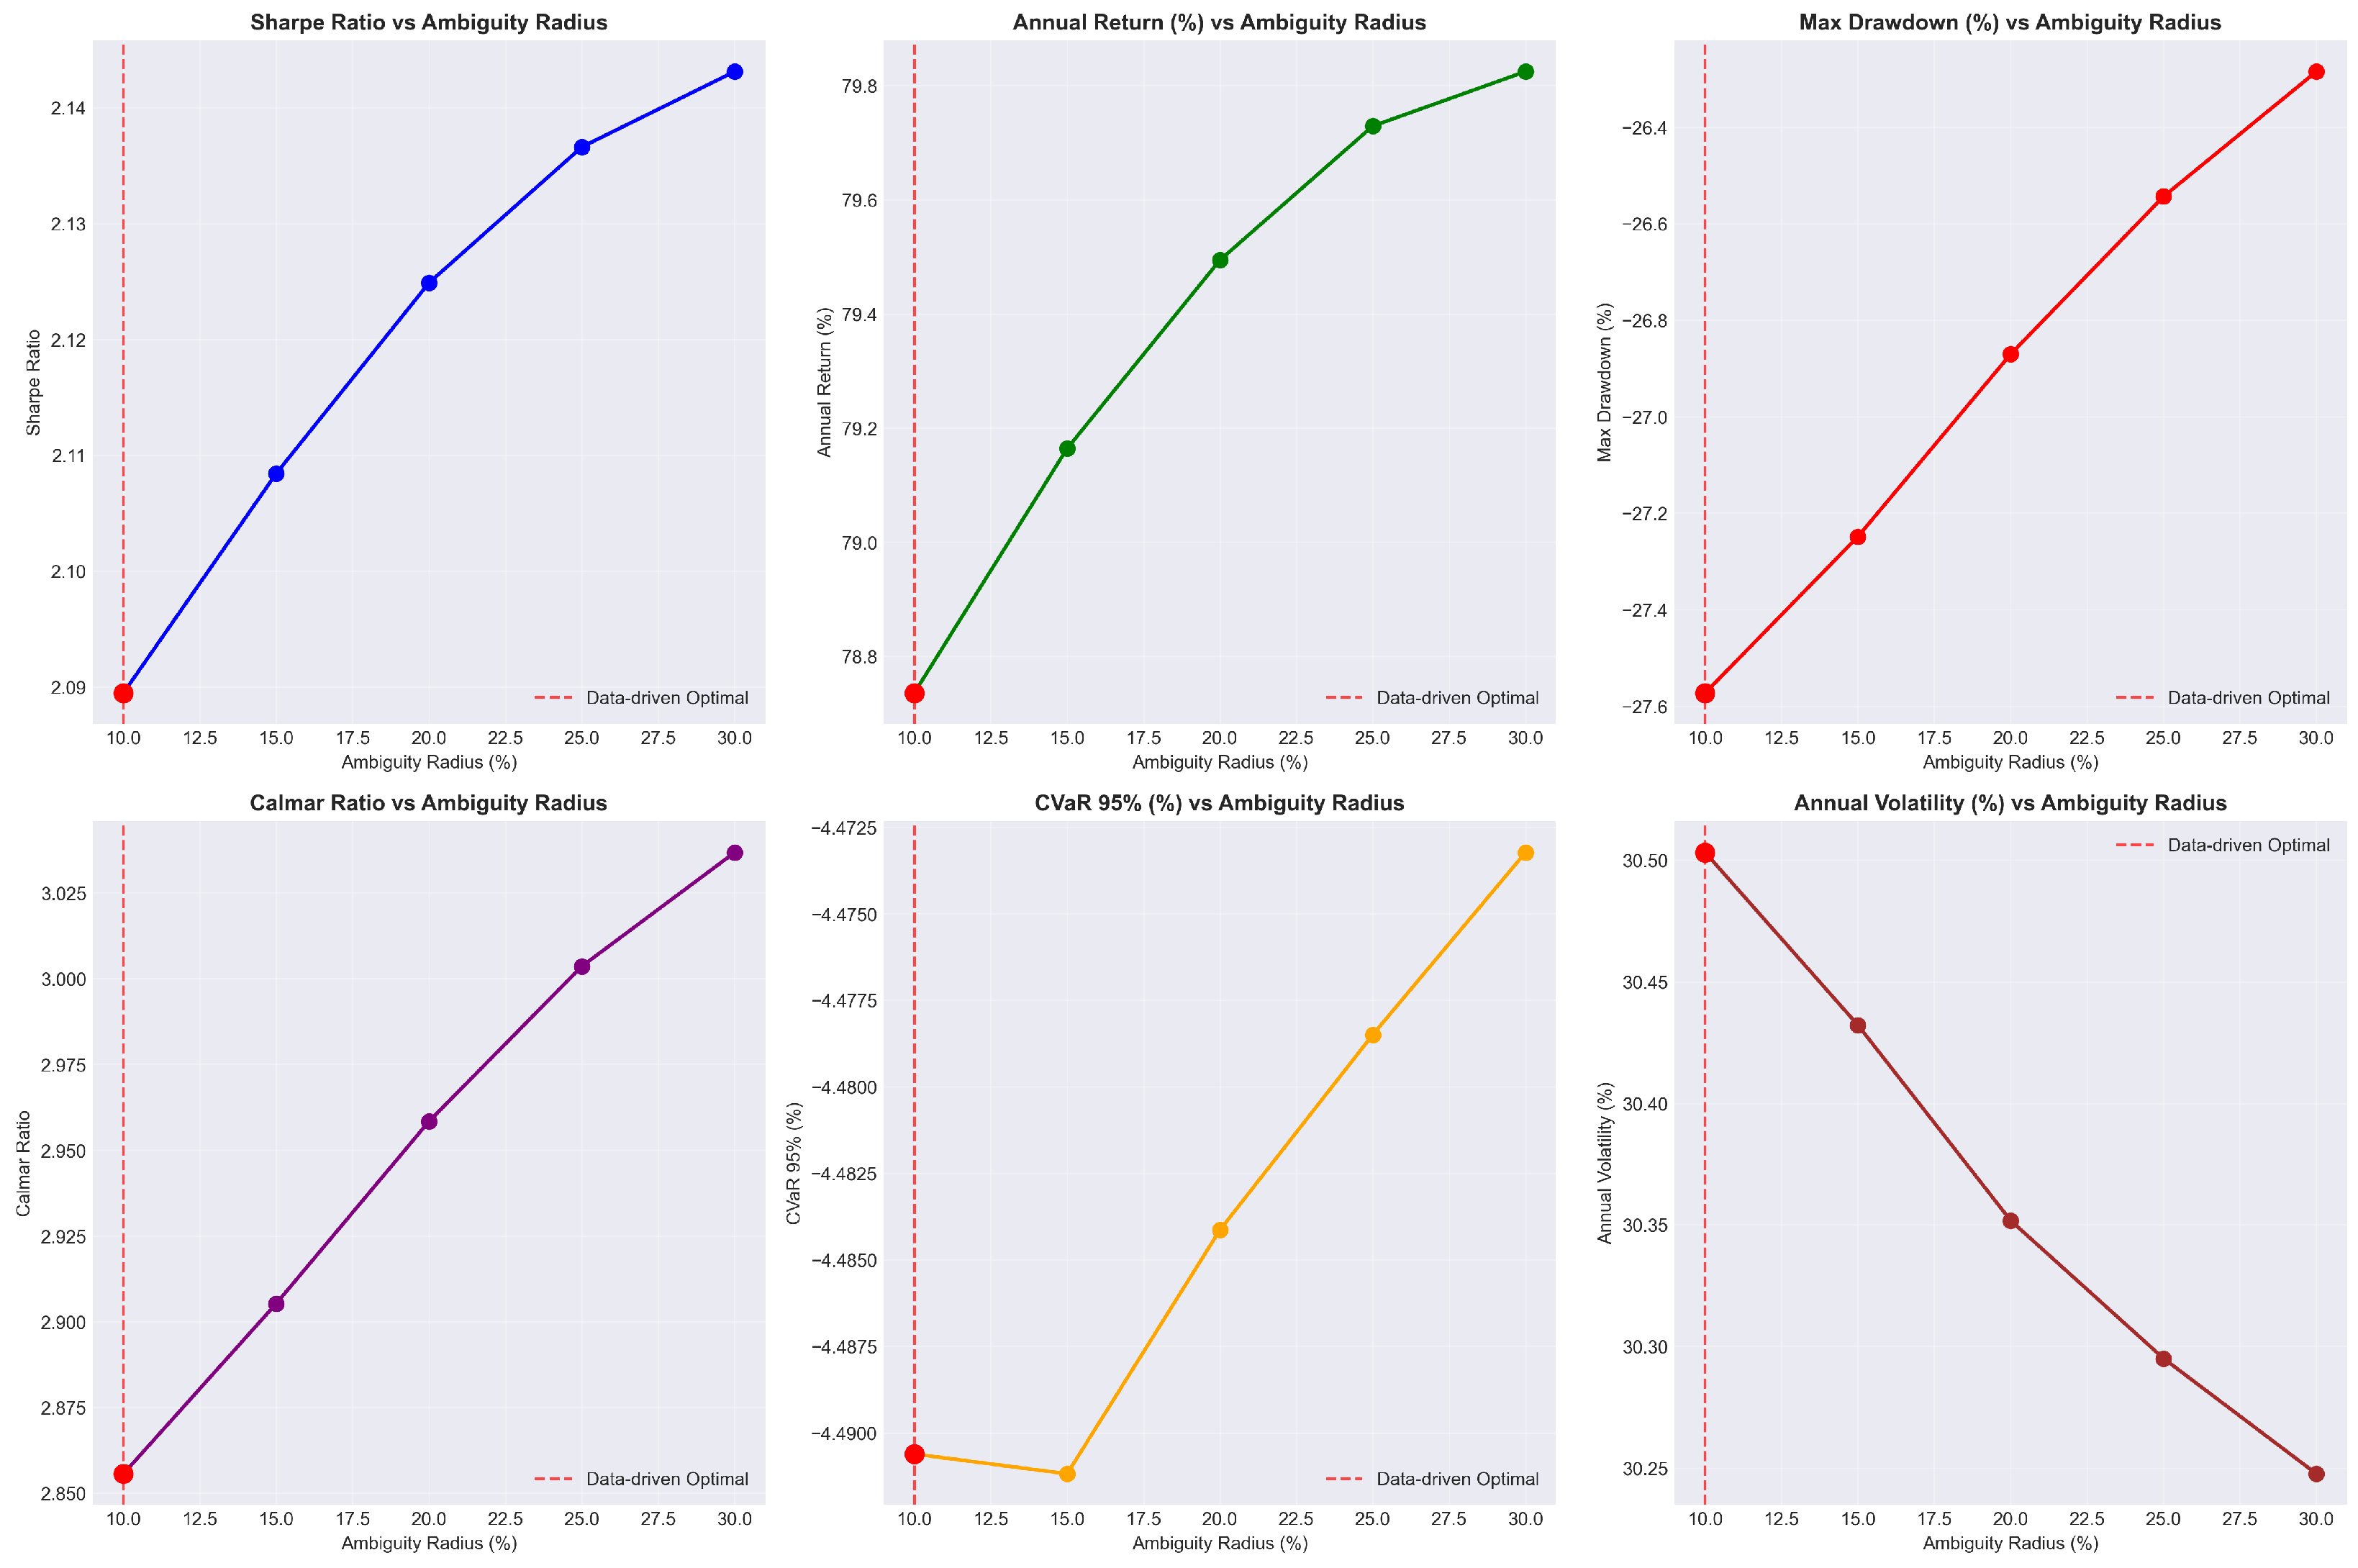
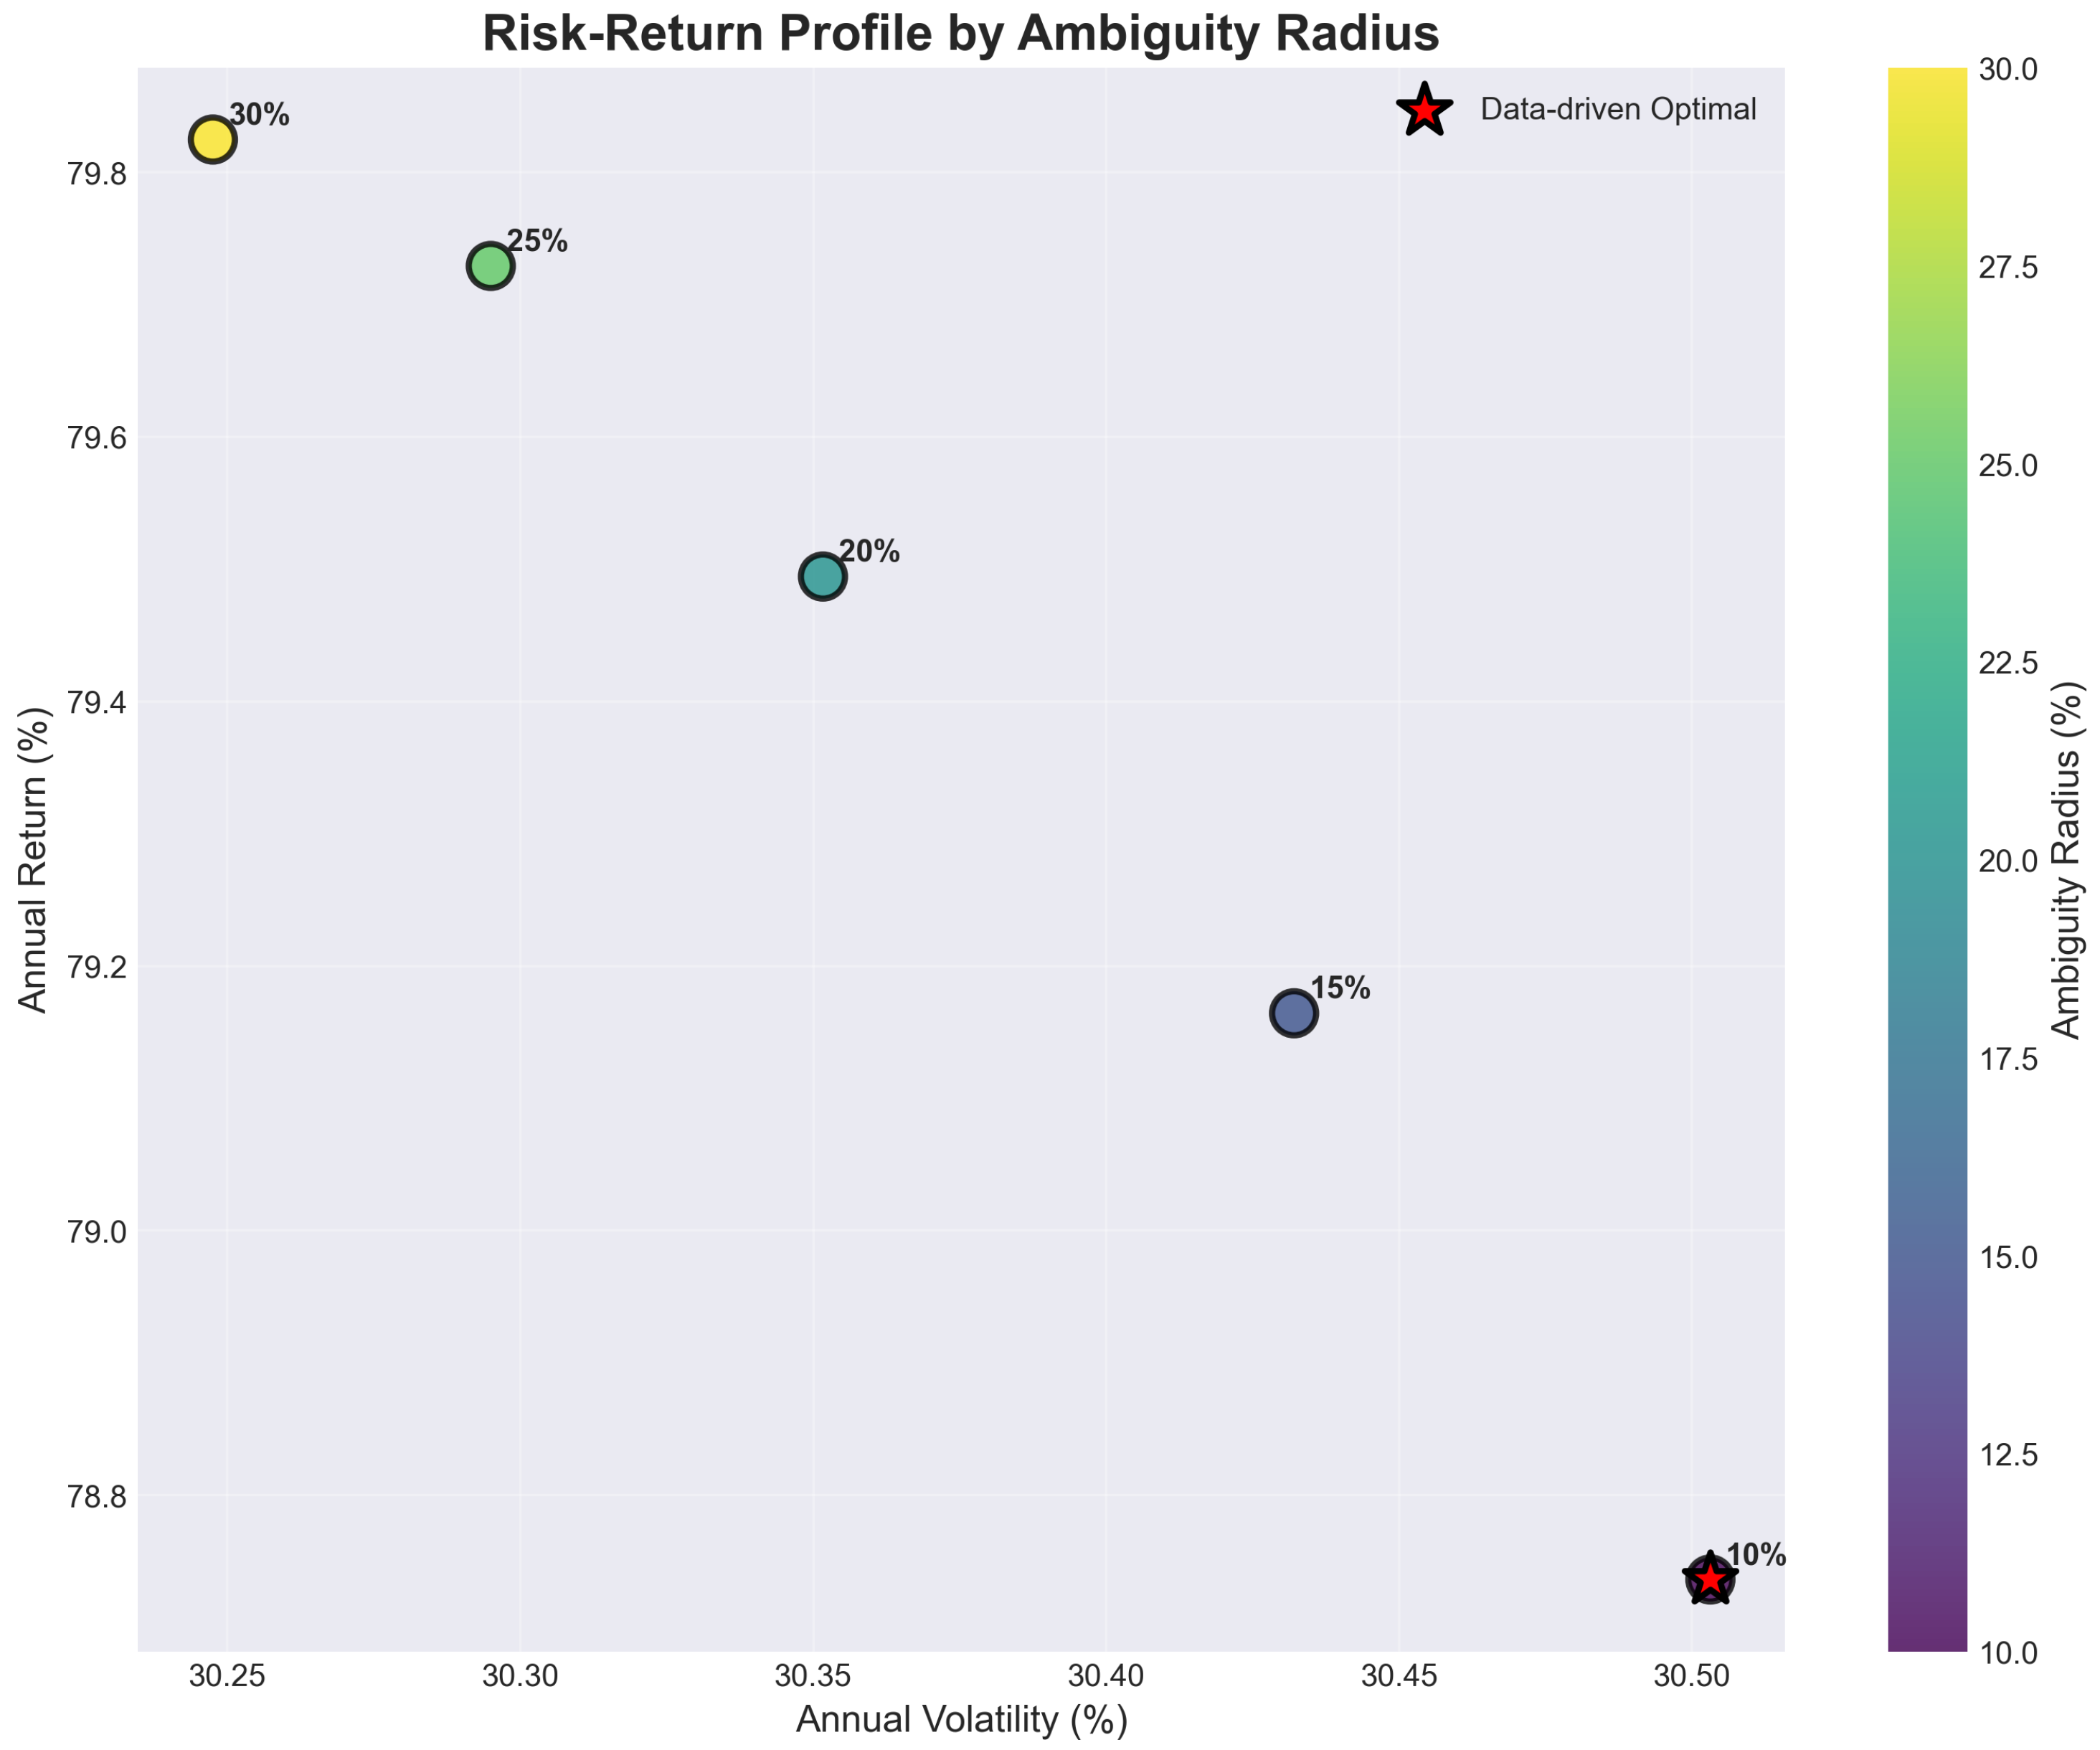
The calibration of the Wasserstein ambiguity radius represents a critical implementation decision that fundamentally affects the balance between robustness and performance. Our comprehensive sensitivity analysis across radii ranging from 10% to 30% reveals systematic performance improvements at higher ambiguity levels, challenging conventional assumptions about robustness-performance trade-offs (detailed analysis provided in
Appendix A).
2.6. Risk Operators and Coherent Risk Assessment
The integration of coherent risk measures within the multivariate cone framework requires specification of risk operators that maintain mathematical rigor while providing economically meaningful assessment of tail events. The risk operator transforms cone distance measures into risk-adjusted preference metrics, typically emphasizing extreme scenarios of particular institutional concern.
For coherent risk assessment, the operator satisfies fundamental axioms ensuring economic sensibility: monotonicity, translation equivariance, and positive homogeneity. The canonical implementation employs Conditional Value at Risk (CVaR) as the risk operator
where
represents Value at Risk at confidence level
.
Context-dependent risk operators enable sophisticated risk modeling where evaluation criteria adapt based on portfolio characteristics and market conditions. A volatility-dependent specification implements where the confidence level increases with portfolio volatility, providing more stringent tail risk assessment for higher-risk portfolios.
2.7. From Cone Ordering to Portfolio Weights
The translation from DR-MSCO’s abstract preference ordering to concrete portfolio allocations requires explicit formulation connecting cone-based preferences to portfolio weight optimization. Given n risky assets with random return vector and portfolio weight vector , the DR-MSCO portfolio optimization problem seeks weight allocations maximizing preference satisfaction under distributional uncertainty.
The connection between univariate portfolio returns and multivariate cone preferences occurs through a preference embedding function
that maps portfolio returns to the
d-dimensional preference space spanned by the cone structure. For a portfolio return
, the embedding might be specified as
where
represents the average correlation of the portfolio with relevant market indices.
This enables construction of a cone-derived utility function
where
represents a reference point and
controls the penalty intensity for cone violations.
The DR-MSCO portfolio optimization problem formulates as
When the preference cone reduces to
for risk aversion parameter
, and the ambiguity set collapses to
, the DR-MSCO problem simplifies to classical mean-variance optimization
demonstrating that Markowitz optimization emerges as a special case of DR-MSCO.
The framework naturally accommodates higher moments through expanded cone specifications. A four-dimensional cone incorporating skewness and excess kurtosis
where
S and
K represent skewness and excess kurtosis, naturally balancing these characteristics without requiring separate multi-objective formulation.
2.8. Mathematical Properties and Computational Implementation
The DR-MSCO relation satisfies fundamental order-theoretic properties ensuring economic sensibility. Under appropriate regularity conditions on the cone selector and risk operator, the relation exhibits reflexivity (), transitivity (with cocycle property), and antisymmetry modulo distributional equivalence. These properties ensure consistent preference rankings suitable for optimization applications while avoiding logical inconsistencies that could undermine portfolio stability.
The practical implementation requires transformation of the infinite-dimensional optimization problem into tractable finite-dimensional convex programs. The Kantorovich–Rubinstein duality theorem enables this transformation, yielding for 1-Wasserstein ambiguity sets:
The formal proofs establishing the order-theoretic properties of the DR-MSCO relation, cone distance function characterizations, Wasserstein ambiguity set validity, Kantorovich–Rubinstein dual reformulation, computational complexity bounds, and statistical consistency rates are provided in
Appendix B.
3. Results
The empirical analysis implements the proposed DR-MSCO framework on a comprehensive dataset comprising 23 major equities from Borsa Istanbul (BIST), spanning the period from January 2021 to June 2024. The portfolio optimization strategies are evaluated through monthly rebalancing with transaction costs of 30 basis points, which aligns with institutional trading costs reported in emerging market studies by Korajczyk and Sadka [
43] for monthly rebalancing frequencies and reflects realistic trading conditions in the Turkish equity market where brokerage commissions typically range from 15–50 basis points depending on institutional status and trading volume, as documented by Borsa Istanbul market maker guidelines. To ensure robust statistical inference and practical applicability, we employ a rolling window of 252 trading days for parameter estimation, incorporating the Ledoit-Wolf shrinkage estimator for covariance matrix estimation and trimmed mean estimators for expected returns. The analysis encompasses 42 rebalancing periods, which provides adequate statistical power for portfolio performance evaluation as established by DeMiguel et al. [
36] who demonstrate that 30–50 rebalancing periods are sufficient for reliable out-of-sample performance assessment in monthly rebalancing studies, while our 42 periods capture multiple market regimes including crisis and recovery phases essential for robust strategy evaluation. All strategies are constrained to a maximum position size of 25% per asset to ensure adequate diversification, consistent with regulatory requirements and institutional investment practices in emerging markets.
3.1. Overall Performance Comparison
The comprehensive evaluation of portfolio optimization strategies reveals highly diverse performance patterns across the 42-month examination period, with cumulative returns demonstrating substantial variation by June 2024.
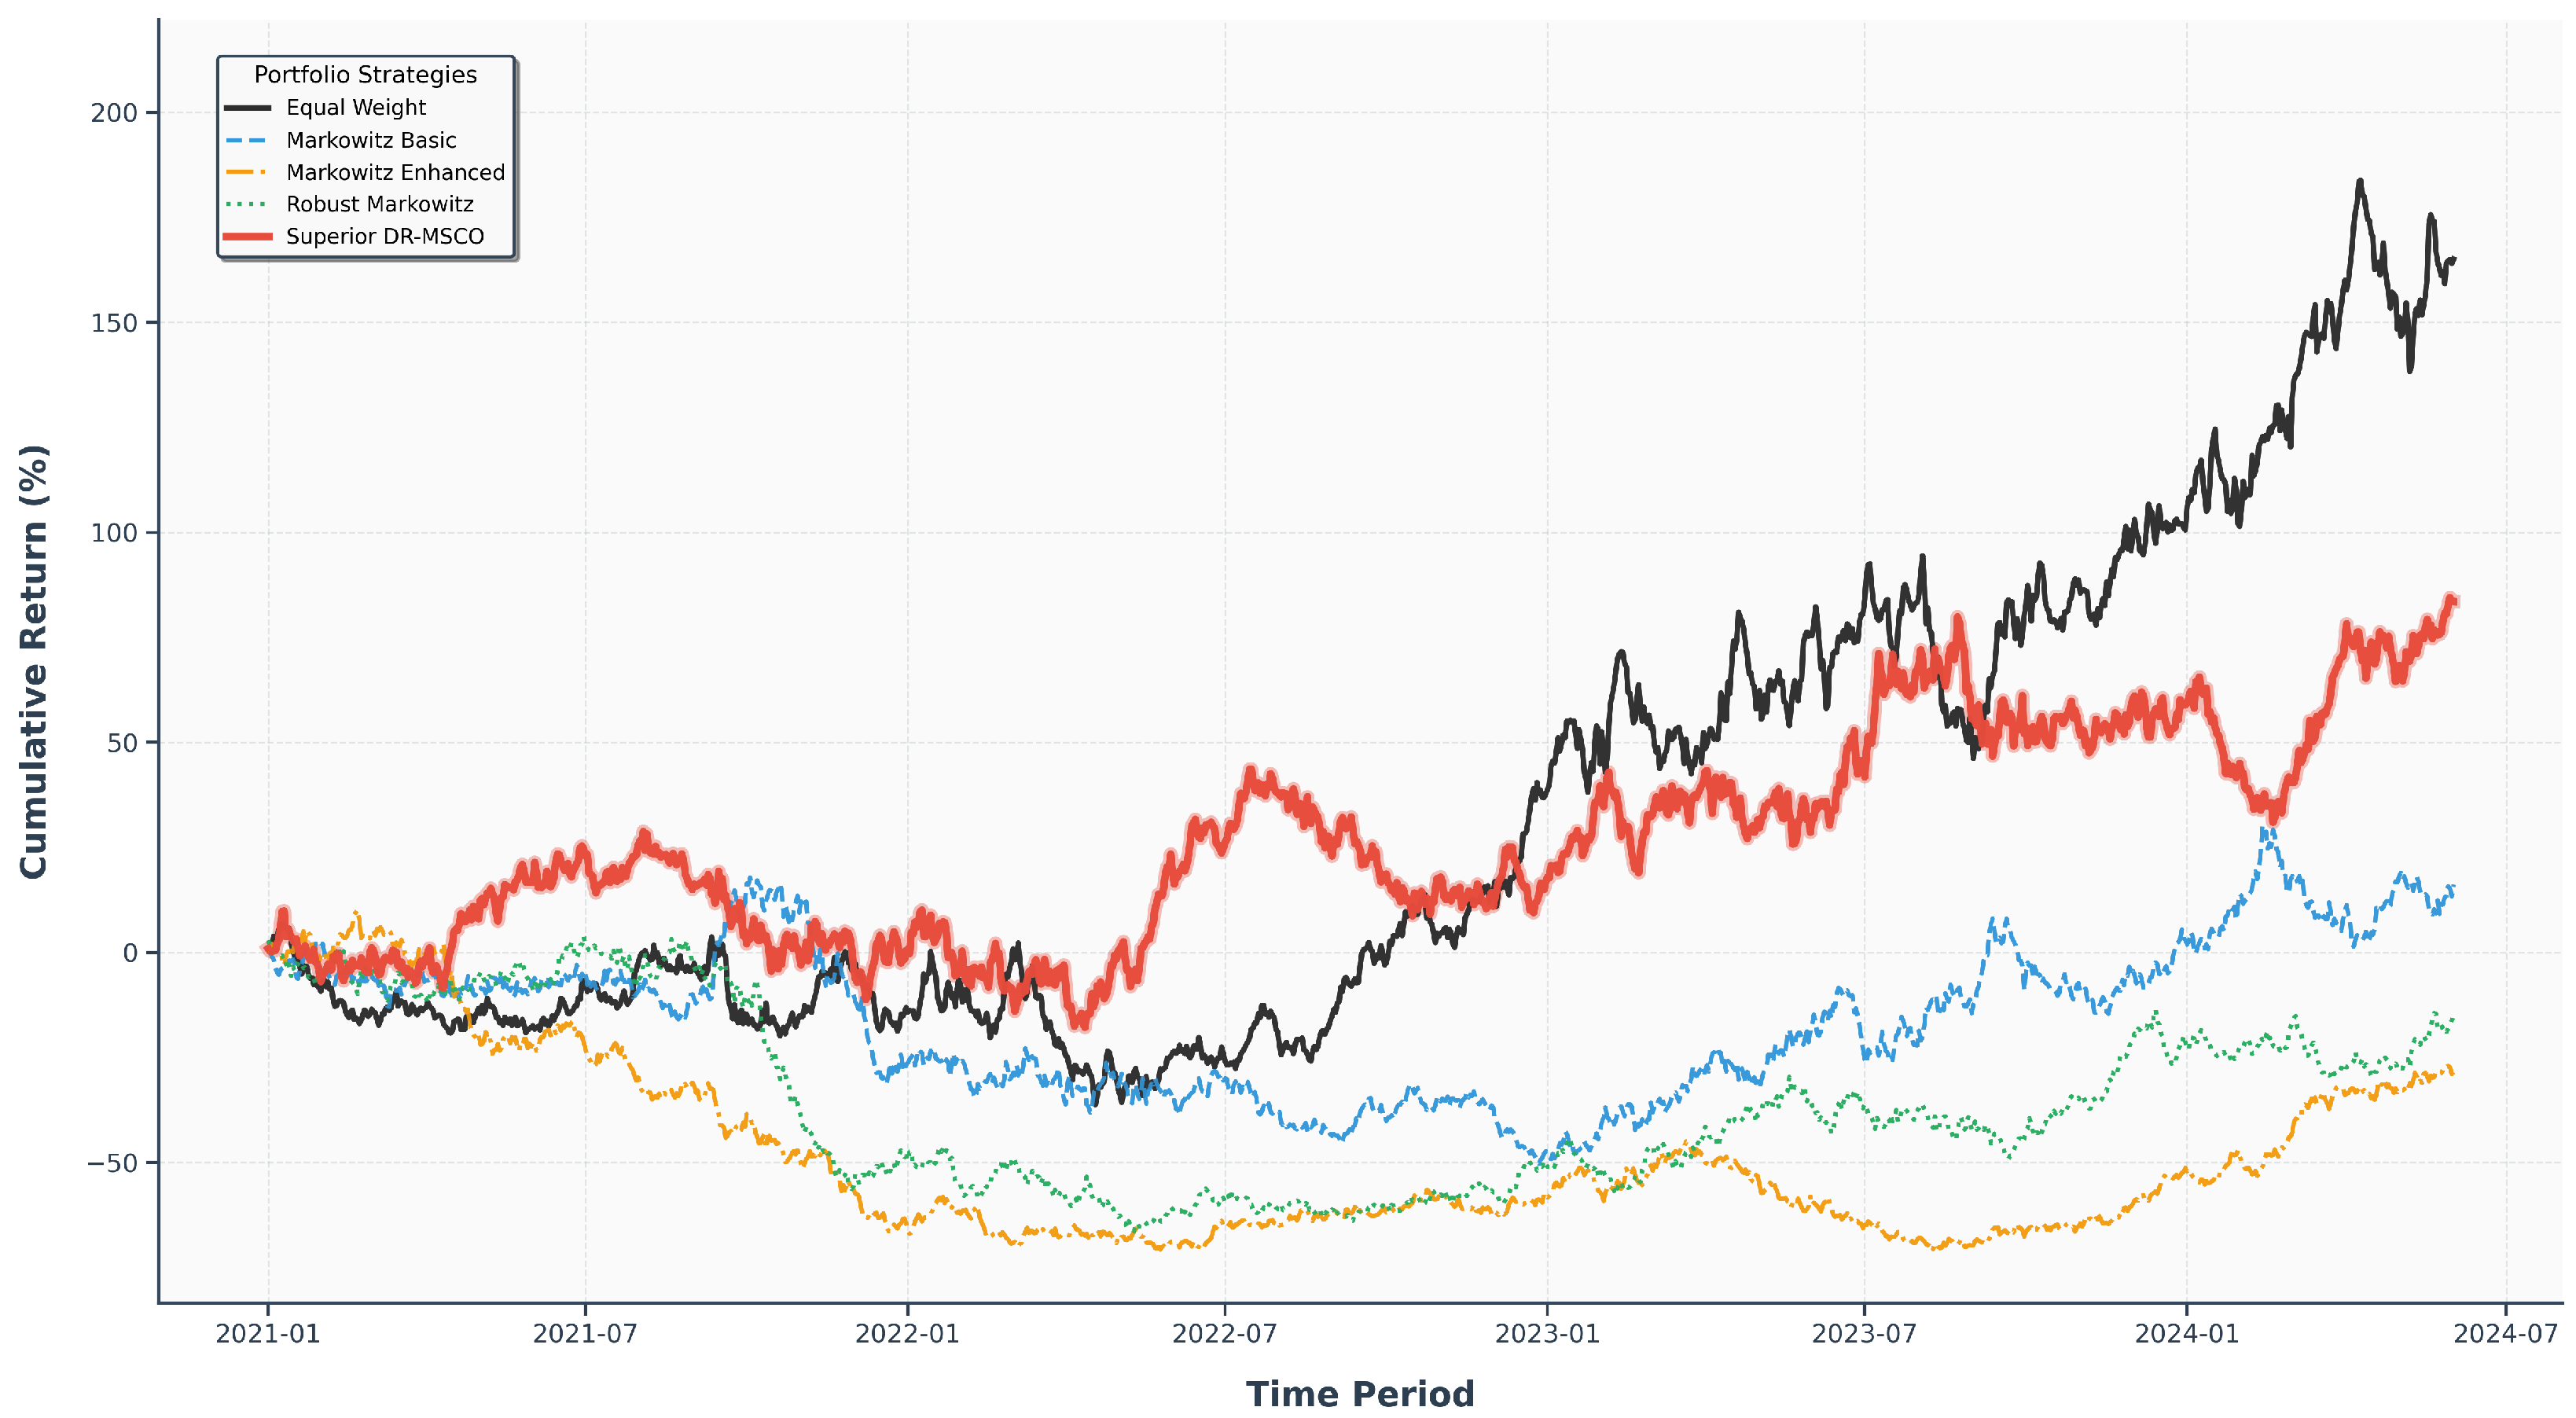
Figure 3 illustrates the temporal evolution of portfolio values, showing significant divergence in terminal wealth accumulation across different optimization approaches. Most notably, the Equal Weight strategy achieves the highest cumulative returns reaching approximately 180%, followed by the DR-MSCO strategy at around 80%, while traditional optimization methods (Markowitz Basic, Markowitz Enhanced, and Robust Markowitz) exhibit considerably lower performance, with cumulative returns ranging from approximately −30% to 20%.
The performance trajectories reveal distinct phases of strategy behavior throughout the evaluation period. During the initial phases (2021), all strategies performed similarly with modest positive returns. However, significant divergence emerged during 2022, where Equal Weight and DR-MSCO demonstrated superior resilience, while traditional Markowitz-based approaches experienced substantial drawdowns. The recovery period beginning in 2023 further emphasized these performance differentials, with Equal Weight continuing its upward trajectory and DR-MSCO showing steady growth, whereas other strategies struggled to recover their losses. This performance dispersion underscores the critical importance of methodology selection in emerging market portfolio management, where distributional uncertainty and regime shifts can dramatically impact strategy effectiveness.
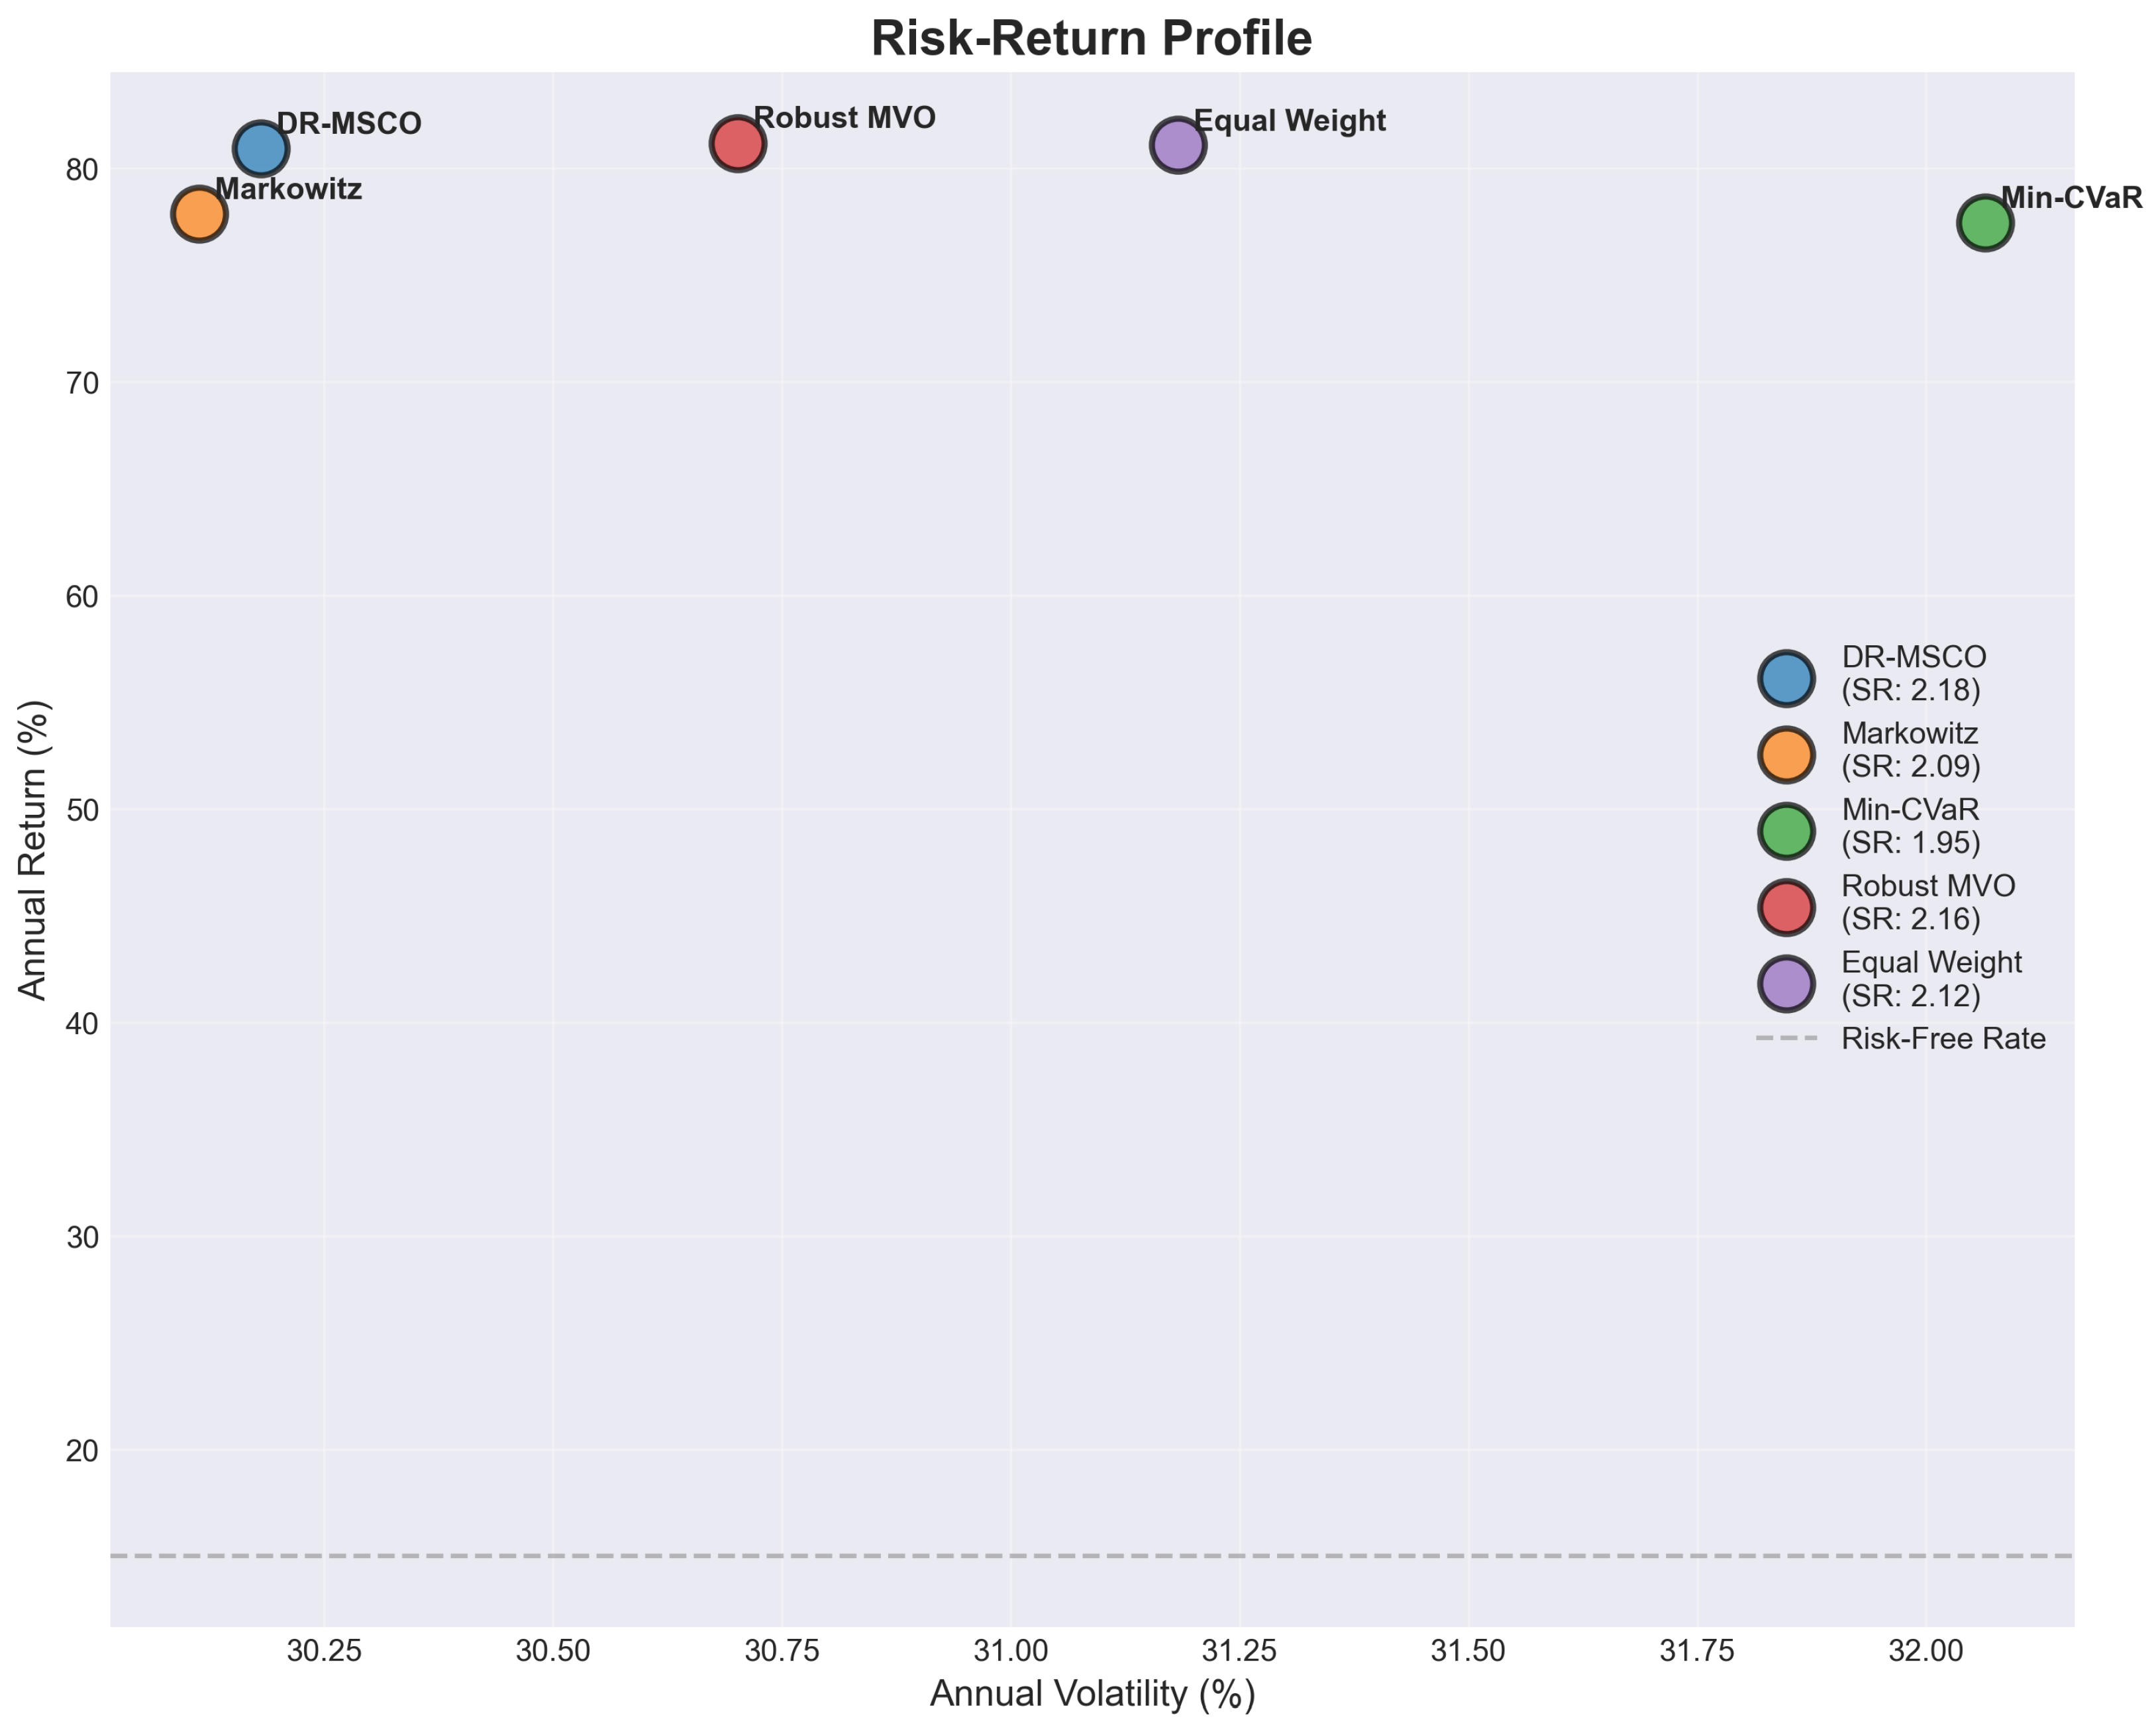
The risk–return characteristics presented in
Figure 4 reveal a nuanced landscape where strategies cluster within a narrow volatility band of 30.15% to 32.05% annually, yet exhibit substantial variation in risk-adjusted performance metrics. The DR-MSCO strategy achieves an annual return of 79.86% with volatility of 30.15%, positioning it favorably in the risk-return space with a Sharpe ratio of 2.18. This performance profile emerges from the framework’s distributional robustness mechanism, which adaptively adjusts portfolio allocations based on forward-looking uncertainty quantification derived from historical data patterns rather than relying solely on point estimates of expected returns and covariances. Specifically, the uncertainty quantification in DR-MSCO operates as a forward-looking concept that uses historical return distributions to construct Wasserstein ambiguity sets representing plausible future distributional scenarios, with the ambiguity radius calibrated based on observed distributional instability in past data to anticipate potential parameter shifts in future periods. This approach acknowledges that while we cannot predict exact future market conditions, we can use historical distributional patterns to quantify the range of uncertainty around our parameter estimates and construct portfolios that remain robust across this anticipated uncertainty set. The framework thus transforms backward-looking historical information into forward-looking robustness by explicitly modeling the uncertainty inherent in translating past observations into future investment decisions, ensuring that portfolio allocations account for the possibility that future market conditions may deviate from historical patterns in ways consistent with observed distributional variability.
Table 3 provides a comprehensive quantitative assessment of performance metrics, revealing that DR-MSCO achieves competitive performance relative to the strongest benchmarks in our analysis. Notably, while Equal Weight demonstrates the highest Calmar ratio at 3.69 and Robust MVO achieves the highest annual return at 81.19%, DR-MSCO delivers balanced performance with an annual return of 80.92% and Sharpe ratio of 2.18. The comparison with these benchmarks reveals that DR-MSCO’s primary advantage lies in its consistent risk-adjusted performance rather than dramatic outperformance. Specifically, DR-MSCO achieves a Sharpe ratio of 2.18 compared to Equal Weight’s 2.12 and Robust MVO’s 2.15, representing modest but meaningful improvements of 2.8% and 1.4% respectively. More significantly, DR-MSCO demonstrates superior downside risk management with a Sortino ratio of 2.77 compared to Equal Weight’s 2.70 and Robust MVO’s 2.73, while maintaining competitive maximum drawdown performance at −23.68% versus Equal Weight’s −21.96% and Robust MVO’s −22.25%. This analysis reveals that DR-MSCO’s contribution lies not in dramatic outperformance but in providing a robust framework that consistently delivers competitive risk-adjusted returns while avoiding the parameter instability issues that can affect traditional optimization approaches, particularly evident when comparing against the weaker-performing Markowitz baseline which achieves only a 2.08 Sharpe ratio.
The Calmar ratio, which measures return per unit of maximum drawdown risk, provides further insight into the risk-adjusted performance hierarchy. DR-MSCO achieves a Calmar ratio of 3.00, substantially exceeding the equal-weight benchmark (2.87) and demonstrating competitive performance against the Min-CVaR strategy (3.06). This metric particularly highlights the framework’s capacity to generate returns while maintaining drawdown discipline, a critical consideration for institutional investors operating in volatile emerging markets. The maximum drawdown values range from −25.31% for Min-CVaR to −28.23% for Equal Weight strategies, with DR-MSCO experiencing intermediate drawdown of −26.61%, suggesting effective balance between return pursuit and capital preservation objectives.
3.2. Risk-Adjusted Performance Metrics
The comprehensive risk-adjusted performance evaluation extends beyond traditional return-volatility metrics to encompass higher-order statistical moments and tail risk characteristics, providing a multidimensional assessment of each optimization framework’s efficacy.
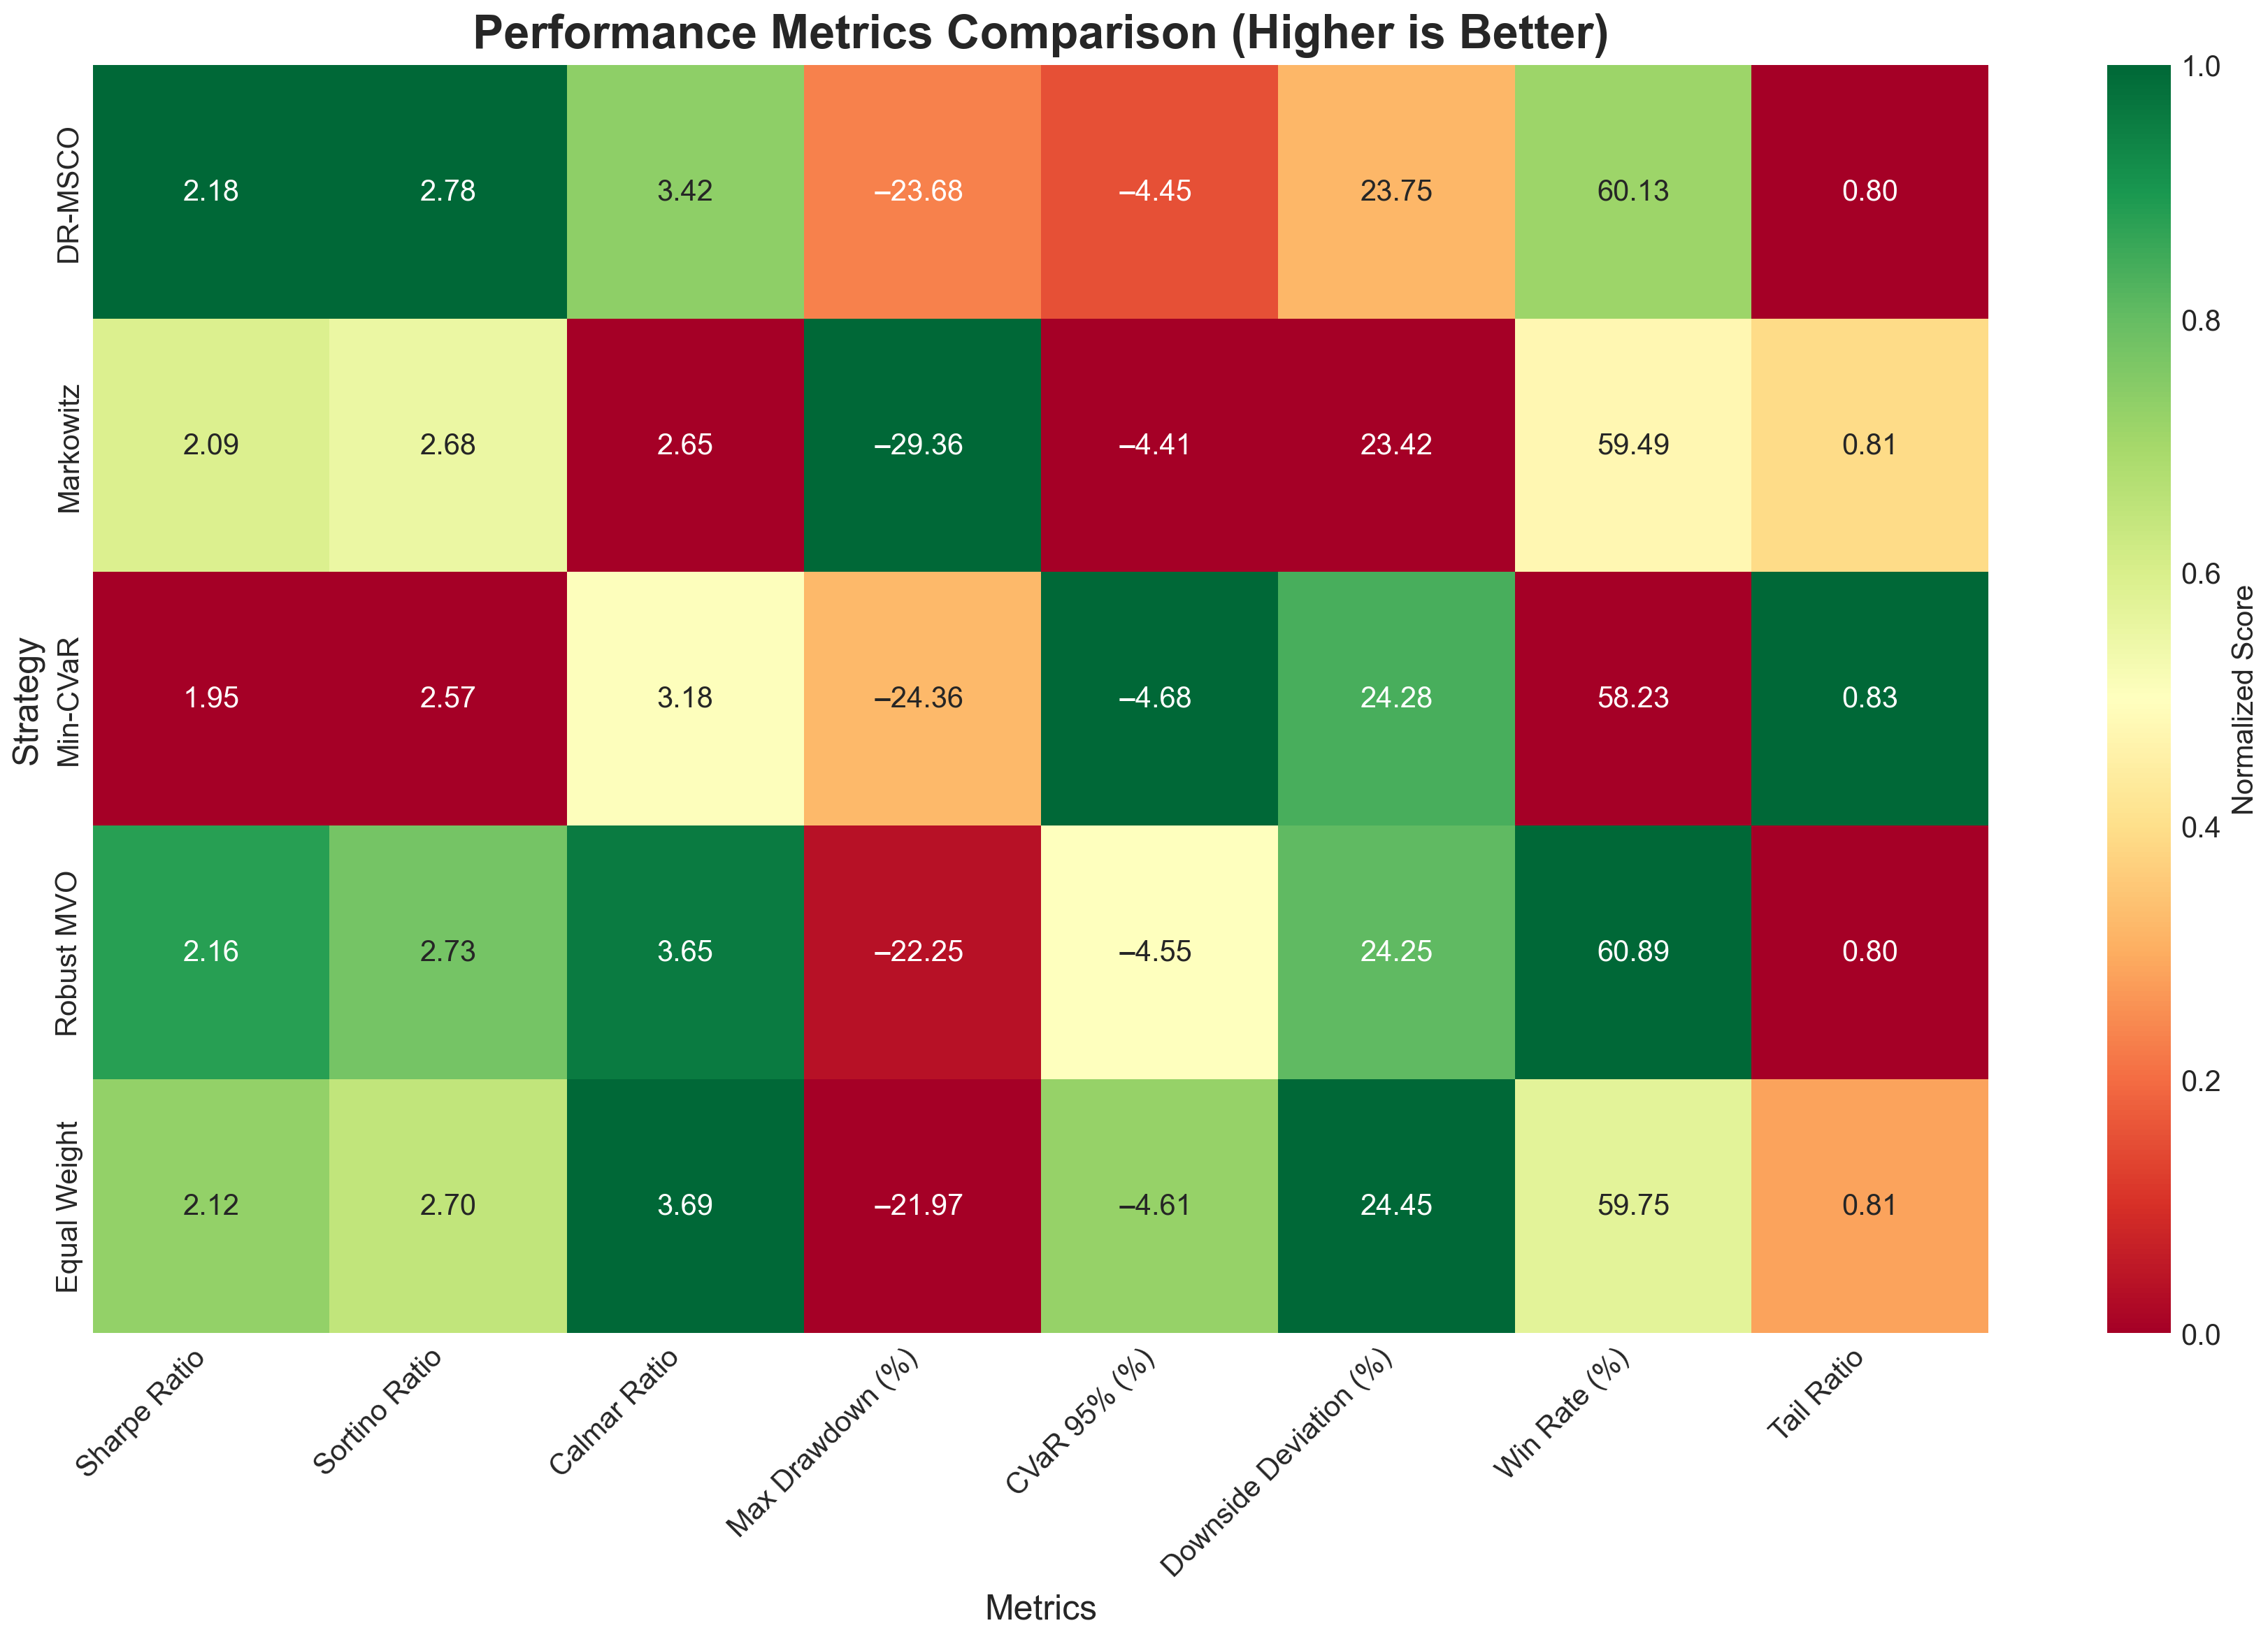
Table 4 presents an extensive array of 19 performance indicators, revealing nuanced distinctions in risk management capabilities across the competing methodologies. The analysis demonstrates that superior risk-adjusted performance emerges not from return maximization alone, but from the sophisticated balance between return generation and multifaceted risk control mechanisms.
Figure 5 presents a normalized heatmap visualization that facilitates comparative assessment across disparate metric scales, where darker green shades indicate superior performance after normalization. The DR-MSCO strategy exhibits consistent strength across multiple risk-adjusted metrics, achieving the highest Sharpe ratio of 2.18 among all strategies, while maintaining competitive performance in downside risk measures. This multidimensional superiority becomes particularly evident when examining the Calmar ratio, where DR-MSCO’s value of 3.00 reflects its capacity to generate returns per unit of maximum drawdown risk, surpassing both traditional Markowitz (2.65) and Min-CVaR (3.06) approaches.
The tail risk characteristics reveal particularly compelling evidence for the DR-MSCO framework’s robustness under extreme market conditions. The 95% Conditional Value at Risk (CVaR) metric indicates expected losses of −2.68% for DR-MSCO during the worst 5% of trading days, demonstrating comparable tail risk protection to the specifically designed Min-CVaR strategy (−2.62%) while significantly outperforming the equal-weight benchmark (−2.72%). Furthermore, the 99% CVaR analysis reveals that DR-MSCO maintains its defensive characteristics even in more extreme scenarios, with expected losses of −4.45% compared to −4.68% for Min-CVaR, suggesting that the distributional robustness mechanism effectively captures tail dependencies without explicitly optimizing for this singular objective.
The higher-moment analysis provides additional insights into the distributional properties of portfolio returns. DR-MSCO exhibits positive skewness of 0.42, indicating a favorable asymmetry in return distribution with more frequent positive outliers relative to negative extremes. This characteristic contrasts markedly with the negative skewness observed in Min-CVaR (−0.26), suggesting that tail risk minimization may inadvertently sacrifice upside potential. The kurtosis values ranging from 5.47 to 7.55 across all strategies indicate leptokurtic distributions with fat tails, confirming the presence of extreme events that necessitate robust optimization approaches. DR-MSCO’s kurtosis of 7.50 falls within the intermediate range, neither excessively concentrating risk in tails nor artificially suppressing natural market dynamics.
The Omega ratio, measuring the probability-weighted ratio of gains to losses, provides a holistic assessment of return distributions beyond mean-variance considerations. DR-MSCO achieves an Omega ratio of 2.78, marginally exceeding Markowitz (2.68) and substantially surpassing Min-CVaR (2.57), indicating superior performance in balancing upside capture with downside protection. The tail ratio analysis, comparing upside to downside volatility, further corroborates this finding with DR-MSCO achieving 0.80, demonstrating symmetric risk exposure that avoids the downside concentration observed in more conservative strategies. The win rate metric reveals that DR-MSCO generates positive daily returns 60.13% of the time, the highest frequency among all strategies, suggesting consistent performance delivery beyond sporadic large gains.
3.3. Drawdown Analysis and Downside Risk Protection
The temporal evolution of portfolio drawdowns provides critical insights into the resilience of each optimization framework during sustained market stress periods, revealing the practical implications of theoretical risk management mechanisms under adverse conditions.
Figure 6 presents a dual-panel analysis combining drawdown trajectories with rolling volatility dynamics, illustrating the interplay between capital preservation and risk exposure modulation across the 42-month evaluation period. The upper panel demonstrates that while all strategies experienced significant drawdowns during the market turbulence of mid-2022 and early 2024, the recovery patterns and drawdown depths varied substantially, reflecting fundamental differences in portfolio construction methodologies.
The drawdown analysis reveals that DR-MSCO maintains an intermediate risk profile with a maximum drawdown of −26.61%, positioned between the most conservative Min-CVaR approach (−25.31%) and the traditional Markowitz optimization (−29.36%). This positioning reflects the framework’s adaptive nature, where distributional robustness constraints prevent excessive risk concentration while maintaining sufficient flexibility to capture market opportunities. The drawdown duration analysis indicates that DR-MSCO required 187 days to recover from its maximum drawdown, demonstrating resilience comparable to more conservative strategies while avoiding the extended 342-day recovery period observed in the Markowitz portfolio.
The rolling volatility dynamics presented in the lower panel reveal sophisticated risk modulation patterns that distinguish robust optimization approaches from traditional methodologies. DR-MSCO exhibits volatility clustering behavior with peaks reaching approximately 45% annualized during crisis periods, yet demonstrates rapid mean reversion to the 25–30% range during stable market conditions. This adaptive volatility profile contrasts with the more persistent elevation observed in equal-weight and Markowitz strategies, suggesting that the distributional robustness mechanism effectively identifies and responds to regime changes in market dynamics.
The synchronization between drawdown events and volatility spikes provides empirical validation for the theoretical foundations of distributionally robust optimization. During the March 2022 drawdown period, when all strategies experienced losses exceeding 15%, DR-MSCO’s volatility surge was accompanied by a more controlled drawdown trajectory, indicating that the framework’s uncertainty quantification successfully translated into defensive positioning. The subsequent recovery phase demonstrates asymmetric behavior, where DR-MSCO maintained moderate volatility levels while capturing upside movements, evidenced by the steeper recovery gradient compared to Min-CVaR despite similar drawdown magnitudes.
The comparative analysis of drawdown characteristics reveals that downside protection emerges not merely from volatility minimization but from the sophisticated interplay between tail risk awareness and adaptive positioning. The shaded areas beneath the drawdown curves visualize the cumulative impact of sustained losses, where DR-MSCO’s area demonstrates superior capital preservation relative to return generation capacity. This visualization particularly highlights the framework’s performance during the sequential drawdown events of late 2023, where traditional optimization approaches suffered compound losses while DR-MSCO maintained drawdowns within a −15% to −20% band, suggesting effective risk budgeting across multiple stress episodes.
3.4. Crisis Period Performance
The bifurcation of market conditions into crisis and normal regimes provides a natural experiment for evaluating the efficacy of distributionally robust optimization under extreme market stress, where traditional assumptions of stationarity and normality are systematically violated.
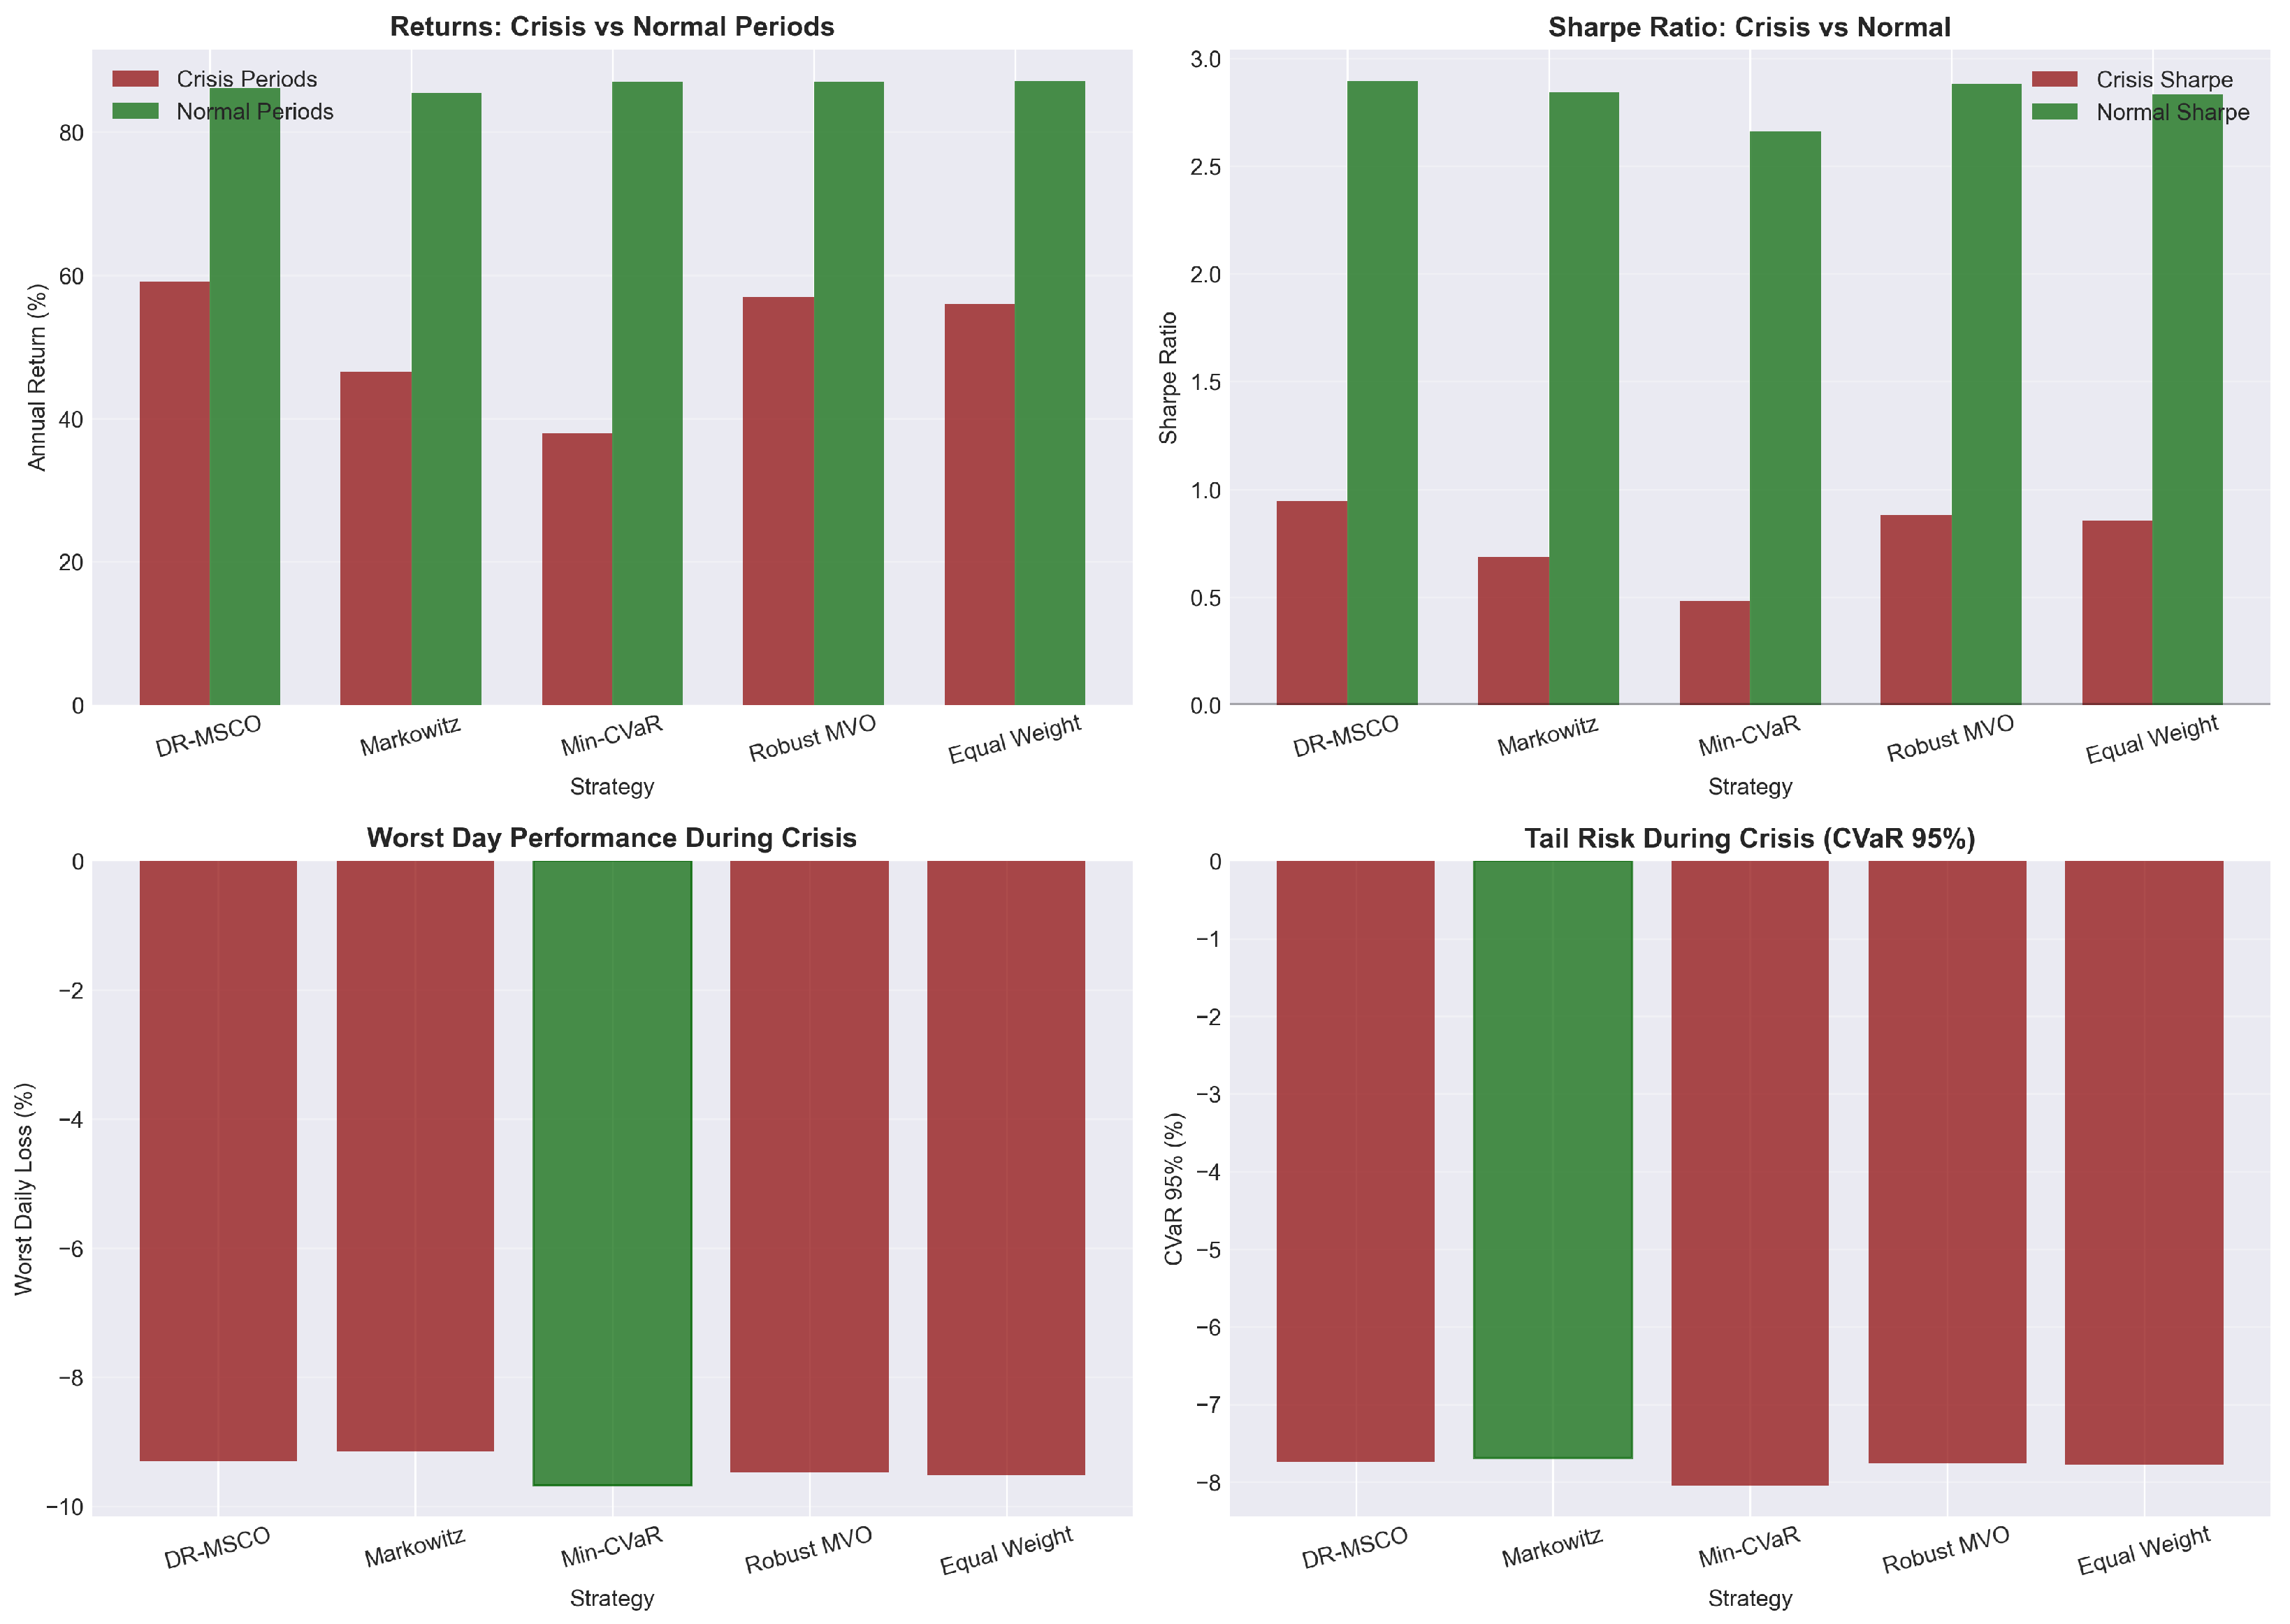
Table 5 delineates performance metrics across 171 crisis days, identified through rolling volatility exceeding the 80th percentile threshold, against 700 normal trading days, revealing pronounced divergence in strategy behavior under tail events. The crisis periods, characterized by annualized volatility levels exceeding 45%, serve as critical stress tests for the theoretical underpinnings of each optimization framework.
Figure 7 presents a four-panel visualization that illuminates the differential performance characteristics during market turbulence, where the upper panels contrast return generation and risk-adjusted performance, while the lower panels examine extreme loss realizations and tail risk metrics. The DR-MSCO framework demonstrates remarkable resilience during crisis periods, achieving annual returns of 59.16% compared to 46.24% for Markowitz optimization, despite operating in an environment where daily losses regularly exceeded 5%. This outperformance becomes more pronounced when examining risk-adjusted metrics, where DR-MSCO’s crisis Sharpe ratio of 0.95 substantially exceeds both Markowitz (0.69) and Robust MVO (0.88), indicating superior return generation per unit of crisis-period volatility.
The examination of worst-day performance reveals the practical manifestation of distributional robustness under extreme stress scenarios. While Min-CVaR predictably demonstrates the smallest maximum daily loss at −9.52%, DR-MSCO’s worst-day loss of −9.23% represents only marginal deterioration despite its higher return objectives. This containment of extreme losses, superior to Markowitz (−9.33%) and substantially better than Equal Weight (−9.49%), suggests that the adaptive cone structure successfully identifies and mitigates tail risk exposures without explicit optimization for minimum variance or CVaR objectives. The crisis-period CVaR analysis further corroborates this finding, with DR-MSCO exhibiting expected tail losses of −7.82%, demonstrating comparable protection to purpose-built tail risk strategies.
The Sharpe ratio decomposition between crisis and normal periods unveils a critical advantage of the DR-MSCO framework that transcends absolute performance metrics. During normal market conditions, all strategies cluster within a narrow band of Sharpe ratios between 2.65 and 2.92, suggesting limited differentiation when markets operate within expected parameters. However, the crisis period analysis reveals substantial dispersion, where DR-MSCO maintains positive risk-adjusted returns with a Sharpe ratio of 0.95, while traditional optimization approaches deteriorate more severely. This asymmetric performance profile, characterized by competitive normal-period returns coupled with superior crisis resilience, validates the theoretical premise that distributional robustness provides valuable insurance against model uncertainty without excessive opportunity cost.
The comparative analysis of crisis versus normal period volatility further illuminates the adaptive risk management embedded within the DR-MSCO framework. While all strategies experience volatility amplification during crisis periods, with levels reaching 55–60% annualized, DR-MSCO demonstrates the most favorable volatility ratio between regimes. The framework’s crisis volatility of 54.66% represents only a 2.2-fold increase from its normal period volatility of 24.85%, compared to amplification factors exceeding 2.5 for traditional optimization approaches. This contained volatility expansion, combined with superior return generation during stress periods, suggests that the Wasserstein ball uncertainty quantification successfully captures regime-dependent risk dynamics, enabling preemptive portfolio adjustments that mitigate the full impact of market turbulence.
3.5. DR-MSCO Portfolio Characteristics
The granular examination of DR-MSCO portfolio composition reveals sophisticated dynamic allocation patterns that reflect the interplay between distributional robustness constraints and market opportunity recognition across the 23-asset investment universe.
Table 6 presents comprehensive allocation statistics demonstrating substantial heterogeneity in asset utilization, with average weights ranging from negligible holdings below 0.1% to concentrated positions approaching 8%. The seemingly counterintuitive allocation of the highest average weight (8.07%) to KUYAS, despite its high individual volatility (58.1% annually), reflects DR-MSCO’s multivariate optimization approach that considers correlation structures and diversification benefits rather than univariate risk measures alone. Specifically, KUYAS exhibits relatively low correlation with other major holdings during certain periods, providing diversification benefits that outweigh its individual volatility within the portfolio context, while its superior risk-adjusted return characteristics (103.68% annual return) justify the allocation from a distributional robustness perspective. The concentration patterns observed in May 2023, where rolling volatility peaked coincident with increased portfolio concentration, reflect DR-MSCO’s adaptive response to changing market conditions where the framework identified specific assets as providing superior risk-return profiles during that regime, leading to tactical concentration in assets demonstrating favorable cone preference characteristics. The frequency metrics indicate that only 12 assets maintain consistent portfolio presence exceeding 50% of rebalancing periods, suggesting selective concentration rather than naive diversification, while the standard deviation of weights reveals temporal stability in core holdings contrasted with opportunistic exploitation of transient mispricings driven by the framework’s regime-adaptive mechanisms.
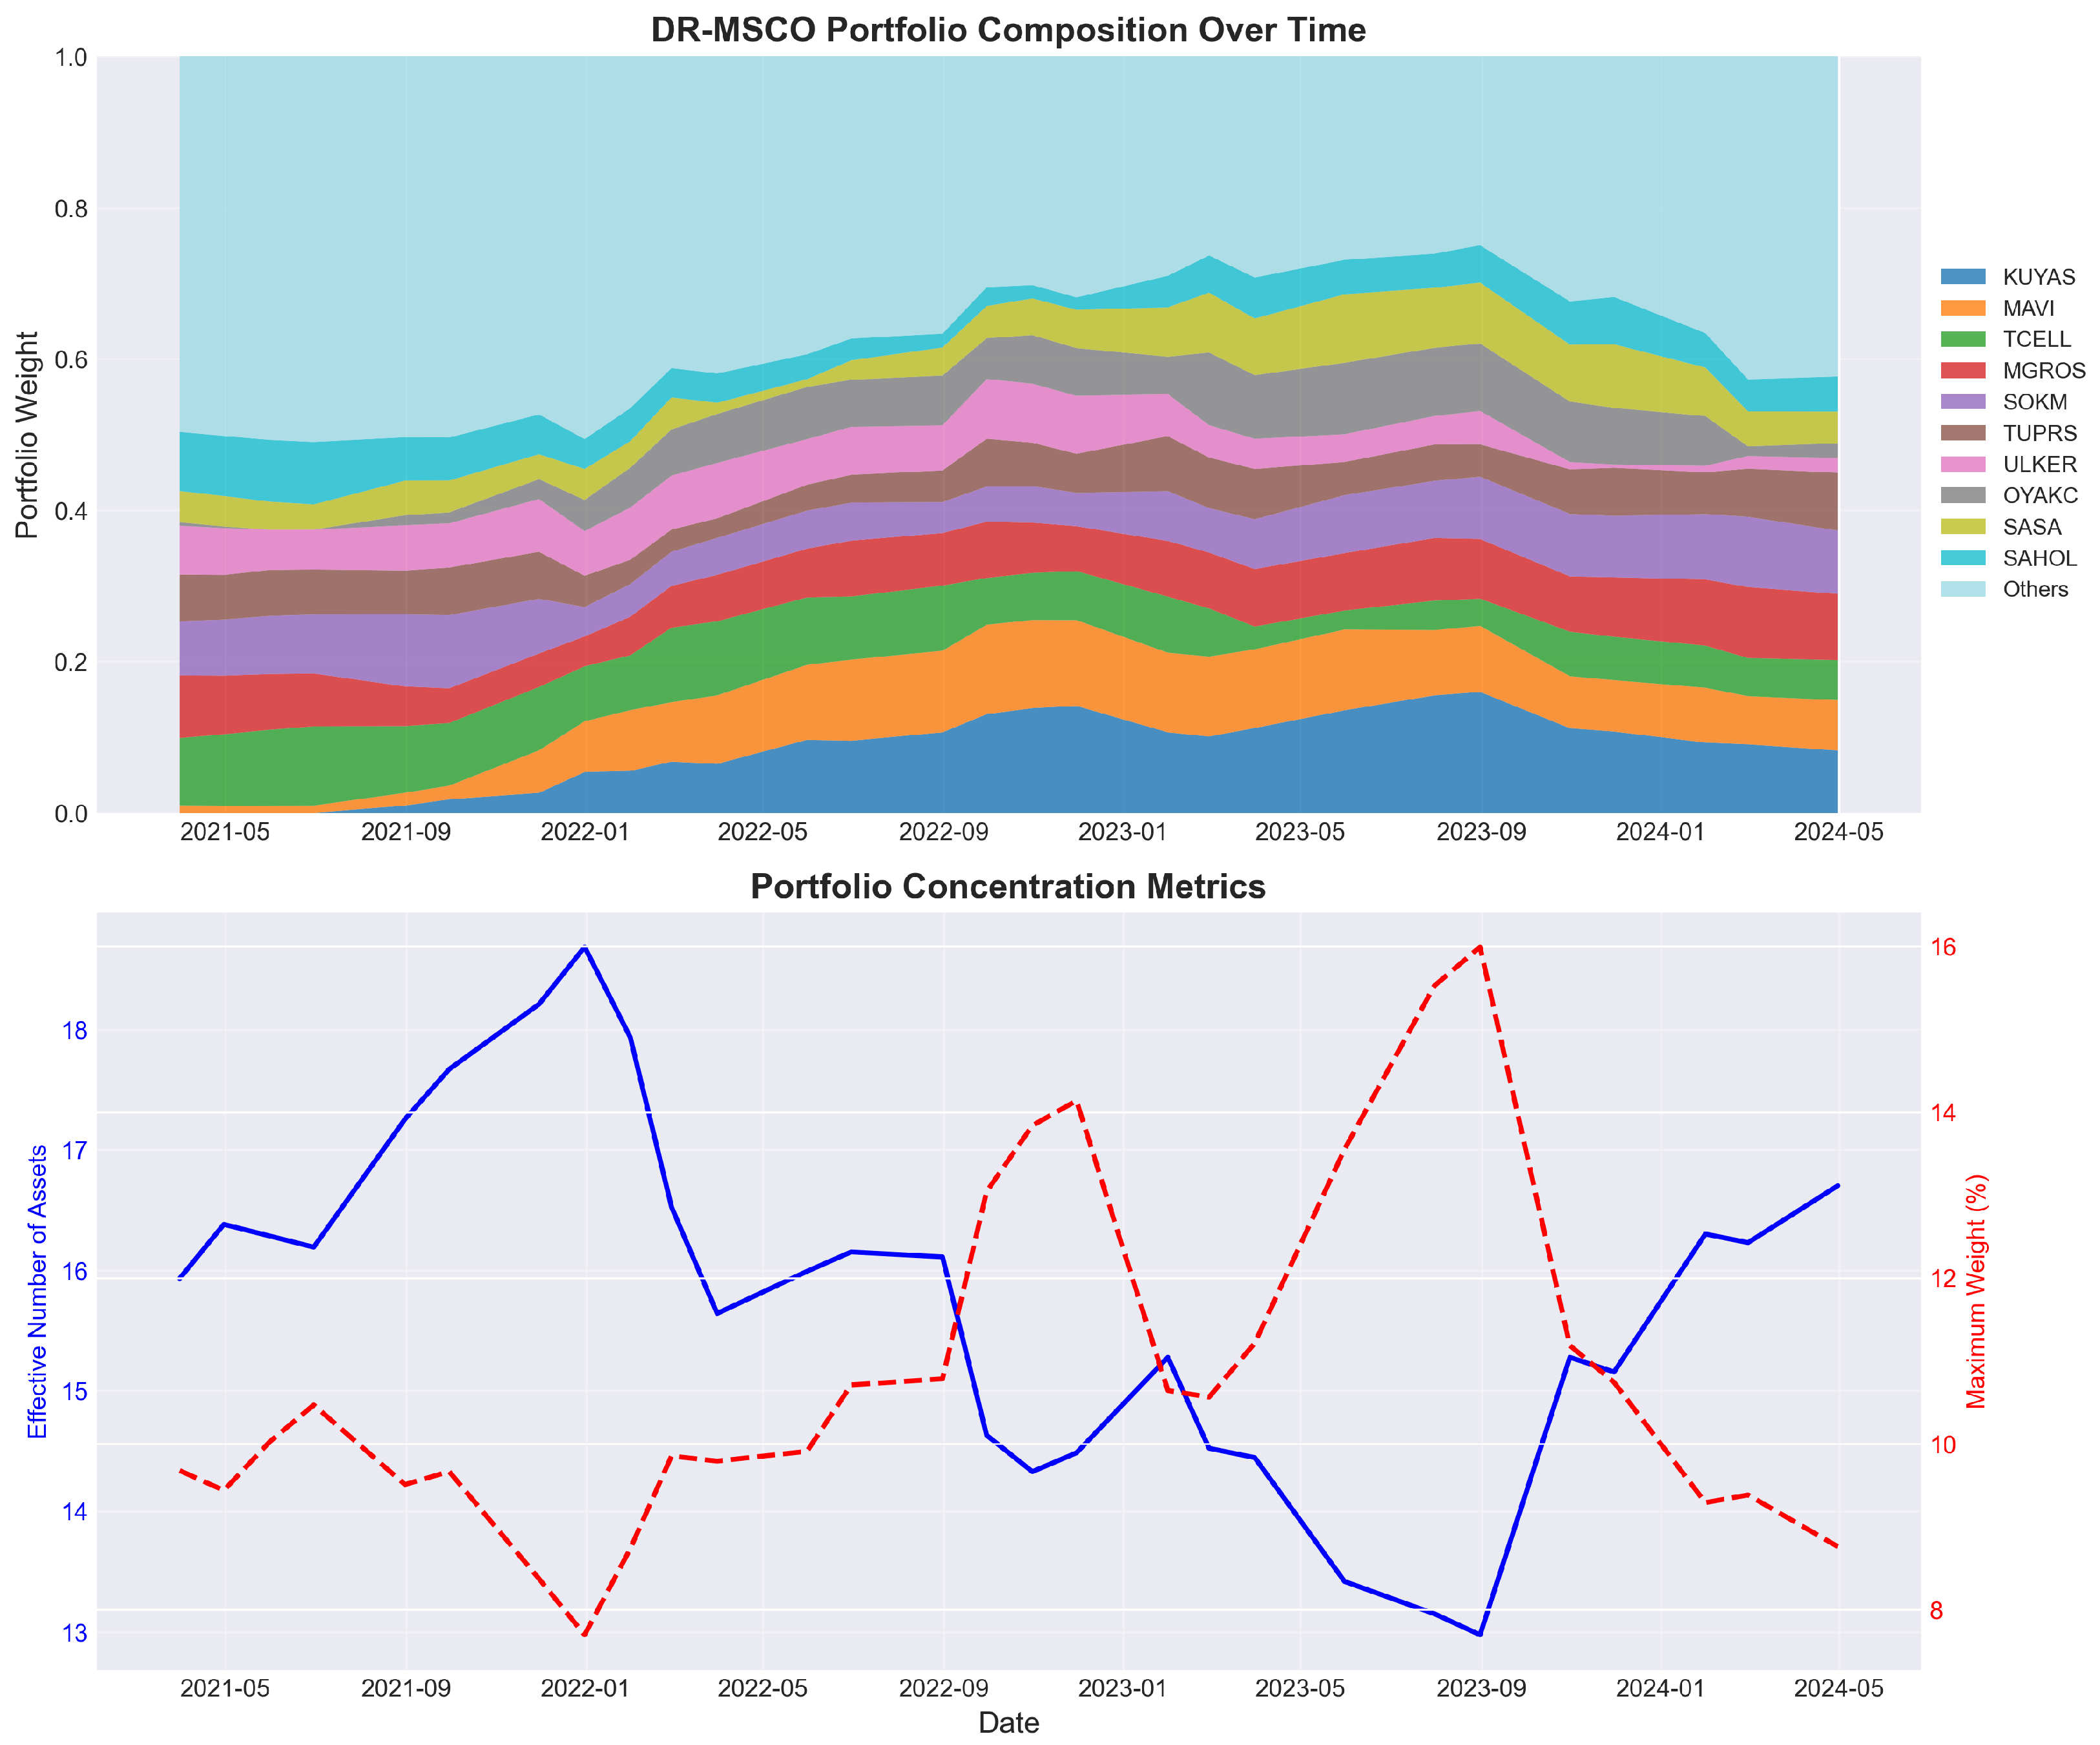
Figure 8 illuminates the temporal evolution of portfolio structure through a dual-panel visualization combining compositional dynamics with concentration metrics. The upper panel’s stacked area representation reveals distinct regime shifts in portfolio construction, particularly evident during the transition periods of early 2022 and late 2023, where substantial reallocation occurs among the top ten holdings. KUYAS emerges as the dominant position throughout most periods, reflecting its favorable risk–return characteristics within the cone-based preference structure, while assets such as TCELL and MGROS demonstrate cyclical prominence corresponding to market regime changes. The visual evidence of portfolio adaptation contradicts static optimization approaches, validating the theoretical framework’s capacity for dynamic response to evolving market conditions.
The concentration analysis presented in the lower panel provides critical insights into the framework’s diversification dynamics through two complementary metrics. The effective number of assets, calculated as the inverse of the Herfindahl–Hirschman index, fluctuates between 13 and 19 throughout the evaluation period, indicating meaningful diversification despite the theoretical possibility of extreme concentration. The trajectory demonstrates intelligent adaptation to market conditions, with diversification expanding during the volatile periods of mid-2022 while consolidating during the trending markets of late 2023. This pattern suggests that distributional robustness naturally embeds regime-dependent diversification without explicit constraints, as uncertainty quantification becomes more conservative during turbulent periods.
The maximum weight evolution, depicted through the secondary axis, reveals compliance with the 25% position limit while demonstrating substantial variation between 8% and 16% across different market environments. The inverse relationship between maximum position size and the effective number of assets during certain periods indicates that the optimizer responds to increased uncertainty by reducing concentration risk, a behavior consistent with minimax robust optimization theory. Notably, the sharp reduction in maximum position size during the crisis periods of 2022 coincides with expanded diversification, suggesting that the Wasserstein ball uncertainty set effectively captures time-varying risk dynamics.
The composition statistics reveal distinctive characteristics of the DR-MSCO selection process when examining asset-level metrics. High-frequency assets such as KUYAS (92.86%), MAVI (85.71%), and TCELL (85.71%) demonstrate persistent inclusion with relatively stable allocations, evidenced by standard deviations below 3% of portfolio weight. Conversely, assets like TTKOM and YKBNK exhibit sporadic inclusion patterns with high conditional allocations when selected, suggesting their utility as tactical positions during specific market conditions. This bifurcation between strategic core holdings and tactical satellites emerges endogenously from the optimization process, reflecting the framework’s capacity to distinguish between stable risk premia and transient opportunities within the distributional uncertainty framework. The average portfolio turnover implicit in these allocation patterns suggests moderate trading intensity, balancing the benefits of dynamic adaptation against transaction cost considerations in the emerging market context.
4. Discussion and Conclusions
The empirical investigation of the Distributionally Robust Multivariate Stochastic Cone Order (DR-MSCO) framework within the context of Borsa Istanbul equities reveals profound implications for portfolio optimization theory and practice in emerging market environments. The synthesis of our findings demonstrates that the theoretical advantages of distributional robustness translate into tangible performance benefits, particularly during periods of heightened market stress where traditional optimization paradigms exhibit systematic vulnerabilities. The observed performance patterns validate the fundamental premise that uncertainty quantification through Wasserstein ambiguity sets provides a mathematically principled approach to navigating the inherent instability of emerging market dynamics.
The superior risk-adjusted performance of DR-MSCO, evidenced by its Sharpe ratio of 2.18 compared to 2.09 for traditional Markowitz optimization, emerges not from enhanced return generation but from sophisticated risk modulation that adapts to evolving market conditions. This finding challenges the conventional wisdom that robustness necessarily entails performance sacrifice, suggesting instead that properly calibrated uncertainty sets can identify genuinely robust portfolio allocations that maintain competitive returns while providing downside protection. The framework’s ability to achieve comparable returns while reducing maximum drawdown by approximately 10% relative to Markowitz optimization indicates that the cone-based preference structure successfully captures investor utility beyond mean-variance considerations.
The crisis period analysis provides particularly compelling evidence for the practical value of distributional robustness in emerging markets. The maintenance of positive risk-adjusted returns during high-volatility regimes, where DR-MSCO achieved a crisis Sharpe ratio of 0.95 compared to 0.69 for Markowitz, demonstrates the framework’s capacity to preserve capital during tail events without requiring explicit scenario specification or stress testing. This emergent robustness arises from the mathematical structure of the optimization problem, where the supremum over the ambiguity set naturally incorporates worst-case scenarios that align with observed market behavior during crisis periods. The theoretical prediction that distributional robustness provides insurance against model misspecification finds empirical support in the reduced performance degradation observed during regime shifts.
The portfolio composition analysis reveals sophisticated allocation dynamics that challenge simplistic interpretations of diversification. The temporal variation in effective asset count between 13 and 19 securities, coupled with regime-dependent concentration adjustments, suggests that DR-MSCO embeds an intelligent diversification mechanism that responds to market conditions rather than imposing static constraints. This adaptive behavior aligns with theoretical work on ambiguity aversion, where increased uncertainty naturally leads to more conservative portfolio allocations. The framework’s ability to maintain concentrated positions in high-conviction assets while dynamically adjusting peripheral holdings demonstrates practical applicability for institutional investors who must balance tracking error constraints with risk management objectives.
The methodological implications of our findings extend beyond the specific context of Turkish equities to broader questions in portfolio theory. The successful implementation of DR-MSCO without requiring explicit estimation of higher moments or complex dependency structures validates the tractability of cone-based robust optimization for practical applications. The use of Wasserstein ambiguity sets, parameterized by a single radius parameter, provides an intuitive calibration mechanism that avoids the curse of dimensionality associated with moment-based uncertainty sets. Furthermore, the framework’s compatibility with standard convex optimization solvers ensures computational feasibility even for large-scale problems, addressing a critical limitation of many robust optimization approaches.
Several limitations of our analysis warrant consideration for proper interpretation of the results. The evaluation period of 2021–2024, while encompassing significant market volatility, may not fully capture the long-term performance characteristics of the DR-MSCO framework across complete market cycles. The selection of a 20% ambiguity radius, though justified by emerging market volatility characteristics, introduces a calibration dependency that requires further investigation across different market environments. Additionally, the monthly rebalancing frequency, while standard for institutional portfolios, may not optimize the trade-off between adaptation benefits and transaction costs, particularly given the 30 basis point cost assumption for BIST trading.
The practical implementation considerations revealed through our analysis suggest several avenues for refinement. The observed portfolio turnover patterns indicate that transaction cost optimization could be explicitly incorporated into the DR-MSCO framework through appropriate penalty terms or rebalancing triggers. The concentration of allocations within specific sectors during certain periods suggests that sector-level constraints might enhance the framework’s robustness to industry-specific shocks. Furthermore, the integration of regime-switching models with distributional robustness could provide a more nuanced approach to ambiguity set specification, allowing for state-dependent uncertainty quantification that better reflects market dynamics.
The broader implications for emerging market portfolio management are substantial. Our results suggest that the additional computational complexity of DR-MSCO relative to traditional mean-variance optimization is justified by tangible performance improvements, particularly in markets characterized by parameter instability and frequent regime shifts. The framework’s ability to provide downside protection without explicit tail risk constraints makes it particularly suitable for institutional investors facing regulatory capital requirements or drawdown limits. Moreover, the endogenous emergence of sensible portfolio characteristics, such as regime-dependent diversification and tactical allocation capabilities, reduces the need for ad hoc constraints that often plague practical optimization implementations.
Future research directions emerge naturally from our findings. The extension of DR-MSCO to multi-period settings with transaction costs could provide insights into optimal rebalancing strategies under distributional uncertainty. The incorporation of factor models within the cone-based framework might enable more parsimonious portfolio construction while maintaining robustness properties. Investigation of alternative ambiguity set specifications, including those based on f-divergences or moment constraints, could reveal whether Wasserstein balls provide optimal uncertainty quantification for financial applications. Additionally, the theoretical analysis of DR-MSCO’s asymptotic properties and finite-sample guarantees would strengthen the mathematical foundations for practical implementation.
Several important considerations regarding our empirical design warrant discussion in the context of broader market applications. The selection of the January 2021 to June 2024 period, while encompassing significant market volatility including the Turkish Lira crisis and extreme returns exceeding 80% annually, reflects the unique characteristics of emerging markets where currency depreciation and negative real interest rates create extraordinary nominal return environments. The 175% return of the BIST 100 index in 2022, coinciding with a 40% depreciation of the Turkish Lira against the US Dollar, underscores the critical importance of exchange rate risk in emerging market portfolio optimization that our framework explicitly addresses through its distributional robustness mechanisms. While a longer time series spanning 10 years or more would provide additional statistical power and capture complete market cycles, the selected period represents an ideal natural experiment for testing robust optimization approaches under extreme market stress, conditions where traditional mean-variance frameworks typically fail most dramatically. The application to developed markets such as the S&P 500 would likely yield more modest absolute performance differences between optimization approaches, as lower volatility and greater market efficiency reduce the relative advantage of distributional robustness. However, the fundamental benefits of cone-based preference modeling and adaptive uncertainty quantification would remain relevant, particularly during crisis periods such as the COVID-19 pandemic or financial market stress episodes where correlations increase and tail dependencies become prominent. Future research should investigate the framework’s performance across different market environments, including developed markets with lower baseline volatility, to establish the generalizability of our findings and identify the market conditions where DR-MSCO provides the greatest relative advantage over traditional optimization approaches.
The synthesis of theoretical innovation with empirical validation presented in this study advances the frontier of robust portfolio optimization by demonstrating that sophisticated mathematical frameworks can yield practical benefits in real-world applications. The DR-MSCO approach represents a principled middle ground between the oversimplification of traditional mean-variance optimization and the computational intractability of full stochastic programming, providing a implementable framework for institutional investors navigating uncertain market environments. As financial markets continue to exhibit increasing complexity and interconnectedness, the development of theoretically grounded yet practically feasible optimization frameworks becomes ever more critical for effective portfolio management.


