3.1. Analysis of Passenger Injury Patterns Using Decision Trees
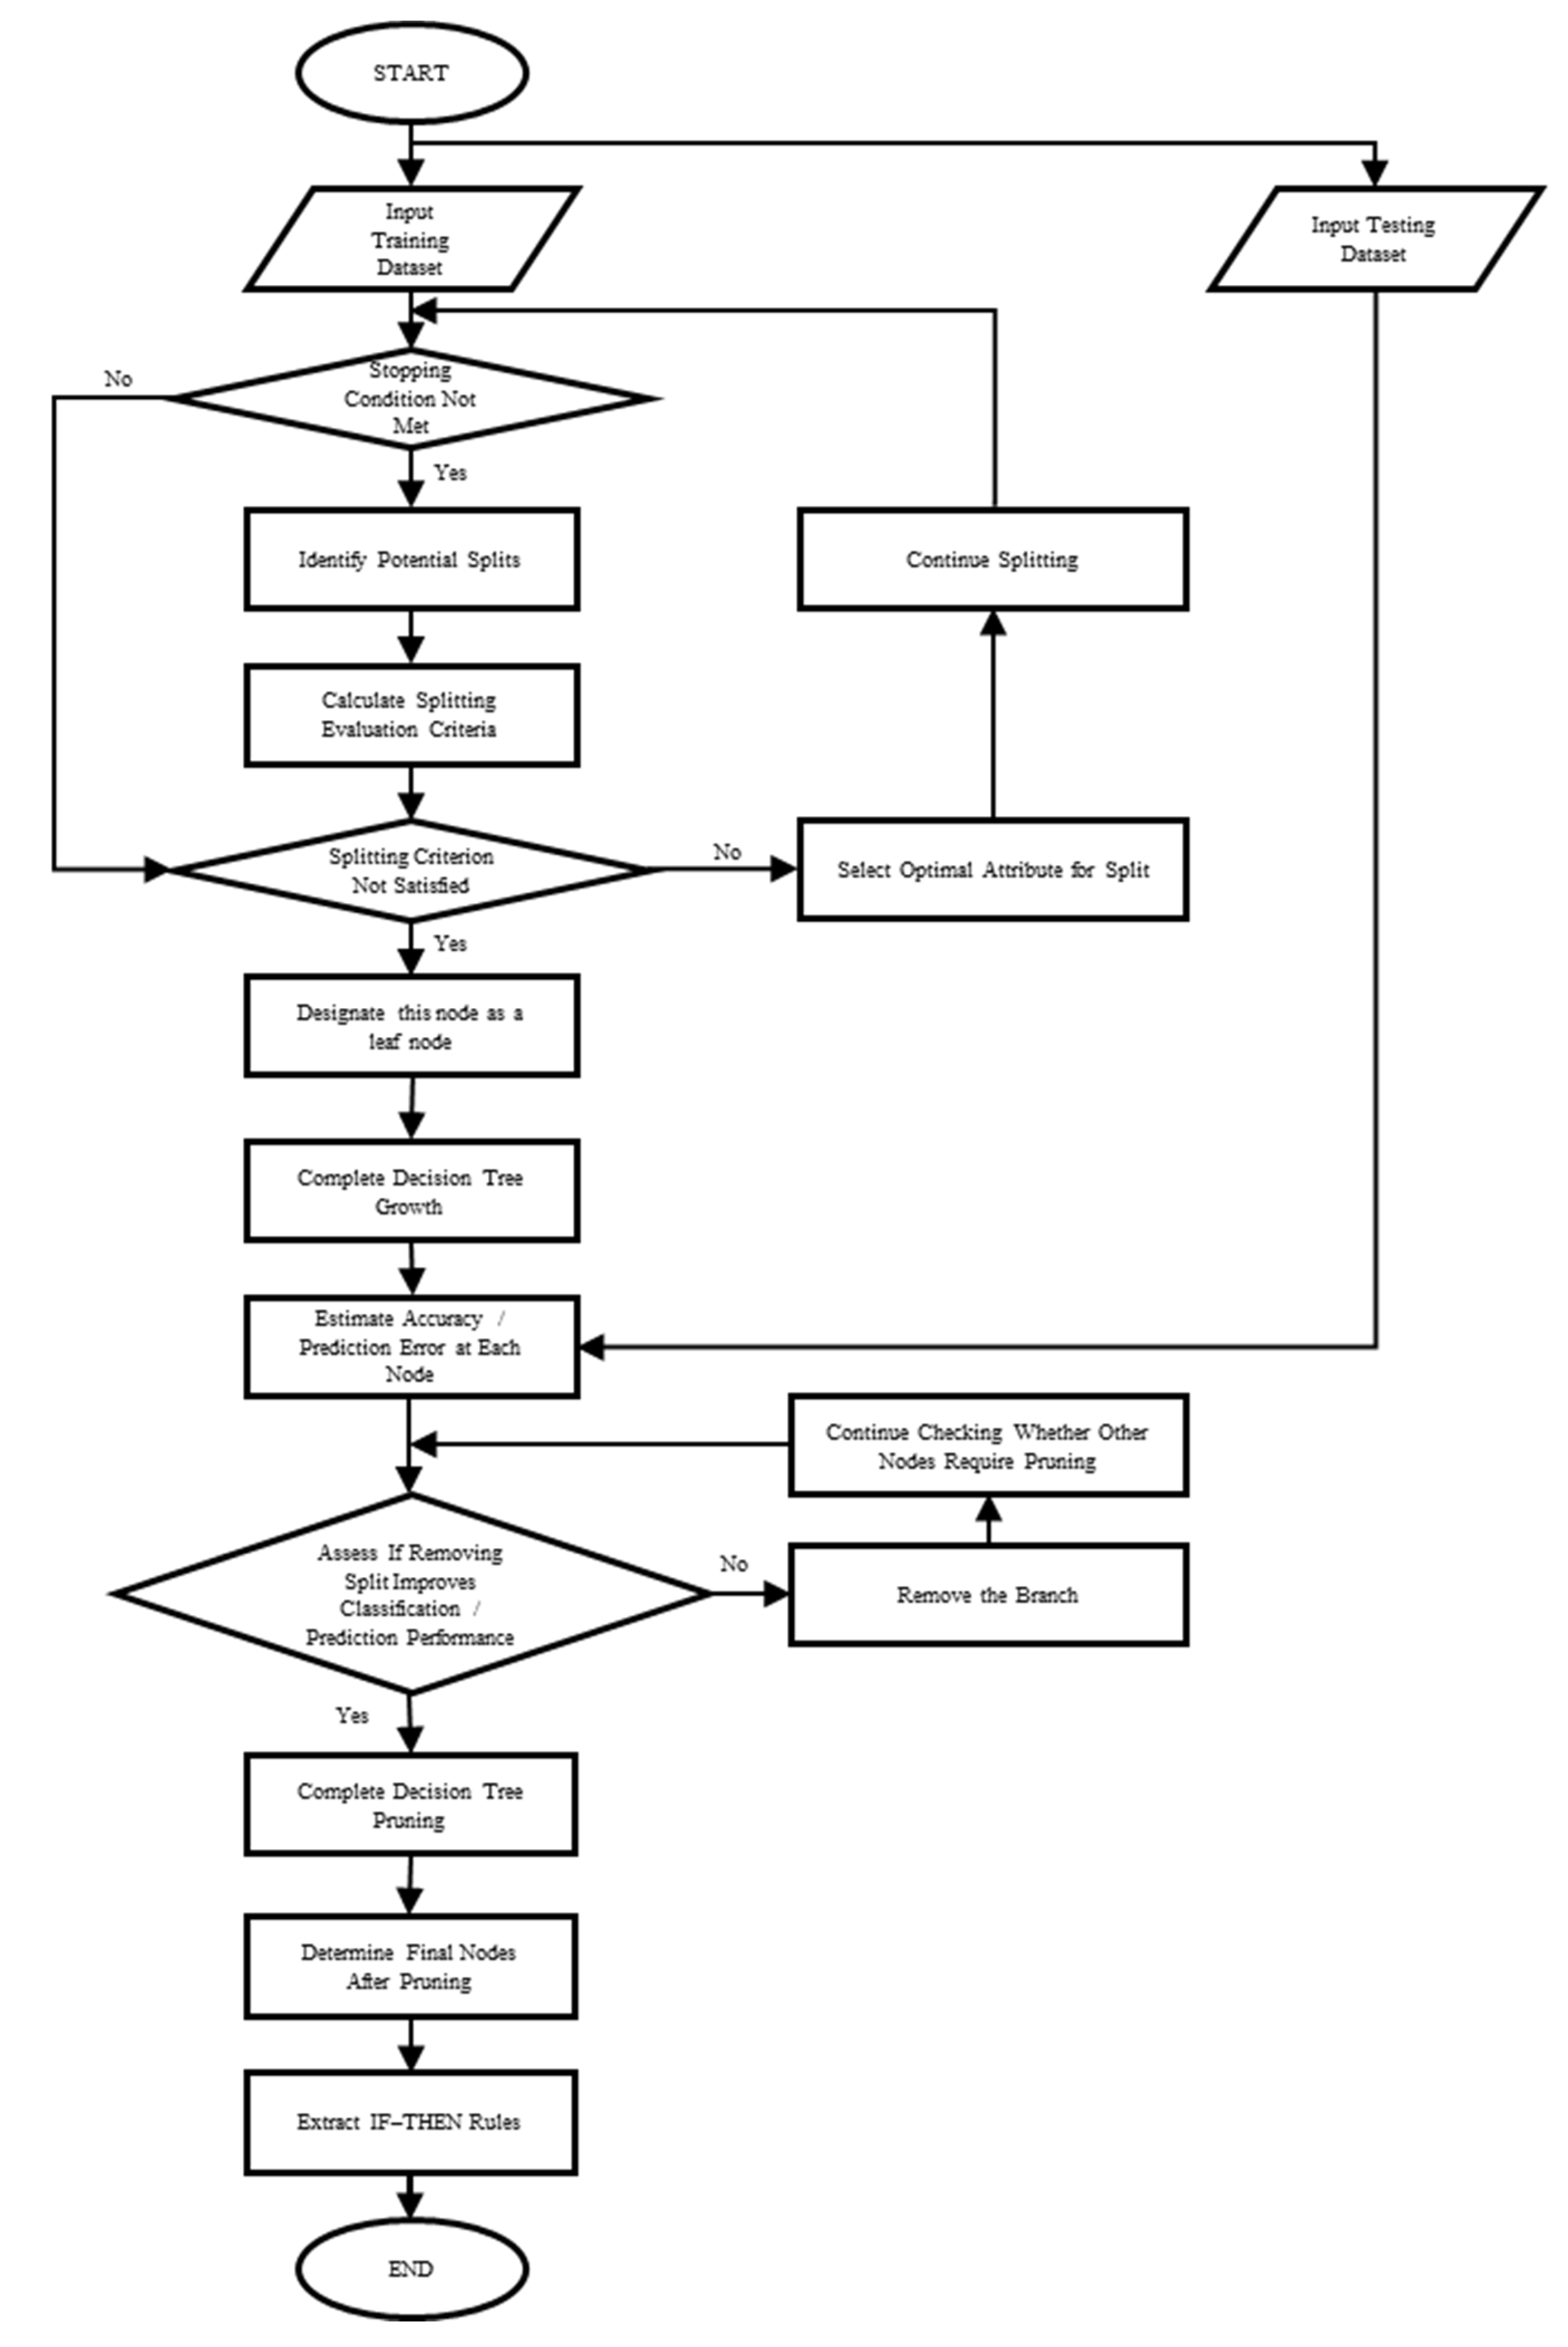
As part of the research methodology, this study employs supervised learning—specifically, the decision tree algorithm from big data analytics—as a tool for further exploration of the problem. The decision tree model is implemented using Python 3.12 (see
Appendix A). The objective is to apply decision tree analysis to classify and interpret patterns in Taipei Metro passenger injury incidents, with variables such as time period, age, gender, location of occurrence defined as feature variables (X), and injury severity as the target variable (Y).
To enhance the analyzability of the dataset, a data preprocessing stage was conducted. Time periods were categorized into peak, off-peak, and weekend classes; age was treated as a continuous variable; locations were classified into nine contextual categories (e.g., platform, train car, ground level); injury severity was divided into minor, moderate, and severe levels; and gender was treated as a binary variable. This preprocessing strategy facilitates the construction and interpretation of the decision tree model, as summarized in
Table 3 and
Table 4.
First, the structured feature dataset must be imported into Python. Since machine learning models in Python cannot directly process categorical variables, it is necessary to convert both the target variable and the feature variables into dummy variables. The target variable, degree of injury, possesses a clear ordinal relationship and is thus treated as an ordinal variable. Therefore, this study utilizes the LabelEncoder module to encode the values “mild,” “moderate,” and “severe” into 0, 1, and 2, respectively.
In contrast, the feature variables are nominal (unordered categorical variables). To avoid the model mistakenly assuming an ordinal relationship, one-hot encoding is applied to transform them into dummy variables.
Once data preprocessing is completed, model training can proceed. Before building the model, the injury dataset is divided into a training set and a test set using an 80:20 split ratio. The training data is then fed into the DecisionTreeClassifier model to train and construct the decision tree.
Next, the trained model is used to make predictions on the test set, and the prediction accuracy is calculated. Experimental results indicate that the model achieved an accuracy of approximately 68%, which falls short of the ideal performance level. As a result, the study further analyzes the feature importance scores provided by the decision tree model to evaluate the contribution of each feature to the prediction outcome. This analysis guides feature selection and model optimization to improve overall predictive performance.
As shown in
Table 5, feature importance is determined by the model based on how frequently and effectively each feature is used for splitting during training. The results reveal that the lower-ranked features are mostly from the variable “type of incident”, with some categories contributing nothing to the model (i.e., feature importance equals zero). For the sake of performance enhancement and model simplification, this study decides to remove the “type of incident” feature, thereby eliminating low-contribution variables that could negatively affect model accuracy.
In addition to simplifying feature variables through feature engineering, this study also identified another potential factor affecting the accuracy of the decision tree model: data imbalance. The injury data categorize the target variable into three levels of severity: (i) mild injury, which includes cases such as abrasions, swelling, or no visible external injury; (ii) moderate injury, which includes fractures, dislocations, or individuals aged 60 and above who were transported to the hospital by ambulance; and (iii) severe injury, which includes serious conditions such as heavy bleeding or loss of consciousness. As shown in
Table 6, among the total of 3331 records, 2188 are classified as mild injuries, 1058 as moderate injuries, and only 85 as severe injuries, indicating a clear imbalance in class distribution.
Data imbalance may cause the model to become biased toward predicting the majority class during training, thereby weakening its ability to recognize and classify minority classes. As a result, even if the model achieves acceptable overall accuracy, its predictive performance for underrepresented categories—such as severe injuries—may deteriorate significantly. This compromises the model’s capacity to accurately learn the distinguishing patterns of minority classes, thereby reducing its practical applicability and reliability in real-world deployments.
To address the issue of data imbalance, this study adopts an oversampling technique. Specifically, the method used is duplicate sampling, which involves randomly replicating samples from minority classes to increase their quantity, thereby achieving a more balanced class distribution.
Oversampling not only balances the dataset but also enhances the model’s ability to learn. In situations where class distributions are highly skewed, models tend to favor predictions toward the majority class, resulting in poor predictive performance for minority classes. By increasing the number of samples in the minority class, oversampling not only balances the dataset but also enhances the model’s ability to learn and accurately predict these underrepresented categories.
As shown in
Table 7, this study duplicates the original samples from the severe injury and moderate injury classes to bring their sample sizes closer to that of the majority (mild injury) class. This increases the model’s sensitivity to minority classes during training and improves their relative contribution to the learning process. Consequently, this helps boost the model’s overall accuracy and stability in classifying minority cases.
After applying the aforementioned feature engineering and oversampling techniques, the dataset was reprocessed through the decision tree model for training and testing. The results show that the model’s accuracy improved to 81%, indicating a significant enhancement compared to the original model.
To further evaluate the overall performance of the decision tree classifier, several commonly used evaluation metrics were calculated and analyzed. First, a confusion matrix was constructed, as shown in
Table 8, followed by the computation of key classification metrics such as precision and recall. These metrics provide a more comprehensive understanding of the model’s predictive performance across different injury severity levels.
Precision and recall values are summarized in
Table 9. Overall, the model demonstrates strong performance across all categories in terms of both precision and recall, indicating that it possesses stable and reliable predictive capabilities for classifying cases of mild, moderate, and severe injuries.
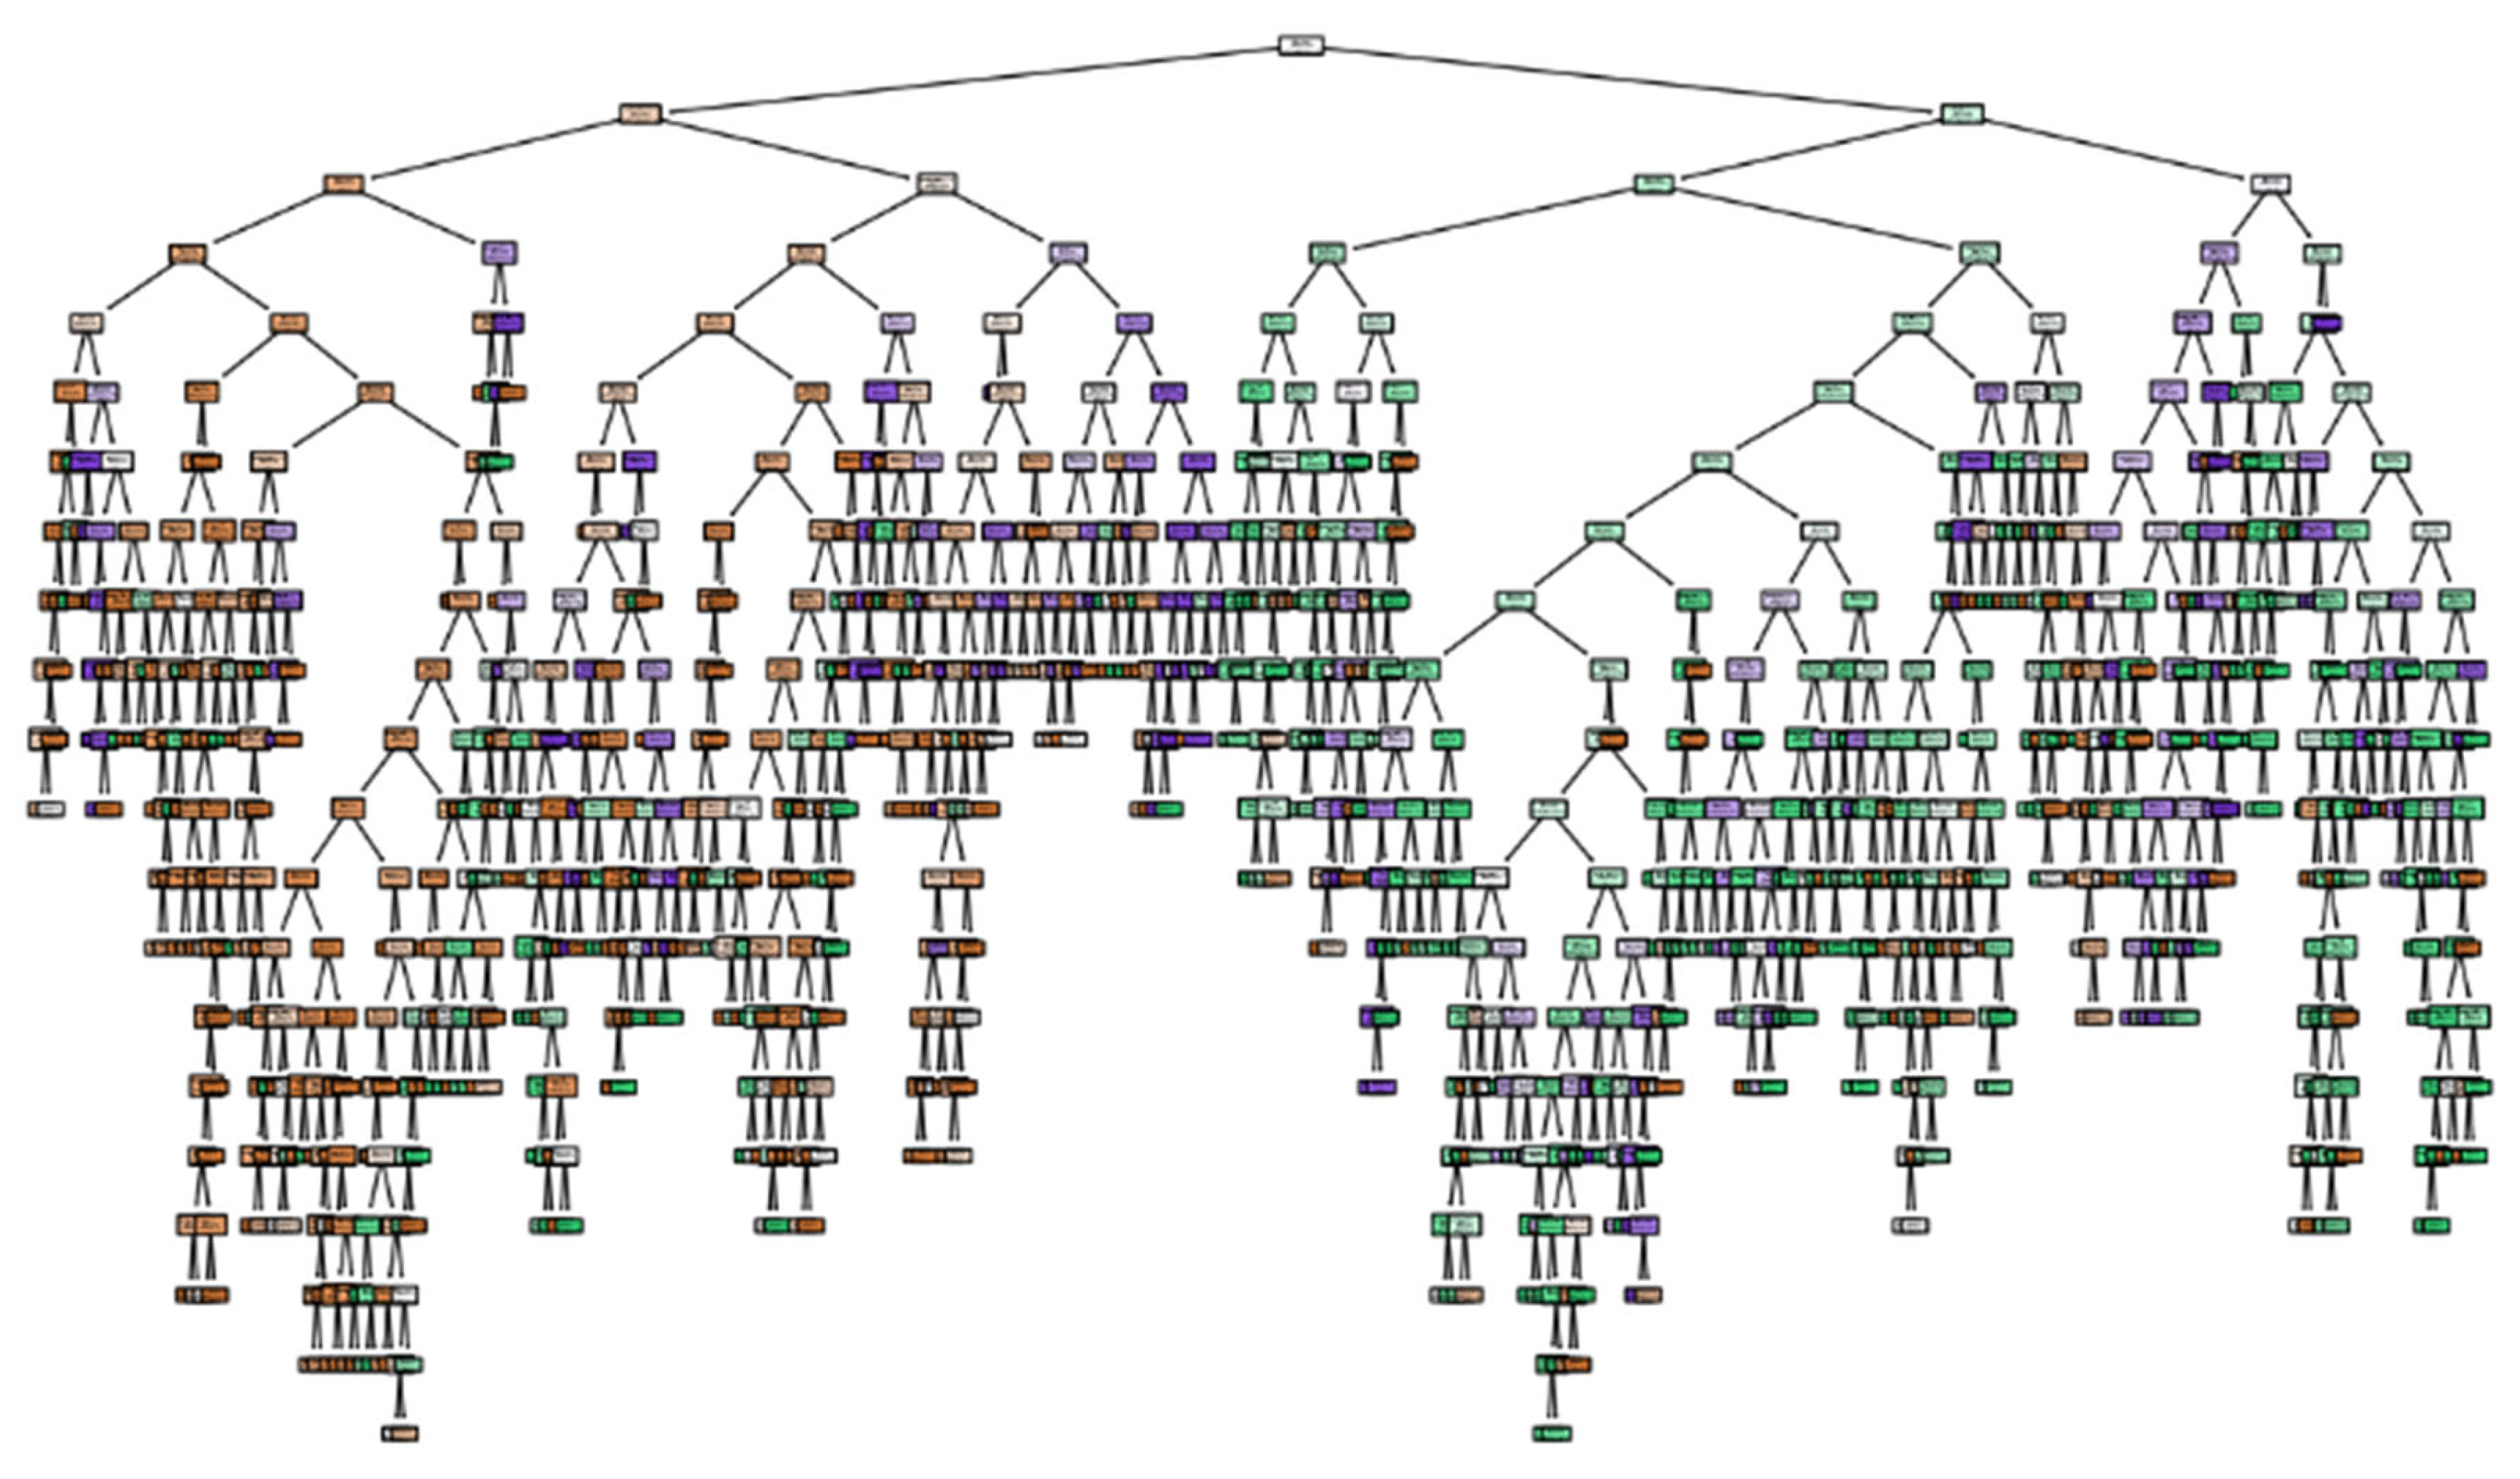
Following the construction of the decision tree model, visualization was conducted to better understand its structure, as shown in
Figure 3. The analysis reveals that the model is highly complex, with a depth of 20 layers and a total of 616 nodes. Such complexity not only makes the model difficult to interpret and explain but also hinders the extraction of clear, actionable rules.
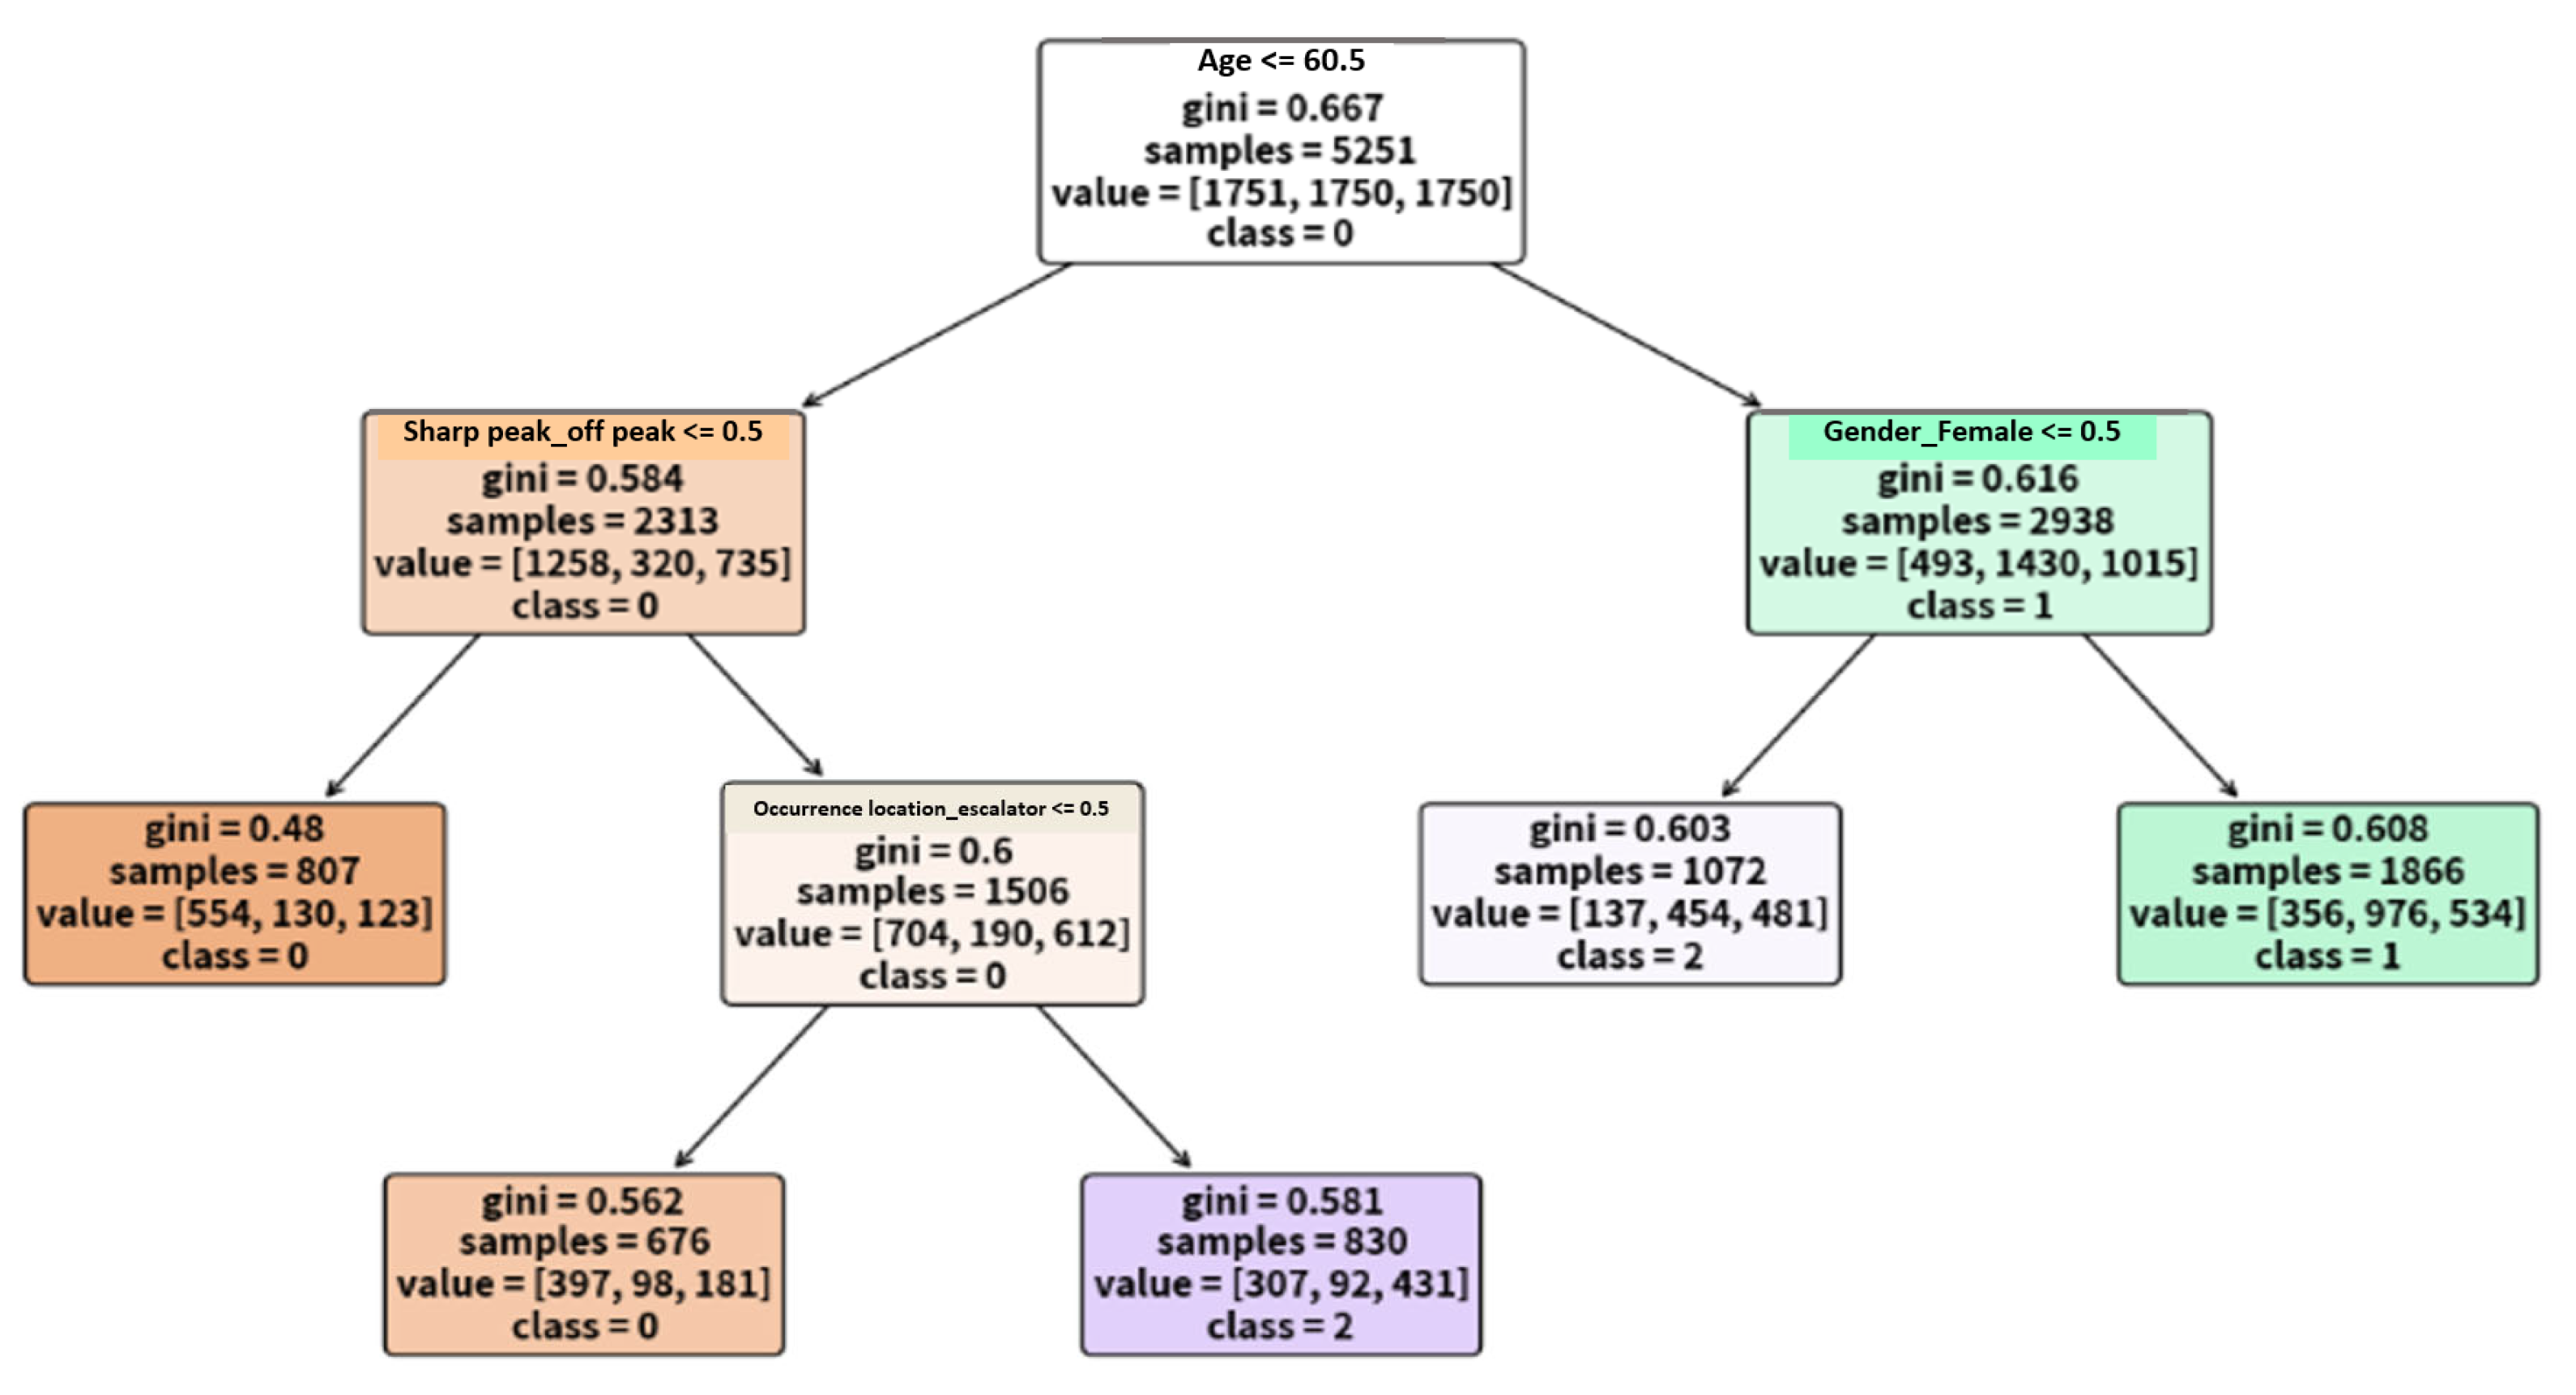
To enhance the interpretability and conciseness of the model, this study further applied post-pruning to simplify the decision tree structure. Based on the pruned model, a set of representative and practically applicable classification rules was derived.
This study adopts minimal cost complexity pruning as the pruning method. This approach regulates the extent of pruning and structural simplification by adjusting the cost complexity hyperparameter α (alpha). After multiple rounds of testing and comparison, the optimal value of α was determined to be 0.05. This setting effectively simplifies the model structure, resulting in a more compact decision tree that facilitates subsequent rule extraction and analysis. Moreover, it enhances the interpretability and practical applicability of the model.
As shown in
Figure 4, the structure of the decision tree has been significantly simplified following the pruning process, enabling clearer extraction of classification rules. This study further organizes the key classification rules and, based on their content, proposes preliminary recommendations for injury prevention strategies in the Taipei Metro system. Using a dataset of approximately 3331 passenger injury records, the model was trained to uncover potential relationships between various feature variables and the degree of injury, as well as to identify distribution patterns and potential risk factors associated with passenger injuries.
- A.
Key extracted classification rules:
- (A)
IF age ≤ 61 AND time period = off-peak AND location = escalator, then the injury is classified as severe.
- (B)
IF age > 61 AND sex = male, then the injury is classified as severe.
- (C)
IF age > 61 AND sex = female, then the injury severity is classified as moderate.
- B.
Interpretation and practical implications:
- (A)
Elderly male passengers (over 61 years old) show a higher likelihood of severe injuries. Enhanced safety education and targeted protection measures should be implemented for this demographic.
- (B)
While elderly females exhibit slightly lower injury severity compared to males, the injuries are still predominantly moderate, suggesting that this group also represents a potential high-risk population.
- (C)
Younger or middle-aged passengers using escalators during off-peak hours may also experience severe injuries. This underscores the importance of evaluating escalator safety and enhancing monitoring and maintenance measures during such time periods.
- C.
Recommendations for improvement
- (A)
Based on the rules extracted in this study, it was found that passengers aged over 61, regardless of gender, have a relatively higher likelihood of experiencing moderate or severe injuries in the metro system. It is recommended that metro operators enhance care and support measures for elderly passengers. These may include deploying additional staff during peak hours to proactively assist older adults with boarding and alighting, and offering guidance and physical support services. Furthermore, designated waiting zones or priority boarding areas for elderly passengers can be established, along with the installation of more seating to improve both safety and comfort during travel.
- (B)
For passengers in younger age groups—including children, adolescents, adults, and middle-aged individuals—the risk of severe injury is also elevated when incidents occur in escalator areas during off-peak hours. This study speculates that individuals in these demographics often use electronic devices (e.g., smartphones, tablets, earphones) while commuting, which may lead to reduced attention and increase injury risk. In contrast, elderly passengers are less likely to use such devices and are typically more focused on their surroundings while moving.
Based on this inference, it is recommended that metro authorities strengthen escalator safety management, including the following actions:
- (i)
Conduct regular inspections and maintenance of escalator equipment to ensure proper functioning and compliance with safety standards.
- (ii)
Install clearly visible warning signs and pictograms reminding passengers to stay attentive and avoid distractions while using escalators.
- (iii)
Consider installing smart monitoring systems in designated escalator zones to detect abnormal behaviors and provide real-time alerts.
3.2. Application of Association Rule Mining to Analyze EMU Fault Patterns
The research methodology is divided into two parts: (i) the medium-capacity system (Brown line), and (ii) the high-capacity system (including the Blue, Red, and Green lines).
For each system, the data was first cleaned and preprocessed, followed by the clear definition of target attributes and input attributes.
All fault events were initially categorized by their corresponding main subsystem, resulting in six major classes:
- (i)
Power supply/electrical system faults.
- (ii)
Signaling faults.
- (iii)
Track faults.
- (iv)
External factors.
- (v)
Communication faults.
- (vi)
EMU (Electric Multiple Unit) faults.
Among these, EMU fault was defined as the target attribute for prediction in this study, while season, time of day, and weather conditions were selected as input attributes.
The variable settings are as follows:
- (i)
Season was categorized into four groups according to Taiwan’s climatic patterns:
Spring (March–May), Summer (June–August), Autumn (September–November), and Winter (December–February).
- (ii)
Time of day was divided into four periods based on metro operating hours:
Early morning (00:00–06:00), morning (06:00–12:00), afternoon (12:00–18:00), and evening (18:00–24:00).
- (iii)
Weather was classified into three categories based on data source:
Sunny, cloudy, and rainy.
This study aims to conduct data exploration and analysis based on the above classification framework, with the goal of uncovering potential associations between input attributes and the target attribute. The ultimate objective is to generate preventive recommendations that support fault prediction and risk management.
In contrast to the earlier section, which focused on classification analysis using decision trees, this part of the study emphasizes identifying the key associative factors underlying fault occurrences. Therefore, the association rule mining technique—widely used in big data analytics—is adopted to extract meaningful patterns from historical datasets. The derived rules are intended to provide practically applicable insights that can inform operational management and system improvement strategies for the Taipei Metro corporation.
The following sections present the results for the two subsystems, beginning with the analysis of the medium-capacity system (Brown line).
- A.
Analysis of the medium-capacity system (Brown line)
In this study, a total of 183 valid records were compiled for the medium-capacity system (Brown line). Statistical analysis and association rule mining were conducted based on the defined input attributes. The relevant statistical results are presented in
Table 10.
In the final stage of analysis, the minimum support threshold was set at 1.5%, the minimum confidence threshold at 10%, and only association rules with a lift greater than 1 were retained for further analysis. These three criteria were applied simultaneously to ensure the reliability and practical relevance of the extracted rules.
To enhance the readability and interpretability of the results, a color-coding scheme was applied based on the range of lift values:
- (i)
Rules with a lift between 1.0 and 1.5 are highlighted in light blue.
- (ii)
Those between 1.5 and 2.0 are in blue.
- (iii)
Rules with a lift greater than 2.0 in dark blue.
After filtering, a total of 24 association rules met the specified conditions. The detailed results are presented in
Table 11.
This study applied association rule mining to investigate and summarize the causes of system faults in the medium-capacity system (Brown line). For each fault category, the corresponding association rules were computed and analyzed using three core indicators: Support, confidence, and lift.
After obtaining the preliminary analytical results, the study further cross-validated the findings by referencing actual maintenance records, relevant literature, and recent incident reports. Through the conditional combinations revealed by association rules, the potential correlations and contextual backgrounds were explored in depth.
Based on the results, a set of multi-faceted recommendations was proposed to assist the metro authority in optimizing maintenance routines, equipment inspections, and preventive mechanisms. Due to the large volume of data processed, only the most highly correlated and explanatorily significant rules are presented here.
Table 12 provides a summary of the qualified association rules identified for the Brown Line system. Each conditional combination is listed alongside its respective values for support, confidence, and lift, serving as a practical reference for future operational planning and decision-making.
Recommendations for improvement of the medium-capacity system (Brown line).
- (i)
Power system
This study identified that although the types of power system faults are diverse, failures tend to cluster between 06:00 and 12:00 on both sunny and rainy days. These time-weather combinations meet the minimum support (1.5%) and confidence (10%) thresholds, with particularly high lift values—3.6 and 4.0, respectively—under winter and sunny morning conditions. This suggests that failures in the power system are more likely to occur during the early morning start-up phase, potentially due to reduced system stability during cold starts.
Therefore, it is recommended that the Taipei Metro strengthens inspections and maintenance of power systems prior to morning train dispatch. Maintenance records should be thoroughly analyzed, with a focus on components that require frequent replacement, to appropriately shorten inspection intervals. Specifically, the following two measures are proposed for the propulsion power substation (PPSS):
Rapid fault response: When an abnormality is detected in the PPSS, a fault-handling procedure should be initiated immediately, aiming to restore service quickly, with backup systems in place to maintain short-term transport capacity.
Institutionalized regular inspections: Regularly assess the condition of PPSS components, replacing outdated or fragile parts in advance to improve overall system stability, reduce maintenance costs, and minimize risk of service interruptions.
- (ii)
Signal faults
Signal faults in the medium-capacity system most frequently occur under sunny conditions between 06:00 and 12:00. As this system operates autonomously without drivers, many maintenance reports have linked these faults to limited system stability. It is hypothesized that such issues may result from initialization errors during early morning start-up or decreased operator attentiveness during the early hours. To mitigate these problems, it is recommended that the Taipei Metro (i) enhances the start-up stability of the autonomous system and (ii) provides targeted training and reinforces operational protocols for early-shift personnel.
- (iii)
External factors
Data indicate a strong association between external factors and the 18:00–24:00 period in autumn. Further investigation revealed that many incidents were caused by passengers accidentally activating emergency handles inside train cars—categorized as uncontrollable events (only one was deemed controllable). Given that the Brown line operates on an unmanned system, this study proposes increasing the frequency of track inspections—especially during high-risk periods—and installing real-time video surveillance in vulnerable areas, and redesigning emergency handles with a multi-step triggering mechanism to reduce the risk of accidental activation and enhance the fault-tolerance of the system.
- (iv)
Communication failures
Communication failures were primarily observed between 18:00 and 24:00 on sunny days during the summer, with significantly high lift values. Analysis reveals that switch malfunctions accounted for approximately 45% of these cases, likely due to high summer temperatures and peak evening passenger loads. It is recommended that the Taipei Metro evaluates the thermal tolerance of communication switches and upgrades components, or considers alternative suppliers if necessary. Additionally, maintenance frequency of the communication system should be increased before and during summer peak periods to facilitate preventive maintenance and reduce the likelihood of failures.
- (v)
Electric multiple unit (EMU) failures
EMU-related failures represent the most prevalent fault type in the medium-capacity system. This study analyzed seven representative conditional combinations associated with such failures (as detailed in
Table 12): Sunny and 06:00–12:00, Rainy and 12:00–18:00, Sunny and Summer, Sunny and Autumn, Summer and 06:00–12:00, Autumn and 06:00–12:00, and Sunny and 06:00–12:00 and Summer.
Four key observations and recommendations were derived, as follows:
The primary causes were identified as cable degradation and defective solder joints, jointly responsible for over 50% of incidents. These issues are likely caused by heat-induced insulation degradation and terminal desoldering. It is advised that preventive maintenance of electrical systems be strengthened during summer, particularly through prioritized inspections prior to morning dispatch.
Data show that 54.54% of faults during this time were brake system-related. The wet environment in rainy weather likely increased braking system load, causing malfunctions to emerge in the early afternoon. Enhanced inspection and testing protocols for brake systems during rainy periods are recommended to ensure stable braking performance.
The predominant failure types were obstacle detection errors, signal anomalies, and cable damage, together comprising 75% of reported incidents. This highlights the substantial impact of summer morning weather conditions on EMU stability. Recommendations include upgrading cable insulation materials, improving the heat resistance of signal systems, and shortening pre-inspection intervals for related components.
Conditions associated with the 06:00–12:00 period (e.g., Sunny, Rainy, Summer, Autumn)
The data indicate that the early morning period is a high-risk window for system faults. Although individual support and confidence metrics may not all meet significance thresholds, this time frame should be regarded as a critical risk period. The Taipei Metro is advised to prioritize system checks before morning departures to enhance the operational stability and safety of EMUs during the early stages of service.
- B.
Analysis of the high-capacity system
Due to the incomplete weather records in the high-capacity system dataset—where more than half of the entries lacked specific weather information—this study excluded weather as a factor in the analysis. Instead, the research focused on season and time of day as the primary input attributes. After data filtering, a total of 978 valid records were obtained. The statistical summary based on the selected input attributes is presented in
Table 13.
In this study, for the high-capacity system dataset, the minimum support was set at 1.5%, the minimum confidence at 7%, and the lift value was required to be greater than 1. Only association rules that simultaneously satisfied all three criteria were retained as results with substantial analytical value.
To enhance visual identification and facilitate data comparison, color coding was applied based on the range of lift values: rules with lift values between 1 and 1.5 were marked in light blue, those between 1.5 and 2.0 in blue, and those greater than 2.0 in dark blue. After filtering, a total of 23 association rules met the criteria. The summarized results are presented in
Table 14.
This study employed association rule mining to analyze and summarize the causes of system failures in high-capacity metro systems. For each failure type, the associated rule calculations were compiled, including three key indicators: support, confidence, and lift.
After obtaining the preliminary analysis results, further validation and categorization were conducted by cross-referencing actual maintenance records, relevant literature, and recent incidents. The rule-based attribute combinations revealed by the analysis were examined to explore their underlying correlations and contextual background.
Based on the findings, this study proposes a series of improvement strategies from multiple perspectives to assist the metro company in optimizing maintenance, equipment inspection, and preventive mechanisms. Due to the large volume of computed data, only a selection of highly relevant and interpretable results is presented.
Table 15 summarizes the qualifying association rule outcomes for the high-capacity system, detailing the support, confidence, and lift values for each condition combination as a reference for future operational planning and decision-making.
Recommendations for improvement of the high-capacity system.
- (i)
Signal system failures
According to the data analysis, signal system failures were predominantly concentrated in the 06:00–12:00 time period during spring and winter. The association rules during these periods met the minimum support and confidence thresholds set by this study, as detailed in
Table 15. The analysis revealed multiple causes, including signal anomalies, automatic train protection (ATP) system malfunctions, and poor circuit board connections—suggesting the faults are not attributable to a single factor.
Therefore, it is recommended that the Taipei Metro enhances the overall stability of the signal system, particularly by reinforcing inspection protocols for relevant equipment during spring and winter mornings. Additionally, a regular maintenance and inspection plan should be established, with preventive measures scheduled for high-risk periods to mitigate operational disruptions.
- (ii)
Track failures
Track failures showed significant association only in the 06:00–12:00 period on the Red line, with the relevant rule listed in
Table 15. Maintenance records indicate that 57% of the incidents were due to misaligned switch points. Other issues included aging components, mechanical malfunctions, or unidentified causes.
It is recommended that the Taipei Metro strengthens functionality tests and maintenance routines for switch points prior to the morning dispatch on the Red line. The inspection frequency should be shortened, and additional personnel should be assigned during high-risk periods for real-time support. It is also advisable to consider the preemptive replacement of problematic equipment or provide technical feedback to suppliers for performance improvement.
- (iii)
External factors
Although the conditions associated with external factors met the basic association thresholds, the overall lift values were not significant. Data showed that 65% of controllable events were due to human error, primarily driver mistakes such as failure to properly close the cab door or incorrect station stopping. Unlike the medium-capacity system, where incidents were mostly passenger-induced, human errors in the high-capacity system were mainly caused by drivers. However, due to the absence of driver identification in the dataset, further verification of specific individuals or shifts was not possible.
It is recommended that the Taipei Metro enhances driver training, emphasizing operational protocols and accident simulation drills. A regular performance evaluation system should be implemented. From a hardware perspective, the human–machine interface design should be improved to reduce the likelihood of operational errors.
Electric multiple unit (EMU) failures were the most frequent anomaly in the high-capacity system. The Red line during the 12:00–18:00 period in spring and summer showed the highest lift values, as detailed in
Table 14. Subsystem analysis of failures revealed that on-board systems accounted for 21.14%, door systems 18.80%, brake systems 16.19%, propulsion systems 8.61%, auxiliary power systems 6.27%, and control systems only 1.83%. Further analysis identified the following main causes:
Door system: Many failures were triggered by emergency stops due to improperly closed cab doors.
On-board signaling system: Failures were often linked to automatic train operation (ATO) module instability, including system crashes, loose connections, and logic errors.
Brake system: The causes varied; one case involved brake pressure failing to release, though maintenance logs did not specify the technical reasons.
Drawing upon these findings, the study proposes the following improvement measures:
Door System: It is recommended to install cab door closure indicators and strengthen driver training on door operation procedures. In addition, targeted retraining for personnel with frequent operational errors can help reduce the risk of incidents caused by human error.
On-board signaling system: Conduct systematic testing and upgrades of the ATO modules, and consider adopting more stable alternatives to prevent cascading failures across subsystems.
Brake system: Enhance preventive maintenance of electronic control units and require detailed failure documentation by technicians to support future analysis and system improvements.
Additionally, because failures are concentrated during high-temperature, high-load periods—particularly on spring and summer afternoons—it is recommended that the Taipei Metro assigns dedicated personnel for inspections and emergency response during these times to ensure operational safety and minimize the impact of unexpected incidents. Furthermore, the analytical framework and classification logic developed in this study are generalizable and may be applied to urban transit systems in other cities, especially those with similar incident categories and reporting mechanisms.


