Abstract
Agricultural development is vital for East Africa’s economic growth, yet the region faces significant disparities and systemic barriers. A critical problem exists due to the lack of an integrated quantitative framework to systematically comparing agricultural capacities and facilitate optimal resource allocation, as existing studies often overlook combined internal and external factors. This study proposes a comprehensive multi-criteria decision-making (MCDM) model to assess, categorize, and strategically profile the agricultural development capacity of 18 East African countries. The method employed is an integrated Entropy-MAIRCA model, which objectively weighs six criteria (the food production index, arable land, production fluctuation, food export/import ratios, and the political stability index) and ranks countries by their distance from an ideal development state. The experiment applied this framework to 18 East African nations using official data. The results revealed significant differences, forming four distinct strategic groups: frontier, emerging, trade-dependent, and high risk. The food export index (C4) and production volatility (C3) were identified as the most influential criteria. This model’s contribution is providing a science-based, transparent decision support tool for designing sustainable agricultural policies, aiding investment planning, and promoting regional cooperation, while emphasizing the crucial role of institutional factors.
Keywords:
multi-criteria decision making; Entropy–MAIRCA method; capacity assessment; strategic profiling; East Africa; engineering management MSC:
90B50
1. Introduction
Africa is the region with the highest rates of malnutrition. While agriculture remains the backbone of most African economies, except for mineral producers, the sector deserves close attention from leaders. It accounts for 65% of Africa’s employment, 40% of its export earnings, and 17% of its GDP [1]. Moreover, agriculture employed about 59% of the population of East and Southern Africa and generated about 15% of the region’s GDP [2]. However, climate change also affects the agricultural system, causing a reduction in productivity [3]. Climate change is a cause that leads to more than 85% of soils in East Africa being severely nutrient deficient [4]. Political instability and regional conflicts continue to disrupt agrarian supply chains and force workers off the land, further undermining farm investment and productivity [5]. Aside from that, there is an apparent disparity in agricultural development capacity among countries in the region that exacerbates the disadvantages of the farm system of East Africa. Given these realities, East Africa faces a unique convergence of climate vulnerability, institutional fragility, and resource inequality. These challenges make it difficult for regional policymakers to adopt uniform agricultural strategies, underscoring the need for data-driven, context-specific decision support tools. An integrated and objective framework is urgently required to evaluate and classify countries’ agrarian development capacities and support more targeted and effective food security and rural transformation interventions.
However, the current review of studies mainly focuses on individual aspects, such as crop productivity, climate impact, or food security, without integrating internal factors (resources, production) and external factors (trade, institutions) into an overall assessment model. Specifically, Brigham emphasized agricultural exports as a growth driver in Sub-Saharan Africa, but did not integrate institutional quality or internal capacity in the assessment framework [6]. Mango et al. focused on crop diversification and its impact on food security in Malawi, but did not incorporate governance or trade-related indicators [7]. Similarly, De Silva et al. highlighted the importance of sustainable farmer development and local capacity building for agri-food supply chains, but did not propose a structured quantitative model for classification [8]. Furthermore, the study on mango value chains around Outamba Kilimi National Park in Sierra Leone explored constraints and opportunities for smallholders, but lacked a regional strategic classification framework using MCDM tools [9]. Moreover, another study assessed the effects of crop diversification on nutrition and food security in Northern Ghana, but their study did not integrate trade or institutional indicators, nor did it offer a comparative ranking across countries [10]. These limitations reflect a broader research gap in developing integrated models that quantify and categorize agricultural development potential across multiple dimensions.
To fill this gap, this study proposes an integrated model based on the MCDM, combining the entropy technique to determine the objective weights for the six criteria and the MAIRCA model to assess the similarity of each country to the ideal conditions. The six criteria include: The food production index, per capita arable land area, production fluctuation, food export/import ratios, and the political stability index.
Through this model, this study ranks and groups 18 East African countries into different strategic groups, thereby providing policy suggestions suitable to the practical conditions of each country. In terms of academics, this study contributes to expanding the application of MCDM in public policy assessment in agriculture, especially in the context of institutional and trade risks. The developed strategic map will be a helpful support tool for investment planning, resource allocation, and promoting sustainable development cooperation in the region. This study seeks to answer the following research question: How can a multi-criteria decision-making framework objectively classify and compare the agricultural development capacity of East African countries?
To address this question, this paper introduces a novel integration of the entropy and MAIRCA methods, enabling the simultaneous consideration of resource, trade, and institutional factors. The main contribution lies in constructing a transparent, objective, and replicable evaluation model that can support policy design, investment targeting, and risk mitigation tailored to each country’s structural conditions.
The remainder of this paper is organized as follows: Section 2 presents the literature review; Section 3 explains the methodology; Section 4 presents the results and classification; Section 5 discusses strategic implications; Section 6 outlines theoretical and managerial contributions; and Section 7 concludes this study with future research directions.
2. Literature Review
2.1. Agriculture and Its Role in East African Development
Agriculture is the economic mainstay of East Africa, but faces many systemic barriers: First is the impact of Climate change on agricultural productivity, and efforts to improve agricultural productivity in the face of climate change. According to research by Seife and Thornton P.K. [11,12], many studies show that climate change seriously impacts crop and livestock production in the African region. Climate change profoundly impacts agrarian production, especially crop yields [13,14,15]. Hence, there is a need for crop diversification and technological innovations to boost agricultural production and enhance agricultural output from Appiah-Twumasi and Asale, and Kadi et al. [10,16]. In addition, civil war in political and institutional institutions has negatively affected productivity and agricultural investment. The internal conflicts in areas such as Somalia and South Sudan have caused farmers to leave the fields, negatively impacting the agricultural sector in these countries [5]. The Russia–Ukraine conflict, which commenced on 24 February 2022, has broken the global supply chain, engendered global apprehensions regarding international trade, and has led to high prices [17]. According to Balma et al., many African countries rely heavily on imports of agricultural products and inputs from Ukraine and Russia, such as wheat, other grains, and fertilizers [18].
In this context, many studies have recommended promoting agricultural technology innovation as an essential solution to increase productivity and strengthen investment [16]. However, the differences between the different countries’ regional levels of modernization, trade efficiency, and governance institutions were evident and problematic in achieving effective implementation. Specifically, countries like Kenya have effective governance policies to develop the agricultural system through an increased use of fertilizers while improving agricultural goods’ distribution and export linkages [19]. Accordingly, Rwanda has also invested in mechanization and machinery management, contributing to productivity growth and improving access to agricultural markets [20]. Meanwhile, countries like Eritrea and South Sudan have shown a lack of necessary infrastructure investments, and the farm governance system is still ineffective. They are heavily dependent on international aid [21]. Countries such as Malawi, despite limited resources, have achieved high performance thanks to effective governance policies [22]. From the above studies, it can be seen that there are apparent differences in agricultural development capacity in the region. It shows the urgent need for a systematic, quantitative approach to comparing and evaluating agrarian development capacity among countries in the area. Previous studies have focused on individual factors (climate, productivity) while ignoring the combined effects of institutions, trade, and production fluctuations. Integrating internal factors (such as resources, productivity, and national policies) and external factors (such as trade dependence and political stability) will be the basis for building agricultural development strategies that are oriented, equitable, and appropriate to the practical conditions of each country in the East African region. The uneven development among East African countries is evident in both internal resources and external factors. This situation raises the question of comprehensively analyzing and comparing the country’s agriculture to develop appropriate strategies.
2.2. Application of MCDM in Agricultural Development Analysis
The MCDM methods have been extensively employed in agricultural development and public policy research, particularly in contexts requiring complex trade-offs among economic, environmental, social, and institutional dimensions. In East Africa, where climate variability, institutional fragility, and uneven resource endowments complicate development strategies, decision support tools must integrate diverse quantitative and qualitative factors in a consistent and transparent framework.
Classical MCDM approaches such as AHP have been widely applied to rank development priorities based on expert judgment that is aligned with the Sustainable Development Goals [23,24,25,26]. Similarly, TOPSIS has been effectively used in environmental and resource optimization problems [27], while fuzzy MCDM extensions help handle uncertainty in domains like social security [28] and energy planning [29,30]. In agriculture, MCDM has supported decisions on crop selection, supply chain resilience, farm investment prioritization, and agricultural input allocation [31].
However, many of these studies suffer from key limitations: subjective weighting mechanisms (AHP, Delphi), limited handling of distributional structure or systemic imbalance, and the exclusion of institutional and trade-related criteria. These constraints reduce their utility in assessing regional agricultural development under uncertainty, especially in the highly diverse and data-challenged context of East Africa. Recent studies in 2024–2025 have applied MCDM in diverse agricultural contexts, such as sensor selection via UAVs and precision agriculture using AI-based criteria [32], as well as maintenance planning of agricultural machinery using fuzzy logic [33], land suitability analysis through fuzzy-TOPSIS [34], and agri-voltaic potential assessment combining GIS and fuzzy MCDM in Türkiye [35]. While these works demonstrate methodological diversity and application depth, few have achieved transparency in weight assignment, regional-level classification, or the integration of trade and institutional factors, which remains the aim of our Entropy–MAIRCA framework.
This study employs a hybrid model combining entropy weighting and MAIRCA to address these gaps. Entropy enables objective derivation of criterion weights based on information entropy across alternatives, minimizing evaluator bias and enhancing reproducibility [36,37,38,39]. MAIRCA, meanwhile, goes beyond classical distance-to-ideal methods (like TOPSIS or VIKOR) by considering the ranking deviation between theoretical expectations and real alternatives, capturing both proximity and structural mismatch [40,41].
The integration of these methods into the Entropy–MAIRCA model provides several advantages:
- Objectivity: Reduces dependence on expert judgments for weighting.
- Comprehensiveness: Considers expectation-versus-reality ranking gaps.
- Sensitivity: Better distinguishes cases where development performance is imbalanced.
- Transparency: Offers a replicable, data-driven structure for decision-making.
This approach is particularly suitable for complex decision-making problems that require the simultaneous processing of quantitative and qualitative data and distributional expectations [42,43,44]. It is also especially valuable for regional analyses where countries exhibit divergent development patterns. While recent studies have applied MCDM to assess agriculture at national or thematic levels [45,46], none to our knowledge have deployed the Entropy–MAIRCA model to construct a strategic typology of agricultural development capacity that integrates resource conditions, production stability, trade balance, and institutional resilience.
By implementing this model across 18 East African countries, this study introduces a novel quantitative tool to support regional development planning, policy targeting, and investment allocation based on multi-dimensional strategic classifications—something the existing literature lacks.
2.3. Research Gaps and Approaches of the Paper
The synthesis of the above studies shows a significant gap: there is no comprehensive quantitative model to compare agricultural development capacity between countries in the same region. Existing models often give broad recommendations or focus on a single group of indicators without a systematic view that combines many aspects. Furthermore, no study has applied the MCDM-based strategic clustering technique at the East African regional scale. This study aims to fill that gap through (1) proposing a multi-criteria analysis framework combining entropy weighting (objectively determining the level of indicators’ contribution level) and the MAIRCA method (ranking based on distance to the ideal state); (2) building a multi-dimensional set of indicators that includes internal capabilities (production, resources) and external factors (commercialization, institutions); and (3) classifying East African countries into distinct agricultural development strategy groups to aid in more appropriate regional policymaking.
3. Research Methodology
3.1. General Research Framework
This study applies the MCDM to assess and classify the agricultural development capacity of East African countries. The research process is shown through the research diagram in Figure 1.
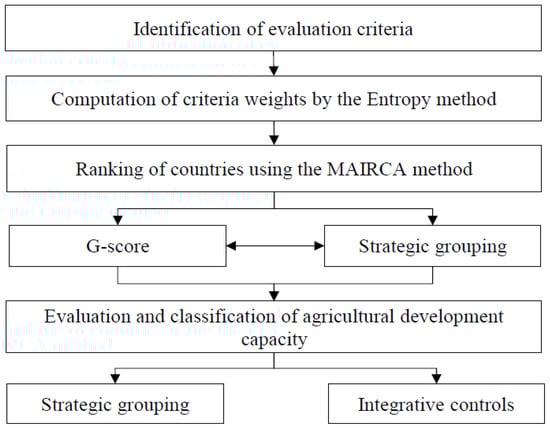
Figure 1.
The research diagram.
Phase 1: Identify the appropriate evaluation criteria: The criteria used in this study were selected based on two principles: (1) data availability and comparability across all 18 East African countries, and (2) theoretical relevance supported by literature on agricultural development, food security, and institutional performance. The six selected criteria include the following: C1: The food production index; C2: per capita arable land area; C3: production fluctuation; C4: food export/import ratios; C5: agricultural value-added per worker; C6: the political stability index. These criteria reflect both internal factors and external or systemic elements.
Phase 2: Calculate the objective weights for each criterion using the entropy method: To ensure transparency and avoid subjective bias, the study applies the entropy method to assign objective weights to each criterion. This method uses the variation in each criterion across countries to compute its relative informational contribution. Criteria with higher variability receive greater weight, as they provide more discriminative power. The raw data are first normalized using a linear benefit or cost-type transformation, depending on whether higher or lower values are preferred. Then, the entropy values and weights are calculated accordingly.
Phase 3: Use the MAIRCA model to rank countries according to their distance to the ideal state: The MAIRCA model is used to evaluate the performance of each country. It constructs two matrices: A theoretical ranking matrix () assuming ideal, equally distributed performance across all countries; a real performance matrix () that is based on actual data weighted by Entropy-derived weights. The Gap matrix (G) is calculated by measuring the deviation between the theoretical and real matrices. The total gap score (G-score) for each country is computed by summing these deviations. A lower G-score indicates a country that is closer to the ideal agricultural development configuration.
Phase 4: Strategic grouping and interpretation: The countries are grouped into four strategic clusters using K-means clustering based on their G-scores. This classification facilitates a comparative strategic analysis and supports decision-makers in identifying development priorities, policy interventions, and cross-country collaboration opportunities. The number of clusters (k = 4) was selected based on both visual (Elbow plot) and cohesion-based (Silhouette index) techniques in unsupervised learning [47]. The Elbow plot showed a significant inflection point at k = 4, indicating that adding more clusters beyond this point yields diminishing returns in explaining variance. The average silhouette score also peaked at k = 4, suggesting a meaningful balance between intra-cluster similarity and inter-cluster separation. Furthermore, this four-group configuration aligns with strategic typology theory, such as the Miles and Snow framework [48], which also classifies organizational or regional strategies into four archetypes.
This integrated framework enables a multi-dimensional assessment that incorporates production capacity, land resources, market integration, and institutional quality, providing a balanced and data-driven basis for strategic planning in agriculture.
3.2. Selection of Evaluation Criteria
Based on the theoretical overview and data availability, this study selected six indicators that comprehensively reflect the factors affecting agricultural development capacity as follows:
C1—Food production index (FPI): This measures the total food crop production compared to the base period. FAO compiles this index and includes all food crops with nutritional value (excluding industrial crops such as coffee and tea) [7,14,49].
C2—The average arable land area per capita (hectares/person): This is calculated according to the FAO definition, including annual crop land, livestock land, and home gardens per person. This criterion reflects the agricultural land resources available to each population member [50,51,52].
C3—Per capita food production fluctuation (USD/person): This measures the fluctuation (standard deviation) of food production value per capita. A high level of fluctuation signals the risk of unstable shortage or surplus [7,53,54].
C4—Food export ratio (% of total merchandise exports): This indicates the ability to participate in global value chains and the competitiveness of agricultural products, and reflects the strategy of commercializing agrarian products [6,52,55].
C5—Food import ratio (% of total merchandise imports): This reflects dependence on external supplies and food security risks [56,57,58].
C6—Political stability and the absence of violence/terrorism index: According to the World Bank’s Worldwide Governance Indicators (WGI), it measures “the likelihood of a government being overthrown or disrupted by violent means” by FAO.org (https://www.fao.org/in-action/drought-portal/preparedness/vulnerability-and-impact-assessment/compendium---vulnerability-indicators-(institutional)/government-effectiveness/en, accessed on 12 May 2024). This index is used instead of the institutional dimension because political stability is a prerequisite for long-term development [54,59,60].
This index ensures representation of three main groups of factors: domestic production (C1–C2–C3), trade capacity (C4–C5), and institutional conditions (C6).
3.3. Using the Entropy–MAIRCA Integrated Model in Assessing and Classifying Agricultural Development Capacity Among Countries in the Region
This study chose the Entropy–MAIRCA integrated method due to its ability to simultaneously handle multiple quantitative and qualitative criteria while overcoming common limitations of traditional MCDM models, such as subjective weighting (AHP) or focusing only on an ideal distance (TOPSIS). Table 1 below compares the technical characteristics of some popular MCDM methods with the model proposed in this study to clarify Entropy–MAIRCA’s suitability in assessing agricultural development capacity in complex and uncertain systems such as East Africa.

Table 1.
Comparison of MCDM methods according to technical characteristics and application suitability.
While many MCDM methods have been successfully applied in evaluating sustainability and agricultural strategies, each has inherent limitations. For instance, the AHP and Delphi methods rely heavily on expert judgment, making them vulnerable to subjective bias and inconsistency, particularly in cross-country assessments where expert perspectives vary. In contrast, entropy is an entirely objective weighting approach, grounded in information theory, which derives criterion weights based solely on the data’s internal variation, thus minimizing evaluator influence. On the other hand, methods such as TOPSIS, VIKOR, GRA, EDAS, and MOORA focus primarily on the proximity to ideal or anti-ideal solutions using linear or ratio-based normalization techniques. While effective for specific decision-making tasks, they often lack sensitivity to distributional gaps, i.e., how far the actual performance deviates from a theoretically expected ranking. These methods also do not capture ranking mismatch, a crucial factor in identifying underperforming or overperforming alternatives relative to expected standards.
The MAIRCA model offers significant advancement. Unlike distance-only models, MAIRCA evaluates the difference between the expected (theoretical) ranking matrix and the actual performance, allowing for a more nuanced assessment of performance distribution and deviation. When integrated with entropy weighting, the Entropy–MAIRCA model combines the benefits of objective weighting and distribution-aware ranking, making it particularly suitable for complex socio-economic assessments such as cross-country agricultural development classification.
Subjective fixed-weight methods, such as the Delphi method and AHP, are therefore replaced in this study by the entropy approach, which utilizes the inherent information content of the dataset. The entropy weight method is grounded in Shannon’s information theory and quantifies the level of disorder or diversity in each criterion across alternatives. The process begins with constructing a decision matrix , where each alternative is represented by a vector indicating the value of the -alternative for the -criteria. To account for the varying impacts of criteria on the final ranking of alternatives, each criterion is assigned a weight ratio ; = 1, 2,…, n (where ), reflecting its relative significance in the evaluation process.
The research employs the entropy weight method to determine the criteria weights. The process involves creating a decision matrix, standardizing indexes to address dimension influences, calculating the entropy of each index, and determining the entropy weight, which is calculated as follows.
Step 1: Index Values and Decision Matrix: Suppose countries and criteria in the index system, the initial decision matrix is defined. The index values obtained for each alternative are shown in Equation (1).
The criteria in can be qualitative or quantitative, and their values are obtained for each alternative.
Step 2: Standardization of indices:
Indexes are standardized using relative optimum membership degree equations to address the influence of index dimension on incommensurability. For beneficial and non-beneficial indexes, attribute values are transformed to create a standardized index matrix th, which can be transformed by (2) and (3).
Note: This formula standardizes the data for each criterion to ensure comparability by rescaling values between 0 and 1.
The matrix of normalized indices is .
Step 3: Calculation of the index’s entropy:
Entropy for each index is calculated based on the definition of entropy, incorporating relative frequencies. The entropy indices of the th index are determined based on Equation (4).
Note: This measures uncertainty or diversity in each criterion. A lower entropy indicates more useful information.
Where in:
Note: This calculates the probability distribution of each criterion across alternatives, which is used to compute entropy.
Step 4: Calculation of the index’s entropy weight:
Entropy weights for each index are determined, with larger weights indicating more useful information in the evaluation process. Entropy weights are determined based on Equation (6)
Note: This computes the objective weight of each criterion based on its entropy value.
Theoretically, the smaller the entropy value, the lower the system disorder. This method calculates index weights based on the information amount, mitigating human-induced disturbances. Using entropy helps to reduce subjective bias, ensuring objectivity in decision-making models. After that, the MAIRCA method is applied to indicate proximity to ideal ratings. A neutral stance is assumed to establish preferences for alternative selection, assigning equal importance to all proposed alternatives. The theoretical ranking matrix () is created by multiplying alternative priorities with the criteria weights. The real rating matrix () is determined using the initial decision matrix () and the theoretical rating matrix. Standardization and transformation equations are applied to the index values.
Step 5: Determining preferences for alternatives : Assuming decision-makers exhibit neutrality in alternative selection, priorities for each alternative are computed, assuming equal significance. Calculating alternative priorities () employs a formula, as expressed in Equation (7), within a total pool of m alternatives.
Note: This defines the ideal theoretical ranking, assuming equal preference across alternatives.
All alternatives are equidistant from the decision-maker, maintaining uniform preferences, as depicted in expression (8) of the research study.
Step 6: Creating the Theoretical Ranking Matrix (): The formulation of the Theoretical Ranking Matrix () involves criteria and alternatives. The matrix, denoted as an mxn matrix, is generated by multiplying alternative priorities with criteria weights , as outlined in Equation (9).
Note: This equation constructs the Theoretical Ranking Matrix () which represents the expected performance of each alternative under ideal, uniformly distributed preferences.
With all alternatives’ priorities equal, the matrix () is often displayed as a vector, as in Equation (10).
Note: In the equation where all alternatives are assumed to have equal theoretical priority (e.g., = 1/m), the Theoretical Ranking Matrix simplifies to a single vector.
Step 7: The real rating matrix ( is determined using the (), and the () is calculated according to Equation (11).
Note: This calculates the actual performance value of each alternative based on objective weights.
For the matrix elements, use Equation (12) for beneficial type criteria and Equation (13) for non-beneficial type criteria.
is the higher value of the criteria from the alternative ()),
is the lower value the criteria get from the alternative ),
Step 8: The Total Gap Matrix () is calculated by taking the difference between the theoretical () and real rating matrices (). The () is calculated according to the following formulas (14) and (15):
This determines the gap between an ideal expectation and real performance for each alternative. A smaller indicates a better match with ideal conditions.
Alternatives are classified as ideal or worst based on the gap values per criterion. If, for a criterion (), the theoretical () and real () ratings are equal and non-zero, the gap is zero (), designating the alternative () as the ideal (). Conversely, if both theoretical and real ratings are zero for an alternative () about a criterion (), it is identified as the worst alternative () for that criterion.
Step 9: After computing the gap matrix, countries are assessed by aggregating all deviations. This final value is computed using Equation (16), where
Note: This equation calculates each alternative’s final score () by summing the total gap values across all criteria.
The alternatives then are ranked according to their final criterion function values, with the alternative possessing the smallest value identified as the best alternative. MAIRCA overcomes the limitations of distance-only approaches by considering the distribution and expectation structure, making it suitable for complex regional policy systems such as those in East Africa.
3.4. Scope of the Study and Data
This research comprehensively analyzes the gap in agricultural capacity in 18 East African countries, according to the statistics from Worldatlas [68], including: Burundi, Comoros, Djibouti, Eritrea, Ethiopia, Kenya, Madagascar, Malawi, Mauritius, Mozambique, Rwanda, Seychelles, Somalia, South Sudan, Uganda, Tanzania, Zambia, and Zimbabwe.
Data is collected from official sources such as the FAO, the World Bank, and national statistical databases based on six leading indicators. We built an assessment matrix using the normalization and entropy weighting step and used MAIRCA to determine each country’s G-point (distance) relative to the ideal agricultural development state. The data were processed and checked for completeness and consistency before being included in the model.
4. Numerical Results
4.1. Case Study Description
This research aims to analyze the agricultural statuses in 18 East African countries, as shown in Table 2 below.
Table 2.
Decision matrix.
4.2. Countries Classification by Proposed Approach
The problem was solved by evaluating and comparing eighteen countries, treated as alternatives, through six predefined criteria. The linear normalization technique was employed to facilitate systematic assessment. This technique manipulates the data presented in Table 2 by applying Equations (2) to (3). The calculations are based on the maximum and minimum values of the evaluated index. The result is the standardization of the indexes, and the outcomes are in the subsequent Table 3. The probability of criterion entropy was determined by applying Equations (4) and (5). The entropy weight () of the th criterion in Table 4 was obtained by summing all the normalized values from each criterion. Similarly, the probabilities for other values in the requirements, ranging from 1 to 6, were calculated and are presented in Table 4. The process calculation was based on Equation (6) to quantify the likelihood and weight of criterion entropy for various criteria in the study.
Table 3.
Standardized index matrix.
Table 4.
Weights of criteria.
As shown in Figure 2, the results show that the food export index (C4) has the highest weight (0.2735), reflecting the key role of trade, which is prominent in differentiating agricultural capacities across countries. Countries with high export shares are often associated with more efficient production systems and better market links. C3 (per capita production volatility) weighs 0.2319, reflecting that production stability is essential for long-term development capacity. Low volatility means reasonable control over agricultural inputs and outputs. C2 (arable land per capita) also has a relatively high weight (0.2069), indicating that land resources are still the fundamental factor. However, the lower weight compared to the trade and production indicators shows that land is no longer the sole determinant of agricultural capacity, as in traditional periods. C5 (food import share) weighs 0.1690, reflecting concerns about external dependence.
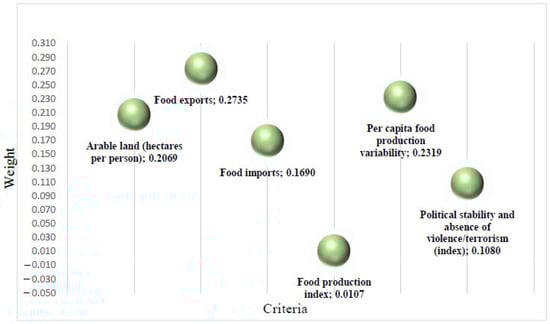
Figure 2.
Entropy weight of criteria.
High-importing countries may face risks in the supply chain during global crises. Although not in the highest group, C6 (political stability index) still plays a significant role (0.1080). This factor is related to the institutional environment, directly affecting the ability to plan and implement agricultural development policies. C1 (the food production index) has the lowest weight (0.0107), indicating that the distribution of this index is relatively even across countries, thus not being able to differentiate agricultural development capacity. This may reflect that traditional food production is no longer a strong enough single indicator in the context of modernized and globalized agriculture.
In summary, the entropy weighting results show that the current effective agricultural development model depends not solely on production or resources, but mainly on commercialization capacity, production stability, and a favorable institutional environment. These factors should be considered as the focus when building regional agricultural development strategies in the context of global integration. The entropy analysis results show that farm commercialization and domestic production stability are most likely to differentiate agricultural development capacity in the East African region. In contrast, indicators considered essential, such as food production or political stability, show lower variability in the dataset, resulting in lower weights. This suggests a remarkable fact: modern agricultural capacity in East Africa is more heavily influenced by the ability to interact with global markets and the stability of production than by pure production. This reflects that the key regional agricultural development factors are commercialization capacity, production stability, and resource base. In addition, C6 (political stability—0.1080) is not the highest, but still plays a significant role, especially when analyzing the correlation with the high-risk group of countries.
Subsequently, the objective is to assess and categorize countries based on their regional agricultural capacity, strengths, and challenges. This evaluation is a foundation for proposing contextually relevant solutions, particularly concerning each country’s regional agricultural development capacity in East Africa. A novel evaluation matrix, informed by the assigned entropy weights, is crafted to delineate rankings among the countries under consideration. The analytical approach employed in this study incorporates the MAIRCA method, contributing clarity to the rankings of each country within the East Africa region.
At the core of MAIRCA lies the fundamental principle of quantifying the disjunction between theoretical and actual ratings, computed individually for each criterion. This computation results in an aggregate gap, illuminating the overall disparities for each country. Notably, this study assumes equal consideration of preferences for individual alternatives. The subsequent construction of the ) captures preferences for alternative selection, grounded in each country’s specific selection preferences (). The ) structure is defined as n × m, where ‘n’ signifies the total number of criteria, and ‘m’ denotes the total count of countries. The matrix elements ) are derived by multiplying the preferences for alternative selection ().
The decision matrix of eighteen countries’ decision-making and six evaluation criteria is established and calculated by Equations (9) and (10), shown as the row vector in Table 5.
Table 5.
The theoretical ranking matrix .
The process of establishing the () precedes the computation of the real ratings matrix (). The authentic values of the real ratings matrix (as outlined in Table 6) are derived through a multiplicative operation involving the elements of the () and the normalized elements of the initial decision-making matrix (). This computation is elucidated through the utilization of Equations (12) and (13) in the method framework. The formulation for each element within the () is governed by the delineated in Equation (11). The precise determination of these elements in the () is delineated in Table 6.
Table 6.
The real rating matrix .
Equations (14) and (15). Subsequently, the Total Distance Matrix () is derived as outlined in Table 7. Alternatives are then prioritized based on their final criterion function values. These values are determined by summing the rows of the distance matrix () for each alternative, employing Equation (16). The alternative exhibiting the lowest final criterion function value is identified as the optimal choice, as illustrated in Figure 3.
Table 7.
The gap matrix (G).
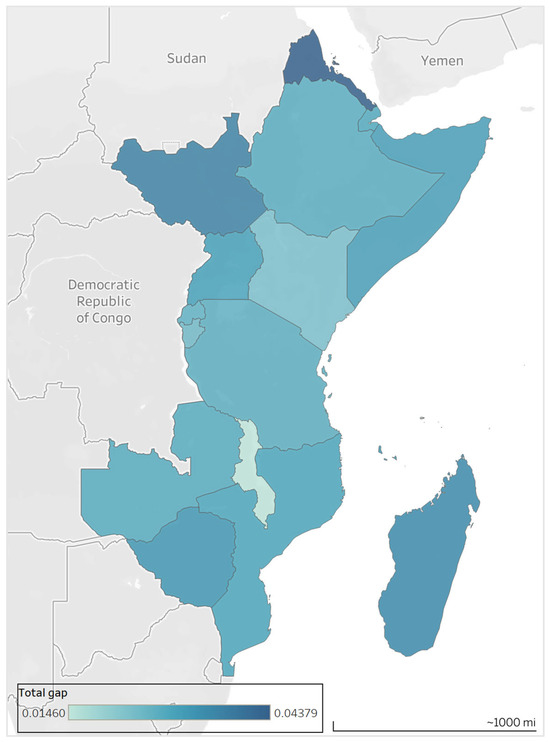
Figure 3.
Final score of East Africa countries.
4.3. Results of Technical Clustering and Ranking by Strategy
After calculating the G-score for 18 East African countries using the Entropy–MAIRCA model (Figure 3), the study applied the K-means clustering algorithm to group countries into four strategic clusters based on their proximity to the ideal development state. The lower the G-score, the closer a country is to optimal agricultural development conditions.
The clustering results reveal distinct development profiles as follows:
Group 1—Agricultural Pioneers: Malawi, Kenya, Burundi, Rwanda, and Tanzania. These countries exhibit the lowest G-scores (below 0.028), strong food export performance, low production volatility, and relatively stable institutions. Malawi has the lowest G-score (0.0146), while Kenya leads in food export share.
Group 2—Emerging Countries: Ethiopia, Mozambique, Zambia, Uganda, Somalia, Mauritius, Comoros, Zimbabwe, and Rwanda (transitional case). Countries in this group have moderate G-scores (0.027–0.032), at least one strong criterion, but need improvements in institutional quality or market infrastructure.
Group 3—Trade-Dependent Economies: Includes Seychelles and Djibouti. These countries are export-active but rely heavily on food imports and are vulnerable due to limited production capacity or political instability.
Group 4—High-Risk Countries: Eritrea, South Sudan, and Madagascar. They have the highest G-scores (>0.034), weak performance across most indicators, including low food production, fragile institutions, and high systemic barriers.
To enhance clarity, Table 8 summarizes the four groups and representative attributes.
Table 8.
Summary of strategic groups and key attributes.
Comparing the characteristics of the leading group (Group 1) and the high-risk group (Group 4) shows apparent differences as follows:
Group 1 (pioneers): This group has a higher food export ratio, good stable production, and relatively strong institutions, ensuring an effective combination of internal factors and market access.
Group 4 (high risk): This group has a low export ratio, high imports, high production volatility, and weak institutions, causing many policy risks and trade dependence.
This classification provides actionable insights for regional development initiatives. It enables policymakers and donor agencies to prioritize investments, tailor support mechanisms, and facilitate cross-country cooperation based on each group’s strengths and constraints.
4.4. Model Validation and Robustness Check
To validate the reliability of the MAIRCA-based ranking results, this study performed a comparative analysis using two widely recognized MCDM methods: TOPSIS and COPRAS. All three models utilized the same normalized decision matrix and the entropy-derived weights to ensure consistency in comparison. The ranking outcomes of the 18 East African countries under the three methods were analyzed and visualized in Figure 4.
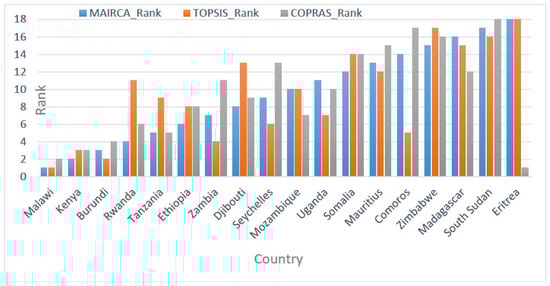
Figure 4.
The ranking outcomes of the 18 East African countries under the three methods.
To quantitatively assess the alignment among methods, correlation coefficients were computed. The Spearman rank correlation between MAIRCA and TOPSIS was 0.771 (p < 0.001), and 0.610 (p < 0.01) for MAIRCA and COPRAS. Notably, the Kendall tau correlation also showed a highlight of reliability with statistically significant values of 0.595 for both comparisons. These results show a strong and statistically meaningful agreement between the models, especially between MAIRCA and TOPSIS, which both consider the ideal solution framework.
These findings support the robustness of the MAIRCA results and demonstrate that, despite methodological differences, the Entropy–MAIRCA model yields rankings consistent with established MCDM approaches. Moreover, the MAIRCA model offers enhanced granularity by incorporating both the distance to ideal and the distributional expectations of alternatives, making it particularly suitable for complex regional development assessments under institutional uncertainty.
Differences in rankings may arise due to MAIRCA’s sensitivity to distributional gaps between theoretical and real performance, unlike TOPSIS or COPRAS, which emphasize proximity to the best/worst alternatives. Specifically, MAIRCA penalizes countries more heavily when their actual performance deviates from an evenly distributed ideal, making it more sensitive to asymmetric or inconsistent data. Rwanda performs relatively well on several criteria but shows underperformance on a highly weighted indicator, resulting in a lower rank in MAIRCA than in TOPSIS. Similarly, Djibouti receives different positions across methods due to its strong trade performance, but has weaker scores in governance and land use, which are weighted differently across the models. These discrepancies are inherent in how each method handles trade-offs, distribution, and deviation, and they underscore the importance of aligning method selection with evaluation objectives.
5. Discussion
5.1. Interpretation of Results and Strategic Implications
The Entropy–MAIRCA model results show a clear differentiation in agricultural development capabilities among East African countries. Leading countries such as Malawi, Kenya, and Burundi do not rely heavily on land or physical resources. Still, they have an effective combination of stable productivity, proactive trade policies, and relatively high institutional stability. In contrast, countries such as Eritrea, South Sudan, and Zimbabwe that have fallen in the rankings show a loss of control due to the ineffective combination of specific factors, such as low production efficiency, high volatility, and political instability, which indicates the importance of non-technical factors in agricultural development outcomes.
Forming four strategic clusters helps identify each country’s current state and facilitates the design of regional policies towards stratified development. The “frontrunners” can lead in value chain linkages and technological innovation. The “emerging” group has the potential to rise if supported by institutions and infrastructure. The “trade-dependent” group needs a strategy to rebalance between exports and domestic security. Meanwhile, the “high-risk” group requires priority support, humanitarian intervention, and foundational investment. The results from this strategic classification framework are not only theoretically meaningful but also highly practical. This framework can serve as a strategic tool for guiding agricultural investment allocation, informing donor priorities, fostering regional cooperation among similarly classified countries, and designing targeted interventions for high-risk zones. Development agencies and regional policymakers can use these results to structure differentiated support programs tailored to the conditions and capacities of each group, enhancing policy precision and resource efficiency.
5.2. Links to Governance Theory and Models
This analysis can be understood through the lens of strategic typology, initially proposed by [48] in organizational management. The four identified country groups correspond to reproducible “regional strategic configurations”, facilitating focused resource allocation by each country’s available capacity and development goals. In addition, the results support the Resource-Based View (RBV) by [69] in showing that internal land resources are insufficient to ensure efficiency without governance, institutional capacity, and flexibility in commercializing agricultural products. It suggests that regional strategies need a multi-dimensional approach instead of relying solely on land advantages or population size.
5.3. Comparison with Previous Studies
Compared to traditional studies on agriculture in East Africa, which predominantly concentrate on singular dimensions, such as climate change adaptation [70], crop yield performance [7], or household-level food security [23], this study contributes a novel, integrated framework for region-wide strategic classification of agricultural development capacity.
Most conventional approaches rely on subjective weighting (e.g., AHP, Delphi) or consider only proximity to an ideal state (e.g., TOPSIS), which can obscure the disparity between countries’ potential and performance. The Entropy–MAIRCA model addresses these limitations by using entropy to assign objective weights, which mitigates subjectivity and ensures that the importance of the criteria is derived directly from the data structure. Incorporating MAIRCA’s deviation-based ranking, which evaluates how closely each alternative matches a theoretical distribution of ideal rankings, captures the distributional inconsistencies better than the linear distance metrics alone.
The novel, the Entropy–MAIRCA model, is uniquely suited for contexts like East Africa, where development asymmetries are quantitative but also structural and systemic. The model ranks countries by performance and reveals mismatches between expected and actual performance, enabling a deeper understanding of the underlying development gaps. This study represents one of the first applications of Entropy–MAIRCA to agricultural development classification at a multi-country regional scale. It contributes methodologically to the MCDM literature and practically to designing tailored, data-informed development strategies across diverse national contexts.
5.4. Contribution to Regional Engineering Management
With the ability to process quantitative data and easy replication, the Entropy–MAIRCA model can be considered an engineering management tool to support decision making in regional conditions with high uncertainty and many conflicting criteria. The model supports the assessment of the current situation and can be integrated into policy support platforms or regional strategic planning.
The results can also be used to develop a strategic map of the East African agricultural region, which will serve regional organizations such as IGAD, COMESA, or international development organizations in resource allocation, technical assistance, and inter-country cooperation planning.
6. Theoretical and Managerial Implications
Methodologically, this study employed a rigorous multi-criteria decision-making (MCDM) framework, integrating the entropy method and the MAIRCA method. This innovative combination was selected to leverage the objective weighting of criteria and a nuanced comparison against an ideal standard, providing a holistic approach to evaluating agricultural development across East African countries. This study contributes three key advancements to the field of agricultural policy and multi-criteria analysis:
- This study proposes an MCDM framework that incorporates a comprehensive set of multi-dimensional indicators—encompassing both internal (e.g., arable land, production capacity) and external (e.g., trade and political stability) factors—to assess agricultural development capacity. A four-tier strategic grouping model was developed, offering flexibility for replication and practical application in other regional contexts to support resource-based policy planning.
- Unlike most previous studies, this research includes institutional indicators—particularly political stability and governance—within the MCDM model. These findings reveal that political stability carries a high weight, demonstrating its significant influence on agricultural performance. Additionally, this study shows that market access (exports) has a more decisive role than simply owning extensive arable land, emphasizing the importance of trade conditions and institutional capacity in achieving food security.
- By integrating entropy and MAIRCA, the study presents a model that ensures greater objectivity than subjective methods such as AHP and better accounts for data distribution compared to methods like TOPSIS or VIKOR. This combination provides more realistic and replicable ranking results, affirming its academic relevance and practical utility for regional policy assessment and decision making.
7. Conclusions
This study presents an integrated Entropy–MAIRCA model to evaluate and classify the agricultural development capacity of 18 East African countries across six key criteria, including production, resource availability, trade, and institutional stability. The approach enables a quantitative and objective assessment that facilitates the strategic grouping of countries into four development categories, providing insights for tailored policy formulation, investment prioritization, and regional collaboration. The findings contribute to academic literature and practical decision-making by advancing the application of MCDM methods in agriculture and development planning.
Despite its contributions, this study has several limitations. First, the model relies exclusively on quantitative data due to the availability and comparability of open datasets. As a result, qualitative or semi-structured criteria—such as farmer perceptions, land tenure security, or policy enforcement effectiveness—are not considered. Second, the model does not incorporate fuzzy logic or linguistic assessments, which may be more appropriate in cases where data uncertainty or subjectivity is significant. Third, the country classification is based on a static dataset and does not account for temporal dynamics or policy changes over time.
To address these limitations, future research could extend the model by integrating fuzzy logic or rough sets into the Entropy–MAIRCA framework, including qualitative expert evaluations. In addition, the integration of additional governance indicators, such as government effectiveness, the rule of law, or corruption control, allows a more holistic evaluation of institutional capacity in agricultural development. Applying the model in other geographic contexts, such as West Africa, Southeast Asia, or Latin America, could help verify its adaptability and generalizability. Moreover, linking this framework to real-time data sources or incorporating machine learning algorithms could support dynamic monitoring and early warning systems for agricultural risk. These advancements would further enhance the model’s utility in supporting sustainable, resilient, and inclusive agri-food systems.
Author Contributions
Conceptualization, D.-O.T.T. and N.-L.N.; methodology, N.-L.N.; validation, C.-N.W. and M.-H.H.; formal analysis, N.-L.N.; data curation, D.-O.T.T.; writing—original draft preparation, D.-O.T.T.; writing—review and editing, C.-N.W.; supervision, M.-H.H. All authors have read and agreed to the published version of the manuscript.
Funding
This research was partially supported by the University of Economics Ho Chi Minh City (UEH), Vietnam. This research is partially supported by the project of NSTC 114-2637-E-992-010 from the National Science and Technology Council, Taiwan.
Data Availability Statement
The original contributions presented in this study are included in the article. Further inquiries can be directed to the corresponding author.
Conflicts of Interest
The authors declare no conflicts of interest.
References
- Ba, M.N. Strategic agricultural commodity value chains in Africa for increased food: The regional approach for food security. Agric. Sci. 2016, 7, 549. [Google Scholar]
- World Bank. Seizing the Agri-Food Opportunity in Eastern and Southern Africa. 2022. Available online: https://blogs.worldbank.org/en/africacan/seizing-agri-food-opportunity-eastern-and-southern-africa (accessed on 20 July 2024).
- Adhikari, U.; Nejadhashemi, A.P.; Woznicki, S.A. Climate change and eastern Africa: A review of impact on major crops. Food Energy Secur. 2015, 4, 110–132. [Google Scholar] [CrossRef]
- Warui, H.; Gatwiri, C. Soil Degradation A Silent Crisis in East Africa. 2025. Available online: https://ke.boell.org/en/2025/02/27/soil-degradation-silent-crisis-east-africa (accessed on 11 May 2024).
- Kimenyi, M.; Adibe, J.; Djiré, M.; Jirgi, A.J.; Kergna, A.; Deressa, T.; Pugliese, J.; Westbury, A. The impact of conflict and political instability on agricultural investments in Mali and Nigeria. Brook. Afr. Growth Initiat. Work. Pap 2014, 17. [Google Scholar]
- Brigham, A.M. Agricultural Exports and Food Insecurity in Sub-Saharan Africa: A Qualititative Configurational Analysis. Dev. Policy Rev. 2011, 29, 729–748. [Google Scholar] [CrossRef]
- Mango, N.; Makate, C.; Mapemba, L.; Sopo, M. The role of crop diversification in improving household food security in central Malawi. Agric. Food Secur. 2018, 7, 1–10. [Google Scholar] [CrossRef]
- De Silva, L.; Jayamaha, N.; Garnevska, E. Sustainable farmer development for Agri-food supply chains in developing countries. Sustainability 2023, 15, 15099. [Google Scholar] [CrossRef]
- Arinloye, A.D.D.; Degrande, A.; Fassinou Hotegni, V.N.; Asaah, E.; Bockarie, R.; Nyemeck, J.B.; Bayala, J.; Kalinganire, A. Value chain development for mango (Mangifera indica) around Outamba Kilimi National Park in Sierra Leone: Constraints and opportunities for smallholders. Agric. Food Secur. 2017, 6, 14. [Google Scholar] [CrossRef]
- Appiah-Twumasi, M.; Asale, M.A. Crop diversification and farm household food and nutrition security in Northern Ghana. Environ. Dev. Sustain. 2024, 26, 157–185. [Google Scholar] [CrossRef]
- Thornton, P.K.; Jones, P.G.; Ericksen, P.J.; Challinor, A.J. Agriculture and food systems in sub-Saharan Africa in a 4 C+ world. Philos. Trans. R. Soc. A Math. Phys. Eng. Sci. 2011, 369, 117–136. [Google Scholar] [CrossRef]
- Seife, T. The impact of climate change on agriculture and food security in the greater horn of Africa. Politikon 2021, 48, 98–114. [Google Scholar] [CrossRef]
- Ritzema, R.S.; Frelat, R.; Douxchamps, S.; Silvestri, S.; Rufino, M.C.; Herrero, M.; Giller, K.E.; López-Ridaura, S.; Teufel, N.; Paul, B.K.; et al. Is production intensification likely to make farm households food-adequate? A simple food availability analysis across smallholder farming systems from East and West Africa. Food Secur. 2017, 9, 115–131. [Google Scholar] [CrossRef]
- Bedasa, Y.; Bedemo, A. The effect of climate change on food insecurity in the Horn of Africa. GeoJournal 2023, 88, 1829–1839. [Google Scholar] [CrossRef]
- Kassaye, A.Y.; Shao, G.; Wang, X.; Shifaw, E.; Wu, S. Impact of climate change on the staple food crops yield in Ethiopia: Implications for food security. Theor. Appl. Climatol. 2021, 145, 327–343. [Google Scholar] [CrossRef]
- Kadi, H.A.; Njau, L.N.; Mwikya, J.; Kamga, A. The State of Climate Information Services for Agriculture and Food Security in East African Countries; CCAFS Working Paper No. 5; CCAFS: Copenhagen, Denmark, 2011. [Google Scholar]
- Karume, K.; Mondo, J.M.; Kiyala, J.C.K. Drought, the War in Europe and Its Impacts on Food Insecurity in Sub-Saharan Africa, East Africa. In Climate Change and Socio-Political Violence in Sub-Saharan Africa in the Anthropocene: Perspectives from Peace Ecology and Sustainable Development; Springer Nature: Amsterdam, The Netherlands, 2024; pp. 91–111. [Google Scholar]
- Balma, L.; Heidland, T.; Jävervall, S.; Mahlkow, H.; Mukasa, A.N.; Woldemichael, A. Long-Run Impacts of the Conflict in Ukraine on Food Security in Africa; Kiel Policy Brief: Kiel, Germany, 2022. [Google Scholar]
- Miruka, M.K.; Okello, J.J.; Kirigua, V.O.; Murithi, F.M. The role of the Kenya Agricultural Research Institute (KARI) in the attainment of household food security in Kenya: A policy and organizational review. Food Secur. 2012, 4, 341–354. [Google Scholar] [CrossRef]
- Ngango, J.; Hong, S. Improving farm productivity through the reduction of managerial and technology gaps among farmers in Rwanda. Agric. Food Secur. 2021, 10, 11. [Google Scholar] [CrossRef]
- Mahgoub, F. Current Status of Agriculture and Future Challenges in Sudan; Nordiska Afrikainstitutet: Uppsala, Sweden, 2014. [Google Scholar]
- Dorward, A.; Chirwa, E. The Malawi agricultural input subsidy programme: 2005/06 to 2008/09. In Sustainable Intensification: Increasing Productivity in African Food and Agricultural Systems; Routledge: London, UK, 2012; pp. 232–247. [Google Scholar]
- Agrawal, N. Multi-criteria decision-making toward supplier selection: Exploration of PROMETHEE II method. Benchmarking Int. J. 2022, 29, 2122–2146. [Google Scholar] [CrossRef]
- Cai, Y.; Jin, F.; Liu, J.; Zhou, L.; Tao, Z. A survey of collaborative decision-making: Bibliometrics, preliminaries, methodologies, applications and future directions. Eng. Appl. Artif. Intell. 2023, 122, 106064. [Google Scholar] [CrossRef]
- Wang, C.-N.; Nguyen, N.-A.-T.; Dang, T.-T. Sustainable evaluation of major third-party logistics providers: A framework of an MCDM-based entropy objective weighting method. Mathematics 2023, 11, 4203. [Google Scholar] [CrossRef]
- Wang, C.-N.; Le, T.Q.; Chang, K.-H.; Dang, T.-T. Measuring road transport sustainability using MCDM-based entropy objective weighting method. Symmetry 2022, 14, 1033. [Google Scholar] [CrossRef]
- Supriya, Y.; Gadekallu, T.R. A Survey on Soft Computing Techniques for Federated Learning—Applications, Challenges and Future Directions. ACM J. Data Inf. Qual. 2023, 15, 1–28. [Google Scholar] [CrossRef]
- Sharma, M.; Sehrawat, R. A hybrid multi-criteria decision-making method for cloud adoption: Evidence from the healthcare sector. Technol. Soc. 2020, 61, 101258. [Google Scholar] [CrossRef]
- Vatankhah, S.; Darvishmotevali, M.; Rahimi, R.; Jamali, S.M.; Ebrahim, N.A. Assessing the application of multi-criteria decision making techniques in hospitality and tourism research: A bibliometric study. Int. J. Contemp. Hosp. Manag. 2023, 35, 2590–2623. [Google Scholar] [CrossRef]
- Yenugula, M.; Sahoo, S.; Goswami, S. Cloud computing in supply chain management: Exploring the relationship. Manag. Sci. Lett. 2023, 13, 193–210. [Google Scholar] [CrossRef]
- Goswami, S.S.; Behera, D.K.; Mitra, S. A comprehensive study of weighted product model for selecting the best product in our daily life. Braz. J. Oper. Prod. Manag. 2020, 17, 1–18. [Google Scholar] [CrossRef]
- Kizielewicz, B.; Wątróbski, J.; Sałabun, W. Multi-criteria decision support system for the evaluation of UAV intelligent agricultural sensors. Artif. Intell. Rev. 2025, 58, 194. [Google Scholar] [CrossRef]
- Atlı, H.F. Safety of agricultural machinery and tractor maintenance planning with fuzzy logic and MCDM for agricultural productivity. Int. J. Agric. Environ. Food Sci. 2024, 8, 25–43. [Google Scholar] [CrossRef]
- Tuncel, G.; Gunturk, B. A Fuzzy Multi-Criteria Decision-Making Approach for Agricultural Land Selection. Sustainability 2024, 16, 10509. [Google Scholar] [CrossRef]
- Dere, S.; Günay, E.E.; Kula, U.; Kremer, G.E. Assessing agrivoltaics potential in Türkiye–A geographical information system (GIS)-based fuzzy multi-criteria decision making (MCDM) approach. Comput. Ind. Eng. 2024, 197, 110598. [Google Scholar] [CrossRef]
- Kumar, A.; Sah, B.; Singh, A.R.; Deng, Y.; He, X.; Kumar, P.; Bansal, R. A review of multi criteria decision making (MCDM) towards sustainable renewable energy development. Renew. Sustain. Energy Rev. 2017, 69, 596–609. [Google Scholar] [CrossRef]
- Zhang, S.; Xu, S.; Zhang, W.; Yu, D.; Chen, K. A hybrid approach combining an extended BBO algorithm with an intuitionistic fuzzy entropy weight method for QoS-aware manufacturing service supply chain optimization. Neurocomputing 2018, 272, 439–452. [Google Scholar] [CrossRef]
- Zhao, D.-Y.; Ma, Y.-Y.; Lin, H.-L. Using the entropy and TOPSIS models to evaluate sustainable development of islands: A case in China. Sustainability 2022, 14, 3707. [Google Scholar] [CrossRef]
- Liu, L.; Zhu, Q.; Yang, D.; Liu, S. Extended multicriteria group decision making with a novel aggregation operator for emergency material supplier selection. Entropy 2023, 25, 702. [Google Scholar] [CrossRef]
- Gigović, L.; Pamučar, D.; Bajić, Z.; Milićević, M. The combination of expert judgment and GIS-MAIRCA analysis for the selection of sites for ammunition depots. Sustainability 2016, 8, 372. [Google Scholar] [CrossRef]
- Pamučar, D.; Lukovac, V.; Božanić, D.; Komazec, N. Multi-criteria FUCOM-MAIRCA model for the evaluation of level crossings: Case study in the Republic of Serbia. Oper. Res. Eng. Sci. Theory Appl. 2018, 1, 108–129. [Google Scholar] [CrossRef]
- Günay, F.; Ecer, F. Cash flow based financial performance of Borsa İstanbul tourism companies by Entropy-MAIRCA integrated model. J. Multidiscip. Acad. Tour. 2020, 5, 29–37. [Google Scholar] [CrossRef]
- Chatterjee, S.; Chakraborty, S. A multi-attributive ideal-real comparative analysis-based approach for piston material selection. Opsearch 2022, 59, 207–228. [Google Scholar] [CrossRef]
- Hadian, S.; Shahiri Tabarestani, E.; Pham, Q.B. Multi attributive ideal-real comparative analysis (MAIRCA) method for evaluating flood susceptibility in a temperate Mediterranean climate. Hydrol. Sci. J. 2022, 67, 401–418. [Google Scholar] [CrossRef]
- Rouyendegh, B.D.; Savalan, Ş. An integrated fuzzy MCDM hybrid methodology to analyze agricultural production. Sustainability 2022, 14, 4835. [Google Scholar] [CrossRef]
- Farida, Y.; Firdaus, G.S.; Wibowo, A.T.; Sari, S.K.; Desinaini, L.N. Evaluation of Food Security Area of East Java Province Using Fuzzy C-Means (FCM) and Technique for Order Preference by Similarity to Ideal Solution (TOPSIS). IJCCS Indones. J. Comput. Cybern. Syst. 2023, 17, 371–382. [Google Scholar] [CrossRef]
- Rousseeuw, P.J. Silhouettes: A graphical aid to the interpretation and validation of cluster analysis. J. Comput. Appl. Math. 1987, 20, 53–65. [Google Scholar] [CrossRef]
- Miles, R.E.; Snow, C.C.; Meyer, A.D.; Coleman, H.J., Jr. Organizational strategy, structure, and process. Acad. Manag. Rev. 1978, 3, 546–562. [Google Scholar] [CrossRef]
- Santeramo, F.G.; Jelliffe, J.; Hoekman, B. Agri-food value chains and the global food dollar: The role of trade and services. Food Policy 2024, 127, 102706. [Google Scholar] [CrossRef]
- Uisso, A.M.; Tanrıvermiş, H. Driving factors and assessment of changes in the use of arable land in Tanzania. Land Use Policy 2021, 104, 105359. [Google Scholar] [CrossRef]
- World Bank. Arable Land. Available online: https://data.worldbank.org/indicator/AG.LND.ARBL.ZS (accessed on 20 May 2024).
- Friha, O.; Ferrag, M.A.; Shu, L.; Maglaras, L.; Wang, X. Internet of things for the future of smart agriculture: A comprehensive survey of emerging technologies. IEEE/CAA J. Autom. Sin. 2021, 8, 718–752. [Google Scholar] [CrossRef]
- Lefe, Y.D.H.; Asare-Nuamah, P.; Njong, A.M.; Kondowe, J.; Musakaruka, R.R. Does climate variability matter in achieving food security in Sub-Saharan Africa? Environ. Chall. 2024, 15, 100870. [Google Scholar] [CrossRef]
- Ferrag, M.A.; Shu, L.; Yang, X.; Derhab, A.; Maglaras, L. Security and privacy for green IoT-based agriculture: Review, blockchain solutions, and challenges. IEEE Access 2020, 8, 32031–32053. [Google Scholar] [CrossRef]
- Patil, P.; Jadhav, P.; Maiti, M. The impact of new agricultural export policy on Indian agriculture exports. J. Public Aff. 2020, 20, e2303. [Google Scholar] [CrossRef]
- Balié, J.; Del Prete, D.; Magrini, E.; Montalbano, P.; Nenci, S. Does trade policy impact food and agriculture global value chain participation of sub-Saharan African countries? Am. J. Agric. Econ. 2019, 101, 773–789. [Google Scholar] [CrossRef]
- Sandström, V.; Saikku, L.; Antikainen, R.; Sokka, L.; Kauppi, P. Changing impact of import and export on agricultural land use: The case of Finland 1961–2007. Agric. Ecosyst. Environ. 2014, 188, 163–168. [Google Scholar] [CrossRef]
- Gilani, S.W. The impact of agricultural imports and exports on agricultural productivity. J. Econ. Sustain. Dev. 2015, 6, 110–116. [Google Scholar]
- Niforos, M. Beyond FinTech: Leveraging Blockchain for More Sustainable and Inclusive Supply Chains. 2017. Available online: https://openknowledge.worldbank.org/entities/publication/6dd33df2-68f4-56cb-ad64-12bf41c784b0 (accessed on 20 May 2024).
- Radoglou-Grammatikis, P.; Sarigiannidis, P.; Lagkas, T.; Moscholios, I. A compilation of UAV applications for precision agriculture. Comput. Netw. 2020, 172, 107148. [Google Scholar] [CrossRef]
- Liu, Y.; Eckert, C.M.; Earl, C. A review of fuzzy AHP methods for decision-making with subjective judgements. Expert Syst. Appl. 2020, 161, 113738. [Google Scholar] [CrossRef]
- Kutlu Gündoğdu, F.; Kahraman, C. Spherical fuzzy sets and spherical fuzzy TOPSIS method. J. Intell. Fuzzy Syst. 2019, 36, 337–352. [Google Scholar] [CrossRef]
- Kutlu Gündoğdu, F.; Kahraman, C. A novel VIKOR method using spherical fuzzy sets and its application to warehouse site selection. J. Intell. Fuzzy Syst. 2019, 37, 1197–1211. [Google Scholar] [CrossRef]
- Brodny, J.; Tutak, M. Assessing the energy security of European Union countries from two perspectives—A new integrated approach based on MCDM methods. Appl. Energy 2023, 347, 121443. [Google Scholar] [CrossRef]
- Wang, C.-N.; Nhieu, N.-L.; Liu, W.-L. Unveiling the landscape of Fintech in ASEAN: Assessing development, regulations, and economic implications by decision-making approach. Humanit. Soc. Sci. Commun. 2024, 11, 1–16. [Google Scholar] [CrossRef]
- Almeida, V.V.A.; Gomes, C.F.S.; Pinochet, L.H.C.; dos Santos, M. Prioritization of investment order in Brazil among renewable energy sources: An analysis using the SWARA-MOORA-3NAG method. J. Model. Manag. 2025, 20, 620–647. [Google Scholar] [CrossRef]
- Chakraborty, S.; Chatterjee, P.; Das, P.P. Multi-Attributive Ideal-Real Comparative Analysis (MAIRCA) Method. In Multi-Criteria Decision-Making Methods in Manufacturing Environments; Apple Academic Press: Palm Bay, FL, USA, 2024; pp. 289–296. [Google Scholar]
- Worldatlats. East African Countries. Available online: https://www.worldatlas.com/ (accessed on 1 March 2025).
- Barney, J. Firm resources and sustained competitive advantage. J. Manag. 1991, 17, 99–120. [Google Scholar] [CrossRef]
- Pervez, S.; McNally, A.; Arsenault, K.; Budde, M.; Rowland, J. Vegetation Monitoring Optimization with Normalized Difference Vegetation Index and Evapotranspiration Using Remote Sensing Measurements and Land Surface Models Over East Africa. Front. Clim. 2021, 3, 589981. [Google Scholar] [CrossRef]
Disclaimer/Publisher’s Note: The statements, opinions and data contained in all publications are solely those of the individual author(s) and contributor(s) and not of MDPI and/or the editor(s). MDPI and/or the editor(s) disclaim responsibility for any injury to people or property resulting from any ideas, methods, instructions or products referred to in the content. |
© 2025 by the authors. Licensee MDPI, Basel, Switzerland. This article is an open access article distributed under the terms and conditions of the Creative Commons Attribution (CC BY) license (https://creativecommons.org/licenses/by/4.0/).